The Journal of Bioadhesion and Biofilm Research · Predictions of full-scale ship resistance and...
13
This article was downloaded by:[Us Naval Academy] On: 13 September 2007 Access Details: [subscription number 770001558] Publisher: Taylor & Francis Informa Ltd Registered in England and Wales Registered Number: 1072954 Registered office: Mortimer House, 37-41 Mortimer Street, London W1T 3JH, UK Biofouling The Journal of Bioadhesion and Biofilm Research Publication details, including instructions for authors and subscription information: http://www.informaworld.com/smpp/title~content=t713454511 Effects of coating roughness and biofouling on ship resistance and powering Michael P. Schultz a a Department of Naval Architecture and Ocean Engineering, United States Naval Academy, Annapolis, Maryland, USA Online Publication Date: 01 October 2007 To cite this Article: Schultz, Michael P. (2007) 'Effects of coating roughness and biofouling on ship resistance and powering', Biofouling, 23:5, 331 - 341 To link to this article: DOI: 10.1080/08927010701461974 URL: http://dx.doi.org/10.1080/08927010701461974 PLEASE SCROLL DOWN FOR ARTICLE Full terms and conditions of use: http://www.informaworld.com/terms-and-conditions-of-access.pdf This article maybe used for research, teaching and private study purposes. Any substantial or systematic reproduction, re-distribution, re-selling, loan or sub-licensing, systematic supply or distribution in any form to anyone is expressly forbidden. The publisher does not give any warranty express or implied or make any representation that the contents will be complete or accurate or up to date. The accuracy of any instructions, formulae and drug doses should be independently verified with primary sources. The publisher shall not be liable for any loss, actions, claims, proceedings, demand or costs or damages whatsoever or howsoever caused arising directly or indirectly in connection with or arising out of the use of this material.
Transcript of The Journal of Bioadhesion and Biofilm Research · Predictions of full-scale ship resistance and...
This article was downloaded by:[Us Naval Academy]On: 13 September 2007Access Details: [subscription number 770001558]Publisher: Taylor & FrancisInforma Ltd Registered in England and Wales Registered Number: 1072954Registered office: Mortimer House, 37-41 Mortimer Street, London W1T 3JH, UK
BiofoulingThe Journal of Bioadhesion and BiofilmResearchPublication details, including instructions for authors and subscription information:http://www.informaworld.com/smpp/title~content=t713454511
Effects of coating roughness and biofouling on shipresistance and poweringMichael P. Schultz aa Department of Naval Architecture and Ocean Engineering, United States NavalAcademy, Annapolis, Maryland, USA
Online Publication Date: 01 October 2007To cite this Article: Schultz, Michael P. (2007) 'Effects of coating roughness andbiofouling on ship resistance and powering', Biofouling, 23:5, 331 - 341To link to this article: DOI: 10.1080/08927010701461974
URL: http://dx.doi.org/10.1080/08927010701461974
PLEASE SCROLL DOWN FOR ARTICLE
Full terms and conditions of use: http://www.informaworld.com/terms-and-conditions-of-access.pdf
This article maybe used for research, teaching and private study purposes. Any substantial or systematic reproduction,re-distribution, re-selling, loan or sub-licensing, systematic supply or distribution in any form to anyone is expresslyforbidden.
The publisher does not give any warranty express or implied or make any representation that the contents will becomplete or accurate or up to date. The accuracy of any instructions, formulae and drug doses should beindependently verified with primary sources. The publisher shall not be liable for any loss, actions, claims, proceedings,demand or costs or damages whatsoever or howsoever caused arising directly or indirectly in connection with orarising out of the use of this material.
Report Documentation Page Form ApprovedOMB No. 0704-0188
Public reporting burden for the collection of information is estimated to average 1 hour per response, including the time for reviewing instructions, searching existing data sources, gathering andmaintaining the data needed, and completing and reviewing the collection of information. Send comments regarding this burden estimate or any other aspect of this collection of information,including suggestions for reducing this burden, to Washington Headquarters Services, Directorate for Information Operations and Reports, 1215 Jefferson Davis Highway, Suite 1204, ArlingtonVA 22202-4302. Respondents should be aware that notwithstanding any other provision of law, no person shall be subject to a penalty for failing to comply with a collection of information if itdoes not display a currently valid OMB control number.
1. REPORT DATE MAR 2007 2. REPORT TYPE
3. DATES COVERED 00-00-2007 to 00-00-2007
4. TITLE AND SUBTITLE Effects of coating roughness and biofouling on ship resistance and powering
5a. CONTRACT NUMBER
5b. GRANT NUMBER
5c. PROGRAM ELEMENT NUMBER
6. AUTHOR(S) 5d. PROJECT NUMBER
5e. TASK NUMBER
5f. WORK UNIT NUMBER
7. PERFORMING ORGANIZATION NAME(S) AND ADDRESS(ES) United States Naval Academy,Department of Naval Architecture andOcean Engineering,Annapolis,MD,21402
8. PERFORMING ORGANIZATIONREPORT NUMBER
9. SPONSORING/MONITORING AGENCY NAME(S) AND ADDRESS(ES) 10. SPONSOR/MONITOR’S ACRONYM(S)
11. SPONSOR/MONITOR’S REPORT NUMBER(S)
12. DISTRIBUTION/AVAILABILITY STATEMENT Approved for public release; distribution unlimited
13. SUPPLEMENTARY NOTES
14. ABSTRACT Predictions of full-scale ship resistance and powering are made for antifouling coating systems with arange of roughness and fouling conditions. The estimates are based on results from laboratory-scale dragmeasurements and boundary layer similarity law analysis. In the present work, predictions are made for amid-sized naval surface combatant at cruising speed and near maximum speed. The results indicate thatslime films can lead to significant increases in resistance and powering and heavy calcareous fouling resultsin powering penalties up to 86% at cruising speed. The present estimates show good agreement with resultsfrom full-scale ship power trials.
15. SUBJECT TERMS
16. SECURITY CLASSIFICATION OF: 17. LIMITATION OF ABSTRACT Same as
Report (SAR)
18. NUMBEROF PAGES
12
19a. NAME OFRESPONSIBLE PERSON
a. REPORT unclassified
b. ABSTRACT unclassified
c. THIS PAGE unclassified
Standard Form 298 (Rev. 8-98) Prescribed by ANSI Std Z39-18
Dow
nloa
ded
By:
[Us
Nav
al A
cade
my]
At:
12:0
3 13
Sep
tem
ber 2
007
Effects of coating roughness and biofouling on ship resistanceand powering
MICHAEL P. SCHULTZ
Department of Naval Architecture and Ocean Engineering, United States Naval Academy, Annapolis, Maryland, USA
(Received 21 March 2007; accepted 15 May 2007)
AbstractPredictions of full-scale ship resistance and powering are made for antifouling coating systems with a range of roughness andfouling conditions. The estimates are based on results from laboratory-scale drag measurements and boundary layersimilarity law analysis. In the present work, predictions are made for a mid-sized naval surface combatant at cruising speedand near maximum speed. The results indicate that slime films can lead to significant increases in resistance and powering,and heavy calcareous fouling results in powering penalties up to 86% at cruising speed. The present estimates show goodagreement with results from full-scale ship power trials.
Keywords: Drag, powering, resistance, biofouling, roughness, antifouling coatings
Introduction
The primary role of a ship antifouling (AF) coating
system is to limit the increase in frictional drag as a
result of surface deterioration and biofouling accu-
mulation. Failure in this pursuit results in either
increased power to maintain a given speed or
reduced speed at a given input power, both of which
have associated economic penalties (Townsin,
2003). The effect of coating condition is crucial to
the performance of ships. Frictional drag alone can
account for as much as 90% of the total drag on
some hull types, even when the hull is relatively
smooth and unfouled (Kempf, 1937). For this
reason, a significant body of work has focused on
better understanding the effect of coating roughness
on frictional drag. A review of the early work in this
field is given by Lackenby (1962). More recently, the
research focused on assessing how changes in surface
roughness affect the drag of the self-polishing
copolymer (SPC) tributyl tin (TBT) systems (e.g.
Musker, 1980 – 1981; Townsin et al. 1981; Gran-
ville, 1987; Medhurst, 1989; Grigson, 1992), with
less effort given to quantifying the effect of fouling.
This was likely due to the fact that the TBT systems
provided long-term fouling control with minimal
settlement of fouling organisms (e.g. Jelic-Mrcelic
et al. 2006). However, these systems are facing a
worldwide ban in 2008 (Champ, 2003), and their
primary replacement, copper-based paints, are not as
effective in controlling fouling (Abbott et al. 2000).
This has spurred active research for effective, non-
toxic alternatives (e.g. Swain & Schultz, 1996;
Carman et al. 2006; Genzer & Efimenko, 2006;
Statz et al. 2006).
The impact of fouling on drag has long been
noted, and much of the early work is reviewed by
Anon (1952). Subsequent hydrodynamic research
has included laboratory studies of the effects of
biofilms (e.g. Watanabe et al. 1969; Picologlou et al.
1980; Schultz & Swain, 1999), filamentous algae
(e.g. Kouwen & Unny, 1973; Schultz, 2000), and
calcareous macrofouling (e.g. Leer-Andersen &
Larsson, 2003; Schultz, 2004). Full-scale ship testing
to document the effect of fouling on the drag of
copper-based coatings has also been conducted (e.g.
Lewthwaite et al. 1985; Haslbeck & Bohlander,
1992). The results of all these studies indicate that
fouling leads to a significant increase in frictional drag,
although the magnitude of the increase depends on
the fouling type and coverage. It should be noted that
despite the large body of research focused on under-
standing the impact of fouling on ship resistance, one
issue which has yet to be satisfactorily addressed is
how to define fouling coverage quantitatively so as to
allow simple predictions of resistance and powering.
Correspondence: M. P. Schultz, Department of Naval Architecture and Ocean Engineering, United States Naval Academy, Annapolis, MD 21402, USA.
Fax: þ1(410) 293 2219. E-mail: [email protected]
Biofouling, 2007; 23(5): 331 – 341
ISSN 0892-7014 print/ISSN 1029-2454 online � 2007 Taylor & Francis
DOI: 10.1080/08927010701461974
Dow
nloa
ded
By:
[Us
Nav
al A
cade
my]
At:
12:0
3 13
Sep
tem
ber 2
007
In the present paper, predictions of full-scale ship
resistance and powering are made for a mid-sized
naval surface combatant coated with AF systems with
a range of roughness and fouling conditions operating
at cruising speed and near maximum speed. The
predictions are based on results from laboratory-scale
drag measurements and boundary layer similarity law
analysis. While the roughness and fouling conditions
considered in this work are only representative (not
exhaustive) and the predictions are for a single hull
form, the methodology implemented here can be used
for other fouling conditions and ship hull forms for
which laboratory drag data are available. Future work
is planned in which the economic impact of hull
roughness and fouling is quantified for a range of ship
types and operational scenarios using the methodol-
ogy described herein.
Materials and methods
In this section, ship resistance and powering predic-
tions based on scale model testing are discussed.
Next, some basic characteristics of turbulent bound-
ary layer flows and the impact of surface roughness
on these flows are discussed. Finally, a method of
relating laboratory measurements and observations
to the full-scale frictional drag of a ship using
boundary layer similarity laws is presented. (For
nomenclature, see Appendix).
Prediction of ship resistance and powering using
scale model tests
Estimates of ship resistance and power requirements
are typically made through towing tank tests of a ship
model that is geometrically similar to the full-scale
ship. The total resistance (drag) of the ship model,
RTm, is made up of two primary components. These
are the residuary resistance, RRm, and the frictional
resistance, RFm, as shown in Equation 1 (Gillmer &
Johnson, 1982).
RTm ¼ RRm þ RFm ð1Þ
The residuary resistance is mainly due to wavemak-
ing, while the frictional resistance is due to tangential
shear stresses on the ship hull arising from the
viscosity of the fluid. It is customary to express
Equation 1 in its non-dimensional form. This is done
by dividing by the reference dynamic pressure,12rmU2
m, and the wetted area of the ship model hull,
Sm, where rm is the fluid density for the model tests
and Um is the ship model towing speed. The total
resistance coefficient of the model, CTm, is, therefore,
the sum of the residuary resistance coefficient of the
model, CRm, and the frictional resistance coefficient,
CFm. The residuary resistance coefficient of the
model is a function of the Froude number,
Frm¼Um(gLm)71/2, where g is the acceleration due
to gravity and Lm is the length of the model.
Likewise, the frictional resistance coefficient of the
model is a function of the Reynolds number,
Rem¼UmLmnm71, where nm is the kinematic viscosity
of the fluid for the model tests. The total resistance
coefficient of the model is, therefore, given as
(Gillmer & Johnson, 1982)1:
CTm ¼ CRmðFrmÞ þ CFmðRemÞ ð2Þ
In order to accurately predict the resistance of the
full-scale ship with model tests, it is desirable to have
dynamic similarity between the ship and the model.
Equation 2 illustrates that in order to accomplish
this, both the Froude number and the Reynolds
number would have to be matched between the
model and the ship. In practice, this is impossible to
do. Instead incomplete dynamic similarity is used in
which the Froude number of the model and the ship
are matched as shown in Equation 3:
Frm ¼ Frs
UmffiffiffiffiffiffiffiffiffigLm
p ¼ UsffiffiffiffiffiffiffigLs
pð3Þ
where, Us is the ship speed and Ls is the ship length.
Towing tank tests are carried out at a range of model
speeds corresponding to full-scale ship speeds in
accordance with Equation 3, as shown below:
Um ¼ Us
ffiffiffiffiffiffiLm
Ls
r¼ Usffiffiffi
lp ð4Þ
where, the scale ratio, l¼Ls/Lm. The total resistance
coefficient, CTm, is measured at each speed. The
frictional resistance coefficient, CFm, is obtained using
the ITTC-1957 formula (Woo et al. 1983) given as:
CFm ¼0:075
log10 Rem � 2ð Þ2ð5Þ
The residuary resistance coefficient of the model,
CRm, is then found using Equation 2. Since the
residuary resistance is a function of the Froude
number and Frm¼Frs in the model tests, it is
understood that CRm¼CRs. The frictional resistance
coefficient of the ship, CFs, is also found using
Equation 5 by substituting Res for Rem. The total
resistance coefficient of the ship, CTs, is given by
Equation 6 (Gillmer & Johnson, 1982):
CTs ¼ CRs þ CFs þ CA ð6Þ
where, CA is the correlation allowance. The correla-
tion allowance is used to account for differences in
332 M. P. Schultz
Dow
nloa
ded
By:
[Us
Nav
al A
cade
my]
At:
12:0
3 13
Sep
tem
ber 2
007
actual ship resistance typically due to scale effect on
propeller characteristics, scale effect on the ship
wake, the effect of three-dimensionality on the
viscous resistance, and hull roughness (Woo et al.
1983). In the present work, the effect of hull
roughness will be dealt with separately and will be
accounted for in an added frictional resistance term,
DCFs so the total resistance coefficient of the ship,
CTs, is:
CTs ¼ CRs þ CFs þ CA þ DCFs ð7Þ
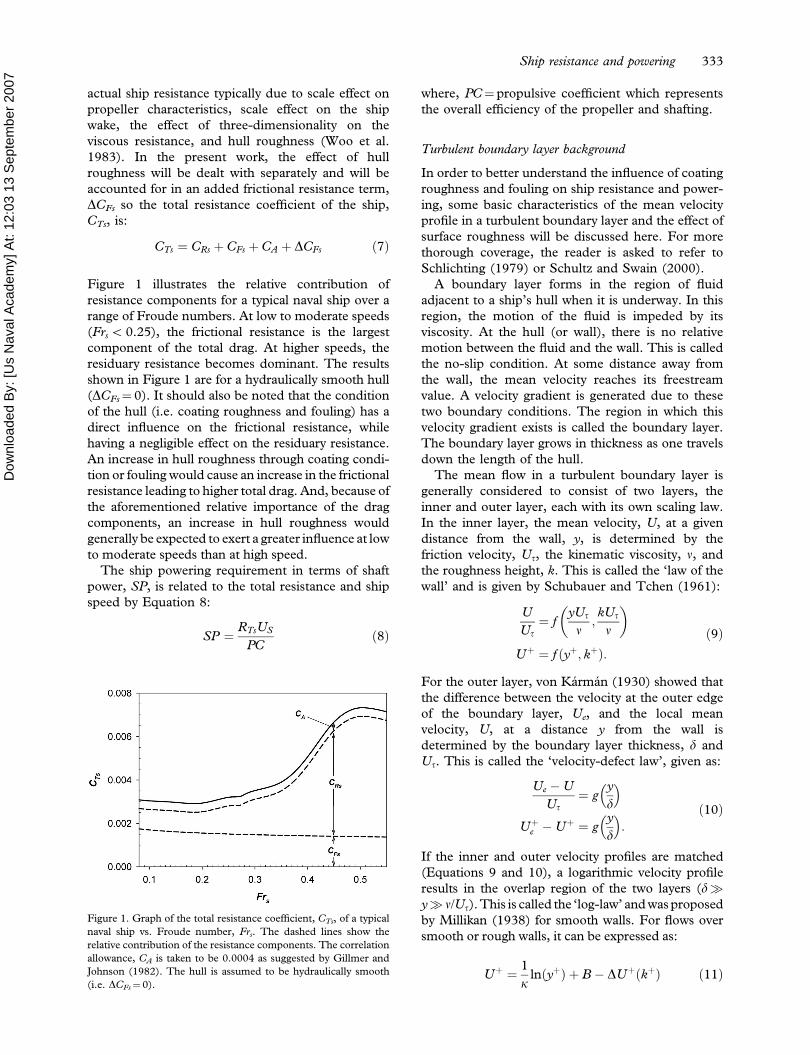
Figure 1 illustrates the relative contribution of
resistance components for a typical naval ship over a
range of Froude numbers. At low to moderate speeds
(Frs50.25), the frictional resistance is the largest
component of the total drag. At higher speeds, the
residuary resistance becomes dominant. The results
shown in Figure 1 are for a hydraulically smooth hull
(DCFs¼ 0). It should also be noted that the condition
of the hull (i.e. coating roughness and fouling) has a
direct influence on the frictional resistance, while
having a negligible effect on the residuary resistance.
An increase in hull roughness through coating condi-
tion or fouling would cause an increase in the frictional
resistance leading to higher total drag. And, because of
the aforementioned relative importance of the drag
components, an increase in hull roughness would
generally be expected to exert a greater influence at low
to moderate speeds than at high speed.
The ship powering requirement in terms of shaft
power, SP, is related to the total resistance and ship
speed by Equation 8:
SP ¼ RTsUS
PCð8Þ
where, PC¼ propulsive coefficient which represents
the overall efficiency of the propeller and shafting.
Turbulent boundary layer background
In order to better understand the influence of coating
roughness and fouling on ship resistance and power-
ing, some basic characteristics of the mean velocity
profile in a turbulent boundary layer and the effect of
surface roughness will be discussed here. For more
thorough coverage, the reader is asked to refer to
Schlichting (1979) or Schultz and Swain (2000).
A boundary layer forms in the region of fluid
adjacent to a ship’s hull when it is underway. In this
region, the motion of the fluid is impeded by its
viscosity. At the hull (or wall), there is no relative
motion between the fluid and the wall. This is called
the no-slip condition. At some distance away from
the wall, the mean velocity reaches its freestream
value. A velocity gradient is generated due to these
two boundary conditions. The region in which this
velocity gradient exists is called the boundary layer.
The boundary layer grows in thickness as one travels
down the length of the hull.
The mean flow in a turbulent boundary layer is
generally considered to consist of two layers, the
inner and outer layer, each with its own scaling law.
In the inner layer, the mean velocity, U, at a given
distance from the wall, y, is determined by the
friction velocity, Ut, the kinematic viscosity, n, and
the roughness height, k. This is called the ‘law of the
wall’ and is given by Schubauer and Tchen (1961):
U
Ut¼ f
yUt
n;kUt
n
� �
Uþ ¼ f yþ; kþð Þ:ð9Þ
For the outer layer, von Karman (1930) showed that
the difference between the velocity at the outer edge
of the boundary layer, Ue, and the local mean
velocity, U, at a distance y from the wall is
determined by the boundary layer thickness, d and
Ut. This is called the ‘velocity-defect law’, given as:
Ue �U
Ut¼ g
y
d
� �
Uþe �Uþ ¼ gy
d
� �:
ð10Þ
If the inner and outer velocity profiles are matched
(Equations 9 and 10), a logarithmic velocity profile
results in the overlap region of the two layers (d�y� n/Ut). This is called the ‘log-law’ and was proposed
by Millikan (1938) for smooth walls. For flows over
smooth or rough walls, it can be expressed as:
Uþ ¼ 1
kln yþð Þ þ B� DUþ kþð Þ ð11Þ
Figure 1. Graph of the total resistance coefficient, CTs, of a typical
naval ship vs. Froude number, Frs. The dashed lines show the
relative contribution of the resistance components. The correlation
allowance, CA is taken to be 0.0004 as suggested by Gillmer and
Johnson (1982). The hull is assumed to be hydraulically smooth
(i.e. DCFs¼0).
Ship resistance and powering 333
Dow
nloa
ded
By:
[Us
Nav
al A
cade
my]
At:
12:0
3 13
Sep
tem
ber 2
007
where, k¼ von Karman constant¼ 0.41, B¼smooth-wall log-law intercept¼ 5.0, and DUþ¼roughness function (note that, for smooth walls,
DUþ : 0). The effect of surface roughness, there-
fore, is to cause a downward shift (DUþ) in the log-
law velocity profile. This is indicative of an increased
momentum deficit due to the roughness and is
directly related to the increase in frictional drag of
the surface.
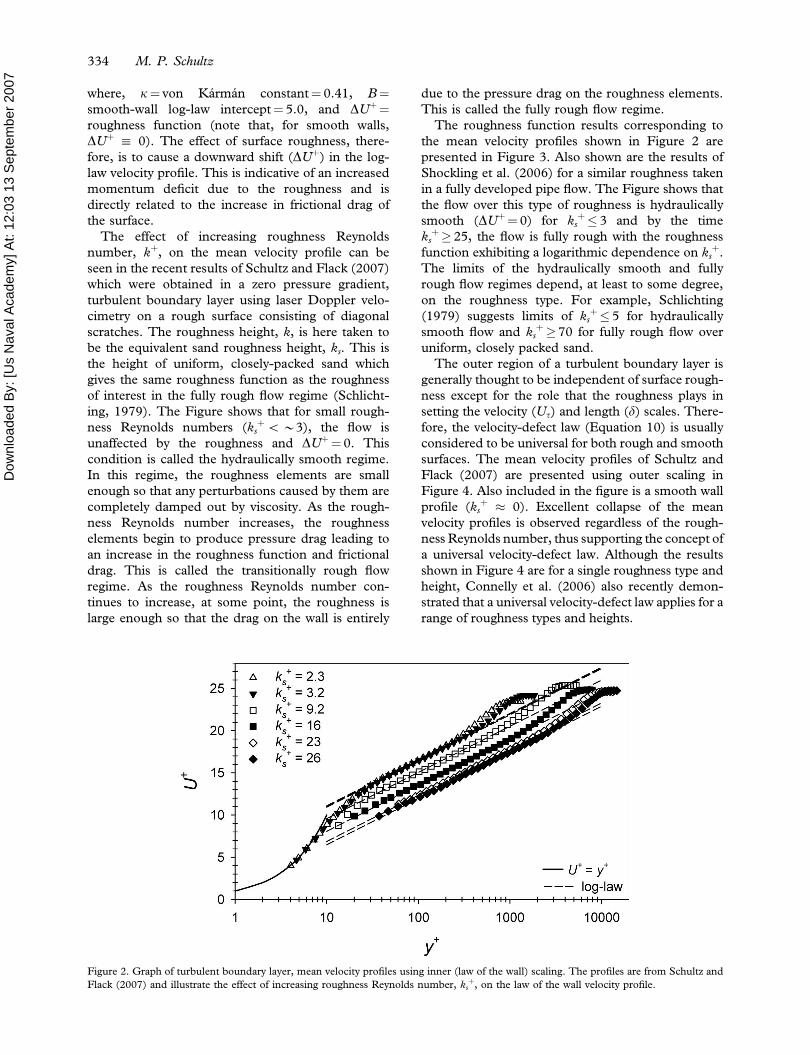
The effect of increasing roughness Reynolds
number, kþ, on the mean velocity profile can be
seen in the recent results of Schultz and Flack (2007)
which were obtained in a zero pressure gradient,
turbulent boundary layer using laser Doppler velo-
cimetry on a rough surface consisting of diagonal
scratches. The roughness height, k, is here taken to
be the equivalent sand roughness height, ks. This is
the height of uniform, closely-packed sand which
gives the same roughness function as the roughness
of interest in the fully rough flow regime (Schlicht-
ing, 1979). The Figure shows that for small rough-
ness Reynolds numbers (ksþ5*3), the flow is
unaffected by the roughness and DUþ¼ 0. This
condition is called the hydraulically smooth regime.
In this regime, the roughness elements are small
enough so that any perturbations caused by them are
completely damped out by viscosity. As the rough-
ness Reynolds number increases, the roughness
elements begin to produce pressure drag leading to
an increase in the roughness function and frictional
drag. This is called the transitionally rough flow
regime. As the roughness Reynolds number con-
tinues to increase, at some point, the roughness is
large enough so that the drag on the wall is entirely
due to the pressure drag on the roughness elements.
This is called the fully rough flow regime.
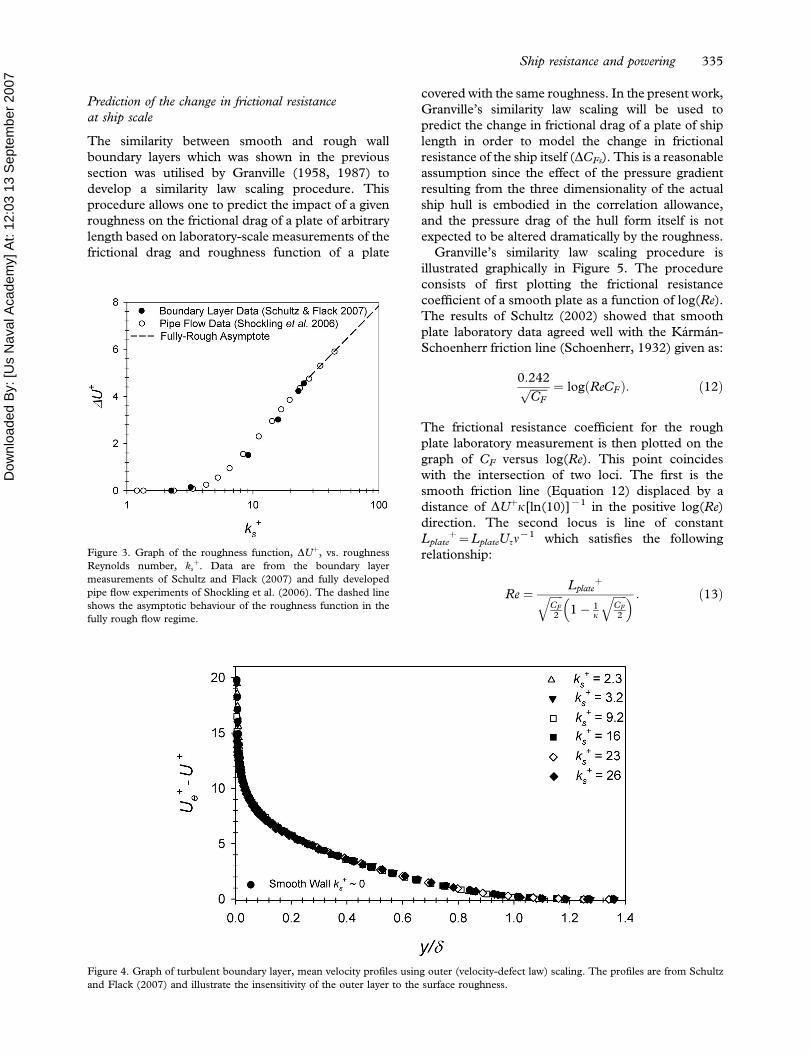
The roughness function results corresponding to
the mean velocity profiles shown in Figure 2 are
presented in Figure 3. Also shown are the results of
Shockling et al. (2006) for a similar roughness taken
in a fully developed pipe flow. The Figure shows that
the flow over this type of roughness is hydraulically
smooth (DUþ¼ 0) for ksþ� 3 and by the time
ksþ� 25, the flow is fully rough with the roughness
function exhibiting a logarithmic dependence on ksþ.
The limits of the hydraulically smooth and fully
rough flow regimes depend, at least to some degree,
on the roughness type. For example, Schlichting
(1979) suggests limits of ksþ� 5 for hydraulically
smooth flow and ksþ� 70 for fully rough flow over
uniform, closely packed sand.
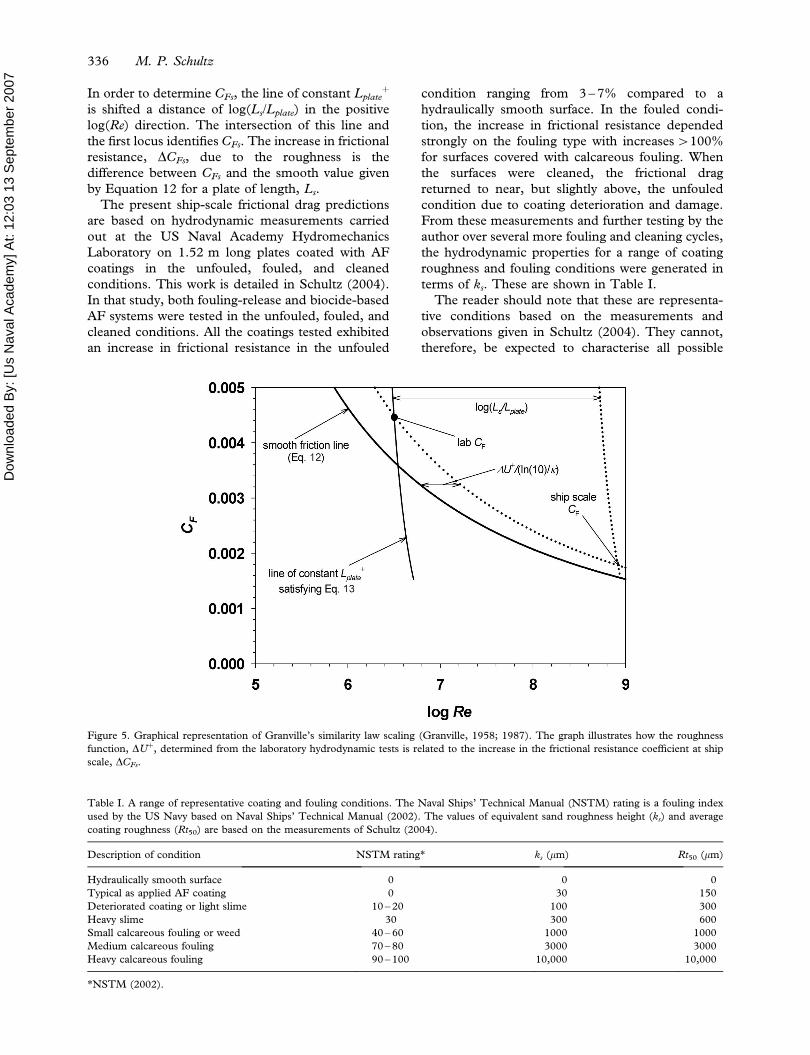
The outer region of a turbulent boundary layer is
generally thought to be independent of surface rough-
ness except for the role that the roughness plays in
setting the velocity (Ut) and length (d) scales. There-
fore, the velocity-defect law (Equation 10) is usually
considered to be universal for both rough and smooth
surfaces. The mean velocity profiles of Schultz and
Flack (2007) are presented using outer scaling in
Figure 4. Also included in the figure is a smooth wall
profile (ksþ � 0). Excellent collapse of the mean
velocity profiles is observed regardless of the rough-
ness Reynolds number, thus supporting the concept of
a universal velocity-defect law. Although the results
shown in Figure 4 are for a single roughness type and
height, Connelly et al. (2006) also recently demon-
strated that a universal velocity-defect law applies for a
range of roughness types and heights.
Figure 2. Graph of turbulent boundary layer, mean velocity profiles using inner (law of the wall) scaling. The profiles are from Schultz and
Flack (2007) and illustrate the effect of increasing roughness Reynolds number, ksþ, on the law of the wall velocity profile.
334 M. P. Schultz
Dow
nloa
ded
By:
[Us
Nav
al A
cade
my]
At:
12:0
3 13
Sep
tem
ber 2
007
Prediction of the change in frictional resistance
at ship scale
The similarity between smooth and rough wall
boundary layers which was shown in the previous
section was utilised by Granville (1958, 1987) to
develop a similarity law scaling procedure. This
procedure allows one to predict the impact of a given
roughness on the frictional drag of a plate of arbitrary
length based on laboratory-scale measurements of the
frictional drag and roughness function of a plate
covered with the same roughness. In the present work,
Granville’s similarity law scaling will be used to
predict the change in frictional drag of a plate of ship
length in order to model the change in frictional
resistance of the ship itself (DCFs). This is a reasonable
assumption since the effect of the pressure gradient
resulting from the three dimensionality of the actual
ship hull is embodied in the correlation allowance,
and the pressure drag of the hull form itself is not
expected to be altered dramatically by the roughness.
Granville’s similarity law scaling procedure is
illustrated graphically in Figure 5. The procedure
consists of first plotting the frictional resistance
coefficient of a smooth plate as a function of log(Re).
The results of Schultz (2002) showed that smooth
plate laboratory data agreed well with the Karman-
Schoenherr friction line (Schoenherr, 1932) given as:
0:242ffiffiffiffiffiffiCF
p ¼ log ReCFð Þ: ð12Þ
The frictional resistance coefficient for the rough
plate laboratory measurement is then plotted on the
graph of CF versus log(Re). This point coincides
with the intersection of two loci. The first is the
smooth friction line (Equation 12) displaced by a
distance of DUþk[ln(10)]71 in the positive log(Re)
direction. The second locus is line of constant
Lplateþ¼LplateUtn
71 which satisfies the following
relationship:
Re ¼ Lplateþffiffiffiffiffi
CF
2
q1� 1
k
ffiffiffiffiffiCF
2
q� � : ð13Þ
Figure 3. Graph of the roughness function, DUþ, vs. roughness
Reynolds number, ksþ. Data are from the boundary layer
measurements of Schultz and Flack (2007) and fully developed
pipe flow experiments of Shockling et al. (2006). The dashed line
shows the asymptotic behaviour of the roughness function in the
fully rough flow regime.
Figure 4. Graph of turbulent boundary layer, mean velocity profiles using outer (velocity-defect law) scaling. The profiles are from Schultz
and Flack (2007) and illustrate the insensitivity of the outer layer to the surface roughness.
Ship resistance and powering 335
Dow
nloa
ded
By:
[Us
Nav
al A
cade
my]
At:
12:0
3 13
Sep
tem
ber 2
007
In order to determine CFs, the line of constant Lplateþ
is shifted a distance of log(Ls/Lplate) in the positive
log(Re) direction. The intersection of this line and
the first locus identifies CFs. The increase in frictional
resistance, DCFs, due to the roughness is the
difference between CFs and the smooth value given
by Equation 12 for a plate of length, Ls.
The present ship-scale frictional drag predictions
are based on hydrodynamic measurements carried
out at the US Naval Academy Hydromechanics
Laboratory on 1.52 m long plates coated with AF
coatings in the unfouled, fouled, and cleaned
conditions. This work is detailed in Schultz (2004).
In that study, both fouling-release and biocide-based
AF systems were tested in the unfouled, fouled, and
cleaned conditions. All the coatings tested exhibited
an increase in frictional resistance in the unfouled
condition ranging from 3 – 7% compared to a
hydraulically smooth surface. In the fouled condi-
tion, the increase in frictional resistance depended
strongly on the fouling type with increases4100%
for surfaces covered with calcareous fouling. When
the surfaces were cleaned, the frictional drag
returned to near, but slightly above, the unfouled
condition due to coating deterioration and damage.
From these measurements and further testing by the
author over several more fouling and cleaning cycles,
the hydrodynamic properties for a range of coating
roughness and fouling conditions were generated in
terms of ks. These are shown in Table I.
The reader should note that these are representa-
tive conditions based on the measurements and
observations given in Schultz (2004). They cannot,
therefore, be expected to characterise all possible
Figure 5. Graphical representation of Granville’s similarity law scaling (Granville, 1958; 1987). The graph illustrates how the roughness
function, DUþ, determined from the laboratory hydrodynamic tests is related to the increase in the frictional resistance coefficient at ship
scale, DCFs.
Table I. A range of representative coating and fouling conditions. The Naval Ships’ Technical Manual (NSTM) rating is a fouling index
used by the US Navy based on Naval Ships’ Technical Manual (2002). The values of equivalent sand roughness height (ks) and average
coating roughness (Rt50) are based on the measurements of Schultz (2004).
Description of condition NSTM rating* ks (mm) Rt50 (mm)
Hydraulically smooth surface 0 0 0
Typical as applied AF coating 0 30 150
Deteriorated coating or light slime 10 – 20 100 300
Heavy slime 30 300 600
Small calcareous fouling or weed 40 – 60 1000 1000
Medium calcareous fouling 70 – 80 3000 3000
Heavy calcareous fouling 90 – 100 10,000 10,000
*NSTM (2002).
336 M. P. Schultz
Dow
nloa
ded
By:
[Us
Nav
al A
cade
my]
At:
12:0
3 13
Sep
tem
ber 2
007
coating or fouling conditions. For example, spatial
heterogeneity in coating roughness and fouling and
differences in fouling community composition all
could have a significant effect on ks and the resulting
DCFs. Also shown in Table I are the estimated
average hull roughness (Rt50) for the different
conditions and the US Navy fouling rating according
to Naval Ships’ Technical Manual (NSTM 2002).
Rt50 is the maximum peak to trough roughness
height measured over a sampling length of 50 mm
which is a standard measure of coating roughness
based on hull surveys using the BMT Hull Rough-
ness Analyzer (Medhurst, 1990; Howell & Behrends,
2006). Rt50 is not generally used to characterise a
fouled surface; therefore, the values given for these
conditions in Table I represent the likely maximum
peak to trough height of the fouling in each case.
Chapter 081 of the NSTM (2002) is the document
that the US Navy uses for guidance on underwater
hull cleaning. The NSTM ratings shown in Table I
are used by divers to evaluate the fouling condition of
the hull in situ. Ratings of 30 or less are used to denote
coverage of soft fouling only. A rating of 0 denotes a
surface free of fouling, while a rating of 30 represents
heavy coverage of soft fouling. A rating of 40 indicates
a surface with incipient calcareous fouling. The rating
increases with the severity of the calcareous fouling,
with a rating of 100 denoting heavy coverage of large
calcareous fouling of multiple types. Some distinction
should also be drawn between light and heavy slime
layers. Heavy slime would be a condition where the
underlying paint colour is difficult or impossible to
determine. In the light slime condition, the underlying
paint colour is visible.
The paper of Woo et al. (1983) provides both full
scale trial powering data as well as model drag and
propeller results for the US Navy Oliver Hazard Perry
class frigate (FFG-7). These data were used in the
present work in order to assess the impact of coating
roughness and fouling on the shaft power require-
ments (SP) of an FFG-7 hull form. The FFG-7
has a waterline length of 124.4 m with a beam of
14.3 m and displaces 3779 metric tonnes. The
full-scale trials were carried out in seawater with
r¼ 1022.3 kg m73 and n¼ 8.976 1077 m2 s71.
The full-scale predictions herein were also made
for these conditions. The ship was recently out of dry
dock when the full-scale trials were conducted, and
the average hull roughness (Rt50) was estimated to be
150 mm. The ship model tests were conducted on a
1:20.82 scale model at the Naval Surface Warfare
Center, Carderock, MD, USA. Further details are
given in Woo et al. (1983).
The data from the model tests were used to predict
the full-scale shaft powering requirements of the
FFG-7 using the procedures previously outlined in
this paper. The correlation allowance (CA) was taken
to be 0.0004 as suggested by Gillmer and Johnson
(1982) for a similar hull form. The change in the
frictional resistance coefficient (DCFs) resulting from
the hull roughness was calculated using similarity law
scaling procedure (Granville, 1958; 1987) for
Rt50¼ 150 mm (ks¼ 30 mm). It was assumed for this
calculation, as well as the subsequent ones presented
in this paper, that the roughness function follows the
results of Schultz and Flack (2007) and Shockling
et al. (2006) shown in Figure 3. While it is known
that the roughness function is not universal for all
roughness types in the transitionally rough flow
regime (Grigson, 1992), the results of Schultz
(2004) agree reasonably well with this roughness
function for a range of coating roughness and fouling
conditions. The procedure for calculating DCFs is as
follows: i) The value of ks for a given hull condition is
selected based on Table I; ii) an initial value of ksþ is
assumed; iii) the corresponding roughness function
(DUþ) is determined from Figure 3; iv) the viscous
length scale (n/Ut) is determined as ks/ksþ; v) the
value of Lplateþ is determined as Lplate divided by the
viscous length scale (Lplate¼ 1.52 m in the study of
Schultz, 2004); vi) the two loci of Granville’s
procedure are located. (a) The first is a line of Lplateþ
from step v satisfying Equation 13; (b) the second is
Equation 12 offset by DUþk[ln(10)]71 in the positive
log(Re) direction; vii) the ship scale frictional
resistance coefficient (CFs) is located by the intersec-
tion of the second locus and the first locus shifted a
distance of log(Ls/Lplate) in the positive log(Re)
direction; viii) the corresponding value of Res is
obtained from the graph. If Res is the value desired,
the procedure is complete. If it is too low, a larger ksþ
is used and steps iii – viii are repeated. If Res is too
high, a smaller ksþ is used and steps iii – viii are
repeated; ix) the increase in frictional resistance,
DCFs, due to the roughness is the difference between
CFs and the smooth value given by Equation 12 for a
plate of length, Ls; x) DCFs is used in Equations 7 and
8 to predict the resulting SP.
Results and discussion
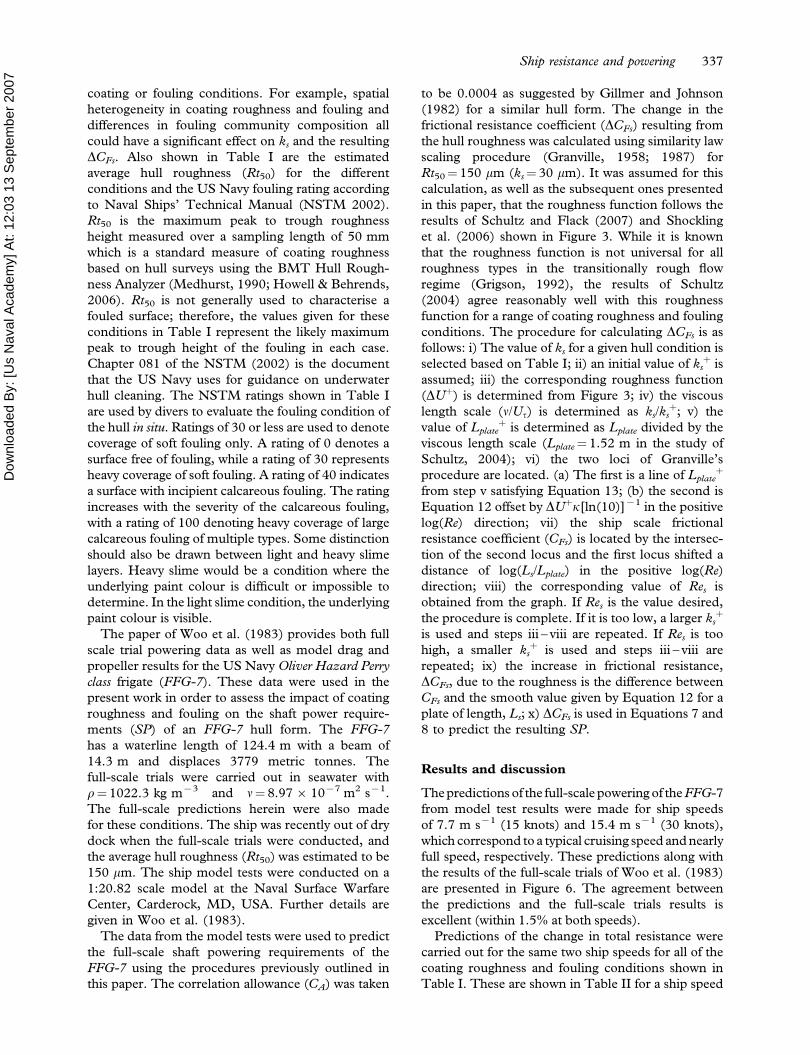
The predictions of the full-scale powering of the FFG-7
from model test results were made for ship speeds
of 7.7 m s71 (15 knots) and 15.4 m s71 (30 knots),
which correspond to a typical cruising speed and nearly
full speed, respectively. These predictions along with
the results of the full-scale trials of Woo et al. (1983)
are presented in Figure 6. The agreement between
the predictions and the full-scale trials results is
excellent (within 1.5% at both speeds).
Predictions of the change in total resistance were
carried out for the same two ship speeds for all of the
coating roughness and fouling conditions shown in
Table I. These are shown in Table II for a ship speed
Ship resistance and powering 337
Dow
nloa
ded
By:
[Us
Nav
al A
cade
my]
At:
12:0
3 13
Sep
tem
ber 2
007
of 7.7 m s71 (15 knots). The results indicate that
only a small resistance penalty (*2%) is expected to
result from a typical, as applied AF coating
compared to a hydraulically smooth hull. With
coating deterioration or a light slime layer, the
impact on resistance begins to become significant
(*11% increase in RT). The resistance penalty
continues to increase with the severity of fouling
until, for a heavy layer of calcareous fouling, the total
resistance is nearly doubled at cruising speed (*89%
increase in RT).
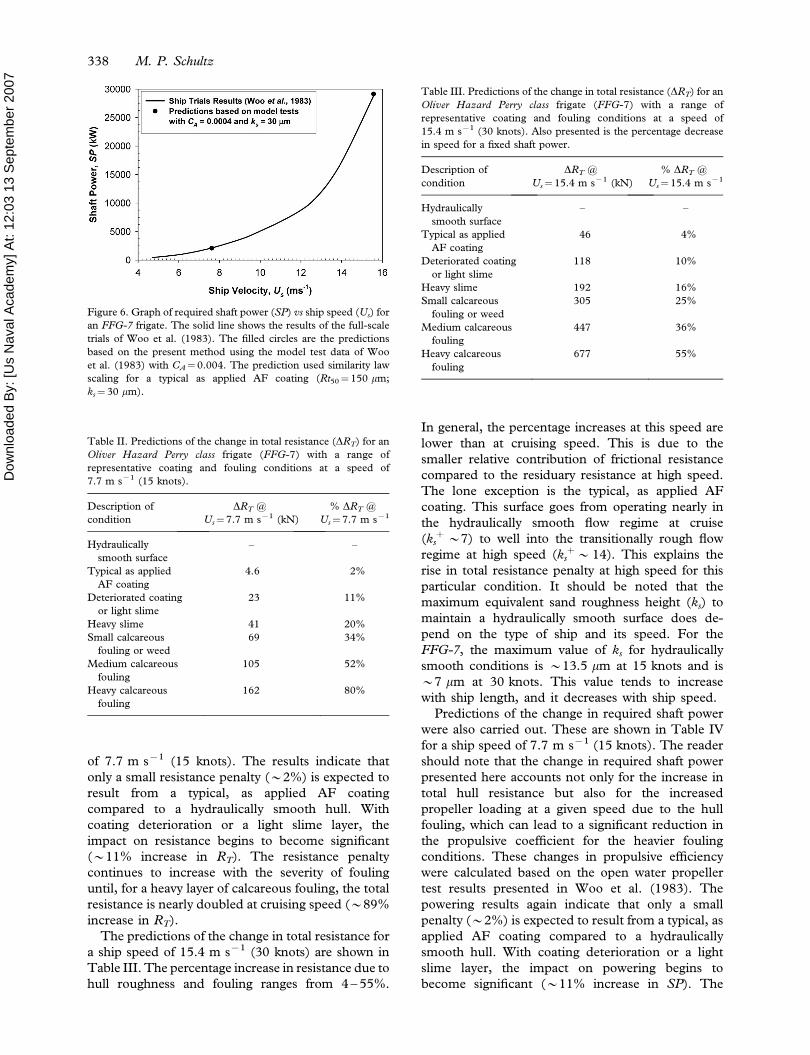
The predictions of the change in total resistance for
a ship speed of 15.4 m s71 (30 knots) are shown in
Table III. The percentage increase in resistance due to
hull roughness and fouling ranges from 4 – 55%.
In general, the percentage increases at this speed are
lower than at cruising speed. This is due to the
smaller relative contribution of frictional resistance
compared to the residuary resistance at high speed.
The lone exception is the typical, as applied AF
coating. This surface goes from operating nearly in
the hydraulically smooth flow regime at cruise
(ksþ*7) to well into the transitionally rough flow
regime at high speed (ksþ*14). This explains the
rise in total resistance penalty at high speed for this
particular condition. It should be noted that the
maximum equivalent sand roughness height (ks) to
maintain a hydraulically smooth surface does de-
pend on the type of ship and its speed. For the
FFG-7, the maximum value of ks for hydraulically
smooth conditions is *13.5 mm at 15 knots and is
*7 mm at 30 knots. This value tends to increase
with ship length, and it decreases with ship speed.
Predictions of the change in required shaft power
were also carried out. These are shown in Table IV
for a ship speed of 7.7 m s71 (15 knots). The reader
should note that the change in required shaft power
presented here accounts not only for the increase in
total hull resistance but also for the increased
propeller loading at a given speed due to the hull
fouling, which can lead to a significant reduction in
the propulsive coefficient for the heavier fouling
conditions. These changes in propulsive efficiency
were calculated based on the open water propeller
test results presented in Woo et al. (1983). The
powering results again indicate that only a small
penalty (*2%) is expected to result from a typical, as
applied AF coating compared to a hydraulically
smooth hull. With coating deterioration or a light
slime layer, the impact on powering begins to
become significant (*11% increase in SP). The
Figure 6. Graph of required shaft power (SP) vs ship speed (Us) for
an FFG-7 frigate. The solid line shows the results of the full-scale
trials of Woo et al. (1983). The filled circles are the predictions
based on the present method using the model test data of Woo
et al. (1983) with CA¼0.004. The prediction used similarity law
scaling for a typical as applied AF coating (Rt50¼150 mm;
ks¼30 mm).
Table II. Predictions of the change in total resistance (DRT) for an
Oliver Hazard Perry class frigate (FFG-7) with a range of
representative coating and fouling conditions at a speed of
7.7 m s71 (15 knots).
Description of
condition
DRT @
Us¼7.7 m s71 (kN)
% DRT @
Us¼7.7 m s71
Hydraulically
smooth surface
– –
Typical as applied
AF coating
4.6 2%
Deteriorated coating
or light slime
23 11%
Heavy slime 41 20%
Small calcareous
fouling or weed
69 34%
Medium calcareous
fouling
105 52%
Heavy calcareous
fouling
162 80%
Table III. Predictions of the change in total resistance (DRT) for an
Oliver Hazard Perry class frigate (FFG-7) with a range of
representative coating and fouling conditions at a speed of
15.4 m s71 (30 knots). Also presented is the percentage decrease
in speed for a fixed shaft power.
Description of
condition
DRT @
Us¼ 15.4 m s71 (kN)
% DRT @
Us¼15.4 m s71
Hydraulically
smooth surface
– –
Typical as applied
AF coating
46 4%
Deteriorated coating
or light slime
118 10%
Heavy slime 192 16%
Small calcareous
fouling or weed
305 25%
Medium calcareous
fouling
447 36%
Heavy calcareous
fouling
677 55%
338 M. P. Schultz
Dow
nloa
ded
By:
[Us
Nav
al A
cade
my]
At:
12:0
3 13
Sep
tem
ber 2
007
powering penalty continues to increase with the
severity of fouling until, for a heavy layer of
calcareous fouling, the required power is increased
by 86%.
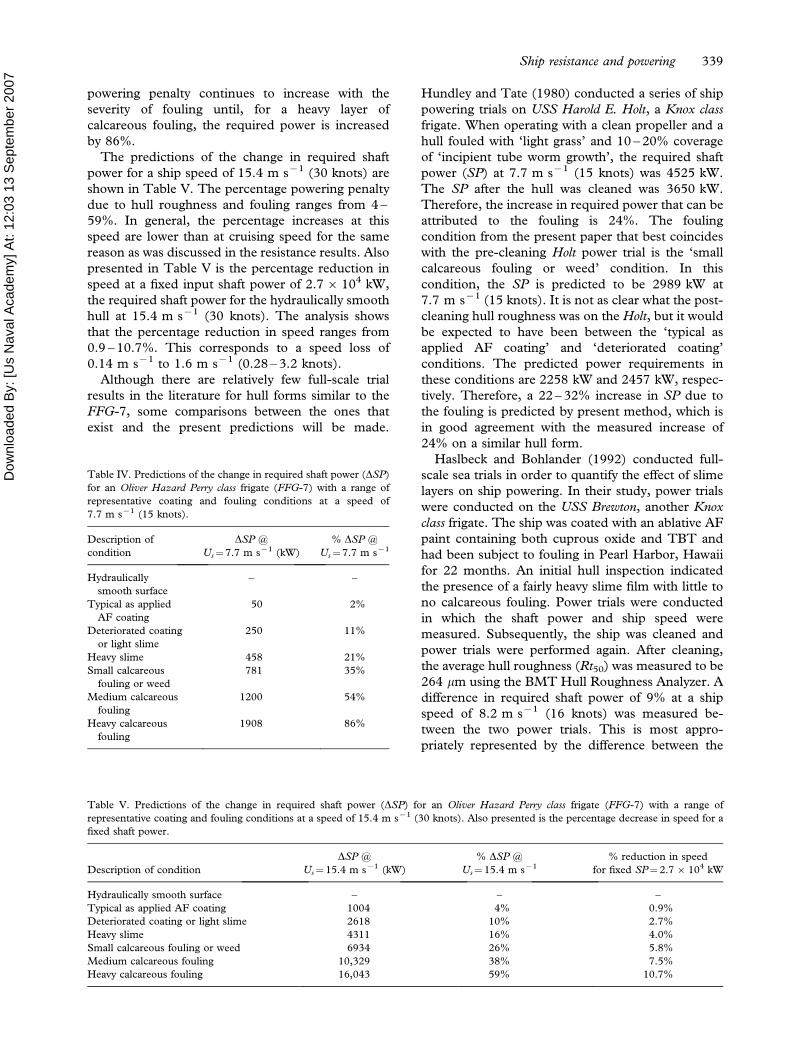
The predictions of the change in required shaft
power for a ship speed of 15.4 m s71 (30 knots) are
shown in Table V. The percentage powering penalty
due to hull roughness and fouling ranges from 4 –
59%. In general, the percentage increases at this
speed are lower than at cruising speed for the same
reason as was discussed in the resistance results. Also
presented in Table V is the percentage reduction in
speed at a fixed input shaft power of 2.76 104 kW,
the required shaft power for the hydraulically smooth
hull at 15.4 m s71 (30 knots). The analysis shows
that the percentage reduction in speed ranges from
0.9 – 10.7%. This corresponds to a speed loss of
0.14 m s71 to 1.6 m s71 (0.28 – 3.2 knots).
Although there are relatively few full-scale trial
results in the literature for hull forms similar to the
FFG-7, some comparisons between the ones that
exist and the present predictions will be made.
Hundley and Tate (1980) conducted a series of ship
powering trials on USS Harold E. Holt, a Knox class
frigate. When operating with a clean propeller and a
hull fouled with ‘light grass’ and 10 – 20% coverage
of ‘incipient tube worm growth’, the required shaft
power (SP) at 7.7 m s71 (15 knots) was 4525 kW.
The SP after the hull was cleaned was 3650 kW.
Therefore, the increase in required power that can be
attributed to the fouling is 24%. The fouling
condition from the present paper that best coincides
with the pre-cleaning Holt power trial is the ‘small
calcareous fouling or weed’ condition. In this
condition, the SP is predicted to be 2989 kW at
7.7 m s71 (15 knots). It is not as clear what the post-
cleaning hull roughness was on the Holt, but it would
be expected to have been between the ‘typical as
applied AF coating’ and ‘deteriorated coating’
conditions. The predicted power requirements in
these conditions are 2258 kW and 2457 kW, respec-
tively. Therefore, a 22 – 32% increase in SP due to
the fouling is predicted by present method, which is
in good agreement with the measured increase of
24% on a similar hull form.
Haslbeck and Bohlander (1992) conducted full-
scale sea trials in order to quantify the effect of slime
layers on ship powering. In their study, power trials
were conducted on the USS Brewton, another Knox
class frigate. The ship was coated with an ablative AF
paint containing both cuprous oxide and TBT and
had been subject to fouling in Pearl Harbor, Hawaii
for 22 months. An initial hull inspection indicated
the presence of a fairly heavy slime film with little to
no calcareous fouling. Power trials were conducted
in which the shaft power and ship speed were
measured. Subsequently, the ship was cleaned and
power trials were performed again. After cleaning,
the average hull roughness (Rt50) was measured to be
264 mm using the BMT Hull Roughness Analyzer. A
difference in required shaft power of 9% at a ship
speed of 8.2 m s71 (16 knots) was measured be-
tween the two power trials. This is most appro-
priately represented by the difference between the
Table V. Predictions of the change in required shaft power (DSP) for an Oliver Hazard Perry class frigate (FFG-7) with a range of
representative coating and fouling conditions at a speed of 15.4 m s71 (30 knots). Also presented is the percentage decrease in speed for a
fixed shaft power.
Description of condition
DSP @
Us¼15.4 m s71 (kW)
% DSP @
Us¼15.4 m s71
% reduction in speed
for fixed SP¼2.76 104 kW
Hydraulically smooth surface – – –
Typical as applied AF coating 1004 4% 0.9%
Deteriorated coating or light slime 2618 10% 2.7%
Heavy slime 4311 16% 4.0%
Small calcareous fouling or weed 6934 26% 5.8%
Medium calcareous fouling 10,329 38% 7.5%
Heavy calcareous fouling 16,043 59% 10.7%
Table IV. Predictions of the change in required shaft power (DSP)
for an Oliver Hazard Perry class frigate (FFG-7) with a range of
representative coating and fouling conditions at a speed of
7.7 m s71 (15 knots).
Description of
condition
DSP @
Us¼7.7 m s71 (kW)
% DSP @
Us¼7.7 m s71
Hydraulically
smooth surface
– –
Typical as applied
AF coating
50 2%
Deteriorated coating
or light slime
250 11%
Heavy slime 458 21%
Small calcareous
fouling or weed
781 35%
Medium calcareous
fouling
1200 54%
Heavy calcareous
fouling
1908 86%
Ship resistance and powering 339
Dow
nloa
ded
By:
[Us
Nav
al A
cade
my]
At:
12:0
3 13
Sep
tem
ber 2
007
‘heavy slime’ and the ‘deteriorated coating’ condi-
tions in the present work. At cruising speed
(7.7 m s71 or 15 knots), the predicted SP in the
‘heavy slime’ condition is 2666 kW. Given the
aforementioned prediction for the ‘deteriorated coat-
ing’, the increase in required power resulting from
the fouling is 8%. This is in very good agreement
with the full-scale trials.
Full-scale trials documenting the effect of heavy
calcareous fouling are presented in Marine Fouling
and Its Prevention (Anon, 1952). Unfortunately, the
hull forms reported on (two 1920 – 1930s era
destroyers and a World War II era battleship) differ
significantly from the present frigate. This makes
direct comparisons impractical. However, at cruising
speed an increase of 60 – 110% in required shaft
power was measured for these hull forms. A
reduction in maximum speed at a fixed input power
of 9% was observed for destroyer with a maximum
speed similar to the FFG-7. These results, therefore,
are similar to the present predictions.
Conclusions
A method of predicting the impact of coating rough-
ness and fouling on the frictional resistance and
powering of a full-scale ship has been presented. The
prediction relies on results from laboratory-scale ship
model tests along with boundary layer similarity law
scaling to assess the impact of the surface condition on
the frictional resistance. The method was illustrated
for an Oliver Hazard Perry class frigate (FFG-7). The
results show that a typical, as applied AF coating
suffers fairly small penalties in required shaft power at
both cruising speed and near top speed. A deterio-
rated coating or light slime film is predicted to cause a
significant increase in required shaft power for this
hull form. Heavy calcareous fouling is predicted to
increase required shaft power by 86% as compared to
a hydraulically smooth hull at cruising speed. Com-
parisons of the present results with full-scale trials of
similar hull forms reported in the literature show good
agreement. Future plans are to utilise this methodol-
ogy to assess the economic impact of hull roughness
and fouling to the entire US Navy fleet. Another area
for future work is to better address the role that spatial
heterogeneity in coating roughness and fouling and
differences in fouling community composition have
on the resulting drag and powering penalties. In the
present work, the roughness and fouling was assumed
to have a homogeneous distribution over the entire
hull. This is typically not the case, and significant
variation is often observed. At present, it is not
altogether clear the influence this will have. Hydro-
dynamic measurements on surfaces with significant
heterogeneity in roughness and fouling may serve to
further elucidate this.
Acknowledgements
The author gratefully acknowledges the financial
support of this research by the Office of Naval
Research. Thanks are also due to Mr Bill Beaver and
Mr Zseleczky and to the referees for their many
helpful comments and suggestions.
Note
1. An alternative approach to ship resistance and powering
prediction from scale model tests is to assume that the total
resistance is comprised of wavemaking and viscous compo-
nents (International Towing Tank Conference [ITTC],
1978). This is generally referred to as the ITTC-78 method.
In this method, the viscous component is assumed to be due
to both frictional resistance and pressure or form resistance.
The ITTC-78 procedure explicitly accounts for the form
resistance as a form factor multiplied by the frictional
resistance. In the present procedure employed by the US
Navy (e.g. Gillmer & Johnson, 1982; Woo et al. 1983), the
form resistance is implicitly accounted for in the residuary
resistance, and no form factor is used. It should be noted that
the resistance and powering predictions from the two methods
are generally comparable.
References
Abbott A, Abel PD, Arnold DW, Milne A. 2000. Cost-benefit
analysis of the use of TBT: the case for a treatment approach.
Sci Total Environ 258:5 – 19.
Anon. 1952. Marine fouling and its prevention. Annapolis, MD:
US Naval Institute.
Carman ML, Estes TG, Feinberg AW, Schumacher JF, Wilkerson
W, Wilson LH, Callow ME, Callow JA, Brennan AB. 2006.
Engineered antifouling microtopographies – correlating wett-
ability with cell attachment. Biofouling 22:11 – 21.
Champ MA. 2003. Economic and environmental impacts on port
and harbors from the convention to ban harmful marine anti-
fouling systems. Mar Pollut Bull 46:935 – 940.
Connelly JS, Schultz MP, Flack KA. 2006. Velocity-defect scaling
for turbulent boundary layers with a range of relative roughness.
Exp Fluids 40:188 – 195.
Genzer J, Efimenko K. 2006. Recent developments in super-
hydrophobic surfaces and their relevance to marine fouling: a
review. Biofouling 22:339 – 360.
Gillmer TC, Johnson B. 1982. Introduction to naval architecture.
Annapolis, MD: US Naval Institute.
Granville PS. 1958. The frictional resistance and turbulent
boundary layer of rough surfaces. J Ship Res 2:52 – 74.
Granville PS. 1987. Three indirect methods for the drag
characterization of arbitrarily rough surfaces on flat plates.
J Ship Res 31:70 – 77.
Grigson CWB. 1992. Drag losses of new ships caused by hull
finish. J Ship Res 36:182 – 196.
Haslbeck EG, Bohlander G. 1992. Microbial biofilm effects on
drag – lab and field. Proc SNAME Ship Production Symp.
Paper No. 3A-1. 7 p.
Howell D, Behrends B. 2006. A review of surface roughness in
antifouling coatings illustrating the importance of cutoff length.
Biofouling 22:401 – 410.
Hundley LL, Tate CW. 1980. Hull-fouling studies and ship
powering trial results on seven FF 1052 class ships. DW Taylor
Naval Ship Research & Development Center Report #
DTNSRDC-80/027. 111 p.
340 M. P. Schultz
Dow
nloa
ded
By:
[Us
Nav
al A
cade
my]
At:
12:0
3 13
Sep
tem
ber 2
007
International Towing Tank Conference (ITTC) 1978. Proc 15th
International Towing Tank Conference: report of performance
committee. The Hague.
Jelic-Mrcelic G, Sliskovic M, Antolic B. 2006. Biofouling
communities on test panels coated with TBT and TBT-free
copper-based antifouling paints. Biofouling 22:293 – 302.
Kempf G. 1937. On the effect of roughness on the resistance of
ships. Trans INA 79:109 – 119.
Kouwen N, Unny TE. 1973. Flexible roughness in open channels.
ASCE J Hydraulics Division 99:713 – 728.
Lackenby H. 1962. Resistance of ships, with special reference to
skin friction and hull surface condition. Proc Inst Mechl Eng
176:981 – 1014.
Leer-Andersen M, Larsson L. 2003. An experimental/numerical
approach for evaluating skin friction on full-scale ships with
surface roughness. J Mar Sci Technol 8:26 – 36.
Lewthwaite JC, Molland AF, Thomas KW. 1985. An investigation
into the variation of ship skin frictional resistance with fouling.
Trans R Inst Naval Architects 127:269 – 284.
Millikan CM. 1938. A critical discussion of turbulent flows in
channels and circular tubes. Proc 5th Int Congr Appl
Mechanics, Cambridge, MA. pp 386 – 392.
Medhurst JS. 1989. The systematic measurement and correlation
of the frictional resistance and topography of ship hull coatings,
with particular reference to ablative antifoulings. PhD Thesis,
University of Newcastle-upon-Tyne, UK.
Medhurst JS. 1990. Outline of a draft international standard for
the measurement and characterisation of roughness topography
in fluid flow. London: Royal Institute of Naval Architects.
March 1990. 9 p.
Musker AJ. 1980 – 1981. Universal roughness functions for
naturally-occurring surfaces. Trans Can Soc Mech Eng 1:1 – 6.
Naval Ships’ Technical Manual. 2002. Waterbourne underwater
hull cleaning of Navy ships. Publication # S9086-CQ-STM-
010/CH-081R4. Naval Sea Systems Command. 31 p.
Picologlou BF, Zelver N, Characklis WG. 1980. Biofilm growth
and hydraulic performance. ASCE J Hydraulics Div 106:733 –
746.
Schlichting H. 1979. Boundary-layer theory. 7th ed. New York:
McGraw-Hill.
Schoenherr KE. 1932. Resistances of flat surfaces moving through
a fluid. Trans SNAME 40:279 – 313.
Schubauer GB, Tchen CM. 1961. Turbulent flow. New Jersey,
USA: Princeton University Press.
Schultz MP. 2000. Turbulent boundary layers on surfaces covered
with filamentous algae. ASME J Fluids Eng 122:357 – 363.
Schultz MP. 2002. The relationship between frictional resistance
and roughness for surfaces smoothed by sanding. ASME J
Fluids Eng 124:492 – 499.
Schultz MP. 2004. Frictional resistance of antifouling coating
systems. ASME J Fluids Eng 126:1039 – 1047.
Schultz MP, Swain GW. 1999. The effect of biofilms on turbulent
boundary layers. ASME J Fluids Eng 121:733 – 746.
Schultz MP, Swain GW. 2000. The influence of biofilms on skin
friction drag. Biofouling 15:129 – 139.
Schultz MP, Flack KA. 2007. The rough-wall turbulent boundary
layer from the hydraulically smooth to the fully rough regime.
J Fluid Mech 580:381 – 405.
Shockling MA, Allen JJ, Smits AJ. 2006. Roughness effects in
turbulent pipe flow. J Fluid Mech 564:267 – 285.
Statz A, Finlay J, Dalsin J, Callow M, Callow JA, Messersmith PB.
2006. Algal antifouling and fouling-release properties of metal
surfaces coated with a polymer inspired by marine mussels.
Biofouling 22:391 – 399.
Swain GW, Schultz MP. 1996. The testing and evaluation of non-
toxic antifouling coatings. Biofouling 10:187 – 197.
Townsin RL. 2003. The ship hull fouling penalty. Biofouling
19(Suppl.):9 – 16.
Townsin RL, Byrne D, Svensen TE, Milne A. 1981. Estimating
the technical and economic penalties of hull and propeller
roughness. Trans SNAME 89:295 – 318.
von Karman T. 1930. Mechanishe aehnlichkeit and turbulenz.
Nachr Ges Wiss Gottingen 58 – 76.
Watanabe S, Nagamatsu N, Yokoo K, Kawakami Y. 1969. The
augmentation in frictional resistance due to slime. J Kansai Soc
Naval Architects 131:45 – 51.
Woo EL, Karafiath G, Borda G. 1983. Ship-model correlation of
powering performance on USS Oliver Hazard Perry, FFG-7
class. Mar Technol 20:35 – 52.
Appendix
CA¼ correlation allowanceCF¼ frictional resistance coefficient¼ RF
12rU2S
CR¼ residuary resistance coefficient¼ RR12rU2S
CT¼ total resistance coefficient¼ RT12rU2S
DCF¼ change in the frictional resistance coefficient
due to hull roughness/foulingFr¼Froude number¼ Uffiffiffiffi
gLp
g¼ gravitational accelerationk¼ roughness heightks¼ equivalent sand roughness heightk¼ roughness heightL¼waterline lengthLplate¼ length of flat plate used in laboratory
experimentRF¼ frictional resistanceRR¼ residuary resistanceRT¼ total resistanceDRT¼ change in total resistanceRe¼Reynolds number¼ UL
nRt50¼maximum peak to trough height over a
50 mm sampling lengthPC¼ propulsive coefficientS¼wetted surface area of the hullSP¼ shaft power¼ RT U
PCDSP¼SPrough 7 SPsmooth
U¼ velocityUe¼ velocity at outer edge of the boundary layer
Ut¼ friction velocity¼ffiffiffiffitw
r
qDUþ¼ roughness functiony¼distance from the walld¼ boundary layer thicknessl¼ scale ratio¼ Ls
Lm
n¼fluid kinematic viscosityr¼fluid densitytw¼wall shear stress
Superscript
þ¼normalised by Ut or n/Ut
Subscripts
m¼modelrough¼ for actual surface conditions¼ shipsmooth¼ for hydraulically smooth surface condition
Ship resistance and powering 341