The Jeypore Sugar Company Ltd · 2011-07-15 · The Jeypore Sugar Company Ltd Concerns on leverage...
22
The Jeypore Sugar Company Ltd Enhancing investment decisions Initiating coverage
Transcript of The Jeypore Sugar Company Ltd · 2011-07-15 · The Jeypore Sugar Company Ltd Concerns on leverage...

The Jeypore Sugar Company Ltd
Enhancing investment decisions
Initiating coverage
Explanation of CRISIL Fundamental and Valuation (CFV) matrix
The CFV Matrix (CRISIL Fundamental and Valuation Matrix) addresses the two important analysis of an investment making process –
Analysis of Fundamentals (addressed through Fundamental Grade) and Analysis of Returns (Valuation Grade) The fundamental
grade is assigned on a five-point scale from grade 5 (indicating Excellent fundamentals) to grade 1 (Poor fundamentals) The
valuation grade is assigned on a five-point scale from grade 5 (indicating strong upside from the current market price (CMP)) to
grade 1 (strong downside from the CMP).
CRISIL Fundamental Grade
Assessment CRISIL Valuation Grade
Assessment
5/5 Excellent fundamentals 5/5 Strong upside (>25% from CMP)
4/5 Superior fundamentals 4/5 Upside (10-25% from CMP)
3/5 Good fundamentals 3/5 Align (+-10% from CMP)
2/5 Moderate fundamentals 2/5 Downside (negative 10-25% from CMP)
1/5 Poor fundamentals 1/5 Strong downside (<-25% from CMP)
Analyst Disclosure Each member of the team involved in the preparation of the grading report, hereby affirms that there exists no conflict of interest
that can bias the grading recommendation of the company. Additional Disclosure This report has been sponsored by NSE - Investor Protection Fund Trust (NSEIPFT). Disclaimer: This Exchange-commissioned Report (Report) is based on data publicly available or from sources considered reliable. CRISIL Ltd.
(CRISIL) does not represent that it is accurate or complete and hence, it should not be relied upon as such. The data / Report are
subject to change without any prior notice. Opinions expressed herein are our current opinions as on the date of this Report. Nothing
in this Report constitutes investment, legal, accounting or tax advice or any solicitation, whatsoever. The subscriber / user assumes
the entire risk of any use made of this data / Report. CRISIL especially states that it has no financial liability, whatsoever, to the
subscribers / users of this Report. This Report is for the personal information only of the authorized recipient in India only. This
Report should not be reproduced or redistributed or communicated directly or indirectly in any form to any other person – especially
outside India or published or copied in whole or in part, for any purpose.

CRISIL EQUITIES | 1
December 02, 2010 Fair Value Rs 152 CMP Rs 167
Fundamental Grade 4/5 (Strong fundamentals)
Valuation Grade 5/5 (CMP has strong upside)
Industry Information technology
Polaris Software Limited
Business momentum remains intact
Fundamental Grade 2/5 (Moderate fundamentals)
Valuation Grade 3/5 (CMP is aligned)
Industry Food Products
The Jeypore Sugar Company Ltd Concerns on leverage Jeypore Sugar Company Ltd (Jeypore) is an Andhra Pradesh based sugar manufacturer. CRISIL Equities believes that while capacity expansion will lead to higher revenues, the high cost inventory and leverage will affect profitability. We assign Jeypore a fundamental grade of ‘2/5’, indicating that its fundamentals are ‘moderate’ relative to other listed securities in India.
Sugar prices expected to remain at Rs 28,000-30,000 per tonne
CRISIL Research expects the production in sugar season(SS)October 2010-September 2011 (SS 2010-11) to increase 34% y-o-y to 25-26 million tonnes. Sugar prices corrected by almost 37% from January 2010 to August 2010 due to production in SS2009-10 being higher than anticipated and expectation of a bumper crop in SS2010-11. However, sugar prices have recovered sharply on the expectation exports being allowed under the Open General License (OGL) and firm global prices. CRISIL Research expects domestic sugar prices to remain at Rs 28,000-30,000 during SS 2010-11.
New capacity operational in SS2010-11 after a nearly three-year delay
Jeypore has an 8500 tonnes crushed per day (TCD) sugar-manufacturing unit integrated with a 25 MW co-generation unit and a 60 (kilolitre per day) KLPD distillery. After a delay of nearly three years, the company has set up another unit of 5000 TCD and 16.8 MW co-generation plant which will be operational in SS2010-11. The delay has resulted in significant escalation in project costs.
High leverage remains a key concern
Jeypore’s capacity expansion has been entirely funded through debt which has resulted in a high net debt-to-equity of 3.6x. While capacity expansion will boost revenues, profitability would be affected due to high interest costs and depreciation. Further, the high leverage remains a concern due to the inherent cyclical nature of the industry.
Expect two-year revenue CAGR of 25% but loss in FY11
Revenues are expected to grow at 25% CAGR over FY10-12 based on the recovery in crushing days and capacity expansion. But EBIDTA margin will decline 840 bps to 17.0% in FY11 due to sale of high cost inventory and start costs for new facility. We expect the company to post a loss of Rs 50 mn in FY11 and profit of Rs 78 mn in FY12.
Valuations – current price is aligned
CRISIL Equities has valued Jeypore at P/BV of 0.9x FY12E book value per share to arrive at a fair value of Rs 152 per share. We initiate coverage on Jeypore with a valuation grade of ‘3/5’.
KEY FORECAST
(Rs mn) FY08 FY09 FY10 FY11E FY12E
Operating income 1,944 1,792 2,420 2,975 3,809
EBITDA 204 364 614 506 752
Adj Net income -75 -7 192 -50 78
Adj EPS-Rs NM NM 42.3 NM 17.3
EPS growth (%) NM NM NM NM NM
PE (x) NM NM 4.5 NM 9.7
P/BV (x) 1.4 0.7 1.2 1.1 1.0
RoCE (%) 4.3 8.9 15.3 8.4 14.0
RoE (%) NM NM 29.1 NM 10.6
EV/EBITDA (x) 12.6 7.6 5.8 6.9 4.5
Source: Company, CRISIL Equ it ies est imate
NM: Not meaningful; CMP: Current Market Price
CFV MATRIX
KEY STOCK STATISTICS NIFTY 5830
NSE ticker JEYPORE
Face value (Rs per share) 10
Shares outstanding (mn) 4.5
Market cap (Rs mn)/(US$ mn) 752/16
Enterprise value (Rs mn)/(US$ mn) 3,464/76
52-week range (Rs) (H/L) 240/136
Beta 0.89
Free float (%) 55.2%
Avg daily volumes (30-days) 1,145.94
Avg daily value (30-days) (Rs mn) 0.2
SHAREHOLDING PATTERN
PERFORMANCE VIS-À-VIS MARKET
Returns
1-m 3-m 6-m 12-m
JEYPORE -10% -12% 4% -23%
NIFTY -2% 10% 21% 17%
ANALYTICAL CONTACT Chetan Majithia (Head) [email protected]
Onkar Kulkarni [email protected]
Suresh Guruprasad [email protected]
Client servicing desk
+91 22 3342 3561 [email protected]
1 2 3 4 5
1
2
3
4
5
Valuation Grade
Fu
nd
am
en
tal G
rad
e
Poor Fundamentals
ExcellentFundamentals
Str
on
gD
ow
nsi
de
Str
on
gU
psi
de
44.8% 44.8% 44.8% 44.8%
0.8% 0.8% 0.8% 0.8%
54.5% 54.5% 54.5% 54.5%
0%
10%
20%
30%
40%
50%
60%
70%
80%
90%
100%
Dec-09 Mar-10 Jun-10 Sep-10
Promoter FII DII Others
CRISIL EQUITIES | 2
The Jeypore Sugar Ltd
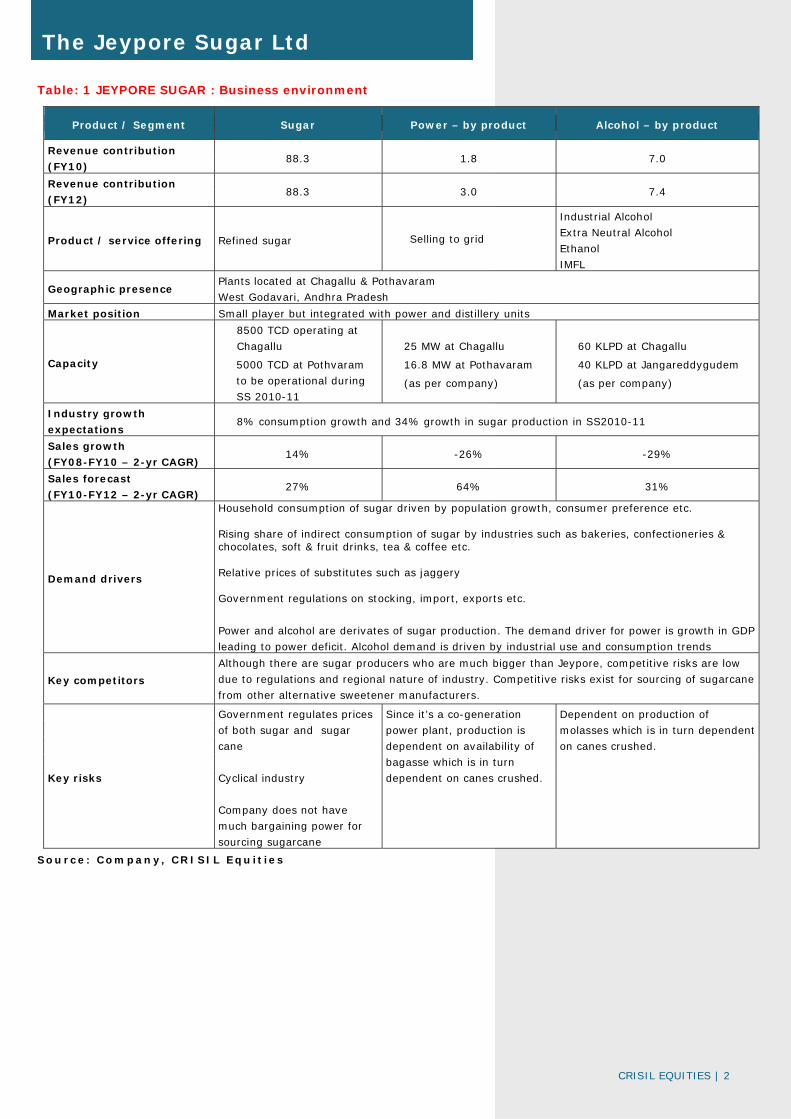
Table: 1 JEYPORE SUGAR : Business environment
Product / Segment Sugar Power – by product Alcohol – by product
Revenue contribution
(FY10) 88.3 1.8 7.0
Revenue contribution
(FY12) 88.3 3.0 7.4
Product / service offering Refined sugar Selling to grid
Industrial Alcohol
Extra Neutral Alcohol
Ethanol
IMFL
Geographic presence Plants located at Chagallu & Pothavaram
West Godavari, Andhra Pradesh
Market position Small player but integrated with power and distillery units
Capacity
8500 TCD operating at
Chagallu
5000 TCD at Pothvaram
to be operational during
SS 2010-11
25 MW at Chagallu
16.8 MW at Pothavaram
(as per company)
60 KLPD at Chagallu
40 KLPD at Jangareddygudem
(as per company)
Industry growth
expectations 8% consumption growth and 34% growth in sugar production in SS2010-11
Sales growth
(FY08-FY10 – 2-yr CAGR) 14% -26% -29%
Sales forecast
(FY10-FY12 – 2-yr CAGR) 27% 64% 31%
Demand drivers
Household consumption of sugar driven by population growth, consumer preference etc. Rising share of indirect consumption of sugar by industries such as bakeries, confectioneries & chocolates, soft & fruit drinks, tea & coffee etc. Relative prices of substitutes such as jaggery Government regulations on stocking, import, exports etc.
Power and alcohol are derivates of sugar production. The demand driver for power is growth in GDP
leading to power deficit. Alcohol demand is driven by industrial use and consumption trends
Key competitors
Although there are sugar producers who are much bigger than Jeypore, competitive risks are low
due to regulations and regional nature of industry. Competitive risks exist for sourcing of sugarcane
from other alternative sweetener manufacturers.
Key risks
Government regulates prices
of both sugar and sugar
cane
Cyclical industry
Company does not have
much bargaining power for
sourcing sugarcane
Since it’s a co-generation
power plant, production is
dependent on availability of
bagasse which is in turn
dependent on canes crushed.
Dependent on production of
molasses which is in turn dependent
on canes crushed.
Source: Company, CRISIL Equ it ies

CRISIL EQUITIES | 3
The Jeypore Sugar Ltd
Grading Rationale Small but integrated sugar manufacturer in Andhra Pradesh
Jeypore has a sugar manufacturing capacity of 8500 TCD located in Chagallu,
Andhra Pradesh. It has an integrated co-generation power plant of 25 MW and
one distillery at Chagallu (60KLPD) and another distillery at Jangareddygudem
(40KLPD). An integrated sugar manufacturing unit with distillery and co-
generation helps the company ensure better realisation from by-products, thereby
supporting profitability.
The expected increase in cane crushed in SS2010-11 will further help the
company’s power generation and distillery units to operate at better utilisation
levels.
Low crushing in the past two years to recover in SS 2010-11
Sugarcane production during SS09-10 was affected due to the decline in acreage
and low rainfall which resulted in an industry-wide shortage of sugarcane.
Jeypore’s average days of crushing fell to 76 and 70 days in FY09 and FY10,
respectively. The cane crushed fell by 42.4% in FY09 and 7.9% in FY10 whereas
production fell by 49% in FY09 and 13% in FY10.
CRISIL Research expects bumper sugarcane crop in SS2010-11. In line with the
increase sugarcane production, we expect the company to report higher crushing
in SS2010-11. We expect the quantity of sugarcane crushed by the company to
increase by 68% y-o-y to 10 lakh tonnes in FY11 due to the increase in cane
availability and commissioning of the new plant at Pothavaram.
Figure 1: Sugarcane quantity crushed and crushing days
Source: CRISIL Equities
0
20
40
60
80
100
120
140
160
0
2
4
6
8
10
12
14
16
FY05 FY06 FY07 FY08 FY09 FY10 FY11E FY12E
daysLakh tonne
Qty crushed (LHS) Crushing days (RHS)
Jeypore’s Chagallu
facility is fully integrated
with 8500 TCD crushing
capacity, a 25-MW co-
generation unit and a 60
KLPD distillery
We expect sugar cane
crushing of 10 lakh
tonnes for SS2010-11
against 5.9 lakh tonnes
done in SS2009-10

CRISIL EQUITIES | 4
The Jeypore Sugar Ltd
5000 TCD expansion plan already delayed by three years
The company has set up a 5000-TCD greenfield sugar manufacturing plant along
with a 16.8 MW co-generation plant at Pothavaram, Andhra Pradesh. The
company expects the plant to be operational in SS2010-11.
However, the project has already faced a delay of around three years which has
escalated the initially planned capital cost of Rs. 2,000 mn to around Rs 2,500
mn. The plant was supposed to start operations in SS2007-08. However, in FY08,
the company decided to undertake some design modifications to enhance the
plant’s flexibility, quality and utilization levels. Procurement of certain equipments
also contributed to the delay. A shortage in sugarcane availability in FY09 and
FY10 further delayed the start of operations.
High leverage a key concern
Capacity expansion when cane production is expected to be high and sugar prices
are expected to remain firm, augurs well for the company. However, the increase
in leverage (net debt-equity of 3.6x as on Mar 2010) of the company to fund the
capacity expansion is a serious of concern if the industry sees a downturn in the
next sugar cycle (SS2011-12).
Low bargaining power to keep cane cost high The company’s cost of procuring sugarcane has always remained high as it has
low bargaining power with the farmers near its factory at Chagallu due to
presence of other sugar factories and alternate sweetener manufacturers. In
FY10, the shortage of sugarcane and the company’s low bargaining power
increased sugarcane procurement costs by 30%.
Figure 2: Sugarcane procurement cost and sugar realisations
Source: Company, CRISIL Equities
0
5000
10000
15000
20000
25000
30000
35000
0
500
1000
1500
2000
2500
FY06 FY07 FY08 FY09 FY10 FY11E FY12E
Rs/tonRs/ton
Cane purchase cost (LHS) Sugar Realisation (RHS)
New facility of 5000 TCD
at Pothavaram to start
operations in SS 2010-11
after a delay of around
three years
The company has low
bargaining power with
farmers due to presence
of other sugar factories
nearby
Company has taken a
term loan of Rs 1621 mn
for funding the new
facility at Pothavaram

CRISIL EQUITIES | 5
The Jeypore Sugar Ltd
Figure 3: Sugar factories located close to Jeypore’s factory
Source: Company websites, CRISIL Equities
Co-generation and distillery revenues to increase The company has a 25MW co-generation plant and a 60 KLPD distillery situated in
the Chagallu unit. The low crushing of cane in FY09 and FY10 had reduced the
availability of raw materials for these units. However, the expected recovery in
cane crushing in FY11 is expected to boost production of power and alcohol.
Further, sales prices of power and alcohol are expected to remain firm. The new
unit at Pothavaram with an additional 16.8 MW co-generation plant will add to
the power revenues from FY11 onwards.
Figure 4: Power revenues and their contribution Figure 5: Alcohol revenues and their contribution
Source: Company, CRISIL Equities Source: Company, CRISIL Equities
1 23
45
6
1 Jeypore sugar -8500 TCD
2 Deccan sugars
3 Sri Saravaraya sugars
4 Andhra Sugars – Tanuku – 5000 TCD
5 Andhra Sugars – Bhimadole – 5500 TCD
6 Andhra sugars – Taduval – 5500 TCD
0.0%
0.5%
1.0%
1.5%
2.0%
2.5%
3.0%
3.5%
4.0%
4.5%
0
20
40
60
80
100
120
140
FY06 FY07 FY08 FY09 FY10 FY11E FY12E
Rs mn
Power (LHS) % of sales (RHS)
0.0%
2.0%
4.0%
6.0%
8.0%
10.0%
12.0%
14.0%
16.0%
18.0%
0
50
100
150
200
250
300
350
400
FY06 FY07 FY08 FY09 FY10 FY11E FY12E
Rs mn
Alcohol (LHS) % of sales (RHS)
Higher crushing this
season will lead to better
availability of bagasse
and molasses for power
and distillery units

CRISIL EQUITIES | 6
The Jeypore Sugar Ltd
Table: 2 Comparative Position of Jeypore Sugar
Name of Company
Year Market
Cap
Rs mn
D/E P/BV EV/
EBIDTA
Capacities Revenue contribution
End Sugar
TCD
Power
MW
Distillery
KLPD
Sugar Power Alcohol Others
Bajaj Hindusthan Ltd Sep09 19117 1.9 0.9 7.3 96000 274 640 91% 1% 5% 3%
Balrampur Chini Mills Ltd Sep10 19498 0.9 1.7 3.7 73500 180 320 84% 7% 8% 1%
Triveni Engineering & Inds. Ltd Mar10 25143 0.9 2.6 3.7 61000 68 160 65% 2% 3% 30%
Bajaj Hind Sugar & Inds. Ltd Sep09 2295 3.1 0.7 6.7 40000 88 85% 2% 11% 2%
Dhampur Sugar Mills Ltd Mar10 3334 1.5 0.7 5.7 39500 145 0 86% 6% 0% 9%
Shree Renuka Sugars Ltd Sep09 51050 0.9 3.4 5.0 39000 143 630 83% 6% 8% 2%
Median 1.7 0.8 6.2
Mawana Sugars Ltd Sep09 926 3.2 0.4 12.9 29500 0 100 67% 1% 0% 32%
Oudh Sugar Mills Ltd Jun09 786 4.5 0.5 5.6 28700 25 132 84% 1% 9% 6%
Uttam Sugar Mills Ltd Mar10 1225 5.5 0.8 16.6 23750 0 0 89% 2% 0% 9%
Dwarikesh Sugar Inds. Ltd Sep09 1496 2.8 0.9 4.6 21500 0 30 89% 5% 1% 5%
Simbhaoli Sugars Ltd Mar10 1029 5.0 0.8 3.9 20100 79 173 59% 2% 39% 1%
Median 4.5 0.8 5.6
E I D-Parry (India) Ltd Mar10 41988 1.6 2.3 2.1 19000 85 135 79% 21% 0% 0%
Bannari Amman Sugars Ltd Mar10 9416 0.3 1.4 3.6 19000 65 349 67% 10% 9% 13%
Rana Sugars Ltd Mar10 1196 2.0 0.4 5.9 15000 88 60 64% 12% 13% 11%
Ugar Sugar Works Ltd Mar10 1913 4.2 2.3 13.9 12500 44 93 61% 5% 27% 7%
K C P Sugar & Inds. Corpn. Ltd Mar10 2103 0.3 1.2 4.0 11500 20 50 87% 1% 4% 8%
Median 2.0 1.2 5.9
Dharani Sugars & Chem Ltd Mar10 1312 4.5 1.2 3.8 10000 22 60 88% 5% 7% 0%
Jeypore Sugar Co. Ltd Mar10 767 3.8 1.0 5.6 8500 25 100 88% 2% 7% 3%
Thiru Arooran Sugars Ltd Mar10 2036 2.1 1.4 2.0 8500 0 60 86% 0% 13% 0%
Piccadily Agro Inds. Ltd Mar10 771 1.1 1.5 3.4 5000 0 0 45% 0% 0% 55%
Empee Sugars & Chem Ltd Mar10 2607 2.9 1.7 76.4 2500 0 30 65% 0% 35% 0%
Ponni Sugars (Erode) Ltd Mar10 958 0.4 1.2 1.7 2500 0 0 86% 0% 0% 14%
Median 19117 2.5 1.3 3.6
Source: Prowess, CRISIL Equ it ies
Domestic sugar prices to be around Rs 28,000-30,000 per tonne for SS2010-11
- Upward revision in production estimates for SS 2009-10 and expectations of
bumper crop in SS2010-11 resulted in sugar prices falling from Rs 40,800 per
tonne in Jan 2010 to Rs 25,330 per tonne in August 2010.
- Expectation of exports being allowed under OGL and firm global prices led to
domestic prices recovering from Rs 25,330 per tonne in August to Rs 28,960
per tonne currently.
- CRISIL Research expects firm global prices and the export of surplus
production to keep sugar prices at Rs 28,000-30,000 per tonne for SS2010-
11.
Production to rise due to increase in acreage: Domestic sugar production is
estimated to grow by 31% y-o-y during SS2009-10 to 19 million tonnes as
against the industry’s expectation of 16-17 million tonnes for the season.
Improvement in yield due to superior variety of cane and increased diversion of
cane towards sugar production has led to the revision in estimates.
In SS 2010-11 the area under sugarcane cultivation in Uttar Pradesh and
Maharashtra is expected to rise by 25% and 20%, respectively. This is expected
to increase production by 34% to 25-26 million tonnes in SS 2010-11.
Production surplus is
expected to lead to
downward pressure on
sugar prices whereas
allowance of export will
support prices
CRISIL EQUITIES | 7
The Jeypore Sugar Ltd
Consumption to witness 8% growth in SS 2010-11: Consumption in
SS2009-10 declined 2.2% y-o-y due to higher sugar prices coupled with
government restrictions on stocking limits. Consumption in SS 2010-11 is
expected to increase by 8% y-o-y to around 24.3 million tonnes. The rise in
consumption would be driven by the removal of restriction on bulk consumer’s
stock limits and the drop in domestic prices.
The growth in industrial consumption by sectors such as confectioneries,
chocolates, soft drinks and sweets is expected to drive consumption at 4.4%
CAGR to reach 28.9 million tonnes by 2014-15.
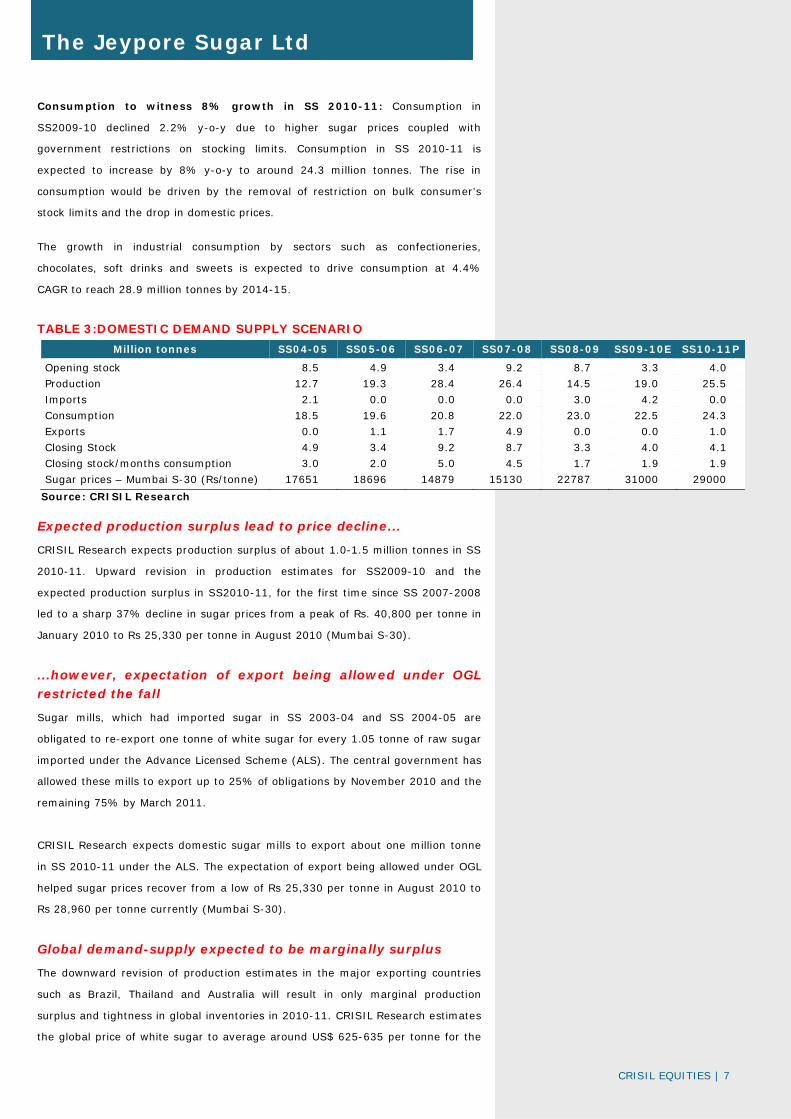
TABLE 3:DOMESTIC DEMAND SUPPLY SCENARIO
Million tonnes SS04-05 SS05-06 SS06-07 SS07-08 SS08-09 SS09-10E SS10-11P
Opening stock 8.5 4.9 3.4 9.2 8.7 3.3 4.0
Production 12.7 19.3 28.4 26.4 14.5 19.0 25.5
Imports 2.1 0.0 0.0 0.0 3.0 4.2 0.0
Consumption 18.5 19.6 20.8 22.0 23.0 22.5 24.3
Exports 0.0 1.1 1.7 4.9 0.0 0.0 1.0
Closing Stock 4.9 3.4 9.2 8.7 3.3 4.0 4.1
Closing stock/months consumption 3.0 2.0 5.0 4.5 1.7 1.9 1.9
Sugar prices – Mumbai S-30 (Rs/tonne) 17651 18696 14879 15130 22787 31000 29000
Source: CRISIL Research
Expected production surplus lead to price decline...
CRISIL Research expects production surplus of about 1.0-1.5 million tonnes in SS
2010-11. Upward revision in production estimates for SS2009-10 and the
expected production surplus in SS2010-11, for the first time since SS 2007-2008
led to a sharp 37% decline in sugar prices from a peak of Rs. 40,800 per tonne in
January 2010 to Rs 25,330 per tonne in August 2010 (Mumbai S-30).
...however, expectation of export being allowed under OGL restricted the fall
Sugar mills, which had imported sugar in SS 2003-04 and SS 2004-05 are
obligated to re-export one tonne of white sugar for every 1.05 tonne of raw sugar
imported under the Advance Licensed Scheme (ALS). The central government has
allowed these mills to export up to 25% of obligations by November 2010 and the
remaining 75% by March 2011.
CRISIL Research expects domestic sugar mills to export about one million tonne
in SS 2010-11 under the ALS. The expectation of export being allowed under OGL
helped sugar prices recover from a low of Rs 25,330 per tonne in August 2010 to
Rs 28,960 per tonne currently (Mumbai S-30).
Global demand-supply expected to be marginally surplus
The downward revision of production estimates in the major exporting countries
such as Brazil, Thailand and Australia will result in only marginal production
surplus and tightness in global inventories in 2010-11. CRISIL Research estimates
the global price of white sugar to average around US$ 625-635 per tonne for the

CRISIL EQUITIES | 8
The Jeypore Sugar Ltd
first half of SS 2010-11. The allowance of exports from India during this period is
expected to firm up domestic sugar prices.
Domestic sugar prices to be around Rs 28,000-30,000 per tonne for SS 2010-11
Based on the demand-supply scenario, CRISIL Research expects domestic sugar
prices to remain at Rs 28,000-30,000 per tonne (Mumbai S-30). The expectation
of allowance of export under OGL has lead to an upward revision of CRISIL
Research’s estimates of sugar prices to 28,000-30,000 per tonne.
Figure 6: Sugar prices (Mumbai-S30)
Source: CRISIL Equities
0
5000
10000
15000
20000
25000
30000
35000
40000
45000
Oct
-05
Jan-
06
Apr
-06
Jul-
06
Oct
-06
Jan-
07
Apr
-07
Jul-
07
Oct
-07
Jan-
08
Apr
-08
Jul-
08
Oct
-08
Jan-
09
Apr
-09
Jul-
09
Oct
-09
Jan-
10
Apr
-10
Jul-
10
Oct
-10
(Rs/tonne)
CRISIL EQUITIES | 9
The Jeypore Sugar Ltd
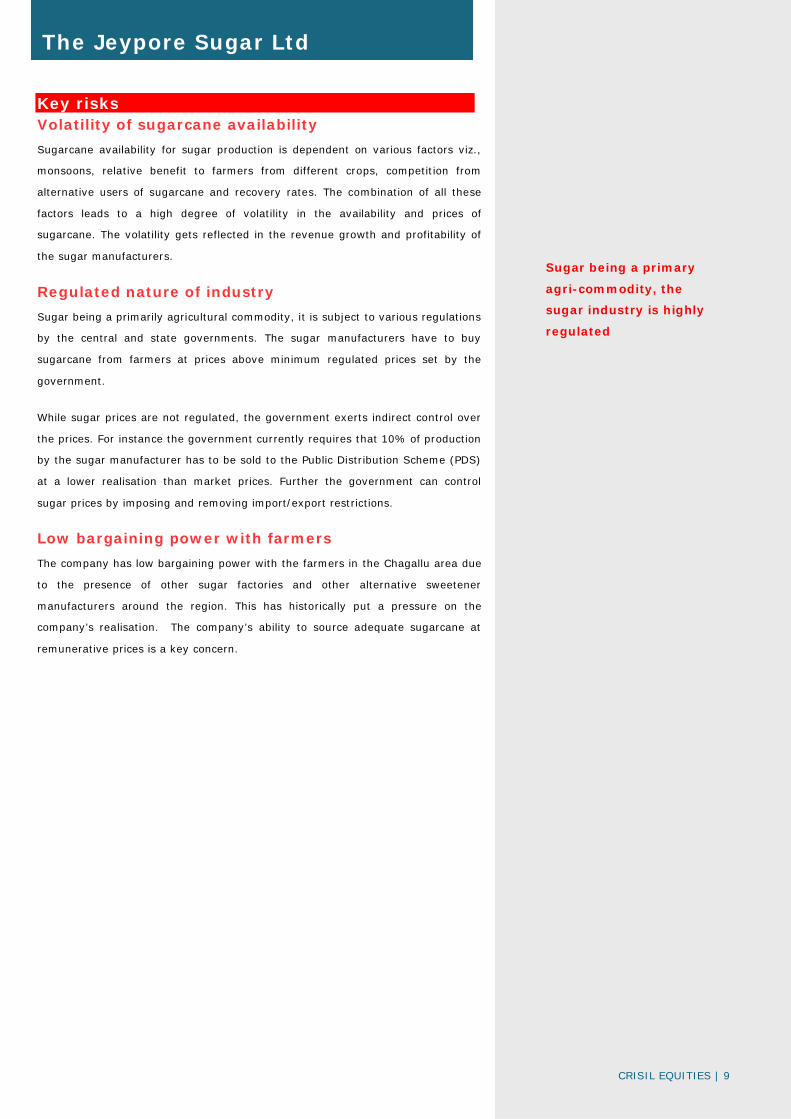
Key risks Volatility of sugarcane availability
Sugarcane availability for sugar production is dependent on various factors viz.,
monsoons, relative benefit to farmers from different crops, competition from
alternative users of sugarcane and recovery rates. The combination of all these
factors leads to a high degree of volatility in the availability and prices of
sugarcane. The volatility gets reflected in the revenue growth and profitability of
the sugar manufacturers.
Regulated nature of industry
Sugar being a primarily agricultural commodity, it is subject to various regulations
by the central and state governments. The sugar manufacturers have to buy
sugarcane from farmers at prices above minimum regulated prices set by the
government.
While sugar prices are not regulated, the government exerts indirect control over
the prices. For instance the government currently requires that 10% of production
by the sugar manufacturer has to be sold to the Public Distribution Scheme (PDS)
at a lower realisation than market prices. Further the government can control
sugar prices by imposing and removing import/export restrictions.
Low bargaining power with farmers
The company has low bargaining power with the farmers in the Chagallu area due
to the presence of other sugar factories and other alternative sweetener
manufacturers around the region. This has historically put a pressure on the
company’s realisation. The company’s ability to source adequate sugarcane at
remunerative prices is a key concern.
Sugar being a primary
agri-commodity, the
sugar industry is highly
regulated
CRISIL EQUITIES | 10
The Jeypore Sugar Ltd
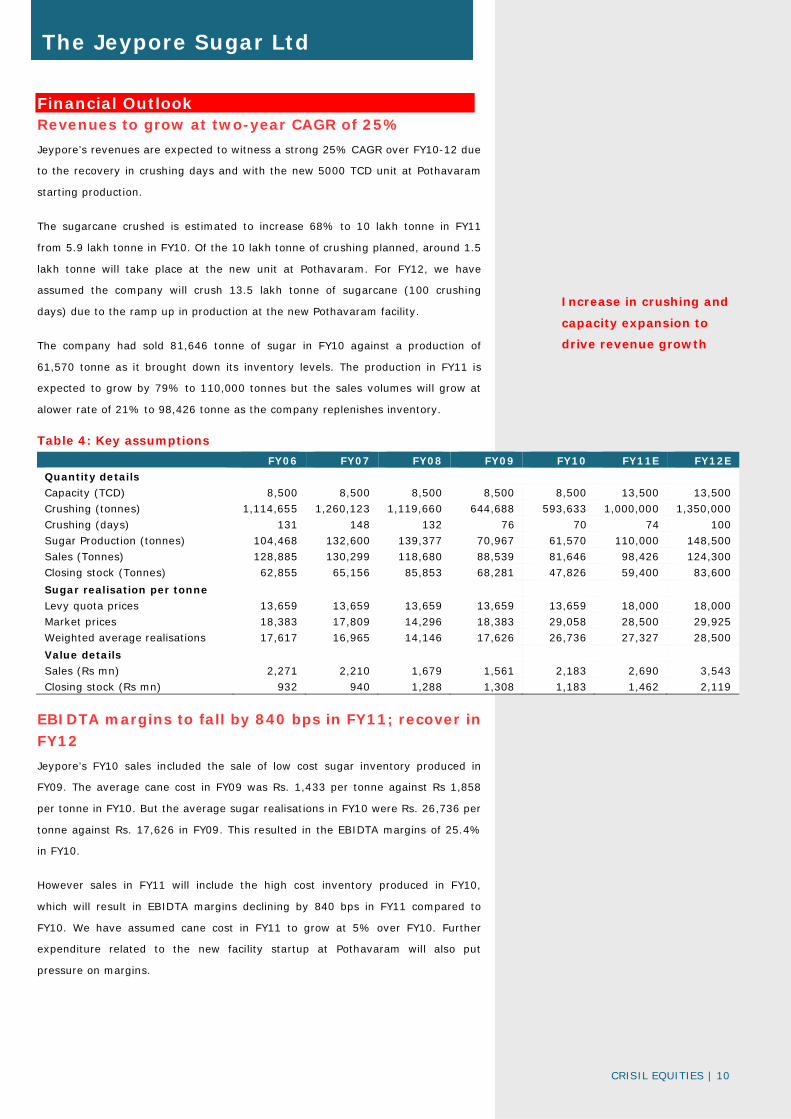
Financial Outlook Revenues to grow at two-year CAGR of 25%
Jeypore’s revenues are expected to witness a strong 25% CAGR over FY10-12 due
to the recovery in crushing days and with the new 5000 TCD unit at Pothavaram
starting production.
The sugarcane crushed is estimated to increase 68% to 10 lakh tonne in FY11
from 5.9 lakh tonne in FY10. Of the 10 lakh tonne of crushing planned, around 1.5
lakh tonne will take place at the new unit at Pothavaram. For FY12, we have
assumed the company will crush 13.5 lakh tonne of sugarcane (100 crushing
days) due to the ramp up in production at the new Pothavaram facility.
The company had sold 81,646 tonne of sugar in FY10 against a production of
61,570 tonne as it brought down its inventory levels. The production in FY11 is
expected to grow by 79% to 110,000 tonnes but the sales volumes will grow at
alower rate of 21% to 98,426 tonne as the company replenishes inventory.
Table 4: Key assumptions
FY06 FY07 FY08 FY09 FY10 FY11E FY12E
Quantity details
Capacity (TCD) 8,500 8,500 8,500 8,500 8,500 13,500 13,500
Crushing (tonnes) 1,114,655 1,260,123 1,119,660 644,688 593,633 1,000,000 1,350,000
Crushing (days) 131 148 132 76 70 74 100
Sugar Production (tonnes) 104,468 132,600 139,377 70,967 61,570 110,000 148,500
Sales (Tonnes) 128,885 130,299 118,680 88,539 81,646 98,426 124,300
Closing stock (Tonnes) 62,855 65,156 85,853 68,281 47,826 59,400 83,600
Sugar realisation per tonne
Levy quota prices 13,659 13,659 13,659 13,659 13,659 18,000 18,000
Market prices 18,383 17,809 14,296 18,383 29,058 28,500 29,925
Weighted average realisations 17,617 16,965 14,146 17,626 26,736 27,327 28,500
Value details
Sales (Rs mn) 2,271 2,210 1,679 1,561 2,183 2,690 3,543
Closing stock (Rs mn) 932 940 1,288 1,308 1,183 1,462 2,119
EBIDTA margins to fall by 840 bps in FY11; recover in FY12
Jeypore’s FY10 sales included the sale of low cost sugar inventory produced in
FY09. The average cane cost in FY09 was Rs. 1,433 per tonne against Rs 1,858
per tonne in FY10. But the average sugar realisations in FY10 were Rs. 26,736 per
tonne against Rs. 17,626 in FY09. This resulted in the EBIDTA margins of 25.4%
in FY10.
However sales in FY11 will include the high cost inventory produced in FY10,
which will result in EBIDTA margins declining by 840 bps in FY11 compared to
FY10. We have assumed cane cost in FY11 to grow at 5% over FY10. Further
expenditure related to the new facility startup at Pothavaram will also put
pressure on margins.
Increase in crushing and
capacity expansion to
drive revenue growth

CRISIL EQUITIES | 11
The Jeypore Sugar Ltd
We have assumed average realisations and cane costs to increase by 5% y-o-y in
FY12. The ramp up in sugarcane crushing as well as the stabilisation of the new
Pothavaram unit will result in EBIDTA margin increasing to 19.8% in FY12.
Interest and depreciation to affect profitability
The company has funded its capacity expansion plans through long-term debt. It
has been capitalising interest costs during the construction period. As the plant is
expected to become operational in FY11, the interest and related depreciation
costs are expected to rise by 55% and 80%, respectively. As a result, we expect
the company to post a loss of Rs. 50 mn in FY11 and a profit of Rs. 78 mn in FY12
Figure 7: Sugar sales volume and realisations Figure 8: Power sales volume and realisations
Source: Company, CRISIL Equities Source: Company, CRISIL Equities
Figure 9: Alcohol sale volumes and realisations Figure 10: Revenue contribution
Source: Company, CRISIL Equities Source: Company, CRISIL Equities
0
5000
10000
15000
20000
25000
30000
35000
0
20000
40000
60000
80000
100000
120000
140000
FY06 FY07 FY08 FY09 FY10 FY11E FY12E
Rs/tonneTonne
Sales Volumes (LHS) Realizations (RHS)
3.06
3.07
3.08
3.09
3.10
3.11
3.12
3.13
3.14
3.15
3.16
3.17
0.0
5.0
10.0
15.0
20.0
25.0
30.0
35.0
40.0
45.0
FY06 FY07 FY08 FY09 FY10 FY11E FY12E
Rs/kwhMU
Sales Volumes (LHS) Realizations (RHS)
0
5
10
15
20
25
30
35
0
2000
4000
6000
8000
10000
12000
14000
16000
FY06 FY07 FY08 FY09 FY10 FY11E FY12E
Rs/LitKL
Sales Volumes (LHS) Realizations (RHS)
90%86%
79%83%
88% 87% 88%
2%
3%
4%
2%
2% 3%3%
7%10%
16% 13%7% 10% 7%
0% 1% 1% 2% 3% 1% 1%
60%
65%
70%
75%
80%
85%
90%
95%
100%
FY06 FY07 FY08 FY09 FY10 FY11E FY12E
Sugar Power Alcohol Others
Interest on loans taken
for expansion and
depreciation to affect
profitability

CRISIL EQUITIES | 12
The Jeypore Sugar Ltd
Figure 11: Revenues and EBIDTA margins Figure 12: EBIDTA and PAT
Source: Company, CRISIL Equities Source: Company, CRISIL Equities
Figure 13: RoCE and ROE Trends Figure 14: Net debt-to-equity and interest coverage
Source: Company, CRISIL Equities Source: Company, CRISIL Equities
0%
5%
10%
15%
20%
25%
30%
0
500
1000
1500
2000
2500
3000
3500
4000
FY06 FY07 FY08 FY09 FY10 FY11E FY12E
Rs mn
Operating Income (LHS) EBIDTA margin (RHS)
-100
0
100
200
300
400
500
600
700
800
FY06 FY07 FY08 FY09 FY10 FY11E FY12E
Rs mn
PAT EBIDTA
-20%
-10%
0%
10%
20%
30%
40%
50%
60%
70%
80%
90%
FY06 FY07 FY08 FY09 FY10 FY11E FY12E
RoCE RoE
0.0
0.5
1.0
1.5
2.0
2.5
3.0
3.5
4.0
4.5
0.0
0.5
1.0
1.5
2.0
2.5
3.0
3.5
4.0
4.5
FY06 FY07 FY08 FY09 FY10 FY11E FY12E
Net D/E (LHS) Interest coverage (RHS)
CRISIL EQUITIES | 13
The Jeypore Sugar Ltd
Management Overview CRISIL's fundamental grading methodology includes a broad assessment of
management quality, apart from other key factors such as industry and business
prospects, and financial performance.
Jeypore Sugar is headed by Smt. Rajeswary Ramakrishnan (chairperson and
managing director), a Bachelor in Arts and a managing director of the company
since 1967. She was appointed as chairman in FY08. She is 82 years of age and
does not take part in day-to-day operations of the company. The company is run
by Smt Anita Prabhu who was appointed as Executive Director in FY04. Smt
Prabhu is a graduate in commerce and has been on the board of the company
since 1997. She is a daughter-in-law of Smt. Ramakrishnan and is 54 years of
age.
Corporate Governance CRISIL’s fundamental grading methodology includes a broad assessment of
corporate governance and management quality, apart from other key factors such
as industry and business prospects, and financial performance. In this context,
CRISIL Equities analyses the shareholding structure, board composition, typical
board processes, disclosure standards and related-party transactions. Any
qualifications by regulators or auditors also serve as useful inputs while assessing
a company’s corporate governance.
Overall, corporate governance in Jeypore meets the minimum regulatory
requirements.
Board composition
The board of directors consists of nine directors of whom five are independent
directors. The board is headed by Smt Rajeswary Ramakrishnan who is the
chairperson and managing director. She is supported by Smt. Anita Prabhu as
executive director. Dr. S. R. K. Prasad and Sri R. Prabhu, sons of Smt.
Ramakrishnan, are non-executive directors.
The company has the audit committee, the remuneration committee and the
shareholder/investor grievance committee in place. The audit committee is
headed by Mr. R. Kannan, Independent Director, and consists of three other
independent directors and one non-executive promoter director. The
remuneration committee consists of three members who are all independent
directors.
Internal systems and processes
During FY10, around 379.2 tonnes of sugar, valued at Rs 70 lakh, were
unofficially removed by the sales staff of the company and sold in the market. The
company needs to strengthen its internal process to avoid such incidences.
CRISIL EQUITIES | 14
The Jeypore Sugar Ltd
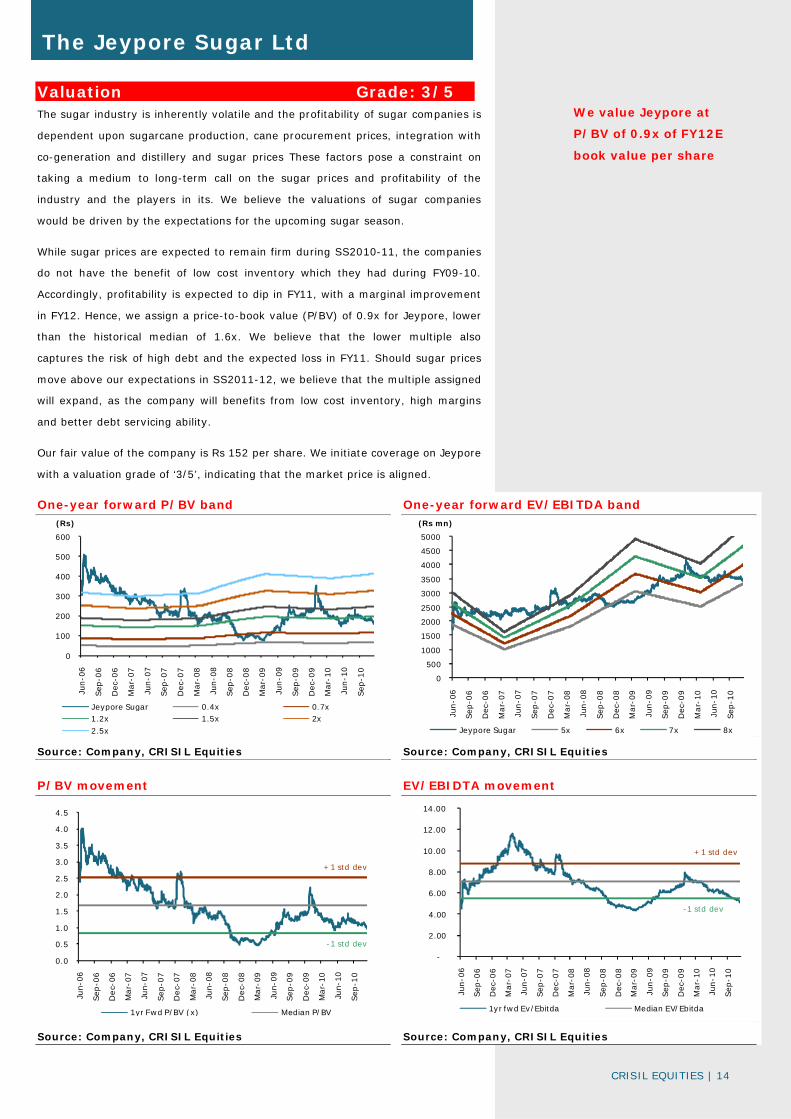
Valuation Grade: 3/5 The sugar industry is inherently volatile and the profitability of sugar companies is
dependent upon sugarcane production, cane procurement prices, integration with
co-generation and distillery and sugar prices These factors pose a constraint on
taking a medium to long-term call on the sugar prices and profitability of the
industry and the players in its. We believe the valuations of sugar companies
would be driven by the expectations for the upcoming sugar season.
While sugar prices are expected to remain firm during SS2010-11, the companies
do not have the benefit of low cost inventory which they had during FY09-10.
Accordingly, profitability is expected to dip in FY11, with a marginal improvement
in FY12. Hence, we assign a price-to-book value (P/BV) of 0.9x for Jeypore, lower
than the historical median of 1.6x. We believe that the lower multiple also
captures the risk of high debt and the expected loss in FY11. Should sugar prices
move above our expectations in SS2011-12, we believe that the multiple assigned
will expand, as the company will benefits from low cost inventory, high margins
and better debt servicing ability.
Our fair value of the company is Rs 152 per share. We initiate coverage on Jeypore
with a valuation grade of ‘3/5’, indicating that the market price is aligned.
One-year forward P/BV band One-year forward EV/EBITDA band
Source: Company, CRISIL Equities Source: Company, CRISIL Equities
P/BV movement EV/EBIDTA movement
Source: Company, CRISIL Equities Source: Company, CRISIL Equities
0
100
200
300
400
500
600
Jun-0
6
Sep
-06
Dec
-06
Mar-
07
Jun-0
7
Sep
-07
Dec
-07
Mar-
08
Jun-0
8
Sep
-08
Dec
-08
Mar-
09
Jun-0
9
Sep
-09
Dec
-09
Mar-
10
Jun-1
0
Sep
-10
(Rs)
Jeypore Sugar 0.4x 0.7x1.2x 1.5x 2x
2.5x
0
500
1000
1500
2000
2500
3000
3500
4000
4500
5000
Jun-0
6
Sep
-06
Dec
-06
Mar-
07
Jun-0
7
Sep
-07
Dec
-07
Mar-
08
Jun-0
8
Sep
-08
Dec
-08
Mar-
09
Jun-0
9
Sep
-09
Dec
-09
Mar-
10
Jun-1
0
Sep
-10
(Rs mn)
Jeypore Sugar 5x 6x 7x 8x
0.0
0.5
1.0
1.5
2.0
2.5
3.0
3.5
4.0
4.5
Jun-
06
Sep
-06
Dec-
06
Mar-
07
Jun-
07
Sep
-07
Dec-
07
Mar-
08
Jun-
08
Sep
-08
Dec-
08
Mar-
09
Jun-
09
Sep
-09
Dec-
09
Mar-
10
Jun-
10
Sep
-10
1yr Fwd P/BV (x) Median P/BV
+1 std dev
-1 std dev
-
2.00
4.00
6.00
8.00
10.00
12.00
14.00
Jun-0
6
Sep
-06
Dec
-06
Mar-
07
Jun-0
7
Sep
-07
Dec
-07
Mar-
08
Jun-0
8
Sep
-08
Dec
-08
Mar-
09
Jun-0
9
Sep
-09
Dec
-09
Mar-
10
Jun-1
0
Sep
-10
1yr fwd Ev/Ebitda Median EV/Ebitda
+1 std dev
-1 std dev
We value Jeypore at
P/BV of 0.9x of FY12E
book value per share

CRISIL EQUITIES | 15
The Jeypore Sugar Ltd
Peer comparison
Companies M.cap Year end
Price/Book (x) EV/EBITDA
(Rs mn) FY10 FY11E FY12E FY10 FY11E FY12E
The Jeypore sugar Ltd 767 Mar 1.2 1.1 1.0 5.8 6.9 4.5
Bajaj Hindustan Ltd 19117 Sep 1.0 1.0 0.9 12.1 11.0 8.9
Balrampur Chini Ltd 19498 Mar 1.7 1.5 1.4 5.5 6.7 5.6
Shree Renuka Sugar Ltd 51050 Sep 2.5 1.9 1.5 6.2 4.0 3.8
Triveni Engineering Ltd 25143 Sep 2.3 - - 6.7 8.6 6.4
Source: CRISIL Equ it ies, Industry est imates

CRISIL EQUITIES | 16
The Jeypore Sugar Ltd
Company Overview Incorporated as a public limited company in 1936, Jeypore began its operations
with the commencement of a sugar unit at Rayagada, Koraput district, Orissa.
However, due to limited irrigation potential, this sugar unit at Rayagada was sold
off in 1994-95. It has diversified into other activities namely the manufacture of
industrial alcohol, Indian made foreign liquor (IMFL) and ferro manganese.
It commenced production at its sugar unit in Chagallu in 1961. This plant has a
capacity to crush 8500 tonnes of cane per day. The ownership of the distillery unit
at Chagallu which was established by the Andhra Pradesh state government in
1976 was transferred to “Nizam Sugar” in 1987. Jeypore acquired this distillery in
2000-01 for the manufacture of rectified spirit. This distillery currently has a
capacity of manufacturing 60KLPD. The company also acquired a distillery unit at
Jangareddigudem which has capacity of 40 KLPD. Through these distillery units,
the company manufactures Extra Neutral Alcohol (ENA), ethanol or absolute
alcohol depending on the market demand. Jeypore has also developed a co-
generation unit at Chagallu of 25 MW.
It has also established a new sugar mill at Pothavaram which is expected to
commence operations in the SS2010-2011. The new unit will have capacity of
5,000 TCD and will be integrated with a 16.8 MW co-generation plant.
Milestones
1936 Incorporated as a public limited company. First company to be
registered in province of Orissa. Started sugar unit at Rayagada, Orissa with initial capacity of 150 TCD subsequently expanded to 450 TCD.
1958 Sugar unit established at Nagaram in Guntur, Andhra Pradesh.
1961 Unit at Nagaram shifted to Chagallu, Andhra Pradesh due to non-availability of sugarcane
2001 Distillery unit purchased from Nizam sugars Ltd. is modified and begins operations
2003 Co-generation unit established at Chagallu unit and started exporting power
2004 IMFL bottling unit started at Rayagada Distillery
2006 Plans for setting up 5000 TCD factory at Pothavaram approved by board
Distillery at Chagallu expanded to reach capacity of 40 KLPD
2010 Co-generation unit modified to enable coal firing
2011 Sugar unit at Pothavaram of 5000 TCD begins operation

CRISIL EQUITIES | 17
The Jeypore Sugar Ltd
Annexure: Financials
Source: CRISIL Equ it ies
Income statement Balance Sheet(Rs mn) FY08 FY09 FY10 FY11E FY12E (Rs mn) FY08 FY09 FY10 FY11E FY12E
Operating income 1,944 1,792 2,420 2,975 3,809 Liabilities
EBITDA 204 364 614 506 752 Equity share capital 45 45 45 45 45
EBITDA margin 10.5% 20.3% 25.4% 17.0% 19.8% Reserves 498 528 700 660 723
Depreciation 113 117 112 201 241 Minorities - - - - -
EBIT 91 247 502 305 512 Net worth 544 573 745 705 768
Interest 177 250 233 361 408 Convertible debt - - - - -
Operating PBT (86) (3) 269 (56) 104 Other debt 1,990 2,424 2,836 2,936 2,886
Other income 5 8 5 6 8 Total debt 1,990 2,424 2,836 2,936 2,886
Exceptional inc/(exp) 14 36 1 - - Deffered tax liability (net) 116 125 117 117 117
PBT (67) 41 275 (50) 112 Total liabilities 2,649 3,123 3,699 3,759 3,772
Tax provision (5) 12 82 - 34 Assets
Minority interest - - - - - Net fixed assets 1,446 1,384 1,330 3,617 3,377
PAT (Reported) (61) 29 193 (50) 78 Capital WIP 1,226 1,848 2,189 0 0
Less: Exceptionals 14 36 1 - - Total fixed assets 2,672 3,233 3,519 3,618 3,377
Adjusted PAT (75) (7) 192 (50) 78 Investments 2 2 2 2 2
Current assets
Ratios Inventory 1,915 1,708 1,574 1,953 2,612
FY08 FY09 FY10 FY11E FY12E Sundry debtors 79 92 38 46 59
Growth Loans and advances 476 495 433 634 811
Operating income (%) nm nm 35.0 22.9 28.0 Cash & bank balance 172 71 124 221 276
EBITDA (%) nm 78.5 68.6 nm 48.6 Marketable securities - - - - -
Adj PAT (%) nm nm nm nm nm Total current assets 2,642 2,366 2,169 2,854 3,758
Adj EPS (%) nm nm nm nm nm Total current liabilities 2,682 2,487 1,995 2,719 3,369
Net current assets (41) (121) 174 135 389
Profitability Intangibles/Misc. expenditure 16 8 4 4 4
EBITDA margin (%) 10.5 20.3 25.4 17.0 19.8 Total assets 2,649 3,123 3,699 3,759 3,772
Adj PAT Margin (%) nm nm 7.9 nm 2.1
RoE (%) nm nm 29.1 nm 10.6 Cash flow
RoCE (%) 4.3 8.9 15.3 8.4 14.0 (Rs Mn) FY08 FY09 FY10 FY11E FY12E
RoIC (%) 5.4 9.5 13.5 9.2 14.5 Pre-tax profit (81) 5 274 (50) 112
Total tax paid (1) (2) (90) - (34)
Valuations Depreciation 113 117 112 201 241
Price-earnings (x) nm nm 4.5 nm 9.7 Working capital changes 352 (20) (242) 136 (199)
Price-book (x) 1.4 0.7 1.2 1.1 1.0 Net cash from operations 383 100 54 287 120
EV/EBITDA (x) 12.6 7.6 5.8 6.9 4.5 Cash from investments
EV/Sales (x) 1.3 1.5 1.5 1.2 0.9 Capital expenditure (1,241) (671) (394) (300) 0
Dividend payout ratio (%) nm 18.2 13.7 16.7 16.7 Investments and others - - (0) - -
Dividend yield (%) 0.7 1.3 3.1 1.1 1.7 Net cash from investments (1,241) (671) (394) (300) 0
Cash from financing
B/S ratios Equity raised/(repaid) - - - - -
Inventory days 415 460 330 307 333 Debt raised/(repaid) 858 434 413 100 (50)
Creditors days 555 626 390 388 389 Dividend (incl. tax) (5) (5) (26) 8 (13)
Debtor days 14 19 6 6 6 Others (incl extraordinaries) 25 42 7 1 (2)
Working capital days (7) (41) (11) (2) 1 Net cash from financing 878 471 393 110 (65)
Gross asset turnover (x) 0.9 0.8 1.0 0.8 0.8 Change in cash posiiton 21 (100) 53 97 55
Net asset turnover (x) 1.4 1.3 1.8 1.2 1.1 Closing cash 172 71 124 221 276
Sales/operating assets (x) 0.9 0.6 0.7 0.8 1.1
Current ratio (x) 1.0 1.0 1.1 1.0 1.1 Quarterly financials
Debt-equity (x) 3.7 4.2 3.8 4.2 3.8 (Rs Mn) Q2FY10 Q3FY10 Q4FY10 Q1FY11 Q2FY11
Net debt/equity (x) 3.3 4.1 3.6 3.9 3.4 Net Sales 644 609 333 541 445
Interest coverage 0.5 1.0 2.2 0.8 1.3 Change (q-o-q) -35% -5% -45% 62% -18%
EBITDA 139 156 233 0 (66)
Per share Change (q-o-q) -4% 12% 49% -100% -22192%
FY08 FY09 FY10 FY11E FY12E EBITDA margin 21.6% 25.6% 69.9% 0.1% -14.9%
Adj EPS (Rs) (16.6) (1.5) 42.3 (11.0) 17.3 PAT 80 76 12 (70) (131)
CEPS 8.2 24.2 67.0 33.4 70.3 Adj PAT 80 76 12 (70) (131)
Book value 119.9 126.4 164.3 155.5 169.4 Change (q-o-q) 170% -5% -85% -702% 88%
Dividend (Rs) 1.2 1.2 5.8 1.2 2.9 Adj PAT margin 12.4% 12.4% 3.5% -12.9% -29.5%
Actual o/s shares (mn) 4.5 4.5 4.5 4.5 4.5 Adj EPS 17.5 16.7 2.6 (15.4) (29.0)

CRISIL EQUITIES | 18
The Jeypore Sugar Ltd
Focus Charts
Revenues and EBIDTA margins EBIDTA and PAT trend
Source: Company, CRISIL Equities Source: Company, CRISIL Equities
Quantity of sugarcane crushed and crushing days Net Debt to Equity and Interest coverage
Source: Company, CRISIL Equities Source: Company, CRISIL Equities
Sugar prices (Mumbai S-30) Shareholding pattern over the quarters
Source: Company, CRISIL Equities Source: Company, CRISIL Equities
0%
5%
10%
15%
20%
25%
30%
0
500
1000
1500
2000
2500
3000
3500
4000
FY06 FY07 FY08 FY09 FY10 FY11E FY12E
Rs mn
Operating Income (LHS) EBIDTA margin (RHS)
-100
0
100
200
300
400
500
600
700
800
FY06 FY07 FY08 FY09 FY10 FY11E FY12E
Rs mn
PAT EBIDTA
0
20
40
60
80
100
120
140
160
0
2
4
6
8
10
12
14
16
FY05 FY06 FY07 FY08 FY09 FY10 FY11E FY12E
daysLakh tonne
Qty crushed (LHS) Crushing days (RHS)
0.0
0.5
1.0
1.5
2.0
2.5
3.0
3.5
4.0
4.5
0.0
0.5
1.0
1.5
2.0
2.5
3.0
3.5
4.0
4.5
FY06 FY07 FY08 FY09 FY10 FY11E FY12E
Net D/E (LHS) Interest coverage (RHS)
0
5000
10000
15000
20000
25000
30000
35000
40000
45000
Oct
-05
Jan-
06
Apr
- …
Jul-
06
Oct
-06
Jan-
07
Apr
- …
Jul-
07
Oct
-07
Jan-
08
Apr
-…
Jul-
08
Oct
-08
Jan-
09
Apr
- …
Jul-
09
Oct
-09
Jan-
10
Apr
-…
Jul-
10
Oct
-10
(Rs/tonne)
44.8% 44.8% 44.8% 44.8%
0.8% 0.8% 0.8% 0.8%
54.5% 54.5% 54.5% 54.5%
0%
10%
20%
30%
40%
50%
60%
70%
80%
90%
100%
Dec-09 Mar-10 Jun-10 Sep-10
Promoter FII DII Others

CRISIL Independent Equity Research Team
Mukesh Agarwal Director +91 (22) 3342 3035 [email protected]
Tarun Bhatia Director, Capital Markets +91 (22) 3342 3226 [email protected]
Chetan Majithia Head, Equities +91 (22) 3342 4148 [email protected]
Sudhir Nair Head, Equities +91 (22) 3342 3526 [email protected]
Nagarajan Narasimhan Director, Research +91 (22) 3342 3536 [email protected]
Ajay D'Souza Head, Research +91 (22) 3342 3567 [email protected]
Manoj Mohta Head, Research +91 (22) 3342 3554 [email protected]
Sachin Mathur Head, Research +91 (22) 3342 3541 [email protected]
Sridhar C Head, Research +91 (22) 3342 3546 [email protected] CRISIL’s Equity Offerings The Equity Group at CRISIL Research provides a wide range of services including: Independent Equity Research IPO Grading White Labelled Research Valuation on companies for use of Institutional Investors, Asset Managers, Corporate Other Services by the Research group include CRISINFAC Industry research on over 60 industries and Economic Analysis Customised Research on Market sizing, Demand modelling and Entry strategies Customised research content for Information Memorandum and Offer documents

About CRISIL
CRISIL is India's leading Ratings, Research, Risk and Policy Advisory Company.
About CRISIL Research CRISIL Research is India's largest independent, integrated research house. We leverage our unique, integrated
research platform and capabilities spanning the entire economy-industry-company spectrum to deliver superior
perspectives and insights to over 750 domestic and global clients, through a range of subscription products and
customised solutions.
Vinaya Dongre – Head, Business Development
Email : [email protected] I Phone : 9920225174
To know more about CRISIL IER, please contact our team members:
Sagar Sawarkar – Senior Manager, Business Development
Email : [email protected] I Phone : 9821638322
Kolkata Priyanka Agarwal - Manager, Business Development Email : [email protected] I Phone : 9903060685 Mumbai Supriya Tapase - Manager, Business Development Email : [email protected] I Phone : 9820745668 New Delhi Vipin Saboo - Manager, Business Development Email : [email protected] I Phone : 9820779873
Ahmedabad I Mumbai I Pune Salil Srivastava - Manager, Business Development Email : [email protected] I Phone : 9833996430 Bengaluru I Chennai Anand Krishnamoorthy - Manager, Business Development Email : [email protected] I Phone : 9884704111 Hyderabad Kaliprasad Ponnuru - Manager, Business Development Email : [email protected] I Phone : 9642004668
Regional Contacts:
Head Office: CRISIL House, Central Avenue, Hiranandani Business Park, Powai, Mumbai - 400 076 Phone : 91-22-3342 3000 Web: www.crisil.com Download reports from: www.ier.co.in