
The Italian NPL Market - PwC · 2020-02-24 · 2 | The Italian NPL market Looking at the NPL...
64
pwc.com/it December 2019 The Italian NPL Market Another Brick in the Wall
Transcript of The Italian NPL Market - PwC · 2020-02-24 · 2 | The Italian NPL market Looking at the NPL...

pwc.com/it December 2019
The Italian NPL Market
Another Brick in the Wall
2 | The Italian NPL market
Looking at the NPL transactions everyone has the same question. What can we expect from a market at its lo est le el for ears an for the first time o n o since 2013? Well, in our opinion, more than a lot.
The Italian banking system has done a step forward to improve asset quality, but banks are facing more and more challenging NPE ratio targets in each release of their industrial plans. The reason for this lies in the regulatory pressure to further reduce the still large amount of bad loans and UtPs lying in their balance sheets hich is re ecte in an a re ate ratio almost three times higher than the EU average.
The renewal of GACS scheme will further facilitate the sale of bad loans, as showed in the transactions pipeline, while newly founded asset management companies (SGR) are specializing in UtP transfers and disposals, both pushed by the investor appetite for non-core and non-performing assets.
SGRs, together with challenger banks, will play a key role in generating value from UtP exposures, given that the are a le to pro i e ne financial reso rces and professional expertise to distressed companies, essential to accomplish a successful turnaround process maximising the expected recovery in a going concern scenario.
From a regulatory perspective, the latest release on calendar provisioning extends the provisioning schedule from 2 to 3 years on unsecured NPEs and from 7 to 9 for secured ones. The impacts will be strongly related to the f t re o s of s especiall for hat concerns new loans, which are fully included in the 630/2019 Regulation. Moreover, we analysed the main aspects of “Decreto Crescita” related to NPL market, while the impact of the latest reform of the Italian Bankruptcy Law is still under evaluation and will be clearer in 2020.

PwC | 3
On top of this, out of the € 200 bn of NPLs sold by the banks over the past 5 years the majority are still to be recovered by servicers and investors. Therefore, we foresee the start-up of the secondary market we did not experience so far, driven by strategic and trading rationales, as discussed in the market outlook chapter of the report.
On the workout side, servicers built the workforce capacity and developed the IT structure needed to onboard and begin to effectively collect the NPL portfolios under management. From this point forward the focus on servicing market will likely shift from AUM
ro th to reco er performances profita ilit an cost optimisation, pushing to aggregations, even between large market operators.
Now, even without the volumes of M&A, NPL will once again have the grounds to be a protagonist in the deals market. And it feels as if we just put another brick in the wall.
Contents
1. Macroeconomic Scenario 4
2. Italian Real Estate Market 8
3. Regulatory framework update 14
4. Italian NPL Market 18
5. Focus on GACS 24
6. Italian Banks Overview 28
7. Focus on UtP Italian Market 34
8. The Servicing Market 40
9. Recent market activity and outlook 48
Appendix 54
4 | The Italian NPL market
Key Message
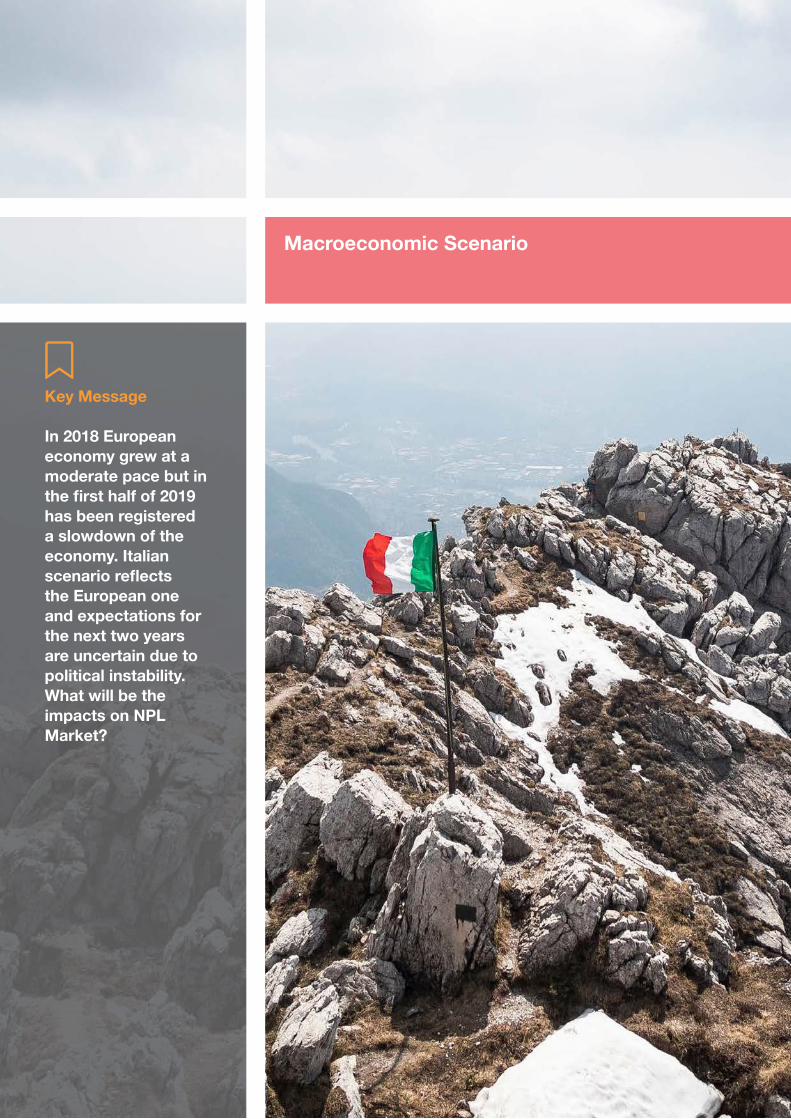
In 2018 European economy grew at a moderate pace but in the first half of 2019 has been registered a slowdown of the economy. Italian scenario reflects the European one and expectations for the next two years are uncertain due to political instability. What will be the impacts on NPL Market?
Macroeconomic Scenario
PwC | 5
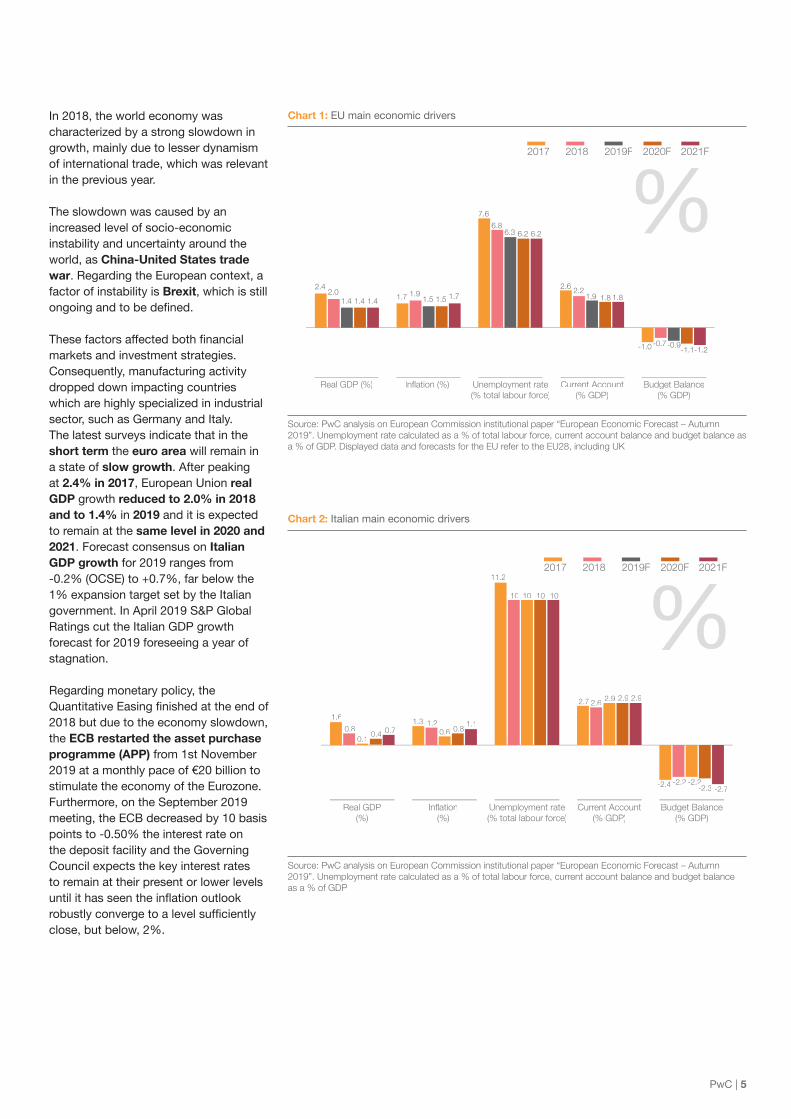
In 2018, the world economy was characterized by a strong slowdown in growth, mainly due to lesser dynamism of international trade, which was relevant in the previous year.
The slowdown was caused by an increased level of socio-economic instability and uncertainty around the world, as China-United States trade war. Regarding the European context, a factor of instability is Brexit, which is still on oin an to e efine
These factors affecte oth financial markets and investment strategies. Consequently, manufacturing activity dropped down impacting countries which are highly specialized in industrial sector, such as Germany and Italy. The latest surveys indicate that in the short term the euro area will remain in a state of slow growth. After peaking at 2.4% in 2017, European Union real GDP growth reduced to 2.0% in 2018 and to 1.4% in 2019 and it is expected to remain at the same level in 2020 and 2021. Forecast consensus on Italian GDP growth for 2019 ranges from -0.2% (OCSE) to +0.7%, far below the 1% expansion target set by the Italian government. In April 2019 S&P Global Ratings cut the Italian GDP growth forecast for 2019 foreseeing a year of stagnation.
Regarding monetary policy, the antitati e asin finishe at the en of
2018 but due to the economy slowdown, the ECB restarted the asset purchase programme (APP) from 1st November 2019 at a monthly pace of €20 billion to stimulate the economy of the Eurozone. Furthermore, on the September 2019 meeting, the ECB decreased by 10 basis points to -0.50% the interest rate on the deposit facility and the Governing Council expects the key interest rates to remain at their present or lower levels
ntil it has seen the in ation o tloo ro stl con er e to a le el s fficientl close, but below, 2%.
Chart 1: EU main economic drivers
Chart 2: Italian main economic drivers
Source: PwC analysis on European Commission institutional paper “European Economic Forecast – Autumn 2019”. Unemployment rate calculated as a % of total labour force, current account balance and budget balance as a % of GDP. Displayed data and forecasts for the EU refer to the EU28, including UK
Source: PwC analysis on European Commission institutional paper “European Economic Forecast – Autumn 2019”. Unemployment rate calculated as a % of total labour force, current account balance and budget balance as a % of GDP
Real GDP (%) n at n Current cc unt (% GDP)
ne l ent ate t tal la u rce
Budget Balance (% GDP)
2019F 2020F 2021F2017 2018
%2.4
2.01.4 1.4 1.7 1.9 1.7
7.6
6.86.3 6.2 6.2
2.6 2.21.9 1.8 1.8
-1.0 -0.7-1.1-1.2
-0.9
1.5 1.51.4
2019F 2020F 2021F2017 2018
Real GDP(%)
Inflation(%)
Current Account (% GDP)
Unemployment rate(% total labour force)
Budget Balance(% GDP)
0.10.4
1.6
0.8 0.7 0.61.21.3
2.92.62.7
0.81.1
2.9 2.9
10
11.2
10 10 10
-2.2-2.4 -2.2-2.3 -2.7
%

6 | The Italian NPL market
2017 2018 2019F 2020F 2021F
EUItaly
3.4%3.3%
3.2%
2.7%1.6%
1.5%
2.5%
3.8%
1.8%1.7%
Focusing on national scenario, on September 5th, 2019, after a few weeks of uncertainty, the Democratic Party and the Five Star Movement started a new government alliance maintaining Giuseppe Conte as Prime Minister.
After a long standoff with the European Commission, the Italian government set the deficit at 2.04% (down from an original target of 2.4%, but 3x compared to the previous administration’s target of 0.8%) of GDP in 2019, at 1.8% (from 2.1%) in 2020 and at 1.5% (from 1.8%) in 2021.
The Italian political uncertainty is one of the key factors that impact on economy, and consequently, in February 2019 Moody’s has downgraded the sovereign rating from Baa2 to Baa3, with a stable outlook. In April 2019 S&P Global Ratings confirme the ratin on tal s sovereign debt and in August 2019
itch confirme the ratin ith a negative outlook. In September 2019 Moody’s confirmed the Italian sovereign rating to Baa3 with a stable outlook stating that the new Government will now open a period of political stability.
Chart 3: Total investments volume trend (% change)
Source: PwC analysis on European Commission institutional paper “European Economic Forecast – Autumn 2019”. Displayed data and forecasts for the EU refer to the EU28, including UK
Table 1: Government gross debt ratio per country
Source: PwC analysis on European Commission institutional paper “European Economic Forecast - Autumn 2019”. Displayed data and forecasts for the EU refer to the EU28, including UK
Government gross debt ratio (% GDP)
2017 2018 2019F 2020F 2021FTrend 2019F-2021F
EU 83.2 81.9 80.6 79.4 78.4
Italy 131.4 134.8 136.2 136.8 132.4
Spain 98.1 97.6 96.7 96.6 96.0
France 98.4 98.4 98.9 98.9 99.2
Germany 64.5 61.9 59.2 56.8 55.0
UK 87.1 85.9 85.2 84.7 84.2

PwC | 7
The Italian Government, after long debates, with the 2019 Budget Law blocked the increase in the standard 22% VAT rate for 2020. The total amount required by European Union for the sterilization of the safeguard clauses for the biennium 2020/2021 is € 52bn.
After an initial negative shock due to the fall of the government and to the negative macroeconomic framework, both equity and bond markets have stabilized. Due to these factors and to ECB’s polices, the sovereign interest rate started going down again, and the BTP-Bund spread is now around 170 bps.
Chart 4: Trend of FTSE All Share Banks index and BTP-Bund spread
Source: PwC analysis on data provider information
400 bps
350 bps
300 bps
250 bps
200 bps
100 bps
150 bps
7,000
8,000
9,000
10,000
11,000
12,000
13,000
Dec
-17
FTSE Italia All Share Banks Spread BTP-BUND
Jan-
18
Feb-
18
Mar
-18
Apr
-18
May
-18
Jul-1
8
Jun-
18
Sep
-18
Aug
-18
Nov
-18
Oct
-18
Oct
-19
Dec
-18
Jan-
19
Feb-
19
Mar
-19
Apr
-19
May
-19
Jul-1
9
Jun-
19
Sep
-19
Aug
-19

8 | The Italian NPL market
Key Message
In the first half of 2019, the number of transactions recorded in the Italian real estate market increased by 5.9% compared to the same period of 2018, mainly driven by the residential asset class. In 2018, 245k judicial real estate executions were recorded, with the residential sector accounting for 78% of those executions. Investments in non-residential real estate reached €5.04bn in the first half of 2019, with the hotel sector dominating the Italian commercial real estate market, followed by office.
Italian Real Estate Market
PwC | 9
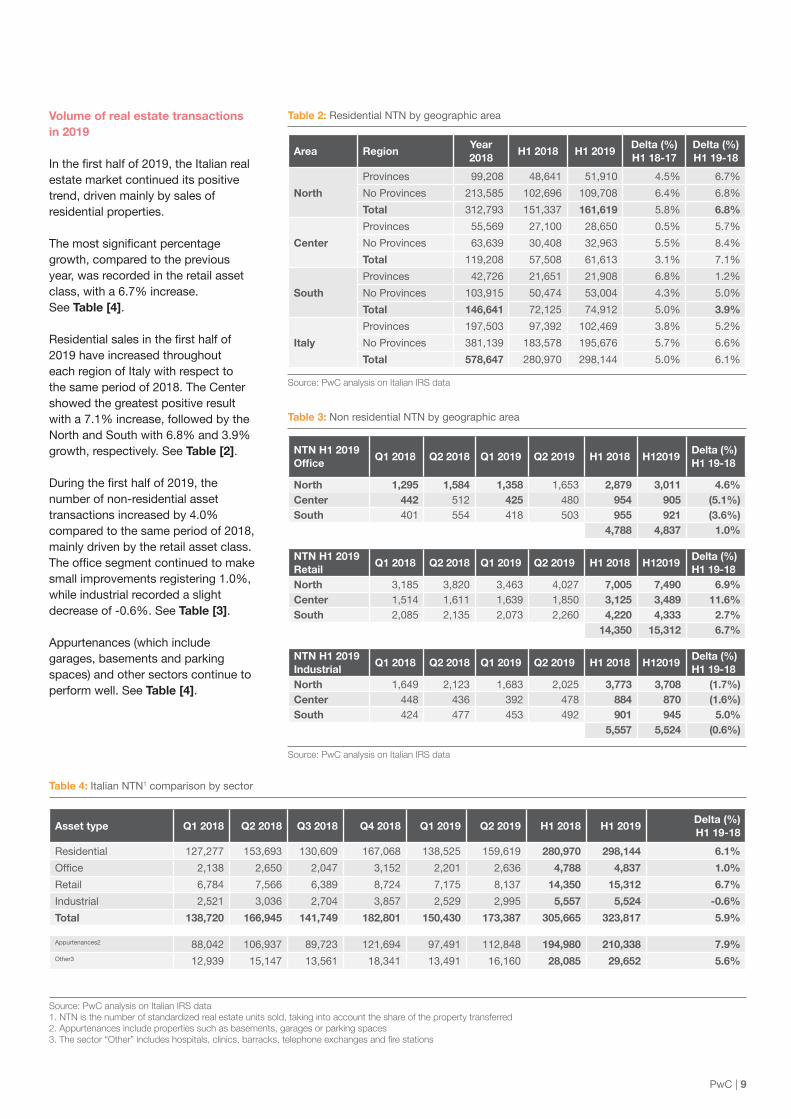
Volume of real estate transactions in 2019
n the first half of the talian real estate market continued its positive trend, driven mainly by sales of residential properties.
The most si nificant percenta e growth, compared to the previous year, was recorded in the retail asset class, with a 6.7% increase. See Table [4].
esi ential sales in the first half of 2019 have increased throughout each region of Italy with respect to the same period of 2018. The Center showed the greatest positive result with a 7.1% increase, followed by the North and South with 6.8% and 3.9% growth, respectively. See Table [2].
rin the first half of the number of non-residential asset transactions increased by 4.0% compared to the same period of 2018, mainly driven by the retail asset class. The office se ment contin e to ma e small improvements registering 1.0%, while industrial recorded a slight decrease of -0.6%. See Table [3].
Appurtenances (which include garages, basements and parking spaces) and other sectors continue to perform well. See Table [4].
Table 2: Residential NTN by geographic area
Table 3: Non residential NTN by geographic area
Table 4: Italian NTN1 comparison by sector
Source: PwC analysis on Italian IRS data
Source: PwC analysis on Italian IRS data
Source: PwC analysis on Italian IRS data 1. NTN is the number of standardized real estate units sold, taking into account the share of the property transferred 2. Appurtenances include properties such as basements, garages or parking spaces
e ect t e nclude tal cl n c a ac tele ne e c ange and e tat n
Asset type Q1 2018 Q2 2018 Q3 2018 Q4 2018 Q1 2019 Q2 2019 H1 2018 H1 2019Delta (%) H1 19-18
Residential 127,277 153,693 130,609 167,068 138,525 159,619 280,970 298,144 6.1%
ffice 2,138 2,650 2,047 3,152 2,201 2,636 4,788 4,837 1.0%
Retail 6,784 7,566 6,389 8,724 7,175 8,137 14,350 15,312 6.7%
Industrial 2,521 3,036 2,704 3,857 2,529 2,995 5,557 5,524 -0.6%
Total 138,720 166,945 141,749 182,801 150,430 173,387 305,665 323,817 5.9%
Appurtenances2 88,042 106,937 89,723 121,694 97,491 112,848 194,980 210,338 7.9%Other3 12,939 15,147 13,561 18,341 13,491 16,160 28,085 29,652 5.6%
Area RegionYear 2018
H1 2018 H1 2019Delta (%) H1 18-17
Delta (%) H1 19-18
North
Provinces 99,208 48,641 51,910 4.5% 6.7%
No Provinces 213,585 102,696 109,708 6.4% 6.8%
Total 312,793 151,337 161,619 5.8% 6.8%
Center
Provinces 55,569 27,100 28,650 0.5% 5.7%
No Provinces 63,639 30,408 32,963 5.5% 8.4%
Total 119,208 57,508 61,613 3.1% 7.1%
South
Provinces 42,726 21,651 21,908 6.8% 1.2%
No Provinces 103,915 50,474 53,004 4.3% 5.0%
Total 146,641 72,125 74,912 5.0% 3.9%
Italy
Provinces 197,503 97,392 102,469 3.8% 5.2%
No Provinces 381,139 183,578 195,676 5.7% 6.6%
Total 578,647 280,970 298,144 5.0% 6.1%
NTN H1 2019 Office
Q1 2018 Q2 2018 Q1 2019 Q2 2019 H1 2018 H12019Delta (%) H1 19-18
North 1,295 1,584 1,358 1,653 2,879 3,011 4.6% Center 442 512 425 480 954 905 (5.1%)South 401 554 418 503 955 921 (3.6%)
4,788 4,837 1.0%
NTN H1 2019 Retail
Q1 2018 Q2 2018 Q1 2019 Q2 2019 H1 2018 H12019Delta (%) H1 19-18
North 3,185 3,820 3,463 4,027 7,005 7,490 6.9% Center 1,514 1,611 1,639 1,850 3,125 3,489 11.6% South 2,085 2,135 2,073 2,260 4,220 4,333 2.7%
14,350 15,312 6.7%
NTN H1 2019 Industrial
Q1 2018 Q2 2018 Q1 2019 Q2 2019 H1 2018 H12019Delta (%) H1 19-18
North 1,649 2,123 1,683 2,025 3,773 3,708 (1.7%)Center 448 436 392 478 884 870 (1.6%)South 424 477 453 492 901 945 5.0%
5,557 5,524 (0.6%)

10 | The Italian NPL market
Investments in the non-residential real estate market
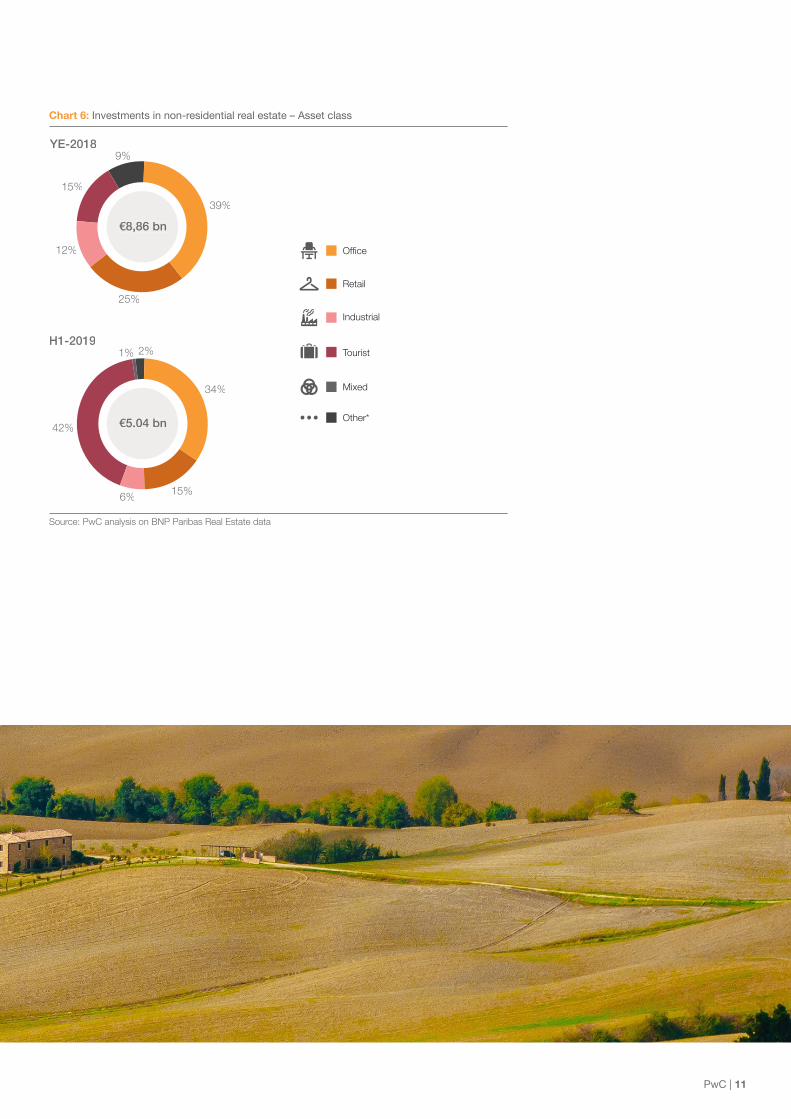
n the first half of the talian commercial real estate market recorded an investment volume of €5.04bn, increasing by 58% compared to the same perio of These first six months of the year are the best ever recorded in terms of volume and total transaction value.
The individual sector with the largest share of investments is the Hotel asset class with €2.1bn, which represents 42% of the total transaction volume, follo e the ffice sector ith €1.7bn invested. This result was in ence the sale of t o portfolios for a total value respectively of €1bn and €0.3bn. Retail investments reached over €760m, a 37% decrease compared to the same period of 2018.
Milan and Rome still represent key markets for investment, accounting for 38% and 16% of the total investment ol me in the first half of
respectively, with a concentration of office in estments in ilan an retail investments in Rome. The main source for real estate investments in Italy is still represented by foreign capital, accounting for 80% of the total, which is higher compared to the previous year.
Chart 5: Investments in non-residential real estate – Investor type
Source: PwC analysis on BNP Paribas Real Estate data
73%
83%
74%
201220112010 2013 2014 2015 2016 2017 2018
30% 27%
27% 17% 26% 70% 78%
40%
30%
73% 60%
35%
65%
20%
80%
413 4,383 1,744 5,130 5,221 8,100 9,100 11,100 8,857 5,044
H1-2019
22%
70%
Total investment (€m)Italian investorsForeign investors
PwC | 11
Chart 6: Investments in non‑residential real estate – Asset class
Source: PwC analysis on BNP Paribas Real Estate data
15%6%
42%
1% 2%
34%
H1-2019Tourist
Mixed
Other*
Retail
Office
Industrial
39%
25%
12%
15%
YE-20189%
€8,86 bn
€5.04 bn
12 | The Italian NPL market
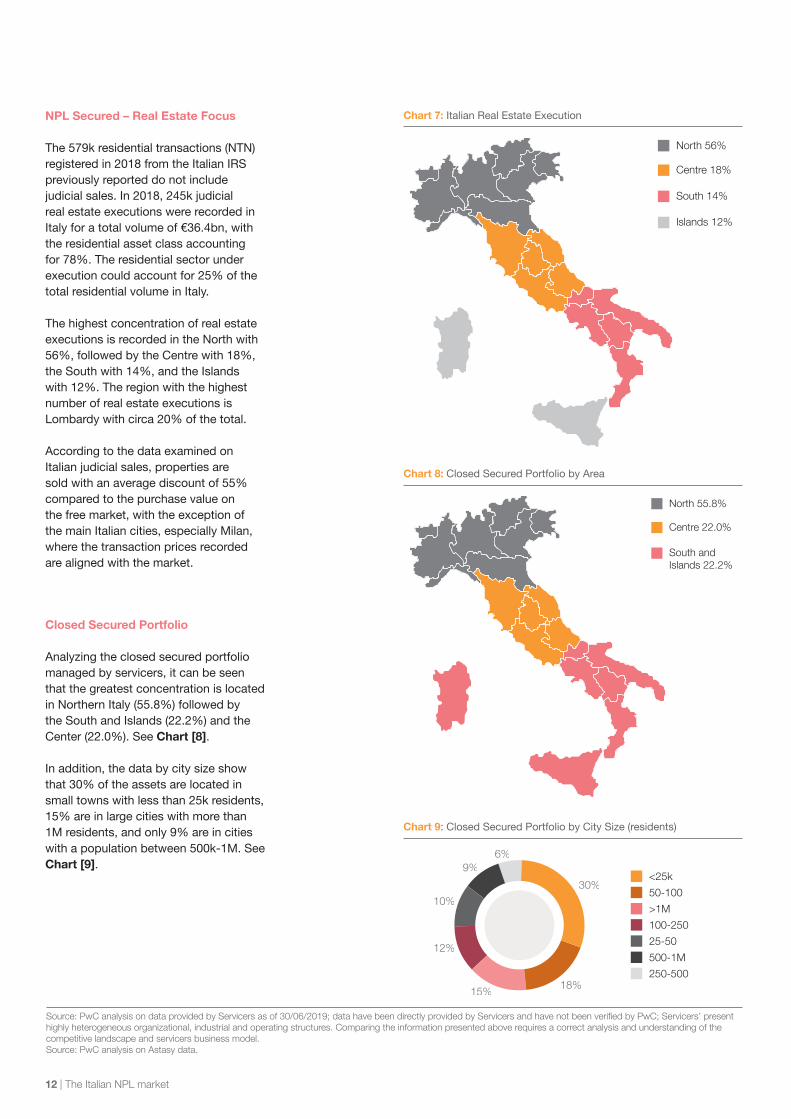
NPL Secured – Real Estate Focus
The 579k residential transactions (NTN) registered in 2018 from the Italian IRS previously reported do not include judicial sales. In 2018, 245k judicial real estate executions were recorded in Italy for a total volume of €36.4bn, with the residential asset class accounting for 78%. The residential sector under execution could account for 25% of the total residential volume in Italy.
The highest concentration of real estate executions is recorded in the North with 56%, followed by the Centre with 18%, the South with 14%, and the Islands with 12%. The region with the highest number of real estate executions is Lombardy with circa 20% of the total.
According to the data examined on Italian judicial sales, properties are sold with an average discount of 55% compared to the purchase value on the free market, with the exception of the main Italian cities, especially Milan, where the transaction prices recorded are aligned with the market.
Closed Secured Portfolio
Analyzing the closed secured portfolio managed by servicers, it can be seen that the greatest concentration is located in Northern Italy (55.8%) followed by the South and Islands (22.2%) and the Center (22.0%). See Chart [8].
In addition, the data by city size show that 30% of the assets are located in small towns with less than 25k residents, 15% are in large cities with more than 1M residents, and only 9% are in cities with a population between 500k-1M. See Chart [9].
Chart 7: Italian Real Estate Execution
Chart 8: Closed Secured Portfolio by Area
Chart 9: Closed Secured Portfolio by City Size (residents)
South 14%
Centre 18%
Islands 12%
North 56%
South and Islands 22.2%
Centre 22.0%
North 55.8%
u ce anal n data ded e ce a data a e een d ectl ded e ce and a e n t een e ed e ce e ent highly heterogeneous organizational, industrial and operating structures. Comparing the information presented above requires a correct analysis and understanding of the competitive landscape and servicers business model. Source: PwC analysis on Astasy data.
30%
18%15%
12%
10%
9%6%
<25k
50-100
>1M
100-250
25-50
500-1M
250-500

PwC | 13
The graphs below show the portfolios closed by the Servicers considering the recovery strategies and the recovery rate by asset class. For all recovery strategies, the main asset class is residential; Extrajudicial and Judicial strategies have a similar asset class allocation, while the Loan Sales strategy has a high concentration of retail (38%). The asset classes in closed portfolios with the lowest share over the total volume are mainl offices an e elopments
onsi erin the reco er rate each asset class offices show the highest performance (70%) followed by residential (51%). The asset classes with the lowest recovery rates are developments and land at 36% and 35%, respectively.
Chart 10: Closed portfolio by asset class (GbV)
Chart 11: Recovery rate by asset class on closed portfolio
Source: PwC analysis on data provided by Servicers as of 30/06/2019; data have been directly provided by e ce and a e n t een e ed e ce e ent g l ete gene u gan at nal ndu t al and
operating structures. Comparing the information presented above requires a correct analysis and understanding of the competitive landscape and servicers business model.
e anal a ed n la e data and etu ned t a t et c a e age
67%
11%
9%
8%
3% 1%
1%
66%
6%
7%
16%
2% 2%
1%
Residential
Retail
Industrial
Others
Land
Office
Development
Extrajudicial Judicial
54%
38%
2%1%4%
1%
Loan-Sale
Land Others Development Industrial Retail Residential Office
35% 35% 36%
47%48%
51%
70%
Regulation Overview
In this phase of the market, numerous credit institutions have created internal platforms capable of monitoring, assessing and maximizing the value of real estate collaterals. The new European regulations, as indicated in the EBA guidelines, also discuss that when the credit line is secured by a real estate guarantee, credit institutions should ensure that the collateral is accurately valued according to international standards by developing internal policies and procedures that specify the approaches that must be utilized. In addition, these institutions should also ensure that all real estate collateral is valued by internal e perts or in epen ent an alifie external professionals. These procedures should cover both new collateral and the regular monitoring and revaluation of existing collateral.

14 | The Italian NPL market
Regulatory framework update
Key Message
A continuous effort is being made within the regulatory framework as to enhance the pace of reducing the non performing exposures in the institutions’ balance sheet by either reviewing existing regulation and removing any impediments and/or by setting the requirements for a timely provisioning and write-off of the non performing exposures.

PwC | 15
Calendar Provisioning Regulatory timeline
2019 02 04 0108 2020 2021 06
SREP letter target on NPE stock
Regulation (EU) 630/2019 as regards minimum loss coverage
ECB Addendum update
Expected UE Commission publication
End of consultation on EBA ITS Expected
reporting reference date for EBA ITS
03
Addendum to ECB Guidelines on NPL
10
EBA published the draft ITS on Supervisory Reporting
First effects deriving from the
application of minimum loss
coverage
10 12
Expected EBA ITS submission to UE Commission
06
First effects deriving from
SREP target 2019
First effects deriving from ECB Addendum
Timeline of the first impacts
On August 22nd the Addendum to the ECB Guidelines on NPLs was updated through a communication from the ECB that reviewed some aspects related to supervisory expectations for prudential provisioning for the exposures classifie as efa lt startin from pril st an rante before April 26th 2019; for the exposures granted after April 26th ECB requires the Banks to refer to the Regulation (EU) 630/2019.
Moreover, EBA published draft Implementing Technical Standards on Supervisory Reporting in line with the minimum loss coverage requirements as per Regulation (EU) 630/2019.
s s mission of the final p ate T to the Commission is expected to take place in June 2020, while the first reference ate for the application is foreseen to e on June 2021. Three new templates (per NPE vintage bucket) are proposed to be added to COREP, while one new template and the review of two templates concerning FINREP. According to the consultation, the calculation of the minimum coverage requirement seems to be required at an exposure level (without taking into account the excess of coverage that institutions may have on individual exposures) and separately for secured and unsecured part of NPEs.
ECB Addendum Update
Perimeter
Scheduling
Other Aspects
The perimeter is limited to non performing e pos res classifie as from pril st 2018) related to credits granted before April, 26th 2019. New NPEs, related to credit granted on or after April, 26th 2019 are subject only to Pillar I regulation (i.e. minimum loss coverage).
The scheduling becomes aligned to the Regulation (EU) 630/2019, with its calendar being extended from 2/7 years for unsecured / secured exposures to 3/9/7 years for unsecured / immovable assets secured / other secured exposures for reaching 100% provisioning level. The clusters of eligible guarantees are aligned to the Regulation (EU) 630/2019 as well.
All the other aspects do not vary. Nevertheless, ECB Addendum and Regulation (EU) 630/2019 applications could lead to a different results, for instance, in case of a forbearance measure whose treatment remains different.
ECB Addendum Perimeter
SREP Perimeter
Regulation 630/2019 Perimeter
2018
2018
2018
2019
2019
2019
31.03
31.03
31.03
26.04
26.04
26.04
Granting
Granting
Granting
lassification
lassification
lassification
Illustrative non exhaustive
Recent evolutions on Calendar Provisioning

16 | The Italian NPL market
Regulatory treatment of NPE Securitisations
Securitisations can enhance the capacity of the market to absorb non performing exposures at a faster and greater rate than in a “typical” NPE sale transaction. However, market structural constraints and, as the EU Council acknowledged, the existence of legal “impediments to the transfer of NPEs by banks to non-banks and their ownership by non-banks” have contributed to a relatively slower NPE reduction pace in the recent years.
As a result the European Banking Authority (EBA) published an opinion to the European’s Commission regulatory treatment of non performing securitisations in order to examine the role of securitisation as a funding tool for NPE reduction and account for the characteristics of such tool (i.e. the risk for the investor is mostly referred to the ins fficient reco eries from the or o t of the e pos res to cover the net value).
Caps for NPE Securitisations Capital requirements calculation
Risk Retention
Other Aspects
EBA with reference to articles 267 and 268 of the CRR recommends:
• for the banks applying an authorised internal rating based approach, in order to reduce capital absorption, the application of the cap to the net value of the exposure/ expected loss (instead of using the gross amount) in case that the discount on the price is such as to absorb the losses;
• for the banks applying the standardised approach the application by the investor of a risk weight equal to 100% for the caps for securitisations where the Originator was permitted to apply such risk weight and the discount on the price is at least equal to the specific cre it ris a stments ma e by the Originator.
EBA recommends a recalibration of the capital requirements calculation methodology for NPE securitisations as to align the results deriving from the application of the standardised and internal rating based approach to the ones deriving form the application of an external rating based approach.According to EBA an element that causes a disproportionality in the use of the different approaches is the (p) correction factor.
Currently the Originator and/ or Sponsor are required to hold a minimum 5% risk retention (economic interest on the securitisation) calculated on the nominal value. EBA recommends such percentage to be applied on a net basis so as to not overstate the retained amount. Also, EBA recommends to expand the list of entities subject to risk retention and include the Independent Servicers since their interest is aligned to the investors’.
EBA also recommends to:
• foresee an appropriate prudential treatment for mixed securitisations (pool composed by both bonis and NPE exposures);
• review the obligation to verify that the ori inator applie so n an ell efine criteria for credit granting” in case of NPE securitisations.
Illustrative non exhaustive
EBA Opinion
PwC | 17
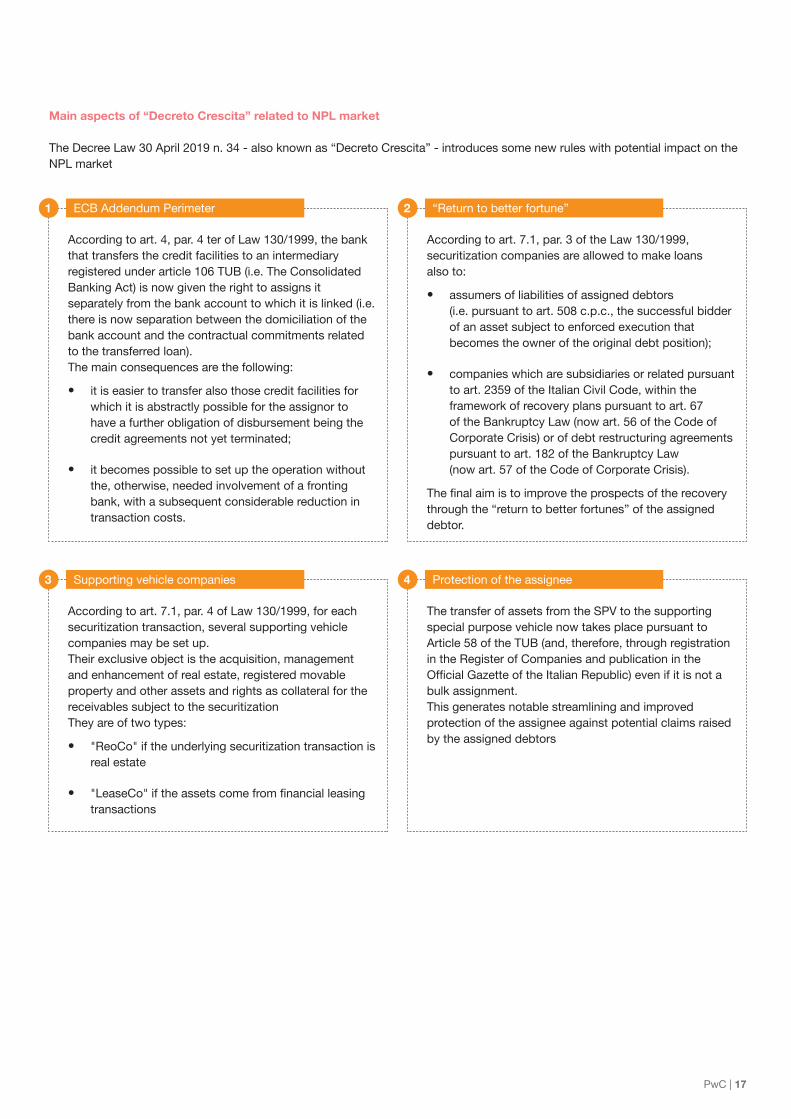
Main aspects of “Decreto Crescita” related to NPL market
The Decree Law 30 April 2019 n. 34 - also known as “Decreto Crescita” - introduces some new rules with potential impact on the NPL market
According to art. 4, par. 4 ter of Law 130/1999, the bank that transfers the credit facilities to an intermediary registered under article 106 TUB (i.e. The Consolidated Banking Act) is now given the right to assigns it separately from the bank account to which it is linked (i.e. there is now separation between the domiciliation of the bank account and the contractual commitments related to the transferred loan).The main consequences are the following:
• it is easier to transfer also those credit facilities for which it is abstractly possible for the assignor to have a further obligation of disbursement being the credit agreements not yet terminated;
• it becomes possible to set up the operation without the, otherwise, needed involvement of a fronting bank, with a subsequent considerable reduction in transaction costs.
According to art. 7.1, par. 4 of Law 130/1999, for each securitization transaction, several supporting vehicle companies may be set up.Their exclusive object is the acquisition, management and enhancement of real estate, registered movable property and other assets and rights as collateral for the receivables subject to the securitizationThey are of two types:
• "ReoCo" if the underlying securitization transaction is real estate
• ease o if the assets come from financial leasin transactions
According to art. 7.1, par. 3 of the Law 130/1999, securitization companies are allowed to make loans also to:
• assumers of liabilities of assigned debtors (i.e. pursuant to art. 508 c.p.c., the successful bidder of an asset subject to enforced execution that becomes the owner of the original debt position);
• companies which are subsidiaries or related pursuant to art. 2359 of the Italian Civil Code, within the framework of recovery plans pursuant to art. 67 of the Bankruptcy Law (now art. 56 of the Code of Corporate Crisis) or of debt restructuring agreements pursuant to art. 182 of the Bankruptcy Law (now art. 57 of the Code of Corporate Crisis).
The final aim is to impro e the prospects of the reco er through the “return to better fortunes” of the assigned debtor.
The transfer of assets from the SPV to the supporting special purpose vehicle now takes place pursuant to Article 58 of the TUB (and, therefore, through registration in the Register of Companies and publication in the
fficial a ette of the talian ep lic e en if it is not a bulk assignment.This generates notable streamlining and improved protection of the assignee against potential claims raised by the assigned debtors
1
3
2
4
ECB Addendum Perimeter
Supporting vehicle companies
“Return to better fortune”
Protection of the assignee
18 | The Italian NPL market
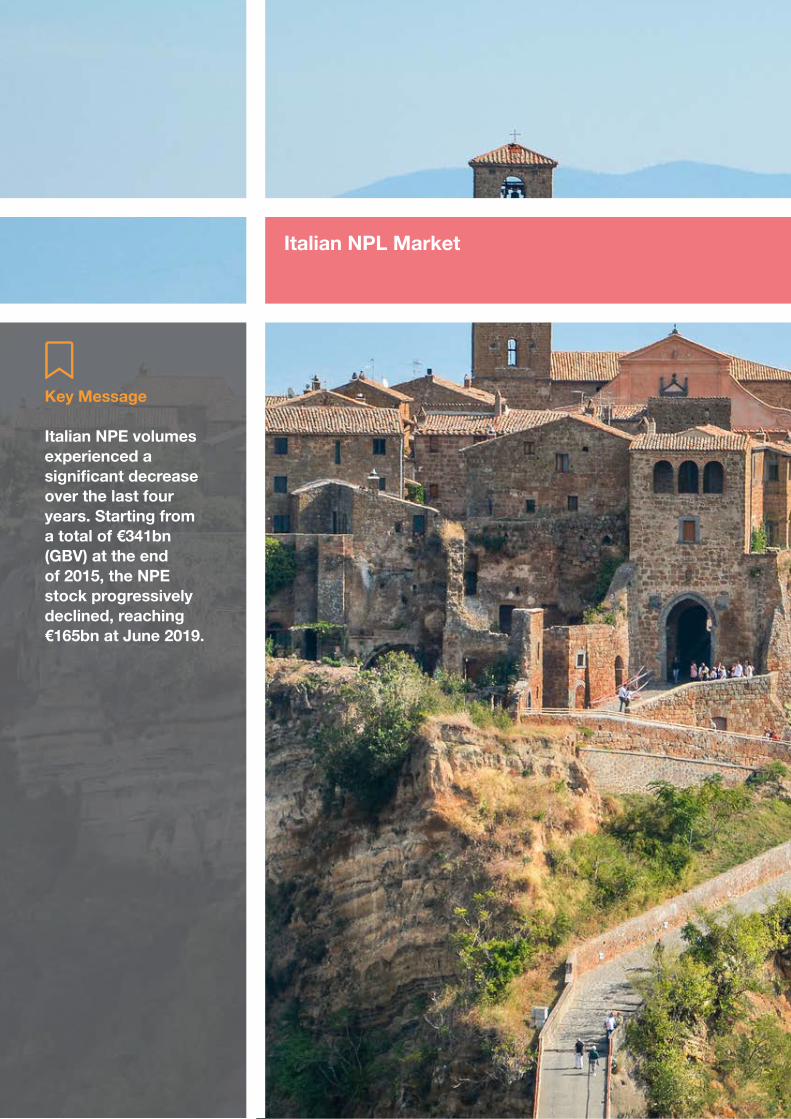
Key Message
Italian NPE volumes experienced a significant decrease over the last four years. Starting from a total of €341bn (GBV) at the end of 2015, the NPE stock progressively declined, reaching€165bn at June 2019.
Italian NPL Market

PwC | 19
Asset Quality
Chart 12 shows the reduction in the Italian NPE stock. After peaking at €341bn of GBV at YE-2015, the stock constantly reduced over the last years, reaching €165bn at H1-2019.
The gross Bad Loans volume reduced by €9bn from YE-2018 and by €77bn from YE-2017. Gross Unlikely to Pay showed a slower decline, with €73bn at H1-2019 from €79bn at YE-2018. Past Due maintained approximately the same value of YE-2018, slightly below YE-2017 level.
Chart 13 shows how the volume of net Bad Loans follows the same decreasing trend from 2015 until the first half of The total amo nt as of H1-2019 remained steady compared to YE-2018 and equal to €32bn (€64bn at YE-2017). The Bad Loans coverage ratio for the Italian system experienced a reverse trend compared to previous years and decreased to 63.8% compared to 67.3% at YE-2018.
Chart 12: Gross NPE trend
Chart 13: Net Bad Loans Trend
u ce anal n Banca d tal a Banc e e t tu n nan a e c nd n e c t del c ed t e settori e territori", September 2019
Source: PwC analysis on ABI Monthly Outlook and Bank of Italy data - September 2019. te and data g t nclude nanc al nte ed a e
9
1612
13
21
18
1214
7
5
44
85
132157
194
237
283
326341
324
264
180165
NPE CAGR 2008-2015: +22%
NPE CAGR 2015 - H1-2019: -19%
Gross UTP (€ bn)Gross Past Due (€ bn) Gross Bad Loans (€ bn)
201020092008 2011 2012 2013 2014 2015 2016 2017 H1-20192018
33
42
57
59
66
78
73
88
74
107
109
156
131
184
127
200
117
20091
125
94
165 79
97
201120102008 2012 2013 2014 2015 2016 2017 2018
62
6047
39
24
84
27% 17% 26% 70%
89
64
32
65%
32
80%
1.4%
2009
2.3% 2.8% 3.5% 3.8% 5.0% 5.4% 5.7% 5.6% 4.3% 2.2% 2.2%
H1-2019
42.9% 34% 39.7% 43.7% 50.3% 48.7% 54% 55.6% 56.5% 61% 67.3% 63.8%
8087
Net Bad Loans / Loans to Customers (%) Bad Loans coverage ratio (%)Net Bad Loans (€ bn)

20 | The Italian NPL market
Looking at the composition of gross Bad Loans:
• The breakdown of gross Bad Loans ratio highlights the highest percentages in Umbria (9.7%), Abruzzo-Molise (9.6%), Campania (9.5%) and Sicily (9.4%); overall, northern regions tend to show lower gross Bad Loans ratio compared to central and southern regions;
• Lombardy collects approx. 20.8% of total Italian Bad Loans, while it shows a relative low Bad Loans ratio (4.3%);
• At H1-2019 the “Corporate & SME” sector still represents the greatest share (71%) of Italian gross Bad Loans, followed by the Consumer loans (21%);
• The percentage of Secured Bad Loans (45%) decreased compared to YE-2018.
Chart 14a: Gross Bad Loans ratio by region* (H1-2019) Chart 14b: Breakdown of gross Bad Loans by region* (H1-2019)
u ce anal n Banca d tal a Banc e e t tu n nan a e c nd n e c t del c ed t e ett e te t e te e te Bad an at n t e eg n a n uenced a a e t e
Prestiti, included in Bank of Italy database; (*) Unique percentage for
alle d ta and e nte 2) Abruzzo and Molise. 3) Puglia and Basilicata.
u ce anal n Banca d tal a Banc e e t tu n nan a e c nd n e c t del c ed t e ett e te t e te e
Note: (*) Unique percentage for alle d ta and e nte
2) Abruzzo and Molise 3) Puglia and Basilicata
4.3%4.5%
5.8%6.2%
7.7%
2.1%9.6%
8.7%
7.7%
9.4%
8.5%
9.5%
4.8%
2.8%
< 3%
6-9%
> 9%
3-6%
8.7%
9.7%
4.4%
20.8%
5.7%
2.1%9.5%
8.6%
11.1%
2.8%
3.3%
5.1%
6.2%
2.5%7.6%
7.8%
1.3%
< 2%
6-10%
> 10%
2-6%
1.9%
2.1%
1.5%

PwC | 21
Chart 15: Breakdown of gross Bad Loans by counterparty** (H1-2019)
Chart 16: Secured gross Bad Loans trend (% on total Bad Loans)
u ce anal n Banca d tal a Banc e e t tu n nan a e c nd n e c t del c ed t e ett e te t e te e te t e nclude and nanc al n t tut n
u ce anal n Banca d tal a Banc e e t tu n nan a e c nd n e c t del c ed t e ett e te t e te e te t e nclude and nanc al n t tut n
2008
36% 36%38% 38%
39%
42%
45%47% 48%
50%48%
45%
64%
7%
28%
2%
2009 2010 2011 2012 2013 2014 2015
Corporate & SME
Counterparty
Retail
Family business
Other**
2016 2017 2018 H1-2019
201120102008 2012 2013 2014 2015 2016 2017 2018
66.8%
12.0%
20.4%
68.7% 69.6% 70.1% 70.9% 72.8% 74.5% 74.3% 73.5%69.6% 70.9% 70.6%
10.6% 9.7% 9.3% 8.9% 8.2% 7.5% 7.4% 7.6%8.2% 6.1% 6.3%
19.8% 19.9% 19.8% 19.4% 18.1% 16.2% 16.5% 17.2% 20.6% 21.1% 21.2%
0.8% 0.9% 0.8% 0.9% 0.8% 0.9% 1.7% 1.8% 1.7% 1.6% 1.9% 1.9%
2009 H1-2019
Corporate & SME Family business Consumer Other

22 | The Italian NPL market
The breakdown of gross Bad Loans by economic sector (Chart 17) shows that Real Estate and Construction accounts for 34% such as manufacturing products, followed by wholesale and retail trade (15%).
The breakdown of gross Bad Loans by ticket size (Chart 18) shows that large-size exposures (over €1m) represent 53% of total GBV, whereas mid-size exposures (from €75k to €1m) and small-size exposures (below €75k) represent 47% of the total.
Focus: UtP
The gross UtP stock composition as of H1-2019 illustrates the following:
• Piemonte, Valle d’Aosta, Friuli Venezia Giulia and Lazio* are the regions with the lowest incidence of UtP (UtP ratio lower than 3%), whereas Liguria is the region with the highest levels of UtP ratio (7.6%);
• In terms of volumes, the highest UtP concentration is in Lombardy and Lazio (respectively, 25.0% and 15.5% of total volumes).
Chart 19a: UtP ratio by region** (H1-2019) Chart 19b: Breakdown of UtP by region** (H1-2019)
Chart 17: Breakdown of gross Bad Loans by economic sector (H1-2019)
Chart 18: Breakdown of gross Bad Loans by ticket size (H1-2019)
u ce anal n Banca d tal a Banc e e t tu n nan a e c nd n e c t del c ed t e ett e te t e te e te t at n t e eg n a n uenced a a e t e e t t
included in Bank of Italy database; (**) Unique percentage for alle d ta and e nte
2) Abruzzo and Molise 3) Puglia and Basilicata
u ce anal n Banca d tal a Banc e e t tu n nan a e c nd n e c t del c ed t e ett e te t e te e
Note: (**) Unique percentage for alle d ta and e nte
2) Abruzzo and Molise 3) Puglia and Basilicata
u ce anal n Banca d tal a Banc e e t tu n nan a e c nd n e c t del c ed t e ett e te t e te e
u ce anal n Banca d tal a Banc e e t tu n nan a e c nd n e c t del c ed t e ett e te t e te e
4.2%
2.6%
7.6%5.5%
5.5%
2.4% 5.1%
5.9%
4.3%
5.4%
4.4%
5.5%
4.4%
4.0%
< 3%
5-7%
> 7%
3-5%
3.5%
5.7%
2.7%
25.0%
4.1%
3.4%10.4%
7.5%
15.5%1.8%
2.7%
3.5%
4.4%
1.5%5.6%
8.7%
2.3%
< 3%
5-10%
> 10%
3-5%
0.9%
1.5%
1.1%
10%
18%
19%26%
27%
Less than 75k
€ 75k to 250k
€ 250k to 1mln
€ 1mln to 5mln
More than € 5mln
> €1mln: 53%
22%
12%
34%
15%
7%
4%6%
Construction
Real Estate
Manufacturing productsWholesale and retail trade
Professional services
Industrial
Other
Real Estate andConstruction = 34%

PwC | 23
Key Message
During the first months of 2019, figures for Italian companies’ closures continued their declining trend started in 2018, except for voluntary arrangements that showed a sharp increase in H1-2019. Bankruptcies showed a decrease, mainly driven by the constructions and industrial sectors.
n the first half of the decrease of Italian companies’ bankruptcies and forced liquidations kept going on: as shown in Chart 20,
rin the first half of there was respectively a 5.1% drop in bankruptcies and a 43.1% drop in forced liquidations compared to the previous year. Differently, a significant increase has been reported for voluntary arrangements (+18.4%).
Chart 21 shows that the increase of voluntary arrangements in H1-2019 is well distributed in all economic sectors. The industrial sector is the one who shows the highest increase (+28.1% YoY), while services’ sector registers the lower increase (+9.7% YoY).
With respect to non-bankruptcy procee in s the most si nificant reduction has been observed for business closures after forced liquidations (-43.1% YoY), in contrast with previous years’ trend.
Chart 22 shows that bankruptcies in the construction sector reduced by 11.2% in H1-2019 YoY (vs -6.5% in H1-2018 YoY). In the industrial and services sectors the decline in bankruptcies is in line with the previous years’ trend, while other sectors register almost no reduction.
Chart 20: Business closures by procedure (% YoY)
Source: PwC analysis on “Osservatorio su fallimenti, procedure e chiusure di imprese”, Cerved, September 2019 Note: “Voluntary arrangement” = “Concordato preventivo”. "Forced liquidation” = “Liquidazione coatta amministrativa”
Bankruptcies (%) Voluntary arrangements (%)
Forced liquidations (%)
Voluntaryliquidations (%)
H1-2017H1-2018H1-2019
-15.1-5.2 -5.1
-31.1
38.6
18.4
-26.0
-43.1
-15.5-3.7
4.31.2
Chart 21: Voluntary arrangements by economic sector (% YoY)
Source: PwC analysis on “Osservatorio su fallimenti, procedure e chiusure di imprese”, Cerved, September 2019
Chart 22: Bankruptcies by economic sector (% YoY)
Source: PwC analysis on “Osservatorio su fallimenti, procedure e chiusure di imprese”, Cerved, September 2019
Construction (%) Industrial (%) Services (%) Other (%)
H1-2017H1-2018H1-2019
-22.1-33.8
24.5
-23.1
-39.8
28.1
-31.3
9.7
-15.6-24.4
30.0
-41.2
Construction (%) Industrial (%) Services (%) Other (%)
H1-2017H1-2018H1-2019
-18.5-6.5 -11.2
-21.9-12.5
-6.0 -6.4 -3.8 -3.5-12.0 -8.9
-0.6

24 | The Italian NPL market
Focus on GACS
Key Message
On March 2019, the Italian Government renovated the public guarantee on Bad Loans securitization (so-called “GACS”). Undoubtedly,GACS has been an important driver for Bad Loans deleverage and its renewal will be an important boost for the market.However, new rules have increased GACS’ costs and performance requirements that might imply the deferral of mezzanine notes’ interests or the substitution of the NPL servicer (only if the GACS has been activated)

PwC | 25
• The Decree Law n. 22 of 25 March 2019 (the so-called re it ecree ha e a si nificant in ence on on
Performing Exposures. This regulatory change provides valuable inspiration for a prospective evaluation of the phenomenon, also towards a combined reading with the rules introduced by the so-called Code of Corporate Crisis and with those deriving from the EU.
• Decree Law n. 22 of March 25, 2019, in order to allow the development of a secondary market for banks' non-performing loans (and consequently their deleveraging), has extended by 24 months (extendable for a further 12 months) the applicability of the State guarantee mechanism - the so-called GACS - on senior tranches (now rated at least BBB) issued as part of securitization transactions. GACS means the unconditional, irrevocable an pa a le on first eman arantee iss e the Ministry of Economy and Finance (MEF) on senior tranches released under an NPLs credits securitization transactions; through this mechanism, the subscribers of the notes, at the occurrence of the trigger event (i.e. non-payment of interest or repayment of principal by the SPV) will obtain within 120 days from the MEF the payment of the amount due to them.
• It’s reasonable to believe that this measure, in addition to ha in a si nificant effects on the i as sprea of the sale price of the receivables, will, in the short term, allow the sale of NPLs portfolios that have been in stand-by
ntil has ta en place the confirmation of the thir extension (although the trend is decreasing) and at better conditions for investors, hoping, as regards to further regulatory measures, the extension/redetermination of the aforesai arantee to cre it portfolios classifie as Unlikely To Pay.
• ore specificall e can see that the pec liarities of the UtPs, among others, both with regard to the so-called liquidation value (let's think about credit facilities
itho t a si nificant al e real estate n erl in an to the credit recovery methods (i.e. switching from a gone concern approach to a going concern approach focused on the monitoring/amendment of the plan/restructuring agreement and, therefore, characterized by a pro-active management of the receivables) would not be reconciled with a transposition tout court of the GACS scheme intended for the NPLs.
• Finally, it should be noted that the extension of the to the t class o l also ha e si nificant social
an economic impacts in fact ne finance o l e channeled to entrepreneurs who are in a state of corporate crisis i in them a secon chance for the enefit of the whole economic system. This is even clearer if compared with the amendments introduced by the so-called "Code of Corporate Crisis", which implements Law N. 155 of October 19, 2017, and aims, by reforming the insolvency procedures, to discover quickly the corporate crisis through the introduction of early warning obligations for these companies pursuant to art. 2086 c.c. both aimed at enabling an early detection of the crisis and the adoption of the tools necessary to overcome it
Chart 23: Key features of NPE portfolios subject to securitization with GACS
te ecu ed ean ecu t e ac ed t l en and un l en gua antee n eal e tate a et ue date d e ent t e cl ng date
58%
42%
2016 2017 2018 2019 Total
Senior
Mezzanine
Junior
Secured
Unsecured
GBV by type of exposureGBV by issuing date (€bn)*
81%
12%
7%
Nominal value of issued notes
€69bn €16bn
0.58.0
45.8
14.4 68.7€69bn out of ~ €200bn total NPL transactions since 2016
26 | The Italian NPL market
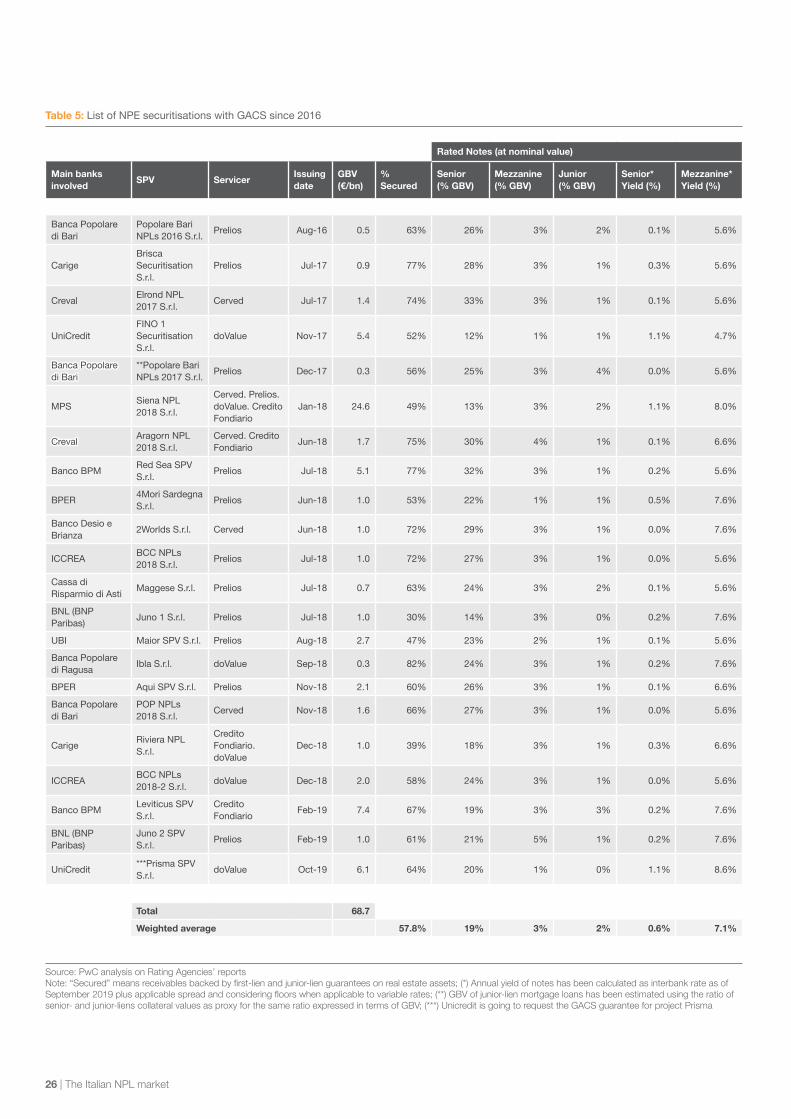
Table 5: List of NPE securitisations with GACS since 2016
Rated Notes (at nominal value)
Main banks involved
SPV ServicerIssuing date
GBV (€/bn)
% Secured
Senior (% GBV)
Mezzanine (% GBV)
Junior (% GBV)
Senior* Yield (%)
Mezzanine* Yield (%)
Banca Popolare di Bari
Popolare Bari NPLs 2016 S.r.l.
Prelios Aug‑16 0.5 63% 26% 3% 2% 0.1% 5.6%
Carige Brisca Securitisation S.r.l.
Prelios Jul‑17 0.9 77% 28% 3% 1% 0.3% 5.6%
Creval Elrond NPL 2017 S.r.l.
Cerved Jul‑17 1.4 74% 33% 3% 1% 0.1% 5.6%
UniCredit FINO 1 Securitisation S.r.l.
doValue Nov‑17 5.4 52% 12% 1% 1% 1.1% 4.7%
Banca Popolare Banca Popolare di Bari di Bari
**Popolare Bari NPLs 2017 S.r.l.
Prelios Dec‑17 0.3 56% 25% 3% 4% 0.0% 5.6%
MPS Siena NPL 2018 S.r.l.
Cerved. Prelios. doValue. Credito Fondiario
Jan‑18 24.6 49% 13% 3% 2% 1.1% 8.0%
Creval Creval Aragorn NPL 2018 S.r.l.
Cerved. Credito Fondiario
Jun‑18 1.7 75% 30% 4% 1% 0.1% 6.6%
Banco BPM Red Sea SPV S.r.l.
Prelios Jul‑18 5.1 77% 32% 3% 1% 0.2% 5.6%
BPER 4Mori Sardegna S.r.l.
Prelios Jun‑18 1.0 53% 22% 1% 1% 0.5% 7.6%
Banco Desio e Brianza
2Worlds S.r.l. Cerved Jun‑18 1.0 72% 29% 3% 1% 0.0% 7.6%
ICCREA BCC NPLs 2018 S.r.l.
Prelios Jul‑18 1.0 72% 27% 3% 1% 0.0% 5.6%
Cassa di Risparmio di Asti
Maggese S.r.l. Prelios Jul‑18 0.7 63% 24% 3% 2% 0.1% 5.6%
BNL (BNP Paribas)
Juno 1 S.r.l. Prelios Jul‑18 1.0 30% 14% 3% 0% 0.2% 7.6%
UBI Maior SPV S.r.l. Prelios Aug‑18 2.7 47% 23% 2% 1% 0.1% 5.6%
Banca Popolare di Ragusa
Ibla S.r.l. doValue Sep‑18 0.3 82% 24% 3% 1% 0.2% 7.6%
BPER Aqui SPV S.r.l. Prelios Nov‑18 2.1 60% 26% 3% 1% 0.1% 6.6%
Banca Popolare di Bari
POP NPLs 2018 S.r.l.
Cerved Nov‑18 1.6 66% 27% 3% 1% 0.0% 5.6%
Carige Riviera NPL S.r.l.
Credito Fondiario. doValue
Dec‑18 1.0 39% 18% 3% 1% 0.3% 6.6%
ICCREA BCC NPLs 2018‑2 S.r.l.
doValue Dec‑18 2.0 58% 24% 3% 1% 0.0% 5.6%
Banco BPM Leviticus SPV S.r.l.
Credito Fondiario
Feb‑19 7.4 67% 19% 3% 3% 0.2% 7.6%
BNL (BNP Paribas)
Juno 2 SPV S.r.l.
Prelios Feb‑19 1.0 61% 21% 5% 1% 0.2% 7.6%
UniCredit ***Prisma SPV S.r.l.
doValue Oct‑19 6.1 64% 20% 1% 0% 1.1% 8.6%
Total 68.7
Weighted average 57.8% 19% 3% 2% 0.6% 7.1%
Source: PwC analysis on Rating Agencies’ reports Note: “Secured” means receivables backed by first-lien and junior-lien guarantees on real estate assets; (*) Annual yield of notes has been calculated as interbank rate as of September 2019 plus applicable spread and considering floors when applicable to variable rates; (**) GBV of junior-lien mortgage loans has been estimated using the ratio of senior- and junior-liens collateral values as proxy for the same ratio expressed in terms of GBV; (***) Unicredit is going to request the GACS guarantee for project Prisma

PwC | 27
Chart 24: Cumulative net collection actual data compared with business plan forecasts
u ce anal n d e t anal n e t e e t a
Below are represented the performances of the 17 out of 19 GACS securitizations realized by the end of 2018
Cumulative Collection Ratio Net
Pop
olar
e B
ari
NP
Ls 2
016
S.r.
l. (1
)
Bris
ca S
ecur
itisa
tion
S.r.
l. (1
)
Cumulative Collection Ratio Net
Elro
nd N
PL
2017
S
.r.l.
(1)
FIN
O 1
Sec
uriti
satio
n S
.r.l.
(1)
Pop
olar
e B
ari
NP
Ls 2
017
S.r.
l. (1
)
Sie
na N
PL
2018
S.r.
l. (2
)
Ara
gorn
NP
L 20
18 S
.r.l.
(2)
Red
Sea
SP
V
S.r.
l. (1
)
4Mor
i Sar
degn
a S
.r.l.
(2)
2Wor
lds
S.r.
l. (2
)
BC
C N
PLs
201
8 S
.r.l.
(1)
Mag
gese
S.r.
l. (1
)
Juno
1 S
.r.l.
(2)
Mai
or S
PV
S.r.
l. (2
)
Aqu
i SP
V S
.r.l.
(1)
PO
P N
PLs
201
8 S
.r.l.
(1)
Riv
iera
NP
L S
.r.l.
(1)
100%
73% 69%
135%127%
114%
98%98%108%
294%
145%
133%140%
111%
97%97% 94%94% 97%97%
139%

28 | The Italian NPL market
Italian Banks Overview

PwC | 29
Gross Bad Loans Ratio (%)
Bad
Loa
ns C
over
age
Rat
io (%
)
Average= 5.8%
Average= 63.9%
CredemISPCariparma
Banco BPM
UBI
0% 1% 2% 3% 4% 5% 6% 7% 8% 9% 10% 11% 12% 13%40%
45%
50%
55%
60%
65%
70%
75%
80%
MPS
BPER
BNLICCREA
UCG
0% 5% 10% 15% 20% 25%30%
35%
40%
45%
50%
55%
60%
65%
70%
Gross NPL Ratio (%)
NP
L C
over
age
Rat
io (%
)
Average= 10.4%
Average= 51.7%Credem BPER MPS
BNL
UCG
Banco BPMUBI
ICCREACariparma
ISP
Chart 25 focuses on the gross NPE ratio and the NPE coverage ratio for the Top 10 Italian banks, which show respectively an average of 10.4% and 51.7%. The differences between banks are clear: on one side MPS shows the highest gross NPE ratio with 16.3% while, on the other side, Credem stands at the lower extreme of 4.4%. Considering the NPE coverage ratio, UniCredit shows the highest value (61.0%) and UBI the lowest (41.0%). However, coverage ratios are not perfectly comparable, as the are in ence se eral factors that are unique in every bank, such as write-off policies, weight of secured component and portfolio vintage (time since default date).
The same analysis is reproduced considering the gross Bad Loans ratio and the Bad Loans coverage ratio (Chart 26). Also in this case there are differences among the Top 10 Italian banks: BNL reached the peak of gross Bad Loans ratio at 9.2% and Credem, the lowest, reported a 2.7% (the average stands at 5.8%). Coverage ratio ranges between 72.2% (UniCredit) and 51.8% (UBI); average stands at 63.9%.
Chart 25: Top 10 Italian banks – NPE Peer Analysis as of H1-2019 (Bubble size: gross NPE)
Chart 26: Top 10 Italian banks – Bad Loans Peer Analysis as of H1-2019 (Bubble size: gross Bad Loans)
u ce anal n nanc al tate ent and anal t e entat n ata a ected d e ent te policies. Totals as simple average of ratios Note: data of BNL as of YE-2018
u ce anal n nanc al tate ent and anal t e entat n ata a ected d e ent te policies. Totals as simple average of ratios Note: data of BNL as of YE-2018

30 | The Italian NPL market
Gross Past Due Ratio (%)
Pas
t Due
Cov
erag
e R
atio
(%)
Average= 0.17%
Average= 19.6%
ISP
Cariparma
Banco BPM
ICCREABPER
UBI
0.0% 0.1% 0.1% 0.2% 0.2% 0.3% 0.3% 0.4% 0.4% 0.5% 0.5% 0.6% 0.6%
0%
5%
10%
15%
20%
25%
30%
35%
40%
Credem UCG
BNL
MPS
Chart 27 provides a snapshot for the Unlikely to Pay ratio and its coverage ratio The a era e for the first ratio is 4.5%, with MPS peaking at 7.6% and Credem being the lowest one with 1.6%. The Unlikely to Pay coverage ratio average is 36.6%: UCG is at the top with 47.9% and UBI at the bottom with 26.9%.
Chart 28 illustrates the gross Past Due ratio and the coverage ratio for the banks analyzed. Iccrea records the highest gross Past Due ratio reaching 0.53% while Cariparma the lowest at 0.06%. The relative coverage ratio indicates two peaks: on one side UniCredit with 31.2% and on the other side 10.7% with UBI. The average reaches 19.6%.
Chart 27: Top 10 Italian banks – Unlikely to Pay Peer Analysis as of H1-2019 (Bubble size: gross Unlikely to Pay)
Chart 28: Top 10 Italian banks – Past Due Peer Analysis as of H1-2019 (Bubble size: gross Past Due)
u ce anal n nanc al tate ent and anal t e entat n ata a ected d e ent te policies. Totals as simple average of ratios Note: data of BNL as of YE-2018
u ce anal n nanc al tate ent and anal t e entat n ata a ected d e ent te policies. Totals as simple average of ratios Note: data of BNL as of YE-2018
Gross Unlikely to Pay Ratio (%)
Unl
ikel
y to
Pay
Cov
erag
e R
atio
(%)
Average= 4.5%
Average= 36.6%ISP
Banco BPM
BPER ICCREA
UBI
UCG
BNL
0% 1% 2% 3% 4% 5% 6% 7% 8% 9% 10% 11%
10%
15%
20%
25%
30%
35%
40%
45%
50%
55%
MPS
Credem
Cariparma
BNL

PwC | 31
Chart 29 analyses, for the Top 10 Italian banks, the movements in the gross Bad Loans Ratio and the Bad Loans coverage ratio between YE-2018 and H1-2019. At H1-2019 the average gross Bad Loans ratio reaches 5.8%, whereas the coverage ratio stands at 63.9%. The snapshot indicates most of the Top 10 Italian banks that improved their gross Bad
oans ratios rin first half an their Bad Loans’ coverage remained stable.
Chart 30, almost all Top 10 Italian banks analysed experienced a decrease in the gross Unlikely to Pay ratio and an increase in the Unlikely to Pay coverage ratio. At H1-2019 the average gross Unlikely to Pay ratio stands at 4.5%, while the Unlikely to Pay coverage ratio is 36.6%.
Chart 29: Top 10 Italian banks – Bad Loans movements (YE-2018 vs H1-2019)
Chart 30: Top 10 Italian banks – Unlikely to Pay movements (YE-2018 vs H1-2019)
u ce anal n nanc al tate ent and anal t e entat n ata a ected d e ent te policies. Totals as simple average of ratios
te data B a and data cc ea a
u ce anal n nanc al tate ent and anal t e entat n ata a ected d e ent te policies. Totals as simple average of ratios
te data B a and data cc ea a
Average= 5.8%
Average= 63.9%ISP
Banco BPM
BPER
UBI
UCG
MPS
BNL
Credem Cariparma
Gross Bad Loans Ratio (%)
Bad
Loa
ns C
over
age
Rat
io (%
)
0% 1% 2% 3% 4% 5% 6% 7% 8% 9% 10% 11% 12% 13% 14% 15% 16%
40%
45%
50%
55%
60%
65%
70%
75%
80%
YE-2018 H1-2019
ICCREA
Average= 4.5%
Average= 36.6%ISP
Banco BPM
ICCREA
BPER
UBI
UCG
BNL
MPS
Credem
Cariparma
Gross Unlikely to Pay Ratio (%)
Unl
ikel
y to
Pay
Cov
erag
e R
atio
(%)
0% 2% 4% 6% 8% 10% 12%0%
5%
10%
15%
20%
25%
30%
35%
40%
45%
50%
YE-2018 H1-2019
32 | The Italian NPL market
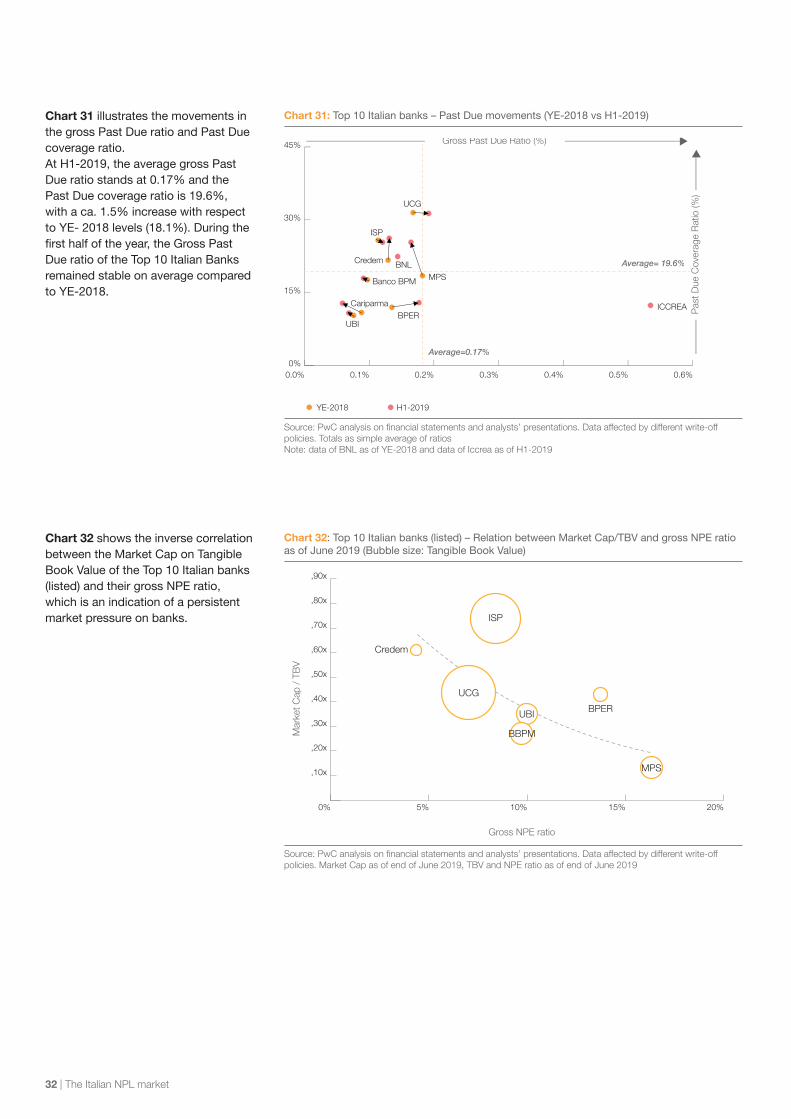
Chart 31 illustrates the movements in the gross Past Due ratio and Past Due coverage ratio. At H1-2019, the average gross Past Due ratio stands at 0.17% and the Past Due coverage ratio is 19.6%, with a ca. 1.5% increase with respect to YE- 2018 levels (18.1%). During the first half of the ear the ross ast Due ratio of the Top 10 Italian Banks remained stable on average compared to YE-2018.
Chart 32 shows the inverse correlation between the Market Cap on Tangible Book Value of the Top 10 Italian banks (listed) and their gross NPE ratio, which is an indication of a persistent market pressure on banks.
Chart 31: Top 10 Italian banks – Past Due movements (YE-2018 vs H1-2019)
Chart 32: Top 10 Italian banks (listed) – Relation between Market Cap/TBV and gross NPE ratio as of June 2019 (Bubble size: Tangible Book Value)
u ce anal n nanc al tate ent and anal t e entat n ata a ected d e ent te policies. Totals as simple average of ratios
te data B a and data cc ea a
u ce anal n nanc al tate ent and anal t e entat n ata a ected d e ent te policies. Market Cap as of end of June 2019, TBV and NPE ratio as of end of June 2019
Average=0.17%
Average= 19.6%
ISP
Banco BPM
ICCREABPER
UBI
UCG
BNLMPS
Credem
Cariparma
Gross Past Due Ratio (%)
Pas
t Due
Cov
erag
e R
atio
(%)
0.0% 0.1% 0.2% 0.3% 0.4% 0.5% 0.6%0%
15%
30%
45%
YE-2018 H1-2019
Gross NPE ratio
0% 5% 10% 15% 20%
,10x
,20x
,30x
,40x
,50x
,60x
,70x
,80x
,90x
Credem
ISP
UCG
UBI
BBPM
BPER
MPS
PwC | 33
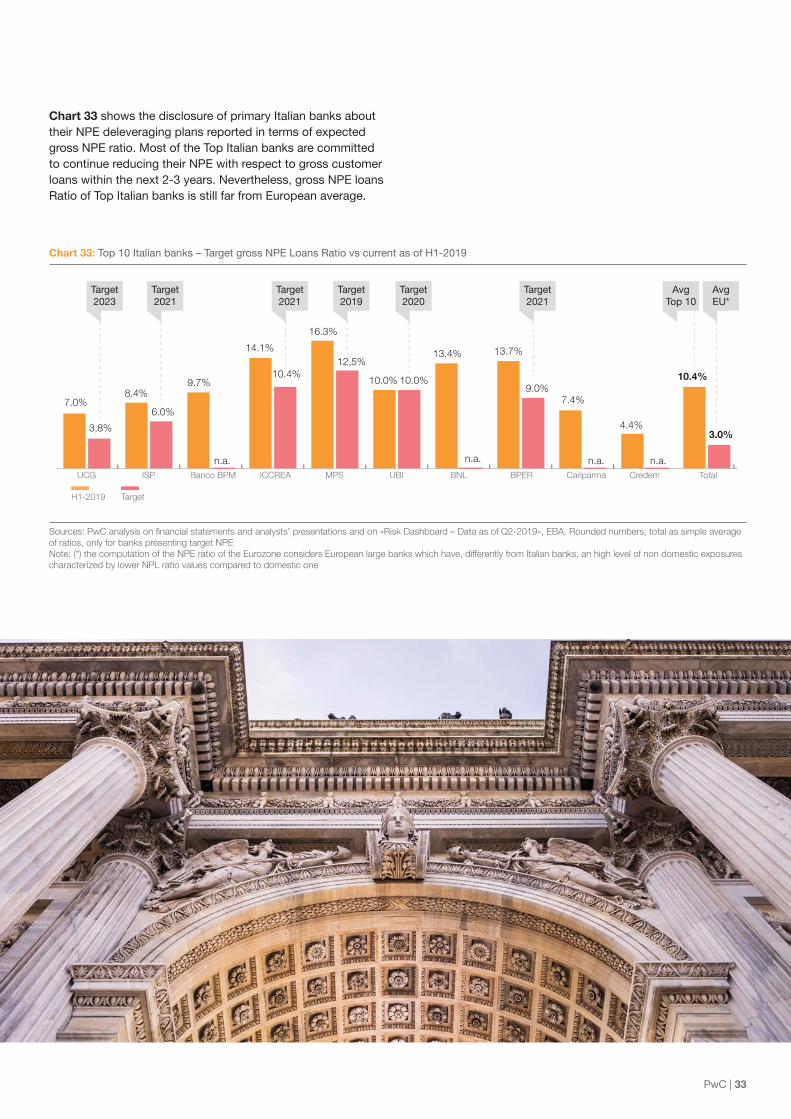
Chart 33: Top 10 Italian banks – Target gross NPE Loans Ratio vs current as of H1-2019
u ce anal n nanc al tate ent and anal t e entat n and n a a d ata a B unded nu e t tal a le a e age of ratios, only for banks presenting target NPE Note: (*) the computation of the NPE ratio of the Eurozone considers European large banks which have, differently from Italian banks, an high level of non domestic exposures characterized by lower NPL ratio values compared to domestic one
UCG ISP ICCREABanco BPM MPS UBI BNL BPER Cariparma Credem Total
7.0%
3,8%
8.4%
14.1%
10.4%
16.3%
12.5%
10.0% 10.0%
13.4%
n.a.
13.7%
9.0%10.4%
3.0%4.4%
7.4%6.0%
9.7%
n.a.n.a. n.a. n.a. n.a.n.a.
H1-2019 Target
Target2023
Target2021
Target2019
Target2020
Target2021
Avg EU*
Avg Top 10
Target2021
Chart 33 shows the disclosure of primary Italian banks about their NPE deleveraging plans reported in terms of expected gross NPE ratio. Most of the Top Italian banks are committed to continue reducing their NPE with respect to gross customer loans within the next 2-3 years. Nevertheless, gross NPE loans Ratio of Top Italian banks is still far from European average.

34 | The Italian NPL market
Focus on Italian UtP market
Key Message
At H1-2019, banks’ UtP exposure amounted to €73bn, (GBV) 81% of which is concentrated within the top 10 banks. Due to the lower decline in UtP with respect to Bad Loans, the proportion of the former compared to total NPE has been increasing: the next banks’ efforts in improving their asset quality will inevitably be determined by the management of UtP.
PwC | 35
Our view
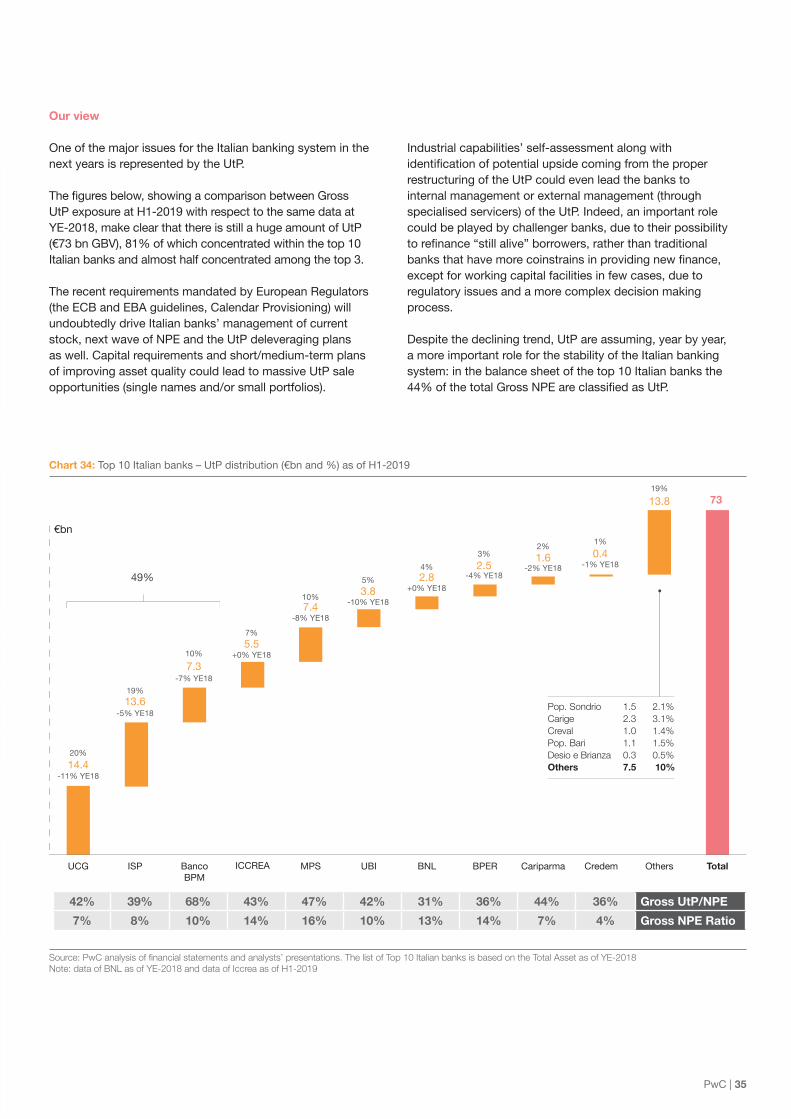
One of the major issues for the Italian banking system in the next years is represented by the UtP.
The fi res elo sho in a comparison et een ross UtP exposure at H1-2019 with respect to the same data at YE-2018, make clear that there is still a huge amount of UtP (€73 bn GBV), 81% of which concentrated within the top 10 Italian banks and almost half concentrated among the top 3.
The recent requirements mandated by European Regulators (the ECB and EBA guidelines, Calendar Provisioning) will undoubtedly drive Italian banks’ management of current stock, next wave of NPE and the UtP deleveraging plans as well. Capital requirements and short/medium-term plans of improving asset quality could lead to massive UtP sale opportunities (single names and/or small portfolios).
Industrial capabilities’ self-assessment along with i entification of potential psi e comin from the proper restructuring of the UtP could even lead the banks to internal management or external management (through specialised servicers) of the UtP. Indeed, an important role could be played by challenger banks, due to their possibility to refinance still ali e orro ers rather than tra itional
an s that ha e more coinstrains in pro i in ne finance except for working capital facilities in few cases, due to regulatory issues and a more complex decision making process.
Despite the declining trend, UtP are assuming, year by year, a more important role for the stability of the Italian banking system: in the balance sheet of the top 10 Italian banks the
of the total ross are classifie as t
Chart 34: Top 10 Italian banks – UtP distribution (€bn and %) as of H1-2019
u ce anal nanc al tate ent and anal t e entat n e l t tal an an a ed n t e tal et a te data B a and data cc ea a
73
14.4
13.6
7.3
5.5
7.43.8
2.82.5
1.6 0.4
-11% YE18
20%
19%
-5% YE18
10%
-7% YE18
7%
10%
-8% YE18
4%
+0% YE185%
-10% YE18
3%
-4% YE18
2%
-2% YE18
1%
-1% YE18
19%
13.8
+0% YE18
Others TotalUCG BancoBPM
ICCREA MPS UBI CariparmaBPERBNL CredemISP
Pop. Sondrio 1.5 2.1%Carige 2.3 3.1%Creval 1.0 1.4%Pop. Bari 1.1 1.5%Desio e Brianza 0.3 0.5%Others 7.5 10%
49%
€bn
42% 39% 68% 43% 47% 42% 31% 36% 44% 36% Gross UtP/NPE
7% 8% 10% 14% 16% 10% 13% 14% 7% 4% Gross NPE Ratio

36 | The Italian NPL market
Key Message
The UtP average coverage ratio of the Top 10 Italian banks reached 36.6% (35.9% in 2018) while their ratio on total loans declined from 4.7% to 4.5%. Italian banks are continuing on the right path but further efforts are required.
UtP Coverage ratios vs. gross UtP ratios
All top 10 Italian banks featured higher provisions of UtP in H1-2019 vs YE-2018, resulting in higher coverage ratios (avg. 36.6% in H1-2019 vs 35.9% in YE-2018).
During 2019, banks have been following their deleveraging plans, reducing their average gross UtP ratio from 4.7% at YE-2018 to 4.5% at H1-2019. Recent market trends are characterized by the setup of deleveraging strategies and reclassifications to a oans in terms of t stoc the
eclinin tren sho e in remaine sta le in the first half of 2019.
Leading banks which are reducing their Gross UtP ratio are MPS (-0.7% vs 2018) and Banco BPM (-0.5% vs 2018), mainly thanks to the disposal projects carried out in 2019.
Chart 35: Top 10 Italian banks – UtP movements (YE-2018 vs H1-2019)
u ce anal n nanc al tate ent and anal t e entat n unded nu e t tal a le a e age at te data B a and data cc ea a
R² = 58%
Gross UtP Ratio (30/06/2019)
Avg. Top 10(36.6%)
Avg. Top 10(4.5%)
0% 2% 4% 6% 8% 10% 12%10%
15%
20%
25%
30%
35%
40%
45%
50%
55%
Credem
Shift (YE-2018 vs H1-2019)
UCG
UtP
Cov
erag
e R
atio
(30/
06/2
019)
Bubble size: Unlikely to Pay gross exposure YE 2018
Bubble size: Unlikely to Pay gross exposure H1-2019
Cariparma
Banco BPM
ISP
UBI
BNL BPER
MPS
ICCREA

PwC | 37
Key Message
Despite the decline in UtP of €55bn from Q1-2015 to Q2-2019, exposures subject to forbearance measures decreased. Since 2015, the proportion of forborne exposures has increased over time and forbearance ratio is 51% in H1-2019 (showing a slight decline from the peak of 53% of Q3-2018). However, still 49% of UtP are devoided of any agreement as of H1-2019.
Chart 36: Italian banks’ forborne UtP exposures (€bn)
u ce anal n Banca d tal a Banc e e t tu n nan a e c nd n e c t del c ed t e ett e te t e te e
Forbearance No Forbearance
31% 32%
37% 40% 41%
47% 48% 48% 50% 51% 51% 52% 52% 53% 51% 51%
69% 68% 63%
60% 59%
53% 52% 52% 50% 49% 49% 48% 48% 47% 49% 49%
128 128 129 127 125
42%
58%
123 120 117 116 104 99 94 91 86 83 79 76
51%
49%
73
Q1-15 Q4-15Q2-15 Q3-15 Q1-16 Q2-16 Q3-16 Q4-16 Q1-17 Q2-17 Q3-17 Q4-17 Q1-18 Q2-18 Q3-18 Q4-18 Q1-19 Q2-19
Forbearance Ratio =Forborne UtP exposures
Total UtP exposures

38 | The Italian NPL market
Key Message
In 2019 UtP transactions have been quite limited in terms of both frequency and volumes. However, some banks have announced Jumbo sales of UtP portfolios for the next year: due to the weight of UtP stock over total NPE, the ongoing and forthcoming market might be characterised by larger and more frequent deals.
Table 6: Main UtP* loan sale transactions as of November 2019
The UtP market has been moving towards transactions of larger portfolios
rin first half of e o ser e t transactions mainly involving top-tier banks, and the vast majority concerning Real-Estate secured portfolios. Major UtP disposal projects have been promoted and closed by Intesa Sanpaolo and MPS.
UtP deleverage is becoming crucial for Italian banks’ asset quality, also considering that UtP reached and even surpassed the levels of Bad Loans in terms of NBV. Banks now are moving towards complex and larger deals involving “pure” UtP portfolio, subject to differentiated and structured deleveraging strategies.
Project n.a.Papa 2Project M Lima 2Quebec 2
Seller MPSMPSIntesa Sanpaolo MPSMPS
Buyer n.a. Cerberus DK / Prelios BofA Merril Lynch illimity
Portfolio Secured
2019 Q3
202
Secured
2019 Q3
455
Mixed Secured/Unsecured
2019 Q3
3,000
Secured
2019 Q3
130
Mainly Unsecured
2019 Q3
450
P / GBV n.a.n.a.67% n.a.n.a.
Collateral RERERE REn.a.
GBV [€m]
Total
€4.2bn
Source: PwC estimates on public information and market rumours. Analysis on loan sale transactions, without considering structured ones, such as restructuring funds and synthetic securitizations Note: (*) Considering only 100% UtP portfolios and mixed portfolios mainly composed of UtP

PwC | 39
Table 7: UtP market pipeline: main announced UtP* transactions and market rumors as of November 2019
Project
Pipeline Ongoing
n.a.
MPS
MPS
UtP
n.a.
Project Dawn
UniCredit
UniCredit
UtP
n.a.
n.a.
CreVal
CreVal
Bad Loans & UtP
n.a.
Project Sandokan 2
UniCredit
UniCredit
UtP
RE
Hydra + Other
Banca Carige
Banca Carige
Bad Loans & UtP
n.a.
Portfolio
Seller
Collateral
GBV [€m]
Total
€14.3 bn
Source: PwC estimates on public information and market rumours. Analysis on loan sale transactions, without conside-ring structured ones, such as restructuring funds and synthetic securitizations Note: (*) Considering only 100% UtP portfolios and mixed portfolios mainly composed of UtP
7,000
1,100800
2,000
3,360

40 | The Italian NPL market
The Servicing Market
Key Message
We believe that a possibility for big players to consolidate other existing players is on the way. A comparable pattern has been observed in more mature European countries (such as Spain and Nordics), which reinforces our outlook on the Italian landscape.
Multiples trends are changing dominating business models in credit management: • Separation
between servicing and purchasing capabilities
• Need for access to investment/ lending capabilities
• Demand for 360° NPE management capabilities
• Technological innovation and transformation

PwC | 41
On-going dynamics and outlook
The Italian credit servicing market has experienced significant change over recent years with a radical review of the competitive landscape as the volume of NPE transactions has grown.
The market, once dominated by small-size loan collectors, is increasingly concentrated among the largest players.
We believe that a possibility for big players to consolidate other existing players is on the way. A comparable pattern has been observed in more mature European countries (such as Spain and Nordics), which reinforces our outlook on the Italian landscape.
Servicers could also leverage M&A options to expand into unripe geographies (i.e. Greece) now offering important opportunities in terms of size and competition that might rationalize an international venture.
In the medium /long term, large private equity and hedge funds, today present in the market, may leave room to large scale comprehensive international servicing platforms which can leverage on strong economies of scale, competence and commercial presence.
In this context, we believe that strong specialization in specific geographies or asset classes will continue to be a sustainable differentiating factor for small-medium size players.
Key business model trends
Multiples trends are changing dominating business models in credit management:
• Separation between servicing and purchasing capabilities: the market is experiencing a clear trend towards separation of pure servicing activities from capital-intensive ones (i.e. debt purchasing and new lending), in line with doValue recent reorganization;
• Need for access to investment/ lending capabilities: given new market expectations, successful credit servicing players need to be part of an ecosystem supporting pure servicing expertise with new lending capabilities and possibility to participate in large NPL sales;
• Demand for 360° NPE management capabilities: market is asking for capacity to manage both bad loans an T re irin not onl financin an refinancin capabilities but also industry expertise, restructuring/ turnaround and legal skills and advisory approach. In addition, active management of collateralized exposures require strong real estate capabilities.
In the medium-long term, the largest credit servicing players may enlarge their business towards tech capabilities and with a wider product suite of business process outsourcing services.
Positioning of main credit servicing players by business model and asset size (data at H1-2019)
0 5 10 15 20 25 30 35 40 45 75 100-20
-10
0
10
20
30
40
50
60
290
720
1,840
1,850
21,315
nt
Aurora - RE
Prelios
e ed ed t anage ent
SistemiaB Banca
IntrumNeprix
ll t Ban
AMCO
Guber
u a act ld ng a cala
c ne
e n
d anc ng adeu e ce
IFIS Npl
n e t
Hoist nance
MB CreditSolutions
Credito Fondiario
H1-2019 Revenues
Large tickets secured
Small ticketsunsecured
«Pure servicers» Integrated players(debt purchaser)
Average Ticket(GBV / # of loans - €k)
Owned portfolio(GBV / # of loans - €k)
Aquileia Capital Services
Fire
Crif
Ge.RiWhiteStar
u
Fides
doValue
Bank of Italy Surveillance
106/115115106Bank
42 | The Italian NPL market
Technology innovation in the industry
The credit servicing Industry is still a human intensive business due to the need for a portfolio manager to directly handle the case mostly across the entire value chain of the credit recovery.
However, the credit servicing industry is quite active in the field of technology innovation that could affect the operational effectiveness of the Industry and the annexed performance.
Hereunder some of the key elements to be taken into account:
• Portfolios On-Boarding rtificial intelli ence is a le to speed up the acquisition of portfolios thanks to automatic checks, information / data feeds, automatic reconciliation etc. We see a trend of adoption of these tools by the players in the Servicing Industry; by the way there is still a large room of achievable improvements (with impact on people reduction).
• Forecasting and NBA (next best action): Data analytics tools are able to support portfolio managers to execute the best action for case handling. This element co l impl a i resh f e of the ser icin industry. The maturity of these techniques is still at the early phase.
• Data Mining: effective data mining techniques and tools are able to support the execution of activities and decision taking. For example, in Spain, servicers invested in the Real Estate Field with good results using data mining techniques.
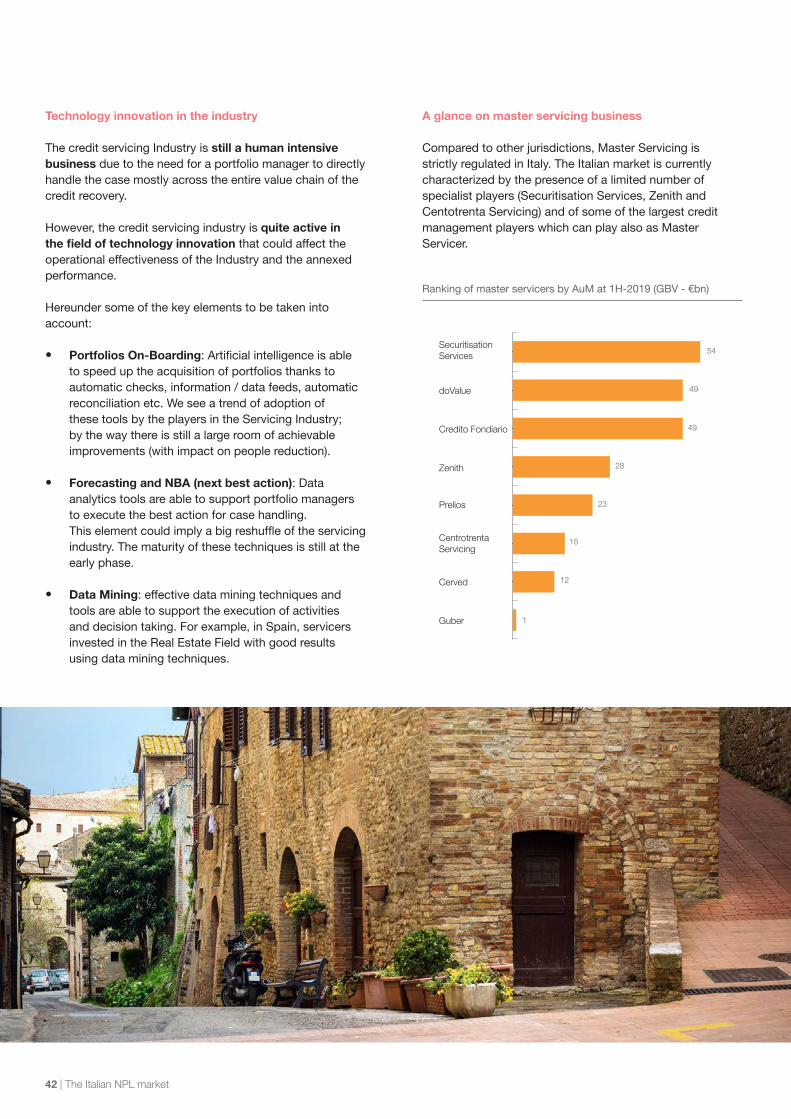
A glance on master servicing business
Compared to other jurisdictions, Master Servicing is strictly regulated in Italy. The Italian market is currently characterized by the presence of a limited number of specialist players (Securitisation Services, Zenith and Centotrenta Servicing) and of some of the largest credit management players which can play also as Master Servicer.
Ranking of master servicers by AuM at 1H-2019 (GBV - €bn)
SecuritisationServices
doValue
Credito Fondiario
Zenith
Prelios
CentrotrentaServicing
Cerved
Guber
54
49
49
28
23
15
12
1
PwC | 43
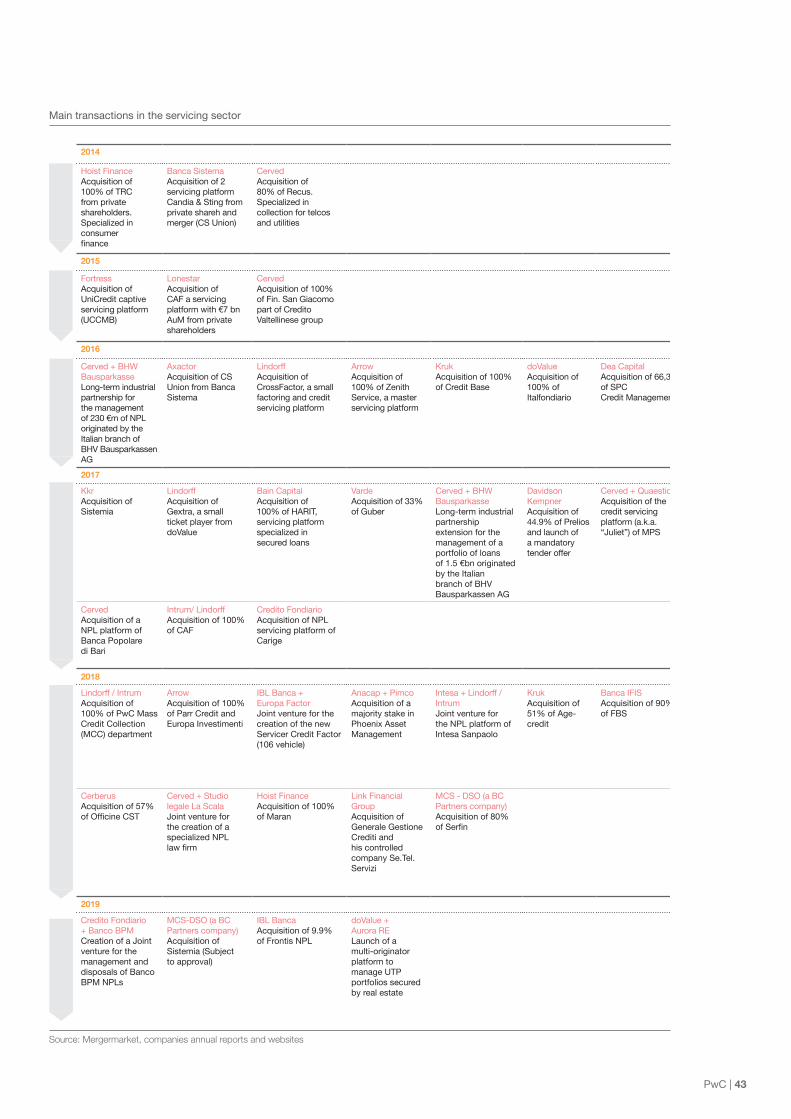
Main transactions in the servicing sector
Source: Mergermarket, companies annual reports and websites
2014
Hoist FinanceAcquisition of100% of TRCfrom privateshareholders.Specialized inconsumerfinance
Banca SistemaAcquisition of 2servicing platform Candia & Sting from private shareh and merger (CS Union)
CervedAcquisition of80% of Recus.Specialized in collection for telcos and utilities
2015
FortressAcquisition ofUniCredit captive servicing platform (UCCMB)
LonestarAcquisition ofCAF a servicingplatform with €7 bn AuM from private shareholders
CervedAcquisition of 100% of Fin. San Giacomo part of Credito Valtellinese group
2016
Cerved + BHW Bausparkasse Long-term industrial partnership for the management of 230 €m of NPL originated by the Italian branch of BHV Bausparkassen AG
AxactorAcquisition of CS Union from Banca Sistema
LindorffAcquisition ofCrossFactor, a small factoring and credit servicing platform
ArrowAcquisition of100% of ZenithService, a master servicing platform
KrukAcquisition of 100% of Credit Base
doValueAcquisition of100% of Italfondiario
Dea CapitalAcquisition of 66,3% of SPCCredit Management
2017
KkrAcquisition ofSistemia
LindorffAcquisition ofGextra, a smallticket player from doValue
Bain CapitalAcquisition of100% of HARIT,servicing platformspecialized insecured loans
VardeAcquisition of 33% of Guber
Cerved + BHW Bausparkasse Long-term industrial partnership extension for the management of a portfolio of loans of 1.5 €bn originated by the Italian branch of BHV Bausparkassen AG
Davidson KempnerAcquisition of 44.9% of Prelios and launch of a mandatory tender offer
Cerved + QuaestioAcquisition of the credit servicing platform (a.k.a. “Juliet”) of MPS
CervedAcquisition of a NPL platform of Banca Popolare di Bari
Intrum/ LindorffAcquisition of 100% of CAF
Credito FondiarioAcquisition of NPL servicing platform of Carige
2018
Lindorff / IntrumAcquisition of 100% of PwC Mass Credit Collection (MCC) department
ArrowAcquisition of 100% of Parr Credit and Europa Investimenti
IBL Banca + Europa FactorJoint venture for the creation of the new Servicer Credit Factor(106 vehicle)
Anacap + PimcoAcquisition of a majority stake in Phoenix Asset Management
Intesa + Lindorff / IntrumJoint venture for the NPL platform of Intesa Sanpaolo
KrukAcquisition of 51% of Age-credit
Banca IFISAcquisition of 90% of FBS
CerberusAcquisition of 57% of ffi cine T
Cerved + Studio legale La ScalaJoint venture for the creation of a specialized NPL la fi rm
Hoist FinanceAcquisition of 100% of Maran
Link Financial GroupAcquisition of Generale Gestione Crediti and his controlled company Se.Tel. Servizi
MCS - DSO (a BC Partners company)Acquisition of 80% of erfi n
2019
Credito Fondiario+ Banco BPMCreation of a Joint venture for the management and disposals of Banco BPM NPLs
MCS-DSO (a BC Partners company)Acquisition of Sistemia (Subject to approval)
IBL BancaAcquisition of 9.9% of Frontis NPL
doValue + Aurora RE Launch of a multi-originator platform to manage UTP portfolios secured by real estate

44 | The Italian NPL market
Table 8: Overview of main servicers (data at 30/06/2019) – Ranking by Total Special Servicing AuM
CompanyBank of Italy Surveillance
Total AuM1 (€bn)
o/w Bad Loans AuM (€bn)
o/w Other NPLs AuM2 (€bn)
Performing AuM (€bn)
Master Servicing AuM (€bn)
Revenues (€m)
Ebitda (€m)
Debt servicing & collection
Debt purchasing
Master servicing
Rating
doValue 115/106 78.6 76.2 2.4 0.9 48.9 112.2 39.1 • • •
Cerved Credit Management
106/115 44.2 41.9 2.3 8.7 11.6 86.7 30.2 • • •
Intrum 115 41.1 41.1 - ‑ ‑ n.a. n.a. • •
IFIS Npl Bank 22.8 22.7 0.1 ‑ ‑ 180.34 118.8 • • •
AMCO 106 20.3 11.9 8.4 ‑ ‑ 29.34 3.3 • • •
Prelios Credit Servicing
106 19.9 19.7 0.3 0.0 23.4 29.8 13.9 • • •
Credito Fondiario Bank 16.9 16.2 0.8 0.1 48.5 31.44 22.2 • • • •
Sistemia 115 9.5 9.0 0.5 ‑ ‑ 13.2 8.6 • •
Crif 115 9.3 3.2 6.2 4.5 ‑ 12.0 n.a. • •
Phoenix Asset Management
115 9.0 8.8 0.2 0.0 ‑ 3.7 1.9 •
MB Credit Solutions 106 7.6 7.6 - ‑ ‑ 43.34 17.5 • •
Guber Bank 7.1 7.1 - ‑ 1.4 26.34 14.6 • • • •
Fire 115 6.7 4.1 2.6 5.4 ‑ 24.34 2.2 • • •
J‑Invest 106/115 5.4 5.4 - ‑ ‑ 6.74 4.0 • •
Neprix (Illimity Bank) 115/Bank 4.83 4.8 n.a. n.a. n.a. 13.74 n.a. • • •
AZ Holding & La Scala
115 4.0 3.9 0.1 ‑ ‑ 9.34 n.a. •
Finint Revalue 115 3.7 3.2 0.5 ‑ ‑ 7.6 n.a. •
CNF (Gruppo Frascino)
115 3.4 3.1 0.4 ‑ ‑ 8.6 2.8 • •
Duepuntozero 115 3.3 3.3 - ‑ ‑ ‑ ‑ •
Frontis NPL 115 3.3 2.3 1.0 ‑ ‑ 7.0 4.8 •
Advancing Trade 106/115 3.1 3.1 0.1 1.2 ‑ 18.74 4.5 • •
Link Financial 115 3.0 2.7 0.4 0.0 ‑ 3.7 ‑ •
WhiteStar Asset Solutions (Arrow Group)
115 2.7 2.4 0.3 0.3 ‑ n.a. n.a. •
Aquileia Capital Services
106/115 2.6 1.6 1.1 0.0 ‑ 4.74 1.5 • •
Europa Factor 106/115 2.4 2.4 0.0 0.3 ‑ 11.13 1.5 • •
Blue Factor 106 2.1 2.1 - ‑ ‑ 1.64 0.6 • •
Aurora RE 115 1.8 0.2 1.6 ‑ ‑ 3.7 3.0 •
Link Asset Services 115 1.5 1.3 0.2 ‑ ‑ 1.8 n.a. • •
Officine CST 115 1.5 1.0 0.5 0.6 ‑ 7.54 2.1 • •
SiCollection 115 1.5 1.5 - ‑ ‑ 2.9 n.a. •
Axactor 106/115 1.4 1.4 - ‑ ‑ 11.33 ‑ • •
CSS 115 1.2 1.0 0.2 ‑ ‑ 4.6 0.8 •
Bayview Italia 115 1.0 1.0 - ‑ ‑ n.a. n.a. •
Securitization Services
106 0.8 0.6 0.3 2.6 54.5 12.3 6.5 • • •
Euro Service 115 0.8 0.8 - ‑ ‑ 7.64 0.2 • •
Ge.Ri 115 0.7 - 0.7 0.1 ‑ 10.1 0.2 • •
Fides 115 0.7 0.5 0.2 0.3 ‑ 7.3 1.8 •
Serfin 115 0.3 0.2 0.1 0.2 ‑ 6.43 1.1 •
Certa Credita 115 0.1 0.1 0.0 0.1 ‑ 2.8 0.5 • • •
Centotrenta Servicing 106 ‑ - - ‑ 14.9 4.6 1.4 • •
Zenith Service (Arrow Group)
106 ‑ - - ‑ 28.4 n.a. n.a. • • •
Source: PwC analysis on data provided by Servicers as of 30/06/2019; data have been directly provided by Servicers and have not been verified by PwC. Servicers present highly heterogeneous organizational, industrial and operating structures. Comparing the information presented above requires a correct analysis and understanding of the competitive landscape and servicers business model 1 Includes both owned and third parties portfolios 2 Includes Unlikely to Pay + Past Due more than 90 days 3 Refers to originated business: includes the origination/purchase of income-producing loans and NPL investments, and deals signed but yet to be booked, owing to a settle-ment structure in multiple tranches or to a time lag between the signing of the master agreement and the date of loan disbursement/onboarding. The AUM of Neprix includes the gross nominal value of NPL purchased and the value of property & capital goods managed by IT Auction. 4 Includes both revenues from Special servicing activities both income from the management of owned portfolios Note: Double counting may arise when adding NPL AuM as some servicers outsource part of their portfolios to others due to capacity and/or specialization issues
Special Servicing Main Activities
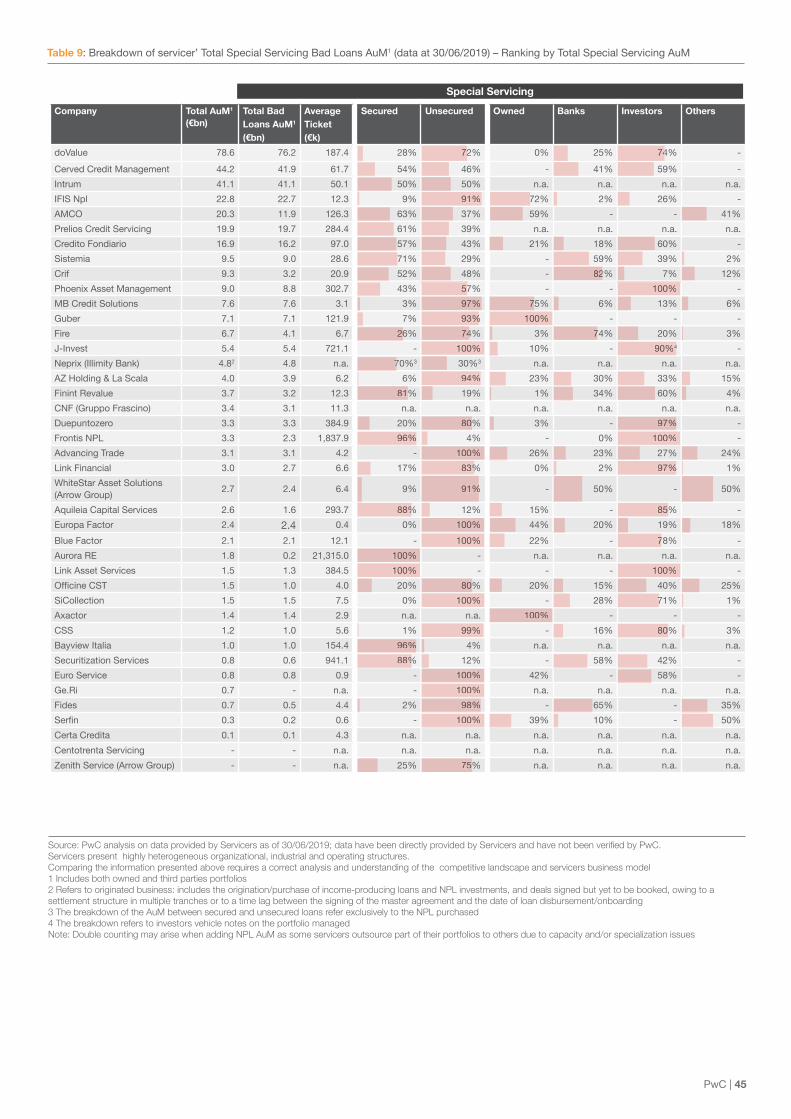
PwC | 45
Table 9: Breakdown of servicer’ Total Special Servicing Bad Loans AuM1 (data at 30/06/2019) – Ranking by Total Special Servicing AuM
Company Total AuM1 (€bn)
Total Bad Loans AuM1 (€bn)
Average Ticket (€k)
Secured Unsecured Owned Banks Investors Others
doValue 78.6 76.2 187.4 28% 72% 0% 25% 74% -
Cerved Credit Management 44.2 41.9 61.7 54% 46% - 41% 59% -
Intrum 41.1 41.1 50.1 50% 50% n.a. n.a. n.a. n.a.
IFIS Npl 22.8 22.7 12.3 9% 91% 72% 2% 26% -
AMCO 20.3 11.9 126.3 63% 37% 59% - - 41%
Prelios Credit Servicing 19.9 19.7 284.4 61% 39% n.a. n.a. n.a. n.a.
Credito Fondiario 16.9 16.2 97.0 57% 43% 21% 18% 60% -
Sistemia 9.5 9.0 28.6 71% 29% - 59% 39% 2%
Crif 9.3 3.2 20.9 52% 48% - 82% 7% 12%
Phoenix Asset Management 9.0 8.8 302.7 43% 57% - - 100% -
MB Credit Solutions 7.6 7.6 3.1 3% 97% 75% 6% 13% 6%
Guber 7.1 7.1 121.9 7% 93% 100% - - -
Fire 6.7 4.1 6.7 26% 74% 3% 74% 20% 3%
J-Invest 5.4 5.4 721.1 - 100% 10% - 90%4 -
Neprix (Illimity Bank) 4.82 4.8 n.a. 70%3 30%3 n.a. n.a. n.a. n.a.
AZ Holding & La Scala 4.0 3.9 6.2 6% 94% 23% 30% 33% 15%
Finint Revalue 3.7 3.2 12.3 81% 19% 1% 34% 60% 4%
CNF (Gruppo Frascino) 3.4 3.1 11.3 n.a. n.a. n.a. n.a. n.a. n.a.
Duepuntozero 3.3 3.3 384.9 20% 80% 3% - 97% -
Frontis NPL 3.3 2.3 1,837.9 96% 4% - 0% 100% -
Advancing Trade 3.1 3.1 4.2 - 100% 26% 23% 27% 24%
Link Financial 3.0 2.7 6.6 17% 83% 0% 2% 97% 1%
WhiteStar Asset Solutions (Arrow Group)
2.7 2.4 6.4 9% 91% - 50% - 50%
Aquileia Capital Services 2.6 1.6 293.7 88% 12% 15% - 85% -
Europa Factor 2.4 2.4 0.4 0% 100% 44% 20% 19% 18%
Blue Factor 2.1 2.1 12.1 - 100% 22% - 78% -
Aurora RE 1.8 0.2 21,315.0 100% - n.a. n.a. n.a. n.a.
Link Asset Services 1.5 1.3 384.5 100% - - - 100% -
fficine T 1.5 1.0 4.0 20% 80% 20% 15% 40% 25%
SiCollection 1.5 1.5 7.5 0% 100% - 28% 71% 1%
Axactor 1.4 1.4 2.9 n.a. n.a. 100% - - -
CSS 1.2 1.0 5.6 1% 99% - 16% 80% 3%
Bayview Italia 1.0 1.0 154.4 96% 4% n.a. n.a. n.a. n.a.
Securitization Services 0.8 0.6 941.1 88% 12% - 58% 42% -
Euro Service 0.8 0.8 0.9 - 100% 42% - 58% -
Ge.Ri 0.7 - n.a. - 100% n.a. n.a. n.a. n.a.
Fides 0.7 0.5 4.4 2% 98% - 65% - 35%
erfin 0.3 0.2 0.6 - 100% 39% 10% - 50%
Certa Credita 0.1 0.1 4.3 n.a. n.a. n.a. n.a. n.a. n.a.
Centotrenta Servicing - - n.a. n.a. n.a. n.a. n.a. n.a. n.a.
Zenith Service (Arrow Group) - - n.a. 25% 75% n.a. n.a. n.a. n.a.
u ce anal n data ded e ce a data a e een d ectl ded e ce and a e n t een e ed Servicers present highly heterogeneous organizational, industrial and operating structures. Comparing the information presented above requires a correct analysis and understanding of the competitive landscape and servicers business model 1 Includes both owned and third parties portfolios 2 Refers to originated business: includes the origination/purchase of income-producing loans and NPL investments, and deals signed but yet to be booked, owing to a settlement structure in multiple tranches or to a time lag between the signing of the master agreement and the date of loan disbursement/onboarding 3 The breakdown of the AuM between secured and unsecured loans refer exclusively to the NPL purchased 4 The breakdown refers to investors vehicle notes on the portfolio managed Note: Double counting may arise when adding NPL AuM as some servicers outsource part of their portfolios to others due to capacity and/or specialization issues
Special Servicing
70%
74%26%
96%
88%
88%
96%
81%
91%
57%
97%
93%
94%
80%
100%
83%
91%
80%
100%
100%
100%
72%
100%
100%
98%
100%
100%
75%
99%
100%
72%
75%
100%
100%
74%
100%
90%4
97%
100%
71%
85%
78%
100%
80%
97%
82%
74%
100%

46 | The Italian NPL market
Table 10: Geographical NPL breakdown (data at 30/06/2019) – Ranking by Total Special Servicing AuM
CompanyTotal AuM1 (€bn)
Total Bad Loans AuM1 (€bn)
North2 Centre3 South - Islands4
doValue 78.6 76.2 43% 28% 29%
Cerved Credit Management 44.2 41.9 36% 39% 25%
Intrum 41.1 41.1 n.a. n.a. n.a.
IFIS Npl 22.8 22.7 33% 29% 39%
AMCO 20.3 11.9 64% 19% 17%
Prelios Credit Servicing 19.9 19.7 47% 21% 32%
Credito Fondiario 16.9 16.2 68% 19% 12%
Sistemia 9.5 9.0 48% 34% 18%
Crif 9.3 3.2 43% 26% 31%
Phoenix Asset Management 9.0 8.8 36% 47% 18%
MB Credit Solutions 7.6 7.6 38% 23% 39%
Guber 7.1 7.1 46% 38% 16%
Fire 6.7 4.1 33% 21% 46%
J-Invest 5.4 5.4 69% 18% 12%
Neprix (Illimity Bank) 4.85 4.8 n.a. n.a. n.a.
AZ Holding & La Scala 4.0 3.9 32% 25% 43%
Finint Revalue 3.7 3.2 40% 35% 25%
CNF (Gruppo Frascino) 3.4 3.1 28% 27% 45%
Duepuntozero 3.3 3.3 18% 23% 60%
Frontis NPL 3.3 2.3 60% 30% 10%
Advancing Trade 3.1 3.1 36% 20% 44%
Link Financial 3.0 2.7 30% 33% 37%
WhiteStar Asset Solutions (Arrow Group) 2.7 2.4 34% 26% 41%
Aquileia Capital Services 2.6 1.6 79% 15% 6%
Europa Factor 2.4 2.4 29% 23% 47%
Blue Factor 2.1 2.1 25% 21% 54%
Aurora RE 1.8 0.2 37% 53% 10%
Link Asset Services 1.5 1.3 41% 42% 17%
fficine T 1.5 1.0 33% 18% 49%
SiCollection 1.5 1.5 42% 16% 42%
Axactor 1.4 1.4 46% 20% 34%
CSS 1.2 1.0 47% 20% 33%
Bayview Italia 1.0 1.0 56% 26% 18%
Securitization Services 0.8 0.6 41% 37% 22%
Euro Service 0.8 0.8 36% 26% 38%
Ge.Ri 0.7 - 32% 25% 43%
Fides 0.7 0.5 22% 17% 61%
erfin 0.3 0.2 30% 50% 20%
Certa Credita 0.1 0.1 7% 9% 84%
Centotrenta Servicing - - 49% 26% 24%
Zenith Service (Arrow Group) - - n.a. n.a. n.a.
84%
u ce anal n data ded e ce a data a e een d ectl ded e ce and a e n t een e ed Servicers present highly heterogeneous organizational, industrial and operating structures. Comparing the information presented above requires a correct analysis and understanding of the competitive landscape and servicers business model 1 Includes both owned and third parties portfolios nclude e nte alle d ta a d a enet ent n lt d ge ul ene a ul a gu a l a agna
3 Includes: Toscana, Umbria, Marche, Lazio 4 Includes: Abruzzo, Molise, Campania, Puglia, Basilicata, Calabria, Sicilia, Sardegna 5 Refers to originated business: includes the origination/purchase of income-producing loans and NPL investments, and deals signed but yet to be booked, owing to a settlement structure in multiple tranches or to a time lag between the signing of the master agreement and the date of loan disbursement/onboarding
Special + Master Servicing
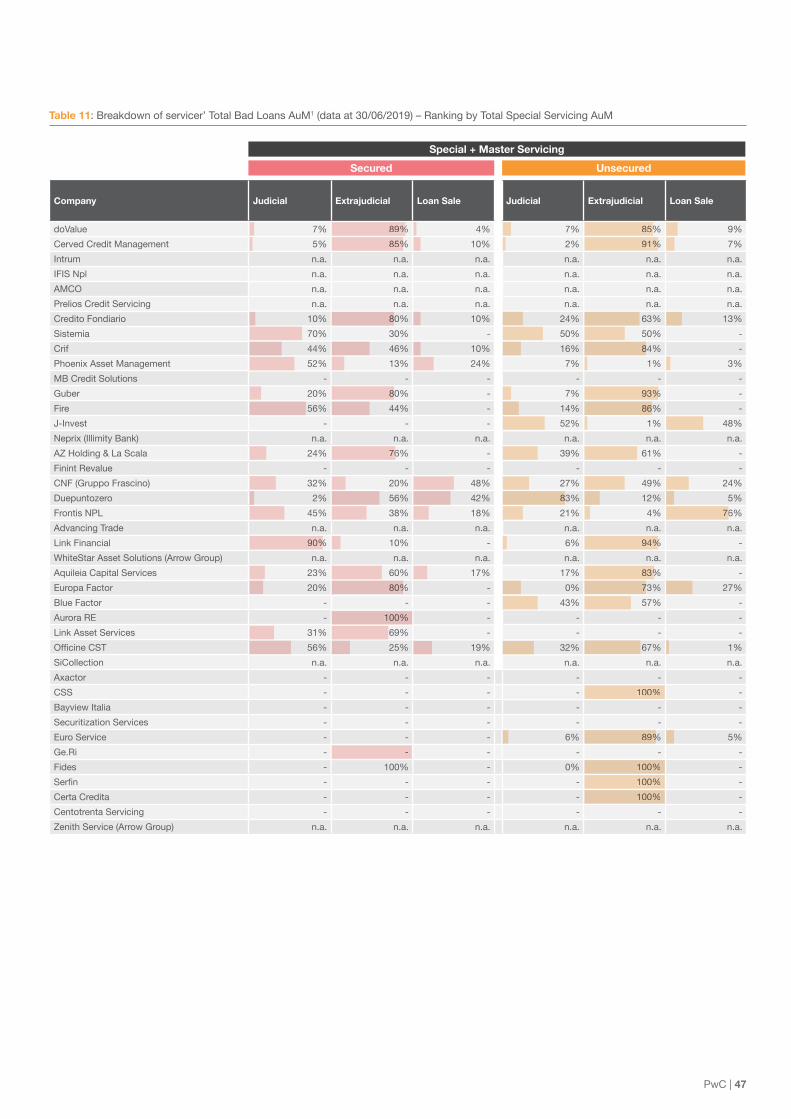
PwC | 47
Table 11: Breakdown of servicer’ Total Bad Loans AuM1 (data at 30/06/2019) – Ranking by Total Special Servicing AuM
Company Judicial Extrajudicial Loan Sale Judicial Extrajudicial Loan Sale
doValue 7% 89% 4% 7% 85% 9%
Cerved Credit Management 5% 85% 10% 2% 91% 7%
Intrum n.a. n.a. n.a. n.a. n.a. n.a.
IFIS Npl n.a. n.a. n.a. n.a. n.a. n.a.
AMCO n.a. n.a. n.a. n.a. n.a. n.a.
Prelios Credit Servicing n.a. n.a. n.a. n.a. n.a. n.a.
Credito Fondiario 10% 80% 10% 24% 63% 13%
Sistemia 70% 30% - 50% 50% -
Crif 44% 46% 10% 16% 84% -
Phoenix Asset Management 52% 13% 24% 7% 1% 3%
MB Credit Solutions - - - - - -
Guber 20% 80% - 7% 93% -
Fire 56% 44% - 14% 86% -
J-Invest - - - 52% 1% 48%
Neprix (Illimity Bank) n.a. n.a. n.a. n.a. n.a. n.a.
AZ Holding & La Scala 24% 76% - 39% 61% -
Finint Revalue - - - - - -
CNF (Gruppo Frascino) 32% 20% 48% 27% 49% 24%
Duepuntozero 2% 56% 42% 83% 12% 5%
Frontis NPL 45% 38% 18% 21% 4% 76%
Advancing Trade n.a. n.a. n.a. n.a. n.a. n.a.
Link Financial 90% 10% - 6% 94% -
WhiteStar Asset Solutions (Arrow Group) n.a. n.a. n.a. n.a. n.a. n.a.
Aquileia Capital Services 23% 60% 17% 17% 83% -
Europa Factor 20% 80% - 0% 73% 27%
Blue Factor - - - 43% 57% -
Aurora RE - 100% - - - -
Link Asset Services 31% 69% - - - -
fficine T 56% 25% 19% 32% 67% 1%
SiCollection n.a. n.a. n.a. n.a. n.a. n.a.
Axactor - - - - - -
CSS - - - - 100% -
Bayview Italia - - - - - -
Securitization Services - - - - - -
Euro Service - - - 6% 89% 5%
Ge.Ri - - - - - -
Fides - 100% - 0% 100% -
erfin - - - - 100% -
Certa Credita - - - - 100% -
Centotrenta Servicing - - - - - -
Zenith Service (Arrow Group) n.a. n.a. n.a. n.a. n.a. n.a.
85%
89%
90%
80%
80%
-
100%
76%
80%
Secured
Special + Master Servicing
Unsecured
83%
100%
85%
86%
93%
89%
91%
94%
83%
100%
100%
100%
76%
84%
73%

48 | The Italian NPL market
Recent market activity and outlook
Key Message
NPE disposals have been sharply growing since 2015, when transactions rocketed at approx. €18bn in terms of GBV and reached their peak at the end of 2018 (around €84bn). Overall, the market cumulated more than €270bn from 2015, and almost €65bn transactions have been already closed in 2019 and planned for 2020. GACS renovation, high UtP stock and secondary market will be the key drivers for the forthcoming NPE disposals.

PwC | 49
Before 2015, NPE transactions were somehow “extraordinary” and total deal volume did not exceed €10bn per year in terms of GBV; accordingly, the NPE stock held by banks kept growing, until it reached €341bn at the end of 2015, the year when NPE market took off.
Since then, the market has totalled more than €270bn in terms of GBV, mostly with primary market transactions. NPE disposals have undoubtedly been the main contributors to the reduction of NPE stock that has been observed in the last three years: these deals are part of the deleveraging strategies carried out by almost all Italian banks and envisage an intensive and proactive approach to improve asset quality, encouraged by several endogenous and exogenous factors (such as the positive correlation between asset quality and stocks’ value, regulators’ pressure and macroeconomic drivers).
On the whole, 2019 featured approx. €25bn of closed transactions in terms of GBV and approx. €40bn of announced transactions of which €14.5bn already ongoing are e pecte ear en an first months of
Main closed transactions include some “jumbo” deals such as Intesa Sanpaolo “Pjt M” (€3bn UtP) and UniCredit “Pjt Prisma” (€6.1bn Bad Loans securitization).
Regarding announced transactions, UniCredit, in its latest industrial plan, is committed to reduce the gross NPE stock by approx. €9bn by 2023. MPS is continuing its deleveraging strategy as well. The Italian Government aims to shield the bank from NPE losses and is negotiating with EU Commission a new NPL disposing plan. Treasury sets the goal to lower the impaired debt ratio to 5% by spinning off some 10 billion euros in problem loans that would be merged with the assets of Treasury-owned NPE manager AMCO S.p.A. (formerly S.G.A. S.p.A.). By the end of December, EU Commission should communicate its response.
Banca Popolare di Bari needs around €1bn to be recapitalized and recently asked for a €100-150mln early intervention of the Interbank Deposit Protection Fund (FITD). The supposed scenario could also involve the NPE disposal to AMCO, as already seen in the crisis resolution of Banca Carige.
Furthermore, we expect that the opportunities represented by the renovation of GACS scheme, will be one of the key drivers for the forthcoming NPE market. After 10 months without GACS deals, now UniCredit is going to request the guarantee for project Prisma. Moreover, UBI, BPER and Banca Popolare di Sondrio will likely ask for the public guarantee in the NPL disposals they are currently working on.
Finally, deals in secondary markets are increasing in volumes and we expect this trend to continue. Below, we present the main drivers for secondary market transactions:
• SPVs that need to accelerate the collections in order to repay Senior notes outstanding principal (often secured by GACS) accordingly to the original business plan. They usually sell sub-portfolios made of NPLs secured by good quality and sizeable assets because they are easier to be marketed
• n estors that nee to foc s on a specific asset class due to investment policy and/or corporate structure (e.g. illimity bank chose to invest only in SME/corporate NPL)
• Investment fund liquidation, when shareholders are not willing to extend the expiring deadline
• Need to sell portfolios’ tails to clean books and improve operational efficienc ormall the or o t of these e pos res is iffic lt e to lac of oc mentation an scarce quality of information. They have to be treated by specialized servicers and usually disposed at a lower price (i.e. P/GBV between 0.2% and 0.5%).
Chart 37: NPL transactions trend in the Italian market (€bn)
2012
2.62.1 0.2 0.2
1.80.5
0.1
0.1
0.4
2.0 0.13.8 2.92.6
0.1
1.2
0.21.20.4
1.5
0.3
0.6
5.13.34.97.32.5
14.5
5.93.95.4
6.5
7.5
5.19.1
3.6
53.7 47.8
21.3
4.8
9.6
2013 2014 2015 2016 2017 2018 2019
Consumer Unsecured Secured Mixed Secured/Unsecured
Mainly Secured
Mainly Unsecured
n.a. Ongoing
4.7 4.08.0
18.3 20.7
68.4
84.0
38.5
Source: PwC estimates on public information and market rumours
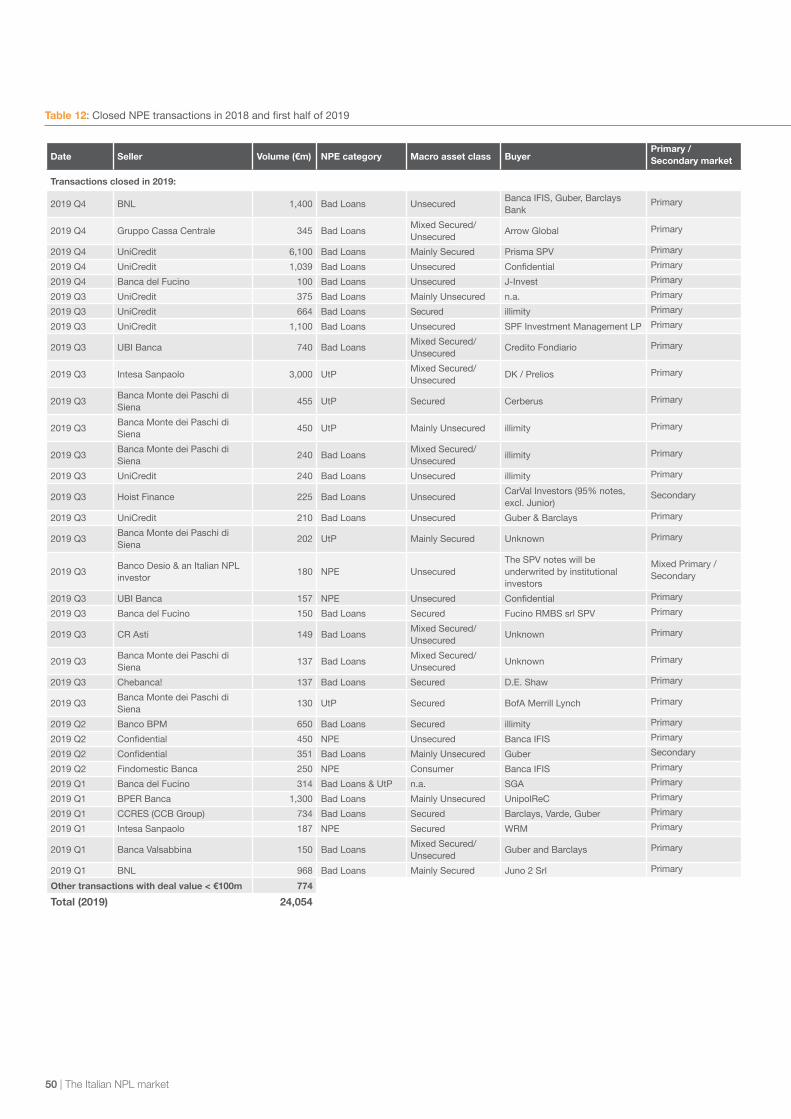
50 | The Italian NPL market
Table 12: Closed NPE transactions in 2018 and first half of 2019
Date Seller Volume (€m) NPE category Macro asset class Buyer Primary / Secondary market
Transactions closed in 2019:
2019 Q4 BNL 1,400 Bad Loans UnsecuredBanca IFIS, Guber, Barclays Bank
Primary
2019 Q4 Gruppo Cassa Centrale 345 Bad Loans Mixed Secured/Unsecured
Arrow Global Primary
2019 Q4 UniCredit 6,100 Bad Loans Mainly Secured Prisma SPV Primary
2019 Q4 UniCredit 1,039 Bad Loans Unsecured Confidential Primary
2019 Q4 Banca del Fucino 100 Bad Loans Unsecured J‑Invest Primary
2019 Q3 UniCredit 375 Bad Loans Mainly Unsecured n.a. Primary
2019 Q3 UniCredit 664 Bad Loans Secured illimity Primary
2019 Q3 UniCredit 1,100 Bad Loans Unsecured SPF Investment Management LP Primary
2019 Q3 UBI Banca 740 Bad Loans Mixed Secured/Unsecured
Credito Fondiario Primary
2019 Q3 Intesa Sanpaolo 3,000 UtP Mixed Secured/Unsecured
DK / Prelios Primary
2019 Q3Banca Monte dei Paschi di Siena
455 UtP Secured Cerberus Primary
2019 Q3Banca Monte dei Paschi di Siena
450 UtP Mainly Unsecured illimity Primary
2019 Q3Banca Monte dei Paschi di Siena
240 Bad Loans Mixed Secured/Unsecured
illimity Primary
2019 Q3 UniCredit 240 Bad Loans Unsecured illimity Primary
2019 Q3 Hoist Finance 225 Bad Loans UnsecuredCarVal Investors (95% notes, excl. Junior)
Secondary
2019 Q3 UniCredit 210 Bad Loans Unsecured Guber & Barclays Primary
2019 Q3Banca Monte dei Paschi di Siena
202 UtP Mainly Secured Unknown Primary
2019 Q3Banco Desio & an Italian NPL investor
180 NPE UnsecuredThe SPV notes will be underwrited by institutional investors
Mixed Primary / Secondary
2019 Q3 UBI Banca 157 NPE Unsecured Confidential Primary
2019 Q3 Banca del Fucino 150 Bad Loans Secured Fucino RMBS srl SPV Primary
2019 Q3 CR Asti 149 Bad Loans Mixed Secured/Unsecured
Unknown Primary
2019 Q3Banca Monte dei Paschi di Siena
137 Bad Loans Mixed Secured/Unsecured
Unknown Primary
2019 Q3 Chebanca! 137 Bad Loans Secured D.E. Shaw Primary
2019 Q3Banca Monte dei Paschi di Siena
130 UtP Secured BofA Merrill Lynch Primary
2019 Q2 Banco BPM 650 Bad Loans Secured illimity Primary
2019 Q2 Confidential 450 NPE Unsecured Banca IFIS Primary
2019 Q2 Confidential 351 Bad Loans Mainly Unsecured Guber Secondary
2019 Q2 Findomestic Banca 250 NPE Consumer Banca IFIS Primary
2019 Q1 Banca del Fucino 314 Bad Loans & UtP n.a. SGA Primary
2019 Q1 BPER Banca 1,300 Bad Loans Mainly Unsecured UnipolReC Primary
2019 Q1 CCRES (CCB Group) 734 Bad Loans Secured Barclays, Varde, Guber Primary
2019 Q1 Intesa Sanpaolo 187 NPE Secured WRM Primary
2019 Q1 Banca Valsabbina 150 Bad Loans Mixed Secured/Unsecured
Guber and Barclays Primary
2019 Q1 BNL 968 Bad Loans Mainly Secured Juno 2 Srl Primary
Other transactions with deal value < €100m 774
Total (2019) 24,054
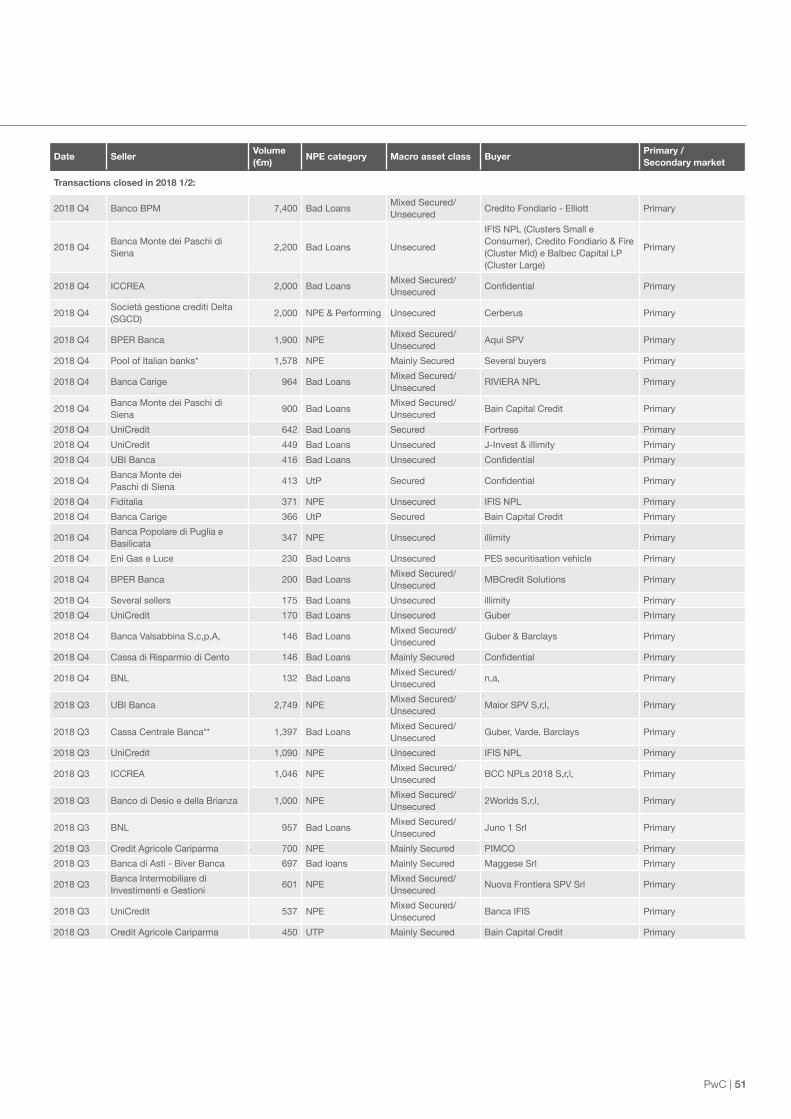
PwC | 51
Table 12: Closed NPE transactions in 2018 and first half of 2019
Date Seller Volume (€m)
NPE category Macro asset class Buyer Primary / Secondary market
Transactions closed in 2018 1/2:
2018 Q4 Banco BPM 7,400 Bad Loans Mixed Secured/Unsecured
Credito Fondiario ‑ Elliott Primary
2018 Q4Banca Monte dei Paschi di Siena
2,200 Bad Loans Unsecured
IFIS NPL (Clusters Small e Consumer), Credito Fondiario & Fire (Cluster Mid) e Balbec Capital LP (Cluster Large)
Primary
2018 Q4 ICCREA 2,000 Bad Loans Mixed Secured/Unsecured
Confidential Primary
2018 Q4Società gestione crediti Delta (SGCD)
2,000 NPE & Performing Unsecured Cerberus Primary
2018 Q4 BPER Banca 1,900 NPE Mixed Secured/Unsecured
Aqui SPV Primary
2018 Q4 Pool of Italian banks* 1,578 NPE Mainly Secured Several buyers Primary
2018 Q4 Banca Carige 964 Bad Loans Mixed Secured/Unsecured
RIVIERA NPL Primary
2018 Q4Banca Monte dei Paschi di Siena
900 Bad Loans Mixed Secured/Unsecured
Bain Capital Credit Primary
2018 Q4 UniCredit 642 Bad Loans Secured Fortress Primary
2018 Q4 UniCredit 449 Bad Loans Unsecured J‑Invest & illimity Primary
2018 Q4 UBI Banca 416 Bad Loans Unsecured Confidential Primary
2018 Q4Banca Monte dei Paschi di Siena
413 UtP Secured Confidential Primary
2018 Q4 Fiditalia 371 NPE Unsecured IFIS NPL Primary
2018 Q4 Banca Carige 366 UtP Secured Bain Capital Credit Primary
2018 Q4Banca Popolare di Puglia e Basilicata
347 NPE Unsecured illimity Primary
2018 Q4 Eni Gas e Luce 230 Bad Loans Unsecured PES securitisation vehicle Primary
2018 Q4 BPER Banca 200 Bad Loans Mixed Secured/Unsecured
MBCredit Solutions Primary
2018 Q4 Several sellers 175 Bad Loans Unsecured illimity Primary
2018 Q4 UniCredit 170 Bad Loans Unsecured Guber Primary
2018 Q4 Banca Valsabbina S,c,p,A, 146 Bad Loans Mixed Secured/Unsecured
Guber & Barclays Primary
2018 Q4 Cassa di Risparmio di Cento 146 Bad Loans Mainly Secured Confidential Primary
2018 Q4 BNL 132 Bad Loans Mixed Secured/Unsecured
n,a, Primary
2018 Q3 UBI Banca 2,749 NPE Mixed Secured/Unsecured
Maior SPV S,r,l, Primary
2018 Q3 Cassa Centrale Banca** 1,397 Bad Loans Mixed Secured/Unsecured
Guber, Varde, Barclays Primary
2018 Q3 UniCredit 1,090 NPE Unsecured IFIS NPL Primary
2018 Q3 ICCREA 1,046 NPE Mixed Secured/Unsecured
BCC NPLs 2018 S,r,l, Primary
2018 Q3 Banco di Desio e della Brianza 1,000 NPE Mixed Secured/Unsecured
2Worlds S,r,l, Primary
2018 Q3 BNL 957 Bad Loans Mixed Secured/Unsecured
Juno 1 Srl Primary
2018 Q3 Credit Agricole Cariparma 700 NPE Mainly Secured PIMCO Primary
2018 Q3 Banca di Asti ‑ Biver Banca 697 Bad loans Mainly Secured Maggese Srl Primary
2018 Q3Banca Intermobiliare di Investimenti e Gestioni
601 NPE Mixed Secured/Unsecured
Nuova Frontiera SPV Srl Primary
2018 Q3 UniCredit 537 NPE Mixed Secured/Unsecured
Banca IFIS Primary
2018 Q3 Credit Agricole Cariparma 450 UTP Mainly Secured Bain Capital Credit Primary

52 | The Italian NPL market
Source: PwC estimates on public information and market rumours of primary and secondary market. Data refer to transaction from January 2018 to November 2019. Some transactions involved groups of different investors; the volumes of these transactions have been allocated to each player, when possible. Otherwise, they have been assigned to the main investor. In case of securitization transactions, the total volume has been allocated to the main buyer, without taking into account eventual notes subscribed by the banks themselves and/or third parties (e.g. senior) Note: (*) The pool is composed by 12 Popolari banks and 5 non-Popolari banks; (**) Cooperative Credit Bank Group under approval process. The volumes might refer also to banks which do not belong to the Group; (***) Aggregate amount of different single names transactions; (****) MPS disposed a $ 160m NPL portfolio in 2018-Q3, the value has been converted in € on the basis of the exchange rate of the closing period
Date Seller Volume (€m)
NPE category Macro asset class Buyer Primary / Secondary market
Transactions closed in 2018 2/2:
2018 Q3 CRC Bayview 425 NPE Unsecured MBCredit Solutions Secondary
2018 Q3 Banca Popolare di Ragusa 349 Bad loans n,a, IBLA S,r,l, Primary
2018 Q3 Findomestic Banca 302 NPE Unsecured Kruk Italia Primary
2018 Q3 Banca Monte dei Paschi di Siena 300 UTP Secured Confidential Primary
2018 Q3Istituto Finanziario del Mezzogiorno
263 Bad Loans Mixed Secured/Unsecured
illimity Secondary
2018 Q3 Balbec 217 NPE Unsecured MBCredit Solutions Secondary
2018 Q3 Banca Sella 214 NPE Mixed Secured/Unsecured
B2 Kapital Investment S,r,l, Primary
2018 Q3Banca Monte dei Paschi di Siena****
135 NPE Secured SC Lowy ‑ Credito di Romagna Primary
2018 Q3 Deutsche Bank 155 NPE Unsecured IFIS NPL Primary
2018 Q3 Cassa di Risparmio di Volterra 155 NPE Mainly Secured illimity Primary
2018 Q3 Emil Banca BCC 145 Bad loans Mixed Secured/Unsecured
Confidential Primary
2018 Q3Banca Patavina Credito Cooperativo di Sant'Elena e Piove di Sacco
145 NPE Unsecured Hoist Finance Primary
2018 Q3 Volksbank 141 NPE Secured AnaCap Primary
2018 Q3 Credit Agricole Cariparma 140 NPE Unsecured Axactor Primary
2018 Q3 Romeo SPV S,r,l, 113 Bad loans Unsecured Hoist Finance Secondary
2018 Q2 Banca Monte dei Paschi di Siena 24,100 Bad Loans Mixed Secured/Unsecured
Italian Recovery Fund Primary
2018 Q2 Intesa Sanpaolo 10,800 Bad Loans Mainly Secured Intrum Primary
2018 Q22018 Q2 Banco BPM 5,100 Bad Loans Mainly Secured CRC Primary
2018 Q2 Credito Valtellinese 1,600 Bad Loans Mainly Secured Aragorn NPL 2018 S,r,l, Primary
2018 Q2 Sicilcassa 1,500 NPE Secured MB Finance S,r,l, Primary
2018 Q2 BPER Banca 900 Bad Loans Mixed Secured/Unsecured
4Mori Sardegna Srl Primary
2018 Q2Banca Monte dei Paschi di Siena***
500 UTP Secured Confidential Primary
2018 Q2 Credito Valtellinese 245 Bad loans & UTP Secured Algebris Investments Primary
2018 Q2 Credito Valtellinese 222 Bad loans & UTP Secured Credito Fondiario Primary
2018 Q2 UniCredit 124 NPE Unsecured MBCredit Solutions Primary
2018 Q2 Alba Leasing 103 NPE Mainly Secured Bain Capital Credit Primary
2018 Q1 Banca Monte dei Paschi di Siena 100 UTP Secured Confidential Primary
Other transactions with deal value < €100m 1,131
Total (2018) 83,992

PwC | 53
Table 13: Main ongoing NPE transactions as of November 2019
Seller Volume (€m) NPE category Macro asset class Primary / Secondary market
Banca Popolare di Sondrio 1,500 Bad Loans n.a. Primary
UBI Banca 800 Bad Loans Secured Primary
Banca Monte dei Paschi di Siena 2,200 Bad Loans & UtP Unsecured Primary
Banca Popolare di Sondrio 1,000 Bad Loans Mixed secured / unsecured Primary
UniCredit 2,000 UtP Secured Primary
Banca Carige 3,360 Bad Loans & UtP n.a. Primary
ICCREA 1,200 Bad Loans n.a. Primary
UBI Banca 1,000 n.a. n.a. Primary
Intesa Sanpaolo 740 n.a. n.a. Primary
BNL 700 n.a. Mixed secured / unsecured Primary
Total 14,500
Source: PwC estimates on public information and market rumours

54 | The Italian NPL market
AppendixTop 10 banks peer analysis

PwC | 55
Gross NPE (€bn)
Gross Bad Loans (€bn)
Gross Unlikely to Pay (€bn)
Source: PwC analysis on financial statements and analysts’ presentations. Data affected by different write-off policies.
UCG ISP Banco BPM ICCREA MPS UBI BNL CariparmaBPER Credem
UCG ISP Banco BPM ICCREA MPS UBI BNL CariparmaBPER Credem
H1-2019
21.6
29.4 31
.2
16.2
14.3
7.8 8.1
0.0
13.6
7.3
5.5
7.4
4.2 3.82.8 2.6 2.5
1.6 1.60.4 0.40.0
0.0 0.0
0.0 0.0
14.4
H1-2019
21.6
29.4 31
.2
21.2 21.7
3.9
8.6
20.7
3.3
6.88.3
5.4 5.16.2
4.3 4.3
2.0 2.0 0.7 0.7
19.1
UCG ISP Banco BPM ICCREA MPS UBI BNL CariparmaBPER
YE - 2018 H1-2019
Credem
38.236.5
11.8
16.8
34.8
10.712.8
15.9
9.7 9.0 9.17.0 6.9
3.7 3.61.2 1.1
34.4
3.2 4.2 6.5 - 9.0 6.7 6.3 6.8 3.8 2.22.9 4.1 5.9 7.7 8.3 6.2 N/A 6.7 N/A 2.1
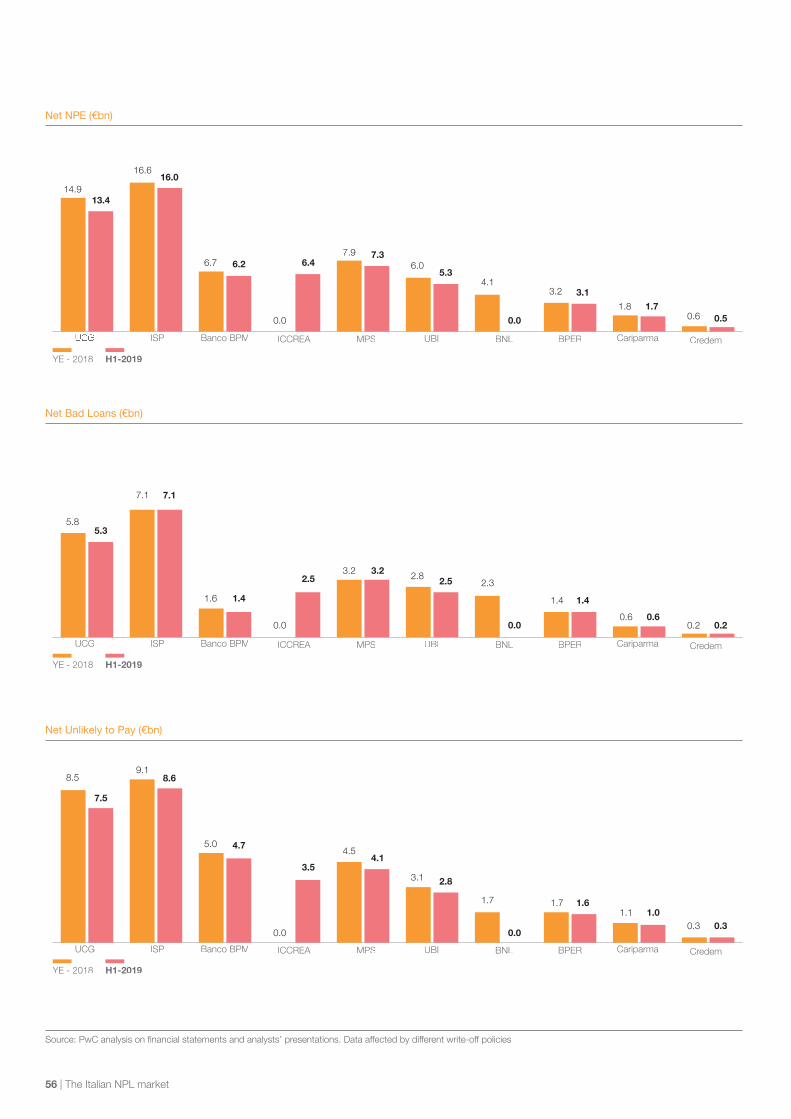
56 | The Italian NPL market
Net NPE (€bn)
Net Bad Loans (€bn)
Net Unlikely to Pay (€bn)
Source: PwC analysis on financial statements and analysts’ presentations. Data affected by different write-off policies
UCG ISP Banco BPM ICCREA MPS UBI BNL CariparmaBPER Credem
UCG ISP Banco BPM ICCREA MPS UBI BNL CariparmaBPER Credem
YE - 2018 H1-2019
YE - 2018 H1-2019
8.59.1
5.04.5
8.6
4.7
3.54.1
3.1 2.8
1.7 1.7 1.61.1 1.0
0.3 0.3
7.5
5.8
7.1
1.6
3.2
7.1
1.4
2.53.2 2.8 2.5 2.3
1.4 1.4
0.6 0.60.2 0.2
5.3
ISP Banco BPM ICCREA MPS UBI BNL CariparmaBPER
YE - 2018 H1-2019
21.6
Credem
29.4 31
.2
14.9
16.6
6.77.9
16.0
6.2 6.47.3
6.05.3
4.13.2 3.1
1.8 1.70.6 0.5
13.4
0.0 0.0
0.0 0.0
0.0 0.0

PwC | 57
Gross NPE ratio (%)
Gross Bad Loans ratio (%)
Gross Unlikely to Pay ratio (%)
Source: PwC analysis on financial statements and analysts’ presentations. Data affected by different write-off policies
UCG ISP Banco BPM ICCREA MPS UBI BNL CariparmaBPER
YE - 2018 H1-2019
21.6
Credem
7.78.8
10.8
17.3
8.49.7
14.1
16.3
10.4 10.0
13.4 13.8 13.7
7.6 7.4
4.4 4.4
7.0
0.0 0.0
UCG ISP Banco BPM ICCREA MPS UBI BNL CariparmaBPER
YE - 2018 H1-2019
21.6
Credem
29.4 31
.24.3
5.2
3.6
8.8
5.0
3.0
7.5
8.5
5.8 5.7
9.28.5 8.6
4.2 4.0
2.7 2.7
3.9
0.0 0.0
UCG ISP Banco BPM ICCREA MPS UBI BNL CariparmaBPER
YE - 2018 H1-2019
21.6
Credem
3.3 3.4
7.1
8.3
3.3
6.66.0
7.6
4.5 4.2 4.1
5.2 5.0
3.4 3.3
1.6 1.6
2.9
0.0 0.0

58 | The Italian NPL market
Net NPE ratio (%)
Net Bad Loans ratio (%)
Net Unlikely to Pay ratio (%)
Source: PwC analysis on financial statements and analysts’ presentations. Data affected by different write-off policies
YE - 2018 H1 - 2019
UCG ISP Banco BPM MPSICCREA UBI BNL BPER Cariparma Credem
21.6
1.82.3
4.9
0.0
3.5
2.2
4.5 4.2
3.2
5.24.6
2.6
0.0
3.6 3.5
2.3
0.0
1.2 1.21.6
YE - 2018 H1 - 2019
UCG ISP Banco BPM MPSICCREA UBI BNL BPER Cariparma Credem
21.6
1.21.8
1.5
0.0
3.1
1.81.4
3.0 2.9
3.7 3.6 3.5
0.0
3.1 3.1
1.4
0.0
0.9 0.91.2
YE - 2018 H1 - 2019
UCG ISP Banco BPM MPSICCREA UBI BNL BPER Cariparma Credem
21.6
3.2
4.2
6.5
0.0
6.7
4.1
5.9
7.7
6.2
9.08.3
6.3
0.0
6.8 6.7
3.8
0.0
2.2 2.1
2.9

PwC | 59
NPE Coverage ratio (%)
Bad Loans Coverage ratio (%)
Unlikely to Pay Coverage ratio (%)
Source: PwC analysis on financial statements and analysts’ presentations. Data affected by different write-off policies
UCG ISP Banco BPM MPSICCREA UBI BNL BPER Cariparma
YE - 2018 H1 - 2019
YE - 2018 H1 - 2019
Credem
UCG ISP Banco BPM MPSICCREA UBI BNL BPER Cariparma Credem
47.3
36.2 35.0
0.0
44.0
37.2 35.5 35.4
45.5
25.5 26.9
0.0
38.735.7 35.3 34.0
35.4
27.3 28.3
47.9
21.6
72.6
67.2
59.6
0.0
49.0
65.9
56.8
63.9
51.8
62.4 61.9 62.9
0.0
66.6 67.0 68.4 68.6 67.1 67.872.2
YE - 2018 H1 - 2019
UCG ISP Banco BPM MPSICCREA UBI BNL BPER Cariparma Credem
21.6
61.0
54.5
43.1
0.0
38.5
54.1
41.9
49.7
41.0
53.1 53.8 55.0
0.0
54.5 54.852.5 53.4 51.5 52.3
61.0

60 | The Italian NPL market

PwC | 61
Pier Paolo Masenza PartnerFinancial Services [email protected]
Gianluigi BenettiAssociate PartnerStrategy&[email protected]
Fedele PascuzziPartnerBusiness Recovery Services [email protected]
Antonio MartinoPartnerReal Estate Deals [email protected]
Salvatore LombardoPartnerBusiness Recovery Services - UtP [email protected]
Edoardo CostaDirectorStrategy&[email protected]
Lorenzo GuiggianiSenior ManagerDeals FS - [email protected]
Vittoria MarchettiSenior ManagerDeals FS - [email protected]
Matteo D’AlessioPartner Deals FS [email protected]
Marco VozziPartner TLS - Asset & Wealth Management Tax [email protected]
Cristian SgaramellaPartner TLS - Head of Crisis and Banking Portfolio [email protected]
Emanuele EgidioPartnerDelivery Deal [email protected]
Francesco Cataldi DirectorStrategy&[email protected]
Alessio ForconiSenior ManagerDeals FS - [email protected]
Gabriele GuggiolaAssociate PartnerRegulatory Deals [email protected]
Contacts List

62 | The Italian NPL market

PwC | 63
Portfolio Advisory Group
AustriaJens [email protected]
Bernhard [email protected]
BulgariaBojidar [email protected]
CroatiaSinisa [email protected]
CyprusStelios [email protected]
Czech Republic and SlovakiaPetr [email protected]
DenmarkBent Jø[email protected]
FranceHervé [email protected]
GermanyChristopher [email protected]
Thomas [email protected]
Jörg Jü[email protected]
GreeceThanassis [email protected]
HungaryCsaba [email protected]
IrelandDavid [email protected]
ItalyPier Paolo [email protected]
Fedele [email protected]
The NetherlandsPeter [email protected]
Wilbert van den [email protected]
Jessica [email protected]
NorwayLars [email protected]
PolandPawel [email protected]
PortugalAntonio [email protected]
SerbiaMarko [email protected]
SpainJaime [email protected]
Guillermo [email protected]
Pablo [email protected]
Richard [email protected]@es.pwc.com
SwedenPer Storbacka [email protected]
TurkeySerkan [email protected]
Kadir Kö[email protected]
UkraineOleg [email protected]
United KingdomRichard [email protected]
Robert [email protected]
Panos [email protected]
Chiara [email protected]
hristina arifichristina arifi p c com
North AmericaMitchell [email protected]
Asia PacificTed [email protected]
James [email protected]
Huong Dao Thi [email protected]
Lee Chui [email protected]
Michael [email protected]
Masaya [email protected]
Latin AmericaCarolina [email protected]
Middle EastMatthew [email protected]

This publication has been prepared for general guidance on matters of interest only, and does not constitute professional advice. You should not act upon the information c nta ned n t u l cat n t ut ta n ng ec c e nal ad ce e e entat n a ant e e l ed g en a t t e accu ac c letene of the information contained in this publication, and, to the extent permitted by law, PwC does not accept or assume any liability, responsibility or duty of care for any consequences of you or anyone else acting, or refraining to act, in reliance on the information contained in this publication or for any decision based on it.
© 2019 PricewaterhouseCoopers Advisory SpA. All rights reserved. PwC and PricewaterhouseCoopers Advisory SpA refer to the PwC network and/or one or more of its e e eac c a e a ate legal ent t lea e ee c c t uctu e u t e deta l
www.pwc.com/it/npl