The Italian Asset Management market - Assogestioni · The Italian Asset Management market key...
45
The Italian Asset Management market key figures 16 February 2016 Research Department
Transcript of The Italian Asset Management market - Assogestioni · The Italian Asset Management market key...

The Italian Asset Management marketkey figures
16 February 2016
Research Department

Key figures16 February 2016
The Italian Asset Management market
Research Department
1. The Italian Asset Management market Summary statistics
Open-end funds
Mandates
The recovery, some tentative explanations
2. The European Investment Fund Industry Net assets & sales by fund / fund group domicile
3. Savings & Wealth Household saving rate: trend & int’l comparison
Household financial portfolio & private pension plans

Research Department The Italian Asset Management market Key figures
16 February 2016
4AuM, net flows & performance, €bn. 4
The Italian AM market (Jan 2015: Dec 2015)
Research Department The Italian Asset Management market Key figures
16 February 2016
5
‐4
‐2
0
2
4
6
8
10
12
14
16
18
20
22
24
Jan2013
Feb Mar Apr May Jun Jul Aug Sep Oct Nov Dec Jan2014
Feb Mar Apr May Jun Jul Aug Sep Oct Nov Dec Jan2015
Feb Mar Apr May Jun Jul Aug Sep Oct Nov Dec€ bn
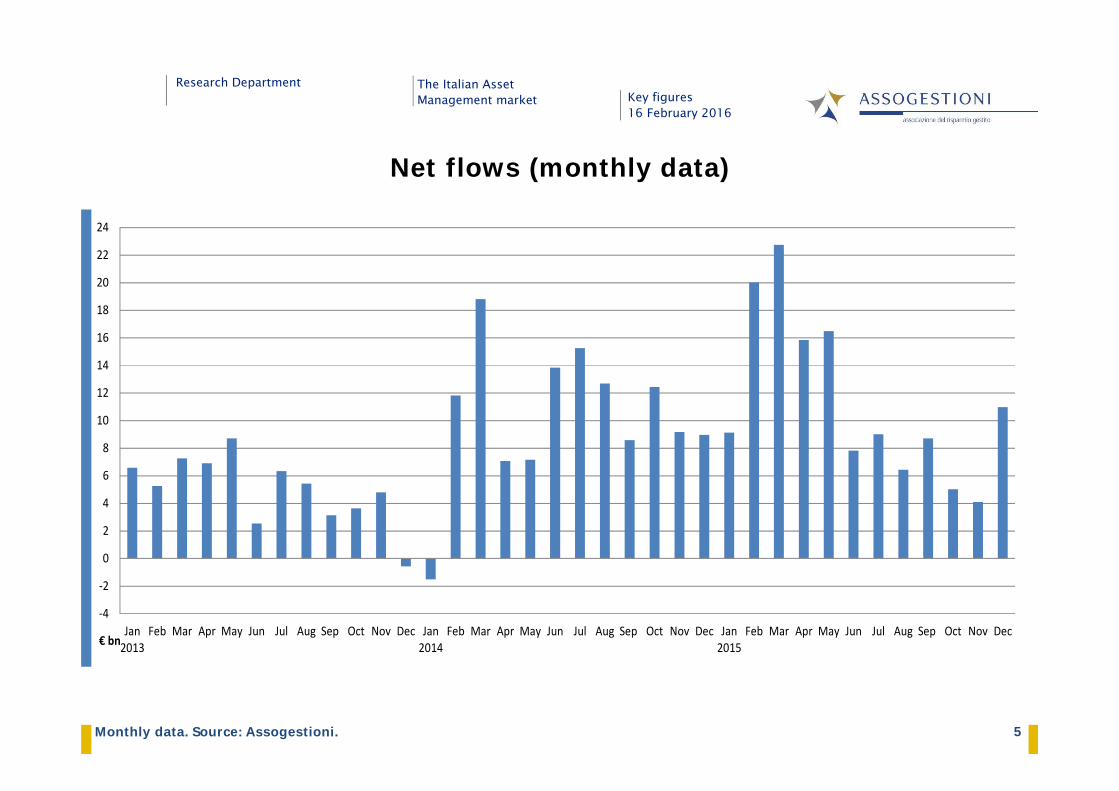
Net flows (monthly data)
Monthly data. Source: Assogestioni.

Research Department The Italian Asset Management market Key figures
16 February 2016
6
+7.3
+4.2
+8.1
+9.9
III
2015 I
II
IV+9.3
+5.5+1.1
+0.8IV
II
2015 I
III
+0.23+0.00 +0.04
+0.53
II III IV
2015 I
+39.1
+30.4
+15.6+9.5
2015 I
IV
II
III
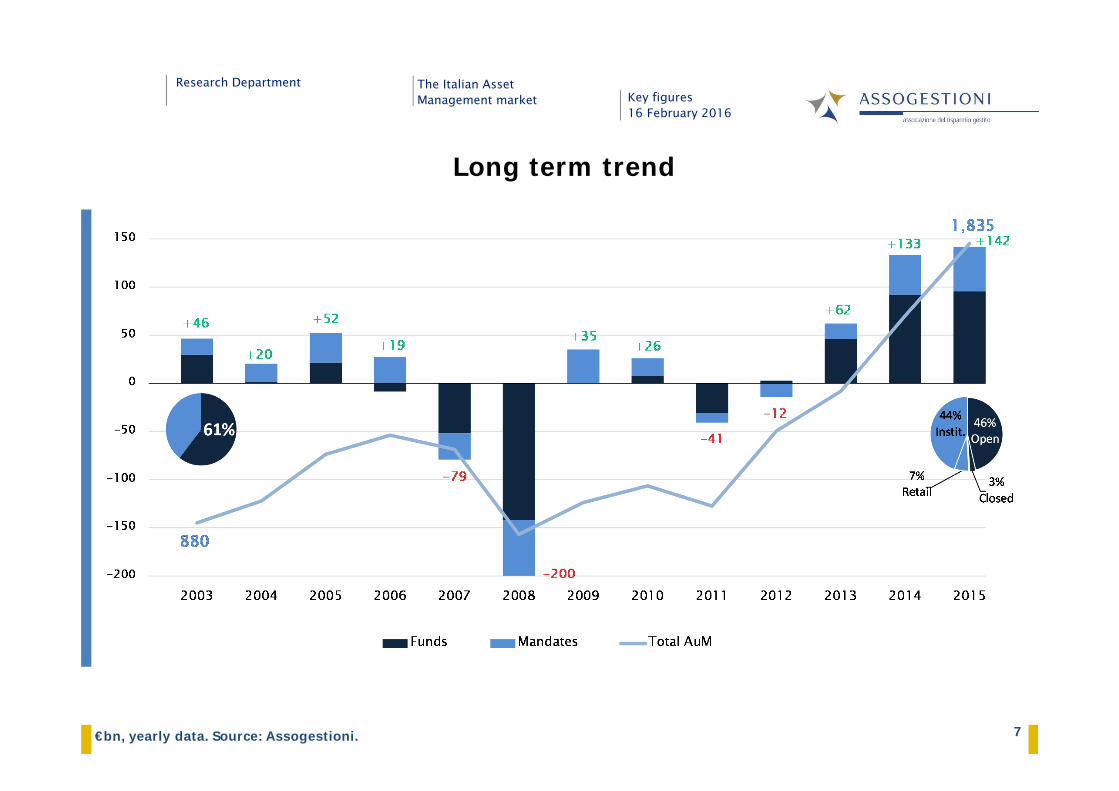
7%128
Product breakdown
6
4%
43
44%808
Open‐end Funds
Retail Mandates (discretionary portfolios)
Closed‐end Funds
Institutional Mandates
85046%
3%49
Research Department The Italian Asset Management market Key figures
16 February 2016
7€bn, yearly data. Source: Assogestioni.
Long term trend
Research Department The Italian Asset Management market Key figures
16 February 2016
8
+31.8
0% 4% 8% 12% 16% 20% 24%
0 4 8 12 16 20 24
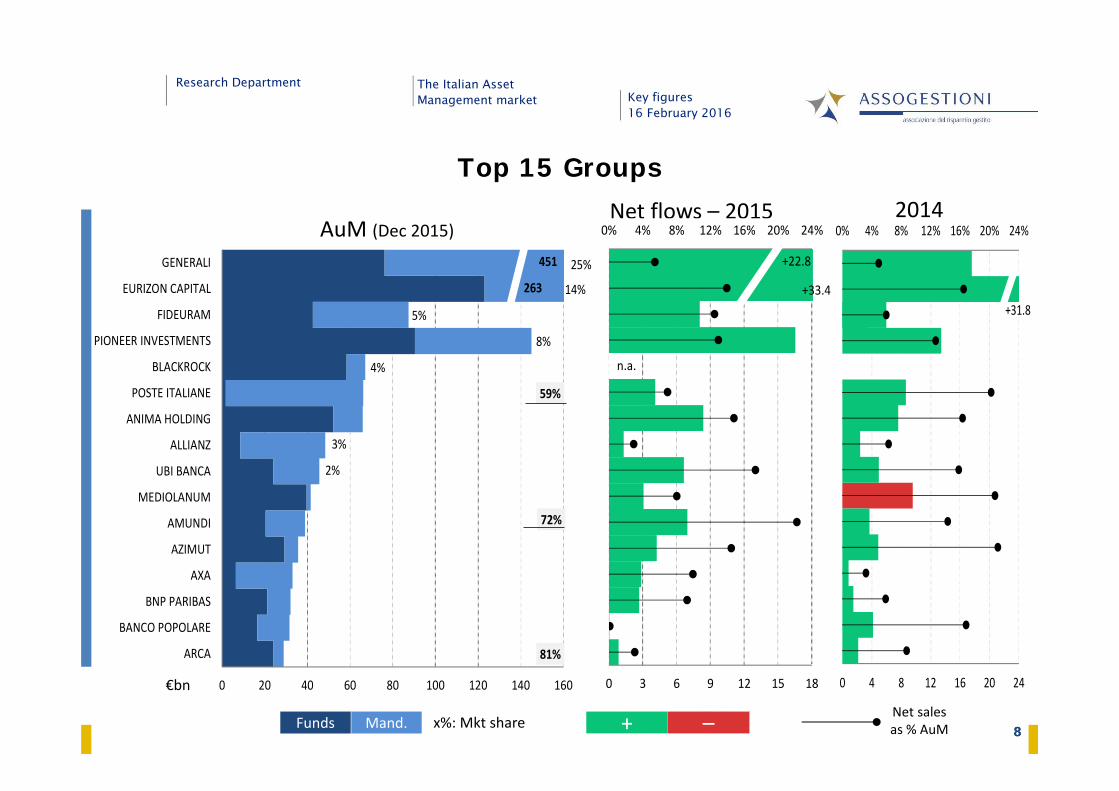
81%
72%
59%
14%263
25%
3%
2%
451
4%
8%
5%
0 20 40 60 80 100 120 140 160
ARCA
BANCO POPOLARE
BNP PARIBAS
AXA
AZIMUT
AMUNDI
MEDIOLANUM
UBI BANCA
ALLIANZ
ANIMA HOLDING
POSTE ITALIANE
BLACKROCK
PIONEER INVESTMENTS
FIDEURAM
EURIZON CAPITAL
GENERALI
Net sales as % AuMFunds
€bn
AuM (Dec 2015)Net flows – 2015 2014
Mand. + –x%: Mkt share 8
Top 15 Groups
n.a.
+33.4
+22.8
0% 4% 8% 12% 16% 20% 24%
0 3 6 9 12 15 18
Research Department The Italian Asset Management market Key figures
16 February 2016
9
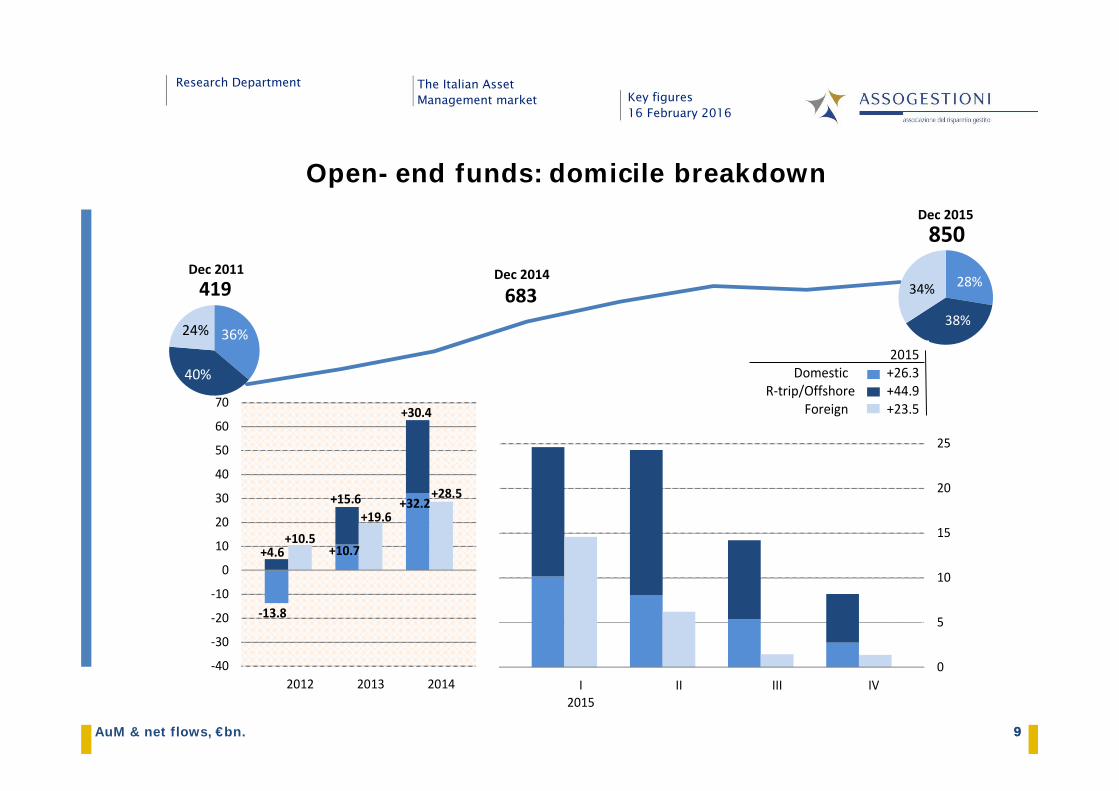
Open-end funds: domicile breakdown
AuM & net flows, €bn. 9
Dec 2015850
Dec 2011419
Dec 2014
683
36%
40%
24%
28%
38%
34%
2015 Domestic +26.3
R‐trip/Offshore +44.9Foreign +23.5
0
5
10
15
20
25
I2015
II III IV
‐13.8
+10.7
+32.2
+4.6
+15.6
+30.4
+10.5+19.6
+28.5
‐40
‐30
‐20
‐10
0
10
20
30
40
50
60
70
2012 2013 2014
Research Department The Italian Asset Management market Key figures
16 February 2016
10
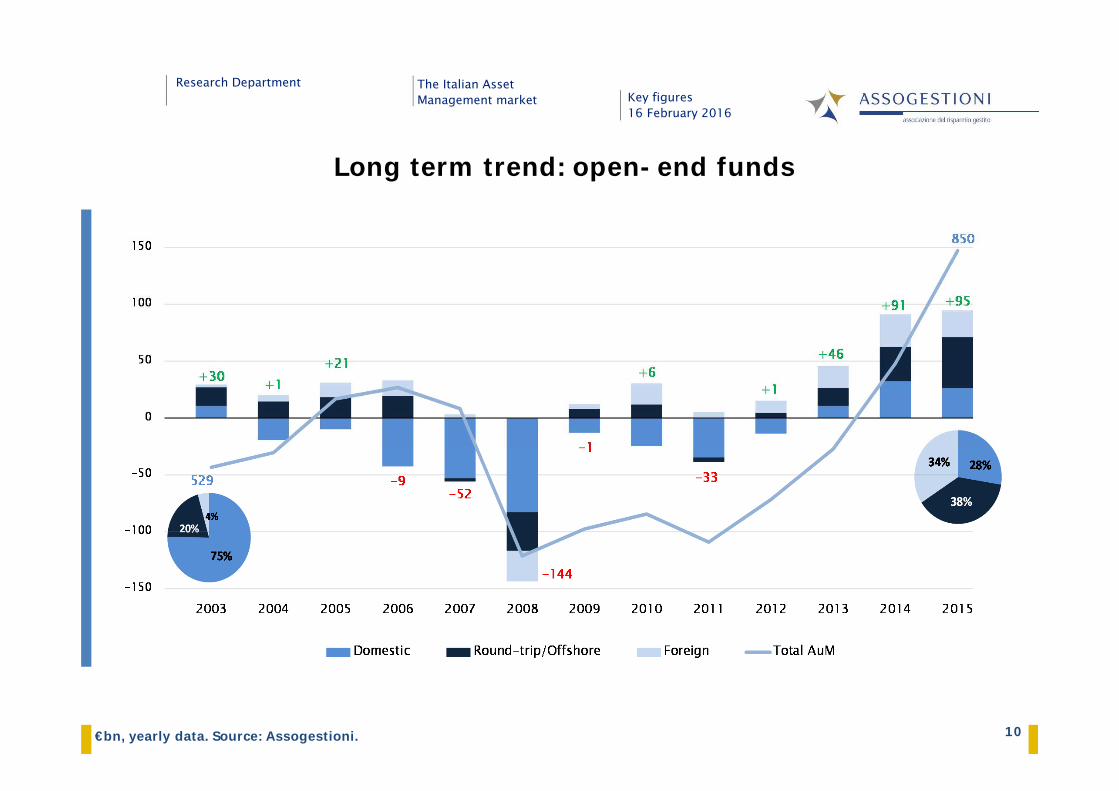
Long term trend: open-end funds
€bn, yearly data. Source: Assogestioni.
Research Department The Italian Asset Management market Key figures
16 February 2016
11
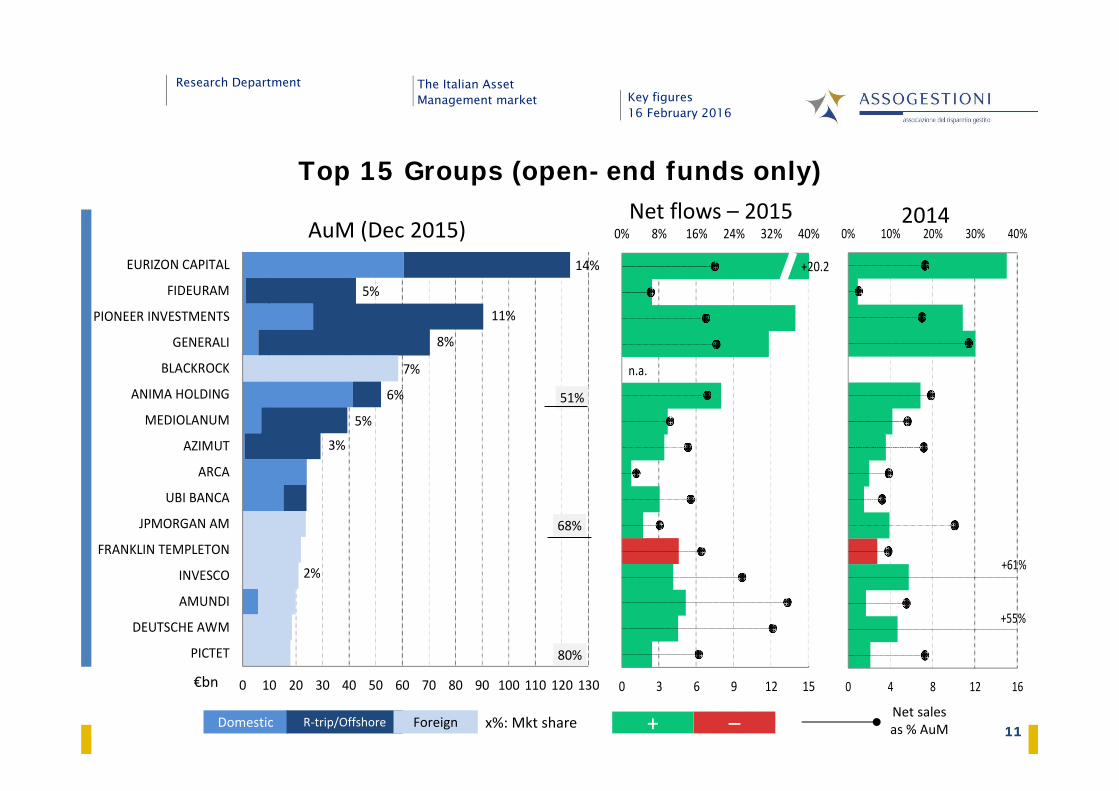
+61%
+55%
0% 10% 20% 30% 40%
0 4 8 12 16
n.a.
+20.2
0% 8% 16% 24% 32% 40%
0 3 6 9 12 15
80%
68%
6%
8%
11%
5%
14%
2%
5%
3%
51%
7%
0 10 20 30 40 50 60 70 80 90 100 110 120 130
PICTET
DEUTSCHE AWM
AMUNDI
INVESCO
FRANKLIN TEMPLETON
JPMORGAN AM
UBI BANCA
ARCA
AZIMUT
MEDIOLANUM
ANIMA HOLDING
BLACKROCK
GENERALI
PIONEER INVESTMENTS
FIDEURAM
EURIZON CAPITAL
Top 15 Groups (open-end funds only)
11Net sales as % AuMDomestic
€bn
AuM (Dec 2015)Net flows – 2015 2014
R‐trip/Offshore + –x%: Mkt shareForeign
Research Department The Italian Asset Management market Key figures
16 February 2016
12
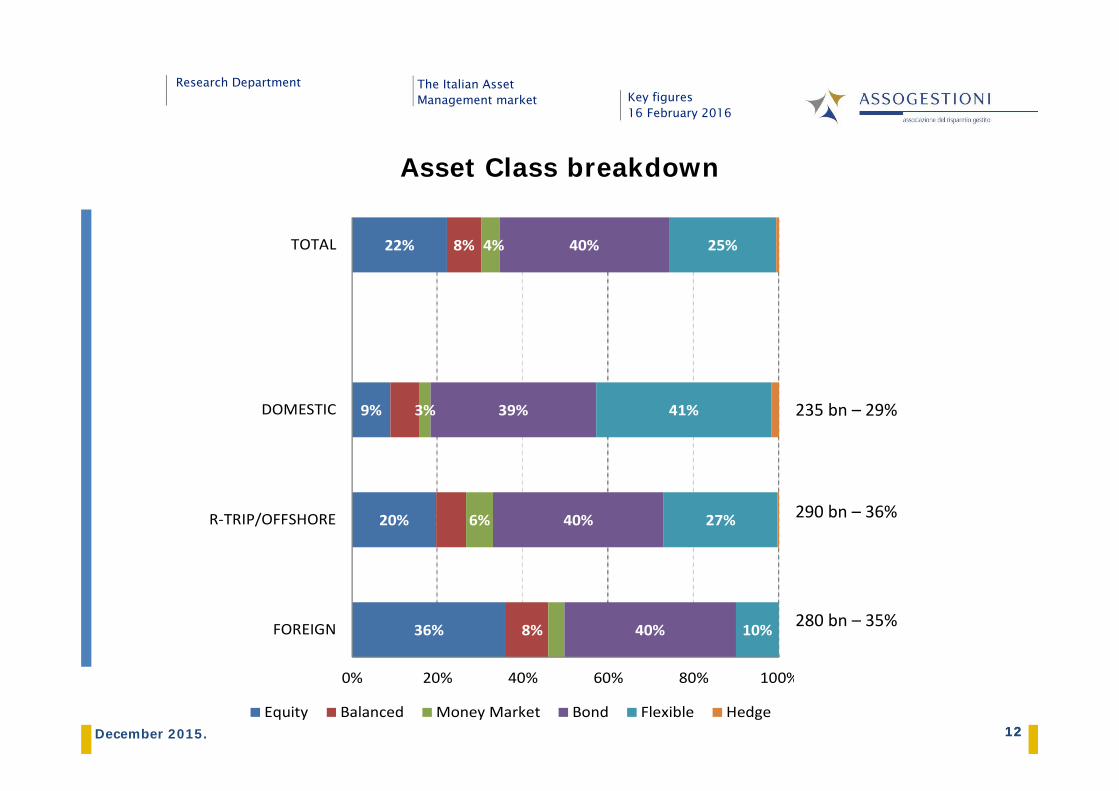
36%
20%
9%
22% 8%
8%
6%
3%
4%
40%
40%
39%
40%
10%
27%
41%
25%
0% 20% 40% 60% 80% 100%
FOREIGN
R‐TRIP/OFFSHORE
DOMESTIC
TOTAL
Equity Balanced Money Market Bond Flexible Hedge
Asset Class breakdown
12December 2015.
235 bn – 29%
290 bn – 36%
280 bn – 35%
Research Department The Italian Asset Management market Key figures
16 February 2016
13
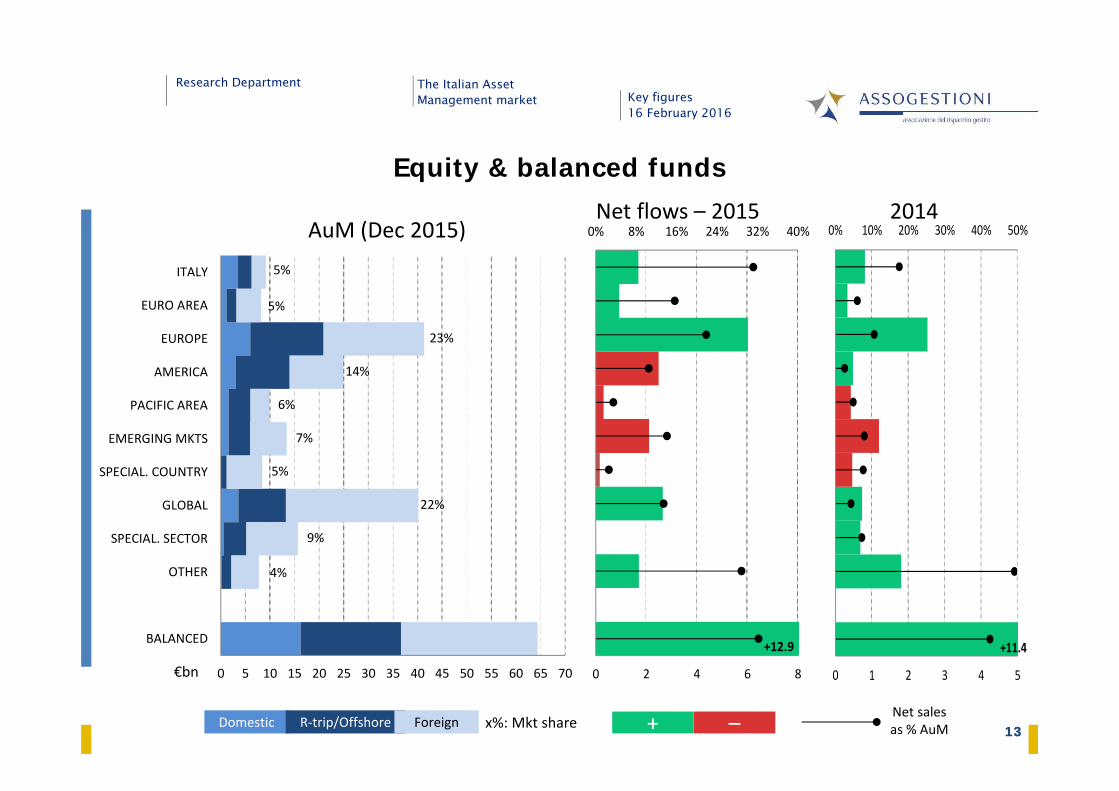
+12.9
0% 8% 16% 24% 32% 40%
0 2 4 6 8
4%
9%
22%
5%
7%
6%
14%
23%
5%
5%
0 5 10 15 20 25 30 35 40 45 50 55 60 65 70
BALANCED
OTHER
SPECIAL. SECTOR
GLOBAL
SPECIAL. COUNTRY
EMERGING MKTS
PACIFIC AREA
AMERICA
EUROPE
EURO AREA
ITALY
+11.4
0% 10% 20% 30% 40% 50%
0 1 2 3 4 5
Equity & balanced funds
Net sales as % AuMDomestic
€bn
AuM (Dec 2015)Net flows – 2015 2014
R‐trip/Offshore + –x%: Mkt shareForeign 13
Research Department The Italian Asset Management market Key figures
16 February 2016
14
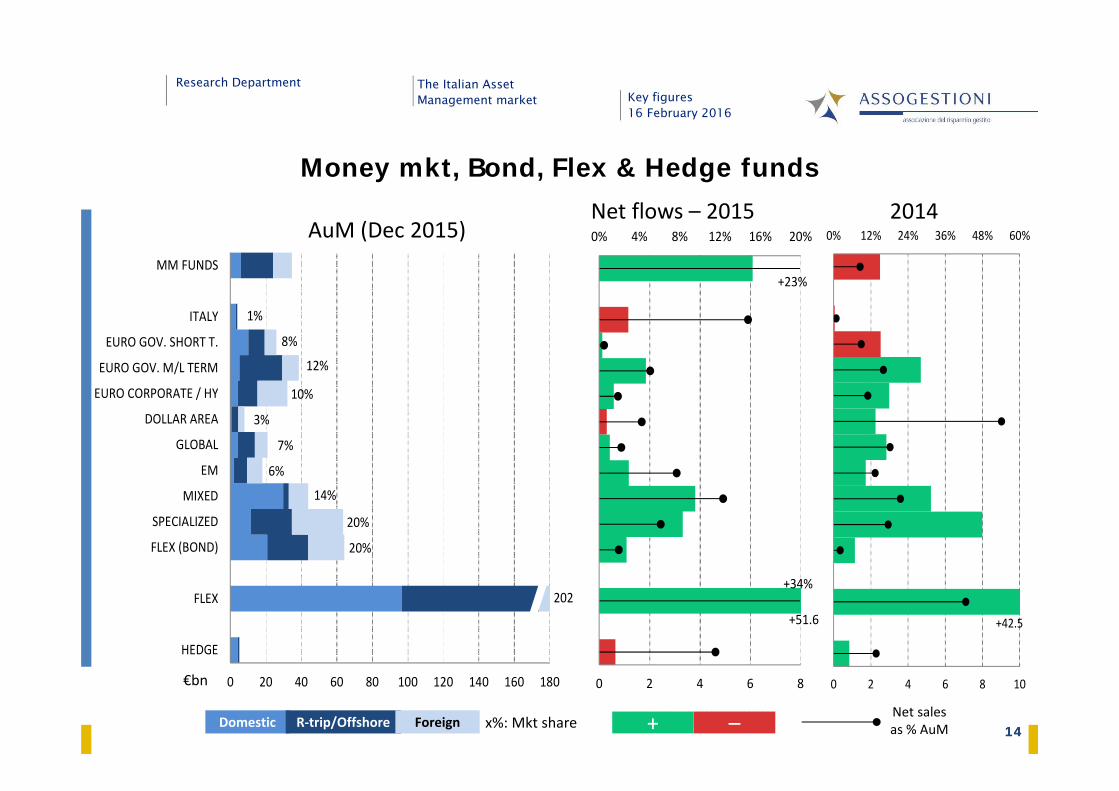
+34%
+23%
+51.6
0% 4% 8% 12% 16% 20%
0 2 4 6 8
1%
202
20%
20%
14%
6%
7%
3%
10%
12%
8%
0 20 40 60 80 100 120 140 160 180
HEDGE
FLEX
FLEX (BOND)
SPECIALIZED
MIXED
EM
GLOBAL
DOLLAR AREA
EURO CORPORATE / HY
EURO GOV. M/L TERM
EURO GOV. SHORT T.
ITALY
MM FUNDS
Net sales as % AuMDomestic
€bn
AuM (Dec 2015)Net flows – 2015 2014
R‐trip/Offshore + –x%: Mkt shareForeign 14
Money mkt, Bond, Flex & Hedge funds
+42.5
0% 12% 24% 36% 48% 60%
0 2 4 6 8 10
Research Department The Italian Asset Management market Key figures
16 February 2016
15
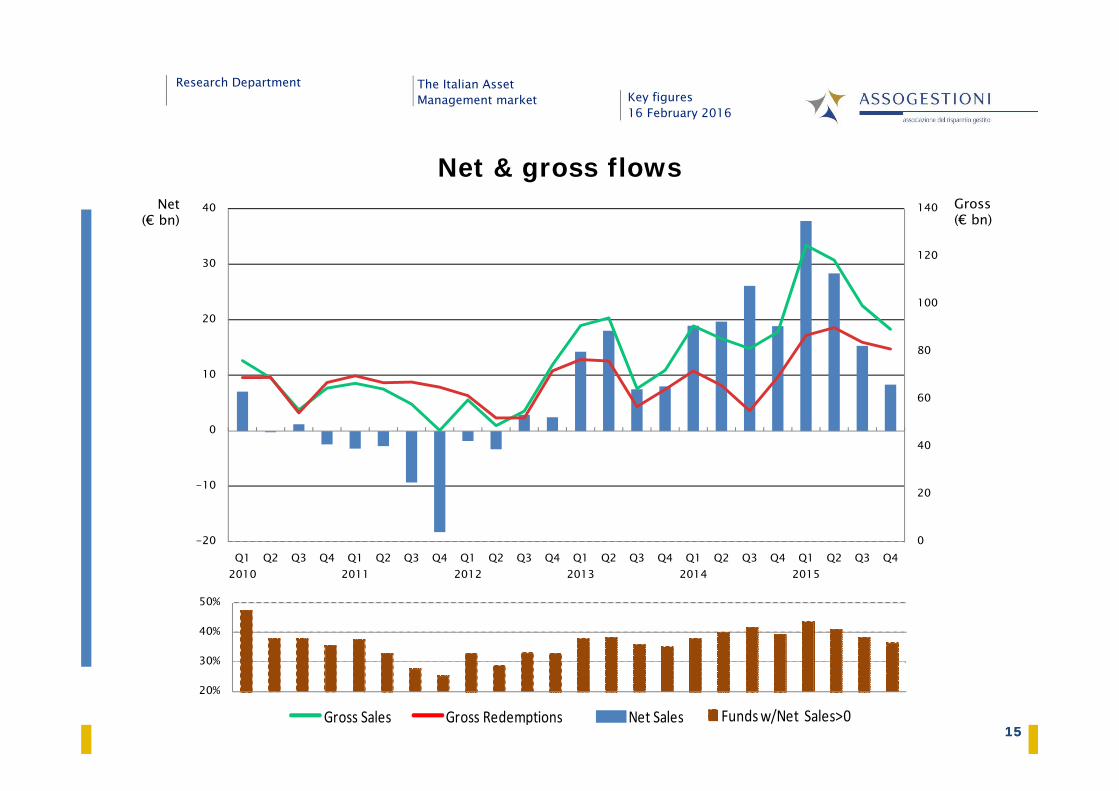
20%
30%
40%
50%
0
20
40
60
80
100
120
140
-20
-10
0
10
20
30
40
Q12010
Q2 Q3 Q4 Q12011
Q2 Q3 Q4 Q12012
Q2 Q3 Q4 Q12013
Q2 Q3 Q4 Q12014
Q2 Q3 Q4 Q12015
Q2 Q3 Q4
Net & gross flowsNet
(€ bn)Gross(€ bn)
15Gross Sales Gross Redemptions Net Sales Funds w/Net Sales>0
Research Department The Italian Asset Management market Key figures
16 February 2016
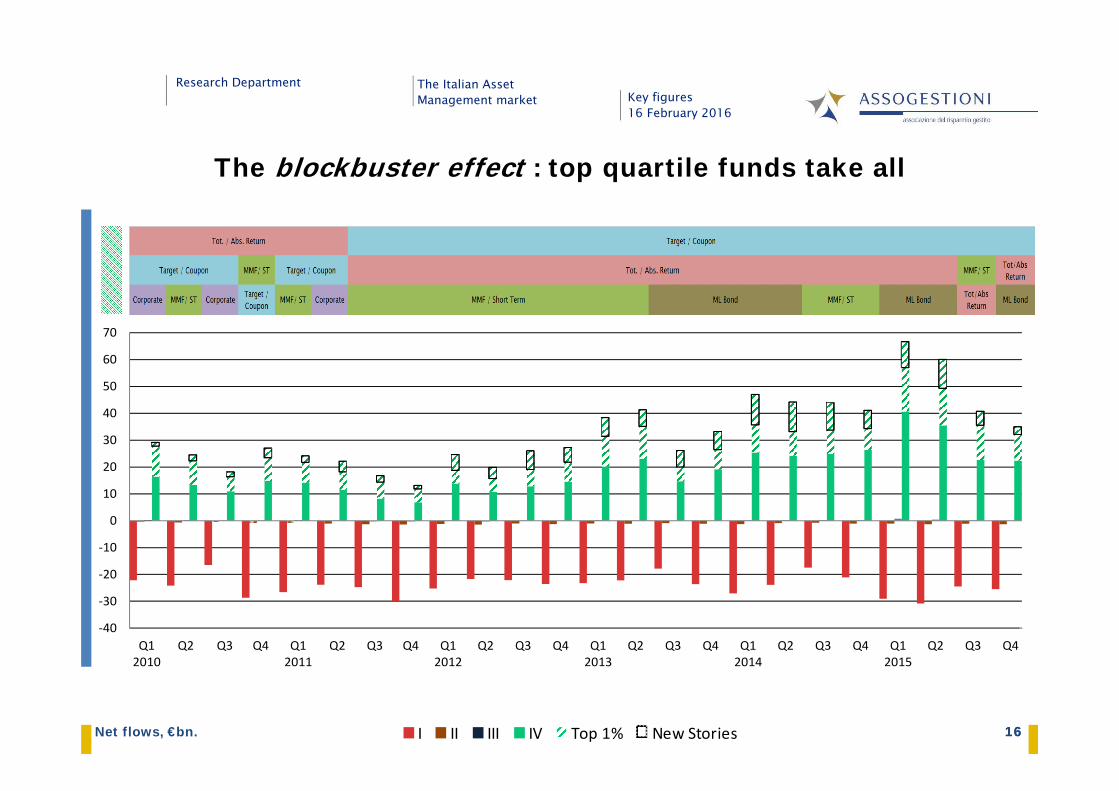
16
‐40
‐30
‐20
‐10
0
10
20
30
40
50
60
70
Q12010
Q2 Q3 Q4 Q12011
Q2 Q3 Q4 Q12012
Q2 Q3 Q4 Q12013
Q2 Q3 Q4 Q12014
Q2 Q3 Q4 Q12015
Q2 Q3 Q4
The blockbuster effect : top quartile funds take all
16Net flows, €bn. I II III IV Top 1% New Stories
Research Department The Italian Asset Management market Key figures
16 February 2016
17
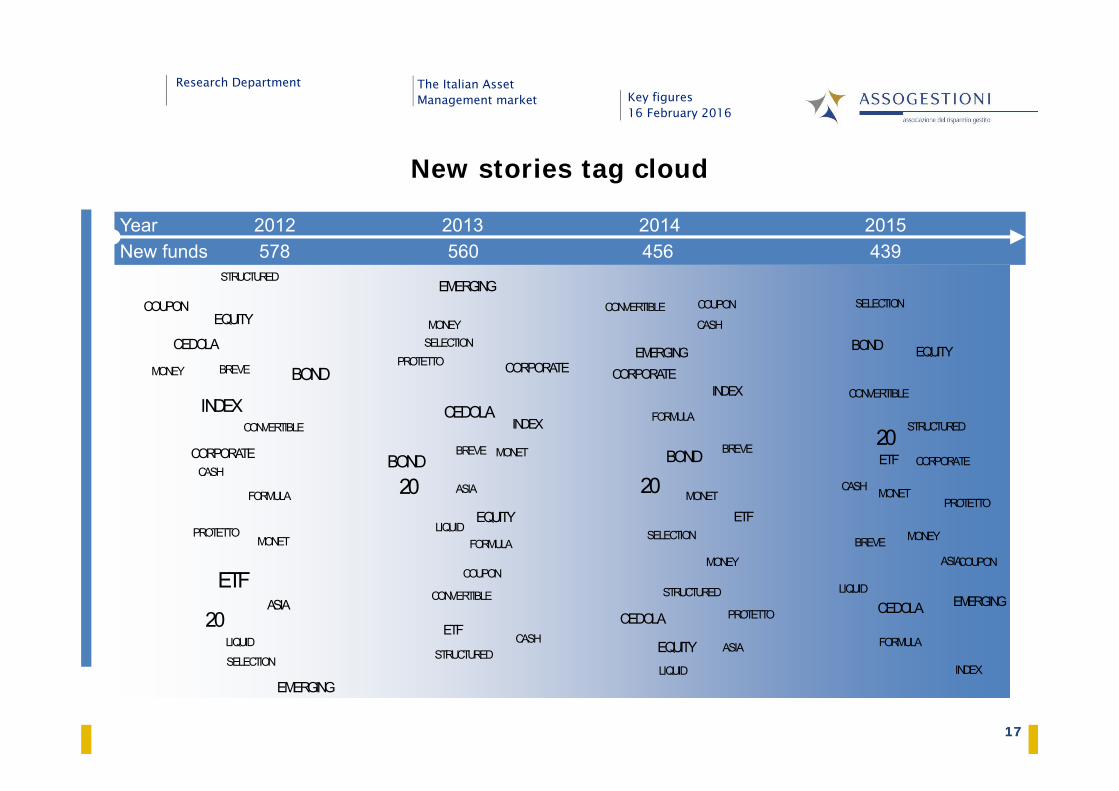
New stories tag cloud
2012 2013 2014 2015New funds 578Year
560 456 439
17
CEDOLA
COUPON
20
INDEX
CORPORATE
EMERGING
ASIAETF
STRUCTURED
FORMULA
SELECTION
CONVERTIBLE
PROTETTOMONET
MONEY
LIQUID
CASH
BREVE BOND
EQUITY
CEDOLA
COUPON
20
INDEX
CORPORATE
EMERGING
ASIA
ETF
STRUCTURED
FORMULA
SELECTION
CONVERTIBLE
PROTETTO
MONET
MONEY
LIQUID
CASH
BREVEBOND
EQUITY
CEDOLA
COUPON
20
INDEXCORPORATE
EMERGING
ASIA
ETF
STRUCTURED
FORMULA
SELECTION
CONVERTIBLE
PROTETTO
MONET
MONEY
LIQUID
CASH
BREVEBOND
EQUITY
CEDOLA
COUPON
20
INDEX
CORPORATE
EMERGING
ASIA
ETF
STRUCTURED
FORMULA
SELECTION
CONVERTIBLE
PROTETTOMONET
MONEY
LIQUID
CASH
BREVE
BOND EQUITY
Research Department The Italian Asset Management market Key figures
16 February 2016
18
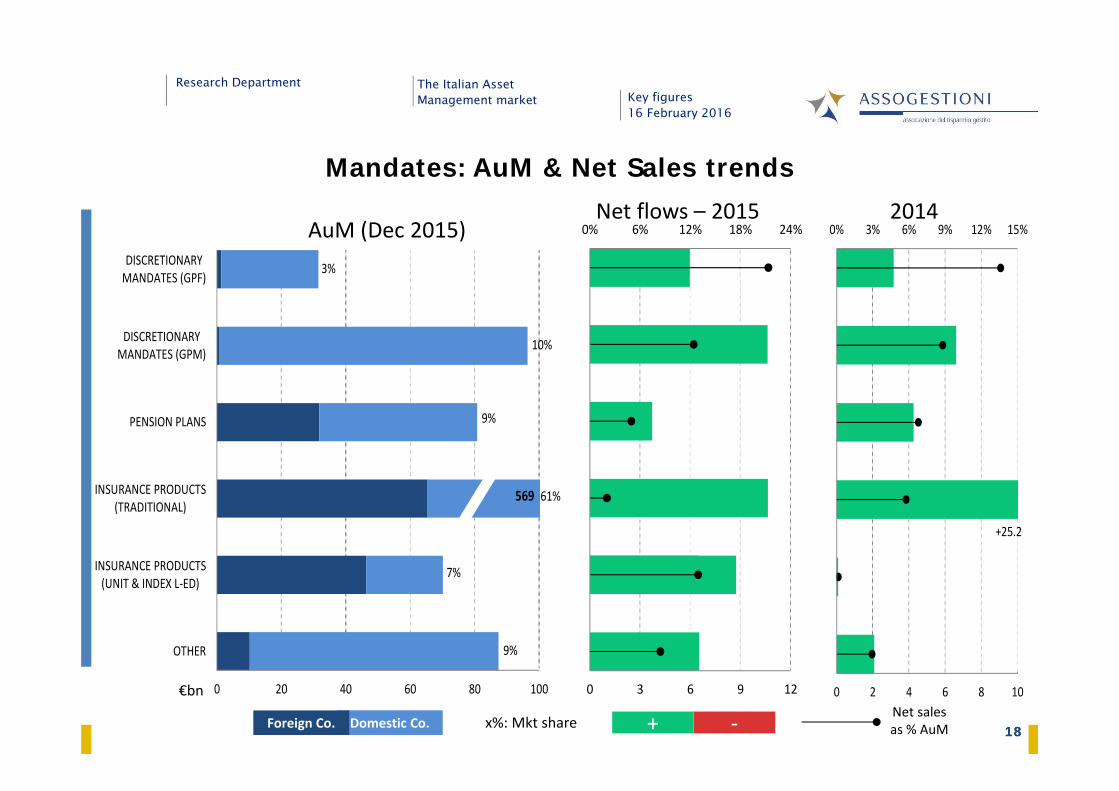
0% 6% 12% 18% 24%
0 3 6 9 12
9%
7%
61%
9%
10%
3%
569
0 20 40 60 80 100
OTHER
INSURANCE PRODUCTS(UNIT & INDEX L‐ED)
INSURANCE PRODUCTS(TRADITIONAL)
PENSION PLANS
DISCRETIONARYMANDATES (GPM)
DISCRETIONARYMANDATES (GPF)
+25.2
0% 3% 6% 9% 12% 15%
0 2 4 6 8 10
18Net sales as % AuM
€bn
AuM (Dec 2015)Net flows – 2015 2014
+ ‐x%: Mkt shareDomestic Co.Foreign Co.
Mandates: AuM & Net Sales trends
Research Department The Italian Asset Management market Key figures
16 February 2016
19
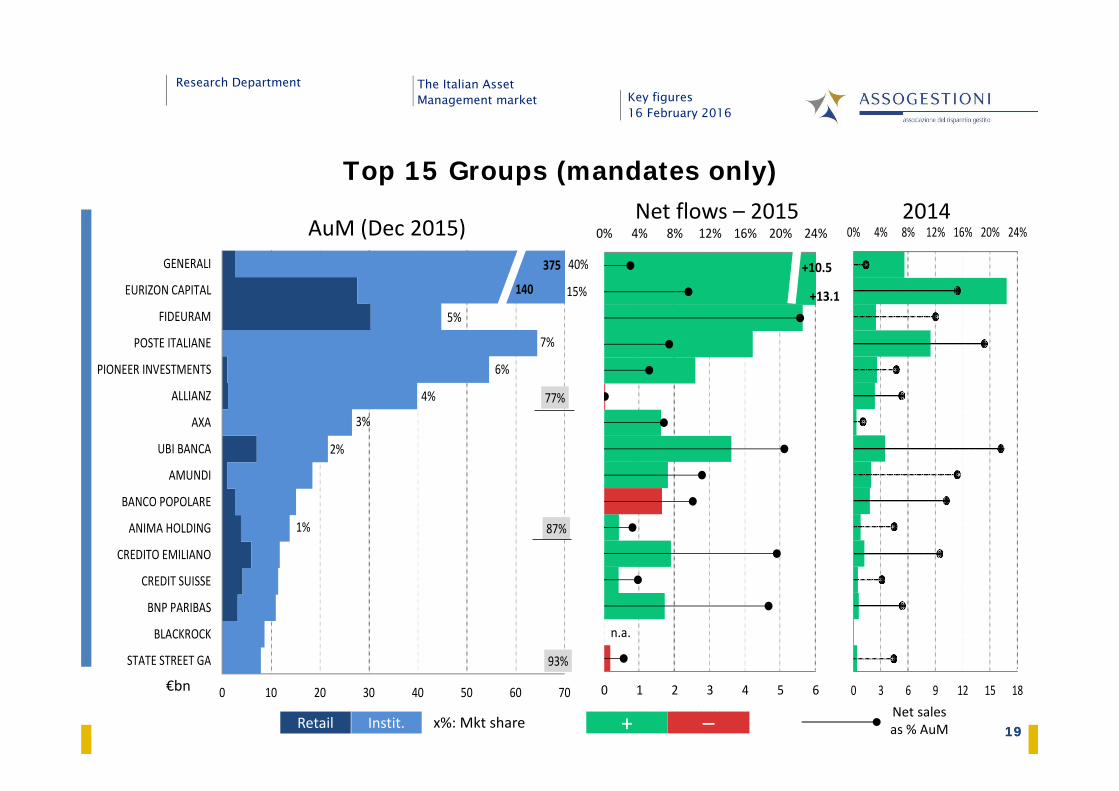
n.a.
+13.1
+10.5
0% 4% 8% 12% 16% 20% 24%
0 1 2 3 4 5 6
140
40%
93%
7%
1%
6%
87%
375
2%
3%
77%4%
15%
5%
0 10 20 30 40 50 60 70
STATE STREET GA
BLACKROCK
BNP PARIBAS
CREDIT SUISSE
CREDITO EMILIANO
ANIMA HOLDING
BANCO POPOLARE
AMUNDI
UBI BANCA
AXA
ALLIANZ
PIONEER INVESTMENTS
POSTE ITALIANE
FIDEURAM
EURIZON CAPITAL
GENERALI
0% 4% 8% 12% 16% 20% 24%
0 3 6 9 12 15 18
Top 15 Groups (mandates only)
19Net sales as % AuMRetail
€bn
AuM (Dec 2015)Net flows – 2015 2014
Instit. + –x%: Mkt share
Research Department The Italian Asset Management market Key figures
16 February 2016
20
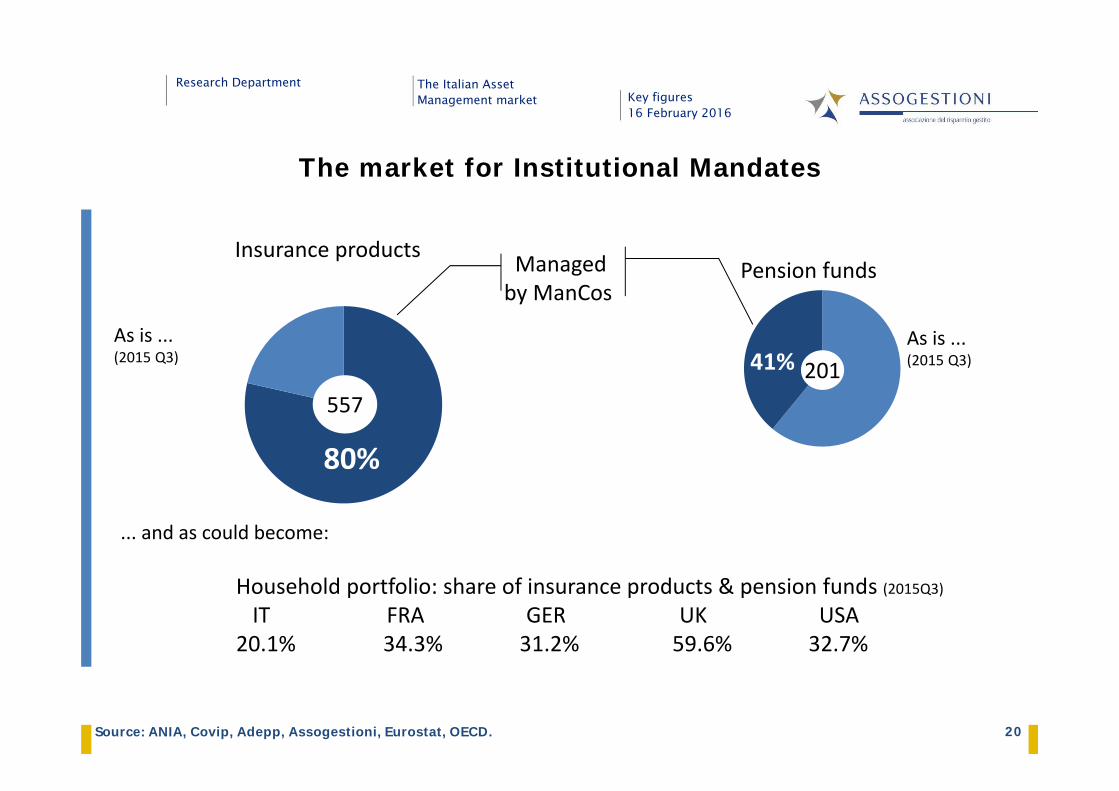
41%
80%
The market for Institutional Mandates
Household portfolio: share of insurance products & pension funds (2015Q3)IT FRA GER UK USA
20.1% 34.3% 31.2% 59.6% 32.7%
Managedby ManCos
As is ...(2015 Q3)
... and as could become:
Pension funds
201
Insurance products
557
Source: ANIA, Covip, Adepp, Assogestioni, Eurostat, OECD.
As is ...(2015 Q3)
Key figures16 February 2016
The Italian Asset Management market
Research Department
1. The Italian Asset Management market Summary statistics
Open-end funds
Mandates
The recovery, some tentative explanations
2. The European Investment Fund Industry Net assets & sales by fund / fund group domicile
3. Savings & Wealth Household saving rate: trend & int’l comparison
Household financial portfolio & private pension plans
Research Department The Italian Asset Management market Key figures
16 February 2016
22
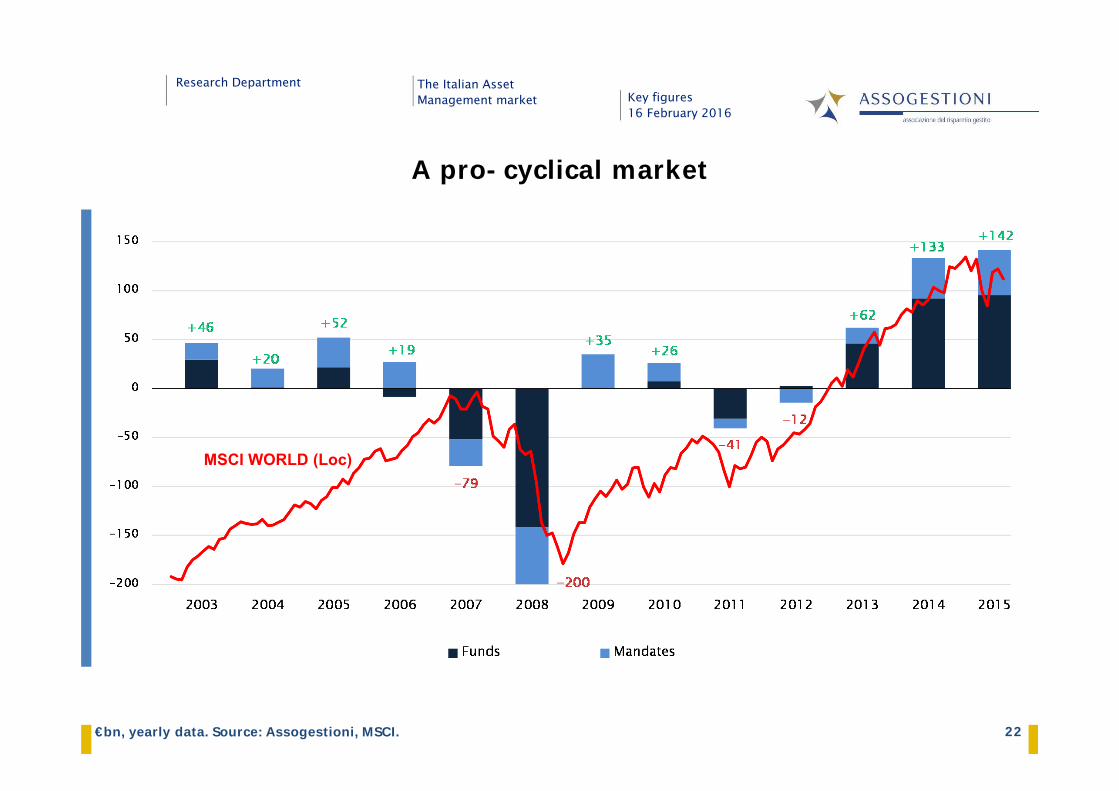
A pro-cyclical market
€bn, yearly data. Source: Assogestioni, MSCI.
MSCI WORLD (Loc)
Research Department The Italian Asset Management market Key figures
16 February 2016
23
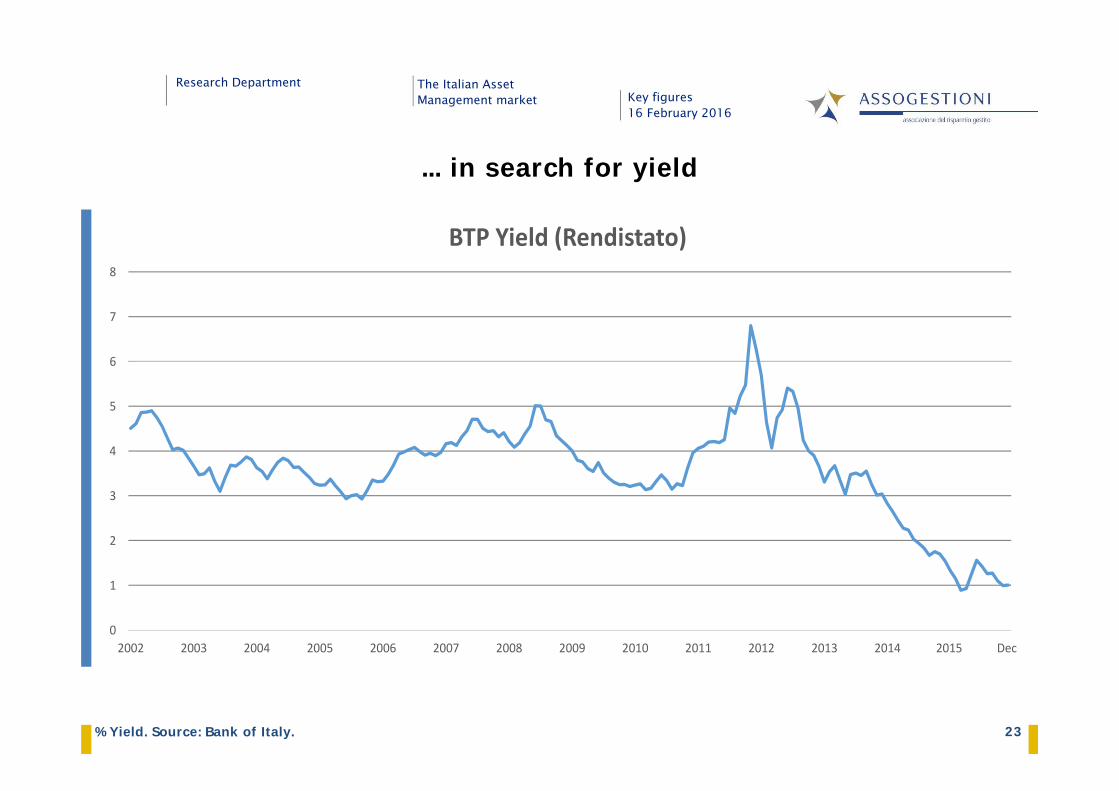
... in search for yield
% Yield. Source: Bank of Italy.
0
1
2
3
4
5
6
7
8
2002 2003 2004 2005 2006 2007 2008 2009 2010 2011 2012 2013 2014 2015 Dec
BTP Yield (Rendistato)
Research Department The Italian Asset Management market Key figures
16 February 2016
24
1741 26 39 43 48 69
4071
1559
18 29
‐74
17
3634
‐49
31
‐44
35
‐68 ‐46
68
‐22 ‐23 ‐31 ‐39
2413
2319
27
21 13 2744
29
14
‐40‐80 ‐56
9120
‐11
19
‐10 ‐27 ‐44 ‐49
8
‐22
20
2856
35
41
38
3841
57 51
5531
28
28
23
53
38
‐150
‐100
‐50
0
50
100
150
200
1999 2000 2001 2002 2003 2004 2005 2006 2007 2008 2009 2010 2011 2012 2013 2014 2015Q3
€bn
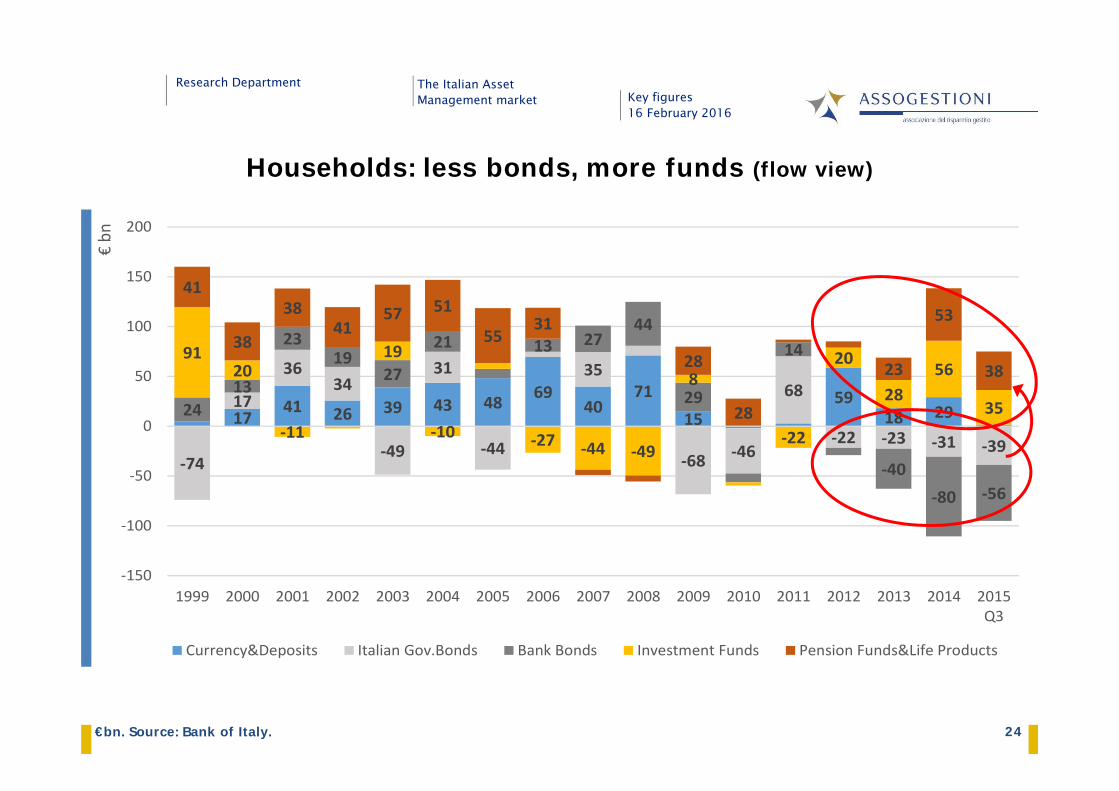
Currency&Deposits Italian Gov.Bonds Bank Bonds Investment Funds Pension Funds&Life Products
Households: less bonds, more funds (flow view)
€bn. Source: Bank of Italy.

Research Department The Italian Asset Management market Key figures
16 February 2016
25
Total Issued by banks Total Listed
Italy € bn % % % % % % %1995 1,799 38.2% 22.6% 1.9% 19.3% 2.8% 5.8% 8.7%2000 3,041 22.9% 16.5% 6.4% 29.5% 5.4% 17.0% 10.0%2005 3,864 23.6% 19.0% 7.1% 28.3% 2.4% 11.0% 14.2%2010 3,633 30.7% 19.7% 10.3% 20.1% 2.0% 7.5% 17.6%
2012 3,732 31.6% 19.3% 10.0% 19.7% 1.6% 7.3% 17.8%
2014 3,951 31.4% 13.6% 6.2% 22.0% 1.6% 9.6% 19.4%
2015 Q3 4,014 30.9% 10.8% 5.0% 23.8% 1.7% 10.4% 20.1%
2015 Q3France 4,804 28.5% 1.4% n.a. 20.1% 4.2% 6.8% 34.3%Germany 5,373 39.3% 3.3% n.a. 9.8% 4.6% 9.7% 31.2%UK 8,126 24.2% 1.6% n.a. 6.4% 2.4% 3.9% 59.6%USA 61,523 13.7% 5.0% n.a. 33.8% n.a. 12.9% 32.7%
Total Asset Currency & deposits
Investment funds
Pension funds & life pr
Bonds Stocks
Households: less bonds, more funds (stock view)
%. Source: Eurostat, OECD, BCE, Deutsche Bundesbank.
Research Department The Italian Asset Management market Key figures
16 February 2016
26
0%
5%
10%
15%
20%
25%
0%
5%
10%
15%
20%
25%
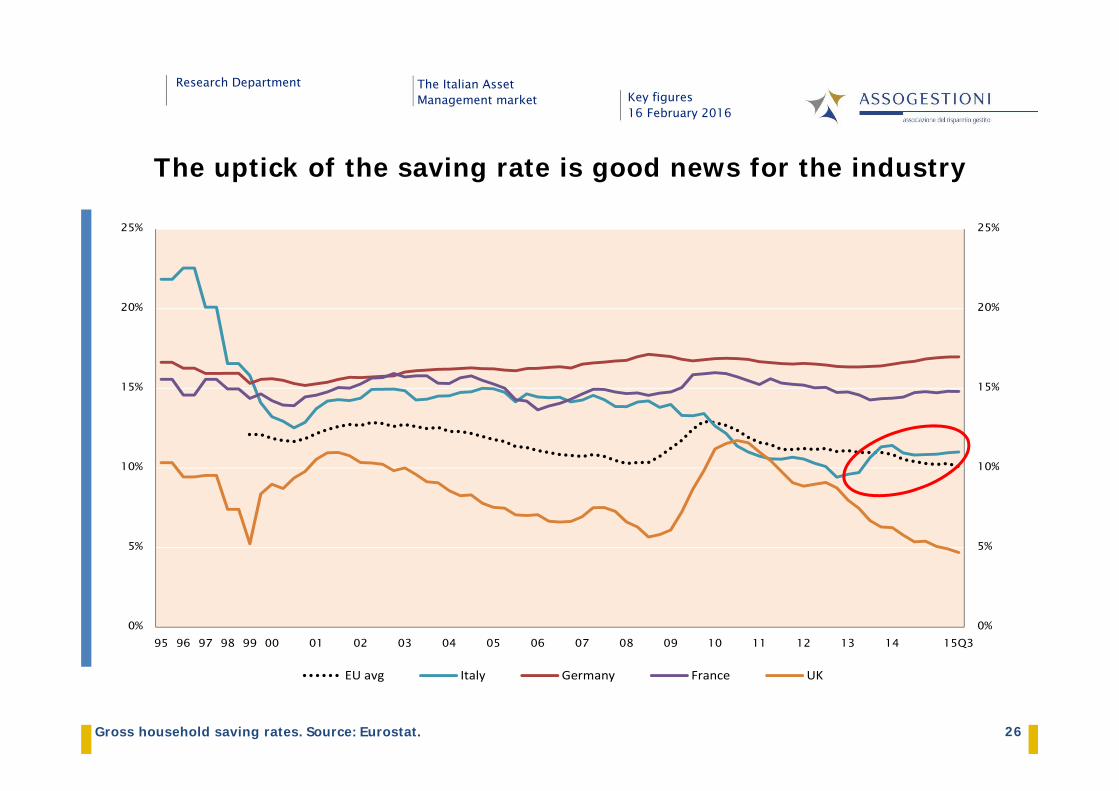
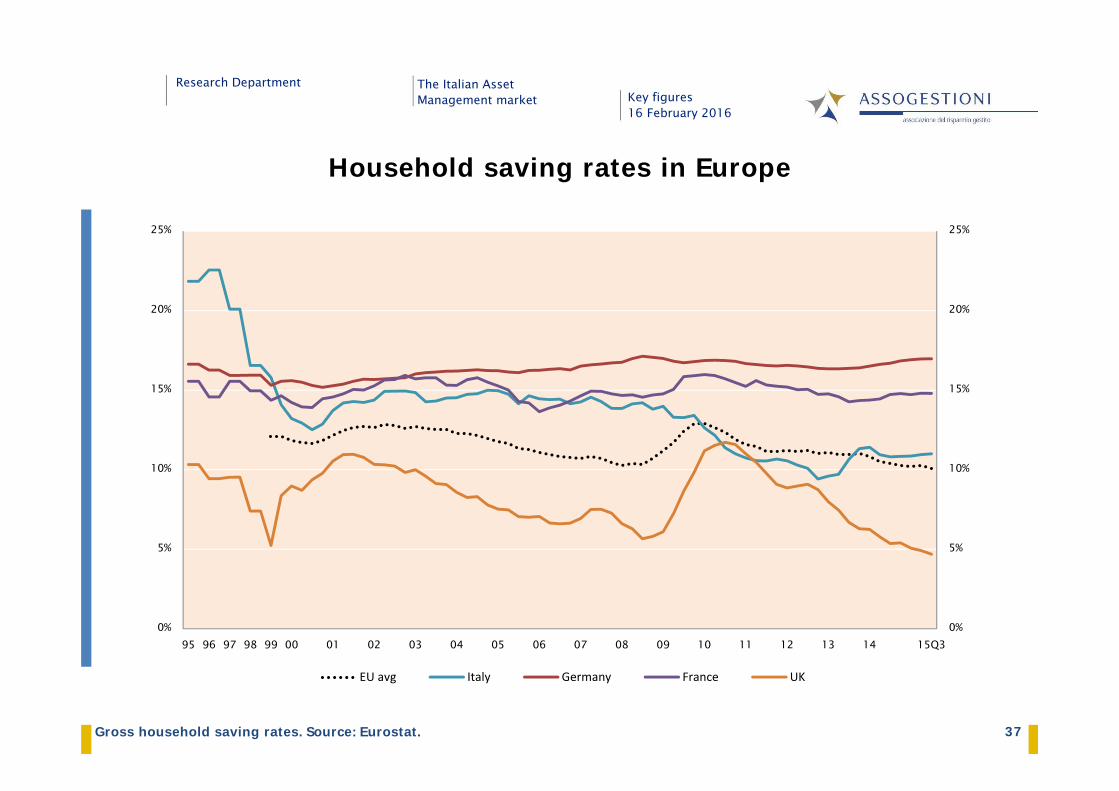
95 96 97 98 99 00 01 02 03 04 05 06 07 08 09 10 11 12 13 14 15Q3
EU avg Italy Germany France UK
The uptick of the saving rate is good news for the industry
Gross household saving rates. Source: Eurostat.
Research Department The Italian Asset Management market Key figures
16 February 2016
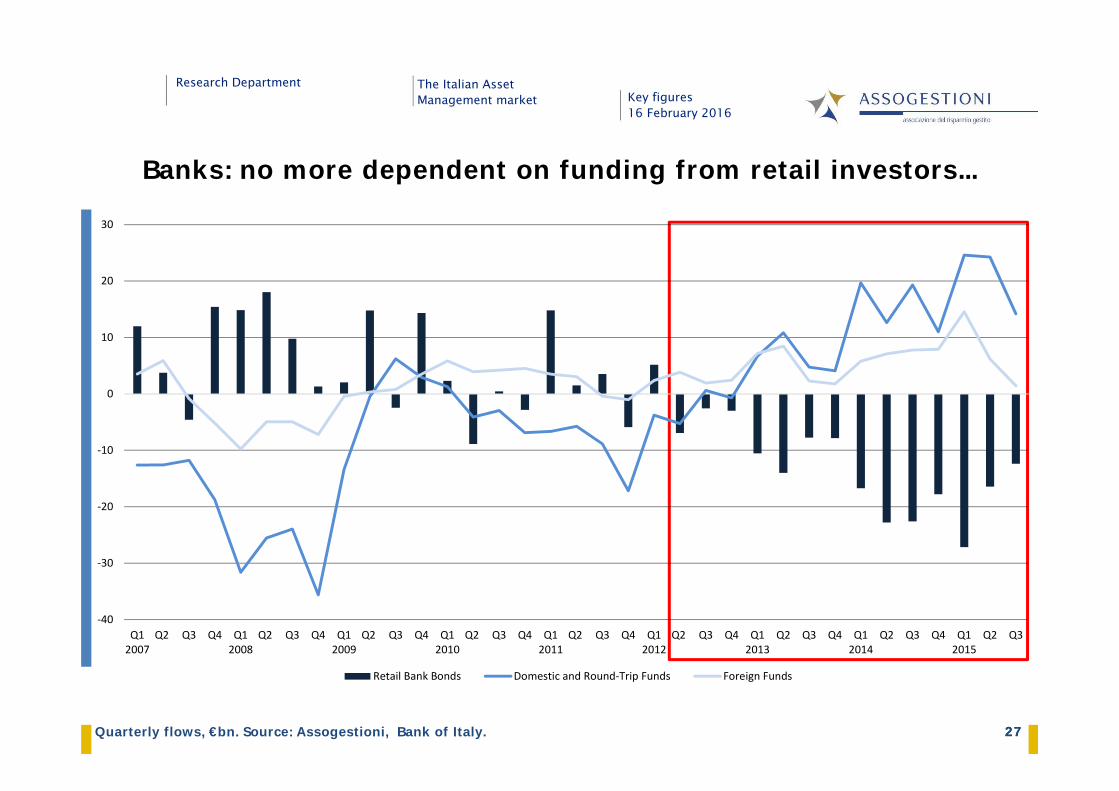
27Quarterly flows, €bn. Source: Assogestioni, Bank of Italy.
Banks: no more dependent on funding from retail investors...
27
‐40
‐30
‐20
‐10
0
10
20
30
Q12007
Q2 Q3 Q4 Q12008
Q2 Q3 Q4 Q12009
Q2 Q3 Q4 Q12010
Q2 Q3 Q4 Q12011
Q2 Q3 Q4 Q12012
Q2 Q3 Q4 Q12013
Q2 Q3 Q4 Q12014
Q2 Q3 Q4 Q12015
Q2 Q3
Retail Bank Bonds Domestic and Round‐Trip Funds Foreign Funds
Research Department The Italian Asset Management market Key figures
16 February 2016
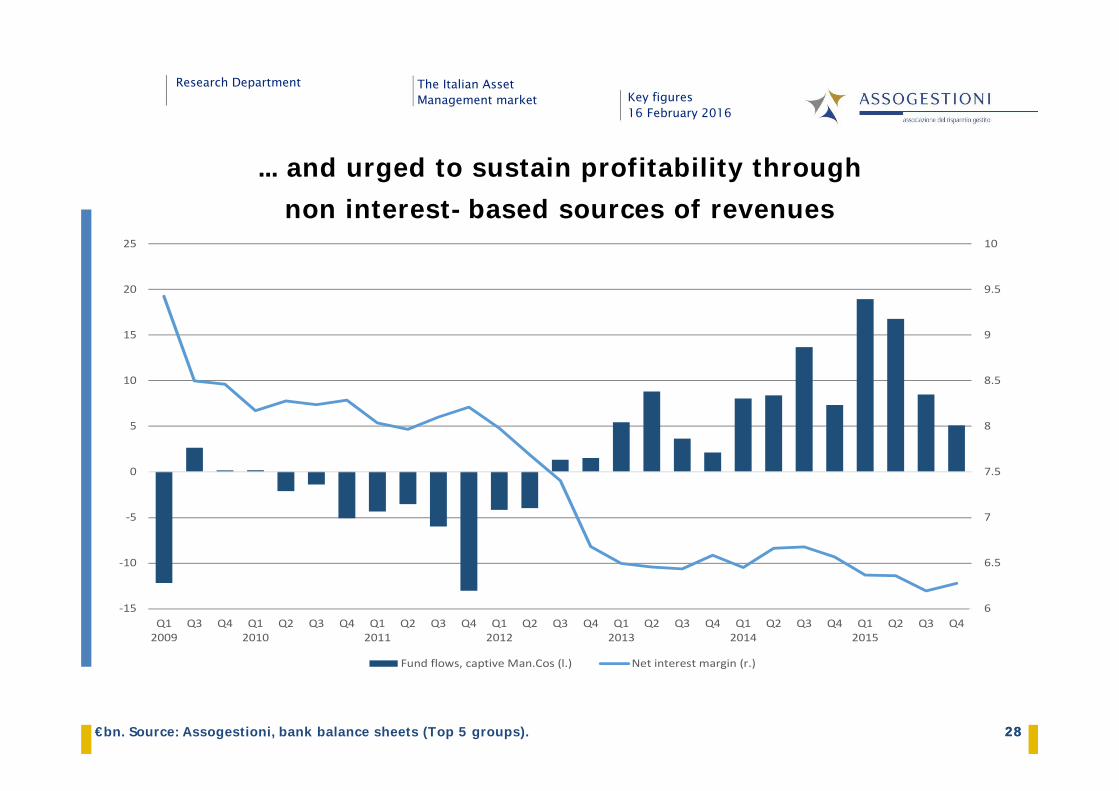
28€bn. Source: Assogestioni, bank balance sheets (Top 5 groups). 28
... and urged to sustain profitability throughnon interest-based sources of revenues
6
6.5
7
7.5
8
8.5
9
9.5
10
‐15
‐10
‐5
0
5
10
15
20
25
Q12009
Q3 Q4 Q12010
Q2 Q3 Q4 Q12011
Q2 Q3 Q4 Q12012
Q2 Q3 Q4 Q12013
Q2 Q3 Q4 Q12014
Q2 Q3 Q4 Q12015
Q2 Q3 Q4
Fund flows, captive Man.Cos (l.) Net interest margin (r.)

Research Department The Italian Asset Management market Key figures
16 February 2016
29
+34%
+23%
+51.6
0% 4% 8% 12% 16% 20%
0 2 4 6 8
1%
202
20%
20%
14%
6%
7%
3%
10%
12%
8%
0 20 40 60 80 100 120 140 160 180
HEDGE
FLEX
FLEX (BOND)
SPECIALIZED
MIXED
EM
GLOBAL
DOLLAR AREA
EURO CORPORATE / HY
EURO GOV. M/L TERM
EURO GOV. SHORT T.
ITALY
MM FUNDS
+42.5
0% 12% 24% 36% 48% 60%
0 2 4 6 8 10
AuM (Dec 2015)Net flows – 2015 2014
Net sales as % AuMDomestic
€bn
R‐trip/Offshore + –x%: Mkt shareForeign 29
The success of funds with high margins (target-date funds)
Key figures16 February 2016
The Italian Asset Management market
Research Department
1. The Italian Asset Management market Summary statistics
Open-end funds
Mandates
The recovery, some tentative explanations
2. The European Investment Fund Industry Net assets & sales by fund / fund group domicile
3. Savings & Wealth Household saving rate: trend & int’l comparison
Household financial portfolio & private pension plans
Research Department The Italian Asset Management market Key figures
16 February 2016
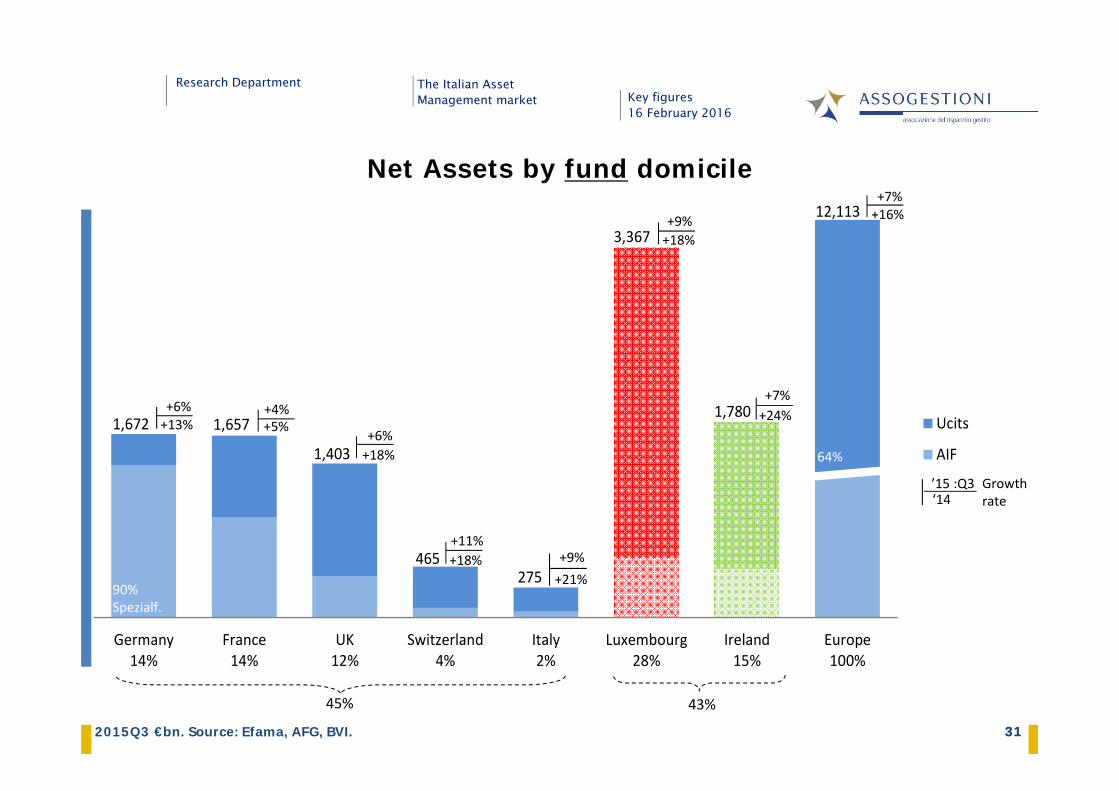
31
1,672 1,657
1,403
465275
3,367
1,780
12,113
Germany14%
France14%
UK12%
Switzerland4%
Italy2%
Luxembourg28%
Ireland15%
Europe100%
Ucits
AIF
312015Q3 €bn. Source: Efama, AFG, BVI.
Net Assets by fund domicile
+24%+7%
+16%+7%
+18%+9%
+13%+6%
+5%+4%
+18%+6%
+18%+11%
+21%+9%
64%
Growth rate‘14
’15 :Q3
45% 43%
90% Spezialf.
Research Department The Italian Asset Management market Key figures
16 February 2016
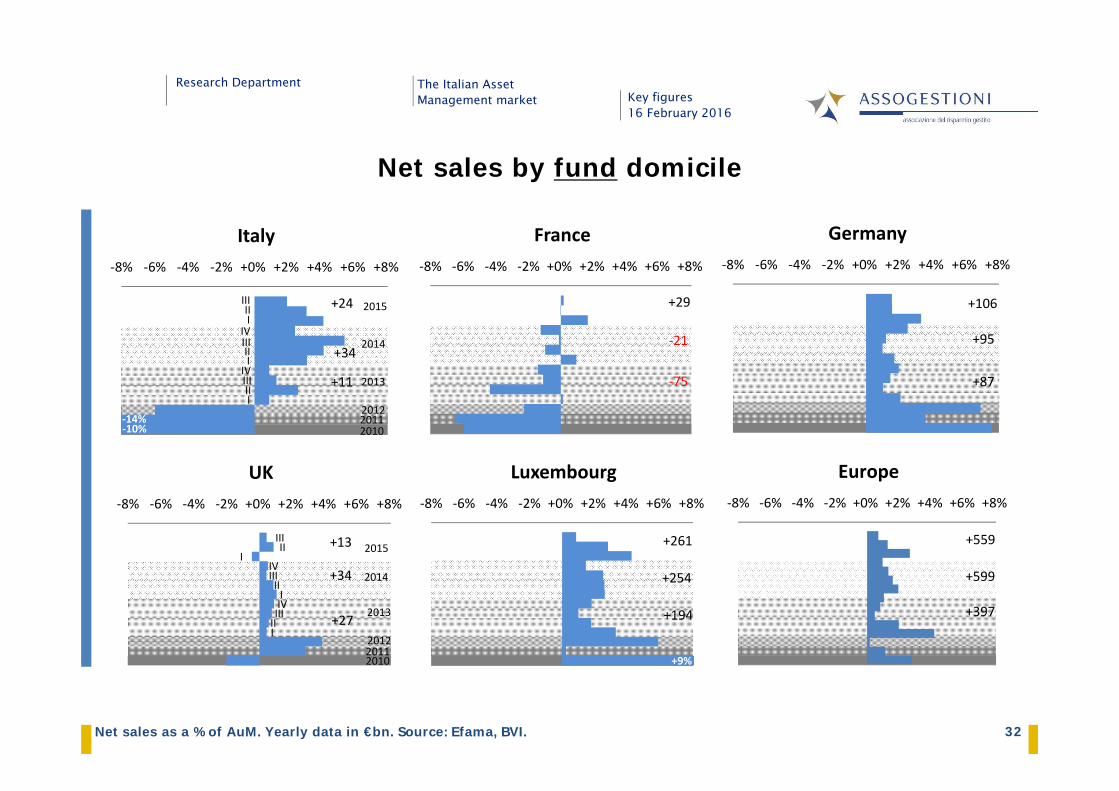
32
Net sales by fund domicile
Net sales as a % of AuM. Yearly data in €bn. Source: Efama, BVI.
‐75
‐21
‐7%
+29
‐8% ‐6% ‐4% ‐2% +0% +2% +4% +6% +8%
France
+87
+95
+106
‐8% ‐6% ‐4% ‐2% +0% +2% +4% +6% +8%
Germany
201020112012
+27 2013
+34 2014
+13 2015
IIIIIIIVI
IIIIIIV
IIIIII
‐8% ‐6% ‐4% ‐2% +0% +2% +4% +6% +8%
UK
+194
+254
+9%
+261
‐8% ‐6% ‐4% ‐2% +0% +2% +4% +6% +8%
Luxembourg
+397
+599
+559
‐8% ‐6% ‐4% ‐2% +0% +2% +4% +6% +8%
Europe
201020112012
+11 2013
+34
+24
2014
‐14%
+5.4%2015
‐10%
IIIIIIIVIIIIIIIVIIIIII
‐8% ‐6% ‐4% ‐2% +0% +2% +4% +6% +8%
Italy
Research Department The Italian Asset Management market Key figures
16 February 2016
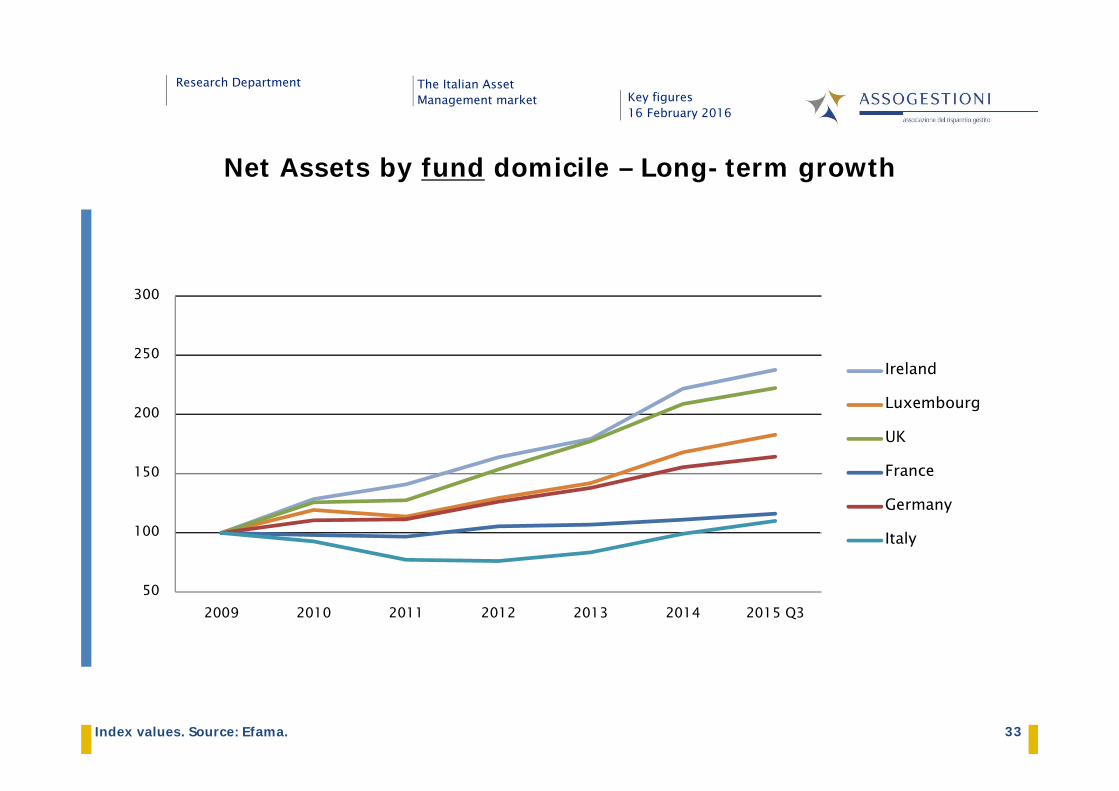
33Index values. Source: Efama.
Net Assets by fund domicile – Long-term growth
50
100
150
200
250
300
2009 2010 2011 2012 2013 2014 2015 Q3
Ireland
Luxembourg
UK
France
Germany
Italy
Research Department The Italian Asset Management market Key figures
16 February 2016
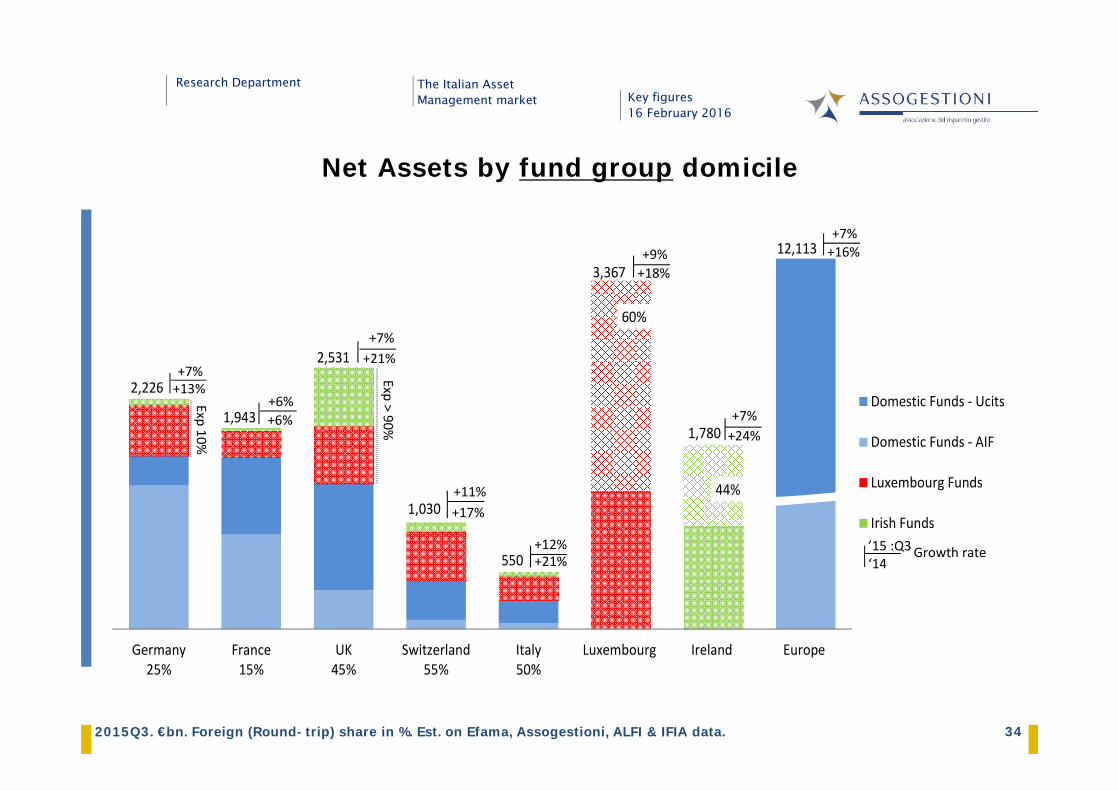
34
60%
44%
3,367
1,780
12,113
1,030
2,226
1,943
2,531
550
Germany25%
France15%
UK45%
Switzerland55%
Italy50%
Luxembourg Ireland Europe
Domestic Funds ‐ Ucits
Domestic Funds ‐ AIF
Luxembourg Funds
Irish Funds
Net Assets by fund group domicile
2015Q3. €bn. Foreign (Round-trip) share in %. Est. on Efama, Assogestioni, ALFI & IFIA data.Exp > 90%
Exp 10%
+13%+7%
Growth rate‘14’15 :Q3
+21%+7%
+6%+6%
+17%+11%
+21%+12%
+24%+7%
+16%+7%
+18%+9%
Research Department The Italian Asset Management market Key figures
16 February 2016
35
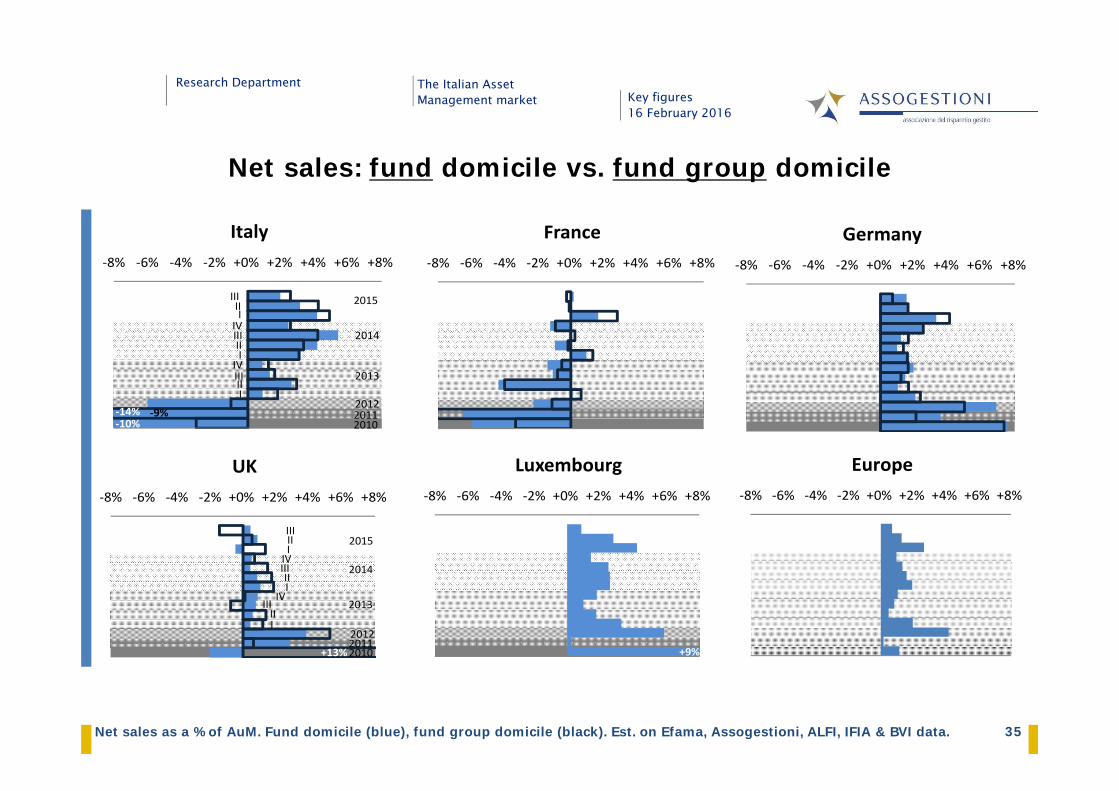
Net sales: fund domicile vs. fund group domicile
Net sales as a % of AuM. Fund domicile (blue), fund group domicile (black). Est. on Efama, Assogestioni, ALFI, IFIA & BVI data.
‐8% ‐6% ‐4% ‐2% +0% +2% +4% +6% +8%
Germany
201020112012
2013
2014
2015
III
IIIIVIIIIIIIVIIIIII
+13%
‐8% ‐6% ‐4% ‐2% +0% +2% +4% +6% +8%
UK
+9%
‐8% ‐6% ‐4% ‐2% +0% +2% +4% +6% +8%
Luxembourg‐8% ‐6% ‐4% ‐2% +0% +2% +4% +6% +8%
Europe
201020112012
2013
2014
‐9%
IIIIIIIVIIIIIIIVIIIIII
‐10%‐14%
2015
‐8% ‐6% ‐4% ‐2% +0% +2% +4% +6% +8%
Italy
‐6%
‐8% ‐6% ‐4% ‐2% +0% +2% +4% +6% +8%
France
Key figures16 February 2016
The Italian Asset Management market
Research Department
1. The Italian Asset Management market Summary statistics
Open-end funds
Mandates
The recovery, some tentative explanations
2. The European Investment Fund Industry Net assets & sales by fund / fund group domicile
3. Savings & Wealth Household saving rate: trend & int’l comparison
Household financial portfolio & private pension plans
Research Department The Italian Asset Management market Key figures
16 February 2016
37
Household saving rates in Europe
Gross household saving rates. Source: Eurostat.
0%
5%
10%
15%
20%
25%
0%
5%
10%
15%
20%
25%
95 96 97 98 99 00 01 02 03 04 05 06 07 08 09 10 11 12 13 14 15Q3
EU avg Italy Germany France UK
Research Department The Italian Asset Management market Key figures
16 February 2016
38
-1.0%
-0.5%
0.0%
0.5%
1.0%
1.5%
-1.5% -1.0% -0.5% 0.0% 0.5% 1.0%
∆ c
onsu
mpt
ion
∆ income
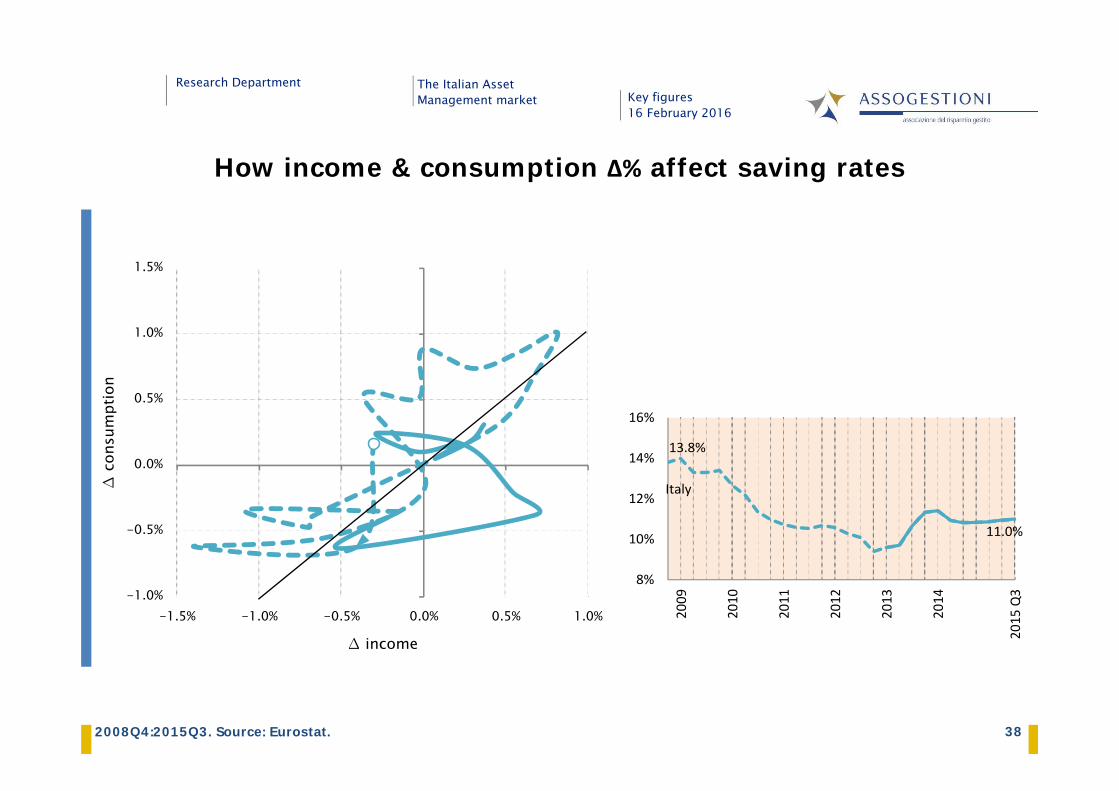
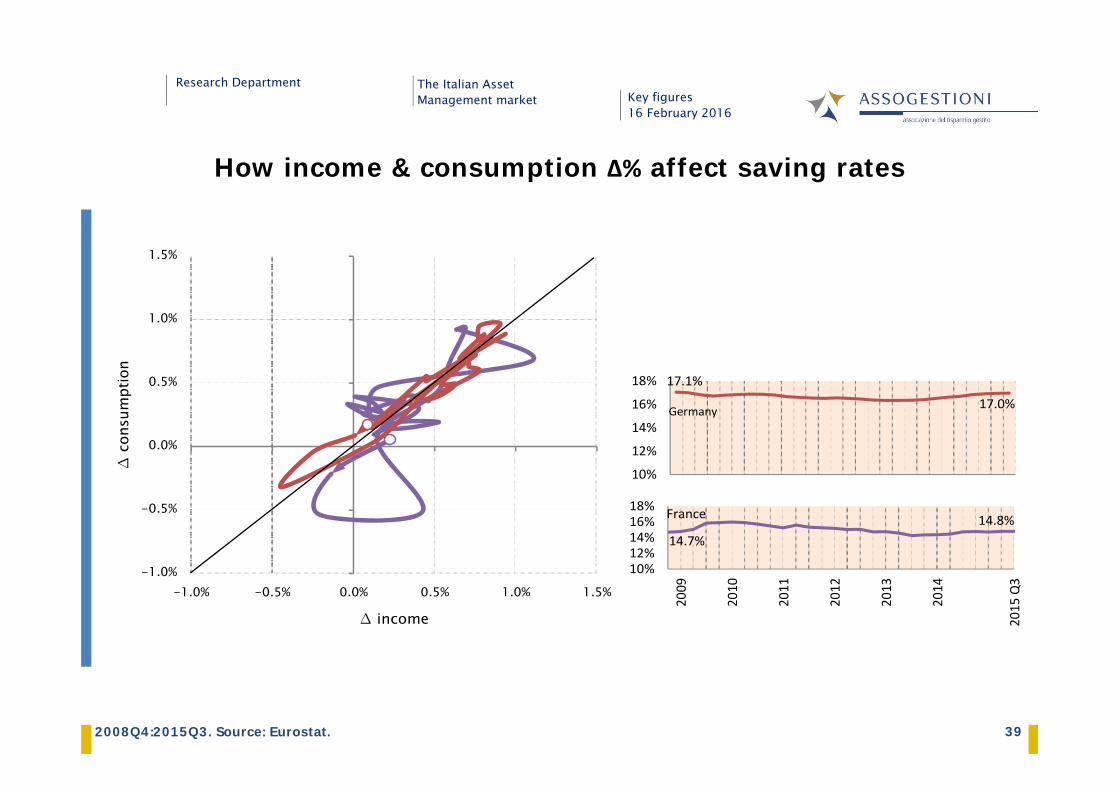
How income & consumption Δ% affect saving rates
2008Q4:2015Q3. Source: Eurostat.
13.8%
Italy
11.0%
8%
10%
12%
14%
16%
2009
2010
2011
2012
2013
2014
2015
Q3
Research Department The Italian Asset Management market Key figures
16 February 2016
39
-1.0%
-0.5%
0.0%
0.5%
1.0%
1.5%
-1.0% -0.5% 0.0% 0.5% 1.0% 1.5%
∆ c
onsu
mpt
ion
∆ income
How income & consumption Δ% affect saving rates
2008Q4:2015Q3. Source: Eurostat.
17.1%
Germany 17.0%
10%
12%
14%
16%
18%
14.7%
France 14.8%
10%12%14%16%18%
2009
2010
2011
2012
2013
2014
2015
Q3
Research Department The Italian Asset Management market Key figures
16 February 2016
40
-1.0%
-0.5%
0.0%
0.5%
1.0%
1.5%
0.0% 0.5% 1.0% 1.5% 2.0% 2.5%
∆ c
onsu
mpt
ion
∆ income
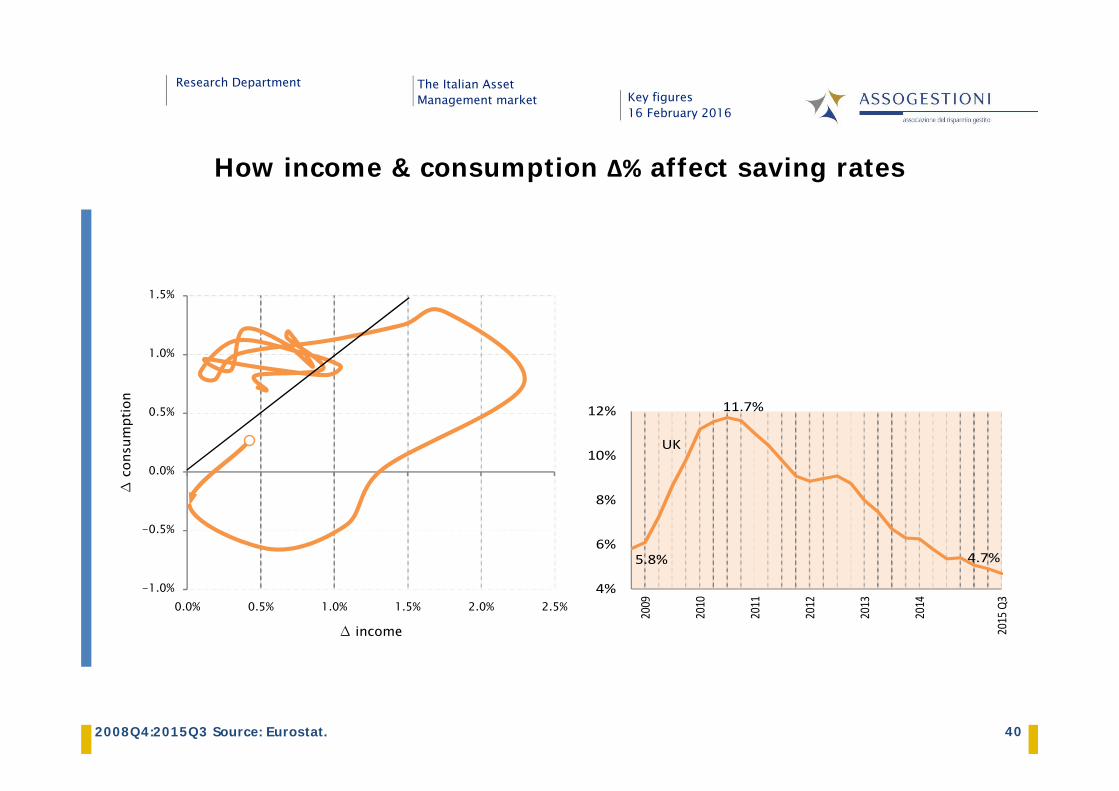
How income & consumption Δ% affect saving rates
2008Q4:2015Q3 Source: Eurostat.
5.8%
UK
11.7%
4.7%
4%
6%
8%
10%
12%
2009
2010
2011
2012
2013
2014
2015
Q3

Research Department The Italian Asset Management market Key figures
16 February 2016
41
Total Issued by banks Total Listed
Italy € bn % % % % % % %1995 1,799 38.2% 22.6% 1.9% 19.3% 2.8% 5.8% 8.7%2000 3,041 22.9% 16.5% 6.4% 29.5% 5.4% 17.0% 10.0%2005 3,864 23.6% 19.0% 7.1% 28.3% 2.4% 11.0% 14.2%2010 3,633 30.7% 19.7% 10.3% 20.1% 2.0% 7.5% 17.6%
2012 3,732 31.6% 19.3% 10.0% 19.7% 1.6% 7.3% 17.8%
2014 3,951 31.4% 13.6% 6.2% 22.0% 1.6% 9.6% 19.4%
2015 Q3 4,014 30.9% 10.8% 5.0% 23.8% 1.7% 10.4% 20.1%
2015 Q3France 4,804 28.5% 1.4% n.a. 20.1% 4.2% 6.8% 34.3%Germany 5,373 39.3% 3.3% n.a. 9.8% 4.6% 9.7% 31.2%UK 8,126 24.2% 1.6% n.a. 6.4% 2.4% 3.9% 59.6%USA 61,523 13.7% 5.0% n.a. 33.8% n.a. 12.9% 32.7%
Total Asset Currency & deposits
Investment funds
Pension funds & life pr
Bonds Stocks
Household financial portfolio breakdown
High level of directinvestment (~ 35%)
Decreasingamounts of bankissued bonds (5.0%)
Negligible level oflisted shares. High level of unlistedones.
Funds: rise until1999 (18%) thendown, then againup.
Pensions/life product: up but stilltoo modest.
41%. Source: Eurostat, OECD, BCE, Deutsche Bundesbank.
Research Department The Italian Asset Management market Key figures
16 February 2016
42
0%
2%
4%
6%
8%
10%
12%
14%
16%
18%
20%
95 96 97 98 99 00 01 02 03 04 05 06 07 08 09 10 11 12 13 14 15Q3
0%
10%
20%
30%
40%
50%
60%
95 96 97 98 99 00 01 02 03 04 05 06 07 08 09 10 11 12 13 14 15Q3
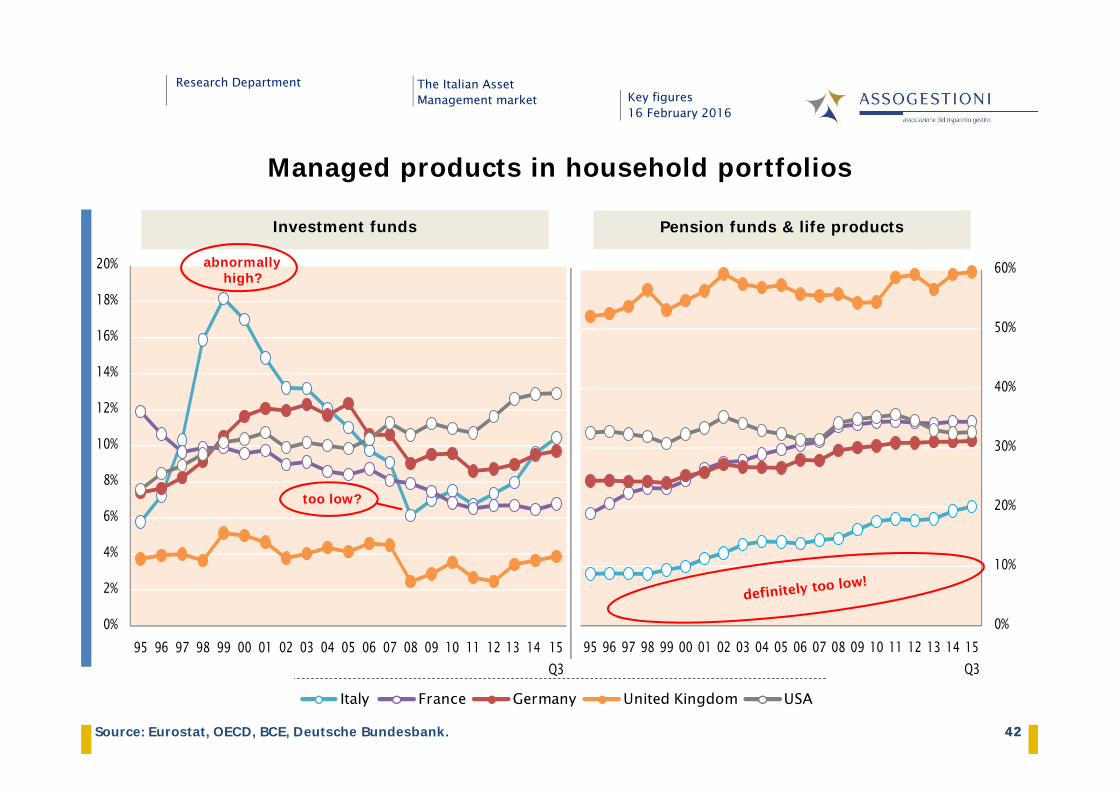
Managed products in household portfolios
too low?
Italy France Germany United Kingdom USA
Investment funds Pension funds & life products
abnormallyhigh?
42Source: Eurostat, OECD, BCE, Deutsche Bundesbank.

Research Department The Italian Asset Management market Key figures
16 February 2016
43
Public Pensions (1st pillar)
Cost (% GDP) Future substitution ratesOld-age pensions
Source: Ragioneria Generale dello Stato.
Today
1
23
4
ante L 243/2004 ante DL 78/2010
ante DL 98/2011 ante DL 201/2011
1 2
3 4 65
66
67
68
69
70
71
40%
45%
50%
55%
60%
65%
70%
75%
80%
85%
90%
2010 2020 2030 2040 2050 2060
Age Private sector employee Self employed
Research Department The Italian Asset Management market Key figures
16 February 2016
44
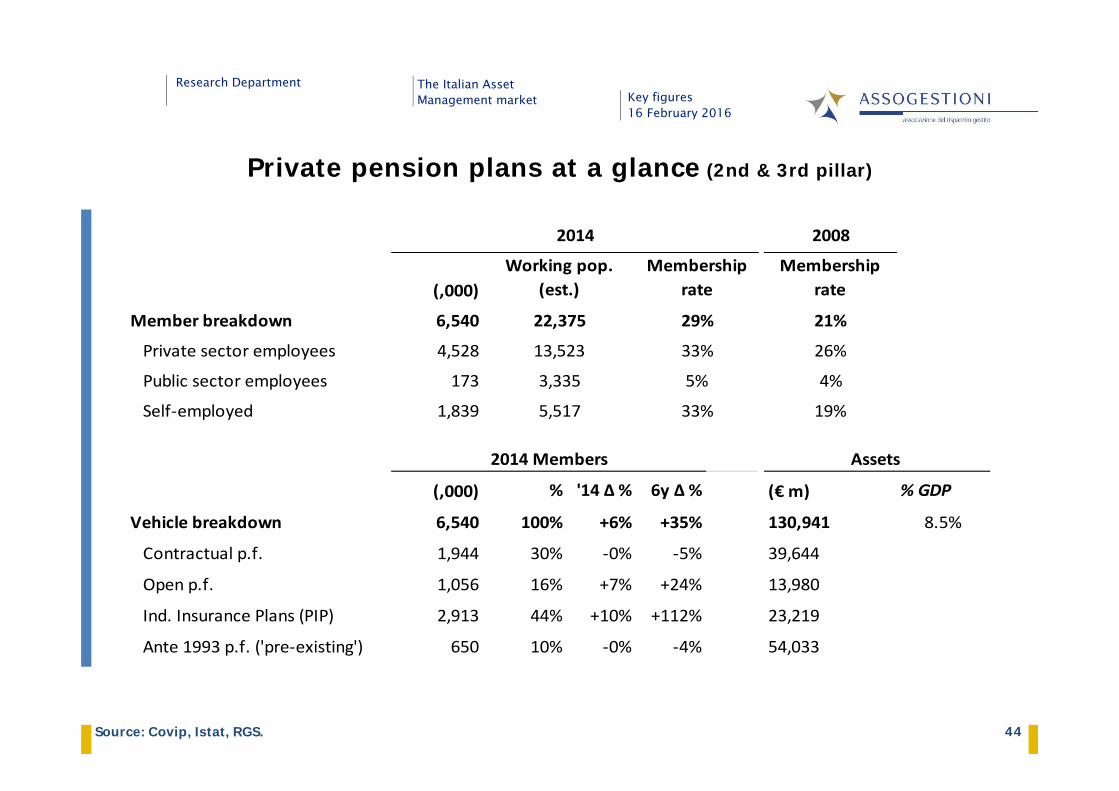
2008
(,000)
Member breakdown 6,540 21%
Private sector employees 4,528 26%
Public sector employees 173 4%
Self‐employed 1,839 19%
(,000) % '14 ∆ % 6y ∆ % (€ m) % GDP
Vehicle breakdown 6,540 100% +6% +35% 130,941 8.5%
Contractual p.f. 1,944 30% ‐0% ‐5% 39,644
Open p.f. 1,056 16% +7% +24% 13,980
Ind. Insurance Plans (PIP) 2,913 44% +10% +112% 23,219
Ante 1993 p.f. ('pre‐existing') 650 10% ‐0% ‐4% 54,033
2014 Members Assets
13,523 33%
3,335 5%
5,517 33%
2014
Working pop. (est.)
Membership rate
Membership rate
22,375 29%
Private pension plans at a glance (2nd & 3rd pillar)
Source: Covip, Istat, RGS.

The Italian Asset Management marketkey figures
16 February 2016
Research Department