
The Islamic University - المكتبة المركزيةlibrary.iugaza.edu.ps/thesis/114058.pdf ·...
159
Transcript of The Islamic University - المكتبة المركزيةlibrary.iugaza.edu.ps/thesis/114058.pdf ·...

The Islamic University – Gaza
Deanery Of Higher Studies
Faculty Of Commerce
Dep. Of Business Administration
Behavioural Factors influencing investment decision making:
An empirical study of Palestine Stock Exchange
Prepared by
Sahar Mohammed Abu Nada
Supervised by
Dr. Faris Abu Moa’mer
A Thesis Submitted In Partial Fulfillment of the Requirements for the Degree of Master of
Business Administration
June, 2013


I
DEDICATION
I dedicate this modest effort to my beloved mother whose love, care and
supplications helped me to reach this accomplishment, to the soul of my beloved late father
who loved me, cherished me and encouraged me through my life, to my sisters and brothers
especially my eldest sister Nada who inspired me, was and is still my raw model in life. To
my sons: Al Baraa and Amro.

II
ACKNOLEDGEMENT
This study would not have seen the light of day without the help I received
from various sources. For invaluable feedback, discussions, support, and
encouragement, so I would like to thank all people who provide me with assistance
and advice. My deep, generous and grateful thanks are directed to my supervisor Dr:
Faris Abu Moamer who supported me with his generous academic contributions to
the research. Thanks and gratitude are also acknowledged to Dr: Wael El Daya who
has a distinguished role in the improvement of this research.
III
Table of Contents
Contents DEDICATION I
ACKNOLEDGEMENT II
TABLE OF CONTENTS III
LIST OF TABLES VI
LIST OF FIGURES VII
ABSTRACT 1
DEFINITIONS OF KEY TERMS 2
CHAPTER ONE: THE OUTLINE OF THE RESEARCH 5
1.1 INTRODUCTION: ......................................................................................................... 5
1.2 RESEARCH PROBLEM: .............................................................................................. 5
1.3 RESEARCH PURPOSE: ............................................................................................... 5
1.4 RESEARCH OBJECTIVES:......................................................................................... 6
1.5 RESEARCH HYPOTHESES: ....................................................................................... 7
1.6 VARIABLES OF THE STUDY: ................................................................................... 8 1.6.1 DEPENDENT VARIABLE ..................................................................................... 8
1.6.2 INDEPENDENT VARIABLE ................................................................................. 8
1.7 THE IMPORTANCE OF THE STUDY: ..................................................................... 9
1.8 RESEARCH METHODOLOGY: ................................................................................. 9 1.8.1 RESEARCH POPULATION: .................................................................................... 9
1.8.2 THE PARAMETERS OF THE RESEARCH: ......................................................... 10
CHAPTER TWO: THEORETICAL FRAMEWORK 11 INTRODUCTION ..................................................................................................... 11
TRADITIONAL FINANCE ...................................................................................... 11
EMERGENCE OF BEHAVIOURAL FINANCE ..................................................... 11
KEY THEORIES IN BEHAVIOURAL FINANCE ................................................. 11
KEY FEATURES OF PROSPECT THEORY .......................................................... 11
PALESTINE STOCK EXCHANGE ......................................................................... 11
2.1 INTRODUCTION: ....................................................................................................... 12
2.2 TRADITIONAL FINANCE: ....................................................................................... 12 2.2.1 THE EFFICIENT MARKET HYPOTHESIS: ......................................................... 13
2.2.2 THE THEORETICAL FOUNDATIONS OF THE EMH: ...................................... 14

IV
2.6 EMERGENCE OF BEHAVIOURAL FINANCE: .................................................... 21 2.6.3 PROSPECT THEORY: ............................................................................................ 23
2.7.1 REPRESENTATIVENESS: .................................................................................... 29
2.7.2 AVAILABILITY: .................................................................................................... 30
2.7.3 OVERCONFIDENCE: ............................................................................................ 31
2.7.4 GAMBLER'S FALLACY: ....................................................................................... 32
2.7.5 PRICE ANCHORING: ............................................................................................ 32
2.8 PALESTINE STOCK EXCHANGE ........................................................................... 33 2.8.1 PSE VISION ............................................................................................................ 34
2.8.2 PSE MISSION ......................................................................................................... 34
2.8.3 PSE OBJECTIVES .................................................................................................. 35
2.8.4 THERE ARE MANY REASONS TO INVEST IN THE PALESTINE
EXCHANGE: .................................................................................................................... 35
2.8.5 PSE REGULATORY FRAMEWORK .................................................................... 36
CHAPTER THREE: LITERATURE REVIEW 38
3.1 INTRODUCTION: ....................................................................................................... 39
3.2 PREVIOUS STUDIES: ............................................................................................... 39
3.3 COMMENTS: ............................................................................................................. 59
CHAPTER FOUR: RESEARCH DESIGN AND METHODOLOGY AND DATA
ANALYSIS 60
4.1 METHODOLOGY AND PROCEDURES ................................................................. 61
4.2 INTRODUCTION: ....................................................................................................... 61
4.3 RESEARCH METHODOLOGY: ............................................................................... 61 4.3.1 RESEARCH POPULATION: .................................................................................. 61
4.3.2 INCLUSION CRITERIA: ........................................................................................ 62
4.3.3 EXCLUSION CRITERIA: ....................................................................................... 62
4.3.4 RESEARCH SAMPLE: ........................................................................................... 62
4.4 DATA COLLECTION: ................................................................................................ 62 4.4.1 SECONDARY DATA: ............................................................................................ 63
4.4.2 PRIMARY DATA: .................................................................................................. 63
4.5 QUESTIONNAIRE DESIGN: ..................................................................................... 63
4.6 DATA MEASUREMENT ............................................................................................ 63
4.7 DATA ANALYSIS AND EXPLANATIONS ............................................................ 69
4.8 RESEARCH HYPOTHESES: ................................................................................ 72

V
10. DIFFERENCES BETWEEN RESPONDENTS IN AGE, CULTURE AND
EDUCATION DO NOT HAVE AN IMPACT ON INVESTMENT DECISIONS AT
PALESTINE STOCK EXCHANGE. ................................................................................ 91
10.1 DIFFERENCES BETWEEN RESPONDENTS IN GENDER DO NOT HAVE
AN IMPACT ON INVESTMENT DECISIONS AT PALESTINE STOCK
EXCHANGE. ...................................................................................................................... 91
10.2 DIFFERENCES BETWEEN RESPONDENTS IN AGE DO NOT HAVE AN
IMPACT ON INVESTMENT DECISIONS AT PALESTINE STOCK EXCHANGE.
92
10.4 DIFFERENCES BETWEEN RESPONDENTS IN ATTENDED COURSE IN
STOCK EXCHANGE DO NOT HAVE AN IMPACT ON INVESTMENT
DECISIONS AT PALESTINE STOCK EXCHANGE. .................................................. 96
CHAPTER FIVE: FINDINGS OF THE RESEARCH 100
5.1 INTRODUCTION: .................................................................................................... 108
5.2 FINDINGS: ................................................................................................................. 108
5.3 CONCLUSION AND COMMENTS: ....................................................................... 110
5.4 RECOMMENDATIONS: .......................................................................................... 110
5.5 FURTHER RESEARCH: .......................................................................................... 111
APPENDICES 112
APPENDIX (1) .................................................................................................................. 113
APPENDIX (2) .................................................................................................................. 122
APPENDIX (3) .................................................................................................................. 134

VI
List of Tables
Table 1 : Kolmogorov-Smirnov test _________________________________________ 64
Table 2 : Correlation coefficient of each field and the whole of questionnaire _______ 67
Table 3:Gender _________________________________________________________ 69
Table 4 : Age ____________________________________________________________ 69
Table 5 : Education level __________________________________________________ 70
Table 6 :How long have you attended the stock market? ________________________ 70
Table 7 : Have you attended any course of Stock Exchange? _____________________ 71
Table 8 : Monthly income ()$ _______________________________________________ 71
Table 9 : Means and Test values for “Overconfidence” _________________________ 72
Table 10 :Means and Test values for “Loss aversion” __________________________ 75
Table 11 : Means and Test values for “Representativeness” _____________________ 77
Table 12 : Means and Test values for “Price anchoring” ________________________ 79
Table 13 :Means and Test values for “Gambler’s fallacy” ______________________ 81
Table 14 : Means and Test values for “Availability” ___________________________ 82
Table 15 :Means and Test values for “Mental Accounting” _____________________ 85
Table 16 : Means and Test values for “Regret Aversion” ________________________ 87
Table 17 : Means and Test values for “Self Control” ___________________________ 89
Table 18 : Independent Samples T-Test of the fields and their p-values for Gender__ 91
Table 19 : Independent Samples T-Test of the fields and their p-values for Age _____ 93
Table 20 : One- Way Analysis of Variance (ANOVA) T-Test of the fields and their _ 95
Table 21 : Independent Samples T-Test of the fields and their p-values____________ 96
VII
Table 22 : One- Way Analysis of Variance (ANOVA) T-Test of the fields and their _ 98
List of Figures
Figure .1 1 : Conceptual framework __________________________________________ 8
Figure 2 :1. A Hypothetical Value Function __________________________________ 25
Figure 2.2: Hypothetical Weighting Function _________________________________ 26

1
ABSTRACT
This research entitled ― Behavioural Factors influencing investment decision making : an
empirical study of Palestine Stock Exchange‖ is an attempt to discuss the impact of
behavioural biases as mentioned in Kahneman and Tversky theories of Prospect and
Heuristics theory . The theoretical framework related to this issue has been mentioned and a
relevant literature is reviewed. The literature review consists of some theoretical studies, as
well as other practical ones. The methodology of the research is the quantitative one where
a questionnaire was designed, distributed to a sample of 400 individual investors in
Palestine Stock Exchange. In addition, findings of the research are discussed in relation to
research hypotheses and conclusions are drawn.
2
DEFINITIONS OF KEY TERMS
These definitions are quoted from Pompian. M. Michael, (2006)
Overconfidence:
It can be summarized as unwarranted faith in one‘s intuitive reasoning, judgments,
and cognitive abilities. In overconfidence, subjects overestimate both their own predictive
abilities and the precision of the information they‘ve been given. So, investors overestimate
their ability and the accuracy of the information they have.
Representativeness:
Two primary interpretations of representativeness bias apply to individual investors.
First : Base-Rate Neglect: In base-rate neglect, investors attempt to determine the potential
success of, say, an investment in Company‖ A‖ by contextualizing the venture in a familiar,
easy-to-understand classification scheme.
Second: Sample-Size Neglect:
In sample-size neglect, investors, when judging the likelihood of a particular investment
outcome, often fail to accurately consider the sample size of the data on which they base
their judgments.
Decision makers in this instance tend to form decisions by observing patterns that may not
be relevant or even truly apparent.
3
Anchoring:
It is a psychological heuristic that influences the way people intuit probabilities.
Investors exhibiting price anchoring are often influenced by purchase ―points‖—or
arbitrary price levels or price indexes—and tend to cling to these numbers when facing
questions like ―Should I buy or sell this security?‖
Mental Accounting:
First coined by University of Chicago professor Richard Thaler, mental accounting
describes people‘s tendency to code, categorize, and evaluate economic outcomes by
grouping their assets into any number of nonfungible (noninterchangeable) mental
accounts. Consequently, individuals allocate wealth to separate mental compartments and ignore
fungibility and correlation effects.
Loss Aversion Bias:
Loss aversion bias was developed by Daniel Kahneman and Amos Tversky in 1979
as part of the original prospect theory specifically, in response to prospect theory‘s
observation that people generally feel a stronger impulse to avoid losses than to acquire
gains.
Regret Aversion Bias:
People exhibiting regret aversion avoid taking decisive actions because they fear that,
in hindsight, whatever course they select will prove less than optimal. Basically, this bias
seeks to forestall the pain of regret associated with poor decision making. Therefore,

4
individuals make decisions in a way that allows them to avoid feeling emotional pain in the
event of an adverse outcome.
Gamblers fallacy:
In the gambler‘s fallacy, an individual erroneously believes that the onset of a certain
random event is less likely to happen following an event or a series of events.
Availability:
Availability bias is a form of adverse selection, where investors place inappropriately
large weighting on the relevance of information that is simply the most easily available
Hence; investors overstate the probabilities of recently observed or experienced events
because the memory is fresh.
Self-control:
Self-control bias is a human behavioural tendency that causes us to consume today at
the expense of saving for tomorrow. Self-control bias can also be described as a conflict
between people‘s overarching desires and their inability, stemming from a lack of self-
discipline, to act concretely in pursuit of those desires.

Chapter one: The outline of the research
Introduction
Research problem
Research Purpose
Research Objectives
Variables of the study
Conceptual framework
The importance of the study
Research methodology
5
1.1 Introduction:
This chapter aims at drawing an outline of the research problem, objectives,
population, sample , variables of the study , research hypotheses, the importance of the
study, research methodology and research parameters briefly.
1.2 Research problem:
In business world, there are millions of decisions made around the world every
minute. Investment decisions are not an exception of this statement. Behavioural factors
affecting the decision making process in the world of investment are many and various.
One type of these factors is related to investors‘ psychological compositions which are
responsible for their financial behaviour.
The behavioural factors influencing investment decision making are many and haven‘t been
studied in Palestine in general and in The Gaza Strip in particular before, Hence, this will
be the first research to try to uncover the behavioural factors standing behind the
investment decision making process as they are affecting the decisions made by investors in
Palestine stock Exchange. So, what impact do behavioural factors have on individual
investors‘ investment decision making in Palestine stock Exchange Market?
1.3 Research Purpose:
The purpose of this research is to uncover the main behavioural factors that influence
the investment decisions taken in Palestine Stock Exchange.

6
1.4 Research Objectives:
There is one main objective: To investigate the impact of the behavioural factors
within the domain of the Prospect and Heuristics theories on investment decision making
of individual investors in Palestine Stock Exchange.
There are a number of sub objectives:
1- To measure the impact of overconfidence on the financial behaviour of individual
investors in Palestine Stock Exchange
2- To measure the impact of loss aversion on the financial behaviour of individual
investors in Palestine Stock Exchange.
3- To measure the impact of representativeness on the financial behaviour of
individual investors in Palestine Stock Exchange.
4- To measure the impact of Price anchoring on the financial behaviour of individual
investors in Palestine Stock Exchange.
5- To measure the impact of Gamble‘s fallacy on the financial behaviour of individual
investors in Palestine Stock Exchange.
6- To measure the impact of availability on the financial behaviour of individual
investors in Palestine Stock Exchange.
7- To measure the impact of mental accounting on the financial behaviour of
individual investors in Palestine Stock Exchange.
8- To measure the impact of regret aversion on the financial behaviour of individual
investors in Palestine Stock Exchange.

7
9- To measure the impact of self control on the financial behaviour of individual
investors in Palestine Stock Exchange.
1.5 Research hypotheses:
1- Representativeness has an impact on individual investment decisions at Palestine
Stock Exchange.
2- Anchoring has an impact on individual investment decisions negatively at Palestine
Stock Exchange.
3- Overconfidence has an impact on individual investment decisions at Palestine Stock
Exchange.
4- Gambler‘s fallacy has an impact on individual investment decisions at Palestine
Stock Exchange.
5- Regret aversion has an impact on investment decisions at Palestine Stock Exchange.
6- Mental accounting has an impact on individual investment decisions at Palestine
Stock Exchange.
7- Loss Aversion has an impact on individual investment decisions at Palestine Stock
Exchange.
8- Availability has an impact on individual investment decisions at Palestine Stock
Exchange.
9- Self control has an impact on individual investment decisions at Palestine Stock
Exchange.
10- Differences between respondents in age, culture and education do not have an
impact on investment decisions at Palestine Stock Exchange.
8
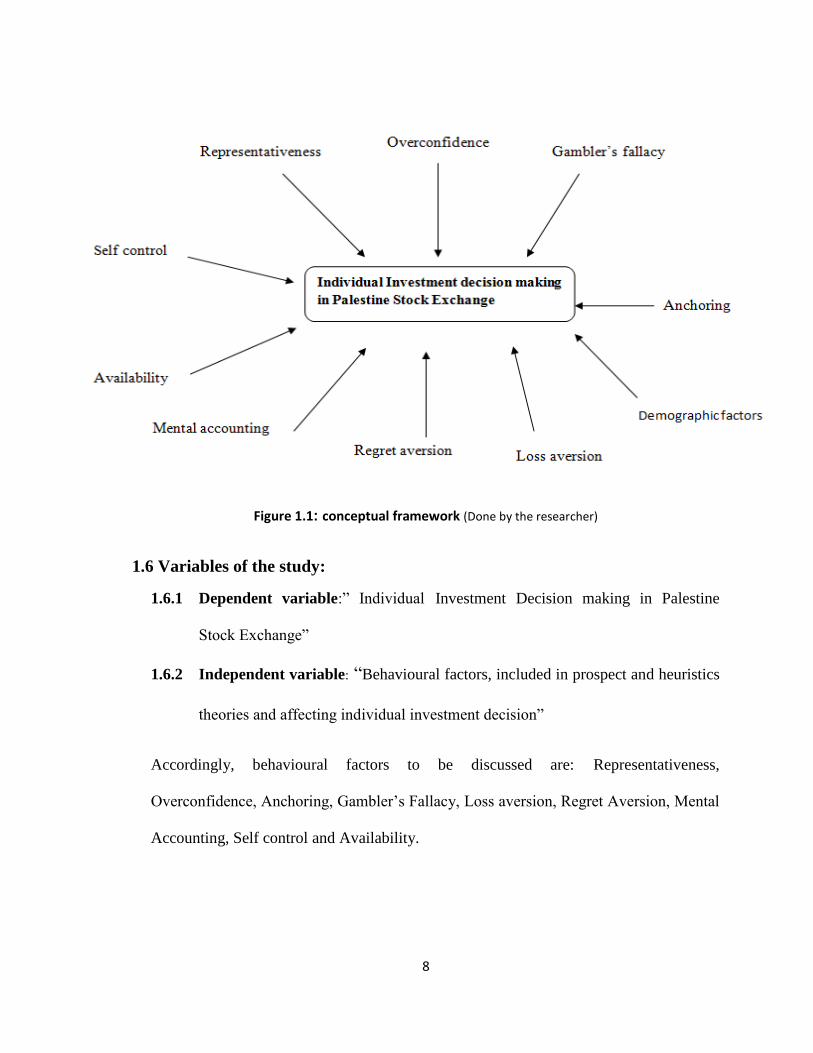
Figure 1.1 : conceptual framework (Done by the researcher)
1.6 Variables of the study:
1.6.1 Dependent variable:‖ Individual Investment Decision making in Palestine
Stock Exchange‖
1.6.2 Independent variable: ―Behavioural factors, included in prospect and heuristics
theories and affecting individual investment decision‖
Accordingly, behavioural factors to be discussed are: Representativeness,
Overconfidence, Anchoring, Gambler‘s Fallacy, Loss aversion, Regret Aversion, Mental
Accounting, Self control and Availability.

9
1.7 The importance of the study:
The study is important for many parties due to different reasons as follows:
1- It is a step on the long road of research accomplished by many researchers in this
field and topic.
2- The study is important for the individual investor in Palestine Stock Exchange. For
investors as decision makers, the most influencing factor / factors on
investment decision making is crucial because this would affect their future financial
plans.
3- The study is essential for the researcher because it is the first project for her on a
topic related to behavioural finance which is a new domain in the Arab world and
Palestine.
4- The study is important for the fellow students and researchers who are interested in
studying behavioural finance.
1.8 Research methodology:
Descriptive analysis methodology will be applied, primary and secondary data
sources, and data collection through a questionnaire designed particularly to address the
issues of interest. The questionnaires will target the target sample, the individual investors
in the Palestine Stock Exchange. The collected data will be analyzed by SPSS.
1.8.1 Research population:
The population of the study will be the individual investors in Palestine Stock
Exchange in the Gaza Strip.

10
Research sample:
It includes Individual investors at Palestine Stock Exchange.
1.8.2 The parameters of the research:
1.8.2.1 Time parameter:
This research will be done in 2012and 2013.
1.8.2.2 Place parameter:
This research is limited by the place limits of the Gaza Strip.
1.8.2.3 Human parameter:
The sample in this research will include individual investors in Palestine Stock Exchange.
1.8.2.4 Subject parameter:
This study will be restricted to testing the impact of the behavioural factors included in the
Prospect and Heuristics theories.

11
Chapter two: Theoretical framework
Introduction
Traditional Finance
Emergence of Behavioural Finance
Key theories in Behavioural Finance
Key Features of Prospect Theory
Palestine stock exchange
12
2.1 Introduction:
It is universally acknowledged that knowledge does not come all at once and it goes
into different stages of development and evolution. Behavioural finance is no exception of
this statement. In this chapter, we will show the evolution of behavioural finance through
different financial theories.
2.2 Traditional Finance:
The key goal of traditional finance theory is to understand financial markets using
mathematical models that assume the rationality of investors. According to Nofsinger
(2001), the field of finance has evolved over the past few decades based on the assumption
that people make rational decisions and that they are unbiased in their predictions about the
future. Individual investors are perceived as a rational lot that take cautiously weighted
economically decisions every single time. A rational investor can be defined as a one that
always (i) updates his beliefs in a timely and appropriate manner on receiving new
information; (ii) makes choices that are normatively acceptable, Thaler, 2005. Traditional
finance theoretical body consist of many financial constructs and trends such as Expected
Utility Theory, CAPM, and Modern Portfolio Theory. However, we are going to
concentrate on the main influential theory that shaped the financial scene for decades which
is the efficient market hypothesis.
13
2.2.1 The efficient market hypothesis:
To stand on a solid ground, some definitions of Efficient Market Hypothesis should
be mentioned before proceeding any further in elaboration of this matter. According to
Fama‘s definition of market efficiency is logically intuitive: it means that asset prices in
financial markets fully reflect all the available information (Fama (1970 [16]). The efficient
market hypothesis (hereafter EMH) assumes that efficient markets are efficient because
prices in the market incorporate all types of information to the degree that individual
investors cannot beat the or outperform the market. EMH is popularly known as the random
walk theory since prices are equally expected to rise or to fall and no investor can predict
its path. Malkiel (1973) advocates that ‘the market and stocks could be just as random as
flipping a coin. The term was firstly used by Fama 1965 who said that all types of
information whether public or private reflects in stock prices. "An 'efficient' market is
defined as a market where there are large numbers of rational, profit-maximizers
actively competing, with each trying to predict future market values of individual
securities, and where important current information is almost freely available to all
participants. So, if there are lots of investors in the financial market, we will get the
highest best price. Otherwise, if somebody is making extra profits there, then other
investors will come in”. This implies that efficient market hypothesis talks about
information efficiency and how fast the share price in the market reflects the new
information. Similarly, Karz (2012) states that ‘Fama persuasively made the argument that
in an active market that includes many well-informed and intelligent investors, securities
will be appropriately priced and reflect all available information’. Assumingly speaking, in
an efficient market, competition among the various intelligent investors leads to a situation
14
where, at any point in time, actual prices of individual securities already reflect the effects
of information based both on events that have already occurred and on events which the
market anticipates to happen in the future. In other words, in an efficient market at any
point in time the actual price of a security will be a good estimate of its intrinsic
value."(Fama, 1995). Hence, EMH maintains that all stocks are perfectly priced according
to their inherent investment properties, the knowledge of which all market participants
possess equally (Fama, 1970). In conclusion , the efficiency intended in the efficient market
hypothesis is that of information where it is supposed that financial markets incorporates all
types of information into stock prices and that market has no memory and the coming of
new information into the market causes the random movement of share prices.
Accordingly, when investors try to gain profit by investing in undervalued stocks, EMH
assumingly deems their trials futile. Put differently, an average investor- whether an
individual, a pension fund, or a mutual fund- cannot hope to consistently beat the market
and the vast resources that such investors dedicate to analyzing, picking and trading
securities are wasted, Shleifer, 2004.
2.2.2 The theoretical foundations of the EMH:
EMH is built on three assumptions that form its theoretical bases: First, investors
are thought to be rational and therefore to value securities logically. Second, if there are
some irrational investors, their trades are random and therefore cancel each other out
without affecting prices. Third, to the extent that investors are irrational in similar ways,
they are met in the market by rational arbitrageurs who eliminate their influence on prices
(Shleifer, 2004). Consequently, the main assumption of the efficient market hypothesis is
15
the idea that information is quickly and efficiently incorporated into assets prices at any
point in time and cannot be used to foretell future price movements as assumed by the
random walk theory. The information available in the market is of different types; public
and private. Accordingly, the efficiency of the market is divided into three versions:
2.2.3 Three versions of the Efficient Market Hypothesis: Aziz and Sulaiman, (2012)
2.2.3.1 The weak form market efficiency The weak form efficiency is related to past information where investors believe that
the market incorporates all publicly known past information such as prices, trading volume,
past financial statements, news, stories etc. a market is said to be efficient in the weak form
if everyone in the financial market has access to such information and no opportunity for
abnormal profits. Hence, all historical information would be useless to an analyst, as
historical prices are reflected in current prices. In other words, what is the benefit of
historical and outdated information to an investor? How does such information incorporate
in the share market price any way? However, Abushamala (2011) proved that weak
efficiency form is not applicable in (PEX) is not applicable.
2.2.3.2 The semi-strong form market efficiency: Semi-strong form means that all public information is incorporated in the prices of
financial assets in the financial market. Therefore, investors will not be able to select
undervalued securities and no individual investor would be able to gain abnormal profits by
exploiting such knowledge. In this form of efficiency, current information is available to
everyone. Consequently, market prices already reflect all current available information that
includes balance sheets, income statements, dividends, earnings, etc.
16
2.2.3.3 The strong market efficiency: In the strong form of market efficiency, prices are supposed to incorporate all types
of information whether public or private. The core assumption of this form is that no
investor can make higher profits even with earlier access to inside information. The actual
situation of financial markets relatively supports the weak and semi strong forms of
efficiency and that market cannot be completely efficient in the strong form. This
conclusion was drawn from the performance of professional investment managers. Hence,
share price reflects all available, public and private, information and thus investors would
not be able to take abnormal return on a regular basis by using private information. This is
because share price reaction toward new information is instantaneous and unbiased.
Consequently, there are close chances for people to take advantage of new information.
The discussions and debates around the Efficient Market Hypothesis prolonged for
decades by theorists in the financial domain: some of them were pro market efficiency and
the others were anti market efficiency. Thus, to be objective and to have the whole picture
of the financial scene that formulated along decades, we have to mention the drawbacks of
such hypothesis that led to the evolution of supplementary financial theories.
2.2.4 Problems and limitations with EMH: (Bergen J. V., 2011) As the case with any scientific theoretical endeavour, the efficient market
hypothesis is criticized for a number of reasons which are mentioned by many opponents of
the hypothesis. First, Efficient Market Hypothesis assumes that all investors perceive all
available information in precisely the same manner as if they were acting as one calculator.
However, the numerous methods for analyzing and valuing stocks pose some problems for
the validity of the EMH. If one investor looks for undervalued market opportunities while
another investor evaluates a stock on the basis of its growth potential, these two investors
17
will already have arrived at a different assessment of the stock‘s fair market value.
Therefore, one argument against the EMH points out that, since investors value stocks
differently, it is impossible to ascertain what a stock should be worth under an efficient
market. Secondly, under the efficient market hypothesis, no single investor is ever able to
attain higher profits than another with the same amount of invested funds: their equal
possession of information means they can only achieve identical returns. According to the
EMH, if one investor is profitable, it means the entire universe of investors is profitable. In
reality, this is not necessarily the case. Thirdly, under the efficient market hypothesis, no
investor should ever be able to beat the market, or the average annual returns that all
investors and funds are able to achieve using their best efforts. This would naturally
implies, as many market experts often maintain, that the absolute best investment strategy
is simply to place all of one‘s investment funds into an index fund, which would increase or
decrease according to the overall level of corporate profitability or losses. These problems
mentioned above have led to a number of limitations: bounded rationality, limits of
arbitrage and limits of subjective utility function.
2.2.4.1 Bounded Rationality: As assumed by EMH, individual investors are considered to be completely rational
and able to use technology and many stock price evaluation tools and softwares that help
them to take the right decision on time. Contradictory to this assumption, there are many
anomalies that take place in stock markets that oppose this utopian situation. The bounded
rationality is the idea that in decision-making, rationality of individuals is limited by the
information they have, the cognitive limitations of their minds, and the finite amount of
time they have to make a decision and the complex circumstances under which they
18
perform. It was proposed by Herbert A. Simon (1957) as an alternative basis for the
mathematical models used for making decisions in economics and other related disciplines.
Simon suggests that economic agents use mental shortcuts and rules of
thumb‖ heuristics‖ to make decisions rather than a strict rigid rule of optimization. They do
this because of the complexity of the situation, and their inability to process and compute
the expected utility of every alternative action. Similarly, Daniel Kahneman (2003)
proposes bounded rationality as a model to overcome some of the limitations of the
rational-agent models in economic literature.
2.2.4.2 Limits of Arbitrage: Limits of arbitrage argues that arbitrageurs may not be capable of profiting from
market dislocations and mispricing done by less or not rational investors, and psychology,
that classifies all the possible types of deviations that we may see in the financial markets
(Thaler and Barberis (2002). In a market with not-fully rational and rational agents, rational
agents will not allow not-fully-rational investors to influence security prices by trading
mispriced and dislocated securities through a process called arbitrage. Therefore, in an
efficient market, there should be no arbitrage opportunities since competition will drive
prices to their fundamental values. However, if non-rational investors are dominant in the
market, it does not follow that prices in the financial markets will fully reflect all the
available information and this is similar to arguing that there will be arbitrage opportunities
(Herschberg, 2012). In the traditional finance theories, arbitrage should be riskless and
arbitrage opportunities must not exist. However, researchers have found strong evidence to
assert the opposite. Arbitrage is generally risky and limited. In fact, there are situations
where arbitrage opportunities exist but do not quickly disappear. This is known in the
19
literature as limits to arbitrage and the idea is usually credited to Professors Shleifer and
Vishny (Shleifer and Vishny 1997).
2.2.4.3 The limits of the subjective utility function: The foundation of the prospect theory
The subjective utility function is one of the tools used strongly in standard finance
to make investment decisions, in which an individual investor measures his or her own
utility according to mathematical modeling of the desired benefit, depending on the
available information about the economics of the market, before taking decisions related to
investment. Therefore, the subjective expected utility (SEU) model provides the theoretical
and mathematical framework that is most often used to analyze decisions under uncertainty.
In the SEU model, uncertainty about the future is represented by a group of states of the
world, which are statistically considered as mutually exclusive and exhaustive events.
Possible outcomes for the decision maker are represented by a group of ramifications that
could be amounts of money in the bank or more general ―states of the person‖ such as
health, pleasure, happy or unhappy experiences, and so on. The SEU model had a
revolutionary effect on statistical decision theory and social science in the 1950s and 1960s,
supplementing the computational basis for a broad range of social and economic theories
under the broad heading of ―rational choice,‖ including the development of Bayesian
methods of statistical inference, the emergence of decision analysis as an applied science
studied in engineering and business schools, the establishment of game theory as a
foundation for microeconomics, and the development of expected-utility-based models of
portfolio optimization and competitive equilibria in asset markets by finance theorists.
However, decision making process is not a mechanical process done by humans in a
20
machine-like way. Consequently, the fascination about the SEU began to fade out in the
late 1970s, however, as an emerging body of behavioural decision research showed that
subjects in laboratory experiments display an array of predictable ―heuristics and biases‖
that are inconsistent with SEU theory. In conclusion, Shiller (2002) provided theoretical
and empirical evidence to support the fact that CAPM, EMH, and other traditional financial
theories did a great job in predicting and explaining certain events. However academics
also started to find anomalies and behaviours which these traditional theories could not
explain. So a new body of knowledge emerged to supplement the existed theories and
paradigms of traditional finance. In other words, EMH has its own flaws that supported the
emergence of a supplementary financial theory like behavioural finance. Robert Shiller in
his article ―from Efficient Markets theory to Behavioural finance‖ said that : browsing
today again through finance journals from 1970, one sees some beginnings of reports of
anomalies that did not seem likely to square with the efficient markets theory , even if they
were not presented as significant evidence against the theory. Hence, by the start of the
twenty-first century, the intellectual dominance of the efficient market hypothesis had
become far less universal. Many financial economists and statisticians began to believe that
stock prices are at least partially predictable. Therefore, A new breed of economists
emphasized psychological and behavioural elements of stock-price determination, and they
came to believe that future stock prices are somewhat predictable on the basis of past stock
price patterns as well as certain ―fundamental‖ valuation metrics (Malkiel B. , 2003). The
Efficient Market Hypothesis is considered as the backbone of contemporary financial
theory and has been the dominant investing theory for more than 30 years (from the early
21
60s to the mid 90s). Needless to say, a generation ago, it was the most widely accepted
approach by academic financial economists. (Malkiel, 2003)
2.6 Emergence of Behavioural Finance:
Behavioural finance is a respectively new field that aims to join behavioural and
cognitive psychological theory with conventional economics and finance to provide
explanations for why people make suboptimal financial decisions. Economists have been
considering financial behaviours for centuries, but behavioural economics formally began
when Pioneers, Daniel Kahneman and Amos Tversky, published a 1979 paper on prospect
theory and the way individuals approach economic risk. In 1980, Richard Thaler developed
Kahneman and Tversky's work by authoring "Toward a Positive Theory of Consumer
Choice‖. Thaler has become one of the most famous theorists in the field, authoring books
like Nudge: The Gentle Power of Choice, Architecture Quasi-Rational Economics, The
Winner's Curse: Paradoxes and Anomalies of Economic Life and Advances in Behavioural
Finance Volumes I and II. After that, ―Kahneman and Tversky‖ won a Nobel Memorial
Prize in Economics in 2002. (Kahneman wrote the best-selling Thinking, Fast and Slow in
2011. In addition, University of California finance professors Brad M. Barber and Terrance
Odean explain in their article on ―The Courage of Misguided Convictions,‖ behavioural
finance incorporates ―observable, systematic, and very human departures into standard
models of financial markets.‖ Before proceeding any further, it is necessary to define
behavioural finance.
22
2.6.1 Definitions of Behavioural Finance:
―It studies how people actually behave in a financial setting. Specifically, it is the study
of how psychology affects financial decisions, corporations, and the financial
markets.”(Nofsinger, 2001)
According to Sewell (2007), “Behavioural finance is the study of the influence of
psychology on the behaviour of financial practitioners and the subsequent effect on
markets.” The science deals with theories and experiments focused on what happens when
investors make decisions based on hunches or emotions.
Shefrin (2000) defines Behavioural finance as ―a rapidly growing area that deals with the
influence of psychology on the behaviour of financial practitioners‖.
Behavioural theorists focus on the exception cases that take place in decision
making process and which are caused by factors like uncertainty and emotional confusion.
Hence, they talk about anomalies and bubbles that take place in the financial market. It
studies the psychological biases and mental shortcuts used by individuals to make
investment decisions. As a single example of hundred ones that studied these anomalies in
the world and the Arab region, the study of Abu-Rub and Sharba (2010) documented the
calendar effects on investment decision making in (PEX) and the anomalies that took place
in stock prices before and after holidays.
This thesis focuses on studying the impact of behavioural factors, as described by
Kahneman and Tversky in their work in regard to prospect theory and heuristics theory and
their effect on investment decision making. Consequently, the following section will deal
with the definitions and nature of these behavioural biases.
23
2.6.3 Prospect theory:
Prospect theory was developed by Kahneman and Tversky (1979). In its basic form,
it is interested in the behaviour of decision makers who have to make a choice between two
alternatives. The definition in the original text is: ―Decision making under risk can be
viewed as a choice between prospects or gambles.". Decisions liable to risk signify a
choice between alternative actions, which are associated with particular probabilities
(prospects) or gambles. Later, the model was modified and elaborated. Goldberg and von
Nitzsch (2001, p. 62) mentioned that Prospect theory has probably done more to bring
psychology into the heart of economic analysis than any other approach. Many economists
still utilize the expected utility theory paradigm when approaching problems; however,
prospect theory has gained much fame in recent years, and now certainly occupies an
essential place on the research agenda for even some prominent economists. Contrary to
much psychology, prospect theory has a solid mathematical basis — making it comfortable
for economists to deal with. However, unlike expected utility theory which concerns itself
with how decisions under uncertainty should be made (a prescriptive approach), prospect
theory concerns itself with how decisions are actually made (a descriptive approach).
Montier (2002, p. 20). Kahneman and Tversky started their research investigating apparent
anomalies and contradictions in human behaviour. Subjects when offered a choice depicted
in one way might display risk-aversion but when offered the same choice put in a different
way might show risk-seeking behaviour. For example, as Kahneman says, people may
drive across town to save $5 on a $15 calculator but not drive across town to save $5 on a
$125 coat. One very essential result of Kahneman and Tversky work is proving that

24
people's attitudes toward risks related to gains may be completely different from their
attitudes toward risks concerning losses. For example, when given a choice between getting
$1000 with certainty or having a 50% chance of getting $2500 they may choose the certain
$1000 in preference to the uncertain chance of getting $2500 even though the mathematical
outcome of the uncertain choice is $1250. This is a perfectly reasonable attitude that is
described as risk-aversion. But Kahneman and Tversky found that the same people when
faced with a certain loss of $1000 versus a 50% chance of no loss or a $2500 loss do often
choose the risky alternative. This is called risk-seeking behaviour. This is not necessarily
irrational but it is essential for analysts to recognize the asymmetry of human choices.
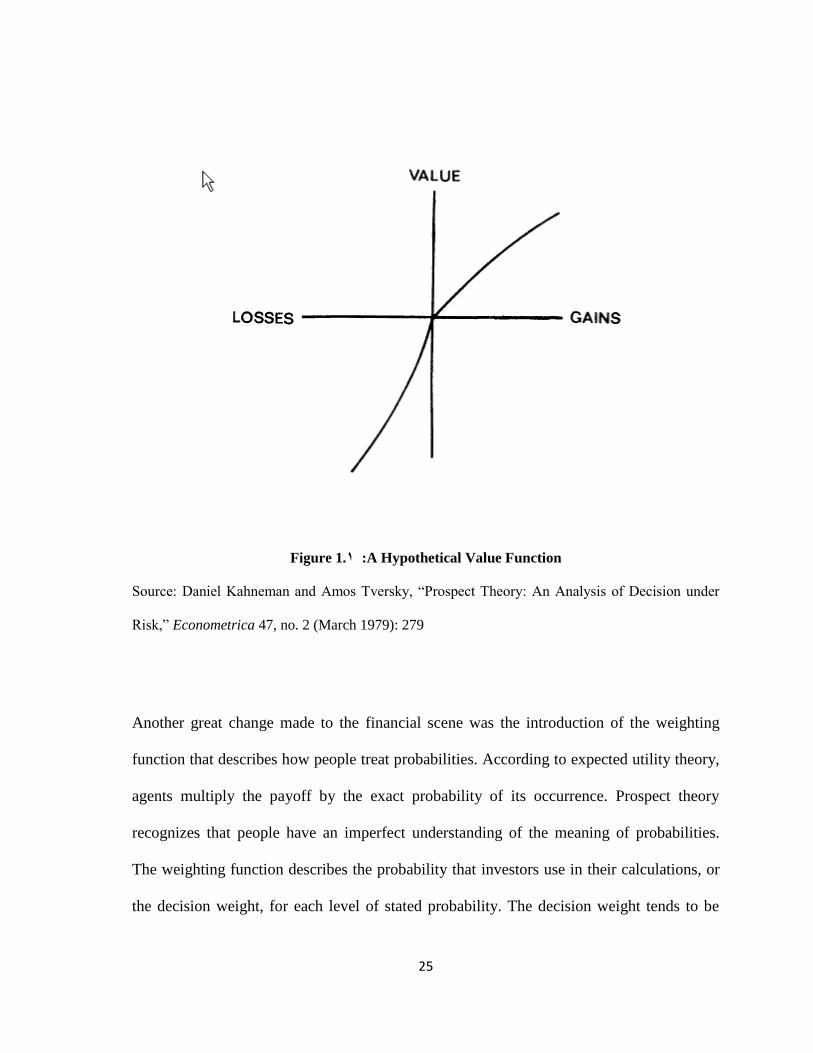
Kahneman and Tversky (1979).Kahneman and Tversky have replaced the subjective utility
theory with a value function that assigns a value to a payoff. Contradictory to the
predictions of expected utility theory, the magnitude of negative and positive payoffs is not
the same — the negative portion of the slope is steeper than the positive portion, so the
absolute value of a loss is greater than the absolute value of an equivalent win. This is
where prospect theory gets its name: the investor sees each gamble as a prospect for change
from his current position. In the case of a guaranteed 300 versus a 50 percent chance of
winning 1,000 and a 50 percent chance of losing 400, expected utility theory would say that
the lotteries are equal because they both have an expected outcome of 300. Under prospect
theory, the probable loss of 400 might outweigh the potential gain of 1,000, thus the
investor could strongly prefer the certain 300. Shiller, 2013
To sum up, prospect theory describes the behaviour of people who accept gambles when
they are less than their levels of aspiration but refuse such gambles when they are above
their levels of aspirations.
25
Figure 1 :1. A Hypothetical Value Function
Source: Daniel Kahneman and Amos Tversky, ―Prospect Theory: An Analysis of Decision under
Risk,‖ Econometrica 47, no. 2 (March 1979): 279
Another great change made to the financial scene was the introduction of the weighting
function that describes how people treat probabilities. According to expected utility theory,
agents multiply the payoff by the exact probability of its occurrence. Prospect theory
recognizes that people have an imperfect understanding of the meaning of probabilities.
The weighting function describes the probability that investors use in their calculations, or
the decision weight, for each level of stated probability. The decision weight tends to be
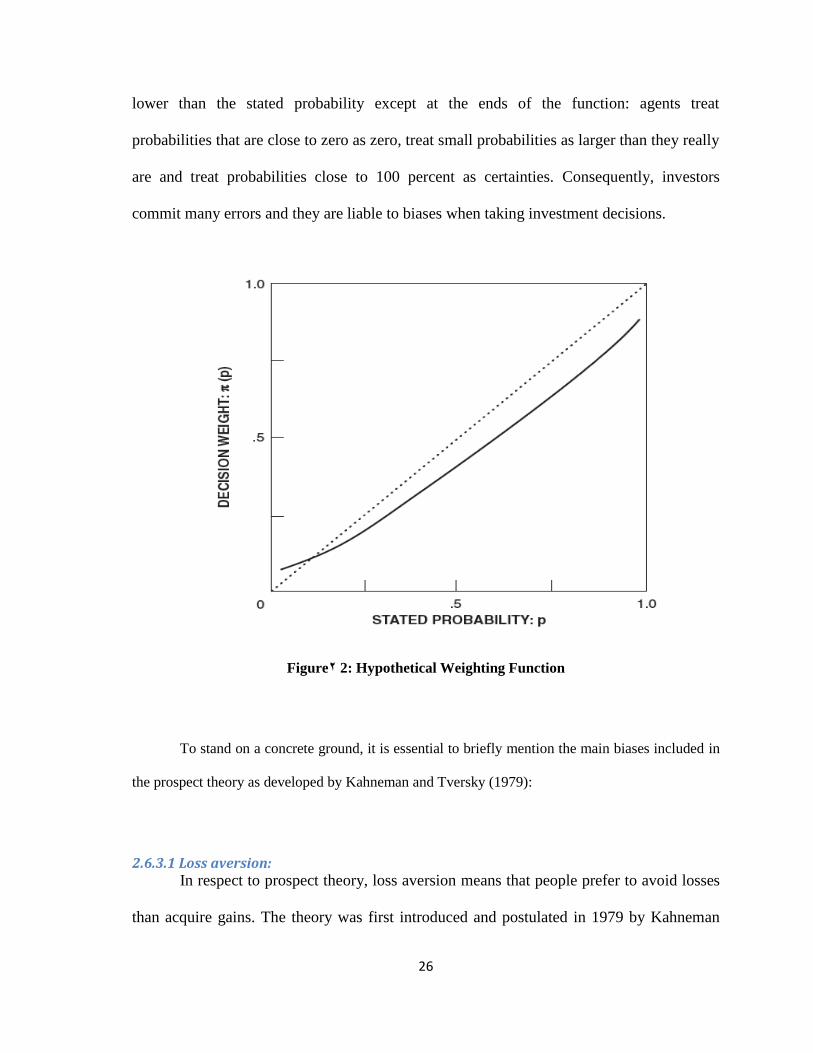
26
lower than the stated probability except at the ends of the function: agents treat
probabilities that are close to zero as zero, treat small probabilities as larger than they really
are and treat probabilities close to 100 percent as certainties. Consequently, investors
commit many errors and they are liable to biases when taking investment decisions.
Figure2 2: Hypothetical Weighting Function
To stand on a concrete ground, it is essential to briefly mention the main biases included in
the prospect theory as developed by Kahneman and Tversky (1979):
2.6.3.1 Loss aversion: In respect to prospect theory, loss aversion means that people prefer to avoid losses
than acquire gains. The theory was first introduced and postulated in 1979 by Kahneman
27
and Tversky under the assumption that losses have a larger impact on preferences than that
of the advantages of gains. Some studies assume that losses are as much as twice as
psychologically strong as gains. Loss aversion is based on the idea that the mental penalty
related to a given loss is greater than the mental reward from a gain of the same size. If
individual investors are loss averse, they may be unwilling to realize losses and may even
take increasing risks to avoid a losing outcome. This provides a viable explanation for
'averaging down' investment tactics, whereby investors increase their exposure to a falling
stock, in an attempt to recoup prior losses. Shefrin (2001) terms this phenomenon
―escalation bias‖.
2.6.3.2 Regret aversion:
Regret aversion shows up when investors have the desire to avoid experiencing the
pain of regret resulting from a poor [investment] decision. It exemplifies more than just the
pain of financial loss, and includes the regret of feeling responsible for the decision, that
gave rise to the loss. Regret aversion can stimulate investors to persist on holding poorly
performing shares. The hope to avoid regret can also potentially bias new investment
decisions. Investors may tend to avoid companies and sectors which have performed poorly
in recent times, in expectation of the regret they would feel if they made the investment and
subsequently lost money. Regret aversion could encourage 'herd behaviour' on the part of
investors, for example, to invest in 'respected' or 'hot' companies as these investments carry
implicit 'insurance' against regret (if you lose money, so will a lot of other people, and
therefore you won't feel as bad about it. Singh, 2012
28
2.6.3.3 Mental Accounting: Mental accounting suggests that people prefers to separate their money into separate
accounts based on various subjective criteria, like the source of the money and intent for
each account. In accordance of the theory, individuals assign different functions to each
asset group, which has an often irrational and detrimental effect on their consumption,
investment decisions and other financial behaviours. Many people use mental accounting,
although they may not realize how illogical this line of thinking really is. For instance,
people often have a special "money jar" or fund set aside for a project, a vacation, son
education or a new home, while still carrying a huge credit card debt. The mental
accounting bias also rises into investing. For instance, some investors distribute their
financial investments between a safe investment portfolio and a risky portfolio to prevent
the negative outcomes that risky investments may have from affecting the entire portfolio.
The problem with such a practice is that despite all the work and money that the investor
spends to separate the portfolio, his net wealth will be no different than if he had held one
larger portfolio. This can lead to inefficient decision-making, for example, an individual
may borrow at a high interest rate to purchase a consumer item, while simultaneously
saving at lower interest rates for a child's college fund. The use of mental accounts could
be partly explained as a self-control device. Singh, 2012
2.6.3.4 Self control: Simply put, self-control bias is a human behavioural tendency that causes us to
consume today at the expense of saving for tomorrow. Money is an area in which people
are notorious for displaying a lack of self-control. (Pompian, 2006)
29
2.7 Heuristics theory:
Heuristics comes from the ancient Greek work ευρίσκω (= discover) and refers to
gaining knowledge or a favourable result by employing smart guessing rather than determined
formulas. Heuristics involve simple experience-based techniques for problem solving, known
as rules-of-thumb or shortcuts, which have been introduced to explain how investors make
decisions, especially during periods when, because of poor information, complex investing
circumstances and market instability, it is difficult to make decisions. Mental heuristics work
by a mechanism called attribute substitution which takes place without conscious awareness
(Kahneman & Frederick, 2002. Similarly speaking, People often use rules-of-thumb or
heuristics to make their decisions and judgments. Some of these judgmental heuristics rest
on metacognitions, people's contemplations about their own thinking. Underpinning each
metacognitive heuristic is an assumption that there is a strong relationship between the way
a person thinks about an event and the natural manner in which that event occurs (Yates,
1990). The heuristics to be defined in the following lines were included in Kahneman and
Tversky‘s work (1979).
2.7.1 Representativeness:
The definition of representativeness is explained by Tversky and Kahneman as
quoted:
"When judging the probability of an event by representativeness, one compares the
essential features of the event to those of the structure from which it originates. In this
manner, one estimates probability by assessing similarity or connotative distance"
(Tversky and Kahneman, 1973). That is to say, representativeness is a process of
overreliance on stereotypes. Similarly speaking, it is a decision making rule of thumb that

30
people use to judge the similarity of something by how well it looks like a particular
prototype. It makes people ignore useful information. Here's an example from (Meyers,
1994): Consider Linda, who is 31, single, outspoken, and very bright. She majored in
philosophy in college. As a student she was deeply concerned with discrimination and
other social issues, and she participated in antinuclear demonstrations. Based on this
description, which you would say, is more likely: (a) Linda is a bank teller or (b) Linda is
a bank teller and active in the feminist movement. Most people answer (b) because it
matches their impression of Linda. But this is an error because it is not possible for the
conjunction of two events to be more likely than one of the events alone. So (b) can never
be more likely than (a).
2.7.2 Availability:
Availability is a cognitive shortcut in which a decision maker relies on knowledge
which is readily available rather than search for other options and alternatives."There are
times in which people evaluate the frequency of a class or the probability of an event by the
ease with which examples or occurrences can be retrieved or brought to mind. For instance,
one may evaluate the risk of heart attack among middle-aged people by recalling such
occurrences among one‘s relatives and acquaintances. Availability is a useful key for
assessing frequency or probability, since instances of large classes are often recalled better
and faster than instances of less frequent classes. However, availability is affected by
factors other than frequency and probability. Hence, the reliance on availability leads to
predictable biases, [...]" Tversky and Kahneman (1974). From a psychological viewpoint,
availability heuristic is a cognitive rule of thumb that rests on current instances that pop up
to mind. When a person is trying to make a decision, a group of connected events or
31
situations might immediately come to the forefront of his\her thoughts. Consequently, a
person might judge that those events are more frequent and possible than others. You give
greater credit to this information and tend to overestimate the probability and likelihood of
similar things taking place in the future. (Cherry, 2013)
2.7.3 Overconfidence:
It is a mental shortcut that affects an individual‘s risk perception because there are
many methods in which a person tends to be overconfident about his/her decision related to
risk-taking behaviour. According to Daniel and Titman (2000), overconfidence is one of
the most documented biases in the behavioural finance literature. Confidence can be
described as the ―belief in oneself and one‘s abilities with full conviction‖ whereas ―
overconfidence can be taken a step further in which overconfidence takes this self-reliant
behaviour to an extreme‖ (Ricciardi and Simon,2000a,p.13). Baruch Fischhoff and his
colleagues (1977) documented the same overconfidence phenomenon when people rate
their certainty about their answers to multiple-choice questions, such as: ―Which is longer
(a0 the Panama Canal, or (b) the Suez Canal?‖ If people 60 percent of the time answer such
a question correctly they will typically feel about 75 percent sure.
There are two main implications of investor overconfidence. The first is that investors take
bad bets because they fail to realize that they are at an informational disadvantage. The
second is that they trade more frequently than is prudent, which leads to excessive trading
volume" Shefrin (2000). Overconfidence, however generated, appears to be a fundamental
factor promoting the high volume of trade we observe in speculative markets. Without such
overconfidence, one would think that there would be little trading in financial markets."
Shiller (2000).

32
2.7.4 Gambler's Fallacy:
When an individual erroneously believes that the onset of a certain random event is
less likely to happen following an event or a series of events. This line of thinking is
incorrect because past events do not change the probability that certain events will occur in
the future. Suppose you have flipped a coin and it has come up heads several straight
times. The gambler's fallacy is the notion that tails is more likely to occur on the next toss.
The chances of heads or tails are 50/50 on every throw. Each toss is completely
independent of the other tosses. Gamblers often base their theories on the incorrect
assumption that something is "bound to happen".
2.7.5 Price anchoring:
Anchoring is used to clarify the strong tendency we all have to cling to a belief that
may or may not be truthful, and use it as a reference point for future upcoming decisions
according to Ricciardi and Simon (2001).the process of anchoring in the decision making
process is used by an individual to solve complex problems by choosing an initial reference
point and slowly adjusting to reach a final decision. For example,‖ one of the most famous
anchors is a past incident or event.
In a 1974 paper entitled "Judgment under Uncertainty: Heuristics and Biases", Kahneman
and Tversky conducted a study in which a wheel containing the numbers 1 through 100 was
spun. After that, subjects were asked if the percentage of U.N. membership accounted for
by African countries was higher or lower than the number on the wheel. Afterward, the
subjects were asked to give an actual estimate. Tversky and Kahneman found that the
33
seemingly random anchoring value of the number on which the wheel landed had an
enormous effect on the answer that the subjects gave. For example, when the wheel landed
on 10, the average estimate given by the subjects was 25%, whereas when the wheel landed
on 60, the average estimate was 45%. As you can see, the random number had an anchoring
effect on the subjects' responses, pulling their estimates closer to the number they were just
shown - even though the number had absolutely no correlation at all to the question.
Anchoring may also be a source of frustration in the financial world, because
investors build their decisions on unrelated figures and statistics. For example, some
investors invest in the stocks of companies that have fallen substantially in a very short
period of time. In this instance, the investor is referring to a recent "high" that the stock has
reached and therefore believes that the drop in price gives an opportunity to buy the stock at
a discount. Although, it is true that the fickleness of the overall market can cause some
stocks to drop considerably in value, permitting investors to take advantage of this short-
term volatility. However, stocks quite often also fall in value due to changes in their
underlying essentials. .
After shedding some light on the general framework of the research, it is time to turn to
take a glance on Palestine Stock Exchange.
2.8 Palestine stock exchange
Palestine Exchange (PSE) was established in 1995 to promote investment in
Palestine. The PSE was fully automated upon establishment- a first amongst the Arab Stock
Exchanges. The PSE became a public shareholding company in February 2010 responding
to principles of transparency and good governance. The PSE operates under the supervision
of the Palestinian Capital Market Authority.

34
The PSE strives to provide an enabling environment for trading that is characterized by
equity, transparency and competence, serving and maintaining the interest of investors.
The PSE is very appealing in terms of market capitalization; it is financially sound, and
well capitalized to maintain a steady business in a volatile world, as it passed with the
minimum level of impact of the global financial crisis compared to other MENA
Exchanges.
There are 48 listed companies on PSE as of 31/03/2013 with market capitalization of about
$ 3 billion across five main economic sectors; banking and financial services, insurance,
investments, industry, and services. Most of the listed companies are profitable and trade in
Jordanian Dinar, while others trade in US Dollars. Only stocks are currently traded on PSE,
but there is potential and readiness to trade other securities in the future.
In 2009, the PSE ranked thirty third amongst the worldwide security markets, and
regionally comes in second in terms of investor protection.
2.8.1 PSE Vision
We seek to be a model for Arab and regional financial markets, through providing
innovative services, proposing ideal investment opportunities in securities, attracting
investments, the use of state of the art technology, compliance to the rules of corporate
governance and establishing constructive relations with Arab, regional and global markets.
2.8.2 PSE Mission
To provide a fair, transparent and efficient market for trading securities that serves
investors, protects their interests, contributes to creating an enabling environment that
attracts local and foreign investments, and interacts with local and Arab relevant

35
institutions in a manner that serves the national economy and enhances the culture of
investment in financial markets.
2.8.3 PSE Objectives
To provide a safe and enabling trading environment characterized by efficiency,
fairness and transparency.
To increase the investment awareness of the local community and enhance PSE
relations with local, Arab and international economic institutions and forums.
To develop domestic investments and attract Palestinian Diaspora & foreign capital.
To increase the depth of the exchange by continuously listing new companies
and providing new and diverse financial tools and services.
To create a proficient working environment within the PSE by investing in human
capital and maintaining an up-to-date technologies of stock markets.
2.8.4 There are many reasons to invest in the Palestine Exchange:
1. Small yet robust.
2. Great spring back potential.
3. Tried & tested.
4. Undervalued stocks.
5. Evolving and efficient regulatory environment within international best practice.
6. No restrictions on foreign investment or taxation of capital gains, no foreign
exchange restrictions.

36
2.8.5 PSE Regulatory Framework
In 2005, with the development of the legal structure of the securities sector in
Palestine, particularly the issuance of the Securities Law No. (12) of 2004 and the Capital
Market Authority Law No. (13) of 2004, the Palestine Capital Market Authority (CMA)
took over the responsibility of supervising the PSE and issuing securities by the public
shareholding companies.
The PSE operates in accordance with the Securities Law No. (12) of 2004, and the
bylaws that stemmed from it in a manner that does not contravene with the CMA
directives.
The PSE works also in accordance with modern regulations, which form a strong
basis to ensure a fair trading environment. These regulations include: listing regulation,
trading regulation, disclosure regulation, membership regulation, dispute resolution
regulation and the regulation of professional conduct.
It is time now to turn to chapter 3, the literature review, in order to display previous
work related to this work and the benefits maintained from others efforts.

38
Chapter Three: Literature Review
Introduction
Previous studies
Comments
39
3.1 Introduction:
This chapter aims at reviewing the previous studies related to the subject matter of the
research .the previous studies will be organized on a chronological basis from the oldest to
the newest. As is the case with any review paper, we will miss many papers and topics that
some deem relevant. We are human, and all humans err. As is the case for individual
investors, so is the case for those who study them.
3.2 Previous studies:
Barberis and Huang (2001):” Mental Accounting, Loss Aversion, and Individual
Stock Returns”
The researchers study equilibrium-level stock returns in two economies: one in which
investors are loss averse over the fluctuations of their stock portfolio and another in which
they are loss averse over the fluctuations of individual stocks that they own. research results
were obtained via using and designing a mathematical model to test the hypotheses. The
conclusions of the research are:
In equilibrium, under mental accounting, individual stock returns have a high mean,
are more volatile than their underlying cash flows and are slightly predictable in the
time series.
The investor's system of mental accounting affects asset prices in a significant way.

40
Massa, Massimo and Simonov, Andrei (2002):‖ Behavioural Biases and
Investment”
The aim of the research is to investigate the way investors react to prior gains/losses
and the so called‖ familiarity‖ bias by using a new and unique dataset. The methodology
followed in the research is done by inspecting investor reactions to different definitions of
gains and losses (i.e., overall wealth, financial gains and losses and real estate gains and
losses). The researchers also investigated the issue of narrow framing and mental
accounting by considering how gains and losses in a category of wealth (e.g., real estate)
affects changes in holdings in other categories (e.g., financial assets).the conclusions of the
research are:
The research provided evidence that shows that investors react to prior gains/losses
according to what postulated by the house-money effect. That is, previous gains
increase investor risk taking, while previous losses reduced reduce it.
In terms of individual stock picking we provided evidence in favour of the
information based familiarity hypothesis and showed that investor stock choice is
mostly driven by the availability of information.
Familiarity can be considered more as a proxy for the availability of information
than a behavioural heuristics.
Barber and Odean (2005),”Individual investors”
This study has a two fold aim of examining the disposition effect on individual
investor‘s behaviour and the effect of overconfidence manifested in overtrading. The

41
research provides an overview of research on the stock trading behaviour of individual
investors. The research conclusions are:
There is compelling evidence that investors tend to sell their winning
investments and to hold on to their losers.
It is not yet clear what contribution behavioural finance will make to asset
pricing theory.
Traditional models of financial markets give us very little insight into why
people trade as much as they do.
Chun, Wong and Ming, Lai (2007): “Investor Behaviour and Decision-Making Style:
A Malaysian perspective”
The study examines the common underlying investor behaviour of Malaysian Stock
market investors. The study uses a structural questionnaire. Data were collected from 290
market investors from April to June 2007. The survey concludes the following points:
The psychological factors underlying the decision-making in Malaysian
Stock Market investors existed.
Because the investment Knowledge and skills were low, decisions were
more likely to be influenced by behavioural biases.
Some investors were overly confident of their personal ability to trade
stocks.
42
Dargham, Nathalie, (2007): “The implications of Behavioural Finance.‖
The paper aims at providing a synthesis of the behavioural finance literature over the
past two decades in order to answer the question: What can we learn from behavioural
finance? To address this question, the paper reviews in the first section the efficient market
hypothesis theory and then explains the prospect theory. In the second section, the
researcher presents the various psychological and sociological principles that constitute the
basis of the behavioural finance. The paper is a narrative one and it surveys the
developments occurred in the field of finance beginning with Efficient Market Hypothesis
and ending with Behavioural finance and it concludes the following:
Actual financial markets tend to deviate from the traditional financial hypotheses,
i.e. Efficient Market Hypothesis.
Behavioural finance has contributed to our better understanding of investors‘
behaviour in financial markets.
Financial hypotheses and theories have helped investors to make better investment
decisions in the actual financial markets.
Shefrin, Hersh, (2007): “Behavioural Finance: Biases, Mean-Variance Returns, and
Risk Premiums.”
The aims of the paper are to discuss some of the behavioural phenomena and how
they connect to particular issues related to analyst perceptions about return and to compare
returns for what is called behavioural mean-variance portfolios with those of traditional
mean-variance efficient portfolios. The research reached the following conclusions:
43
Many investors make judgements that are based on some assumptions that
mistakenly assume that risk and return are negatively related.
The assumptions underlying analysts‘ target prices assume that risk and return are
positively related.
Behavioural mean-variance portfolios exemplify investor errors and feature
negatively skewed return patterns.
Bhandari and Hassanein and Deaves, (2008):” Debiasing Investors with Decision
Support Systems: An Experimental Investigation.”
This research aims at presenting evidence that decision support systems can play an
important role in debasing behaviourally-challenged investors. An empirical study
involving 119 subjects provides strong evidence for the existence of cognitive biases in
investment decision making and demonstrates the effectiveness of decision aids in lowering
the negative impact of such biases on the ability of investors to make sound investment
decisions. Additionally, such decision aids are shown to be more valuable in environments
where bias is most likely to be present. The conclusions of the research are:
This study has demonstrated that individuals, even in simple investment decision-
making tasks are adversely influenced by such cognitive biases as framing,
representativeness and ambiguity.
The study found that decision aids such as feedback and graphs can significantly
mitigate the impact of such biases.
The study concluded that decision aids such as feedback and graphs can lower the
impact of investment related cognitive biases and they are more valuable in
environments where the bias level is likely to be higher.
44
Chen and Kim and Nofsinger, (2008): ―Trading Performance, Disposition Effect,
Overconfidence, Representativeness Bias, and Experience of Emerging Market
Investors,‖
Using brokerage account data from China, the study aims at examining investment
decision making in an emerging market. The study used brokerage account data from China
and four empirical tests to examine the investment decision making:
a) Investor characteristics and trading performance.
b) Investor characteristics and the disposition effect.
c) Investor characteristics and overconfidence.
d) Investor characteristics and the recent past performance of stocks purchased. the
research was concluded as follows:
The study finds that Chinese investors make poor trading decisions: the stocks they
purchase underperform those they sell.
Chinese investors suffer from three behavioural biases: (i) they tend to sell stocks
that have appreciated in price, but not those that have depreciated in price, consistent
with a disposition effect, acknowledging gains but not losses; (ii) they seem
overconfident; and (iii) they appear to believe that past returns are indicative of
future returns (a representativeness bias).
Chinese investors seem more overconfident than U.S. investors (i.e., the Chinese
hold fewer stocks, yet trade very often) and their disposition effect appears stronger.
45
Ghandra, Abhiee (2008): “Decision-Making In The Stock Market: Incorporating
Psychology with Finance.”
The purpose of the paper is to explore the impact of behavioural factors and
investors‘ psychology on their decision-making and to examine the relationship between
investors‘ attitude towards risk and behavioural decision-making.The research was based
on the secondary data and concluded that:
Contrary to classical finance theory suggestions, individual investors do not always
act rationally while making investment decisions.
Individual investors practice psychological and emotional biases which play an
essential role in an investor‘s decision-making process.
The individual investors are the most susceptible to behavioural anomalies and
mental errors.
The investment decision making is influenced largely, by behavioural factors like
greed and fear, cognitive dissonance, heuristics, mental accounting, and anchoring.
Nik, Maheran et.al (2008): “Study on Behavioural Finance: Is the Individual Investors
Rational?
The article aims at offering a brief survey of prior research and theory on behavioural
finance and look at the behaviour of the investors, their psychology and their investing
style.
There is substantial evidence that psychological biases affect market price.
46
Due to the mispricing, there is a substantial misallocation of resources in the
economy. Therefore, there is some suggestion to the economists to study how
regulatory and legal policies can limit the damage done by imperfect rationality.
Government should take proper actions to help investors make better choices and
make the market more efficient by making several modifications to regulations,
investment education and perhaps standardizing mutual fund advertizing.
Bernéus, Hannes, Sandberg, Carl, Wahlbeck, David (2008) “behavioural finance:
investors’ rationality”
The purpose of this thesis is to examine if professional investors are indicating
tendencies of irrational behaviour when exposed to certain psychological dilemmas related
to the financial world. A quantitative method has been used and a survey has been
conducted. The results of the survey show that Anchoring and Gambler’s fallacy both
indicated strong biases, compared to overconfidence that indicated low tendencies.
Chira, Inga et.al (2008) “Behavioural Bias within the Decision Making Process”
This paper investigates the cognitive biases and heuristics to which business
students are subject. This paper evaluates the existence and extent of a number of
psychological phenomena that fall under the three categories. Specifically, it will analyze:
excessive optimism and overconfidence, loss aversion, the influence of sunk cost on the
decision making process, and the concept of familiarity. In addition, illusion of control and
confirmation biases will be presented. This was achieved by administering a questionnaire
and collecting empirical evidence about both undergraduate and graduate business students‘

47
own perceptions of bias. The psychological phenomenon known as bias and its presence in
human decision making, both financial and non-financial, will provide additional insight on
the subject of investor irrationality and broaden the ideals of rationality assumed in
classical financial theory. the conclusions were: the research focused on overconfidence
and excessive optimism, loss aversion, familiarity, and sunk cost fallacy, as well as an
initial overview of illusion of control and confirmation bias. Research is based on only one
questionnaire and was administered to a limited number of students, so any statistical
inferences drawn may be spurious.
Seppälä, Antti (2009):” Behavioural Biases of Investment Advisors: The Effect of
Overconfidence and Hindsight Bias”
The objective of this thesis is to examine the effects of three behavioural biases on
investment advisors. These biases are hindsight bias, overconfidence and self-attribution
bias. A survey study is carried out to find out how the studied biases affect the investment
advisors. Conclusions of the study were as follows:
The results on hindsight bias suggest that all people, including investment advisors,
suffer from it. People tend to perceive their initial performance better than it
actually is, after learning the outcome
The tests of this study show that people tend to overestimate their initial capability
to choose the better performing asset from two alternatives or estimate the return of
an asset, after learning the realization.
48
Thus expertise is interpreted to reduce hindsight bias. However, investment advisors
have the strongest tendency to exaggerate their initial ability to predict asset returns,
after learning the realization. The exaggeration reinforces with experience.
People with more expertise are less confident compared to their true capabilities.
Professionals outperform other people with lower level of confidence, which
indicates lower overconfidence.
People who believe they have been successful in a task on initial round increase
their confidence to the second round.
Opposite to the hypothesis that expertise reduces behavioural biases, investment
advisors are the most exposed to self-attribution bias.
Gervais, Simon (2009): “Behavioural Finance: Capital Budgeting and Other
Investment Decisions.
The survey explores the literature that handled the effects of behavioural biases on
capital budgeting. It is a descriptive research that depends on surveying the literature in
order to study the effects of behavioural biases on capital budgeting. The study concluded
that:
People tend to be overconfident and overestimate the precision of their information
and their ability to control risk. In addition to the fact that, firm managers are
especially susceptible to such bias.
Learning and contractual incentives can reduce the investment inefficiencies that
result from manager‘s overconfidence, but do not seem sufficient to eliminate them.
Deeper research and exploration is needed to study the interaction between
contractual incentives, overconfidence, and investment policy.
49
Bailey, Warren and Kumar, Alok and Ng, David (2010) : “Behavioural Biases of
Mutual Fund Investors”
The study examines the effect of behavioural biases on the mutual fund choices of
a large sample of U.S. discount brokerage investors using new measures of attention to
news, tax awareness, and fund-level familiarity bias, in addition to behavioural and
demographic characteristics of earlier studies. The researchers used documenting the
importance of behavioural factors in the delegated management setting of mutual funds
besides applying factor analysis to the individual behavioural bias measures and other
characteristics identifies several investor stereotypes that the study relates to mutual fund
trading and performance. The study concludes the following points:
Behavioural factors influence the decisions of individual investors to hold
individual stocks as opposed to mutual funds, including passive index funds.
Investors with higher income, relatively higher educational level, and greater
investment experience are more likely to use mutual funds and benefit from their
choices.
Investors with strong behavioural biases tend to gravitate towards individual stocks
and avoid low expense index funds. When they do invest in mutual funds, they tend
to select high expense funds, trade funds frequently, avoid index funds, and time
their buys and sells poorly, thereby damaging their portfolio‘s performance.
Investors who score high on behavioural biases tend to invest in funds with higher
expense ratios and loads. They experience poor investment performance as a result.
50
Park, JaeHong et. al (2010):” Confirmation Bias, Overconfidence, and Investment
Performance: Evidence from Stock Message Boards”
Using data from a new field experiment in South Korea, the study examines how
information from virtual communities such as stock message boards influences investors‘
trading decisions and investment performance. An analysis of 502 investor responses from
the largest message board operator in South Korea was used to support the study
hypotheses. Findings of the research were:
We find that investors exhibit confirmation bias when they process information
from message boards.
We also demonstrate that investors with stronger confirmation bias exhibit greater
overconfidence.
Yahyazadehfar, Mahmood et.al (2010):” The Influence of Investor Psychology on
Regret Aversion”
This paper looks at a bias that can affect investors which is regret aversion and
examines the influences of four psychological factors include disposition effect, Herding
Behaviour, cognitive dissonance and Conservatism the investors regret aversion. Survey by
questionnaires is conducted and five-point scales are anchored from strongly disagree to
strongly agree. The scales are combined from several other relevant studies, such as Shefrin
and Statman (1985), with new items to make an initial list of questions. Data is collected
from Tehran Stock Exchange. 60 investors were asked to complete the questionnaires. 48
of the 60 retuned questionnaires are usable. Eighty four percent of all the respondents are
male and 16% are female. The research found that:
51
Investor psychology tends to feel sorrow and grief after having made an error in
judgments.
Investors decision whether to sell a security are typically emotionally affected by
whether the security was bought for more or less than the current price.
The disposition effect implies that investors, in trying to avoid regret, will have a
greater tendency to sell winners than losers.
Investor must try to practice some mechanisms to control his (her) irrational
behaviour.
Luong, Le and Ha, Doan (2011): “Behavioural Factors Influencing Individual
Investors’ Decision Making and Performance: a survey at The Ho CHI Mini Stock
Exchange. “
The main objectives of this research are:
To apply the behavioural finance to identify the possible behavioural factors
influencing the investment decisions of individual investors at the HOSE.
To identify the impact levels of behavioural factors on the investment decisions and
performance of individual investors at the HOSE.
To give some recommendations for individual investors to adjust their behaviour to
achieve good investment results.
To set the backgrounds for the further researches in behavioural finance in Vietnam.
Hypotheses are tested through the questionnaires distributed to individual investors at
the Ho Chi Minh Stock Exchange. The collected data are analyzed by using SPSS and
AMOS software's. The research concluded that:
52
There are five behavioural factors that impact the investment decisions of individual
investors at The Ho CHI Mini Stock Exchange: Herding, Market Prospect,
Overconfidence, Gambler‘s fallacy and anchoring.
Only three factors are found to influence the Investment performance: Herding,
Prospect and Heuristic.
Further Researches are suggested to apply behavioural finance to explore the
behaviours influencing the decisions of institutional investors at the Stock Exchange of
Vietnam.
Mahmood Iqbal, et.al (2011): “Behavioural Implications of investors for Investment
in the Stock Market.”
The research aims at examining the role of various socioeconomic, demographic an
attitudinal factors affecting the investment decision of investors in the market.‖ The
research concluded that:
The researcher developed a risk perception centered model and various
socioeconomic and attitudinal variables have been incorporated in the model. The
impact of these variables on the dependent variables of reinvestment intentions and
return expectations can be tested.
It is necessary that the investment professionals take these factors into consideration
when designing portfolio of their clients.
53
Ahmed, Naveed et.al (2011): “Behavioural Finance: Shaping the Decisions of small
Investors of Lahore Stock Exchange.”
The paper aims at investigating the behaviour of investors in the stock market by
looking into the decision making process of the small investors in Lahore Stock Exchange.
Survey methodology was used to collect the data from the small investors of Lahore Stock
Exchange. A total of 300 questionnaires were distributed out of which 147 generated valid
responses yielding a response rate of 49% which is quite satisfactory. The sample was
drawn randomly and Questionnaire was partially adopted from (Sevil, Sen and Yalama,
2007). Simple descriptive are used to analyze the data using software SPSS 16.0. Findings
were:
Small investors in Lahore Stock Exchange seem to be irrational and have different
psychological biases like loss aversion, regret aversion and heuristics.
The behavioural aspect of the human nature could not be avoided while providing the
explanations with regard to stock market functioning and volatility as human are the
participants and drives if these markets. The paper calls for more research in the field so
that alternative models could be advised and better understanding of the stock market
mechanisms and functioning can be reached.
Ghandra, Abhijeet and Kumar, Ravinder (2011): “Determinants of Individual
Investor Behaviour: An Orthogonal Linear Transformation Approach.”
The paper considers the theory of irrationality of individual investors and
investigates into their behaviour regarding their investment decisions. The paper
investigates whether some psychological and contextual factors affect individual investor
54
behaviour. The paper reveals the five underlying psychological axes that appear driving the
individual investor behaviour. The five axes are called as prudence and precautious attitude,
conservatism, under confidence, informational asymmetry and financial addiction.
Gunay, Suleyman and Demirel, Engin (2011): “Interaction between Demographic and
Financial Behaviour Factors in Terms of Investment Decision Making”
The purpose of this study is to show that there is an interaction between
demographic and financial behaviour factors (overreaction, herding, cognitive bias,
irrational thinking, and overconfidence) in investment decisions.
The study is conducted in Edirne city, Turkey. A questionnaire is developed and seventeen
questions are asked to the respondents based on these eighteen hypotheses. Three of these
questions are about demographic factors and fourteen of these questions are about financial
behaviour factors. The questionnaire is distributed to 397 respondents and conclusions
driven were:
Gender is an important factor in financial behaviour. It is found that male
respondents have tendency to show more financial behaviour than female
respondents in their investment decisions.
Gender has an interaction with five of the financial behaviour factors (overreaction,
herding, cognitive bias, irrational thinking, and overconfidence).
The level of individual savings has an interaction with four of the financial
behaviour factors (overreaction, herding, cognitive bias, and irrational thinking).

55
There is no interaction between age and six financial behaviour factors
(overreaction, herding, cognitive bias, irrational thinking, overconfidence and media
effect).
Huei-Wen Lin,(2011) : “Elucidating rational investment decisions and behavioural
biases: Evidence from the Taiwanese stock market”
This study examines how rational decision making and behavioural biases are
related, as well compares the relative differences of three behavioural biases, that is,
disposition effect, herding and overconfidence, by various demographic variables. The
psychological cognition of investment decision making among investors and the
antecedences of behavioural biases are also studied. A sampling survey of 430 valid
respondents from voluntary individual investors in Taiwan was used to examine how
rational decision making and behavioural biases are related. The results further demonstrate
that male and female investors significantly differ in disposition effect, herding and
tendency of overconfidence.
Evans, Anthony et.al (2011): “Trust and self-control: The moderating role of the
default”
The present research explores the determinants of deliberative trust, investigating
how trust decisions are affected by the availability of cognitive resources. The research test
the interaction of two relevant factors: self-control (the ability to exert mental control over
one‘s behaviour) and the default response (a preselected option that requires minimal or no
effort). The study uses the experimental approach. So students from Brown university (N =
56
132) were recruited to participate in a study on decision making. The average age was 19.9
years (SD = 2.5) and 60% were women. The experiment was administered via computer.
The research found that:
These experiments illustrate that deliberative trust depends upon two interactive
factors: the availability of self-control and the default response
Self-control has an indirect, rather than a direct, influence on trusting behaviour
When self-control is weak and decision making requires effort, individuals settle for
a preselected default response.
Sadi, Rasoul et.al (2011): “Behavioural Finance: The Explanation of Investors’
Personality and Perceptual Biases Effects on Financial Decisions “
The aim of this study is to recognize the popular perceptual errors among investors and
its connection with their personality. 200 of the investors in Tehran's stock market were
taken randomly as samples and the needed data was gathered through questions, using the
parametric analysis and correlation the researchers have tried to check the accuracy of the
hypotheses. the research was summed by the following conclusions:
The finding demonstrates that the offered perceptual errors have got a significant
correlation with the investors‘ personality.
The conclusions exhibit that there is direct correlation between extroversion and
openness whit hindsight bias and over confidence bias, between neuroticism and
randomness bias, between escalation of commitment and availability biases.
Also, there is a reverse correlation between conscientiousness and randomness bias,
between openness and availability bias.
57
Deuskar, Prachi et.al (2012):” Effect of Regret”
The study empirically investigates the effect of regret on future decisions in the
context of stock-trading strategies by individual investors.
This study investigates the effect of regret on future decisions in the context of stock
trading via using data for all orders submitted by individual investors on the Shanghai
Stock Exchange for one year. Conclusions of the research were as follows:
People are more likely to change their trading strategy, i.e., whether to place a
desperate or patient order, after experiencing regret over their most recently
submitted order.
The study finds that the effect of regret on the next order placed is stronger if the
prior order was executed rather than unexecuted (i.e., action leads to more regret
than inaction), if the investor lost money on the prior trade (i.e., a worse mood
amplifies the effect of regret), and if the prior order represented an unusual trading
strategy for the individual.
The emotionally-charged decisions made because of regret lead to worse outcomes
for investors, with the poor returns resulting from these decisions lasting for at least
three months.
Masomi, Sayed and Ghayekhloo, Sara (2012): “Consequences of human behaviours’
in Economics: The Effects of Behavioural Factors in Investment decision making at
Tehran Stock Exchange.”
The study investigates the role of behavioural finance and investor psychology in
investment decision- making at Tehran Stock Exchange with due reference to institutional
investors. A sample of 23 institutional investors is used. The Behavioural factors discussed
58
are: representativeness, overconfidence, anchoring, gambler‘s fallacy, loss aversion, regret
aversion and mental accounting affected the decisions of the institutional investors
operating at the TSE. Conclusions were:
The study discovers that behavioural factors affect the investment decision-making
process.
Heuristics and Prospect theories were evident, but heuristics were dominant over the
prospect theory in explaining the institutional investors‘ behaviour that are
operating in TSE.
The study disclosed that the effect of behavioural factors were evident on the
institutional investors operating in TSE but with varying degrees from very high
impact to little or no impact.
Shaheen, Yasser (2010): The perceived Usefulness of Information for Investment
Decisions: Evidence from Palestine Securities Exchange [PSE]
The research investigates the perception of users concerning the adequacy,
relevance, availability and usefulness of disclosed information in the financial reports of
companies listed at the PSE.a survey methodology was used in the research and a well-
designed questionnaire was distributed to a chosen sample of information users during the
period 1/8/2008-1/11/2008. The research found that investors did not consider available
information disclosed by the listed companies as adequate or useful.
The most important finding in the research is that lack of available information and
the uselessness of this information to investors led to the inefficiency of the market on the
weak level.
59
3.3 Comments:
From revising the previous studies, we can see the following facts:
This research agrees with the previous studies in respect to the general topic which is
behavioural factors influencing individual investment decision making process. They all
studied these behavioural factors in their local environments and stock exchanges. They all
agreed upon the importance and the effect of behavioural factors on the individual
investment decision making process and the practical studies applied a similar tool of
research which is a questionnaire. All the studies agreed upon the important effect of
overconfidence on decision making process and gave it special consideration in analysis
and scrutiny.
This research differs from the previous studies mentioned above in the fact that it
studies the nine behavioural factors mentioned in the prospect theory and the heuristics
theory as mentioned in Tversky and Kahneman (1979). In addition, this study is solely
practical while many studies done in this field were theoretical and synthesized previous
studies into one body.

60
Chapter Four: Research Design And
Methodology And Data Analysis
Methodology and Procedures
Introduction
Research Methodology
Data analysis and explanations
61
4.1 Methodology and Procedures
4.2 Introduction:
This chapter describes the methodology that is used in this research. The adopted
methodology to accomplish this research uses the combination techniques of descriptive
approach and information about the research design, research conceptual model, population
sample size, research setting, questionnaire design, statistical data analysis, content validity, pilot
study and ethical aspects of the research.
4.3 Research Methodology:
This Research uses the quantitative analysis. The research relies on secondary data such as
books and specialized studies and journals. Due to the novelty of the topic in Palestine, the
research relies on the primary data collected by questionnaire distributed for relevant target
group which is individual investors in Palestine Stock Exchange. The research follows the
descriptive methodology approach to describe the basic features of the data in a research.
Descriptive methodology is accepted methodology to be used because it is non-experimental in
that it deals with the relationships existed between non-manipulated variables in a natural, rather
than artificial setting. Since the events or conditions of our research interest have already existed
and practiced, the researcher focuses and selects the relevant variables for analysis of the
relationships among the hypotheses
4.3.1 Research Population:
The research population includes all individual investors in Palestine Exchange living in
The Gaza Strip totalled 11,311 individual investor, as obtained from the management of El
Wasata Company in the year 2012.
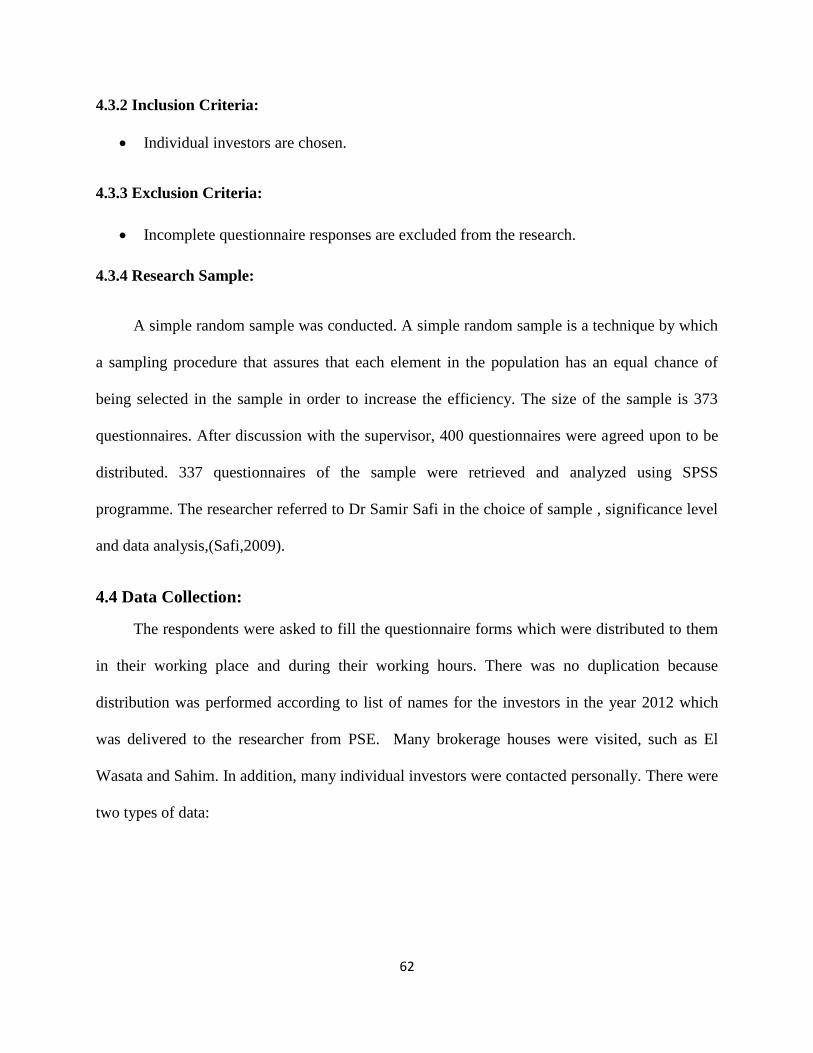
62
4.3.2 Inclusion Criteria:
Individual investors are chosen.
4.3.3 Exclusion Criteria:
Incomplete questionnaire responses are excluded from the research.
4.3.4 Research Sample:
A simple random sample was conducted. A simple random sample is a technique by which
a sampling procedure that assures that each element in the population has an equal chance of
being selected in the sample in order to increase the efficiency. The size of the sample is 373
questionnaires. After discussion with the supervisor, 400 questionnaires were agreed upon to be
distributed. 337 questionnaires of the sample were retrieved and analyzed using SPSS
programme. The researcher referred to Dr Samir Safi in the choice of sample , significance level
and data analysis,(Safi,2009).
4.4 Data Collection:
The respondents were asked to fill the questionnaire forms which were distributed to them
in their working place and during their working hours. There was no duplication because
distribution was performed according to list of names for the investors in the year 2012 which
was delivered to the researcher from PSE. Many brokerage houses were visited, such as El
Wasata and Sahim. In addition, many individual investors were contacted personally. There were
two types of data:

63
4.4.1 Secondary Data:
Secondary data was obtained from journals on behavioural finance, standard finance,
investor behaviour in financial markets and behavioural factors affecting the investment decision
making in financial markets.
4.4.2 Primary Data:
This data was collected from the field by questionnaire. Questionnaire was designed and
distributed to get responses from target group of the research. Respondents were asked to
provide opinions on the variables of this research, such as cognitive biases of the investors when
trading in stocks.
4.5 Questionnaire Design:
A survey Questionnaire was designed to collect the research‗s primary data. The
questionnaire included close-ended questions to facilitate the data collection process. The
questionnaire is composed of nine sections to accomplish the aim of the research; each section is
tested by using a number of close ended questions.
4.6 Data Measurement
In order to be able to select the appropriate method of analysis, the level of measurement
must be understood. For each type of measurement, there is/are an appropriate method/s that can
be applied and not others. In this research, Ordinal scale is used. The numbers assigned to the
important (1,2,3,4,5) do not indicate that the interval between scales are equal, nor do they
indicate absolute quantities. They are merely numerical labels. Based on Likert scale we have the
following:
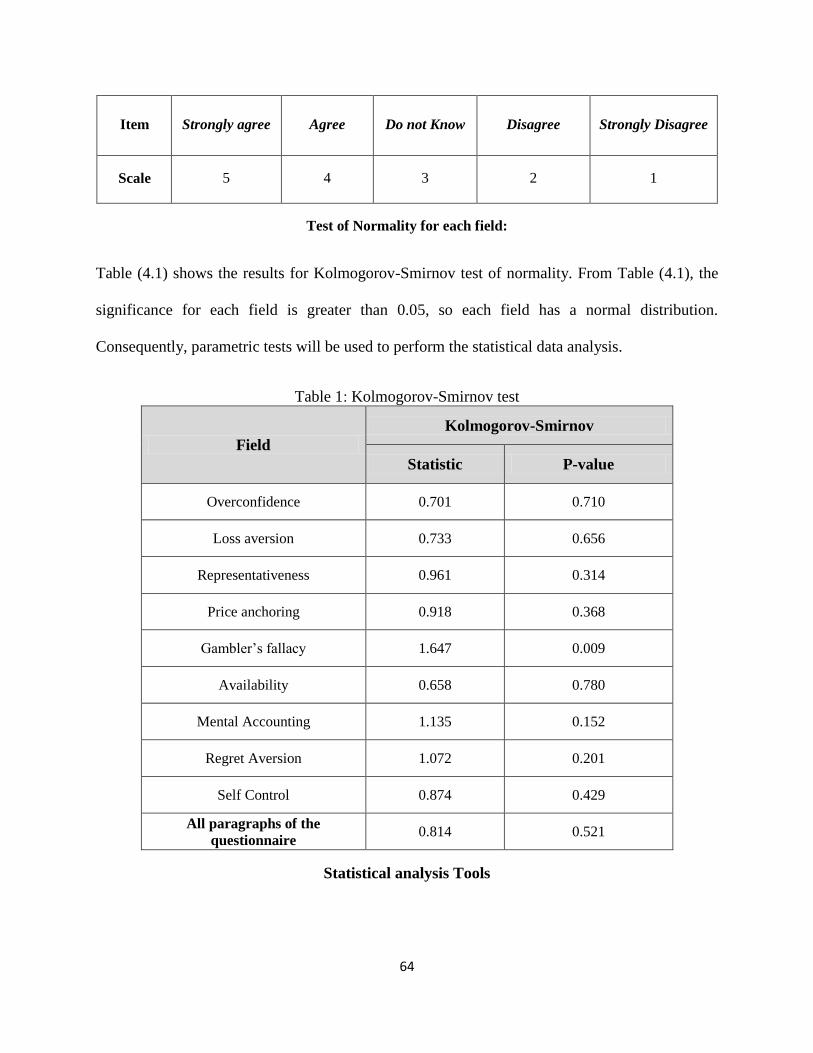
64
Item Strongly agree Agree Do not Know Disagree Strongly Disagree
Scale 5 4 3 2 1
Test of Normality for each field:
Table (4.1) shows the results for Kolmogorov-Smirnov test of normality. From Table (4.1), the
significance for each field is greater than 0.05, so each field has a normal distribution.
Consequently, parametric tests will be used to perform the statistical data analysis. Person-O
Table 1 : Kolmogorov-Smirnov test
Field
Kolmogorov-Smirnov
Statistic P-value
Overconfidence 0.701 0.710
Loss aversion 0.733 0.656
Representativeness 0.961 0.314
Price anchoring 0.918 0.368
Gambler‘s fallacy 1.647 0.009
Availability 0.658 0.780
Mental Accounting 1.135 0.152
Regret Aversion 1.072 0.201
Self Control 0.874 0.429
All paragraphs of the
questionnaire 0.814 0.521
Statistical analysis Tools

65
The researcher would use quantitative data analysis method. The Data analysis will be
made utilizing (SPSS 20). The researcher would utilize the following statistical tools:
1) Kolmogorov-Smirnov test of normality.
2) Pearson correlation coefficient for Validity.
3) Cronbach's Alpha for Reliability Statistics.
4) Parametric Tests (One-sample T test, Independent Samples T-test, Analysis of Variance).
Internal validity:
As shown in Appendix (1)
Table (A1-2) clarifies the correlation coefficient for each paragraph of the
―Overconfidence‖ and the total of the field. The p-values (Sig.) are less than 0.05, so the
correlation coefficients of this field are significant at α = 0.05, thus all paragraphs of this field are
consistent and valid to measure what it was set for.
Table (A1-3) clarifies the correlation coefficient for each paragraph of the ―Loss aversion‖
and the total of the field. The p-values (Sig.) are less than 0.05, so the correlation coefficients of
this field are significant at α = 0.05, thus all paragraphs of this field are consistent and valid to
measure what it was set for.
Table (A1-4) clarifies the correlation coefficient for each paragraph of the
Representativeness ―and the total of the field. The p-values (Sig.) are less than 0.05, so the
correlation coefficients of this field are significant at α = 0.05, thus all paragraphs of this field are
consistent and valid to measure what it was set for.

66
Table (A1-5) clarifies the correlation coefficient for each paragraph of the " Price
anchoring " and the total of the field. The p-values (Sig.) are less than 0.05, so the correlation
coefficients of this field are significant at α = 0.05, thus all paragraphs of this field are consistent
and valid to measure what it was set for.
Table (A1-6) clarifies the correlation coefficient for each paragraph of the ―Availability‖
and the total of the field. The p-values (Sig.) are less than 0.05, so the correlation coefficients of
this field are significant at α = 0.05, thus all paragraphs of this field are consistent and valid to
measure what it was set for.
Table (A1-7) clarifies the correlation coefficient for each paragraph of the ―Mental
Accounting‖ and the total of the field. The p-values (Sig.) are less than 0.05, so the correlation
coefficients of this field are significant at α = 0.05, thus all paragraphs of this field are consistent
and valid to measure what it was set for.
Table (A1-8) clarifies the correlation coefficient for each paragraph of the ―Regret
Aversion" and the total of the field. The p-values (Sig.) are less than 0.05, so the correlation
coefficients of this field are significant at α = 0.05, thus all paragraphs of this field are consistent
and valid to measure what it was set for.
Table (A1-9) clarifies the correlation coefficient for each paragraph of the ―Self Control‖
and the total of the field. The p-values (Sig.) are less than 0.05, so the correlation coefficients of
this field are significant at α = 0.05, thus all paragraphs of this field are consistent and valid to
measure what it was set for.

67
Structure Validity of the Questionnaire:
Structure validity is the second statistical test that used to test the validity of the
questionnaire structure by testing the validity of each field and the validity of the whole
questionnaire. It measures the correlation coefficient between one Field and all the fields of the
questionnaire that have the same level of Likert scale.
Table (4.2) clarifies the correlation coefficient for each Field and the whole questionnaire.
The p-values (Sig.) are less than 0.05, so the correlation coefficients of all the fields are
significant at α = 0.05, so it can be said that the fields are valid to be measured what it was set for
to achieve the main aim of the study.
Table 2 : Correlation coefficient of each field and the whole of questionnaire
No. Field Pearson Correlation
Coefficient
P-Value
(Sig.)
1. Overconfidence .646 0.000*
2. Loss aversion .599 0.000*
3. Representativeness .553 0.000*
4. Price anchoring .756 0.000*
5. Gambler‘s fallacy .463 0.000*
6. Availability .750 0.000*
7. Mental Accounting .531 0.000*
8. Regret Aversion .725 0.000*
9. Self Control .572 0.000*

68
Reliability of the Research:
The reliability of an instrument is the degree of consistency which measures the attribute; it
is supposed to be measuring. Reliability can be equated with the stability, consistency, or
dependability of a measuring tool. The test is repeated to the same sample of people on two
occasions and then compares the scores obtained by computing a reliability coefficient.
a. Cronbach’s Coefficient Alpha
The normal range of Cronbach‘s coefficient alpha value between 0.0 and + 1.0, and the
higher values reflects a higher degree of internal consistency. The value of Cronbach's Alpha
equals 0.786. This value is considered high which indicates an excellent reliability of the entire
questionnaire.
b. Split Half Method:
The correlation coefficient between the odd and even questions equal 0.689. The
Spearman-Brown Coefficient equals 0.816. This correlation coefficient is statistically significant
at α = 0.05, so it can be said that the questionnaire is consistent and valid to measure what it was
set for. Thereby, it can be said that the researcher proved that the test was valid, reliable, and
ready for distribution for the population sample.
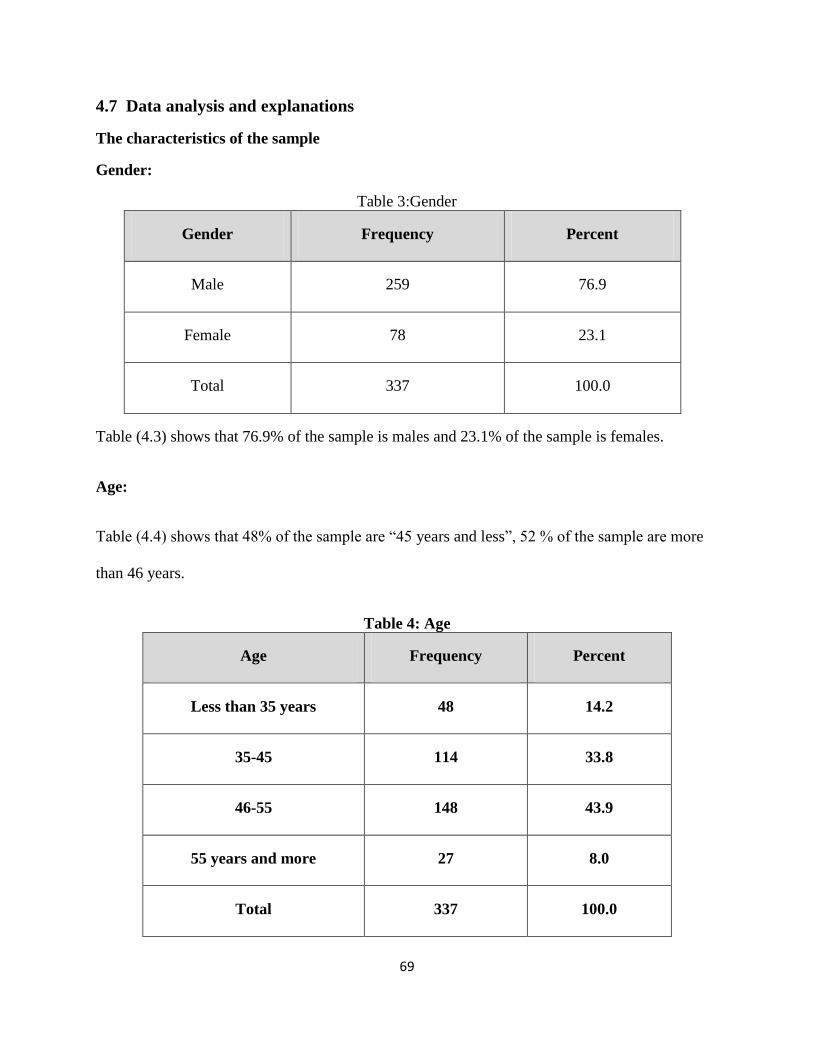
69
4.7 Data analysis and explanations
The characteristics of the sample
Gender:
Table 3:Gender
Gender Frequency Percent
Male 259 76.9
Female 78 23.1
Total 337 100.0
Table (4.3) shows that 76.9% of the sample is males and 23.1% of the sample is females.
Age:
Table (4.4) shows that 48% of the sample are ―45 years and less‖, 52 % of the sample are more
than 46 years.
Table 4 : Age
Age Frequency Percent
Less than 35 years 48 14.2
35-45 114 33.8
46-55 148 43.9
55 years and more 27 8.0
Total 337 100.0

70
Education level
Table (4.5) shows that 48.4 % of the sample is " bachelor holders and higher‖.
Table 5 : Education level
Education level Frequency Percent
High school and lower 42 12.5
Diploma 132 39.2
Bachelor 128 38.0
Higher studies 35 10.4
Total 337 100.0
Time attended to the stock market:
Table 6 :How long have you attended the stock market?
How long have you attended the stock
market Frequency Percent
under 3 years 106 31.5
3- under 5 years 117 34.7
5 years and more 114 33.8
Total 337 100.0
66% of the respondents attended the stock market for time periods less than five years and thirty
three point eight per cent attended the market for more than five years.
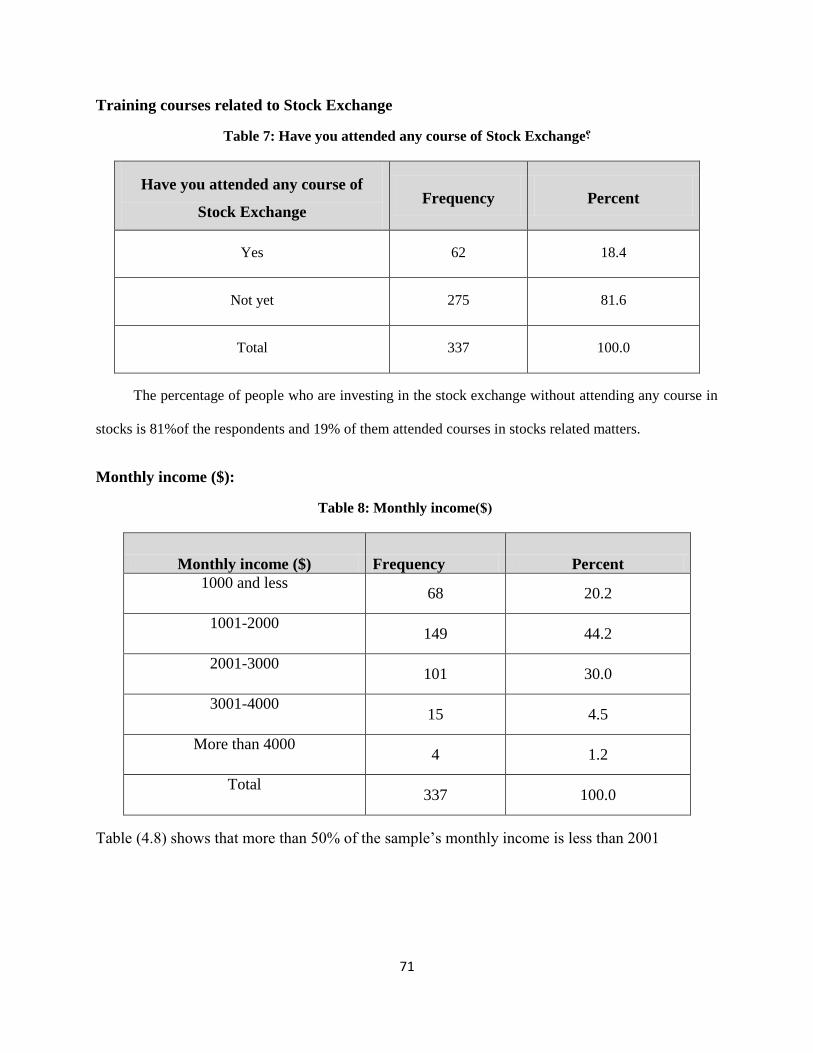
71
Training courses related to Stock Exchange
Table 7 : Have you attended any course of Stock Exchange?
Have you attended any course of
Stock Exchange Frequency Percent
Yes 62 18.4
Not yet 275 81.6
Total 337 100.0
The percentage of people who are investing in the stock exchange without attending any course in
stocks is 81%of the respondents and 19% of them attended courses in stocks related matters.
Monthly income ($):
Table 8 : Monthly income )$(
Monthly income ($) Frequency Percent
1000 and less 68 20.2
1001-2000 149 44.2
2001-3000 101 30.0
3001-4000 15 4.5
More than 4000 4 1.2
Total 337 100.0
Table (4.8) shows that more than 50% of the sample‘s monthly income is less than 2001

72
4.8 Research Hypotheses:
1. Overconfidence has an impact on individual investment decisions at Palestine Stock
Exchange.
Overconfidence impact:
Table 9 : Means and Test values for “Overconfidence”
No. Item Mean
Proportional
mean (%)
Test
value
P-value
(Sig.) Rank
1. I am an experienced investor 4.14 82.75 23.02 0.000* 1
2. I feel more confident in my own investment
opinions over opinions of my colleagues or friends 3.94 78.87 22.68 0.000* 2
3. I consult others (family, friends or colleges) before
making stock purchase 2.55 50.92 -6.92 0.000* 6
4. I use my predictive skills to time the market and to
make my port folio performance higher than the
market performance
3.85 76.90 17.59 0.000* 3
5. I trade stocks excessively 3.53 70.60 8.82 0.000* 5
6. I have stocks in more than one company in Palestine
stock exchange 2.36 47.23 10.32 0.000* 7
7. I have the ability to choose the stocks which its
performance will be better than the market
performance.
3.84 76.74 14.01 0.000* 4
All paragraphs of the Field 3.46 69.15 18.16 0.000*
* The mean is significantly different from 3.
A percentage of 69.15% of investors perceive themselves as better decision makers than
they really are, so the hypothesis cannot be rejected. This finding is supported by Kent et al.
(2001) who found that investors are overconfident in their decision making process.
73
The mean of item #1 ―I am an experienced investor‖ equals 4.14 (82.75%), Test-value =
23.02, and sig = 0.000 which is smaller than the level of significance 0.05 . It might be
concluded that the respondents might agree to this item. Hence, individual investors in Palestine
Stock Exchange are overconfident and optimistic. This overconfidence means that they do not
learn from their mistakes because they do not see overconfidence as a bias or mistake affecting
their decision making (Galant and Debbie, 1995). The mean of item #6 ―I have stocks in more
than one company in Palestine stock exchange‖ equals 2.36 and sig = 0.000 0.05 . The sign of
the test is negative. It might be concluded that the respondents might disagree to this item.
Therefore, individual investors‘ overconfidence and optimism lead them to not diversify their
investment portfolios. Consequently, they may incur losses frequently. The mean of the Field
―Overconfidence‖ equals 3.46 with sig =0.000 .The sign of the test is positive, so the mean of
this field is significantly greater than the hypothesized value 3. It might be concluded that the
respondents agreed to field of ―Overconfidence ". This means that individual investors at the
Palestine Stock Exchange have the degree of confidence at the moderate level which can be
explained by the fact that Palestine stock exchange is still emerging, so its trend fluctuates
complexly. Generally speaking, overconfidence may lead to detrimental effects on investment
such as:
1- Overconfident investors overestimate their ability to evaluate a company as a potential
investment. As a result, they can become blind to any negative information that might
normally indicate a warning sign that either a stock purchase should not take place or a
stock that was already purchased should be sold.
74
2- Overconfident investors can trade excessively as a result of believing that they possess
special knowledge that others don‘t have. Excessive trading behaviour has proven to lead
to poor returns over time.
3- Because they don‘t know, don‘t understand, or don‘t heed historical investment
performance statistics, overconfident investors can underestimate their downside risks.
As a result, they can unexpectedly suffer poor portfolio performance.
4- Overconfident investors hold undiversified portfolios, thereby taking on more risk
without a commensurate change in risk tolerance. Often, overconfident investors don‘t
even know that they are accepting more risk than they would normally tolerate
Studies have shown that investor overconfidence results in excessive trading. Odean
(1998) figured that overconfidence encouraged investors to trade more than rational investors.
Barber and Odean (1999) also believe that high levels of trading in financial markets are due to
overconfidence. They sustain that overconfidence increases trading activity because it causes
investors to be too certain about their own opinions and to not consider sufficiently the opinion
of others, these findings are similar to item 5 ( I trade stocks excessively). Similarly speaking,
studies by Allen and Evans 2005, p.108, Gervais, Simon and Odean (2001, p.1) suggest that
people usually believe in their skills and knowledge to outperform the market. According to
Seppälä, Antti (2009), people tend to overestimate their initial capability to choose the better
performing asset from two alternatives or estimate the return of an asset, after learning the
realization .Kahneman et al. (1998) indicated that overconfident investors overestimate their
private information and neglect available information and they presented a related model based
on overconfidence and biased self-attribution. Overconfidence leads investors to overweight
their private information in assessing the value of securities, causing the stock price to overreact.
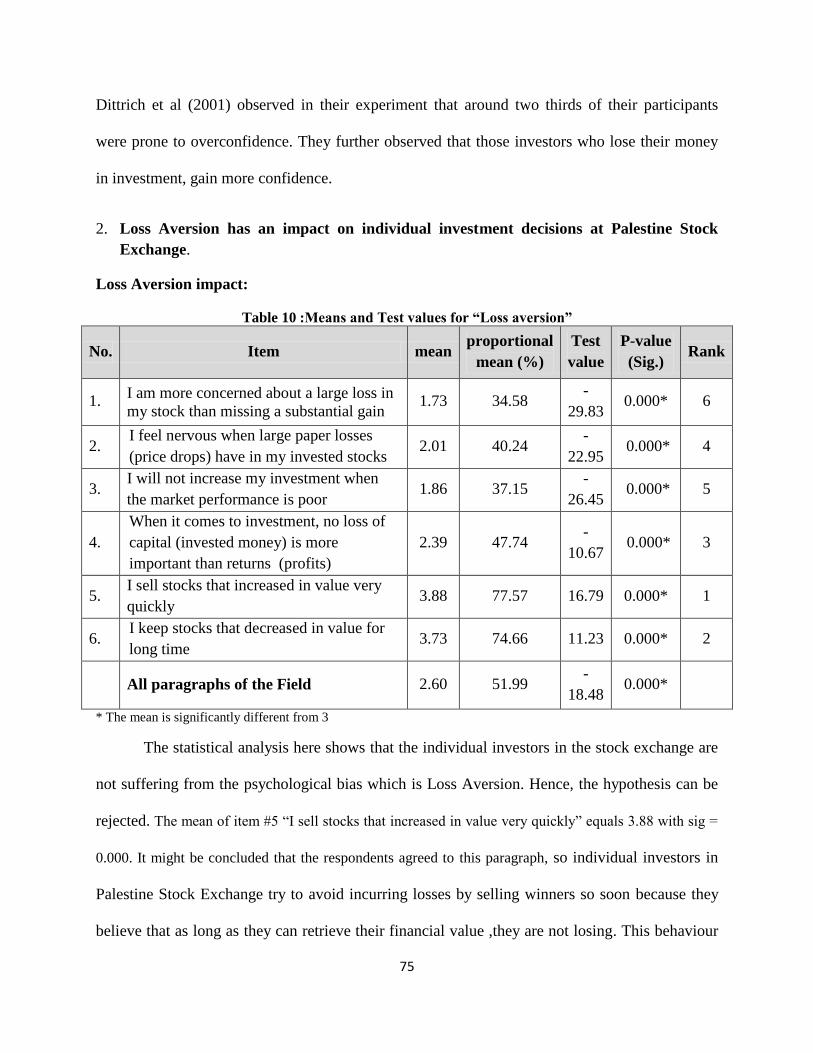
75
Dittrich et al (2001) observed in their experiment that around two thirds of their participants
were prone to overconfidence. They further observed that those investors who lose their money
in investment, gain more confidence.
2. Loss Aversion has an impact on individual investment decisions at Palestine Stock
Exchange.
Loss Aversion impact:
Table 10 :Means and Test values for “Loss aversion”
No. Item mean proportional
mean (%)
Test
value
P-value
(Sig.) Rank
1. I am more concerned about a large loss in
my stock than missing a substantial gain 1.73 34.58
-
29.83 0.000* 6
2. I feel nervous when large paper losses
(price drops) have in my invested stocks 2.01 40.24
-
22.95 0.000* 4
3. I will not increase my investment when
the market performance is poor 1.86 37.15
-
26.45 0.000* 5
4.
When it comes to investment, no loss of
capital (invested money) is more
important than returns (profits)
2.39 47.74 -
10.67 0.000* 3
5. I sell stocks that increased in value very
quickly 3.88 77.57 16.79 0.000* 1
6. I keep stocks that decreased in value for
long time 3.73 74.66 11.23 0.000* 2
All paragraphs of the Field 2.60 51.99 -
18.48 0.000*
* The mean is significantly different from 3
The statistical analysis here shows that the individual investors in the stock exchange are
not suffering from the psychological bias which is Loss Aversion. Hence, the hypothesis can be
rejected. The mean of item #5 ―I sell stocks that increased in value very quickly‖ equals 3.88 with sig =
0.000. It might be concluded that the respondents agreed to this paragraph, so individual investors in
Palestine Stock Exchange try to avoid incurring losses by selling winners so soon because they
believe that as long as they can retrieve their financial value ,they are not losing. This behaviour
76
is not unique or inclusive to loss aversion only because it is characteristic to loss aversion and
overconfidence. Consequently, the investors are not necessarily loss averse as supported by the
finding in item number 4. The mean of item #4 ―I am more concerned about a large loss in my stock
than missing a substantial gain‖ equals 1.73 with sig = 0.001. The sign of the test is negative. It might be
concluded that the respondents disagreed to this item. This indicates that the investors are reluctant
and don‘t care about incurring losses if exposed to both a loss and a gain of the same size. The
mean of the Field ―Loss aversion‖ equals 2.60. Test-value = -18.48, and sig =0.000. The sign of the test is
negative. It might be concluded that the respondents disagreed to the field ―Loss aversion ―The result
shows that the individual investors tend to be risk seekers in their investment decisions. This
finding can be psychologically explained if we take into consideration the unique psychological
formation of the citizens in The Gaza Strip who are accommodating and adapting to different
kinds of loss. Similar findings are found in where the results strongly reject the loss-aversion
story, as investors react to prior positive (negative) changes in wealth by increasing (reducing)
risk-taking. This holds for different classes of investors and for changes in overall wealth, as well
as for financial and real estate capital gains. Contrary to the finding in this study, many studies
showed that individual investors are loss averse. According to Luong and Thu Ha 2011 loss
aversion has a moderate impact on the individual investors in HOSE. Reviewing the trading
records of 160,000 customers (10,000 accounts) at a large discount brokerage firm throughout
1987 and 1993, Odean (1998) noted that individual investors projected a significant affinity
towards selling winners and holding in to losing stocks. Benartzi and Thaler 1995 demonstrated
experimentally that when subjects are asked to allocate their defined contribution pension plans
between stocks and fixed incomes, their responses differed sharply depending on how historical
returns were presented to them. If they were shown 30 one-year returns, their median allocation
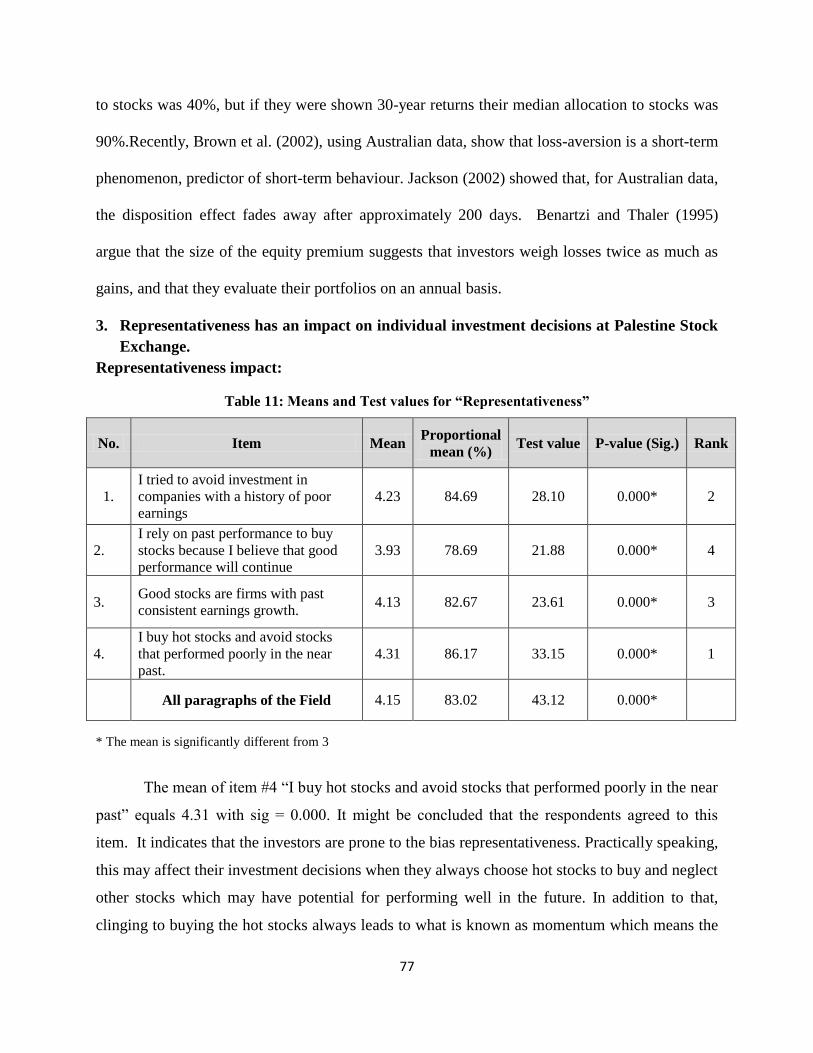
77
to stocks was 40%, but if they were shown 30-year returns their median allocation to stocks was
90%.Recently, Brown et al. (2002), using Australian data, show that loss-aversion is a short-term
phenomenon, predictor of short-term behaviour. Jackson (2002) showed that, for Australian data,
the disposition effect fades away after approximately 200 days. Benartzi and Thaler (1995)
argue that the size of the equity premium suggests that investors weigh losses twice as much as
gains, and that they evaluate their portfolios on an annual basis.
3. Representativeness has an impact on individual investment decisions at Palestine Stock
Exchange.
Representativeness impact:
Table 11 : Means and Test values for “Representativeness”
No. Item Mean Proportional
mean (%) Test value P-value (Sig.) Rank
1.
I tried to avoid investment in
companies with a history of poor
earnings
4.23 84.69 28.10 0.000* 2
2.
I rely on past performance to buy
stocks because I believe that good
performance will continue
3.93 78.69 21.88 0.000* 4
3. Good stocks are firms with past
consistent earnings growth. 4.13 82.67 23.61 0.000* 3
4.
I buy hot stocks and avoid stocks
that performed poorly in the near
past.
4.31 86.17 33.15 0.000* 1
All paragraphs of the Field 4.15 83.02 43.12 0.000*
* The mean is significantly different from 3
The mean of item #4 ―I buy hot stocks and avoid stocks that performed poorly in the near
past‖ equals 4.31 with sig = 0.000. It might be concluded that the respondents agreed to this
item. It indicates that the investors are prone to the bias representativeness. Practically speaking,
this may affect their investment decisions when they always choose hot stocks to buy and neglect
other stocks which may have potential for performing well in the future. In addition to that,
clinging to buying the hot stocks always leads to what is known as momentum which means the
78
rising stocks will keep rising and the falling ones will keep going down in a specific period of
time.
The mean of item #2 ―I rely on past performance to buy stocks because I believe that
good performance will continue‖ equals 3.93 with sig = 0.000. It might be concluded that the
respondents agreed to this item. The result here shows that the investors take into consideration
stocks past performance as a predictor of their future investment. So, it is similar to anchoring in
that they consider past performance as a reference point for their future investment decisions and
this may prevent the investors from grabbing investment chances that exist in the market. The
mean of the Field ―Representativeness‖ equals 4.15 with sig =0.000. It might be concluded that
the respondents agreed to field of ―Representativeness ".Similarly speaking, a research in
finance conducted by Fama (1970) in the US and UK exposed that prior stock performance was
generally not a good indication or prediction of future stock returns. However, investors
continued to rely on such information in their decision making process. De bondt and Thaler
(1985) found that those stocks which had performed very well in the preceding 5-year period
tended to underperform those that had done very poorly by over 30%in the subsequent 5-year
period. Similar to these findings, Barber and Odean (2008) also confirm that individual investors
prefer to buy attention grabbing stock that is in news or that has experienced higher unexpected
trading volume or stocks which have provided some excessive one day returns and that
behaviour also signals towards the good expectation relative to the past performance or publicity
of that particular stock. Shefrin and Statman (1995) show that survey respondents believe that
the shares of companies that do well in the annual Fortune magazine survey of corporate
reputation will prove to be good investments. Their findings indicate that these companies tend
to be large companies (past winners) with low book-to-market ratios, which are characteristics
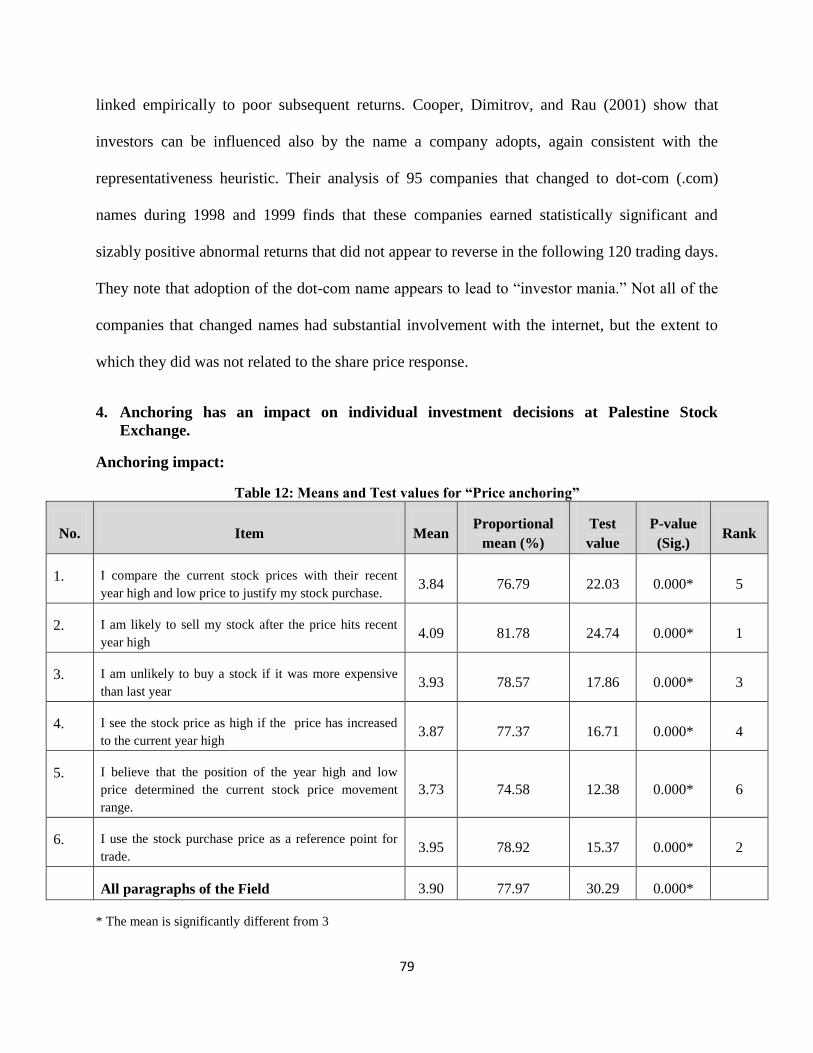
79
linked empirically to poor subsequent returns. Cooper, Dimitrov, and Rau (2001) show that
investors can be influenced also by the name a company adopts, again consistent with the
representativeness heuristic. Their analysis of 95 companies that changed to dot-com (.com)
names during 1998 and 1999 finds that these companies earned statistically significant and
sizably positive abnormal returns that did not appear to reverse in the following 120 trading days.
They note that adoption of the dot-com name appears to lead to ―investor mania.‖ Not all of the
companies that changed names had substantial involvement with the internet, but the extent to
which they did was not related to the share price response.
4. Anchoring has an impact on individual investment decisions at Palestine Stock
Exchange.
Anchoring impact:
Table 12 : Means and Test values for “Price anchoring”
No. Item Mean Proportional
mean (%)
Test
value
P-value
(Sig.) Rank
1. I compare the current stock prices with their recent
year high and low price to justify my stock purchase. 3.84 76.79 22.03 0.000* 5
2. I am likely to sell my stock after the price hits recent
year high 4.09 81.78 24.74 0.000* 1
3. I am unlikely to buy a stock if it was more expensive
than last year 3.93 78.57 17.86 0.000* 3
4. I see the stock price as high if the price has increased
to the current year high 3.87 77.37 16.71 0.000* 4
5. I believe that the position of the year high and low
price determined the current stock price movement
range.
3.73 74.58 12.38 0.000* 6
6. I use the stock purchase price as a reference point for
trade. 3.95 78.92 15.37 0.000* 2
All paragraphs of the Field 3.90 77.97 30.29 0.000*
* The mean is significantly different from 3

80
The mean of item #2 ―I am likely to sell my stock after the price hits recent year high‖
equals 4.09 with sig = 0.000. It might be concluded that the respondents agreed to this paragraph.
This result shows that the investors rely on a reference point that is stock price in order to take a
decision of selling or buying. To stop on a concrete ground, this may lead to hindsight when
taking investment decisions. The mean of item #6 ―I believe that the position of the year high
and low price determined the current stock price movement range‖ equals 3.73 with sig = 0.000.
It is concluded that the respondents agreed to this item. This result implies that the investors use
current year prices as an arbitrary reference point for stocks they invest in without taking into
their consideration the far future. Practically speaking, the investors may not be able to see
potential investment chances larking in the horizon because they limit themselves to a very
limited time range. Therefore, they may lose a lot of potential returns. The mean of the Field
―Price anchoring‖ equals 3.90 with sig=0.000. It might be concluded that the respondents agreed
to field of ―Price anchoring ". This is a moderate mean which indicates that Anchoring has a
moderate impact on individual investment decisions at Palestine Stock Exchange. This reflects
the status quo of the Palestine Stock Exchange that many people use techniques to analyze and
predict the changes of stock prices in the future based on the previous prices. Benartzi and Thaler
1995 argued that a reference point was the stock price that investors compared with. Huddart and
Lang, 1999 noted that highest stock prices in the previous year are often selected as a reference
point and an anchor. In a study conducted by Hoguet, 2005, he concluded that investors tend to
anchor to the most recent information when asked to define a quantum, such as earning
expectations for a stock. Fischer and Gerhardt (2007) find that the theoretical recommendation to
treat winning and losing assets equally and focus only on future developments is not followed
either. There is a tendency to sell winning stocks too early and keep losing stocks too long. This

81
so called disposition effect was introduced by Shefrin and Statman as a combination to two
cognitive errors: loss aversion and anchoring.
5. Gambler’s fallacy has an impact on individual investment decisions at Palestine Stock
Exchange.
Gambler’s Fallacy impact:
Table 13 :Means and Test values for “Gambler’s fallacy”
Item Mean Proportional
mean (%)
Test
value
P-value
(Sig.)
I can normally expect the end of the market returns whether
they are good or bad. 3.95 78.98 19.33 0.000*
* The mean is significantly different from 3
The mean of paragraph ―I can normally expect the end of the market returns whether they
are good or bad‖ equals 3.95 with sig = 0.000. It might be concluded that the respondents agreed
to this paragraph. This is a moderate mean which indicates that Anchoring has a moderate impact
on individual investment decisions at Palestine Stock Exchange. This means that individual
investors in The Palestine Stock Exchange moderately have the bias of being able to anticipate
the ends of good or poor market. This finding means that the investors may take risky or faulty
investment decisions depending on the bias that they are able to predict the end of the market
whether bad or good. The study of Benartzi and Thaler (2000) about investors‘ immature
diversification strategies, found evidence that Asset Allocation Puzzle can be explained by a new
behavioural portfolio model. To verify the findings questionnaires were distributed among
several investment consultants who gave information about their market expectations. These
expectations were heavily influenced by the behavioural aspects such as gambler‘s fallacy and
over confidence. It has been argued that the disposition effect in finance (the tendency of
investors to sell stocks that have appreciated and hold stocks that have lost value) is caused by

82
gambler‘s fallacy beliefs. In particular, the reasoning goes, if a stock has risen repeatedly in the
past, it‘s due for a downturn and thus it‘s time to sell. Similarly, stocks that have lost value are
due to appreciate, so one should hold those stocks, Shefrin and Statman, 1985; Odean, 1998.
6. Availability has an impact on individual investment decisions at Palestine Stock
Exchange.
Availability impact:
Table 14 : Means and Test values for “Availability”
No. Item Mean Proportional
mean (%)
Test
value
P-value
(Sig.) Rank
1. If I heard from a friend about a stock that achieved
high returns, I would buy it. 3.87 77.43 19.96 0.000* 5
2. If I want to invest in the stocks of a certain
company, I will rely on my coworkers opinions 3.91 78.21 19.12 0.000* 4
3. If I want to invest in the stocks of a certain
company, I will rely on information from the
internet
3.92 78.45 17.14 0.000* 3
4. If I want to invest in the stocks of a certain
company, I will rely on information from the same
company
3.82 76.43 13.40 0.000* 6
5. If I want to invest in the stocks of a certain
company, I will rely on information from financial
experts
4.17 83.45 26.52 0.000* 1
6. If a friend advised me to purchase a stock of certain
company then news arrived me about the
probability of that stock‘s price rising, I will invest
in these stocks.
3.96 79.16 23.47 0.000* 2
All paragraphs of the Field 3.94 78.85 32.90 0.000*
* The mean is significantly different from 3
83
The mean of item #5 ―If I want to invest in the stocks of a certain company, I will rely on
information from financial experts‖ equals 4.17 with sig = 0.000 it might be concluded that the
respondents agreed to this paragraph. So, the result indicates that the investors rely heavily on
available information spelled by financial experts in the market. The practical consequences of
this reliance on the available source of information are the investors themselves will not bother
themselves of taking their own investment decisions and consequently, they will lose the chance
of being experienced themselves.
In addition to that, the investors may lose many chances for investment just because they
need time to consult financial experts on the decision to be made.
The mean of item #4 ―If I want to invest in the stocks of a certain company, I will rely on
information from the same company‖ equals 3.82 with sig = 0.000. It might be concluded that
the respondents agreed to this item. This result shows that the investors are ready to rely on the
same company information when taking their investment decisions. The reflection of this
tendency may be very serious in the practical practice because the validity and reliability of such
information cannot be trusted as a source of information about the financial well being of the
company or its stocks.
Similar studies like (Kliger & Kudryavtsev, 2010) confirm the prevalence of availability
heuristic in the decision making process of the investors. Sevil, Sen and Yalama (2007) also
found that heuristics play a vital role in affecting the decisions made by inventors in the stock
exchange. The "recency" aspect of availability heuristic is closely connected to another well-
known psychological effect – the effect of priming. Priming is an unconscious remembering
process, which occurs when a certain stimulus or event contemporaneously increases the
84
availability of (primes) a specific informative category. It may affect information processing and,
as a result, also decision making Baron and Byrne 1997. Shiller 1998 argues that investors'
attention to investment categories (e.g., stocks versus bonds or real estate; investing abroad
versus investing at home) may be affected by alternating waves of public attention or inattention.
Similarly, Barber and Odean, 2008 found that when choosing which stock to buy, investors tend
to consider only those stocks that have recently caught their attention (stocks in the news, stocks
experiencing high abnormal trading volume, stocks with extreme one day returns). (Frieder,
2004) finds that stock traders seek to buy after large positive earnings surprises and sell after
large negative earnings surprises, and explains this tendency by the availability heuristic,
assuming that the salience of an earnings surprise increases in its magnitude. Chiodo et al. (2003)
construct a simple model of belief formation based on the assumption that it is easier for people
to recall information which has recently arrived, and respectively, investors overreact to new
information. Lee et al. (2005) discuss the "recency bias", which is the tendency of people to
make judgments about the likelihood of events based on their recent experience. They find that
analysts‘ forecasts of firms‘ long-term growth in earnings per share tend to be relatively
optimistic when the economy is expanding and relatively pessimistic when the economy is
contracting. This finding is consistent with the availability heuristic, indicating that forecasters
overweight current state of the economy in making long-term growth predictions.
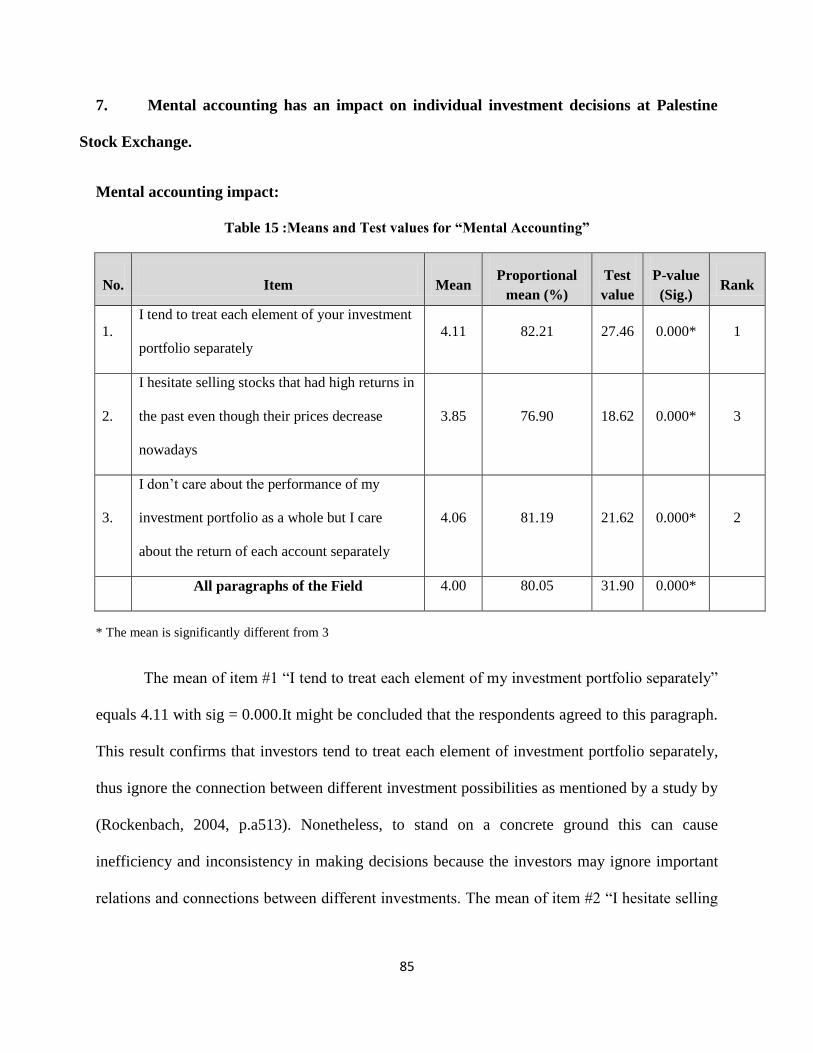
85
7. Mental accounting has an impact on individual investment decisions at Palestine
Stock Exchange.
Mental accounting impact:
Table 15 :Means and Test values for “Mental Accounting”
No. Item Mean Proportional
mean (%)
Test
value
P-value
(Sig.) Rank
1.
I tend to treat each element of your investment
portfolio separately
4.11 82.21 27.46 0.000* 1
2.
I hesitate selling stocks that had high returns in
the past even though their prices decrease
nowadays
3.85 76.90 18.62 0.000* 3
3.
I don‘t care about the performance of my
investment portfolio as a whole but I care
about the return of each account separately
4.06 81.19 21.62 0.000* 2
All paragraphs of the Field 4.00 80.05 31.90 0.000*
* The mean is significantly different from 3
The mean of item #1 ―I tend to treat each element of my investment portfolio separately‖
equals 4.11 with sig = 0.000.It might be concluded that the respondents agreed to this paragraph.
This result confirms that investors tend to treat each element of investment portfolio separately,
thus ignore the connection between different investment possibilities as mentioned by a study by
(Rockenbach, 2004, p.a513). Nonetheless, to stand on a concrete ground this can cause
inefficiency and inconsistency in making decisions because the investors may ignore important
relations and connections between different investments. The mean of item #2 ―I hesitate selling
86
stocks that had high returns in the past even though their prices decrease nowadays‖ equals 3.85
with sig = 0.000. It might be concluded that the respondents agreed to this item. This result
indicates that the investors cling to losing stocks because they once were wining ones because
they classify them in a separate mental account where they are labelled as wining stocks. The
consequences of this orientation may be serious on investment decisions as the investors are
reluctant to sell stocks that relate to this mental account. Put differently, Mental accounting bias
can cause investors to hesitate to sell investments that once generated significant gains but, over
time, have fallen in price. According to Kent et al. 2001, investors were very much influenced by
historical performance of the stock price. These findings were consistent with Daniel,
Hirshleifer, Teoh, 2002 where they suggest that investors may form theories of how the market
works based upon irrelevant historical values, somewhat analogous to making decisions based
upon mental accounting with respect to arbitrary reference points. Barberis and Huang 2000
have suggested that investors apply mental accounting to stock holdings and react separately to
gains and losses for different stocks.

87
8. Regret aversion has an impact on investment decisions at Palestine Stock Exchange.
Regret aversion impact:
Table 16 :Means and Test values for “Regret Aversion”
No. Item Mean Proportional
mean (%)
Test
value
P-value
(Sig.) Rank
1. I keep the stocks that decreased in value
and I don‘t sell them 4.13 82.51 24.68 0.000* 1
2. I sell the stocks that increased in value
faster 4.02 80.42 24.43 0.000* 3
3. I invest in companies with low risks 4.09 81.80 25.94 0.000* 2
4. I don‘t buy the stocks that decreased in
value 3.66 73.21 11.44 0.000* 5
5. I buy the stocks that a group of investors 3.76 75.16 12.50 0.000* 4
All paragraphs of the Field 3.93 78.61 30.99 0.000*
* The mean is significantly different from 3
The mean of item #1 ―I keep the stocks that decreased in value and I don‘t sell them‖
equals 4.13 with sig = 0.000. It might be concluded that the respondents agreed to this item. The
result exemplifies typical regret aversion behaviour when the investors hold losing stocks instead
of selling them because they do not want to feel regretful about buying such stocks at the first
place. So, from a practical point of view, this behaviour may lead to serious problems related to
investment decisions. The investors become irrational in their investment decisions and may lose
many chances for selling the losing stocks and purchasing others especially when they keep
losing and their prices keep decreasing. In other words, the investors seem to be willing to sell
shares increasing in value than decreasing ones. Many people think that they do not lose until

88
they sell losing stocks, thus, they refuse to sell them although selling may be the best solution at
this time. The mean of item #4 ―I don‘t buy the stocks that decreased in value‖ equals 3.66 with
sig = 0.000. It might be concluded that the respondents agreed to this item. By not buying the
stocks that decreased in value; investors try to avoid regretting the decision in future if their
prices will not increase; but the consequences of such behaviour may include ignoring modest
investment chances which may hold great potential in the future. The mean of the Field ―Regret
Aversion‖ equals 3.93 with sig=0.000. it is concluded that the respondents agreed to field of
―Regret Aversion ".This result is high and indicates that the variable regret aversion has a strong
impact on the decisions of the individual investors in The Palestine Stock Exchange. Regret may
drive investors to avoid selling stocks that have gone down because of the chance that the stocks
later regain their value. And they may sell stocks that have gone up so they can avoid regretting
the failure to do so before the stocks, Shiller 1998. Kahneman and Tversky (1982) using an
investment scenario. They found that an investor who was described has having lost $1,200 by
switching from an investment in stock A to an investment in stock B (abnormal behaviour) was
judged by most respondents to feel more regret than a second investor who lost the same amount
of money by holding onto his investment in stock B after considering stock A (normal
behaviour).Fischer and Gerhardt (2007) find that the theoretical recommendation to treat
winning and losing assets equally and focus only on future developments is not followed either.
There is a tendency to sell winning stocks too early and keep losing stocks too long. This so
called disposition effect was introduced be Shefrin and Statman as a combination to two
cognitive errors: loss aversion and anchoring.

89
9. Self-control has an impact on individual investment decisions at Palestine Stock
Exchange.
Self-control impact:
Table 17 : Means and Test values for “Self Control”
No. Item Mean Proportional
mean (%)
Test
value
P-value
(Sig.) Rank
1. I can achieve profits out of my stocks by
consulting expert always. 4.07 81.37 22.63 0.000* 1
2. If I believe that some details about
certain stock are not available to me, I
don‘t buy that stock.
3.88 77.66 20.21 0.000* 3
3. Whatever my investment goals are in
stock exchange, I can achieve them 3.82 76.42 15.82 0.000* 4
4. I care about spending on my daily
obligations more than caring about
saving for the future
2.24 44.79 -13.50 0.000* 5
5. I divide my money to capital for
investment and money for daily
spending
4.02 80.36 17.70 0.000* 2
All paragraphs of the Field 3.61 72.12 23.55 0.000*
* The mean is significantly different from 3
The mean of item #1 ―I can achieve profits out of my stocks by consulting expert always‖
equals 4.07 with sig = 0.000. it might be concluded that the respondents agreed to this paragraph.
The result shows that the investors are highly prone to the bias of having control over their
investments especially if they consult financial experts before taking steps toward the investment
available to them. To stand on a solid ground, Self control may be the result of the investors

90
feeling they are optimistic and overconfident of their investment decisions. The mean of item #4
―I care about spending on my daily obligations more than caring about saving for the future‖
equals 2.24 with sig = 0.001. The sign of the test is negative. It might be concluded that the
respondents disagreed to this item. This result indicates that the investors are trying to put certain
limitations and regulations on their spending in order to feel that they have self control on their
own investment for the future. Illusion of control bias can cause investors to use limit orders and
other such techniques in order to experience a false sense of control over their investments. In
fact, the use of these mechanisms most often leads to an overlooked opportunity or, worse, a
detrimental, unnecessary purchase based on the occurrence of an arbitrary price. The mean of the
Field ―Self Control‖ equals 3.61 with sig =0.000. It might be concluded that the respondents
agreed to field of ―Self Control ".Therefore, the effect of Self Control on individual investment
decision making is moderate. Similarly stated in a study by Thaler and Shefrin 1981, investors
are subject to temptation, and they look for tools to improve self control. According to the views
of Thaler & Shefrin (1981) investors should always show some sort of tolerance and should be
looking for improving their self-control. Psychologically it is also known as self-regulation.
Thaler and Shefrin (1981) analyze how people exhibit self-control with respect to saving
behaviour. Shefrin and Statman 1984 develop a theory of dividends based on this idea, where
mainly elderly investors have a preference for dividends. Shefrin and Statman (1985) refer to
self-control when they explain how investors deal with the impulse to hold onto losing
investments for too long.

91
10. Differences between respondents in age, culture and education do not have an impact
on investment decisions at Palestine Stock Exchange.
10.1 Differences between respondents in gender do not have an impact on investment
decisions at Palestine Stock Exchange.
There is insignificant relationship between the dependent variables of the study, except
Gambler‘s fallacy, and the respondents‘ gender.
Table 18 : Independent Samples T-Test of the fields and their p-values for Gender
No. Field Test
Value Sig.
Means
Male Female
1. Overconfidence 0.462 -0.736 3.45 3.49
2. Loss aversion 0.292 1.056 2.61 2.56
3. Representativeness 0.513 -0.654 4.14 4.18
4. Price anchoring 0.352 -0.932 3.88 3.95
5. Gambler‘s fallacy 0.997 0.004 3.95 3.95
6. Availability 0.440 -0.773 3.93 3.98
7. Mental Accounting 0.828 -0.218 4.00 4.01
8. Regret Aversion 0.178 -1.351 3.91 4.00
9. Self Control 0.054 -2.026 3.68 3.70
All paragraphs of the questionnaire 0.209 -1.260 3.64 3.69
This finding supports the hypothesis that ―Differences between respondents in age,
culture and education do not have an impact on investment decisions at Palestine Stock
Exchange‖
92
In contrast of this finding, studies assert that the variable Gender has a significant effect
on the investors‘ investment decisions. For example, Odean and Barber 2000 have produced very
interesting findings. The study of differences in trading habits according to an investor‘s gender
covered 35,000 households over six years. The study found that men were more overconfident
than women regarding their investing skills and that men trade more frequently. As a result,
males not only sell their investments at the wrong time but also experience higher trading costs
than their female counterparts. Females trade less (buy and hold their securities), at the same
time sustaining lower transaction costs. The study found that men trade 45 percent more than
women.
This finding is supported by, Barber and Odean 2001 which concluded that men trade as
much as 45% more than women thereby reducing their yields and overconfidence was the only
explanation that could be provided for this behaviour of men. In addition, Felton et. al. 2003
have studied the effect of gender and optimism on the riskiness of investment choices .They have
concluded that males make more risky investment choices than females, and that this difference
was primarily due to the riskier choices of optimistic males. Kuo et al. (2005) thoroughly
surveyed Taiwanese individual stock investors with respect to gender role in investment,
indicating that females are psychologically less confident and pessimistic than males.
10.2 Differences between respondents in age do not have an impact on investment
decisions at Palestine Stock Exchange.
There is a positive significant relationship between the field of ―Representativeness, Gambler‘s
fallacy and Mental Accounting‖ and the respondents‘‘ age.
We conclude that the respondents‘ Age has significant effect on these fields.

93
Table (18) shows that there are insignificant differences among the respondents in the fields of
―Overconfidence, Loss aversion, Price anchoring, Availability, Regret Aversion and Self
Control‖ due to Age.
In addition, Gambler‘s fallacy and Mental Accounting, Less than 45 years respondents have the
higher than 45 years and more respondents
Table 19 : Independent Samples T-Test of the fields and their p-values for Age
No. Field Test
Value Sig.
Means
Less than 45 45 and more
1. Overconfidence -1.574 0.117 3.42 3.50
2. Loss aversion 0.017 0.986 2.60 2.60
3. Representativeness -3.200 0.002* 4.06 4.23
4. Price anchoring -0.379 0.705 3.89 3.91
5. Gambler‘s fallacy -2.560 0.011* 3.82 4.07
6. Availability -0.053 0.958 3.94 3.94
7. Mental Accounting -2.594 0.010* 3.92 4.08
8. Regret Aversion -0.016 0.988 3.93 3.93
9. Self Control -1.242 0.215 3.57 3.64
All paragraphs of the questionnaire -1.796 0.073 3.62 3.68
* Means differences are significant at = 0.05
The statistics indicate that younger investors are liable to the behavioural factors such as
Representativeness, Gambler‘s fallacy and Mental Accounting. Consequently, the hypothesis
that Differences between respondents in age do not have an impact on investment decisions at
Palestine Stock Exchange can be rejected. So, from a practical point of view, younger investors
can commit different kinds of mistakes due to their susceptibility to behavioural biases. These

94
findings can be due to the fact that younger investors are less experienced and more prone to
behavioural biases. Similar findings are found in Barclays Wealth Insights (2011), as age
increases (and holding all other things equal):
• Composure increases (they are less stressed).
• People become less concerned with preventing bad things from happening.
• Risk tolerance decreases — a pattern that has been indicated by other research studies.
This means that older people become less prone to psychological biases than younger ones.
Contradictory findings are found in a study of Gunay, Suleyman and Demirel, Engin (2011),
although age differences on amount of investment were not significant, interactions between
participant age and vignette information are found. Results of the study indicate that older and
younger adults make similar decisions using different pieces of information.
10.3Differences between respondents in Education level do not have an impact on
investment decisions at Palestine Stock Exchange.
Table (4.20) shows that there are positive significant differences between the fields of
―Overconfidence, Gambler‘s fallacy and Mental Accounting‖, and the Education level. We
conclude that the respondents‘ Education level has significant effect on these fields. In addition,
Table (4.20) shows that there is insignificant difference among the respondents regarding to the
fields of (Loss aversion, Representativeness, Price anchoring, Availability and Self Control) due
to Education level. Table (4.20) also shows that, for the fields" Overconfidence, Gambler‘s
fallacy and Mental Accounting‖, Bachelor have the higher mean than other Education levels.

95
Table 20 : One- Way Analysis of Variance (ANOVA) T-Test of the fields and their
No. Field Test
Value Sig.
Means
High
school
and
lower
Diploma Bachelor Higher
studies
1. Overconfidence 3.566 0.014* 3.36 3.45 3.54 3.29
2. Loss aversion 0.855 0.465 2.64 2.57 2.60 2.68
3. Representativeness 0.077 0.972 4.18 4.14 4.15 4.15
4. Price anchoring 0.933 0.425 3.94 3.87 3.94 3.80
5. Gambler‘s fallacy 6.168 0.000* 3.86 4.04 4.32 3.51
6. Availability 1.890 0.131 4.10 3.90 3.96 3.86
7. Mental Accounting 2.768 0.042* 4.08 3.94 4.06 3.83
8. Regret Aversion 2.445 0.064 4.04 3.85 4.00 3.86
9. Self Control 1.570 0.196 3.55 3.63 3.63 3.46
All paragraphs of the questionnaire 2.435 0.065 3.70 3.63 3.69 3.56
* Means differences are significant at = 0.05
The results show that bachelor holders among individual investors studied in this sample
are susceptible to overconfidence, gambler‘s fallacy and mental accounting than other investors.
It is worth mentioning that the three biases are related because one leads to the other.
Because Overconfidence is the tendency for people to overestimate their knowledge, abilities
and the precision of their information, for that reason investment decisions become based on
conjecture rather than fundamental value. This overconfidence leads individual investors to trust
their own abilities to predict the ending of the market, whether it is bad or good. Consequently,
individual investors will not care about diversifying their portfolios because they think different
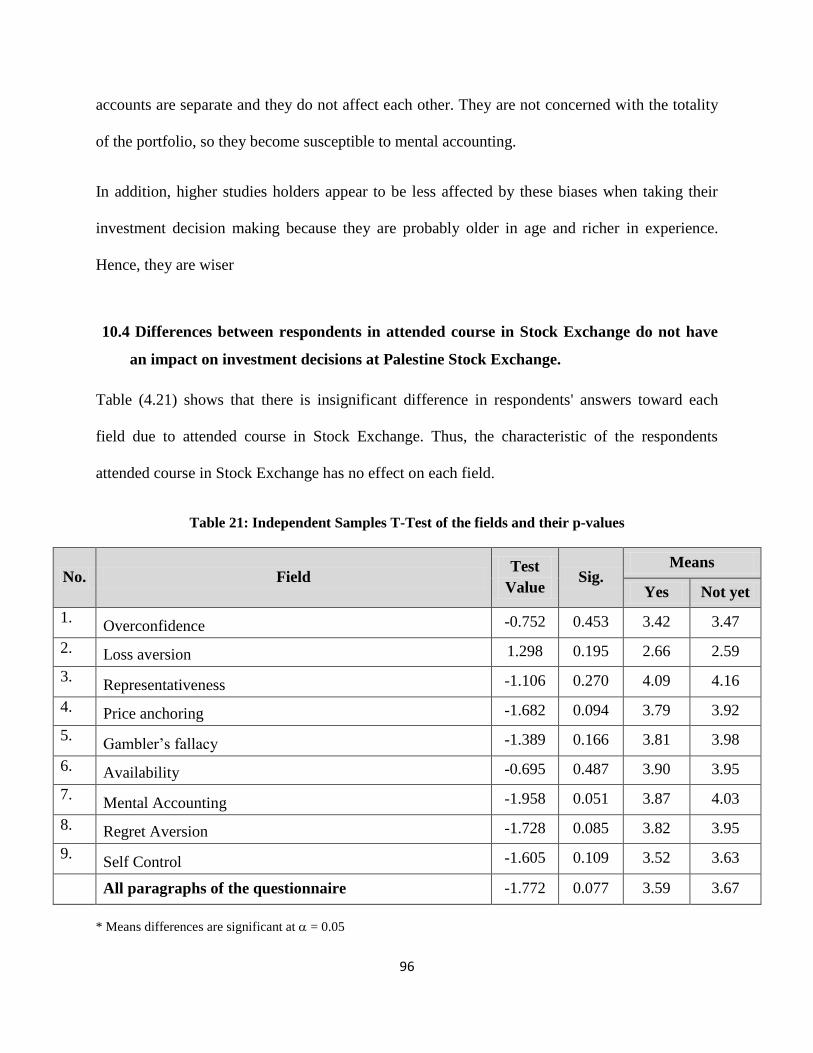
96
accounts are separate and they do not affect each other. They are not concerned with the totality
of the portfolio, so they become susceptible to mental accounting.
In addition, higher studies holders appear to be less affected by these biases when taking their
investment decision making because they are probably older in age and richer in experience.
Hence, they are wiser
10.4 Differences between respondents in attended course in Stock Exchange do not have
an impact on investment decisions at Palestine Stock Exchange.
Table (4.21) shows that there is insignificant difference in respondents' answers toward each
field due to attended course in Stock Exchange. Thus, the characteristic of the respondents
attended course in Stock Exchange has no effect on each field.
Table 21 : Independent Samples T-Test of the fields and their p-values
No. Field Test
Value Sig.
Means
Yes Not yet
1. Overconfidence -0.752 0.453 3.42 3.47
2. Loss aversion 1.298 0.195 2.66 2.59
3. Representativeness -1.106 0.270 4.09 4.16
4. Price anchoring -1.682 0.094 3.79 3.92
5. Gambler‘s fallacy -1.389 0.166 3.81 3.98
6. Availability -0.695 0.487 3.90 3.95
7. Mental Accounting -1.958 0.051 3.87 4.03
8. Regret Aversion -1.728 0.085 3.82 3.95
9. Self Control -1.605 0.109 3.52 3.63
All paragraphs of the questionnaire -1.772 0.077 3.59 3.67
* Means differences are significant at = 0.05
97
The result derived from this table shows that the hypothesis : Differences between
respondents in attended course in Stock Exchange do not have an impact on investment decisions
at Palestine Stock Exchange cannot be rejected . The explanation for this finding could be the
fact that The Palestine Stock Exchange is an emerging organization which was founded in 1995.
Consequently, the time range is not long enough for the investors to gain experience by practice
or by attending training courses in financial markets to affect the behaviour of individual
investors clearly. Hence, investors do not have the proper background in behavioural finance. So,
investors are equal in their ignorance of the psychology of investment.
This will have serious ramifications on the investors practice on a daily basis where they
may commit many mistakes and be prone to many biases while taking their investment
decisions.
10.5- Differences between respondents in monthly income in Stock Exchange do not
have an impact on investment decisions at Palestine Stock Exchange.
Table (4.22) shows that there is insignificant difference between the fields of ―Mental
Accounting and Self Control‖, and monthly income. It is concluded that the respondents‘
monthly income has no effect on these fields. In addition, Table (30) shows that there is
significant difference among the respondents regarding to these fields of (Overconfidence, Loss
aversion, Representativeness, Price anchoring, Gambler‘s fallacy, Availability and Regret
Aversion) due to monthly income. We conclude that the respondents‘ monthly income has
significant effect on these fields.
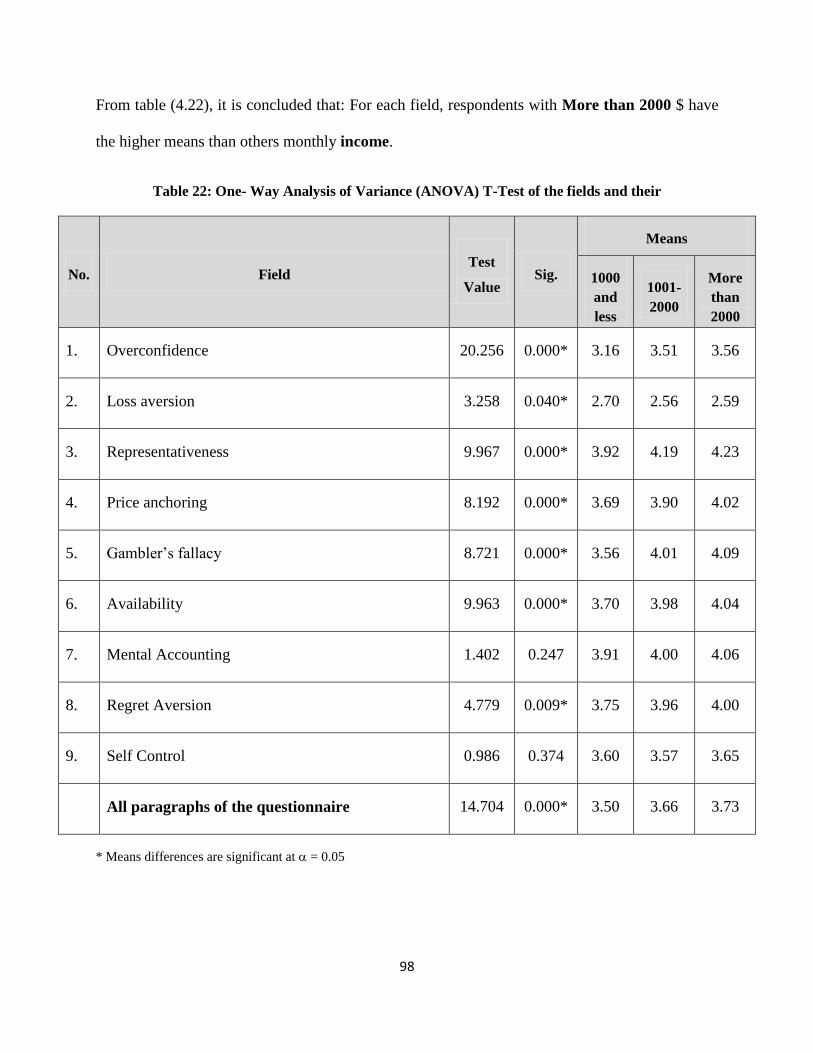
98
From table (4.22), it is concluded that: For each field, respondents with More than 2000 $ have
the higher means than others monthly income.
Table 22 : One- Way Analysis of Variance (ANOVA) T-Test of the fields and their
No. Field Test
Value Sig.
Means
1000
and
less
1001-
2000
More
than
2000
1. Overconfidence 20.256 0.000* 3.16 3.51 3.56
2. Loss aversion 3.258 0.040* 2.70 2.56 2.59
3. Representativeness 9.967 0.000* 3.92 4.19 4.23
4. Price anchoring 8.192 0.000* 3.69 3.90 4.02
5. Gambler‘s fallacy 8.721 0.000* 3.56 4.01 4.09
6. Availability 9.963 0.000* 3.70 3.98 4.04
7. Mental Accounting 1.402 0.247 3.91 4.00 4.06
8. Regret Aversion 4.779 0.009* 3.75 3.96 4.00
9. Self Control 0.986 0.374 3.60 3.57 3.65
All paragraphs of the questionnaire 14.704 0.000* 3.50 3.66 3.73
* Means differences are significant at = 0.05

99
The analysis shows several findings in regard the relation between behavioural biases and the
investors‘ monthly income as follows:
1- Investors‘ monthly income contribute to the existence of behavioural biases, which are
Overconfidence, Loss aversion, Representativeness, Price anchoring, Gambler‘s fallacy,
Availability, Regret Aversion, in investors‘ investment decision making process.
2- Investors‘ monthly income does not contribute to the existence of behavioural biases
which are Mental Accounting and Self Control
3- The higher the monthly income, the greater the contributions to behavioural biases like
Overconfidence, Loss aversion, Representativeness, Price anchoring, Gambler‘s fallacy,
Availability, Regret Aversion.
These findings can be explained as follows:
It is probable that People with high income tend to control their long term financial plans
and future goals, so they are not prone to self control bias which affect negatively on investors
saving plans. The concept of Self Control and Mental Accounting are related in that if the
investor does not have Self Control bias, the investor is not likely to have Mental Accounting
bias because not having these two biases means that the investor is aware of his or her financial
goals and can achieve them via considering his or her investment portfolio as a whole and not as
separate accounts. The practical implications may include rich investors tendency toward
committing mistakes related to behavioural biases such as overconfidence, mental accounting
and self control. Hence rich investors may incur more losses and trading costs than other
investors

100
Chapter Five: Findings of the research
Introduction
Findings
Conclusion and Comments
Recommendations
108
5.1 Introduction:
This chapter concludes all the findings of the research which are about the behavioural
factors influencing the individual investors‘ investment decisions in the Palestine Stock
Exchange.
The chapter also gives some recommendations to the individual investors at the PSE.
5.2 Findings:
The study is summed up by giving all the answers for the research questions raised in
Chapter -1- . This means that the research objectives are done and the hypotheses are tested.
The following part gives the conclusions for the study by presenting the main points to answer
the research hypotheses.
1- Overconfidence has an impact on individual investment decisions at PSE.
The conclusion in regard to this hypothesis is that individual investors are highly
influenced by the overconfidence bias. Consequently, the hypothesis cannot be rejected.
2- Loss Aversion has an impact on individual investment decisions at PSE.
The findings of the research concluded that individual investors in PSE are not affected
or impacted by the Loss Aversion bias and that the hypothesis cannot be rejected.
3- Representativeness has an impact on individual investment decisions at PSE.
The findings of the research concluded that individual investors in PSE are moderately
affected or impacted by the representativeness bias and that the hypothesis cannot be
rejected.
4- Anchoring has an impact on individual investment decisions at PSE.
The research found that individual investors in PSE are moderately affected by the
anchoring bias; therefore the hypothesis cannot be rejected.

109
5- Gambler‘s fallacy has an impact on individual investment decisions at PSE.
The individual investors at PSE agreed to the field of Gambler‘s fallacy with a
moderate mean. Hence, Gambler‘s fallacy bias moderately affects the individual
investment decisions. Therefore, the hypothesis cannot be rejected.
6- Availability has an impact on individual investment decisions at PSE. The findings of the
research concluded that individual investors in PSE are moderately affected or impacted
by the Availability bias and that the hypothesis cannot be rejected.
7- Mental Accounting has an impact on individual investment decisions at PSE. The
findings of the research concluded that individual investors in PSE are moderately
affected or impacted by Mental Accounting bias and that the hypothesis cannot be
rejected.
8- Regret Aversion has an impact on individual investment decisions at PSE.
The findings of the research concluded that individual investors in PSE are moderately
affected or impacted by the Regret Aversion bias and that the hypothesis cannot be
rejected.
9- Self-Control has an impact on individual investment decisions at PSE.
The findings of the research concluded that individual investors in PSE are moderately
not affected or impacted by the Self Control bias and that the hypothesis can be
rejected.
10- Differences between respondents in age, culture and education do not have an impact on
investment decisions at Palestine Stock Exchange.
110
5.3 Conclusion and Comments:
From the prior research, it is found that there is persuasive evidence that investors make
major systematic errors and there is evidence that psychological biases affect market prices
substantially.
5.4 Recommendations:
1) Individual investors in the market should take educational courses in behavioural biases
that affect investment decision making in order to be able to manage their portfolios
2) Professionals in consulting and investment management should be exposed to the field of
behavioural finance through workshops and seminars such that when decisions are been
taken, behavioural finance tendencies will reduce.
3) Information providers in the Palestine Stock Exchange should think of a proper way of
releasing information about the market to the public as this have a way of affecting the
decision taken by the investor about the market.
4) Collective views on an investment should be applied by fund managers and investors as
this has tendencies of reducing individual personal biases on an investment. Formation of
committees could be employed, though the use of committees has its own implications.
5) As Shefrin (2000, p. 3) points out, practitioners studying behavioural finance should
learn to recognize their own mistakes and those of others, understand those mistakes, and
take steps to avoid making them.
111
5.5 Further research:
1- Further research may be specifically directed at some of these issues in undertaking a
more nuanced study or to explore why behavioural theories that relate to developed
markets are applicable in emerging markets.
2- Research may also be directed towards the investigation of the behaviour of individual
investors at the PSE, since individual investors behave differently.
3- Research may be extended into proposing investment models that explain more precisely
behavioural factors and biases affecting investment decision making in financial markets.
4- Research may handle the relationship between religion and individual investment
decision making.
5- Further research may be needed in the relation between behavioural finance and the
influence of market makers on setting prices.

112
APPENDICES
Appendix (1): list of tables
Appendix (2): Arabic version of the questionnaire
Appendix (3): English version of the questionnaire
Appendix (4): References
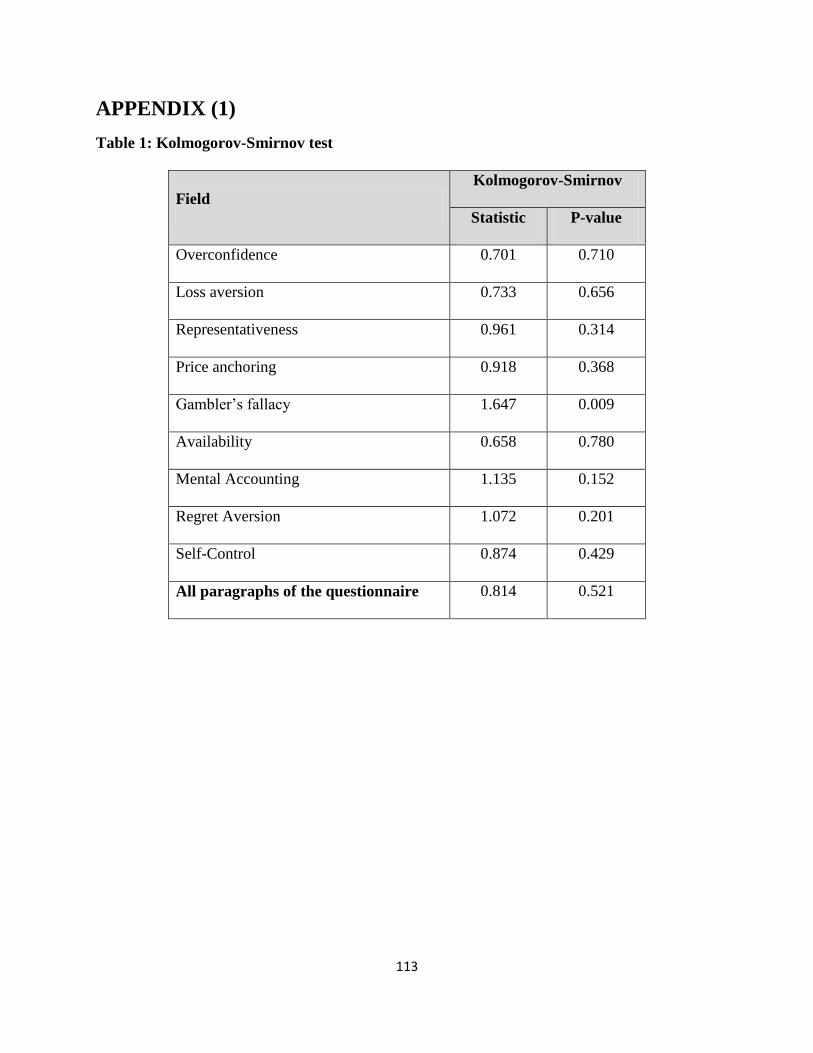
113
APPENDIX (1) Table 1: Kolmogorov-Smirnov test
Field
Kolmogorov-Smirnov
Statistic P-value
Overconfidence 0.701 0.710
Loss aversion 0.733 0.656
Representativeness 0.961 0.314
Price anchoring 0.918 0.368
Gambler‘s fallacy 1.647 0.009
Availability 0.658 0.780
Mental Accounting 1.135 0.152
Regret Aversion 1.072 0.201
Self-Control 0.874 0.429
All paragraphs of the questionnaire 0.814 0.521

114
Table 2: Correlation coefficient of each paragraph of “Overconfidence” and the total of
this field:
No. Paragraph Pearson Correlation
Coefficient
P-Value
(Sig.)
1. I am an experienced investor .586 0.000*
2. I feel more confident in my own
investment opinions over opinions of my
colleagues or friends
.599 0.000*
3. I consult others (family, friends or
colleges) before making stock purchase
.404 0.000*
4. I use my predictive skills to time the
market and to make my port folio
performance higher than the market
performance
.511 0.000*
5. I trade stocks excessively .612 0.000*
6. I have stocks in more than one company
in Palestine stock exchange
.599 0.000*
7. I have the ability to choose the stocks
which its performance will be better than
the market performance.
.504 0.000*
* Correlation is significant at the 0.05 level

115
Table 3: Correlation coefficient of each paragraph of “Loss aversion” and the total of this
field:
No. Paragraph Pearson Correlation
Coefficient
P-Value
(Sig.)
1. I am more concerned about a large loss in
my stock than missing a substantial gain
.450 0.000*
2. I feel nervous when large paper losses
(price drops) have in my invested stocks
.445 0.000*
3. I will not increase my investment when the
market performance is poor
.484 0.000*
4. When it comes to investment, no loss of
capital (invested money) is more important
than returns (profits)
.429 0.000*
5. I sell stocks that increased in value very
quickly
.307 0.000*
6. I keep stocks that decreased in value for
long time
.463 0.000*
* Correlation is significant at the 0.05 level

116
Table 4: Correlation coefficient of each paragraph of “Representativeness”
and the total of this field:
No. Paragraph Pearson Correlation
Coefficient
P-Value
(Sig.)
1. I tried to avoid investment in companies
with a history of poor earnings
.704 0.000*
2. I rely on past performance to buy stocks
because I believe that good performance
will continue
.593 0.000*
3. Good stocks are firms with past consistent
earnings growth
.661 0.000*
4. I buy hot stocks and avoid stocks that
performed poorly in the near past.
.465 0.000*
* Correlation is significant at the 0.05

117
Table 5: Correlation coefficient of each paragraph of “Price anchoring” and the total of
this field:
No. Paragraph Pearson Correlation
Coefficient
P-Value
(Sig.)
1. I compare the current stock prices with
their recent year high and low price to
justify my stock purchase.
.591 0.000*
2. I am likely to sell my stock after the price
hits recent year high
.484 0.000*
3. I am unlikely to buy a stock if it was more
expensive than last year
.580 0.000*
4. I see the stock price as high if the price has
increased to the current year high
.598 0.000*
5. I believe that the position of the year high
and low price determined the current stock
price movement range.
.664 0.000*
6. I use the stock purchase price as a
reference point for trade.
.558 0.000*

118
Table 6: Correlation coefficient of each paragraph of “Availability” and the total of this
field:
No. Paragraph Pearson Correlation
Coefficient
P-Value
(Sig.)
1. If I heard from a friend about a stock that
achieved high returns, I would buy it.
.589 0.000*
2. If I want to invest in the stocks of a certain
company, I will rely on my coworkers
opinions
.612 0.000*
3. If I want to invest in the stocks of a certain
company, I will rely on information from the
internet
.613 0.000*
4. If I want to invest in the stocks of a certain
company, I will rely on information from the
same company
.660 0.000*
5. If I want to invest in the stocks of a certain
company, I will rely on information from
financial experts
.496 0.000*
6. If a friend advised me to purchase a stock of
certain company then news arrived me about
the probability of that stock‘s price rising, I
will invest in these stocks.
.536 0.000*

119
Table 7: Correlation coefficient of each paragraph of “Mental Accounting” and the total of
this field:
No. Paragraph Pearson Correlation
Coefficient
P-Value
(Sig.)
1. I tend to treat each element of your investment
portfolio separately
.707 0.000*
2. I hesitate selling stocks that had high returns in
the past even though their prices decrease
nowadays
.669 0.000*
3. I don‘t care about the performance of my
investment portfolio as a whole but I care
about the return of each account separately
.703 0.000*

120
Table 8: Correlation coefficient of each paragraph of “Regret Aversion” and the total of
this field:
No. Paragraph Pearson Correlation
Coefficient
P-Value
(Sig.)
1. I keep the stocks that decreased in value and I
don‘t sell them
.545 0.000*
2. I sell the stocks that increased in value faster .651 0.000*
3. I invest in companies with low risks .530 0.000*
4. I don‘t buy the stocks that decreased in value .609 0.000*
5. I buy the stocks that a group of investors .677 0.000*

121
Table 9: Correlation coefficient of each paragraph of “Self Control” and the total of this
field:
No. Paragraph Pearson Correlation
Coefficient
P-Value
(Sig.)
1. I can achieve profits out of my stocks by
consulting expert always.
.654 0.000*
2. If I believe that some details about certain
stock are not available to me, I don‘t buy that
stock.
.627 0.000*
3. Whatever my investment goals are in stock
exchange, I can achieve them
.528 0.000*
4. I care about spending on my daily obligations
more than caring about saving for the future
.199 0.000*
5. I divide my money to capital for investment
and money for daily spending
.554 0.000*

122
Appendix (2)
Questionnaire: Arabic version

123
Behavioral Factors influencing investment decision making:
an empirical study of Palestine Stock Exchange.
الستثًبريت: دراست تطبيقيت في سىق انعىايم انسهىكيت انًؤثرة عهً عًهيت اتخبر انقراراث ا
فهسطين نألوراق انًبنيت.
Prepared by: Sahar Mohammed Abu Nada
Supervised by: Dr: Faris Abu Moa’mer
يقذيت:
تثًرين األفراد تهذف انببحثت نذراست انعىايم انسهىكيت اننفسيت انتي تؤثر عهً عًهيت اتخبر انقراراث االستثًبريت نذي انًس
في سىق فهسطين نألوراق انًبنيت وانتي قذ تؤثر عهً قراراتهى ببنبيع أو انشراء في أسهى انشركبث انًذرجت في انسىق .
فبنرجبء انتكرو بئجببت األسئهت انتبنيت :
Higher Studies department انذراسبث انعهيب
Commerce Faculty كهيت انتجبرة
Business Administration قسى إدارة األعًبل

124
I. :المعمومات الشخصية
ذكر اثني الجنس .1
العمر .2
55فوق 55 -46 45 -36 35 -26 25 -18
الحالة االجتماعية أعزب متزوج مطمق .3
مستوى التعميم .4
بكالوريوس غير خريج الثانوية العامة وأقل
أخرى دكتوراه ماجستير
سنوات العمل .5
سنوات 11فوق سنوات 11 -5 سنوات 5أقل من

125
ا ىي المدة التي حضرت فييا إلى سوق فمسطين لألوراق الماليةم .6
سنوات 5أقل من – 3 سنوات 3أقل من –سنة أقل من سنة
سنوات 11فوق سنوات 11أقل من -5
ىل درست أي دورة في سوق األوراق .7
أجل ليس بعد

126
ـــــــــــــيومالمفـــــــــــــــــــــــــــــــموافق
بشدة موافق
موافق
بدرجة
متوسطة
غير
موافق
غير موافق
بشدة
الثقة الزائدة -1
أنا مستثمر خبير .1
أشعر بالثقة في قراراتي االستثمارية أكثر من ثقتي في .2
.وجيات نظر أصدقائي وزمالئي
أقوم باستشارة اآلخرين )عائمة، أصدقاء، أو زمالء( قبل .3
.ام بشراء أسيمالقي
جعل أداء و السوق أستخدم مياراتي التنبؤية في توقيت .4
.محفظتي االستثمارية أعمى من أداء السوق ككل
.أقوم ببيع وشراء األسيم بشكل مبالغ فيو .5
أقوم بتنويع األسيم في محفظتي االستثمارية .6
تي سوف أنا أعتقد أن لدي القدرة عمى اختيار األسيم ال .7

127
يكون أداؤىا أعمى من أداء السوق
تجنب الخسارة -2
من أشعر بقمق من الخسارة الكبيرة في أسيمي أكثر .1
من ضياع فرصة لمربح يقمق
العصبية عندما تنخفض األسعار في و أشعر بالتوتر .2
أسيمي المستثمرة.
أزيد من استثماري عندما يكون أداء السوق ضعيفاً ال .3
رأس ال اشعر أنبعين االعتبار استثماريعندما آخذ .4
.المال المستثمر أىم من األرباح
أبيع األسيم الرابحة وأحتفظ باألسيم التي انخفضت .5
قيمتيا في السوق.
أتمسك باألسيم التي انخفضت قيمتيا لمدة طويمة. .6
التمثيل -3
في خ تجنب االستثمار في شركات ليا تاريأحاول .1
.األرباح الضعيفة تحقيق

128
اخذ باالعتبار األداء الماضي ألسيم الشركة التي أريد .2
ألني أعتقد أن األداء الجيد يستمر في شراء أسيميا
المستقبل
تاريخ ذات لشركاتىي ممك األسيم الجيدةأعتقد أن .3
.ثابت من نمو المكاسب )األرباح(
وأتجنب شراء طمب عالييم التي عمييا أشتري األس .4
األسيم التي كان أدائيا ضعيفًا في الماضي القريب.
التخاذ قراراتي في شراء أو بيع أستخدم تحميل االتجاه .5
األسيم.
االعتماد عمى السعر -4
أقارن أسعار األسيم الحالية مع أعمى سعر أو أدنى سعر .1
ليا خالل السنة الماضية حتى أبرر شرائي لألسيم.
أسيمي بعد أن تصل إلي أعمى سعر من المحتمل أن أبيع .2
قد وصمت لو السنة الماضية.
ليس من المحتمل أن أشترى سيم إذا كان سعره أغمى من .3

129
السنة الماضية.
أنا أرى سعر السيم مرتفعًا إذا كان السعر زاد ووصل إلى .4
أعمى سعر لو في خالل السنة.
بأن أعمى سعر و أدنى سعر لألسيم خالل أنا أعتقد .5
السنة الماضية تحدد المدى الذي يتحرك فيو سعر السيم
الحالي.
بيعي وشرائي لألسيم يتأثر بالتجارب الحديثة لي في .6
السوق.
استخدم سعر الشراء لألسيم كنقطة مرجعية في المتاجرة. .7
وىم المقامر -5
توقع نياية عوائد السوق سواء أنا قادر وبشكل عادي أن أ .1
كانت جيدة أو سيئة في البورصة.
اإلتاحة -6
إذا سمعت من صديقي في سوق األوراق المالية عن أن .1
سيما يحقق عوائد مرتفعة فاني سأقوم بشرائو.

130
سوف اعتمد انيإذا أردت االستثمار في أسيم شركة ما ف .2
.غالبا عمى آراء ونصائح زمالء العمل
إذا أردت االستثمار في أسيم شركة ما فاني سوف اعتمد .3
غالبا عمى المعمومات من االنترنت أو التمفزيون.
إذا أردت االستثمار في أسيم شركة ما فاني اعتمد غالبا .4
عمى معمومات من الشركة نفسيا.
إذا أردت االستثمار في أسيم شركة ما فاني اعتمد غالبا .5
ومات من خبراء ماليين.عمى معم
إذا أردت االستثمار في أسيم شركة ما فاني اعتمد غالبا .6
عمى تحميمي الشخصي.
إذا أردت االستثمار في أسيم شركة ما فاني اعتمد غالبا .7
عمى األداء المالي الماضي لمشركة.
إذا نصحني صديق بشراء سيم شركة معينة ثم وصمتني .8
ال ارتفاع سعر السيم فاني سأستثمر في أنباء عن احتم
أسيم الشركة.

131
الحسابات العقمية -7
أنا أميل إلى أن أعامل كل حساب في محفظتي .1
االستثمارية بشكل منفصل.
أشعر بتردد في بيع األسيم التي حققت أرباحا عالية يوما .2
ما رغم انخفاض أسعارىا حاليًا.
ة االستثمارية ككل ولكن أىتم أنا ال أىتم بأداء المحفظ .3
لعائد كل حساب عمى حدة.
تجنب الندم -8
أنا احتفظ باألسيم التي انخفضت قيمتيا و ال أقوم ببيعيا. .1
أنا أبيع األسيم التي ارتفعت قيمتيا بشكل أسرع. .2
أستثمر في أسيم شركات ليس فييا مخاطرة كبيرة. .3
قيمتيا. ال أشترى أسيما قد انخفضت .4
أشتري األسيم التي يقوم بشرائيا جماعة من المستثمرين .5
في السوق.

132
السيطرة عمى الذات -9
استطيع تحقيق األرباح من أسيمي في السوق عن .1
طريق استشارة الخبراء دائما.
إذا اعتقدت بان بعض التفاصيل عن سيم شركة معينة .2
بشراء األسيم. أقومليست لدي فاني ال
أىدافي االستثمارية في سوق األوراق فاني ميما كانت .3
استطيع تحقيقيا.
.ال اىتم باالدخار لممستقبل بقدر اىتمامي باإلنفاق عمى 4
التزاماتي اليومية.
.مار و مال لإلنفاق اليوميتث. أنا اقسم مالي إلي رأسمال لالس5
نشكر لكم حسن تعاونكم

134
Appendix (3)
Questionnaire: English version

135
Behavioral Factors influencing investment decision making:
an empirical study of Palestine Stock Exchange.
دراست تطبيقيت في سىق انعىايم انسهىكيت انًؤثرة عهً عًهيت اتخبر انقراراث االستثًبريت:
.فهسطين نألوراق انًبنيت
Prepared by: Sahar Mohammed Abu Nada
Supervised by: Dr: Faris Abu Moa’mer
Higher Studies department
الدراسات العليا
Commerce Faculty كلية التجارة
Business Administration قسم إدارة األعمال

136
Personal information
1. Gender Male Female
2. Age
18 – 25 26 - 35 36 - 45 Over 55
46-55
3. Education level
High school and lower Diploma Bachelor
Higher studies
4. How long have you attended the stock market
1-under 3 years 3- under 5 years 5 years and more
5. Have you attended any course of Stock Exchange
Yes Not yet
6. Please estimate your average monthly income ($)
1000 1001-2000 2001-3000
3001-4000 More than 4000

137
Concept Strongly
agree Agree Neutral Disagree
Strongly
disagree
I. Overconfidence
1. I am an experienced investor
2. I feel more confident in my own
investment opinions over opinions of my
colleagues or friends
3. I consult others (family, friends or
colleges) before making stock purchase
4. I use my predictive skills to time the
market and to make my port folio
performance higher than the market
performance
5. I trade stocks excessively
6. I have stocks in more than one company in
Palestine stock exchange
7. I have the ability to choose the stocks
which its performance will be better than
the market performance.
II. Loss aversion
8. I am more concerned about a large loss in
my stock than missing a substantial gain
9. I feel nervous when large paper losses
(price drops) have in my invested stocks
10. I will not increase my investment when the
market performance is poor

138
11. When it comes to investment, no loss of
capital (invested money) is more
important than returns (profits)
12. I sell stocks that increased in value very
quickly
13. I keep stocks that decreased in value for
long time
III. Representativeness
14. I tried to avoid investment in companies
with a history of poor earnings
15. I rely on past performance to buy stocks
because I believe that good performance
will continue
16. Good stocks are firms with past
consistent earnings growth
17. I buy hot stocks and avoid stocks that
performed poorly in the near past.
IV. Price anchoring
18. I compare the current stock prices with
their recent year high and low price to
justify my stock purchase.
19. I am likely to sell my stock after the price
hits recent year high

139
22. I believe that the position of the year high
and low price determined the current
stock price movement range.
23. I use the stock purchase price as a
reference point for trade.
V. Gambler’s fallacy
24. I can normally expect the end of the
market returns whether they are good or
bad.
VI. Availability
25. If I heard from a friend about a stock that
achieved high returns, I would buy it.
26. If I want to invest in the stocks of a
certain company, I will rely on my
coworkers opinions
27. If I want to invest in the stocks of a
certain company, I will rely on
information from the internet
20. I am unlikely to buy a stock if it was
more expensive than last year
21. I see the stock price as high if the price
has increased to the current year high

140
28. If I want to invest in the stocks of a
certain company, I will rely on
information from the same company
29. If I want to invest in the stocks of a
certain company, I will rely on
information from financial experts
30. If a friend advised me to purchase a stock
of certain company then news arrived me
about the probability of that stock‘s price
rising, I will invest in these stocks.
VII. Mental Accounting
31. I tend to treat each element of your
investment portfolio separately
32. I hesitate selling stocks that had high
returns in the past even though their prices
decrease nowadays
33. I don‘t care about the performance of my
investment portfolio as a whole but I care
about the return of each account
separately
VIII. Regret Aversion
34. I keep the stocks that decreased in value

141
and I don‘t sell them
35. I sell the stocks that increased in value
faster
36. I invest in companies with low risks
37. I don‘t buy the stocks that decreased in
value
38. I buy the stocks that a group of investors
IX. Self Control
39. I can achieve profits out of my stocks by
consulting expert always.
40. If I believe that some details about certain
stock are not available to me, I don‘t buy
that stock.
41. Whatever my investment goals are in
stock exchange, I can achieve them
42. I care about spending on my daily
obligations more than caring about saving
for the future
43. I divide my money to capital for
investment and money for daily spending
142
REFERENCES
1. (n.d.). Retrieved 2013, from : http://www.pex.ps/PSEWebSite/English/AboutPSE.aspx?TabIndex=0
2. (Uri Gneezy, B. R.-G. (2004). Measuring Lying Aversion. Journal of Economic Behavior and Organization.
3. (2011). European Journal of Economics, Finance and Administrative Sciences.
4. Abu-Rub, N., & Sharba, T. (2010). Calender Effects in the Palestine Securities Exchange ( PSE): Analysis
and Investigation.
5. Abushammala, N., & Sami. (2011). Testing the Weak Form Efficiency of Palestine Exchange. International
Journal of Economics and Finance, 244-253.
6. Agha Jahanzeb, S. M.-u.-R. (2012). Implication of Behavioral Finance in investment decision-making
process. Business and Management Review Vol. 2(8), 01 – 04.
7. Akintoye, I. a. (2007). Effect of Misinterpretation in an Informational Efficient Marke. European Journal of
Finance.
8. Avanidhar, S. (2007). Behavioral Finance: A review and Synthesis. European Financial Management, Vol.
14, No. 1, 12–29.
9. Azeez, B., & Sulaiman, L. (2012). CAPITAL MARKET EFFICIENCY: A Test of the Strong Form in Nigeria.
Australian Journal of Business and Management Research.
10. Baghdadabad, M. R., Tanha, F. H., & Halid, N. (20111). A study on small investors’ behavior in choosing
143
stock. African Journal of Business Management, 11083-11092.
11. Baily, W., Alok, K., & Ng, D. (2011). Behavioral biases of mutual fund investors . Journal of Financial
Economics.
12. Baker, H. K. (October 5, 2010). Behavioral Finance: Investors, Corporations, and Markets.
13. Baker, K., & Nofsinger, J. (2009). Behavioral Finance.
14. Barber, B. a. (2001). Boys will be boys: Gender, overconfidence, and common stock investment.
Quarterly Journal of Economics, 261-292.
15. Barber, B. M. (2008). All that glitters: the effect of attention on the buying behavior of individual and
institutional investors. Review of Financial Studies, 785–818.
16. Barberies, N., & Huang, M. (2001). Metanl Accounting, Loss Aversion and Individual Stock Returns.
Natioal Bureau of Economic Research ;Working Paper 8190.
17. BARBERIS, N. A. (1998). A Model of investor sentiement. Journal of Financial Economics,, 307-343.
18. BARBERIS, N. a. (2001). Mental Accounting, Loss Aversion and Individual Stock Returns. The Journal of
Finance,, 1247-1292.
19. Barberis, N. S. (1998). A model of investor sentiment. Journal of Financial, 307Ð343.
20. Baron, R. A., & Byrne, D. (1997). Social Psychology. Boston, MA: Allyn and Bacon.
21. Belotti, H. S. (2007). Behavioral Finance: Biases, Mean–. Journal of Finance.
22. Benartzi, S. a. (1995). Myopic Loss Aversion and the Equity Premium Puzzle. Quarterly Journal of
144
Economics, 73-92.
23. Benartzi, S., & Thaler, R. (1995). Myopic Loss Aversion and the Equity Premium Puzzle. Quarterly Journal
of Economics, 73-92.
24. Bergen, J. (2013). Forbs. Retrieved july 2013, from Investopedia:
http://www.forbes.com/sites/investopedia/2011/01/12/efficient-market-hypothesis-is-the-stock-
market-efficient/
25. Bergen, J. V. (2011). Efficient Market Hypothesis: Is The Stock Market Efficient? Retrieved May 30, 2013,
from Investopedia: http://www.investopedia.com/articles/basics/04/022004.asp
26. Bernéus, H., Sandberg, C., & Wahlbeck, D. (2013). Behavioral Finance – Investors’ Rationality.
27. Bhandaria, G., Hassaneinb, K., & Deaves, R. (2008). Debiasing investors with decision support systems: An
experimental investigation. Decision Support Systems, 399–410.
28. Chandra, A. (2008). Decision Making in the Stock Market: Incorporating Psychology with Finance.
National Conference on Forecasting Financial Markets of India, 2008 .
29. Chandra, A. (2008). DECISION-MAKING IN THE STOCK MARKET: INCORPORATING PSYCHOLOGY WITH
FINANCE. Journal of Finance.
30. Chandra, A., & Kumar, R. (2011). Determinants of Individual Investor Behaviour: An Orthogonal Linear
Transformation Approach. MPRA_paper_29722.pdf.
31. Chen G, K. K. (2007). Trading Performance, Disposition Effect,Overconfidence, Representativeness
Bias,and Experience of Emerging Market Investors. Journal of Behavioral Decision Making, 425-451.
145
32. Chen, G. K. (2007). Trading performance, disposition effect, overconfidence representativeness bias, and
experience of emerging market investors. Journal of Behavioral Decision Making.
33. Cherry, K. (2013). About Psychology. Retrieved April 20, 2013, from Availability Heuristic:
http://psychology.about.com/bio/Kendra-Cherry-17268.htm
34. Chip Heath, S. H. (1999). Psychological factors and stock option exercise. Quarterly Journal of Economics,
227-271.
35. Chira, I. (August 2008). Behavioral Bias Within The Decision Making Process. Journal of Business &
Economics Research Volume 6, Number 8.
36. Chira, I., Adams, M., & Thoronton, B. (2008). Behavioral Bias Within The Decision Making Process. Journal
Of Business & Economics Research.
37. Chun, W., & Ming, L. (2007). "Investor behavioure and Decision Making Style: A Malaysian perspective".
3-14.
38. Cooper, M., Dimitrov, O., & Rau, P. R. (2001). Journal of Finance, 2371-2388 .
39. CURTIS, G. (2004). Modern Portfolio Theory and Behavioral Finance. THE JOURNAL OF WEALTH
MANAGEMENT, 16-22.
40. Daniel, K. D. (1998). Investor Psychology and Security Market Under- and Over-Reactions. Journal of
Finance, 1839-1886.
41. Daniel, K. D. (2001). Covariance Risk, Mispricing, and the Cross-section of Security Returns. Journal of
Finance.
146
42. Daniel, K. H. (2002). Investor Psychology In Capital Markets: Evidence And Policy Implications. Journal of
Monetary Economics, 139–209.
43. Daniel, k., & Titman, s. (2000). Market effeciency in an irrational world. Working paper 7489.National
Bureau of Econimic Research (NBER).
44. Dargham, N. A. (2009). The implications of Behavioral Finance. Journal Of Economics.
45. De Bondt, W. F. (1985). Does the Stock Market overreact. The Journal of Finance, 793-805.
46. DeBondt, W. T. (1995). Does the stock market overreact? Journal of Finance, 793-805.
47. DeBondt, W. T. (1995). Financial decision-making in markets and firms:a behavioral perspective. Elsevier,
385-410.
48. Deuskar, P. J. (2012). effect of regret. Review of Financial Studies.
49. Deuskar, P., Deng, P., Weisbenner, S. J., & Wu, F. (2012). The Effect of Regret. 25th Australasian Finance
and Banking Conference .
50. Dittrich, D., Güth, W., & Maciejovsky, B. (2005). Overconfidence in investment decisions: An
experimental approach. The European Journal of Finance.
51. Dominic D. P. Johnson, J. H. (22 Sep 2009). The Evolution of Overconfidence.
52. Evans, A., Dillon, K., Goldin, G., & Krueger, J. (2011). Trust and self-control: The moderating role of the
default. Judgment and Decision Making, 697-705.
53. Evans, W. D. (2005). Bidding and overconfidence in experimental financial markets. The journal of
147
behavioral finance, 108-120.
54. Fama, E. F. (1 September 1998). Market efficiency, long-term returns, and behavioral finance. Journal of
Financial Economics Volume 49, Issue 3, Pages 283–306.
55. FAMA, E. F. (1998). Market Efficiency, Long-Term Returns, and Behavioral Finance. Journal of Financial
Economics,, 283-306.
56. Fama, F. (September/October(reprinted January - February 1995). Random Walks in Stock Market Prices.
Financial Analysts Journal.
57. Fischer, R., & Gerhardt, R. (2007). Investment Mistakes of Individual Investors and the Impact of Financial
Advice. 20th Australasian Finance and Banking Conference .
58. Fischer, R., & Gerhardt, R. (2007). Investment Mistakes of Individual Investors and the Impact of Financial
Advice. 20th Australasian Finance and Banking Conference .
59. Frieder, L. (2004). Evidence on Behavioral Biases in Trading Activity. 2-58.
60. G. Sevil, M. S. (2007). Small Investor Behaviour in Istanbul Stock Exchange (ISE). Middle Eastern Finance
and Economics, 74-79.
61. Gervais, S. &. (2001). Learning to be overconfident. Review of Financial Studies, 1-27.
62. Gervais, S. (2009). Behavioral Finance:Capital Budgeting and Other Investment Decisions. Review of
financial Studies.
63. Gervais, S. (2009). Behavioral Finance:Capital Budgeting and Other Investment Decisions. Behavioral
Finance.
148
64. Gervais, S. (2009). Behavioral Finance:Capital Budgeting and Other Investment Decisions. Behavioral
Finance.
65. Gokul Bhandari, K. H. (2011). Debiasing Investors with Decision Support Systems:Debiasing Investors with
Decision Support Systems:. 1-33.
66. Gokul Bhandaria, K. H. (n.d.). Debiasing Investors with Decision Support Systems:An Experimental
Investigation.
67. Goldberg, J. ,. (2001). Behavioural Finance. Wiely.
68. Goldberg, J. a. (2001). Behavioral Finance. Chichester: FinanzBuch Verlag GmbH.
69. GONGMENG CHEN, K. A. (2007). Trading Performance, Disposition Effect,Overconfidence,
Representativeness Bias and Experience of Emerging Market Investors. Journal of Behavioral Decision
Making, 425–451.
70. Gunay, S. G., & Demirel, E. (2011). Interaction between Demographic and Financial Behavior Factors in
Terms of Investment Decision Making. International Research Journal of Finance & Economics.
71. Herschberg, M. (2012). Limits to Arbitrage: An introduction to Behavioral Finance and a Literature
Review. Palermo Business Review.
72. Herschberg, M. (2012). Limits to Arbitrage: An introduction to Behavioral Finance and a Literature
Review. Palermo Business Review.
73. Hoguet, G. (2005). How the World Works. Behavioral Finance and Investing in Emerging Markets.
149
74. James Felton, B. G. (2003). Preference for Risk in Investing as a Function of Trait Optimism and Gender.
The journal of behavioral finance, 33-40.
75. Jensen, M. C. (1987). Some Anomalous Evidence Regarding Market Efficiency. Journal of Financial
Economics, 95-101.
76. Jeremy Siegel - Efficient Market Theory and the Recent Financial Crisis . (n.d.). Retrieved august
8/11/2012, 2012, from you tube: http://www.youtube.com/watch?v=8mT-JOqTIMk&feature=related
77. John Ameriks, A. C. (2004). Measuring Self-Control.
78. Kadariya, S. (2012). Factors affecting investor decision making: A case of Nepalese capital market. Journal
of Research in Economics and International Finance, 16-30.
79. Kahneman, D. (2003). Maps of bounded rationality: psychology for behavioral economics. The American
Economic Review, 1449–75.
80. Kahneman, D. a. (2002). Representativeness revisited: Attribute substitution in intuitive judgment. 48-81.
81. Kahneman, D. a. (2002). Representativeness revisited: Attribute substitution in intuitive judgment.
Heuristics & Biases: The Psychology of Intuitive Judgment, pp. 49-81.
82. Kahneman, D. S. (1982). Judgment Under Uncertainty: Heuristics and Biases. New York: Cambridge
University Press.
83. Kahneman, D., & Tversky, A. ((Mar., 1979)). Prospect Theory: An Analysis of Decision under Risk.
Econometrica, Vol. 47, No. 2, pp. 263-292.
150
84. Kahneman, D., & Tversky, A. (1974). Judgment under uncertainty: Heuristics and Biases. Science, 1124–
1131.
85. Kamstra, M. J., & Kramer, L. A. (September 2000,). Losing Sleep at the Market: The. American Economic,
pp.1005-11.
86. Kaneko, H. (2004). Individual investors and investments trusts.
87. Karz, G. (2012). The Efficient Market Hypothesis and Random Walk Theory.
http://www.investorhome.com/emh.htm.
88. Karz, G. (n.d.). The Efficient Market Hypothesis and Random Walk Theory. Retrieved October 2013, from
http://www.investorhome.com/emh.htm
89. Kliger, D., & Kudryavtsev, A. (2010). The availability heuristic and investors' reaction to company-specific
events. The journal of behavioral finance, 50-65.
90. Kuo, M.-H., Kuo, N.-F., Chiu, Y.-C., & Fan, P.-H. (2005). Gender and Investment Behavior: on Taiwanese
Individual Investors. Journal of Financial Studies.
91. Lichtenstein, S. a. (1982). Calibration of probabilities: the state of the art to 1980. In: Kahneman, Daniel
and Slovic, Paul and Tversky, Amos, (eds.) Judgment under uncertainty: heuristics and biases, pp. 306-
334.
92. Lin, H.-W. (2011). Elucidating rational investment decisions and behavioral biases: Evidence from the
Taiwanese stock market. African Journal of Business Management Vol. 5(5),, 1630-1641.
93. Lin, H.-W. (2011). Elucidating rational investment decisions and behavioral biases: Evidence from the
151
Taiwanese stock market. African Journal of Business Management Vol. 5(5), 1630-1641.
94. Lin, H.-W. (2011). Elucidating rational investment decisions and behavioral biases: Evidence from the
Taiwanese stock market. African Journal Of Business Management, 1630-1641.
95. Luong, L. P., & Thu Ha, D. T. (2011). BEHAVIORAL FACTORS INFLUENCINGINDIVIDUAL INVESTORS’
DECISION-MAKINGAND PERFORMANCEA SURVEY AT THE HO CHI MINH STOCK EXCHANGE.
96. Mahmood, I., Ahmed, H., Khan, A. Z., & Anjum, M. (2011). Behavioural Implication of Investors for
Investments in the Stock Market. European Journal of SOCIAL sciences, 240-247.
97. Malkiel, B. (2003). The Efficient Market Hypothesis and Its. Journal of Economic Perspectives, 59–82.
98. Malkiel, B. (2003). The Efficient Market Hypothesis and Its Critics. Journal of Economic, 59–82.
99. Masomi, S. a. (2012). consequences of human behaviors in Economics: the Effects of Behavioral Factors
in INvestment decision making in Tehran Stock Exchange.
100. Masomi, S. R., & Ghayekhloo, S. (2011). Consequences of human behaviours' in Economic: the Effects of
Behavioural Factors in Investment decision making at Tehran Stock Exchange. International Conference
and Economics Research, 234-237.
101. Massimo Massa, A. S. ( 2004). Behavioral Biases and Investment.
102. members, r. t. (2005, september 1st). Individual investors. (R. H. Thaler, Ed.) Advances in behavioral
finance, 2, pp. 543-563.
103. Meyers, D. G. (1994). Exploring Social Psychology. 15-19.
152
104. Montier, J. (2002). Darwin's Mind: The Evolutionary Foundations of Heuristics and Biases.
105. Montier, J. (2002). Darwin's Mind: The Evolutionary Foundations of Heuristics and Biases.
106. Nau, R. (2007). Advances in Decision Analysis: From Foundations to Applications. Cambridge University
Press.
107. Naveed, A. (2011). Behavioural Finance : Shaping the Decisions of small Investors of Lahore Stock
Exchange. Inerdisiplinary Journal if Research in Business, 38-43.
108. Nofsinger, J. R. (2001). The Psychology of Investing.
109. Odean, B. M. (2010). The Courage of Misguided Convictions. Financial Analysts Journal, 41–55.
110. Odean, T. (1998). Are investors reluctant to realize their losses? Journal of Finance, 1775-1798.
111. ODEAN, T. (1998). Are Investors Reluctant to Realize Their Losses? The Journal of Finance, 1775-1798.
112. ODEAN, T. (1999). Do Investors Trade Too Much? The American Eco-nomic Review, 1279-1298.
113. Odean, T., & Barber, B. (2000). Trading Is Hazardous to Your Wealth:The Common Stock Investment
Performanceof Individual Investors. THE JOURNAL OF FINANCE, 773-806.
114. Olsen, R. A. ((Mar. - Apr., 1998)). Behavioral Finance and Its Implications for Stock-Price Volatility.
Financial Analysts Journal, pp. 10-18.
115. Olsen, R. A. (1998). Behavioral Finance and Its Implications for Stock-Price Volatility. Financial Analysts
Journal, 10-18.
153
116. Park, J. (2010). Confirmation Bias, Overconfidence, and Investment Performance: Evidence from Stock
Message Boards.
117. Park, J., Konana, P., & Kumar, A. (2010). Confirmation Bias, Overconfidence, and
InvestmentPerformance: Evidence from Stock Message Boards. McCombs Research Paper Series No.
IROM-07-10 .
118. Paul Slovic1, E. U. (2002). Perception of Risk Posed by Extreme Events. Center for Decision Sciences (CDS)
Working Paper.
119. Peterson, R. (2007). Affect and Financial Decision-Making: How Neuroscience can Inform Market
Participants. The Journal of Behavioural Finance , 1-9.
120. Pompian, M. M. (2006). Incorporating Behavioral Finance into Your Practice. Journal of Financial
Planning.
121. Rasoul Sadi, H. G. (2011). Behavioral Finance: The Explanation of Investors’ Personality and Perceptual
Biases Effects on Financial Decisions. International Journal of Economics and Finance.
122. Ricciardi, V., & Simon, H. (2001). Behavioural finance:A new perspective for investors and financial
professionals. Working paper.
123. Sadeghi, M. Y. (n.d.). The Influence of Investor Psychology On Regret Aversion. journal of finance.
421. Samir Safi ( .2002 .) An introduction to statistics . Gaza.
125. Saunders, E. M. (1993). Stock prices and wall street weather. American Economic Review, 1337–1345.
154
126. Seppälä, A. (2009). Behavioral biases of investment advisors - The effect of overconfidence and hindsight
bias.
127. Sevil, G. S. (2007). Small Investor Behavior In Istanbul Stock Exchange(ISE). Eurojournal Publishing, Inc,
Middle Eastern Finace And Economics, 14550-2889.
128. Sewell, M. (2007). Behavioural Finance.
129. Shaheen, Y. (2010). The Percevied Usefulness of Information for Investment Decisions: Evidence from
Palestine Securities Exchange[PSE]. Hebron University Research Journal, 284-307.
130. Shefrin, H. (2000). “Beyond Fear and Greed: Understanding Behavioral Finance and the Psychology of
Investing. Harvard Business School Press.
131. Shefrin, H. (2000). Beyond Greed and Fear: Understanding behavioral finance and the psychology of
investing. Harvard Business School Press.
132. SHEFRIN, H. (2000). Beyond Greed and Fear: Understanding Behavioral Finance and the Psychology of
Investing. Financial Management Association Survey and Synthesis Series.
133. Shefrin, H. (2001). Behavioral Corporate Finance. Journal of Applied Corporate Finance, 113-124.
134. Shefrin, H. (2007). Behavioral Finance: Biases, Mean–Variance Returns, and Risk Premiums. CFA Institute
Conference Proceedings Quarterly.
135. SHEFRIN, H., & STATMAN, M. (1984). EXPLAINING INVESTOR PREFERENCE FOR CASH DIVIDENDS. Journal
of Financial Economics, 253-282.
155
136. Shefrin, H., & Statman, M. (1995). Making sense of beata, size, and book-to-market. Journal of Portfolio
Management, 26-34.
137. Shfrn, H., & Statman, M. (1985). The Disposition to Sell Winners Too Early and Ride Losers Too Long:
Theory and Evidence. The Journal of Finance, 777-790.
138. Shiller, J. (2003). From efficient markets theory to behavioral finance. The Journal of Economic
Perspectives, 83-104.
139. Shiller, R. (2013). Retrieved November 2013, from http://www.youtube.com/watch?v=IK-idXz0dhw
140. Shiller, R. J. (1998). Human Behavior and the Efficiency of the Financial System. NBER Working Papers
6375.
141. Shiller, R. J. (1999). Human Behavior and the Efficiency of the Financial System. J.B. Taylor and M.
Woodford, eds., Handbook of Macroeconomics, Vol. 1C, Part 6, pp. 1306-1340.
142. Shiller, R. (May 2010). Using behavioral Finance to Better understand the psychology of Investors.
Institutional Investor.
143. SHLEIFER, A. (2000). Inefficient Markets: A Introduction to Behavioral Finance. Oxford: Oxford University
Press.
144. Shleifer, A. (2000). Inefficient Markets: An Introduction to Behavioral Finance. Oxford University Press,
New York.
145. Shleifer, A. a. (1997). The limits of arbitrage. Journal of Finance 52, 35-55.
156
146. Shleifer, A. a. (1997). The limits to arbitrage. The Journal of Finance, 35-55.
147. Shleifer, A. a. (1997). The limits to arbitrage. The Journal of Finance, 35-55.
148. Simon, G., & Terrance, O. (2001). Learning to be Overconfident. Review of Financial Studies, 1-27.
149. Simon, H. (1957). models of man. New York: John Wiley and Sons, Inc.
150. Singh, S. (2012). Investor Irrationality and Self-Defeating Behavior:Insights from Behavioral Finance. The
Journal of Global Business Management, 116-122.
151. Singh, S. (2012). Investor Irrationality and Self-Defeating Behavior:Insights from Behavioral Finance.
Global Business Management, 116-122.
152. Suleyman Gokhan Gunay, E. D. (2011). Interaction between Demographic and Financial Behavior Factors
in Terms of Investment Decision Making. International Research Journal of Finance and Economics, 147-
156.
153. Thaler, C. M. (2005). "Overconfidence vs. Market Efficiency in the National Football League. NBER
Working Papers 11270.
154. Thaler, R. (1999). The End of Behavioral Finance. Financial Analysts Journal vol. 55, no. 6, 12-17.
155. Thaler, R. a. (2002). A Survey of Behavioral Finance, Handbook of the Economics of Finance. National
Bureau of Economic Research.
156. Thaler, R. H. (1981). An Economic Theory of Self-Control. Journal of Political Economy, 392-406.
157. THALER, R. H. (1999). Mental Accounting Matters. Journal of Behavioral Decision Making, 183-206.

157
158. Wang, F. A. (2001). Overconfidence, Investor Sentiment, and Evolution. Journal of Financial
Intermediation 10, 138–170.
159. Yahyazadehfar, M. a. (2008). The Influence of Investor Psychology On Regret Aversion. Journal of finance.
160. Yates, J. F. (1990). Judgment and decision making. Englewood Cliffs, NJ.
161. Zhu, Y.-J. L.-S.-Y.-P. (n.d.). The Investment Behavior, Decision Factors and Their Effects Toward
Investment Performance in the Taiwan Stock Market.