The Islamic University Gaza - library.iugaza.edu.ps · The Islamic University Gaza Research and...
115
Transcript of The Islamic University Gaza - library.iugaza.edu.ps · The Islamic University Gaza Research and...

The Islamic University Gaza
Research and Graduate Studies
Faculty of Engineering
Civil Engineering Department
Design and Rehabilitation of Structures
زةــــــــــــــــة بغاإلسالميــــــــــــة ـــــــــــــلجامعا شؤون البحث العلمي والدراسات العليا
ةــــــــــــــــــــــــــــــــة الهندســـــــــــــــــــــــــــــــــــكلي ةــــــــــــــــــة المدنيــــــــــــــــم الهندســــــــــقس
آتــــــــأهيل المنشتو برنامج / تصميم
Fresh and Hardened Properties of Locally Produced Reactive Powder
Concrete
صلبة المنتجة محليا مت" المساحيق الفعالة" الطازجة وال خواص خرسانة
Prepared by
Osama Mohammed El-Louh
Supervised by
Dr. Mohammed Arafa Dr. Mamoun Alqedra
A Research Submitted in Partial Fulfillment of the Requirements for the Degree of
Master of Science in Civil Engineering – Design and Rehabilitation of Structures
3415 - 4134

I
ABSTRACT
Reactive Powder Concrete (RPC) is a relatively new cementitious material. Its main
features include a high percentage ingredient of Portland cement, very low water-to-
cement ratio, and the presence of very fine crushed quartz, fine quartz sand and silica
fume. Coarse aggregate in normal aggregate concrete is completely replaced by fine quartz
sand and crushed quartz. RPC is characterized by ultra-high performance in mechanical
properties, particularly in compressive strength; and this would be of tremendous interest
to construction practitioners.
The main goal of this research is to produce RPC in Gaza Strip, using materials that are
available at the local markets. Different trial mixes and curing methods are used to obtain
the acceptable fresh properties with a compressive strength exceeding 561 MPa for normal
curing.
The research includes also the use of steel fibers, quartz sand, crushed quartz,
superplasticizers and without using any type of course aggregates.
This research focuses firstly on the fresh and hardened mechanical properties of RPC,
which are studied, such as, workability, self-compacting properties, compressive strength,
split cylinder strength, and flexural strength. The effects of using different steel fibers and
silica fume doses on these properties are obtained within the research work. Secondly, the
research focuses on the effect of different curing conditions on the mechanical properties
of RPC, such as compressive strength, splitting strength and flexural strength.
Experimental program includes twelve trial mixes, which are prepared using several steel
fiber and silica fume contents. Silica fume contents of 25%, 30% and 35% by weight of
cement and steel fiber contents of 0%, 1%, 2% and 3% by total volume are used. While
keeping other contents (cement, Quartz sand, crushed quartz, superplastisizers and water)
constant.
II
The production of RPC in Gaza using materials from local markets are successfully carried
out at the minimum compressive strength of 561 MPa at the age of 28 days at standard
conditions and curing temperature 25°C. RPC concrete is produced with Water/Cement
ratio of 0.82; steel fibers 24% by cement weight, quartz sand 110% by cement weight,
crushed quartz 20% by cement weight, and silica fume 30% by cement weight as the
mineral admixture 2% superplasticizer by cement weight.
The results also showed the effect of curing temperatures 66, 51, and 90°C. It is noted that
compressive strength increases proportionally for all types of curing methods with curing
ages and a compressive strength of 191 MPa at 90°C for 3 days was obtained.

III
الملخص
هي مادة إسمنتية جديدة وتحتوي بشكل رئيسي على نسبة عالية من االسمنت ونسبة قليلة من الماء خرسانة المساحيق الفعالةبالنسبة لإلسمنت وكذلك وجود الرمل الناعم والكوارتز المطحون وغبار السليكا. الركام الخشن المستخدم في الخرسانة التقليدية
بالرمل الناعم والكوارتز المطحون وتتميز خرسانة المساحيق الفعالة بأداء فائق في الخواص الميكانيكية يتم استبداله بالكامل وخصوصًا في قدرة تحمل الضغط والكسر وهذا من شأنه أن تكون له فائدة كبيرة في مجال البناء.
زة باستخدام المواد المتوفرة في االسواق إن الهدف الرئيسي من هذا البحث هو إنتاج خرسانة المساحيق الفعالة في قطاع غ
المحلية، حيث تم في هذا البحث تنفيذ العديد من الخلطات التجريبية للحصول على خصائص جديدة ومقبولة وفي نفس الوقت ميجا باسكال في المعالجة العادية. 561تتحمل ضغط كسر يفوق
د، رمل الكوارتز، الكوارتز المطحون، غبار السليكا، وبعض الملدنات تم استخدام مواد خاصة في هذه الخلطات، مثل ألياف الحدي
المضافة دون استخدام أي نوع من الركام ذو التدرج الحبيبي الكبير باستثناء رمل الكوارتز والكوارتز المطحون.
ويشتمل هذا البحث على قسمين: لحالة الطازجة والحالة الصلبة مثل التشغيلية ومقاومة الضغطأوال( دراسة الخواص الميكانيكية لخرسانة المساحيق الفعالة في ا
والكسر ومقاومة الشد باستخدام االسطوانة القياسية ومقاومة االنحناء. وتمت أيضًا دراسة تأثير أضافة نسب مختلفة من ألياف الحديد وغبار السليكا على هذه الخواص.
حرارية على الخواص الميكانيكية لخرسانة المساحيق الفعالة في الحالة الصلبة ثانيًا( دراسة تأثير الظروف المختلفة للمعالجة ال مثل مقاومة الضغط والكسر ومقاومة الشد باستخدام االسطوانة القياسية ومقاومة االنحناء.
النسب .ختلفةب مبنسغبار السيليكا و الحديد ألياف باستخدامخلطة تجريبية تم اعدادها اثني عشر تجريبيال برنامجالوتضمن
من %5، %2، %5، %0نسب الياف الحديد هي و ، وزن االسمنتمن ٪51 ،٪30 ،٪25هي غبار السيليكال المستخدمة رمل الكوارتز والكوارتز المطحون والملدنات المضافة والماء.مع تثبيت نسب المكونات األخرى للخرسانة االسمنت و الحجم الكلي
خرسانة المساحيق الفعالة في قطاع غزة باستخدام المواد المتوفرة في األسواق المحلية، إذا تم أظهرت النتائج أنه يمكن أنتاج
ميجا باسكال، باستخدام 165اختيار هذه المواد بعناية، ويمكن الحصول على خرسانة ذات قدرة تحمل للضغط والكسر تفوق من وزن االسمنت، %550، رمل الكوارتز الناعم بنسبة من وزن االسمنت %22، ألياف حديد بنسبة 0.20نسبة مياه لإلسمنت
من وزن االسمنت. %2من وزن اإلسمنت وملدنات بنسبة %50، غبار السليكا بنسبة %20الكوارتز المطحون بنسبة
ضغط درجة مئوية وتم االستنتاج ان قدرة تحمل ال 00، 51، 60كما وأظهرت النتائج تأثير المعالجة الحرارية بدرجات حرارة ميجا 505والكسر تزداد بزيادة درجة حرارة المعالجة وعدد ايام المعالجة وكذلك تم انتاج خرسانة ذات قدرة تحمل للضغط والكسر
ايام معالجة. 5درجة مئوية لمدة 00باسكال في المعالجة الحرارية عند درجة حرارة
IV
DEDICATIONS
I dedicate my thesis work to my father, mother, wife, sons and daughter their love, endless
support and encouragement.
To those who taught us letters of gold and words of jewel of the utmost and sweetest
sentences in the whole knowledge. Who reworded to us their knowledge simply and from
their thoughts made a lighthouse guides us through the knowledge and success path, to
our honored teachers and professors.
To our truly friends who share us their feelings and hard work, throw our research
accomplishment.
V
ACKNOWLEDGMENTS
I would like to express my sincere appreciation to my supervisors, Dr. Mohamed Arafa
and Dr. Mamoun Alqedra for their help and guidance in the preparation and development
of this work. The constant encouragement, support and inspiration they offered were
fundamental to the completion of this research.
Special thanks go to the material and soil lab of the Islamic University of Gaza, for their
logistic facilitations and their continuous support. Finally, I would like to thank everyone
who gave advice or assistance that contributed to complete this research.
VI
ABBREVIATIONS
ACI American Concrete Institute
ASTM American Society for Testing and Materials
HPC High Strength Concrete
HRWRA High-Range Water-Reducing Admixture
MDF Macro-Defect-Free Cement
NSC Normal Strength Concrete
SCC Self-Compacting Concrete
RPC Reactive Powder Concrete
UHSC Ultra High Strength Concrete
UHPC Ultra High Performance Concrete
UHPFRSCC Ultra High Performance Fiber Reinforced Self-Compacting Concrete
ITZ Interfacial Transition Zone
VII
TABLE OF CONTENTS
ABSTRACT…………………………………….……………………………………… I
III .………..…………………………… .………………………………………… الملخص
DEDICATIONS………………………….……………………………………………. IV
ACKNOWLEDGMENT……………….…………………………………………….... V
ABBREVIATIONS……………………….…………………………………...…….…VI
TABLE OF CONTENTS………………….…………………………………..……... VII
LIST OF TABLES…………………………………………………………………….. X
LIST OF FIGURES………………………………………………………..………….. XI
Chapter (1): Introduction …………………………...…..…………........ 1
1.1 Background ……………………………………………………….………….. 1
1.2 Statement of the Problem …………………………………………….………. 2
1.3 Research Significance …………………………………………...…………… 3
1.4 Objectives …………………………………………………………………….. 3
1.5 Methodology …………………………………………………………………. 4
1.6 Scope of Work ……………………………………………………………..…. 4
1.6.1 Characteristics of fresh RPC ……………………………………..…….. 4
1.6.2 Characteristics of hardened (RPC) ……………………………….……. 4
1.7 Thesis Structure ……………………..…………………………………….….. 5
Chapter (2): Literature Review …….……………………………...…… 6
2.1 Reactive Powder Concrete ………………..……………………….………….. 6
2.2 Advantages of RPC ……………………………………………………………. 7
2.3 Historical Background of RPC ………………………………….……..……… 8
2.4 Applications of RPC ………………………………………….….…………… 11
2.4.1 Sherbrooke Footbridge in Canada ………………..……….…………… 11
2.4.2 Sunyudo Footbridge in Korea …………………………….…………… 11
2.4.3 Sakata-Mirai Footbridge in Japan ……….…………………………….. 11
4.2.4 Shepherds Creek Road Bridge in Australia ………..………...………… 51
VIII
2.5 Materials of RPC ……………………………………………….……………. 12
2.5.1 Portland Cement ………………………………………………………. 12
2.5.2. Silica fume ……………………………………………….…………… 13
2.5.3 Quartz sand ………………………………………………...………….. 55
2.5.4 Crushed quartz …………………………………..…………………….. 55
2.5.5 Superplasticizer …………………………….…………………………. 15
2.5.6. Steel fibers ……………………………………………………………. 17
2.6 Particle Packing ……………………………………………………..……….. 18
2.7 Water-to-binder ratio ………………………………………………………… 20
2.8 Curing regimes ……………………………………...…………...…………… 21
2.9 Properties of RPC ……………………………………………………………. 29
2.9.1 Physical properties ……………………………………………………. 29
2.9.2 Mechanical properties ………………………………………...………. 30
2.10 Mix Designs from Previous Research ……………………………….…...…. 32
2.11 Summary ………………………………………...…………………….…….. 34
Chapter (3): Constituent Materials and Experimental Program ….…35
3.1 Introduction ………………………………………………………….……….. 35
3.2 Experimental Program ………………………………..……………………… 35
3.3 Characterizations of Constituent Materials …………………………….…….. 37
3.3.1 Cement …………………………………………………………..……. 37
3.3.2 Silica Fume ……………………………………………………………. 38
3.3.3 Quartz sand …………………………………...……………………….. 39
3.3.4 Crushed quartz powder ………………………………………..………. 40
3.3.5 Water ………………………………………………………….………. 41
3.3.6 Admixture …………………………………………………..………… 41
3.3.7 Steel fibers ……………………………………………………..……… 42
3.4 Preparation of RPC ……………………………………………………….….. 42
3.5 Equipment and testing procedure ……………………………………………. 43
3.5.1 Tests of Fresh Concrete ……………………………..………..…….…. 44
3.5.2 Tests of Hardened Concrete ……………………………...…………… 46
IX
3.5.3 Curing Tank ……………………………………………..…….………. 53
3.5.4 Curing methods ……………………………………………….……….. 54
Chapter (4) Test Results and Discussion …………………….….…….. 56
4.1 Introduction ………………………………………………………….…..……. 56
4.2 Fresh properties results for Normal Water Curing ……………..……..……… 57
4.2.1 Effect of silica fume and steel fibers on slump flow results ...…......….. 59
4.2.2 Effect of silica fume and steel fibers on V-Funnel results ……….…….. 59
4.2.3 Segregation in the trial mixes ………………………………….……… 60
4.3 Hardened properties results for Normal Water Curing ………………….…… 60
4.3.1 Effects of silica fume and steel fibers on RPC density ……..…..……... 62
4.3.2 Effects of silica fume and steel fibers on RPC compressive strength….. 62
4.3.3 Compressive strength – Time relationship ………………………….… 65
4.3.4 Effects of silica fume and steel fibers on RPC splitting strength ….….. 67
4.3.5 Effects of silica fume and steel fibers on RPC flexural strength …….... 68
4.4 Hardened properties results for duration of heat temperature ………….….…. 69
4.4.1 Effects of curing methods on RPC density ………………..………..… 69
4.4.2 Effects of curing methods on RPC compressive strength ………..……. 70
4.4.3 Effects of curing methods on RPC splitting tensile strength …….……. 72
4.4.4 Effects of curing methods on RPC flexural strength ………………….. 74
Chapter (5) Conclusions and Recommendations …………….…...….. 76
References ……………………………………….………………...……. 81
Appendices ……………………………...………………...…..… ... ……. 91
Appendix A1. Density and Compressive Strength of RPC ………….....…..…. 91
Appendix A2. Density and Splitting Tensile Strength of RPC ………………...97
Appendix A3. Flexural Strength of RPC …………………………….………... 99
X
LIST OF TABLES
Table 4.3 : Mix designs for RPC from past literatures (% by weight) ………..………. 33
Table 3.1 : Cement characteristics according to manufacturer sheet tests…….….…… 37
Table 3.2 : Physical property of quartz sand used ………………………….….……… 40
Table 3.3 : Grading of the Quartz sand used ………………………………….…….… 40
Table 3.4 : Physical properties of the Crushed quartz powder used ………….…..…… 41
Table 3.5 : Grading of the Crushed quartz powder used ………………….….……….. 41
Table 3.6 : The technical data for the "Sika ViscoCrete - 5930" ……………..………. 42
Table 3.7 : Self-compacting criteria (Slump flow) ………………….………….……... 45
Table 3.8 : Self-compacting criteria (T500 test) …………………..……………….….. 45
Table 3.9 : Self-compacting criteria (V-funnel) ……………………..…………….…... 45
Table 4.1 : Best mixture proportions of RPC by weight of cement …………….……... 56
Table 4.2 : One cubic meter components of RPC mixture ……………………….……. 56
Table 4.3 : Different mixes proportions of RPC by weight of cement ……….…...…… 57
Table 4.4 : Components of RPC trial mixture …………………………………….…… 57
Table 4.5 : Fresh properties tests results ………………………………………...…….. 58
Table 4.6 : Hardened properties results of Normal Water Curing ……………….…….. 61
Table 4.7 : Comparison of ratio of (fc) t / (fc) 28 of RPC with the prediction of ACI
Committee 209 of NSC ……………………………………….…..……….. 66
Table 4.8 : Compressive strength of RPC due to curing method ……….……..….…… 70
Table 4.9 : Splitting tensile strength of RPC due to curing method …………...………. 72
Table 4.10: Flexure strength of RPC due to curing method ……………..…….......…… 74
XI
LIST OF FIGURES
Figure 2.1 : The effect of steel fiber on the brittleness of very-high performance concrete……….. 18
Figures 2.2: (a): Schematic of “Apollonian” packing - smaller particles exactly fit into spaces left
by larger particles (b): larger particles of the same class are spaced by the smaller ones
………………...………………………………………………………….………..….. 19
Figure 3.1 : Experimental Program for Trail Mixes ……………………...……………….……… 36
Figure 3.2 : Experimental Program for Curing Methods ……………………..…………...………. 36
Figure 3.3 : Ordinary Portland Cement ………………………………………..……..…………… 38
Figure 3.4 : Silica Fume …………………………………………………..……..………….……... 38
Figure 3.5 : Quartz sand ……………………………………………………..…………...………... 39
Figure 3.6 : Crushed quartz powder ……………………………………………....………….……. 40
Figure 3.7 : Steel fibers ………………………………………………………....…………….…… 42
Figure 3.8 : The drum mixer ………………………………………………..…...………………… 43
Figure 3.9 : Slump cone and base plate ……………………………………..…..………………… 44
Figure 3.10 : V-Funnel ……………………………………..…………………..…………………... 45
Figure 3.11 : Cube specimens ……………………………………………………..………………... 46
Figure 3.12 : Cubes at curing basin ……………………………………………………..………….. 46
Figure 3.13 : Compressive strength test machine …………………………………………..………. 47
Figure 3.14 : Force applied on the 100 mm cube ………………………………………….……….. 47
Figure 3.15 : Split cylinder test setup for cylinder 150 x 300mm …………………………...……… 49
Figure 3.16 : Force applied on cylinder ………………………………………………………..…… 50
Figure 3.17 : Crack in a split cylinder tensile specimen according steel fiber ………………..……. 50
Figure 3.18 : Flexural test specimens (100*100*500mm) ……………………………………..…… 51
Figure 3.19 : Schematic view for flexure test of concrete by center-point loading ……………..….. 52
Figure 3.20 : Heat Curing Tank ………………...………………………………………………..…. 53
Figure 4.1: Effect of silica fume and steel fibers on slump test results ………………..…………. 59
Figure 4.2 : Effect of silica fume and steel fibers on V-funnel time results …………..…………... 60
Figure 4.3 : Effect of silica fume and steel fibers on RPC density ….... 62
Figure 4.4 : Effect of silica fume and steel fibers on RPC compressive strength (7days)…………. 62
XII
Figure 4.5 : Effect of silica fume and steel fibers on RPC compressive strength (14days)………... 63
Figure 4.6 : Effect of silica fume and steel fibers on RPC compressive strength (28days)………... 63
Figure 4.7 : Mean compressive strength Vs. age of mix M3-2 …………………………………..…. 65
Figure 4.8 : Mean compressive strength Vs. age ………………………………………..………… 65
Figure 4.9 : Effect of silica fume and steel fibers on RPC splitting tensile strength at age of 28
Days …………………………………………………………………………………... 67
Figure 4.11 : Effect of silica fume and steel fibers on RPC Flexural strength at age of 28 Days …... 68
Figure 4.31 : Relationship between density and curing methods …………....……………….……... 69
Figure 4.12 : Relationship between compressive strength and age at curing temperature 60 ͦC…….. 70
Figure 4.13 : Relationship between compressive strength and age at curing temperature 75 ͦC…….. 71
Figure 4.14 : Relationship between compressive strength and age at curing temperature 90 ͦC…….. 71
Figure 4.15 : Relationship between splitting tensile strength and temperatures of curing …………. 73
Figure 4.16 : Relationship between flexural strength and temperatures of curing ……………….… 74
1
Chapter (1)
Introduction
1.1 Background
Concrete is a commonly used structural material in construction around the world. Over
the past decade, some research works have been conducted to examine the effects of
cementitious materials that can achieve a higher mechanical performance.
One of the breakthroughs was the development of High Performance Concrete (HPC) ,
which can provide a compressive strength of 50 to 100 MPa (Washer et al., 2004).
Recently, Bouygues in France have developed a new generation of ultra high performance
concrete named Reactive Powder Concrete (RPC) in the mid 1990s .It has a typical
compressive strength of 150 to 200 MPa, which is four times that of Normal Strength
Concrete (NSC). Strengths with up to 810 MPa have also been recorded (Cyr and Shah,
2002).
RPC is recognized as a revolutionary material that can provide a combination of ultra-
high strength, high ductility through the inclusion of short steel fiber reinforcement and
excellent durability (Wong et al., 2007).
The composition of RPC is coarse aggregate-free which differs from that of ordinary
concrete. Instead, fine powders such as quartz sand and crushed quartz, with particle sizes
ranging from 45 to 600 μm are used. In fact, it is rather a mortar than an original concrete
mixture because there is no coarse aggregate.
The term “reactive powder” reflects the fact that all the powder components in RPC react
chemically following casting: cement by conventional hydration; silica fume through
pozzolanic reaction with the resulting calcium hydroxide; quartz sand by providing
dissolved silica for the formation of further Calcium Silicate Hydrate C-S-H gel; crushed
quartz to alter the CaO/SiO2 ratio and favour the formation of tobermorite and xonolite
when RPC is subjected to heat treatment or setting pressure (Lee and Chisholm, 2005) .
2
The ultra-high mechanical performance of RPC can be explained by:
Enhancement of homogeneity of RPC by the elimination of coarse aggregates. It
was suggested that the maximum size of ingredients of RPC should be less than
600 μm (Shaheen and Shrive, 2006).
Enhancement of compacted density by optimizing the granular mixture (Richard
and Cheyrezy, 1995).
Improved matrix properties by addition of pozzolanic admixtures, i.e. silica fume
(Ma and Schneider, 2002).
Improved matrix properties by reducing water-to-binder ratio (Ma and Schneider,
2002).
Enhancement of microstructure by heat treatment after hardening (Shaheen and
Shrive, 2006).
1.2 Statement of the Problem
The usage of Reactive Powder Concrete with high compressive strength in
construction applications has been increasing worldwide and will make an impact in
Gaza Strip due to the limited land area available for construction and the fast growing
population as well.
High-rise reinforced concrete multistory buildings are being increasingly used. The
large loads in high rise buildings lead to the design of large sections when normal
strength concrete is used, but when Reactive Powder Concrete is to be used, small
cross sections can be obtained.
Moreover; finally yet importantly, due to bad and unstable political conditions and the
continuing wars in Gaza Strip, strong, relatively cheap, easy to use and locally
available repairing and strengthening material should be produced for that purposes.
3
1.3 Research Significance
There is significant interest in the development of innovative cementitious materials
that possess superior properties. A relatively new cementitious material, Reactive
Powder Concrete (RPC), is recognized as a revolutionary material that can provide a
combination of ultra-high strength and excellent durability. However, production of
RPC is not yet available in Gaza and limited research is available in this area. If the
RPC, being mixed using local available materials without complicated production
process, exhibits good performances comparable to that in foreign countries, then it
would be beneficial to study their potential use in the construction industry for future
research.
Ordinary concrete includes numerous micro crack that rapidly increase under the
applied stresses. These cracks are responsible for the low tensile and flexural strength.
Therefore, the production of concrete with a high strength and low permeability is of
considerable importance with respect to durability performance.
1.4 Objectives
The main goal of the proposed study is to produce Reactive Powder Concrete (RPC)
in Gaza strip using available local materials, and to study its mechanical properties in
the fresh and hardened stages. This can be achieved through the following objectives:
1. Study the production process of RPC utilizing locally available materials in
Gaza with suitable mixing procedures.
2. Conduct parametric study to determine the effect of mixing steps, silica fume
content, filler materials, admixture dosage, and steel fiber.
3. Obtaining fresh properties of the RPC (Slump, V-Funnel).
4. Obtaining the mechanical properties of hardened RPC including compressive
strength, splitting tensile strength, hardened density, and flexural strength.
5. Study the effect of curing procedure (normal curing, steam curing) :
4
a) To investigate the effect of different curing conditions on the mechanical
properties of Reactive Powder Concrete (RPC).
b) To obtain optimum curing conditions of Reactive Powder Concrete (RPC).
1.5 Methodology
In general, the following methodology was followed:
1. Conduct comprehensive literature review related to the subject of RPC.
2. Selection of suitable local available materials required for producing RPC,
including cement, silica fume, steel fibers and plasticizers.
3. Determine mix proportions to produce RPC.
4. Performing physical and mechanical laboratory tests on RPC samples.
5. Analyze results and draw conclusions.
1.6 Scope of Work
The testing program for this study can be summarized in the following steps:
1.6.1 Characteristics of fresh RPC
In order to obtain the characteristics of fresh RPC, the following aspects will be
considered:
Mix design and materials properties.
Workability, flowability and ability for filling.
Homogeneity (No separation/ segregation)
1.6.2 Characteristics of hardened RPC
The following tests are to be carried out to establish the mechanical properties of
RPC:
Compressive strength
Splitting tensile strength
Flexural strength
Hardened density
5
1.7 Thesis Structure
The research consists of six chapters organized as follows:
Chapter 1 Introduction
This chapter gives a general background about Reactive Powder Concrete,
research problem and scope of work, objectives and methodology used to
achieve the research objectives. In addition, it describes the structure of the
research.
Chapter 2 Literature Review
This chapter discusses definition of Reactive Powder Concrete, definitions of
curing regimes, advantages of RPC , history of RPC, applications and materials
, particle packing and effect of curing, mixing techniques, properties of RPC ,
microstructures of RPC and mechanisms and processes in early age thermal
curing RPC.
Chapter 3 Constituent Materials and Experimental Program
This chapter reviews the materials, which were used in producing Reactive
Powder Concrete and their properties, testing program, equipments used in the
testing procedures and methods of curing.
Chapter 4 Test Results and discussion
This chapter illustrates the test results including the fresh and hardened results,
visual inspection splitting and flexural test results.
Chapter 5 Conclusions and Recommendations
This chapter includes the concluded remarks, main conclusions and
recommendations drawn from this research.
References
Appendices
6
Chapter (2)
Literature Review
2.1 Reactive Powder Concrete
Reactive powder concrete (RPC) is an ultra high performance concrete. It is a relatively
new form of concrete for general applications. The definition of reactive powder concrete
was coined by two French scientists in1994 (Richard and Cheyrezy, 1995; Shaheen and
Shrive, 2006). According to their research, the key characteristics of the material are
enhancement of homogeneity by elimination of coarse aggregates, enhancement of the
compacted density by optimization of the granular mix, possible application of pressure
before and during setting, enhancement of the microstructure by post-set heat-treated and
enhancement of the ductility by incorporating short steel fibers.
Reactive powder concrete mixes are characterized by high silica fume content and very
low water/cement ratio. Coarse aggregate is eliminated to avoid weaknesses of the
microstructure, the addition of superplasticizer is used to achieve a low water/binder
(cement and silica fume) ratio and heat-treatment (steam curing) is applied to achieve high
strength (Lee and Chisholm, 2005).
Owing to the fineness of silica fume and the increased quantity of hydraulically active
components, it has been called Reactive Powder Concrete (Dowd, 1999).
The durability properties of RPC are those of an impermeable material there is almost no
penetration of chlorides and sulphates and high resistance to sulphate attack. Resistance
to abrasion is similar to that of rock. There is almost no shrinkage or creep, which makes
the material suitable for the applications in prestressed concrete.
7
2.2 Advantages of RPC
The ultra-high performance of RPC provides many advantages compared to conventional
concrete as listed in the following:
1. Superior strengths with very high compressive strength of 200 MPa (approximately
four times the strengths of conventional concrete) result in significant savings in dead
load. RPC structures may weight only one-third or one-half of corresponding
conventional concrete structures. Weight reduction is good in producing more slender
transportation structures, reducing overall costs and increasing usable floor space in
high-rise buildings (Rebentrost and Cavill, 2006).
2. Superior ductility and energy absorption (typical values of 300 times greater than that
of HPC and is comparable to those of some metals) provide greater structure reliability
even under overload conditions or earthquakes (Dowd,1999) ; the high energy
absorption characteristics of RPC may also allow improved post-elastic response of
columns, beam-column joints and shear walls (Lee and Chisholm, 2005).
3. Superior durability which leads to long service life with reduced maintenance. RPC is
nearly impermeable, almost no carbonation or penetration of chlorides and sulfates for
RPC. The enhanced abrasion resistance provides extended life for bridge decks and
industrial floors (Dauriac, 1997) ; while the enhanced corrosion resistance provides
protection to areas with bad or harsh climate conditions such as concentrated rain and
snow, and heavy sandstorms (Ji, et al., 2004).
4. Elimination of steel reinforcement bars reduces high labour costs and provides greater
architectural freedom. That means it allows nearly limitless structural member shapes
and forms for the architects and designers (Dauriac, 1997).
5. Reduction of thickness of concrete elements results in material and cost savings
(Yazici, et al., 2009).
6. A significant amount of unhydrated cement in the finished product provides a self-
healing potential under cracking conditions (Dauriac, 1997).
7. The fineness of the RPC product allows high quality surface finishes (Dauriac, 1997).
8
2.3 Historical Background of RPC
Recent developments of concrete technology have made it possible to produce concrete
with compressive strength up to or higher than 100 MPa. These technological
advancement was mainly brought about by the developments in chemical and mineral
admixtures, particularly superplasticizers and silica fume during 70s and 80s (Kwan,
2003).
As stated by Aarsleff et al. (1985), concrete can be subdivided into classes by its
compressive strength as follows:
Low Strength Concrete, i.e. concrete having compressive strength less than 25
MPa.
Normal Strength Concrete, i.e. concrete having compressive strength between
25 MPa and 50 MPa.
High Strength Concrete, i.e. concrete having compressive strength between
50MPa and 100 MPa.
Ultra-High Strength Concrete, i.e. concrete having compressive strength above
100 MPa.
It is possible to make concrete having compressive strength greater than 200 MPa
(Baache, 1981). In such cases, special high strength aggregate, suitable pressure and heat
treatment have to be applied. A value of 810 MPa has been obtained with mixture
incorporating steel aggregate (Richard and Cheyrezy, 1995).
Over the years, much research work has been done to produce composite materials with
high mechanical performance using cementitious materials. High strength concrete (HSC)
columns were first used in the construction of high-rise buildings in the 1970s (Cyr and
Shah, 2002). In many developed countries, concrete producers defined high strength
concrete as a concrete having a 28-day compressive strength of above 45 MPa when the
normal weight aggregate is used (Shannag, 2000).
9
However, the disadvantages of HSC are that workability would be difficult to define and
often declines rapidly with time after mixing; and, high heat evolution of HSC may
necessitate the use of low-heat binders and cooling measures to avoid early age thermal
cracking (Wong, 1996).
Apart from high strength, civil engineers are now demanding concrete with high
performance in other aspects such as high workability, high durability, low heat generation
during curing, etc. High performance concrete (HPC) refers to concrete mixtures with a
water-to-binder ratio as low as 0.3-0.4, so as to obtain 28-day compressive strength as
high as 70-100 MPa or even 1-day compressive strength as high as 45-55 MPa
(Collepardi et al. , 2003).
HPC is often produced with specifically designed matrices, which contain chemical and
mineral admixtures and fiber reinforcement (Cyr and Shah, 2002). The performance
criteria of HPC include high strength and elastic modulus, improved toughness and impact
resistance, high early-age strength, high durability (including low permeability, resistance
to chemical attack and free-thaw damage) and ease of placement and compaction without
segregation.
Owing to the rapid advances in concrete technology, special techniques have been used to
produce concrete with even higher compressive strengths. Ultra-high strength or ultra-
high performance concrete (UHSC or UHPC) is a relatively new cementitious material
with compressive strength more than 150 MPa and possesses other perfect properties (Ma
and Schneider, 2002). Two commonly produced UHSCs are macro-defect-free cement
(MDF) and reactive powder concrete (RPC).
MDF is a mixture of cement and a water-soluble polymer; the high shear mixing causes
a mechano-chemical reaction between the cement and the polymer resulting in tensile
strengths up to 200 MPa (Cyr and Shah, 2002), in particular when mixed with aluminous
cements (Birchall, 1983). The main drawback of this concrete was that the mechanical
10
properties was diminished after contact with water, and thus eventually did not have any
practical applications (Cwirzen et al., 2008).
RPC is an ultra-high strength superplasticized silica fume concrete characterized by an
extremely dense microstructure and with compressive strengths in excess of 200 MPa
(Shaheen and Shrive, 2006). Strengths as high as 810 MPa have been recorded by
Semioli (2001).
RPC is prepared following a completely different approach. It is a coarse aggregate-free
mixture, which is different from that of ordinary concrete. Instead, fine powders such as
quartz sand, crushed quartz and silica fume, with particle size ranging from 0.1 to 600 μm
are used. The grain size distribution of different powders is carefully optimized in order
to achieve a mixture of very high compactness or to increase the matrix density (Richard
and Cheyrezy, 1994).
Superplasticizer is used to reduce the w/b ratio to 0.2 as compared with w/b ratio of 0.4-
0.5 for normal strength concrete (Cyr and Shah, 2002).
High-strength steel fibers or non-metallic fibers maybe included to improve its ductility
(Rebentrost and Cavill, 2006). Application of pressure and heat curing are optional
measures designed to enhance the performance (Richard and Cheyrezy, 1995).
RPC was originally developed by Rhodia, Lafarge and Bouygues, the parent company of
VSL, and is a registered trademark under the name of Ductal (Rebentrost and Cavill,
2006). Rebentrost and Cavill (2006) reported that the durability properties are in
multiple folds of magnitude better than current high performance concrete.
11
2.4 Applications of RPC
2.4.1 Sherbrooke Footbridge in Canada
Sherbrooke Footbridge in Quebec in Canada was the world’s first major structure to be
built with Reactive Powder Concrete (RPC) in 1997 (Blais and Couture, 1999). Spanning
60 m, this precast, prestressed pedestrian bridge is a post-tensioned open-web space RPC
truss.
2.4.2 Sunyudo Footbridge in Korea
The Sunyudo (Peace) Footbridge in Seoul in Korea is the largest RPC bridge in the world
with a single span of 120m (Rebentrost and Cavill, 2006). The bridge contains no
ordinary reinforcement. During construction, all segments were prefabricated next to the
erection site in the area containing batching facilities, steel formwork and heat treatment
chamber (Rebentrost and Cavill, 2006).
2.4.3 Sakata-Mirai Footbridge in Japan
Sakata-Mirai Footbridge in Sakata in Japan does not use any passive reinforcement. It is
extremely light with dead weight of only 56 tones, which is approximately one-fifth of the
dead load of an equivalent conventional prestressed concrete structure and results in an
economic advantage of around 10% (Jungwirth, 2005).
2.4.4 Shepherds Creek Road Bridge in Australia
The Shepherds Creek Road Bridge in Australia replaces an existing timber bridge. The
slab is placed onto a thin permanent precast RPC formwork panels that span between the
beams. The beams weigh only 4.2 tones over a length of 15.1 m, compared to about nine
tones for a conventional prestressed beam. In addition, the permanent formwork slabs are
extremely light and provide a highly durable soffit to the deck (Rebentrost and Cavill,
2006).
12
2.5 Materials of RPC
Materials used for producing RPC containing large amounts of binder (i.e. cement). Silica
fume, quartz powder …etc. are used as filler materials. Fibers added to improve the
mechanical properties.
To ensure and improve the self-leveling and high workability properties, without causing
segregation; Large amounts of superplasticizers are to be used.
2.5.1 Portland Cement
As the cement content in RPC is generally as high as 700 – 1000 kg/m3 (Collepardi et
al., 2003), the choice of cement could be a critical factor affecting the performance of
RPC. It is reported that the ideal cement should have a high C3S and C2S (di & tri-calcium
silicate) content with very low or zero C3A (tri-calcium aluminate) content (Kwan,
2003). Lee and Chisholm (2005) explained that C3A has little intrinsic value as a binding
agent and is primarily included in cement due to its role as a flux during the calcination
process.
The high cement content of RPC 700 – 1000 kg/m3 compared to 300 – 500 kg/m3 of
ordinary concrete would cause the generation of a large amount of heat of hydration during
curing and subsequently thermal cracking when the concrete starts to cool down (Kwan,
2003).
Moreover, the large cement paste volume would cause large shrinkage and swelling strains
when the moisture condition of concrete changes (Kwan, 2003). This means that the
concrete would result in a lower dimensional stability. Therefore, Kwan (2003) stated that
adding more cement to reduce the water/cement ratio and increase the concrete strength
is not the best way to produce concrete with high strength; concrete strength should be
increased without significant increase in cement content. Yazici et al. (2009) suggested
that partial replacement of cement by mineral admixtures could be a feasible solution to
overcome these problems in RPC.
13
When Portland cement is mixed with water, its constituent compounds undergo a series
of chemical reactions that are responsible for the eventual hardening of concrete.
Reactions with water are designated hydration, and the new solids formed on hydration
are collectively referred to as hydration products (Mindess et al., 2003).
In Portland cement, the hydration of tricalcium aluminate C3A involves reactions with
sulfate ions that are supplied by the dissolution of gypsum, which is added to temper the
strong initial reaction of C3A with water that can lead to flash set.
2.5.2. Silica fume
Silica fume is known as an admixture to concrete to increase the compressive strength. It
is effect material in reducing deleterious alkali silica expansion. Silica fume effect on the
properties of fresh concrete also it has a lesser propensity for segregation than concrete
without silica fume will not significantly change the unit weight of concrete and increase
permeability for plastic shrinkage cracking.
Observation has exhibited that there is a no increase or little increase in strength as for the
long term. Silica fume has improved the flexural strength of the concrete. The splitting
tensile strength has not exhibited an improvement in the silica fume mixtures. Silica fume
is a by-product of silicon metal or silicon-alloy metal factories. Although the silica fume
is a waste of industrial materials, it became the most valuable by-product between the
pozzolanic materials due to its high pozzolanic property. Actually, silica fume is widely
used in concrete or cement as an admixture (Turkmen, 2003).
Concrete materials containing silica fume and found that they have a higher resistance to
water transporting with comparison to concrete materials without silica fume. Silica fume
is added as it changes the microstructure of the concrete. These changes occur due to two
reasons; the first one is the physical aspect of SF, and the second is the chemical
contribution. However, the physical aspect of silica fume and chemical contribution is
equally important processes (Tan and Gjorv, 1996).
14
Silica fume leads to changes in the microstructure of the concrete. These changes are
consequences of two different but equally important processes; physical aspect of SF, and
chemical contribution. The physical phase of this action enhances the void system of
cement paste, particularly; the transition zone .The result of this work from SF provides
significant improvement in the compressive strength, flexural strength, in addition to other
significant improvement in durability and impermeability (Pigeon and Plante, 1989).
The mortar that containing silica fume (SF) as a partial replacement for cement has
increased its compressive strength. In addition, it was found that silica fume (SF)
strengthens the bond between the cement paste and the aggregate. They also added that
the partial replacement of cement by silica fume (SF) and the addition of super plasticizer
would increase the strength of mortar (Toutanji and El-Korchi, 1995).
The silica fume (SF) has four main functions in the use of concrete technology as follows:
(Gonen and Yazicioglu, 2009).
1. Filling the voids between the large class particles (cement).
2. Improving the resistance of concrete and the durability of concrete, by reducing
the permeability of the cement paste matrix.
3. Producing secondary hydration with the lime resulting from the primary hydration.
4. Making the concrete more resistant to abrasive forces, and reducing the expansion
generated by alkali-aggregate.
Papadakis (1999) reported that concrete containing 18% silica fume by weight of cement
is enough for total consumption of Ca(OH)2 released from cement hydration. However,
considering the filler effect, the optimal share of silica fume is about 30% of cement
(Richard and Cheyrezzy, 1995). Therefore, silica fume content in RPC is normally 20-
30% of the weight of cement.
15
2.5.3 Quartz sand
Quartz is the major form of pure silica in nature and is a very hard material with hardness
of seven on the Mohs scale and density of 2.65 g/cm3 (Wikipedia, 2009). This can explain
the high stiffness of RPC. Richard and Cheyrezzy (1995) reported that quartz also offers
the advantages of excellent paste/aggregate interfaces, readily available and low cost.
They also suggested that the particle size range of quartz sand is between 150 and 600 μm,
in order to prevent interference with largest cement particles (80-100 μm).
2.5.4 Crushed quartz
The presence of fine particles of mineral admixture in fresh concrete leads to considerable
improvement in rheological properties, such as cohesiveness and workability (Wong,
1996). Crushed quartz, a kind of mineral admixture, was incorporated which helps to
reduce bleeding and segregation. Bleeding and segregation are the major source of
inhomogeneous microstructure of hydrated cement paste (Wong, 1996).
Richard and Cheyrezzy (1995) reported that crushed crystalline quartz powder with a
mean particle size of 10 μm (same granular class as cement) is an essential ingredient
especially for heat-treated RPC. As reported by Lee and Chisholm (2005), additional
silica such as crushed quartz is necessary to modify the CaO/SiO2 ratio of the binder.
These powdered quartz flour with a mean particle size of about 10 to 15 μm was especially
activated at high temperatures of about 250°C (Zanni et al., 1996).
2.5.5 Superplasticizer
Superplasticizers (high range water reducers) are chemical admixtures that can be added
to concrete mixtures. Superplasticizer influences the fresh and hardened concrete
properties. They:
1. Increase workability.
2. Produce stronger concrete.
3. Reduce the amount of water added to the mixture.
16
The advantages of superplasticizer when used in the concrete are the following:
1. The production of concrete that has a high workability for placement.
2. The production of RPC with normal workability with lower water content.
3. The production of a mixture, which has a combination of better than normal workability
and lower than the normal amount of water or, which is with less cement but has a normal
strength and workability (Ramachandran, 1984).
Superplasticizers are high-range water reducers composed of powerful organic polymers
used to disperse cement particles and silica fume, improving the flowability of UHPFC
mixtures (Aitcin et al., 2000). Subsequently, superplasticizer can allow a lower
water/cement ratio and lower water/binder ratio (binder includes cement and silica fume)
to be used without loss the workability of the mixture. Since UHPFC uses such low
water/cement ratio and lower water/binder ratio, the optimum amount of superplasticizer
is relatively high, with a solid content of approximately 1.6 percent of the cement content
(Richard and Cheyrezzy, 1995).
Concrete with normal requirements can be produced using traditional superplasticizers
like Vinylcopolymers or Melamine sulfonate. However, for the Ultra-high performance
of special concretes requires the use of special polymers. Among these special polymers
the polycarboxylate-type plasticizers has become the most widely used polymers recently.
The molecular structure of the new polymers differs completely from conventional ones
(Yamada, 2000).
The polymers on the other hand typically feature short principle chains containing ionic
functions and very long polyether type side chains that can separate particles by strong
steric repulsion. Considering the manifold properties of a polymer like molecular weight
of the whole polymer, backbone or side chains, ionic strength, chemical composition or
production conditions, an extraordinary variety of special performing polymers is feasible
(Maeder and Schober, 2003).
17
Lee and Chisholm (2005) reported that Sika ViscoCrete-5 was selected as the most
suitable SP for RPC on the advice of Sika NA Ltd. This is described as an aqueous
modified carboxylate, designed specifically for ultra-high water reduction applications. A
dosage of as high as 2% is necessary.
Production of a cohesive and flowing RPC mix requires extremely large quantities of
superplasticizer compared to high performance or self compacting concrete (Lee and
Chisholm, 2005). Without the addition of superplasticizer (SP), cement grains are usually
flocculated throughout the cement paste when water is added. This is because the flocs
trap water, and the cement paste become less mobile and fluidity decreases. When SP is
added, the cement grains disperse evenly throughout the matrix, and the fluidity of the
cement paste is enhanced; as a result, less water may be needed to maintain the same level
of workability (Lok, 2007).
Richard and Cheyrezzy (1995) mentioned that the optimal superplasticizer ratio is high
and solid content is approximately 1.6% of cement content. On the other hand, Collepardi
et al. (1990) found that a change from 2 to 4% superplasticizer dosage rate significantly
increases compressive strength in the presence of silica fume for high strength concrete.
However, over dosage of superplasticizer can lead to chemical incompatibility problems
and excessive retardation of the setting time (Kwan, 2003).
2.5.6. Steel fibers
The high brittleness is the biggest disadvantage of concretes, especially of very-high-
strength concrete (Long et al., 2002). It has been reported that the only really practical
solution to the brittleness exhibited by all high strength cement-based materials is to
incorporate fibers into the matrix (Huang and Shen, 1983). The ductility is enhanced
through the incorporation of steel fibers in RPC matrix (Richard and Cheyrezzy, 1995).
According to Hannant et al. (1983) and Majmudar and Laws (1983), addition of small
quantities of fibers (in the range of 1-6% by volume) to a concrete mix has relatively little
18
effect on strength; the real purpose of adding fibers is to increase the toughness (the total
energy absorbed in breaking a specimen). The steel fibers used are normally 13 mm long
with a diameter of 0.15 to 0.2 mm (Richard and Cheyrezzy, 1995).
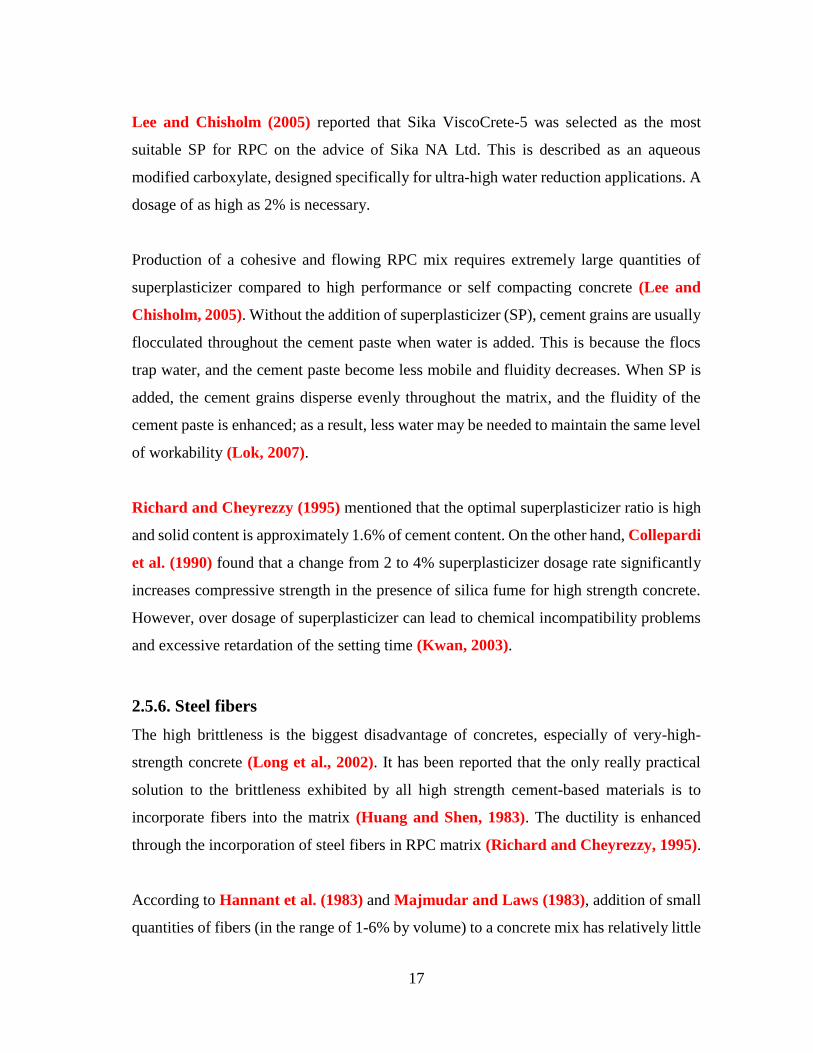
Richard and Cheyrezzy (1995) stated that the economic optimum corresponds to a ratio
of 2% by volume. Long et al. (2002) found that the flexural strength to compressive
strength ratio increases with the increase in steel fibers content. Moreover, they found that
the greater the length to diameter ratio (L/D) of steel fibers, the better the toughness of
very-high performance concrete is. It can be shown in Figure 2.1.
Figure 2.1: The effect of steel fiber on the brittleness of very-high performance
concrete (Long et al., 2002)
2.6 Particle Packing
The composition of RPC differs from that of HPC with the absence of coarse aggregates.
Instead, fine powders such as quartz sand and crushed quartz, with particle sizes ranging
from 45 to 600 μm are used. Lee and Chisholm (2005) stated that the performance of
RPC strongly depends on the optimization of packing of powder constituents; size classes
for granular materials are tightly constrained, with mean particle diameters differing by at
least an order of magnitude.
19
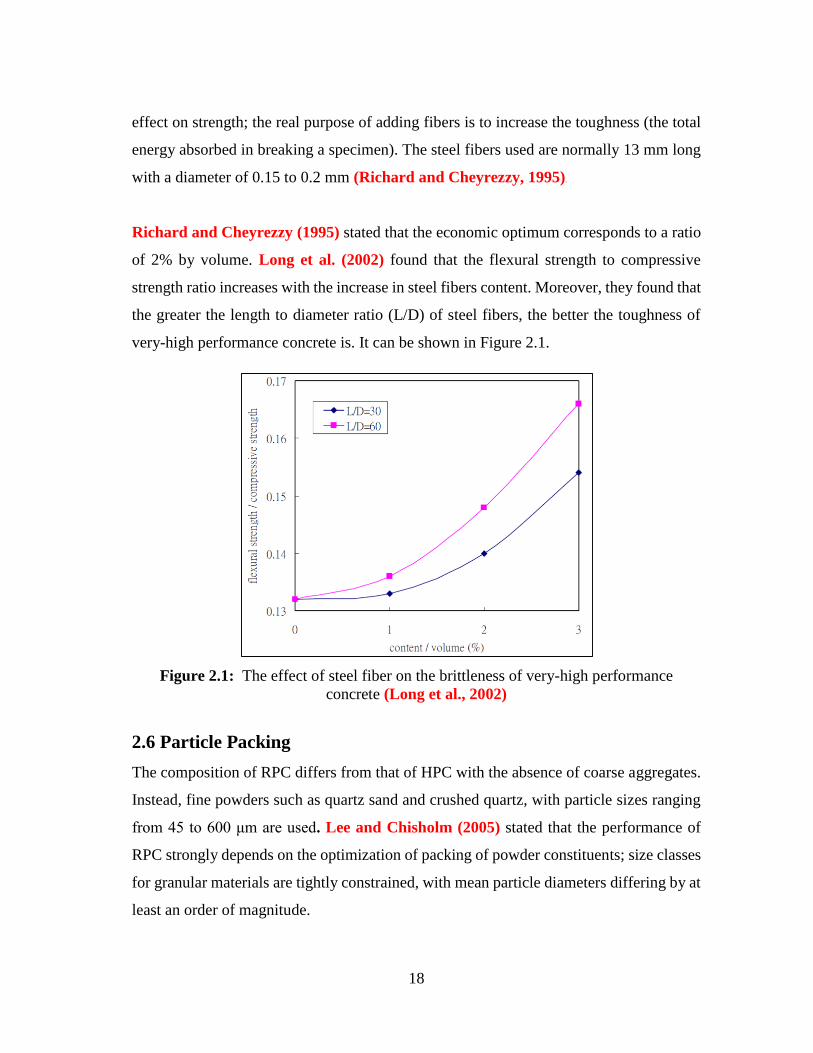
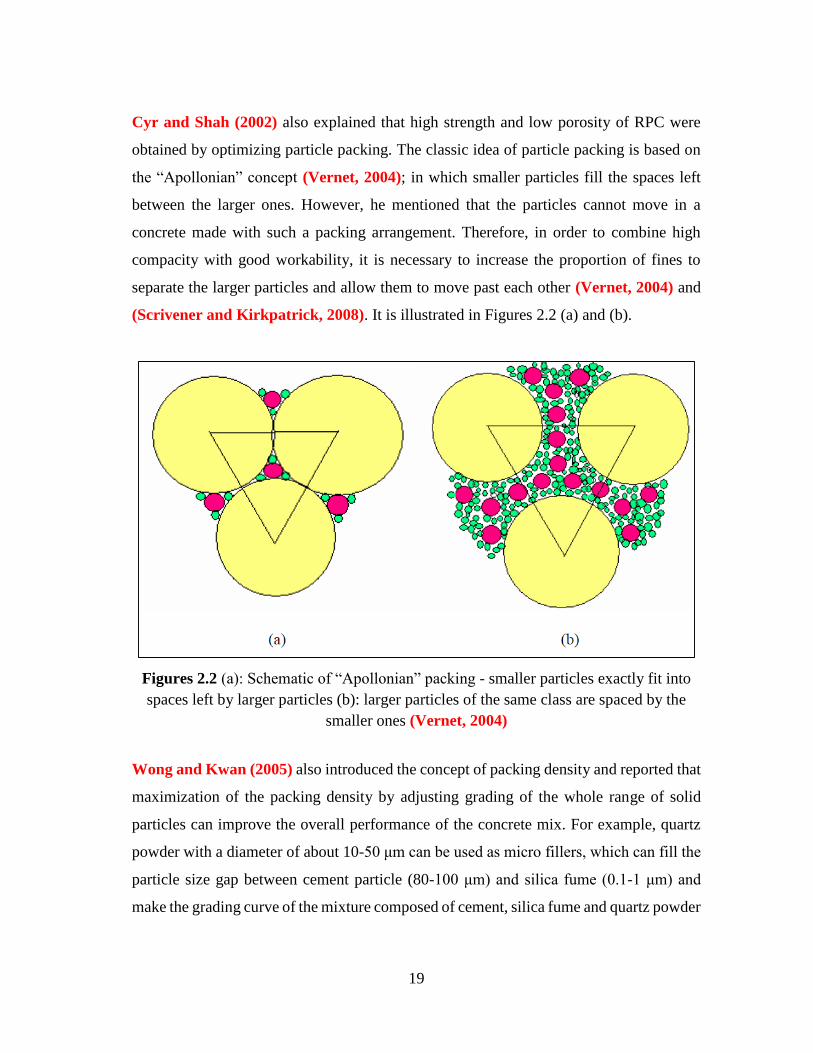
Cyr and Shah (2002) also explained that high strength and low porosity of RPC were
obtained by optimizing particle packing. The classic idea of particle packing is based on
the “Apollonian” concept (Vernet, 2004); in which smaller particles fill the spaces left
between the larger ones. However, he mentioned that the particles cannot move in a
concrete made with such a packing arrangement. Therefore, in order to combine high
compacity with good workability, it is necessary to increase the proportion of fines to
separate the larger particles and allow them to move past each other (Vernet, 2004) and
(Scrivener and Kirkpatrick, 2008). It is illustrated in Figures 2.2 (a) and (b).
Figures 2.2 (a): Schematic of “Apollonian” packing - smaller particles exactly fit into
spaces left by larger particles (b): larger particles of the same class are spaced by the
smaller ones (Vernet, 2004)
Wong and Kwan (2005) also introduced the concept of packing density and reported that
maximization of the packing density by adjusting grading of the whole range of solid
particles can improve the overall performance of the concrete mix. For example, quartz
powder with a diameter of about 10-50 μm can be used as micro fillers, which can fill the
particle size gap between cement particle (80-100 μm) and silica fume (0.1-1 μm) and
make the grading curve of the mixture composed of cement, silica fume and quartz powder
20
continuous (Ma and Schneider, 2002). This implies that powder mixture should be
composed of a number of classes of granular powder in order to enhance the packing
density.
In general, the higher the packing density, the smaller will be the amount of water needed
to fill up the voids between the particles and the better will be the performance of the
concrete mix (Kwan, 2003).
Similar findings were reported by Wong and Kwan (2005) that an increase in packing
density of particles would improve the overall performance of concrete, which is
summarized in the following:
Reduction in water demand and thus allowing the use of a lower water/cement
ratio for achieving higher strength;
Reduction in the permeability of the bulk cementitious materials and thus bleeding
of fresh cement paste;
Reduction in the porosity of transition zone by filling up the voids;
Increase in workability of concrete mix under the same water/cement ratio;
Improvement in cohesiveness and thus the concrete mix would be less likely to
segregate during placing.
2.7 Water-to-binder ratio
Water demand is the main parameter for assessing the quality of the granular mixture of
RPC. That is, the minimum quantity of water which must be added to the powders to
obtain fluidification (Richard and Cheyrezy, 1995). Both the strength and workability
of a concrete mix depend on the water-to-binder (w/b) (cement + silica fume) or water-to-
cement (w/c) ratio of the mix (Kwan, 2003). W/c ratio is usually replaced by the w/b ratio
to account for the incorporation of silica fume and quartz powder to the strength
development of RPC (Liu and Huang, 2008).
21
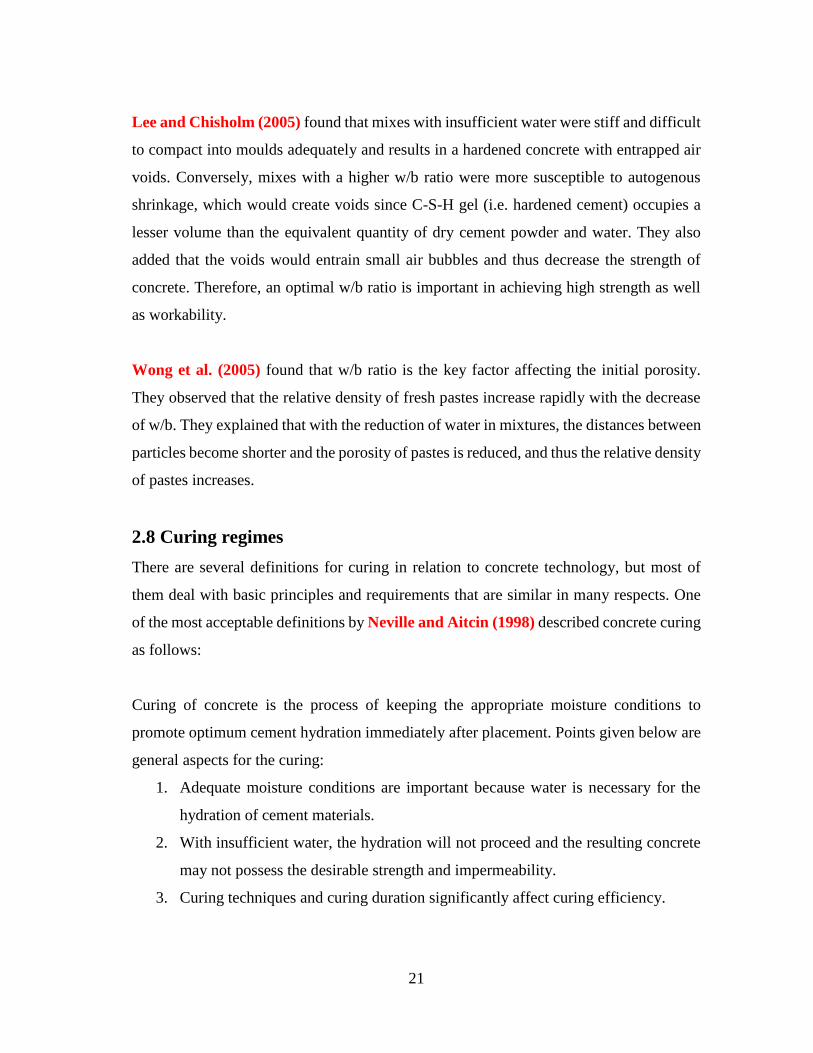
Lee and Chisholm (2005) found that mixes with insufficient water were stiff and difficult
to compact into moulds adequately and results in a hardened concrete with entrapped air
voids. Conversely, mixes with a higher w/b ratio were more susceptible to autogenous
shrinkage, which would create voids since C-S-H gel (i.e. hardened cement) occupies a
lesser volume than the equivalent quantity of dry cement powder and water. They also
added that the voids would entrain small air bubbles and thus decrease the strength of
concrete. Therefore, an optimal w/b ratio is important in achieving high strength as well
as workability.
Wong et al. (2005) found that w/b ratio is the key factor affecting the initial porosity.
They observed that the relative density of fresh pastes increase rapidly with the decrease
of w/b. They explained that with the reduction of water in mixtures, the distances between
particles become shorter and the porosity of pastes is reduced, and thus the relative density
of pastes increases.
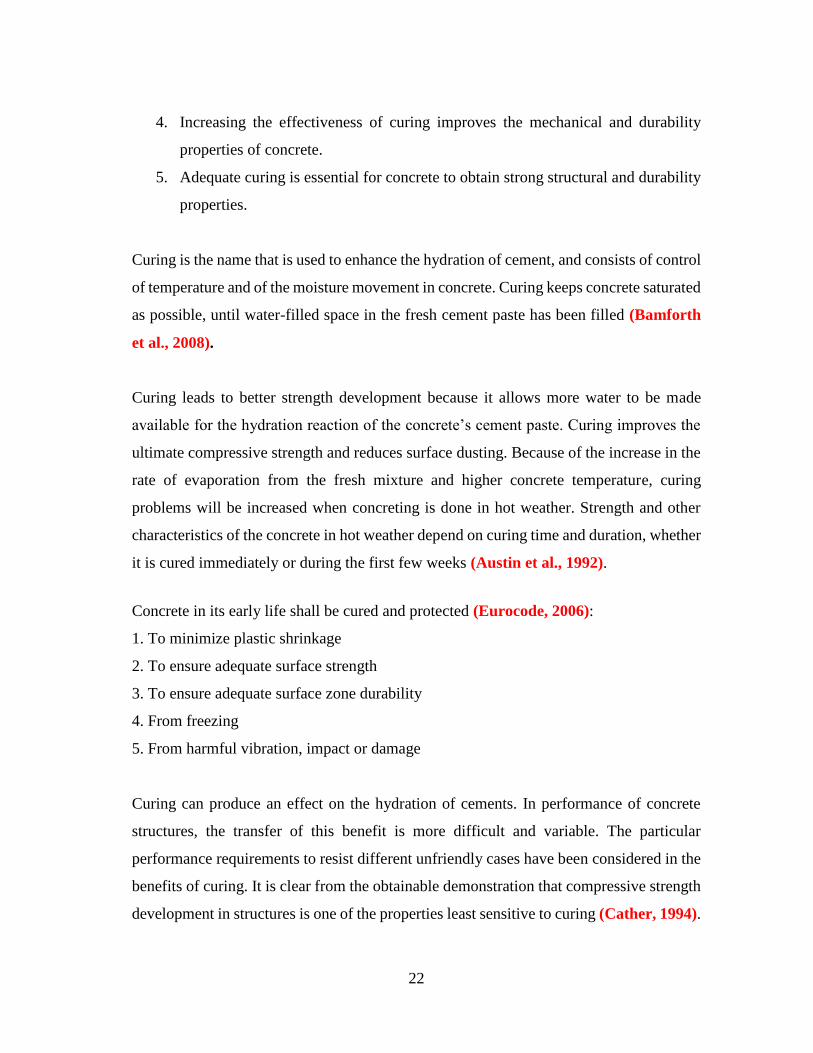
2.8 Curing regimes
There are several definitions for curing in relation to concrete technology, but most of
them deal with basic principles and requirements that are similar in many respects. One
of the most acceptable definitions by Neville and Aitcin (1998) described concrete curing
as follows:
Curing of concrete is the process of keeping the appropriate moisture conditions to
promote optimum cement hydration immediately after placement. Points given below are
general aspects for the curing:
1. Adequate moisture conditions are important because water is necessary for the
hydration of cement materials.
2. With insufficient water, the hydration will not proceed and the resulting concrete
may not possess the desirable strength and impermeability.
3. Curing techniques and curing duration significantly affect curing efficiency.
22
4. Increasing the effectiveness of curing improves the mechanical and durability
properties of concrete.
5. Adequate curing is essential for concrete to obtain strong structural and durability
properties.
Curing is the name that is used to enhance the hydration of cement, and consists of control
of temperature and of the moisture movement in concrete. Curing keeps concrete saturated
as possible, until water-filled space in the fresh cement paste has been filled (Bamforth
et al., 2008).
Curing leads to better strength development because it allows more water to be made
available for the hydration reaction of the concrete’s cement paste. Curing improves the
ultimate compressive strength and reduces surface dusting. Because of the increase in the
rate of evaporation from the fresh mixture and higher concrete temperature, curing
problems will be increased when concreting is done in hot weather. Strength and other
characteristics of the concrete in hot weather depend on curing time and duration, whether
it is cured immediately or during the first few weeks (Austin et al., 1992).
Concrete in its early life shall be cured and protected (Eurocode, 2006):
1. To minimize plastic shrinkage
2. To ensure adequate surface strength
3. To ensure adequate surface zone durability
4. From freezing
5. From harmful vibration, impact or damage
Curing can produce an effect on the hydration of cements. In performance of concrete
structures, the transfer of this benefit is more difficult and variable. The particular
performance requirements to resist different unfriendly cases have been considered in the
benefits of curing. It is clear from the obtainable demonstration that compressive strength
development in structures is one of the properties least sensitive to curing (Cather, 1994).

23
The curing period consists of two stages; initial and final stage. Initial stage of curing
depends on action taken between placement and final finishing of concrete to reduce the
loss of moisture from the surface of the concrete. The final stage of curing depends on
action taken between the final finishing and termination of curing. The ACI 308
recommended a wet curing period of 7 days for most structural concretes and a period of
14 days for structural concretes containing supplementary cementing materials. Curing is
also used quite regularly in the industry. In this method, evaporation of water can be
prevented by using polyethylene sheets and curing compounds (ACI, 1998).
If a concrete has insufficient water at the early age, it cannot gain the properties and
durability for its long term service. Appropriate curing helps to reduce the porosity and
drying shrinkage of concrete, and to achieve higher strength and greater resistance.
Therefore, a suitable curing method such as, water pounding, spraying of water, or
covering with wet burlap and plastic sheet is essential in order to produce a strong and
durable concrete (Safiuddin et al. 2000) .
Steam curing is useful in terms of the early strength in concrete, which is important when
additional heat is required to complete the hydration as in the case of cold weather (Naik,
2005). Accelerated curing reduces costs and curing time in the fabrication of pre-cast
members.
Concrete derives its strength by the hydration of cement particles. The hydration of cement
is not a momentary action but a continuing process for a long time and requires water and
proper temperature. The rate of hydration is fast to start with, but continues over a very
long time at a decreasing rate. The quantity of the product of hydration and consequently
the amount of gel formed depends upon the extent of hydration (Shetty, 1982).
The curing allows the hydration to be continued and consequently, continued gains in
concrete strength. In fact, once curing stops the concrete dries out and the strength gain
stops (Mamlouk and Zaniewski, 1999).
24
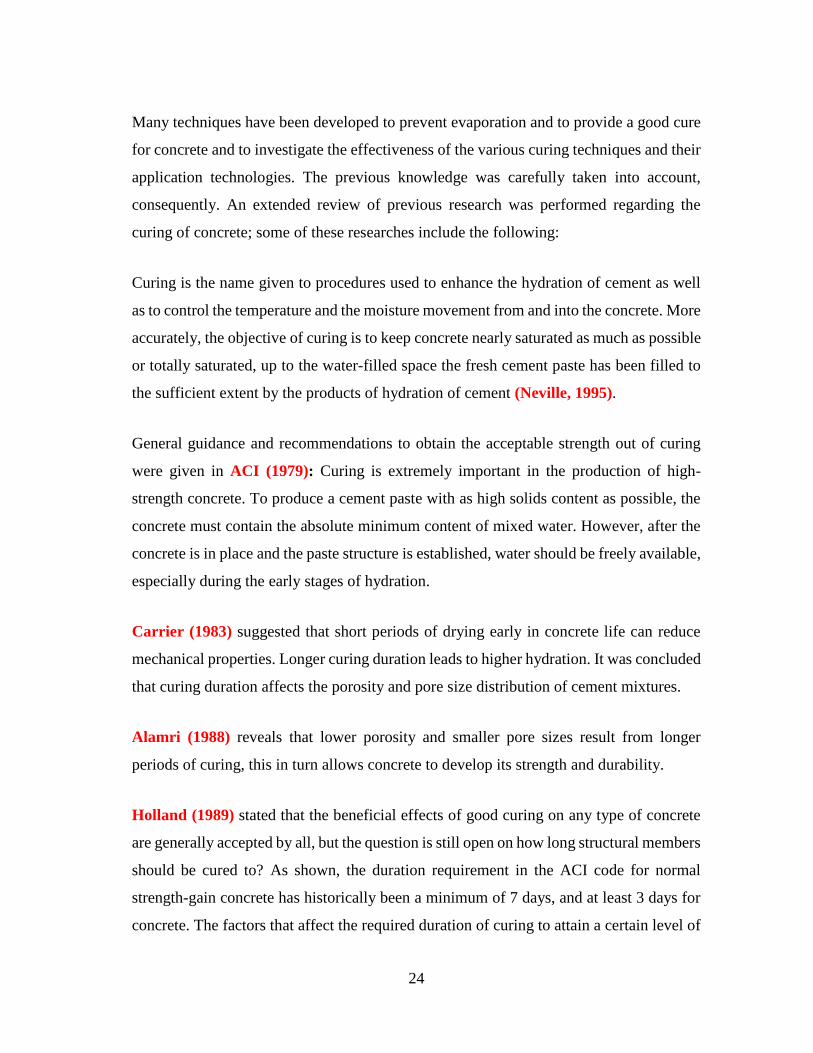
Many techniques have been developed to prevent evaporation and to provide a good cure
for concrete and to investigate the effectiveness of the various curing techniques and their
application technologies. The previous knowledge was carefully taken into account,
consequently. An extended review of previous research was performed regarding the
curing of concrete; some of these researches include the following:
Curing is the name given to procedures used to enhance the hydration of cement as well
as to control the temperature and the moisture movement from and into the concrete. More
accurately, the objective of curing is to keep concrete nearly saturated as much as possible
or totally saturated, up to the water-filled space the fresh cement paste has been filled to
the sufficient extent by the products of hydration of cement (Neville, 1995).
General guidance and recommendations to obtain the acceptable strength out of curing
were given in ACI (1979): Curing is extremely important in the production of high-
strength concrete. To produce a cement paste with as high solids content as possible, the
concrete must contain the absolute minimum content of mixed water. However, after the
concrete is in place and the paste structure is established, water should be freely available,
especially during the early stages of hydration.
Carrier (1983) suggested that short periods of drying early in concrete life can reduce
mechanical properties. Longer curing duration leads to higher hydration. It was concluded
that curing duration affects the porosity and pore size distribution of cement mixtures.
Alamri (1988) reveals that lower porosity and smaller pore sizes result from longer
periods of curing, this in turn allows concrete to develop its strength and durability.
Holland (1989) stated that the beneficial effects of good curing on any type of concrete
are generally accepted by all, but the question is still open on how long structural members
should be cured to? As shown, the duration requirement in the ACI code for normal
strength-gain concrete has historically been a minimum of 7 days, and at least 3 days for
concrete. The factors that affect the required duration of curing to attain a certain level of
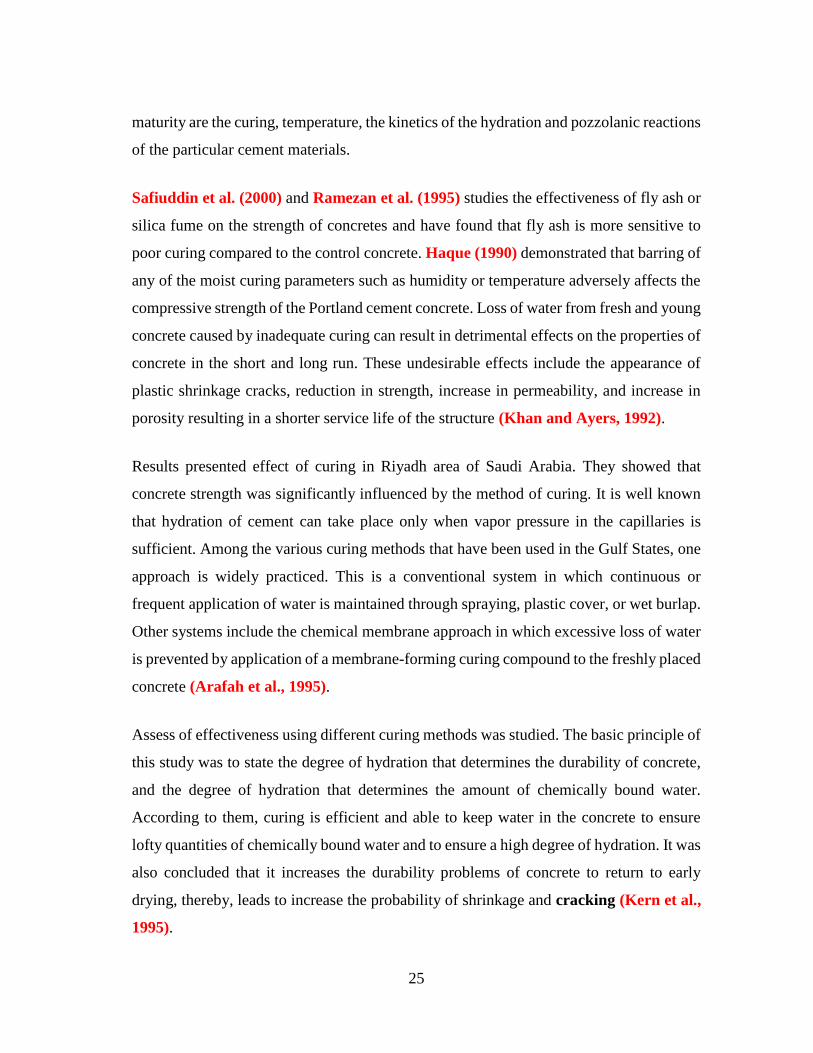
25
maturity are the curing, temperature, the kinetics of the hydration and pozzolanic reactions
of the particular cement materials.
Safiuddin et al. (2000) and Ramezan et al. (1995) studies the effectiveness of fly ash or
silica fume on the strength of concretes and have found that fly ash is more sensitive to
poor curing compared to the control concrete. Haque (1990) demonstrated that barring of
any of the moist curing parameters such as humidity or temperature adversely affects the
compressive strength of the Portland cement concrete. Loss of water from fresh and young
concrete caused by inadequate curing can result in detrimental effects on the properties of
concrete in the short and long run. These undesirable effects include the appearance of
plastic shrinkage cracks, reduction in strength, increase in permeability, and increase in
porosity resulting in a shorter service life of the structure (Khan and Ayers, 1992).
Results presented effect of curing in Riyadh area of Saudi Arabia. They showed that
concrete strength was significantly influenced by the method of curing. It is well known
that hydration of cement can take place only when vapor pressure in the capillaries is
sufficient. Among the various curing methods that have been used in the Gulf States, one
approach is widely practiced. This is a conventional system in which continuous or
frequent application of water is maintained through spraying, plastic cover, or wet burlap.
Other systems include the chemical membrane approach in which excessive loss of water
is prevented by application of a membrane-forming curing compound to the freshly placed
concrete (Arafah et al., 1995).
Assess of effectiveness using different curing methods was studied. The basic principle of
this study was to state the degree of hydration that determines the durability of concrete,
and the degree of hydration that determines the amount of chemically bound water.
According to them, curing is efficient and able to keep water in the concrete to ensure
lofty quantities of chemically bound water and to ensure a high degree of hydration. It was
also concluded that it increases the durability problems of concrete to return to early
drying, thereby, leads to increase the probability of shrinkage and cracking (Kern et al.,
1995).
26
High temperature curing delays the hydration from the cement in the later ages and forms
an open pore structure of cement paste. Accordingly, it affects the properties of hardened
concrete (Kelham, 1996). Continuous pore structure may be formed from the early drying
of concrete, which will stop the cement hydration before the pores are decreased by
hydration.
The concrete cover is more prone to lose water because it is sensitive to drying. Curing
properties of hardened concrete are affected by the curing conditions and temperature.
Proper curing not only reduces the rate of water evaporation, moreover, it provides a
continuous source of moisture for the hydration that reduces the porosity and provides a
finer size distribution in the concrete (Neville and Aitcin, 1998). The compressive
strength, modulus of elasticity, and flexural strength of concrete will decrease at later ages
if curing is neglected in the early age of hydration caused by this compensate the loss
(Aitcin et al., 2000).
Houssam and Ziad (1999) investigated the effect of three different methods of curing
procedures on the properties of concrete. The methods used were steam curing, air curing
and moist curing. They were determent the mechanical properties of concrete such;
compressive strength, flexural strength, and permeability.
The steam curing method has the best results to improve the properties of concrete, while
moist curing exhibited favorable effects when compared to air curing. If a concrete is not
well cured particularly at the early age, it would not gain the properties and durability at
the desired level due to a lower degree of hydration. Thereby, the concrete wouldn’t
comply with the standard specifications (Safiuddin et al., 2000).
Although curing is an important aspect in the production of a good concrete, the timing
and duration of curing is even more important (Kovler et al., 2000). It is demonstrated
that if an interruption happens during the curing, a significant concrete strength could be
27
regained by curing of concrete. Nevertheless, the detrimental effects resulted from the lack
of proper early curing are irreversible, and the strength gained by curing is lower.
Safiuddin et al. (2007) investigated the effect of different curing methods on the
properties of micro silica concrete. Three curing methods were used; namely, dry air
curing, wrapped curing, and water curing which was applied at 20 ºC to cure the cube and
cylinder specimens up to the day of testing. The cube specimens were tested to determine
the initial surface absorption of the concrete and hardened density.
Furthermore, cylinder specimens were tested to determine the following parameters;
compressive strength, dynamic modulus of elasticity, splitting tensile and rate of moisture
movement of micro silica concrete. Researchers also add that, water curing and wrapped
curing perform better than dry-air curing; the reason for this phenomenon is that the rate
of moisture movement was significant when the specimens were subjected to dry-air
curing. Therefore, the hydration process was hindered and consequently affects the
compressive strength and other properties of the concrete. Consequently, it was suggested
that the concrete that contain silica fume should be cured by water curing to achieve well
hardened properties.
Mechanical properties were independent of age at which thermal treatment was applied as
well as the age at which the specimen was tested by following thermal treatment. This will
have a large impact on how UHPC is used in industry, by allowing a precaster to cast
several elements over a period of time and then thermally treat them simultaneously,
allowing more flexibility in the casting and curing sequence (Ahlborn et al., 2008).
Roy and Gouda (1973) investigated the effects the effects of high temperature curing on
cement pastes. Their experimental results indicated that heat curing enables rapid cement
hydration. More recently, Cheyrezy et al. (1995) reported that heat treatment greatly
affects the hydrated microstructures and in turn porosity of RPC. With additional pressure,
application during casting and setting the resulting porosity is negligible.
28
Without heat treatment Gilbertm et al. (2000) reported that RPC suffers endogenous
shrinkage (approximately -500 µs) occurring over a considerable period of time. Heat
treatment catalyses this shrinkage over a shorter period alleviating concerns of shrinkage
after curing.
Cwirzen, 2007 studied the influence of curing regime on the mechanical properties of
ultra high performance concrete. Nine different curing methods were tried with variation
in heat treatment, variation in water to binder ratio, with variation of filler materials like
silica fume and fine quartz.
The microstructure of the specimens was investigated by electron microscope and
mercury intrusion porosimeter scan. Results revealed that increase in heat treatment
periods decreases the hydration processes and refine the microstructure. This results in
higher compressive strength. The scanning electron microscope investigation revealed the
formation of one hydration rim around anhydrous cement particles and the presence of a
hollow shell in all investigated specimens.
Lawend et al. (2013) studied the effect of different curing methods, six types of curing
methods are explained such as: steam curing one day delay, steam curing two days delay,
boiling water curing, fog curing, water curing, and finally normal curing. As a result,
steam and boiling methods proportionally increases the mechanical properties of UHPFC,
in the first ages of curing. This means that both curing methods accelerating the rate of
compressive strength and flexure strength of UHPFC, it was noticed that curing was
accelerated by retaining heat of hydration or by the addition of heat via steam or boil
method. Increase of temperature method effect on the microstructure and mechanical
properties of UHPFC at an early age of curing.
Mechanical properties in fog curing method is slightly different from the water curing
method while the normal curing method gave the lowest values in mechanical properties
because dry curing resulted in a lower mechanical properties compared to other curing
methods.
29
Feylessoufi et al. (1997) discuss results of specimens cured with three different heating
modes. The results confirmed the formation of xonolite when heat-treated and the data
showed that the kinetically controlled thermal curing had a control on hydration and
crystallization.
2.9 Properties of RPC
2.9.1 Physical Properties
Density
In general, the RPC produced has a density ranging from 1760 to 2410 kg/m3 (Shaheen
and Shrive, 2006). Density increases with increasing presettling load, but decreases with
increasing heat-treating temperature. Sadrekarimi (2004) has also reported similar
results. He observed that high-temperature curing at 240°C lowers the density more than
that of 90°C curing and the decreasing rate of density for samples cured at 240°C is
substantially higher than that cured at 90°C. This can be due to more dehydration of the
samples and the formation of xonotlite, which is lighter than its seminal elements (C-S-
H).
On the other hand, Sadrekarimi (2004) also found that increase in silica fume content
decreases the density. He explained that the space occupied by cement is partly replaced
by a relatively lighter powder of silica fume.
Workability
Shaheen and Shrive (2006) observed that the RPC mix was so thick and viscous that the
mixture had zero slump with a water/cement ratio of 0.13.
Liu and huang (2008) proposed a highly flowable reactive powder mortar as a repair
material. A flow value as high as 200% was obtained with w/b ratio of 0.3. It is confirmed
that workability increases with increased water content (Lee and Chisholm, 2005).
30
Ma and Schneider (2002) found that the flowability of UHPC was improved with the
cement replacement by quartz powder. The result shows that the slump flow increases
from 510 mm to 620 mm when 30% cement is replaced by quartz powder. They explained
that the incorporation of fine quartz powder reduced the voids in the original mixture.
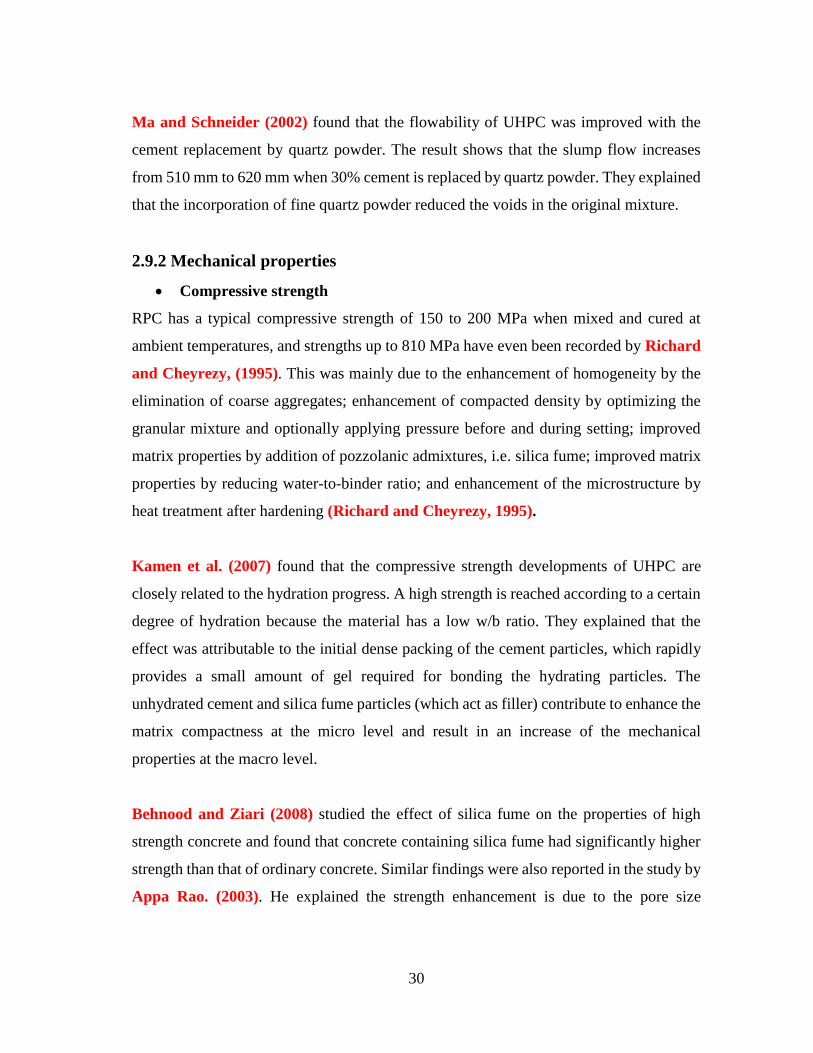
2.9.2 Mechanical properties
Compressive strength
RPC has a typical compressive strength of 150 to 200 MPa when mixed and cured at
ambient temperatures, and strengths up to 810 MPa have even been recorded by Richard
and Cheyrezy, (1995). This was mainly due to the enhancement of homogeneity by the
elimination of coarse aggregates; enhancement of compacted density by optimizing the
granular mixture and optionally applying pressure before and during setting; improved
matrix properties by addition of pozzolanic admixtures, i.e. silica fume; improved matrix
properties by reducing water-to-binder ratio; and enhancement of the microstructure by
heat treatment after hardening (Richard and Cheyrezy, 1995).
Kamen et al. (2007) found that the compressive strength developments of UHPC are
closely related to the hydration progress. A high strength is reached according to a certain
degree of hydration because the material has a low w/b ratio. They explained that the
effect was attributable to the initial dense packing of the cement particles, which rapidly
provides a small amount of gel required for bonding the hydrating particles. The
unhydrated cement and silica fume particles (which act as filler) contribute to enhance the
matrix compactness at the micro level and result in an increase of the mechanical
properties at the macro level.
Behnood and Ziari (2008) studied the effect of silica fume on the properties of high
strength concrete and found that concrete containing silica fume had significantly higher
strength than that of ordinary concrete. Similar findings were also reported in the study by
Appa Rao. (2003). He explained the strength enhancement is due to the pore size
31
refinement and matrix densification as well as the pozzolanic reaction which reduces the
Ca(OH)2 (CH) content.
For the application of pressure to increase the compacted density. Shaheen and Shrive
(2006) added that applying a presetting force of between 50 and 100 KN resulted in a
maximum compressive strength and any higher values of pressure resulted in lower
compressive strength. They explained that the decrease of compressive strength was due
to microcracks induced on the release of presetting load.
It has been reported that mechanical properties of RPC were highly dependent on heat
treatment (Cheyrezy et al., 1995). Shaheen and Shrive (2006) studied the effect of
temperature on mechanical properties of RPC and found that the compressive strength
increases rapidly with curing temperature between 23 and 150°C due to the acceleration
of the hydration process; and rises again between 200 and 300°C due to the pozzolanic
reaction of quartz, which can be activated at these temperatures, causing the formation of
very dense calcium silicate hydrate (C S-H) compounds with very low numbers of water
molecules such as Xonotlite.
Richard and Cheyrezy, (1995) discovered that pozzolanic activity of both silica fume
and crushed quartz is greatly increased by higher temperature. Jennings (2000) reported
that high temperatures favour the formation of the inner C-S-H and make the silica chains
to become longer. This in turn explains that the high compressive strength of RPC after
heat treatment by the enhancement of microstructure.
Modulus of elasticity
The value of elastic modulus of RPC has a typical value of about 47 GPa (Rebentrost
and Cavill, 2006). Richard and Cheyrezy (1995) reported that RPC has Young’s
modulus values exceeding 50 GPa, and it can go up to 75 GPa for those with the highest
densities.
32
2.10 Mix Designs from Previous Research
Mix designs developed for RPC from previous literatures are outlined in Table 8.5. Most
mix designs for RPC are based on the benchmark mix developed by Richard and
Cheyrezy (1994). Cement contents range between 28 and 38 percent of the total mix
weight, which equates to a mass greater than 650 kilograms per cubic meter of RPC mix.
The 10 percent variation in cement content between mix designs arises through the use of
fine powders (silica flour or ground quartz) which enable a reduction in the cement
content. Use of either silica flour or ground quartz is dependent on local materials
available. Silica fume contents vary between 8 and 10 percent of total mix weight
(approximately 20 to 30 percent of cement content) which corresponds to masses of
approximately 200 kilograms per cubic meter of RPC mix. Similar to cement, a reduction
in silica fume content is enabled through the use of silica flour or ground quartz.
Although not shown in Table 8.5, variations in silica fume types were evident in past mix
designs for RPC. These variations are often due to differing carbon, sulphur, and calcium
contents and also the retrieval level in the furnace where the silica fume is collected
(Coppola et al. 1996). The superplasticiser type and quantity used is highly dependent on
the water demand of the binding materials and desired flow of the RPC mix. High range
superplasticiser (polycarboxcylic ether polymer) at high dosage rates (typically 6 to 7
percent of cement content) are used in RPC.
Also indicated in Table 2.1 are characteristic strengths obtained from individual RPC
mixes. In summary:
Compressive strength (f'c) achieved varied between 160 and 197 MPa,
Flexural strengths (f'cf) achieved varied between 25 and 50 MPa,
Indirect tensile strengths (f'ct) achieved varied between 12 and 21 MPa.
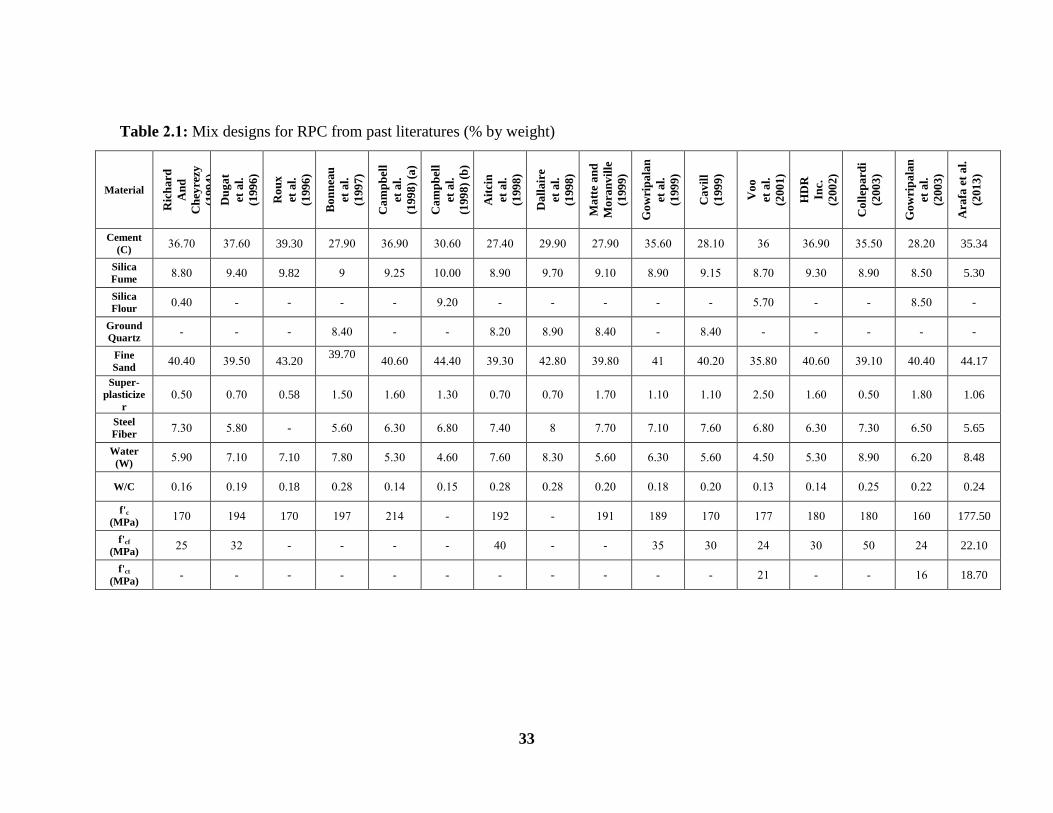
33
Table 4.3: Mix designs for RPC from past literatures (% by weight)
Ara
fa e
t a
l.
(201
3)
Go
wri
pa
lan
et a
l.
(200
3)
Co
llep
ard
i
(200
3)
HD
R
Inc.
(200
2)
Vo
o
et a
l.
(200
1)
Ca
vil
l
(199
9)
Go
wri
pa
lan
et a
l.
(199
9)
Ma
tte
an
d
Mo
ran
vil
le
(199
9)
Da
lla
ire
et a
l.
(199
8)
Ait
cin
et a
l.
(199
8)
Ca
mp
bel
l
et a
l.
(199
8)
(b)
Ca
mp
bel
l
et a
l.
(199
8)
(a)
Bo
nn
eau
et a
l.
(199
7)
Ro
ux
et a
l.
(199
6)
Du
ga
t
et a
l.
(199
6)
Ric
ha
rd
An
d
Ch
eyre
zy
(199
4)
Material
35.34 82.86 31.16 36.96 36 82.56 31.66 85.96 89.96 85.76 36.66 36.96 85.96 39.30 35.66 36.56 Cement
(C)
5.30 2.16 2.96 9.36 2.56 9.51 2.96 9.56 9.56 2.96 56.66 9.81 9 9.82 9.76 2.26 Silica
Fume
- 2.16 - - 1.56 - - - - - 9.86 - - - - 6.76 Silica
Flour
- - - - - 2.76 - 2.76 2.96 2.86 - - 2.76 - - - Ground
Quartz
44.17 76.76 39.56 76.66 31.26 76.86 75 39.26 78.26 39.36 77.76 76.66 39.70
43.20 39.16 76.76
Fine
Sand
1.06 5.26 6.16 5.66 8.16 5.56 5.56 5.56 6.56 6.56 5.36 5.66 5.16 0.58 6.56 6.16 Super-
plasticize
r
5.65 6.16 5.36 6.36 6.26 5.66 5.56 5.56 2 5.76 6.26 6.36 1.66 - 1.26 5.36 Steel
Fiber
8.48 6.86 2.96 1.36 7.16 1.66 6.36 1.66 2.36 5.66 7.66 1.36 5.26 7.10 5.56 1.96 Water
(W)
0.24 6.88 6.81 6.57 6.53 6.86 6.52 6.86 6.82 6.82 6.51 6.57 6.82 0.18 6.59 6.56 W/C
177.50 566 526 526 555 556 529 595 - 598 - 857 595 170 597 556 f'c
(MPa)
22.10 87 16 36 87 36 31 - - 76 - - - - 38 81 f'cf
(MPa)
18.70 56 - - 85 - - - - - - - - - - - f'ct
(MPa)
34
2.11 Summary
A review of relevant literature has revealed that the superior material performance of RPC
is attributable to a combination of a low water cement ratio, high silica fume content, particle
grading optimization of steel fibers. A meticulous mixing rationale is required for the
production of RPC. This coupled with the requirement of a dedicated curing regime has
generally limited its application to the precast industry where the stringent quality control
issues, required for RPC production, can be adhered. These finding where utilized in the
investigation for an optimal/consistent RPC mix.
35
Chapter (3)
Constituent Materials and Experimental Program
3.1 Introduction
The laboratory investigation consisted of tests for both fresh and hardened concrete
properties. This chapter presents the experimental program and the constituent materials
used to produce RPC associated with this research work.
Fresh concrete was tested for slump flow and V-funnel to ensure reasonable workability and
self-compacting ability in the plastic state. The tests for hardened concrete included
compression tests for strength and indirect tensile tests (split cylinder and flexural strength
tests) The influence of the silica fume dosages, steel fibers, amounts and investigate the
influence of curing regimes on the mechanical properties of RPC on the compressive
strength concrete together with the workability and density of RPC was studied by preparing
several concrete mixes.
The properties of different constituent materials used to produce RPC are also discussed
such as moisture content, unit weight, specific gravity and the grain size distribution. The
test procedures, details and equipment used to assess concrete properties are illustrated in
the following sections.
3.2 Experimental Program
The main objective of the testing program is to investigate the fresh and hardened properties
of RPC. Fresh concrete is tested for slump and V-funnel to ensure a reasonable workability
and self-compacting ability in the plastic state. Hardened concrete is tested for compression
and tension. In addition to this, the influence of steel fiber and silica fume contents is also
studied.
Experimental program included twelve trial mixes are prepared using several steel fiber and
silica fume contents. Silica fume contents of 25%, 30% and 35%, by weight of cement, are
used. In addition, steel fiber contents of 0 %, 1%, 2% and 3%, by total volume (0%, 8%,
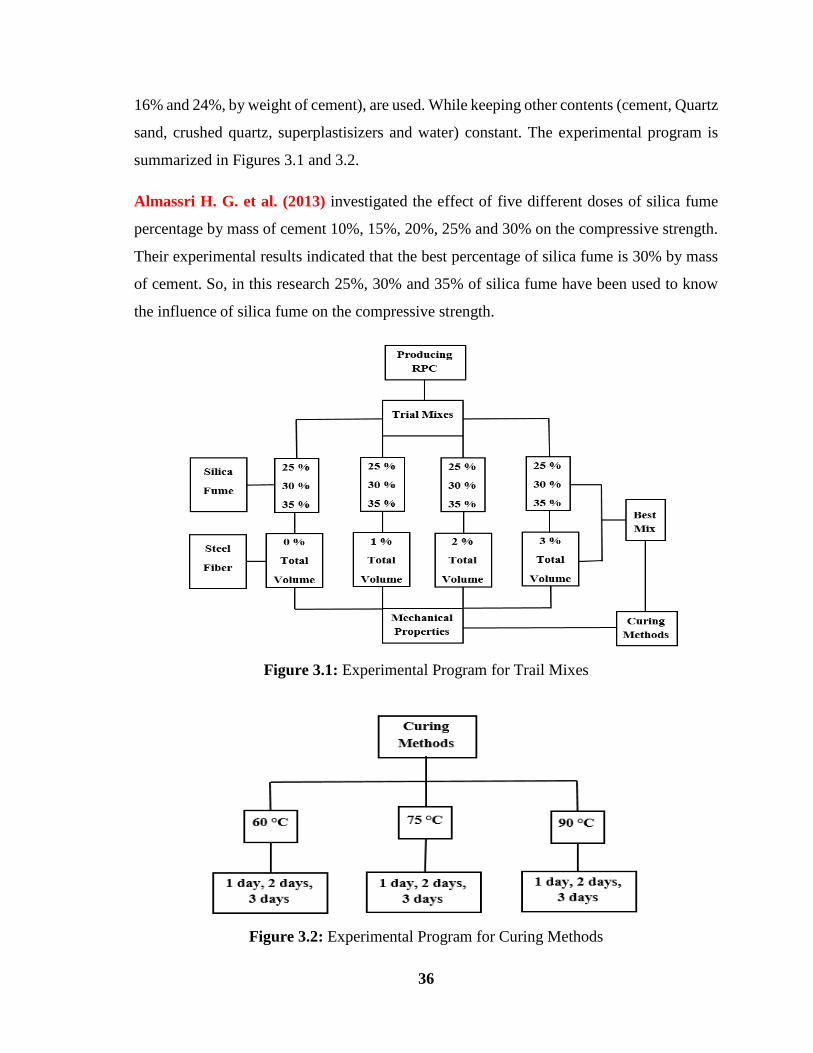
36
16% and 24%, by weight of cement), are used. While keeping other contents (cement, Quartz
sand, crushed quartz, superplastisizers and water) constant. The experimental program is
summarized in Figures 3.1 and 3.2.
Almassri H. G. et al. (2013) investigated the effect of five different doses of silica fume
percentage by mass of cement 10%, 15%, 20%, 25% and 30% on the compressive strength.
Their experimental results indicated that the best percentage of silica fume is 30% by mass
of cement. So, in this research 25%, 30% and 35% of silica fume have been used to know
the influence of silica fume on the compressive strength.
Figure 3.1: Experimental Program for Trail Mixes
Figure 3.2: Experimental Program for Curing Methods
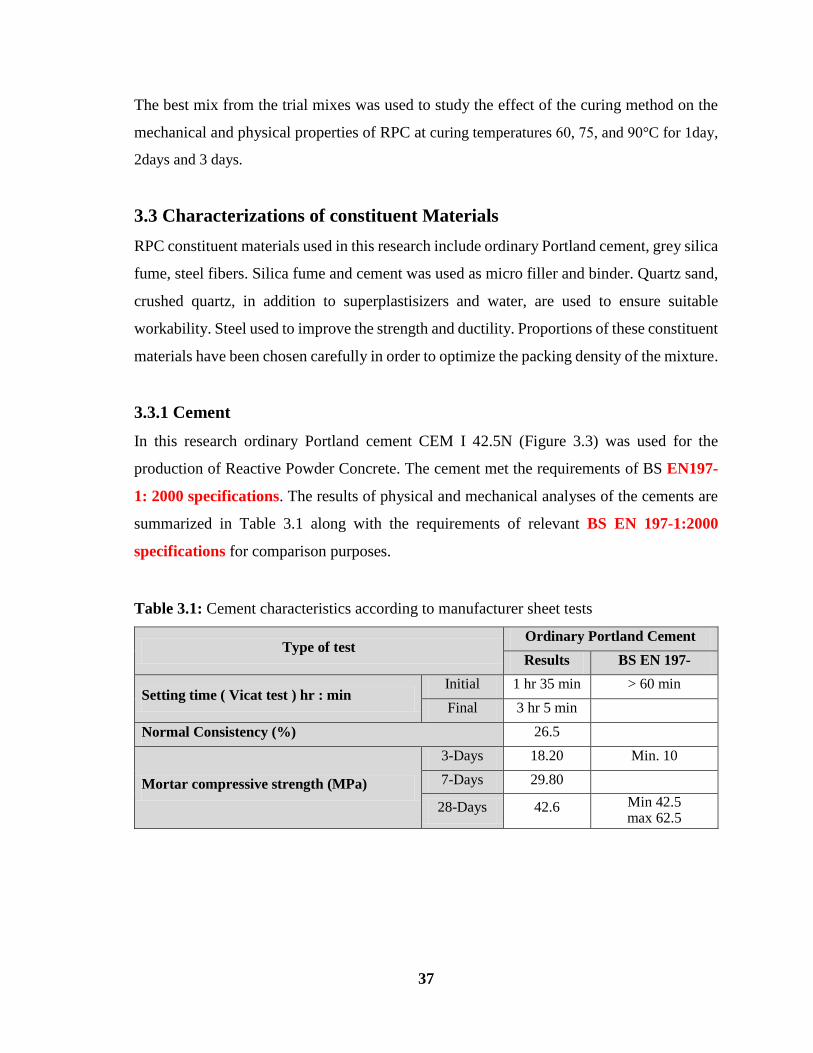
37
The best mix from the trial mixes was used to study the effect of the curing method on the
mechanical and physical properties of RPC at curing temperatures 66, 51, and 90°C for 1day,
2days and 3 days.
3.3 Characterizations of constituent Materials
RPC constituent materials used in this research include ordinary Portland cement, grey silica
fume, steel fibers. Silica fume and cement was used as micro filler and binder. Quartz sand,
crushed quartz, in addition to superplastisizers and water, are used to ensure suitable
workability. Steel used to improve the strength and ductility. Proportions of these constituent
materials have been chosen carefully in order to optimize the packing density of the mixture.
3.3.1 Cement
In this research ordinary Portland cement CEM I 42.5N (Figure 3.3) was used for the
production of Reactive Powder Concrete. The cement met the requirements of BS EN197-
1: 2000 specifications. The results of physical and mechanical analyses of the cements are
summarized in Table 3.1 along with the requirements of relevant BS EN 197-1:2000
specifications for comparison purposes.
Table 3.1: Cement characteristics according to manufacturer sheet tests
Type of test Ordinary Portland Cement
Results BS EN 197-
1:2000 Setting time ( Vicat test ) hr : min
Initial 1 hr 35 min > 60 min
Final 3 hr 5 min
Normal Consistency (%) 26.5
Mortar compressive strength (MPa)
3-Days 18.20 Min. 10
7-Days 29.80
28-Days 42.6 Min 42.5 max 62.5
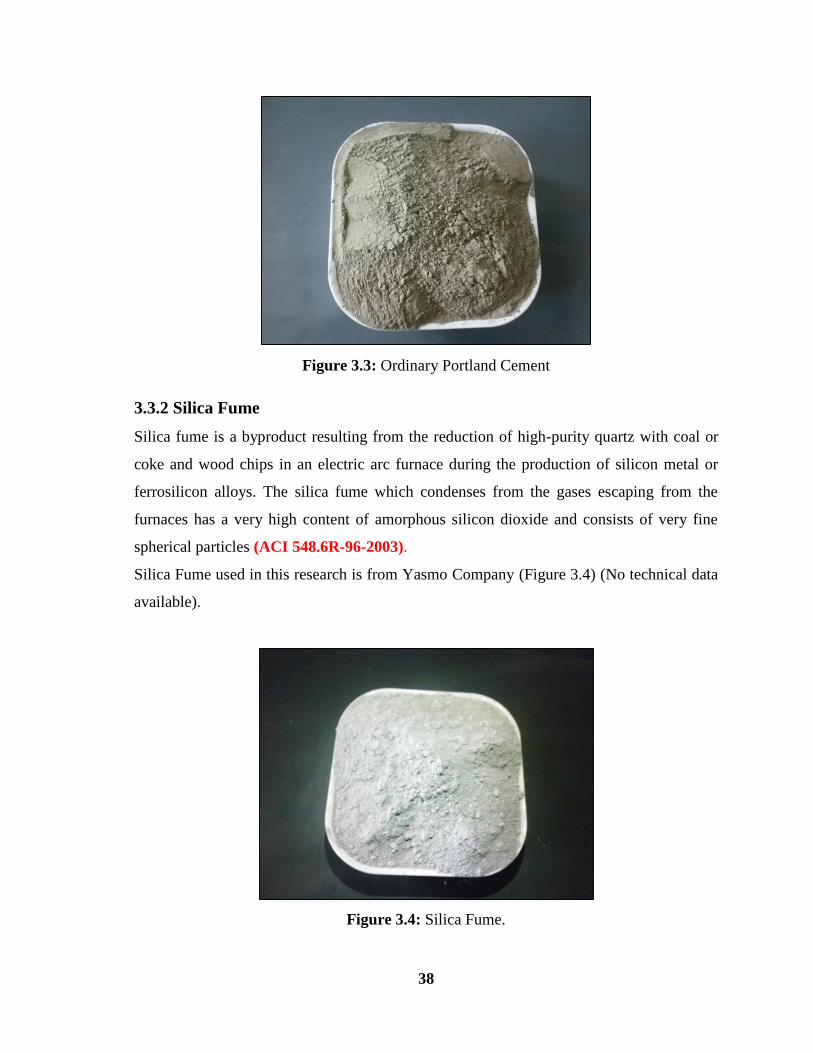
38
Figure 3.3: Ordinary Portland Cement
3.3.2 Silica Fume
Silica fume is a byproduct resulting from the reduction of high-purity quartz with coal or
coke and wood chips in an electric arc furnace during the production of silicon metal or
ferrosilicon alloys. The silica fume which condenses from the gases escaping from the
furnaces has a very high content of amorphous silicon dioxide and consists of very fine
spherical particles (ACI 548.6R-96-2003).
Silica Fume used in this research is from Yasmo Company (Figure 3.4) (No technical data
available).
Figure 3.4: Silica Fume.
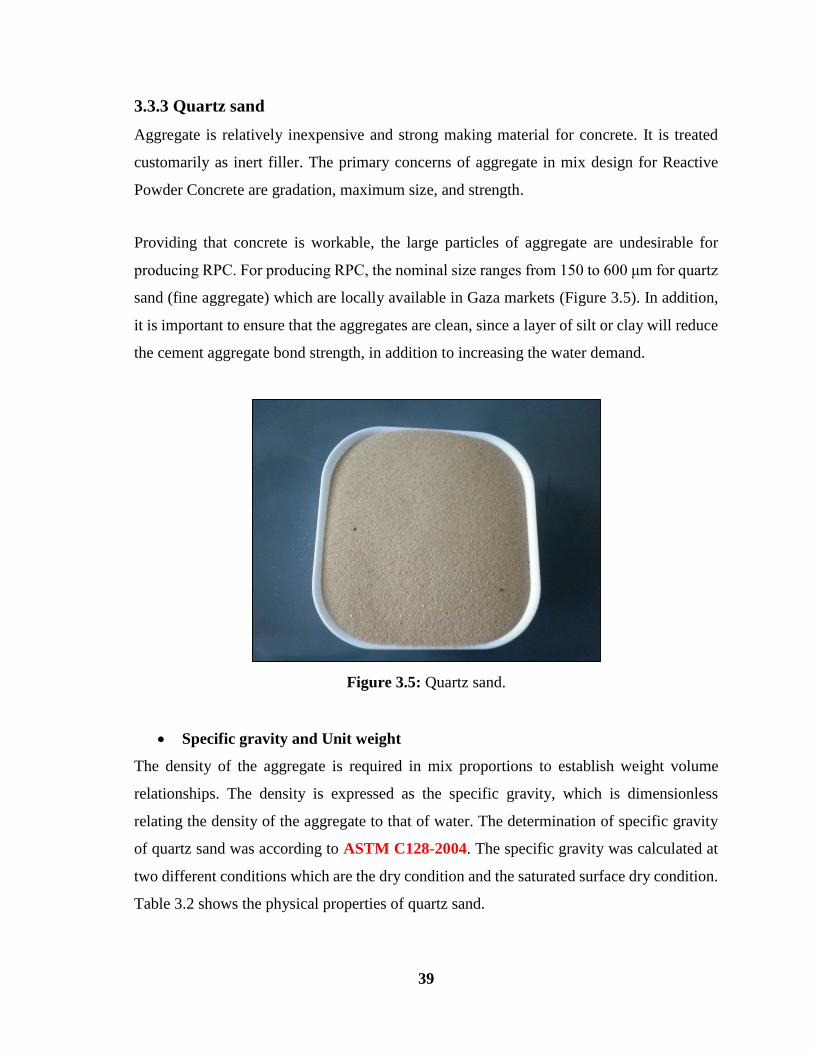
39
3.3.3 Quartz sand
Aggregate is relatively inexpensive and strong making material for concrete. It is treated
customarily as inert filler. The primary concerns of aggregate in mix design for Reactive
Powder Concrete are gradation, maximum size, and strength.
Providing that concrete is workable, the large particles of aggregate are undesirable for
producing RPC. For producing RPC, the nominal size ranges from 150 to 600 μm for quartz
sand (fine aggregate) which are locally available in Gaza markets (Figure 3.5). In addition,
it is important to ensure that the aggregates are clean, since a layer of silt or clay will reduce
the cement aggregate bond strength, in addition to increasing the water demand.
Figure 3.5: Quartz sand.
Specific gravity and Unit weight
The density of the aggregate is required in mix proportions to establish weight volume
relationships. The density is expressed as the specific gravity, which is dimensionless
relating the density of the aggregate to that of water. The determination of specific gravity
of quartz sand was according to ASTM C128-2004. The specific gravity was calculated at
two different conditions which are the dry condition and the saturated surface dry condition.
Table 3.2 shows the physical properties of quartz sand.
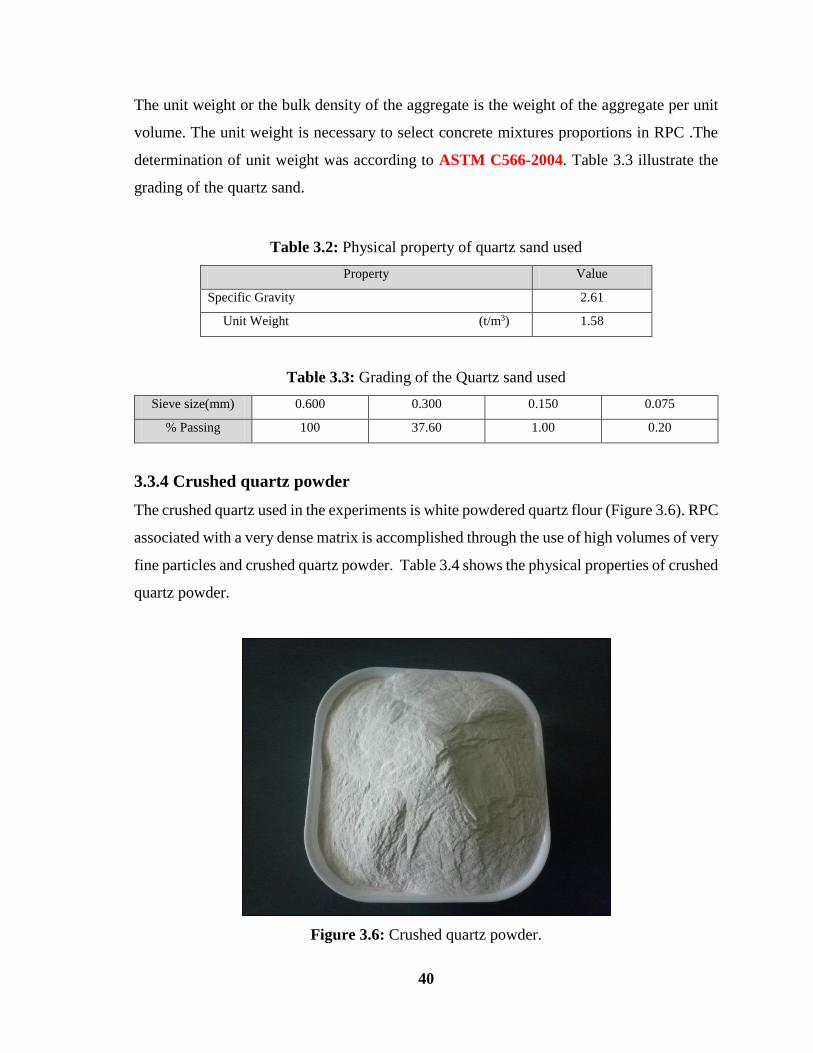
40
The unit weight or the bulk density of the aggregate is the weight of the aggregate per unit
volume. The unit weight is necessary to select concrete mixtures proportions in RPC .The
determination of unit weight was according to ASTM C566-2004. Table 3.3 illustrate the
grading of the quartz sand.
Table 3.2: Physical property of quartz sand used
Property Value
Specific Gravity 2.61
Unit Weight (t/m3) 1.58
Table 3.3: Grading of the Quartz sand used
Sieve size(mm) 0.600 0.300 0.150 0.075
% Passing 100 37.60 1.00 0.20
3.3.4 Crushed quartz powder
The crushed quartz used in the experiments is white powdered quartz flour (Figure 3.6). RPC
associated with a very dense matrix is accomplished through the use of high volumes of very
fine particles and crushed quartz powder. Table 3.4 shows the physical properties of crushed
quartz powder.
Figure 3.6: Crushed quartz powder.
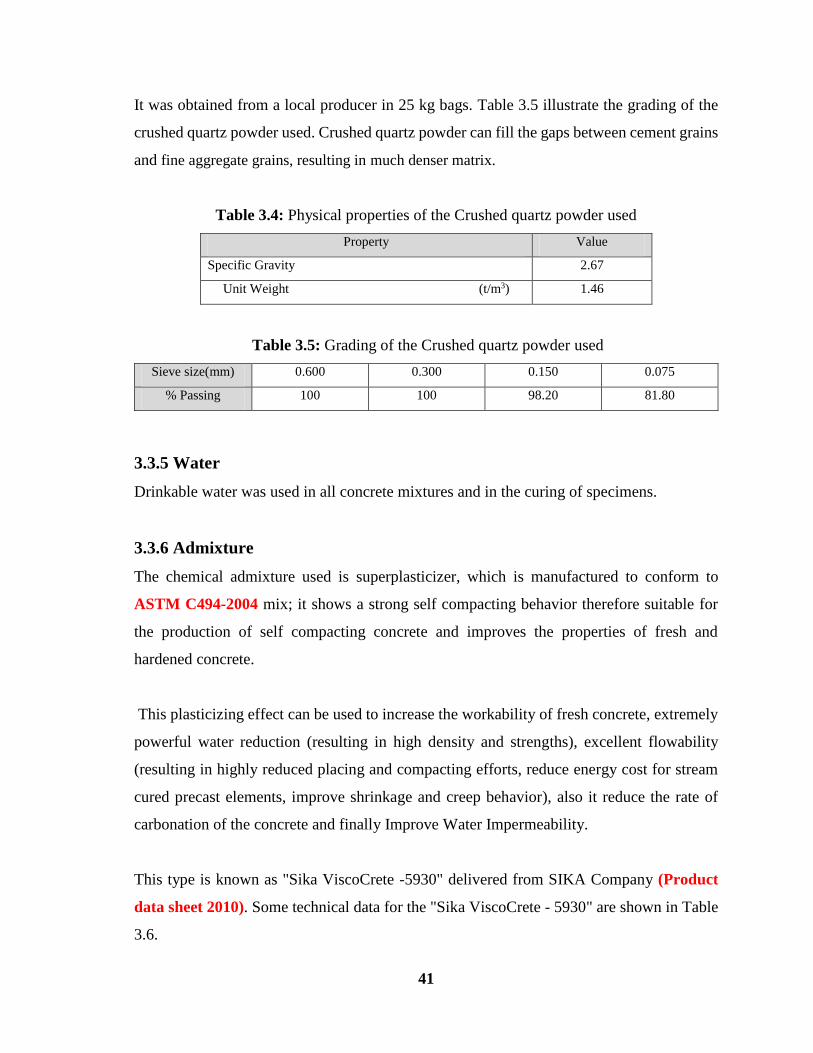
41
It was obtained from a local producer in 25 kg bags. Table 3.5 illustrate the grading of the
crushed quartz powder used. Crushed quartz powder can fill the gaps between cement grains
and fine aggregate grains, resulting in much denser matrix.
Table 3.4: Physical properties of the Crushed quartz powder used
Property Value
Specific Gravity 2.67
Unit Weight (t/m3) 1.46
Table 3.5: Grading of the Crushed quartz powder used
Sieve size(mm) 0.600 0.300 0.150 0.075
% Passing 100 100 98.20 81.80
3.3.5 Water
Drinkable water was used in all concrete mixtures and in the curing of specimens.
3.3.6 Admixture
The chemical admixture used is superplasticizer, which is manufactured to conform to
ASTM C494-2004 mix; it shows a strong self compacting behavior therefore suitable for
the production of self compacting concrete and improves the properties of fresh and
hardened concrete.
This plasticizing effect can be used to increase the workability of fresh concrete, extremely
powerful water reduction (resulting in high density and strengths), excellent flowability
(resulting in highly reduced placing and compacting efforts, reduce energy cost for stream
cured precast elements, improve shrinkage and creep behavior), also it reduce the rate of
carbonation of the concrete and finally Improve Water Impermeability.
This type is known as "Sika ViscoCrete -5930" delivered from SIKA Company (Product
data sheet 2010). Some technical data for the "Sika ViscoCrete - 5930" are shown in Table
3.6.
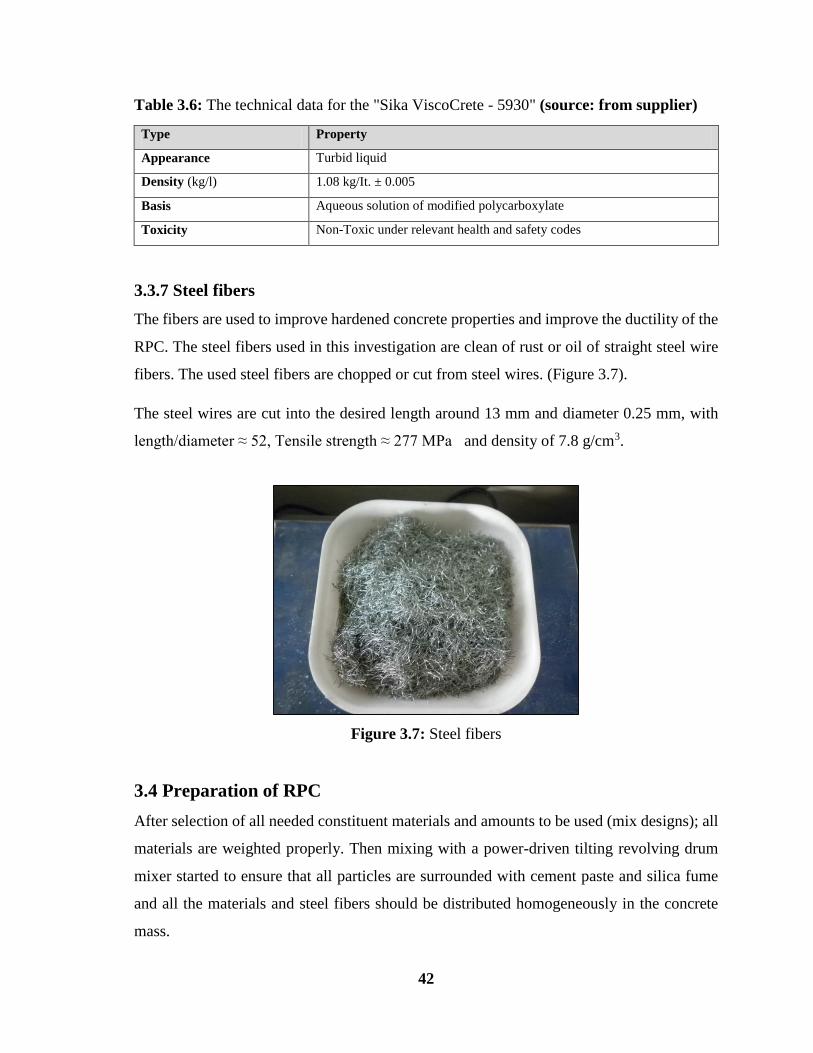
42
Table 3.6: The technical data for the "Sika ViscoCrete - 5930" (source: from supplier)
Type Property
Appearance Turbid liquid
Density (kg/l) 1.08 kg/It. ± 0.005
Basis
Aqueous solution of modified polycarboxylate
Toxicity Non-Toxic under relevant health and safety codes
3.3.7 Steel fibers
The fibers are used to improve hardened concrete properties and improve the ductility of the
RPC. The steel fibers used in this investigation are clean of rust or oil of straight steel wire
fibers. The used steel fibers are chopped or cut from steel wires. (Figure 3.7).
The steel wires are cut into the desired length around 13 mm and diameter 0.25 mm, with
length/diameter ≈ 52, Tensile strength ≈ 277 MPa and density of 7.8 g/cm3.
Figure 3.7: Steel fibers
3.4 Preparation of RPC
After selection of all needed constituent materials and amounts to be used (mix designs); all
materials are weighted properly. Then mixing with a power-driven tilting revolving drum
mixer started to ensure that all particles are surrounded with cement paste and silica fume
and all the materials and steel fibers should be distributed homogeneously in the concrete
mass.
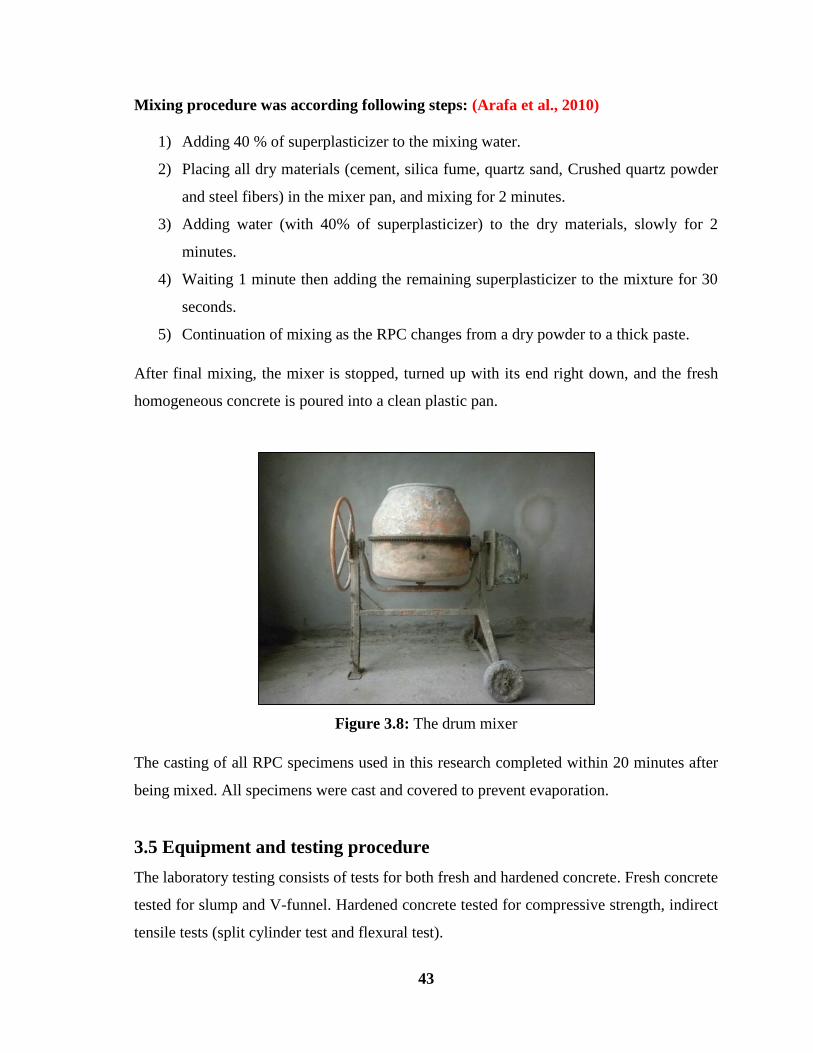
43
Mixing procedure was according following steps: (Arafa et al., 2010)
1) Adding 40 % of superplasticizer to the mixing water.
2) Placing all dry materials (cement, silica fume, quartz sand, Crushed quartz powder
and steel fibers) in the mixer pan, and mixing for 2 minutes.
3) Adding water (with 40% of superplasticizer) to the dry materials, slowly for 2
minutes.
4) Waiting 1 minute then adding the remaining superplasticizer to the mixture for 30
seconds.
5) Continuation of mixing as the RPC changes from a dry powder to a thick paste.
After final mixing, the mixer is stopped, turned up with its end right down, and the fresh
homogeneous concrete is poured into a clean plastic pan.
Figure 3.8: The drum mixer
The casting of all RPC specimens used in this research completed within 20 minutes after
being mixed. All specimens were cast and covered to prevent evaporation.
3.5 Equipment and testing procedure
The laboratory testing consists of tests for both fresh and hardened concrete. Fresh concrete
tested for slump and V-funnel. Hardened concrete tested for compressive strength, indirect
tensile tests (split cylinder test and flexural test).
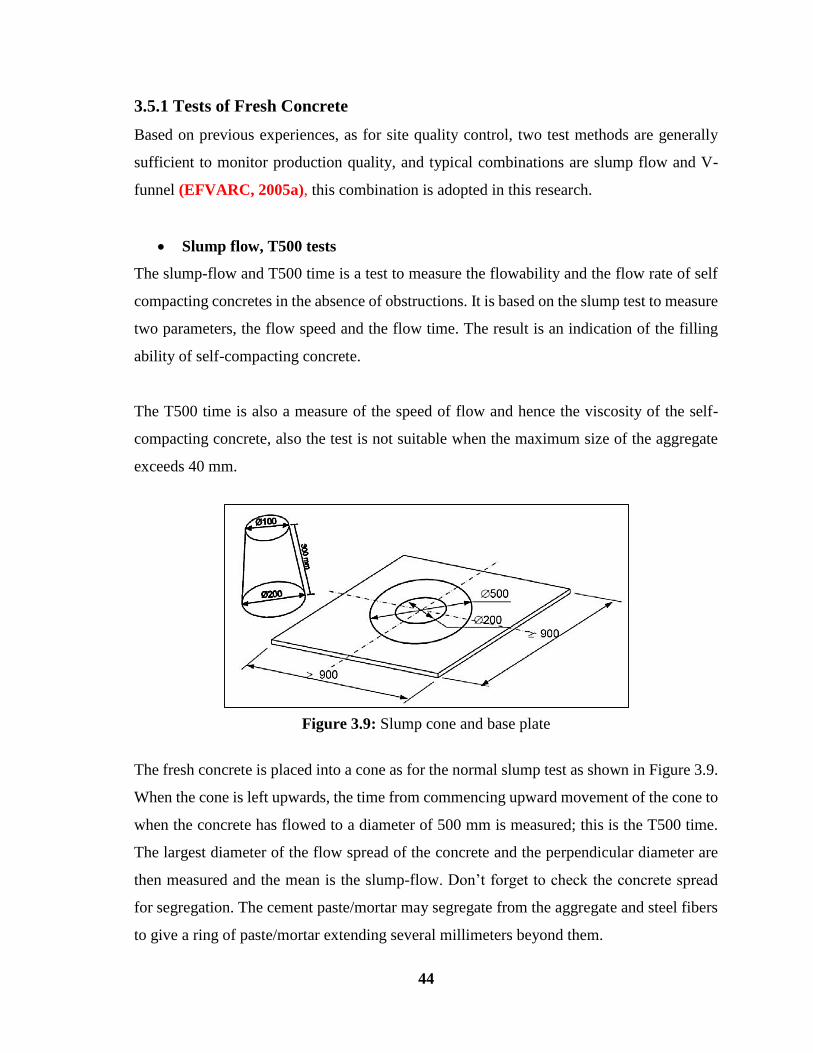
44
3.5.1 Tests of Fresh Concrete
Based on previous experiences, as for site quality control, two test methods are generally
sufficient to monitor production quality, and typical combinations are slump flow and V-
funnel (EFVARC, 2005a), this combination is adopted in this research.
Slump flow, T500 tests
The slump-flow and T500 time is a test to measure the flowability and the flow rate of self
compacting concretes in the absence of obstructions. It is based on the slump test to measure
two parameters, the flow speed and the flow time. The result is an indication of the filling
ability of self-compacting concrete.
The T500 time is also a measure of the speed of flow and hence the viscosity of the self-
compacting concrete, also the test is not suitable when the maximum size of the aggregate
exceeds 40 mm.
Figure 3.9: Slump cone and base plate
The fresh concrete is placed into a cone as for the normal slump test as shown in Figure 3.9.
When the cone is left upwards, the time from commencing upward movement of the cone to
when the concrete has flowed to a diameter of 500 mm is measured; this is the T500 time.
The largest diameter of the flow spread of the concrete and the perpendicular diameter are
then measured and the mean is the slump-flow. Don’t forget to check the concrete spread
for segregation. The cement paste/mortar may segregate from the aggregate and steel fibers
to give a ring of paste/mortar extending several millimeters beyond them.
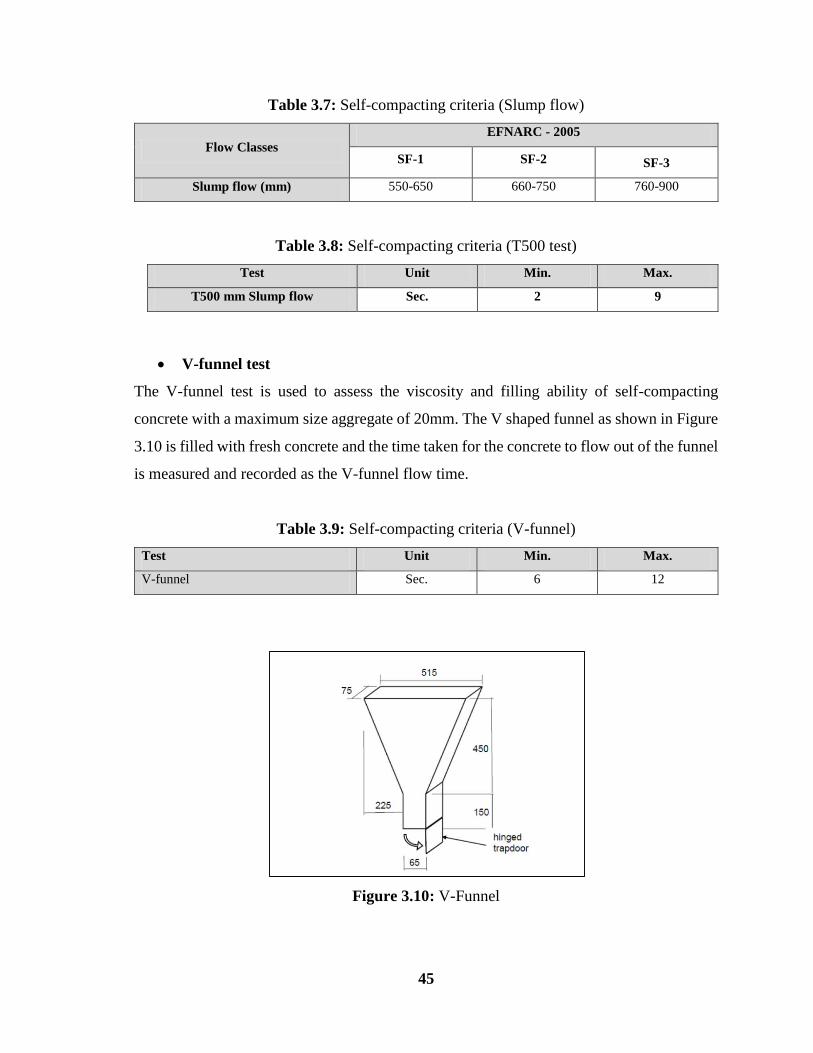
45
Table 3.7: Self-compacting criteria (Slump flow)
Flow Classes
EFNARC - 2005
SF-1 SF-2 SF-3
Slump flow (mm) 550-650 660-750 760-900
Table 3.8: Self-compacting criteria (T500 test)
Test Unit Min. Max.
T500 mm Slump flow Sec. 2 9
V-funnel test
The V-funnel test is used to assess the viscosity and filling ability of self-compacting
concrete with a maximum size aggregate of 20mm. The V shaped funnel as shown in Figure
3.10 is filled with fresh concrete and the time taken for the concrete to flow out of the funnel
is measured and recorded as the V-funnel flow time.
Table 3.9: Self-compacting criteria (V-funnel)
Test Unit Min. Max.
V-funnel Sec. 6 12
Figure 3.10: V-Funnel
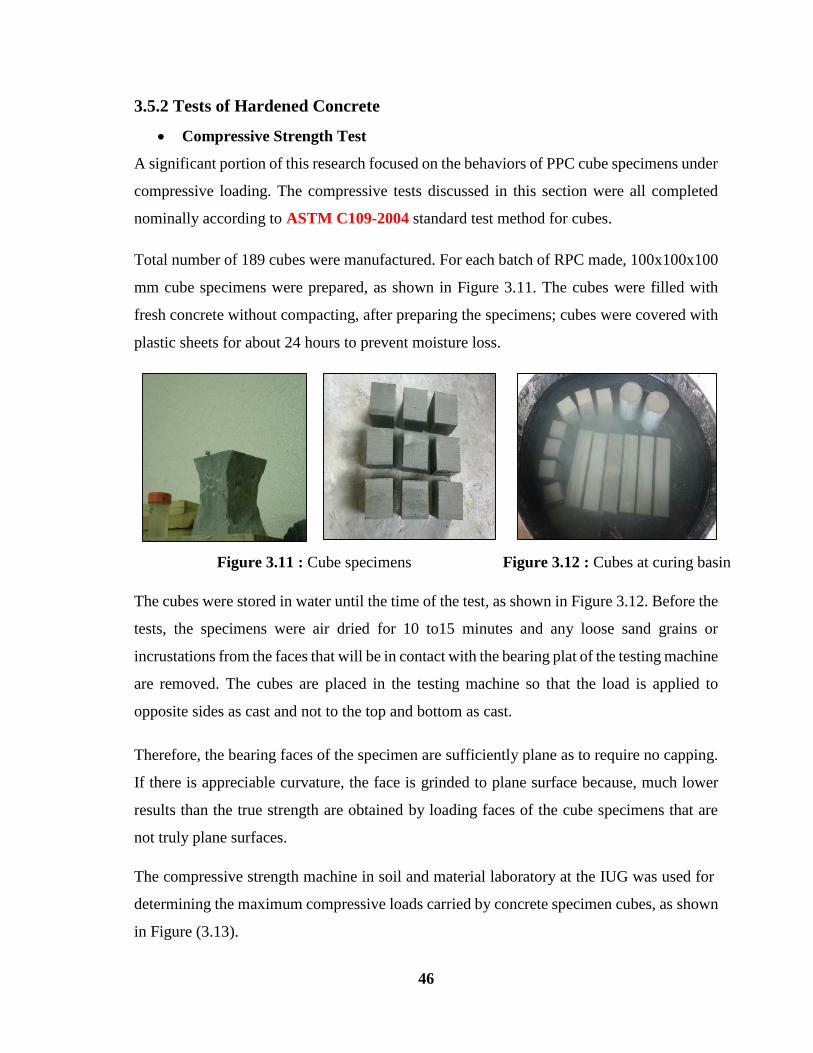
46
3.5.2 Tests of Hardened Concrete
Compressive Strength Test
A significant portion of this research focused on the behaviors of PPC cube specimens under
compressive loading. The compressive tests discussed in this section were all completed
nominally according to ASTM C109-2004 standard test method for cubes.
Total number of 189 cubes were manufactured. For each batch of RPC made, 100x100x100
mm cube specimens were prepared, as shown in Figure 3.11. The cubes were filled with
fresh concrete without compacting, after preparing the specimens; cubes were covered with
plastic sheets for about 24 hours to prevent moisture loss.
Figure 3.11 : Cube specimens Figure 3.12 : Cubes at curing basin
The cubes were stored in water until the time of the test, as shown in Figure 3.12. Before the
tests, the specimens were air dried for 10 to15 minutes and any loose sand grains or
incrustations from the faces that will be in contact with the bearing plat of the testing machine
are removed. The cubes are placed in the testing machine so that the load is applied to
opposite sides as cast and not to the top and bottom as cast.
Therefore, the bearing faces of the specimen are sufficiently plane as to require no capping.
If there is appreciable curvature, the face is grinded to plane surface because, much lower
results than the true strength are obtained by loading faces of the cube specimens that are
not truly plane surfaces.
The compressive strength machine in soil and material laboratory at the IUG was used for
determining the maximum compressive loads carried by concrete specimen cubes, as shown
in Figure (3.13).
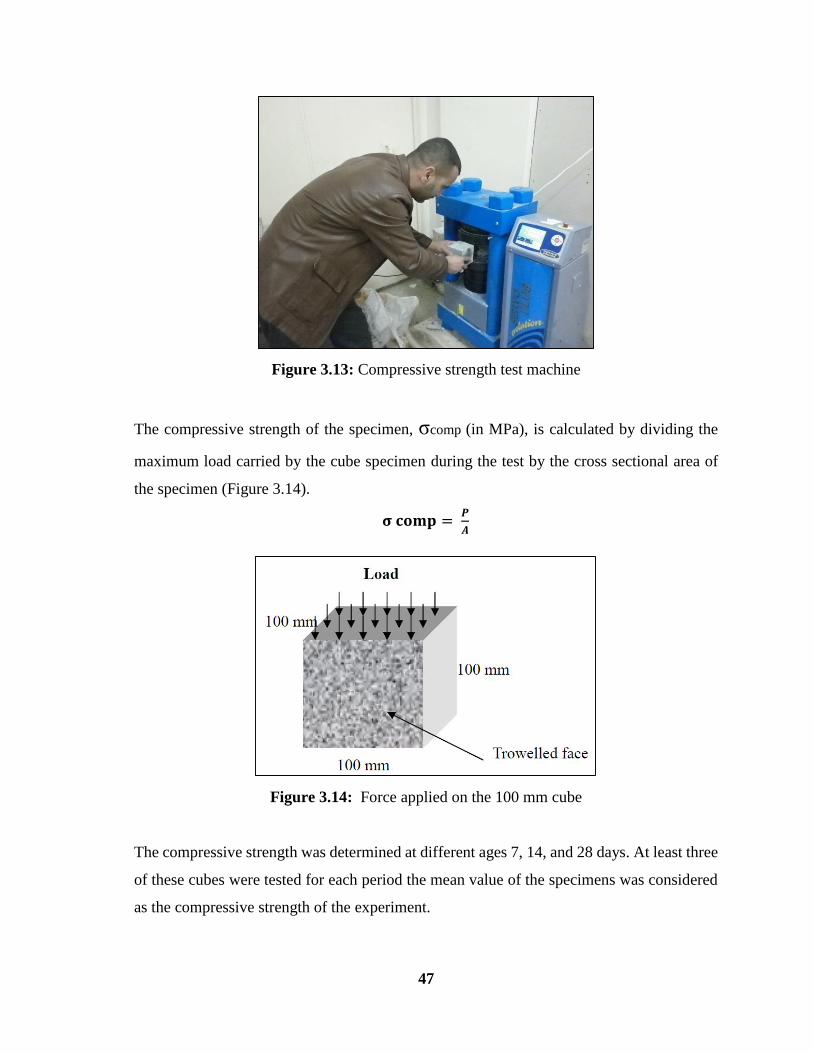
47
Figure 3.13: Compressive strength test machine
The compressive strength of the specimen, σcomp (in MPa), is calculated by dividing the
maximum load carried by the cube specimen during the test by the cross sectional area of
the specimen (Figure 3.14).
𝛔 𝐜𝐨𝐦𝐩 = 𝑷
𝑨
Figure 3.14: Force applied on the 100 mm cube
The compressive strength was determined at different ages 7, 14, and 28 days. At least three
of these cubes were tested for each period the mean value of the specimens was considered
as the compressive strength of the experiment.
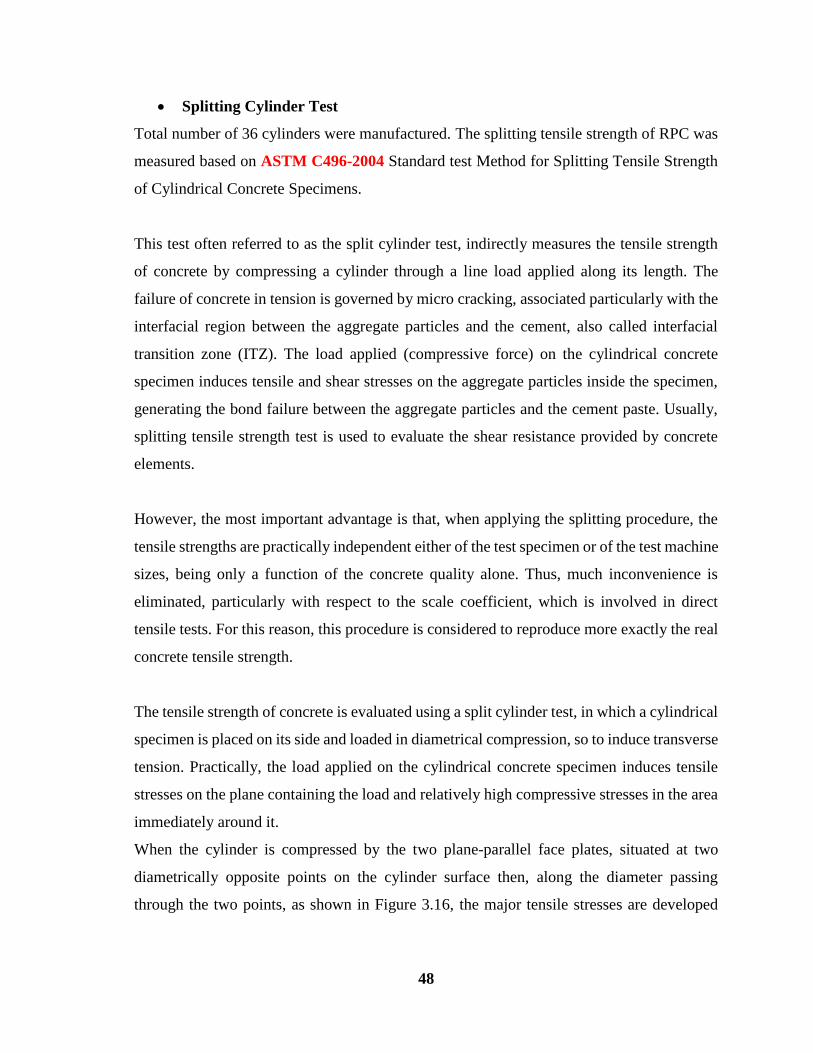
48
Splitting Cylinder Test
Total number of 36 cylinders were manufactured. The splitting tensile strength of RPC was
measured based on ASTM C496-2004 Standard test Method for Splitting Tensile Strength
of Cylindrical Concrete Specimens.
This test often referred to as the split cylinder test, indirectly measures the tensile strength
of concrete by compressing a cylinder through a line load applied along its length. The
failure of concrete in tension is governed by micro cracking, associated particularly with the
interfacial region between the aggregate particles and the cement, also called interfacial
transition zone (ITZ). The load applied (compressive force) on the cylindrical concrete
specimen induces tensile and shear stresses on the aggregate particles inside the specimen,
generating the bond failure between the aggregate particles and the cement paste. Usually,
splitting tensile strength test is used to evaluate the shear resistance provided by concrete
elements.
However, the most important advantage is that, when applying the splitting procedure, the
tensile strengths are practically independent either of the test specimen or of the test machine
sizes, being only a function of the concrete quality alone. Thus, much inconvenience is
eliminated, particularly with respect to the scale coefficient, which is involved in direct
tensile tests. For this reason, this procedure is considered to reproduce more exactly the real
concrete tensile strength.
The tensile strength of concrete is evaluated using a split cylinder test, in which a cylindrical
specimen is placed on its side and loaded in diametrical compression, so to induce transverse
tension. Practically, the load applied on the cylindrical concrete specimen induces tensile
stresses on the plane containing the load and relatively high compressive stresses in the area
immediately around it.
When the cylinder is compressed by the two plane-parallel face plates, situated at two
diametrically opposite points on the cylinder surface then, along the diameter passing
through the two points, as shown in Figure 3.16, the major tensile stresses are developed
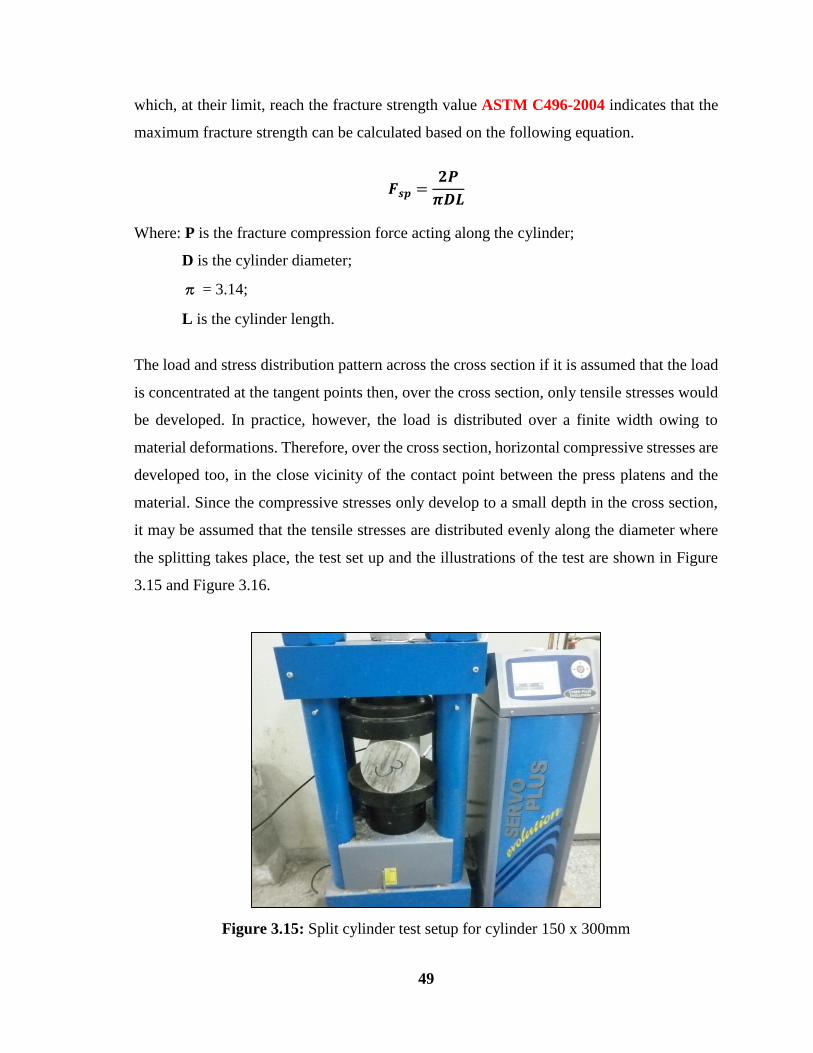
49
which, at their limit, reach the fracture strength value ASTM C496-2004 indicates that the
maximum fracture strength can be calculated based on the following equation.
𝑭𝒔𝒑 =𝟐𝑷
𝝅𝑫𝑳
Where: P is the fracture compression force acting along the cylinder;
D is the cylinder diameter;
π = 3.14;
L is the cylinder length.
The load and stress distribution pattern across the cross section if it is assumed that the load
is concentrated at the tangent points then, over the cross section, only tensile stresses would
be developed. In practice, however, the load is distributed over a finite width owing to
material deformations. Therefore, over the cross section, horizontal compressive stresses are
developed too, in the close vicinity of the contact point between the press platens and the
material. Since the compressive stresses only develop to a small depth in the cross section,
it may be assumed that the tensile stresses are distributed evenly along the diameter where
the splitting takes place, the test set up and the illustrations of the test are shown in Figure
3.15 and Figure 3.16.
Figure 3.15: Split cylinder test setup for cylinder 150 x 300mm
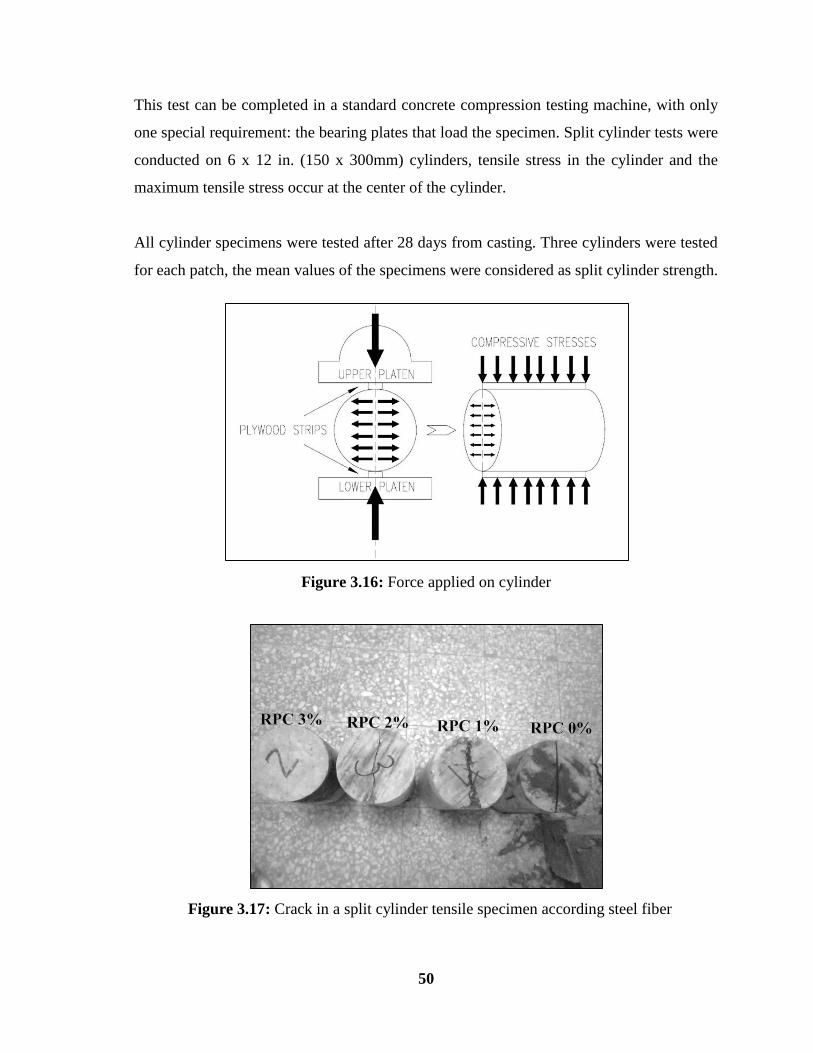
50
This test can be completed in a standard concrete compression testing machine, with only
one special requirement: the bearing plates that load the specimen. Split cylinder tests were
conducted on 6 x 12 in. (150 x 300mm) cylinders, tensile stress in the cylinder and the
maximum tensile stress occur at the center of the cylinder.
All cylinder specimens were tested after 28 days from casting. Three cylinders were tested
for each patch, the mean values of the specimens were considered as split cylinder strength.
Figure 3.16: Force applied on cylinder
Figure 3.17: Crack in a split cylinder tensile specimen according steel fiber
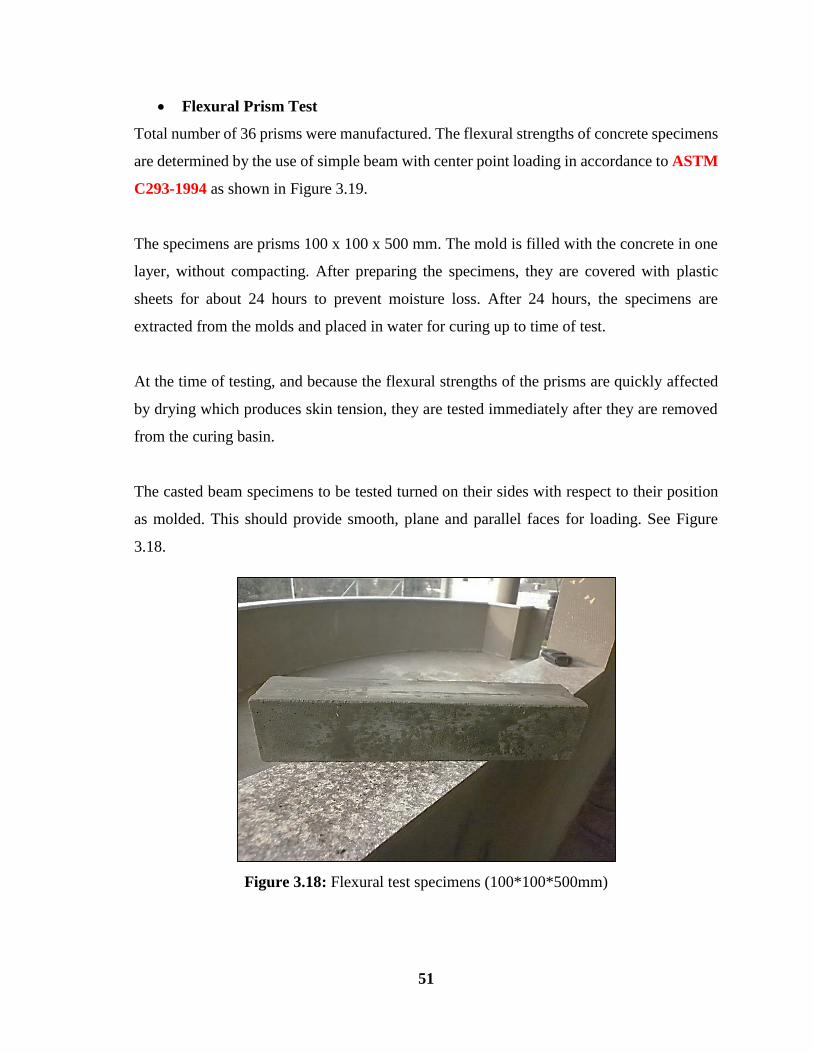
51
Flexural Prism Test
Total number of 36 prisms were manufactured. The flexural strengths of concrete specimens
are determined by the use of simple beam with center point loading in accordance to ASTM
C293-1994 as shown in Figure 3.19.
The specimens are prisms 100 x 100 x 500 mm. The mold is filled with the concrete in one
layer, without compacting. After preparing the specimens, they are covered with plastic
sheets for about 24 hours to prevent moisture loss. After 24 hours, the specimens are
extracted from the molds and placed in water for curing up to time of test.
At the time of testing, and because the flexural strengths of the prisms are quickly affected
by drying which produces skin tension, they are tested immediately after they are removed
from the curing basin.
The casted beam specimens to be tested turned on their sides with respect to their position
as molded. This should provide smooth, plane and parallel faces for loading. See Figure
3.18.
Figure 3.18: Flexural test specimens (100*100*500mm)
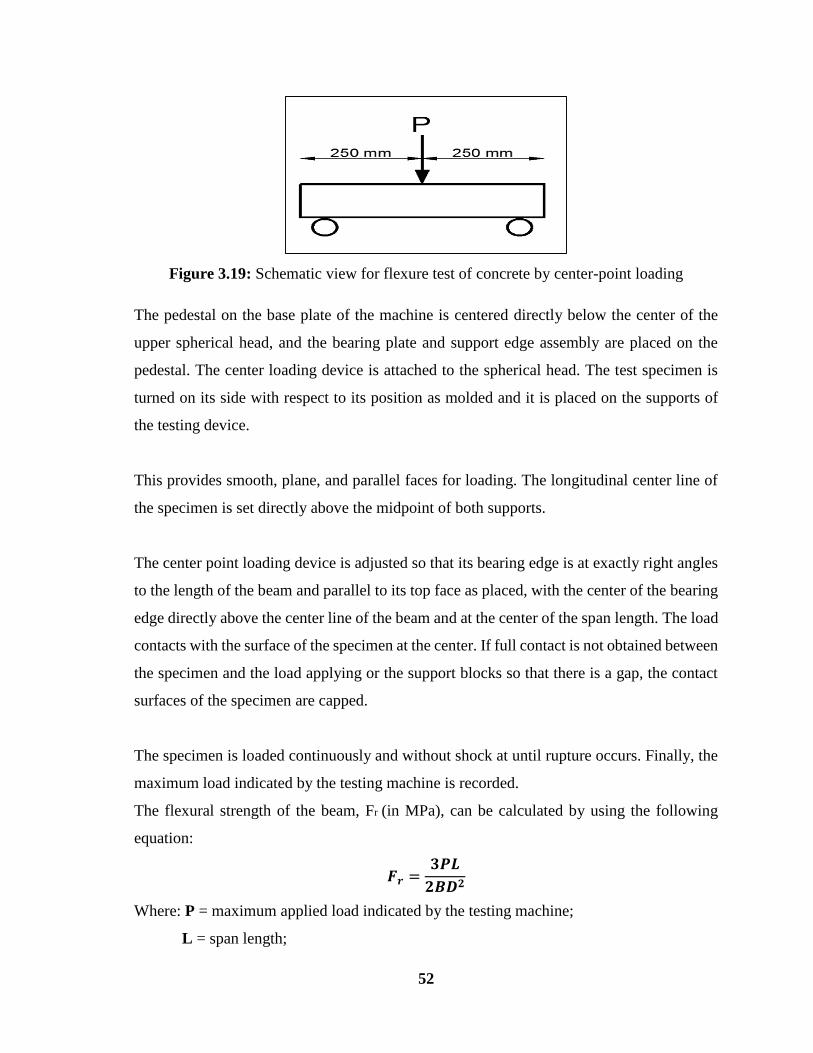
52
Figure 3.19: Schematic view for flexure test of concrete by center-point loading
The pedestal on the base plate of the machine is centered directly below the center of the
upper spherical head, and the bearing plate and support edge assembly are placed on the
pedestal. The center loading device is attached to the spherical head. The test specimen is
turned on its side with respect to its position as molded and it is placed on the supports of
the testing device.
This provides smooth, plane, and parallel faces for loading. The longitudinal center line of
the specimen is set directly above the midpoint of both supports.
The center point loading device is adjusted so that its bearing edge is at exactly right angles
to the length of the beam and parallel to its top face as placed, with the center of the bearing
edge directly above the center line of the beam and at the center of the span length. The load
contacts with the surface of the specimen at the center. If full contact is not obtained between
the specimen and the load applying or the support blocks so that there is a gap, the contact
surfaces of the specimen are capped.
The specimen is loaded continuously and without shock at until rupture occurs. Finally, the
maximum load indicated by the testing machine is recorded.
The flexural strength of the beam, Fr (in MPa), can be calculated by using the following
equation:
𝑭𝒓 =𝟑𝑷𝑳
𝟐𝑩𝑫𝟐
Where: P = maximum applied load indicated by the testing machine;
L = span length;
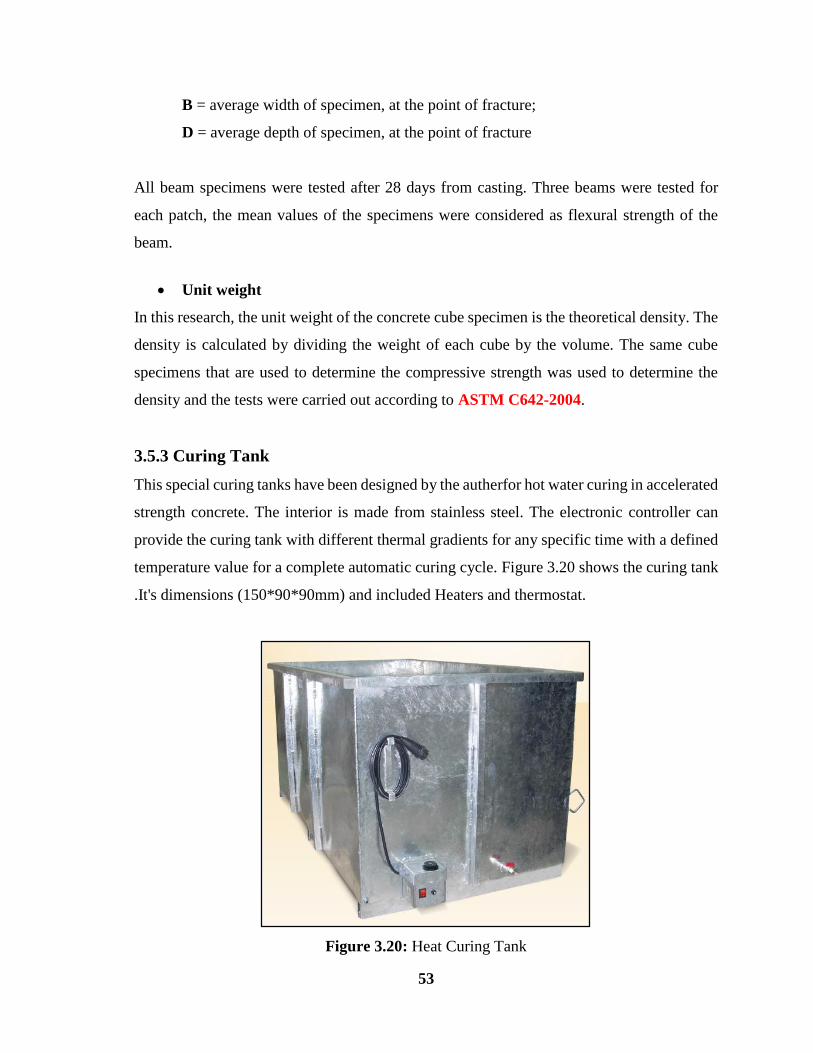
53
B = average width of specimen, at the point of fracture;
D = average depth of specimen, at the point of fracture
All beam specimens were tested after 28 days from casting. Three beams were tested for
each patch, the mean values of the specimens were considered as flexural strength of the
beam.
Unit weight
In this research, the unit weight of the concrete cube specimen is the theoretical density. The
density is calculated by dividing the weight of each cube by the volume. The same cube
specimens that are used to determine the compressive strength was used to determine the
density and the tests were carried out according to ASTM C642-2004.
3.5.3 Curing Tank
This special curing tanks have been designed by the autherfor hot water curing in accelerated
strength concrete. The interior is made from stainless steel. The electronic controller can
provide the curing tank with different thermal gradients for any specific time with a defined
temperature value for a complete automatic curing cycle. Figure 3.20 shows the curing tank
.It's dimensions (150*90*90mm) and included Heaters and thermostat.
Figure 3.20: Heat Curing Tank
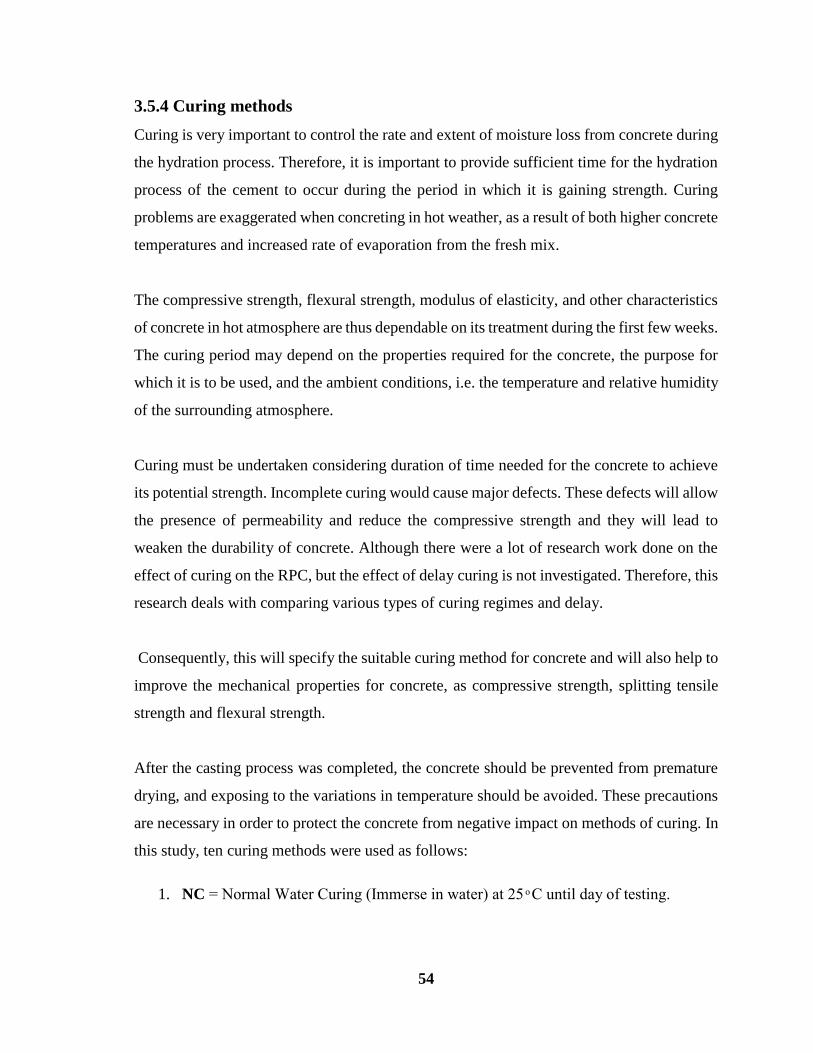
54
3.5.4 Curing methods
Curing is very important to control the rate and extent of moisture loss from concrete during
the hydration process. Therefore, it is important to provide sufficient time for the hydration
process of the cement to occur during the period in which it is gaining strength. Curing
problems are exaggerated when concreting in hot weather, as a result of both higher concrete
temperatures and increased rate of evaporation from the fresh mix.
The compressive strength, flexural strength, modulus of elasticity, and other characteristics
of concrete in hot atmosphere are thus dependable on its treatment during the first few weeks.
The curing period may depend on the properties required for the concrete, the purpose for
which it is to be used, and the ambient conditions, i.e. the temperature and relative humidity
of the surrounding atmosphere.
Curing must be undertaken considering duration of time needed for the concrete to achieve
its potential strength. Incomplete curing would cause major defects. These defects will allow
the presence of permeability and reduce the compressive strength and they will lead to
weaken the durability of concrete. Although there were a lot of research work done on the
effect of curing on the RPC, but the effect of delay curing is not investigated. Therefore, this
research deals with comparing various types of curing regimes and delay.
Consequently, this will specify the suitable curing method for concrete and will also help to
improve the mechanical properties for concrete, as compressive strength, splitting tensile
strength and flexural strength.
After the casting process was completed, the concrete should be prevented from premature
drying, and exposing to the variations in temperature should be avoided. These precautions
are necessary in order to protect the concrete from negative impact on methods of curing. In
this study, ten curing methods were used as follows:
1. NC = Normal Water Curing (Immerse in water) at 25 ͦ C until day of testing.
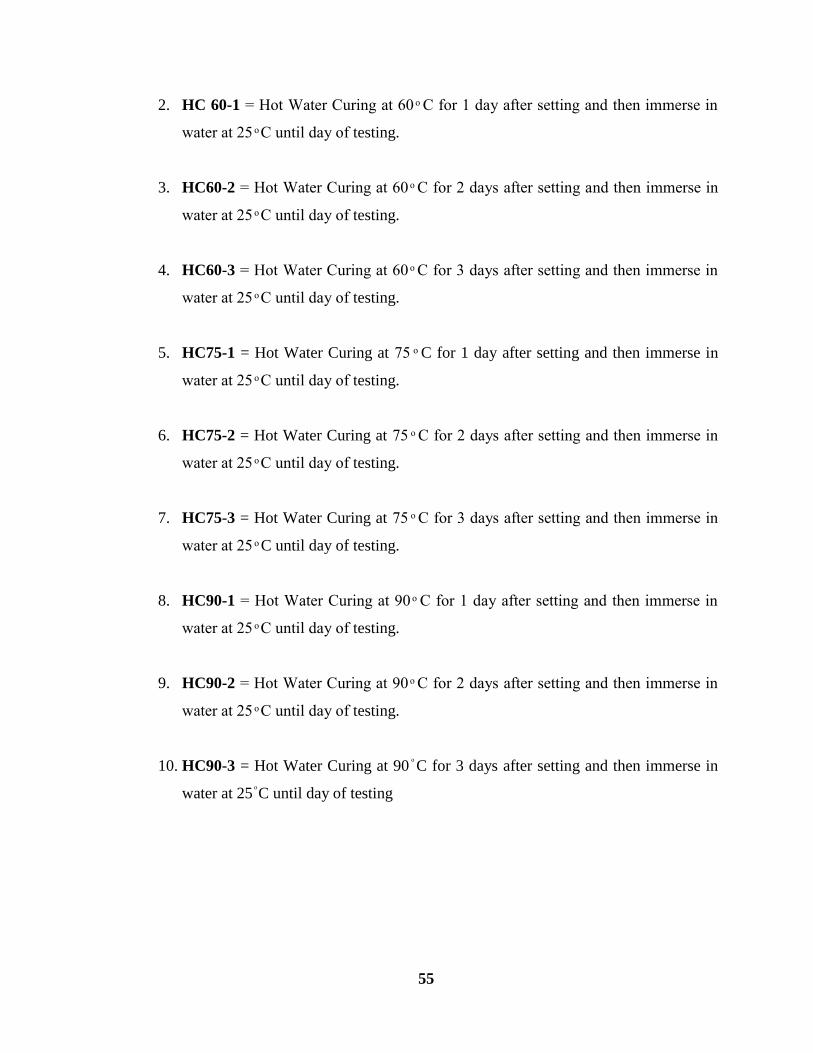
55
2. HC 60-1 = Hot Water Curing at 60 ͦ C for 1 day after setting and then immerse in
water at 25 ͦ C until day of testing.
3. HC60-2 = Hot Water Curing at 60 ͦ C for 2 days after setting and then immerse in
water at 25 ͦ C until day of testing.
4. HC60-3 = Hot Water Curing at 60 ͦ C for 3 days after setting and then immerse in
water at 25 ͦ C until day of testing.
5. HC75-1 = Hot Water Curing at 51 ͦ C for 1 day after setting and then immerse in
water at 25 ͦ C until day of testing.
6. HC75-2 = Hot Water Curing at 51 ͦ C for 2 days after setting and then immerse in
water at 25 ͦ C until day of testing.
7. HC75-3 = Hot Water Curing at 51 ͦ C for 3 days after setting and then immerse in
water at 25 ͦ C until day of testing.
8. HC90-1 = Hot Water Curing at 90 ͦ C for 1 day after setting and then immerse in
water at 25 ͦ C until day of testing.
9. HC90-2 = Hot Water Curing at 90 ͦ C for 2 days after setting and then immerse in
water at 25 ͦ C until day of testing.
10. HC90-3 = Hot Water Curing at 90 ͦ C for 3 days after setting and then immerse in
water at 25 ͦ C until day of testing
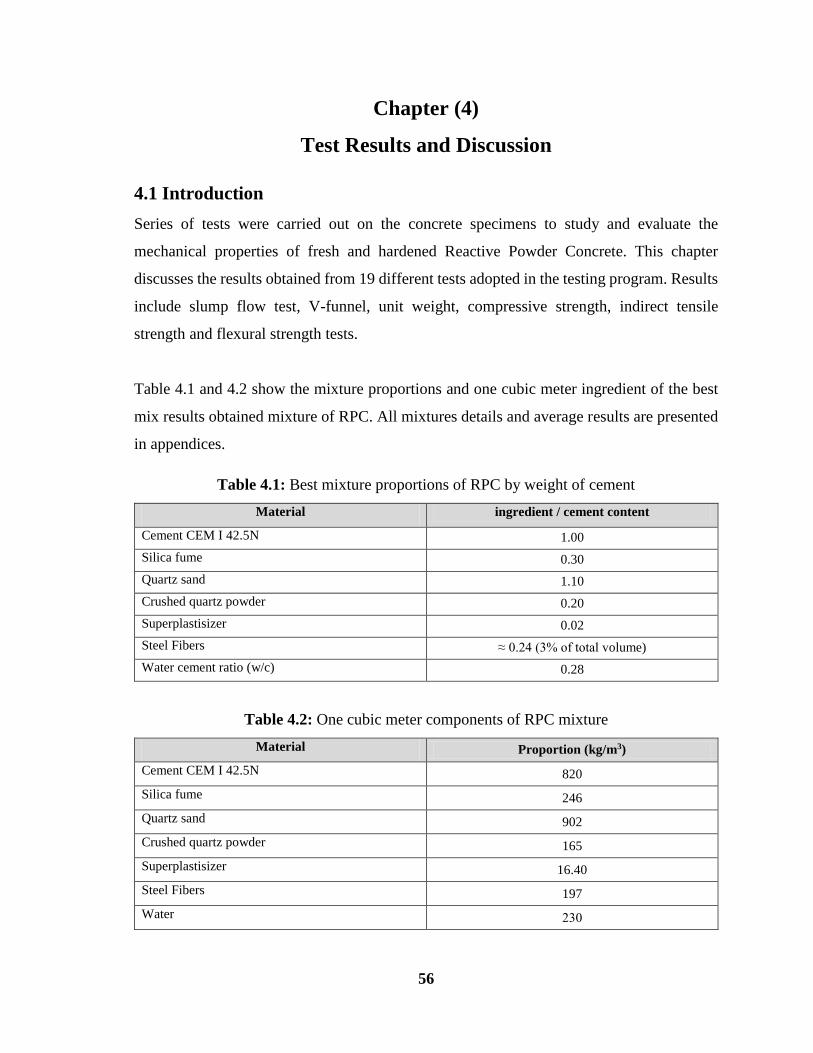
56
Chapter (4)
Test Results and Discussion
4.1 Introduction
Series of tests were carried out on the concrete specimens to study and evaluate the
mechanical properties of fresh and hardened Reactive Powder Concrete. This chapter
discusses the results obtained from 19 different tests adopted in the testing program. Results
include slump flow test, V-funnel, unit weight, compressive strength, indirect tensile
strength and flexural strength tests.
Table 4.1 and 4.2 show the mixture proportions and one cubic meter ingredient of the best
mix results obtained mixture of RPC. All mixtures details and average results are presented
in appendices.
Table 4.1: Best mixture proportions of RPC by weight of cement
Material ingredient / cement content
Cement CEM I 42.5N 1.00
Silica fume 0.30
Quartz sand 1.10
Crushed quartz powder 0.20
Superplastisizer 0.02
Steel Fibers ≈ 0.24 (3% of total volume)
Water cement ratio (w/c) 0.28
Table 4.2: One cubic meter components of RPC mixture
Material Proportion (kg/m3)
Cement CEM I 42.5N 820
Silica fume 246
Quartz sand 902
Crushed quartz powder 165
Superplastisizer 16.40
Steel Fibers 197
Water 836
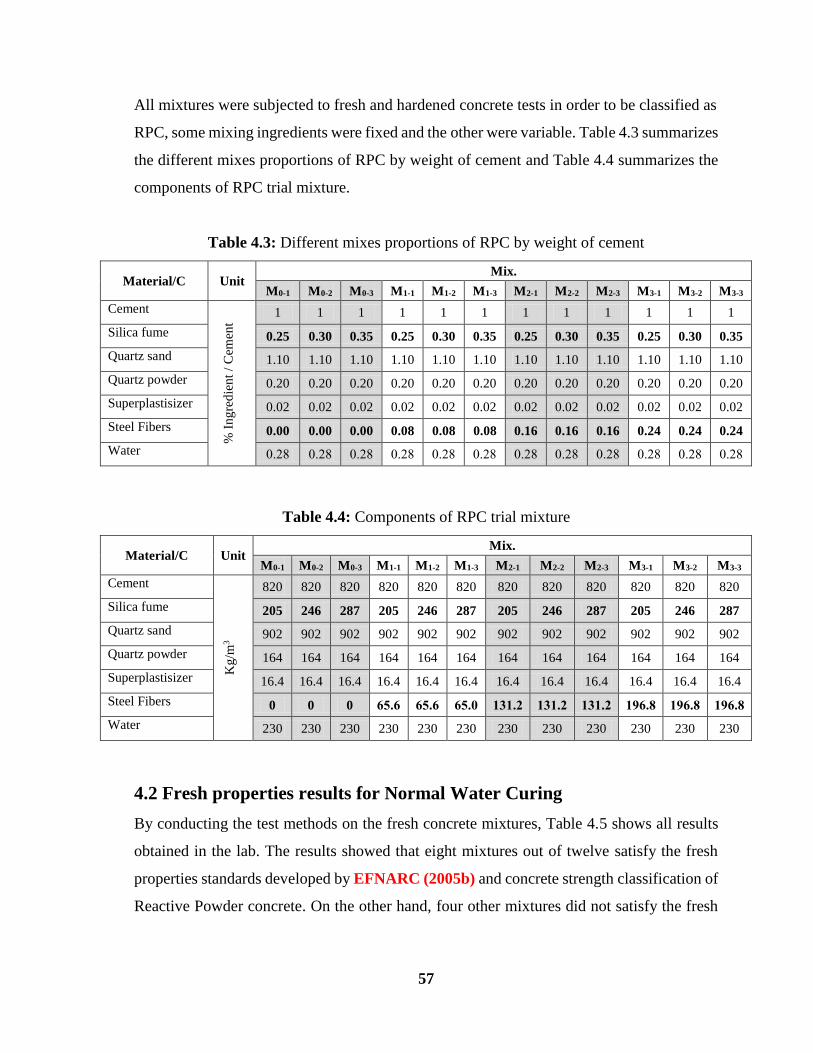
57
All mixtures were subjected to fresh and hardened concrete tests in order to be classified as
RPC, some mixing ingredients were fixed and the other were variable. Table 4.3 summarizes
the different mixes proportions of RPC by weight of cement and Table 4.4 summarizes the
components of RPC trial mixture.
Table 4.3: Different mixes proportions of RPC by weight of cement
Mix. Unit Material/C
M3-3 M3-2 M3-1 M2-3 M2-2 M2-1 M1-3 M1-2 M1-1 M0-3 M0-2 M0-1
1 1 1 1 1 1 1 1 1 1 1 1
% I
ng
red
ien
t /
Cem
ent
Cement
0.35 0.30 0.25 0.35 0.30 0.25 0.35 0.30 0.25 0.35 0.30 0.25 Silica fume
1.10 1.10 1.10 1.10 1.10 1.10 1.10 1.10 1.10 1.10 1.10 1.10 Quartz sand
0.20 0.20 0.20 0.20 0.20 0.20 0.20 0.20 0.20 0.20 0.20 0.20 Quartz powder
0.02 0.02 0.02 0.02 0.02 0.02 0.02 0.02 0.02 0.02 0.02 0.02 Superplastisizer
0.24 0.24 0.24 0.16 0.16 0.16 0.08 0.08 0.08 0.00 0.00 0.00 Steel Fibers
6.82 6.82 6.82 6.82 6.82 6.82 6.82 6.82 6.82 6.82 6.82 6.82 Water
Table 4.4: Components of RPC trial mixture
Mix. Unit Material/C
M3-3 M3-2 M3-1 M2-3 M2-2 M2-1 M1-3 M1-2 M1-1 M0-3 M0-2 M0-1
820 820 820 820 820 820 820 820 820 820 820 820
Kg
/m3
Cement
287 246 205 287 246 205 287 246 205 287 246 205 Silica fume
902 902 902 902 902 902 902 902 902 902 902 902 Quartz sand
164 164 164 164 164 164 164 164 164 164 164 164 Quartz powder
16.4 16.4 16.4 16.4 16.4 16.4 16.4 16.4 16.4 16.4 16.4 16.4 Superplastisizer
396.1 396.1 396.1 313.4 313.4 313.4 65.1 65.6 65.6 0 0 0 Steel Fibers
230 230 230 230 230 230 230 230 230 230 230 230 Water
4.2 Fresh properties results for Normal Water Curing
By conducting the test methods on the fresh concrete mixtures, Table 4.5 shows all results
obtained in the lab. The results showed that eight mixtures out of twelve satisfy the fresh
properties standards developed by EFNARC (2005b) and concrete strength classification of
Reactive Powder concrete. On the other hand, four other mixtures did not satisfy the fresh
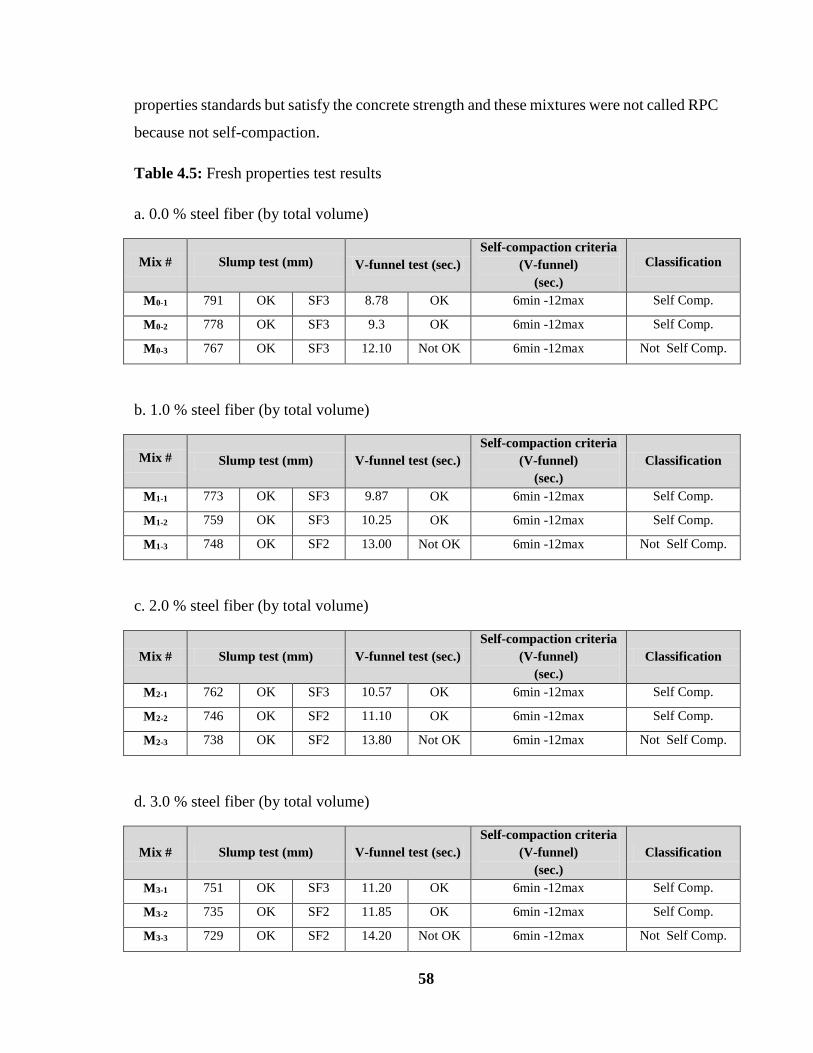
58
properties standards but satisfy the concrete strength and these mixtures were not called RPC
because not self-compaction.
Table 4.5: Fresh properties test results
a. 0.0 % steel fiber (by total volume)
Mix # Slump test (mm) V-funnel test (sec.)
Self-compaction criteria
(V-funnel)
(sec.)
Classification
M0-1 791 OK SF3 8.78 OK 6min -12max Self Comp.
M0-2 778 OK SF3 9.3 OK 6min -12max Self Comp.
M0-3 767 OK SF3 12.10 Not OK 6min -12max Not Self Comp.
b. 1.0 % steel fiber (by total volume)
Mix # Slump test (mm) V-funnel test (sec.)
Self-compaction criteria
(V-funnel)
(sec.)
Classification
M1-1 773 OK SF3 9.87 OK 6min -12max Self Comp.
M1-2 759 OK SF3 10.25
OK 6min -12max Self Comp.
M1-3 748 OK SF2 13.00 Not OK 6min -12max Not Self Comp.
c. 2.0 % steel fiber (by total volume)
Mix # Slump test (mm) V-funnel test (sec.)
Self-compaction criteria
(V-funnel)
(sec.)
Classification
M2-1 762 OK SF3 10.57
10
OK 6min -12max Self Comp.
M2-2 746 OK SF2 11.10
OK 6min -12max Self Comp.
M2-3 738 OK SF2 13.80 Not OK 6min -12max Not Self Comp.
d. 3.0 % steel fiber (by total volume)
Mix # Slump test (mm) V-funnel test (sec.)
Self-compaction criteria
(V-funnel)
(sec.)
Classification
M3-1 751 OK SF3 11.20 OK 6min -12max Self Comp.
M3-2 735 OK SF2 11.85 OK 6min -12max Self Comp.
M3-3 729 OK SF2 14.20 Not OK 6min -12max Not Self Comp.
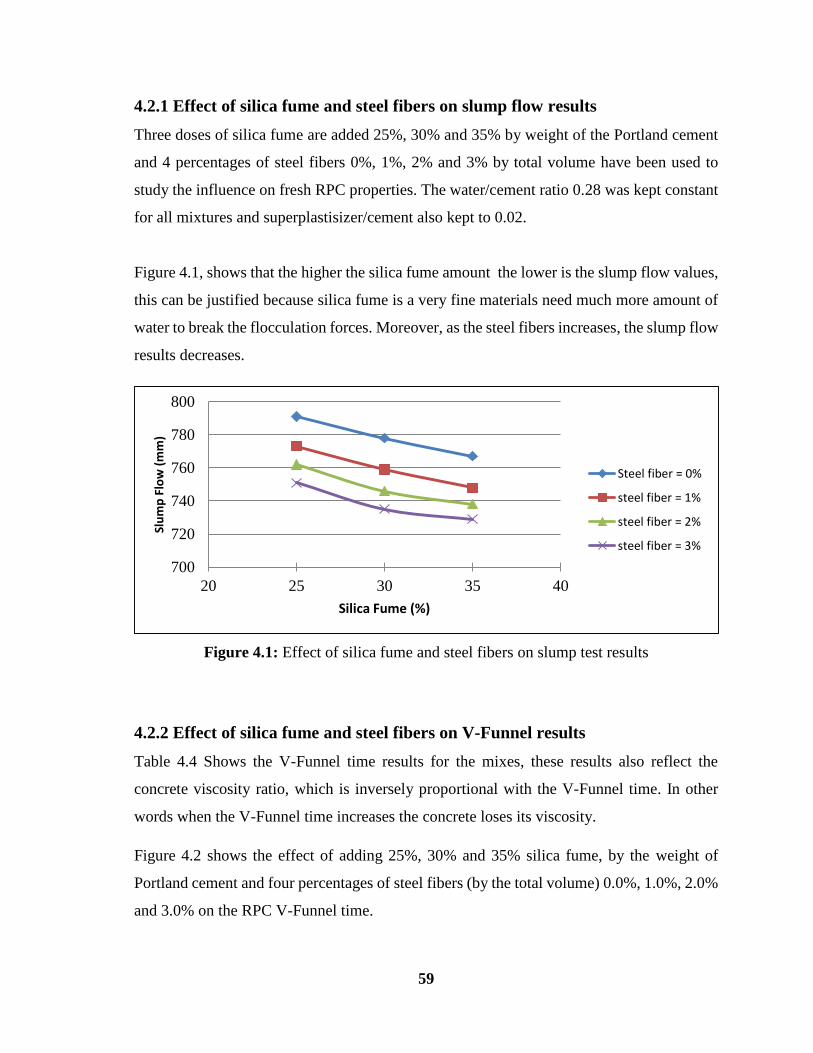
59
4.2.1 Effect of silica fume and steel fibers on slump flow results
Three doses of silica fume are added 25%, 30% and 35% by weight of the Portland cement
and 4 percentages of steel fibers 0%, 1%, 2% and 3% by total volume have been used to
study the influence on fresh RPC properties. The water/cement ratio 0.28 was kept constant
for all mixtures and superplastisizer/cement also kept to 0.02.
Figure 4.1, shows that the higher the silica fume amount the lower is the slump flow values,
this can be justified because silica fume is a very fine materials need much more amount of
water to break the flocculation forces. Moreover, as the steel fibers increases, the slump flow
results decreases.
Figure 4.1: Effect of silica fume and steel fibers on slump test results
4.2.2 Effect of silica fume and steel fibers on V-Funnel results
Table 4.4 Shows the V-Funnel time results for the mixes, these results also reflect the
concrete viscosity ratio, which is inversely proportional with the V-Funnel time. In other
words when the V-Funnel time increases the concrete loses its viscosity.
Figure 4.2 shows the effect of adding 25%, 30% and 35% silica fume, by the weight of
Portland cement and four percentages of steel fibers (by the total volume) 0.0%, 1.0%, 2.0%
and 3.0% on the RPC V-Funnel time.
700
720
740
760
780
800
20 25 30 35 40
Slu
mp
Flo
w (
mm
)
Silica Fume (%)
Steel fiber = 0%
steel fiber = 1%
steel fiber = 2%
steel fiber = 3%
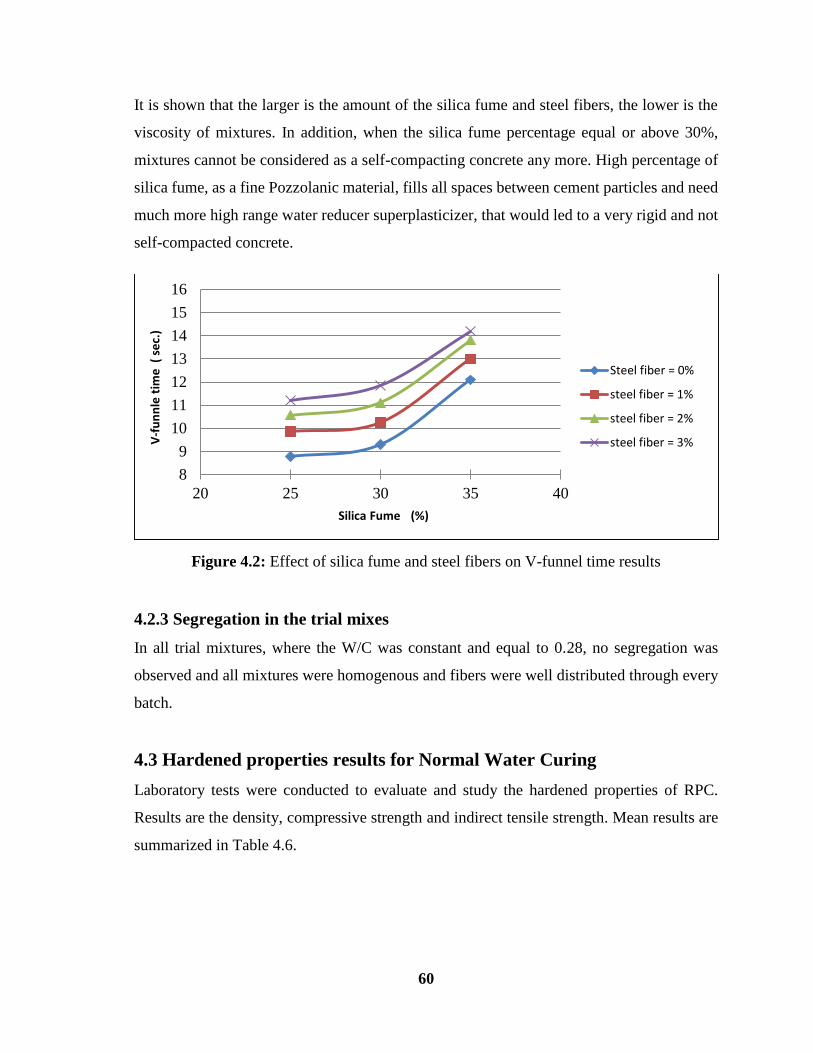
60
It is shown that the larger is the amount of the silica fume and steel fibers, the lower is the
viscosity of mixtures. In addition, when the silica fume percentage equal or above 30%,
mixtures cannot be considered as a self-compacting concrete any more. High percentage of
silica fume, as a fine Pozzolanic material, fills all spaces between cement particles and need
much more high range water reducer superplasticizer, that would led to a very rigid and not
self-compacted concrete.
Figure 4.2: Effect of silica fume and steel fibers on V-funnel time results
4.2.3 Segregation in the trial mixes
In all trial mixtures, where the W/C was constant and equal to 0.28, no segregation was
observed and all mixtures were homogenous and fibers were well distributed through every
batch.
4.3 Hardened properties results for Normal Water Curing
Laboratory tests were conducted to evaluate and study the hardened properties of RPC.
Results are the density, compressive strength and indirect tensile strength. Mean results are
summarized in Table 4.6.
8
9
10
11
12
13
14
15
16
20 25 30 35 40
V-f
un
nle
tim
e (
se
c.)
Silica Fume (%)
Steel fiber = 0%
steel fiber = 1%
steel fiber = 2%
steel fiber = 3%
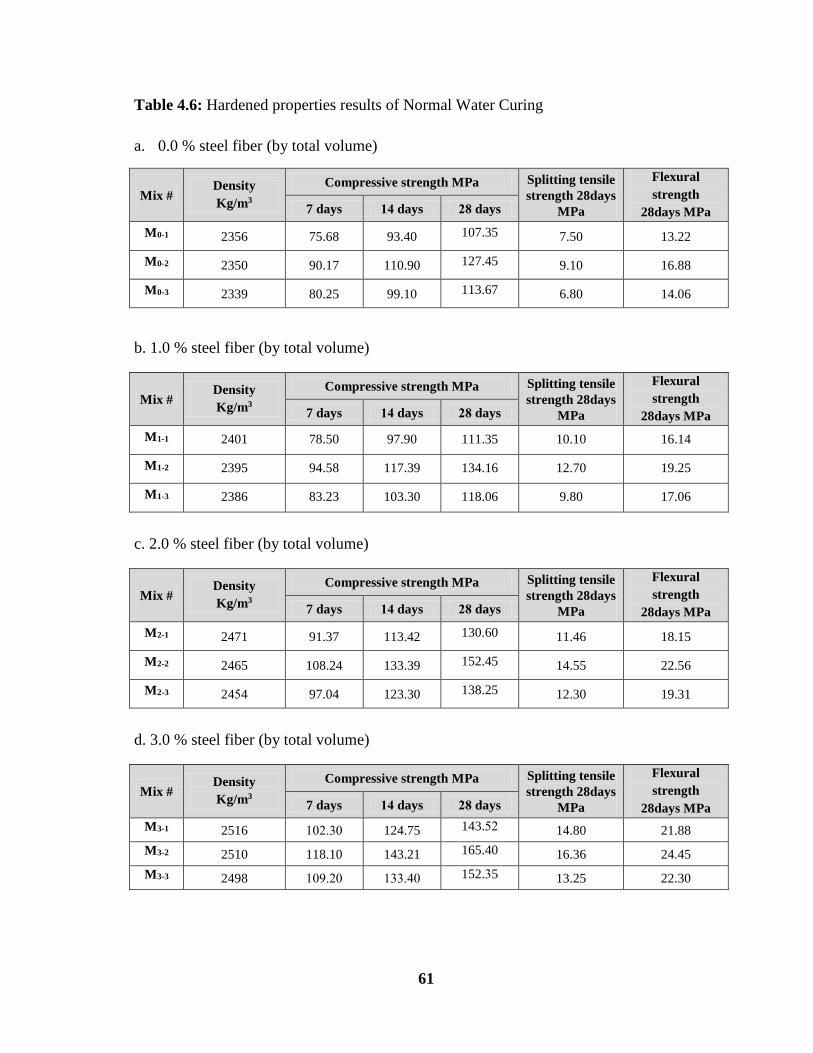
61
Table 4.6: Hardened properties results of Normal Water Curing
a. 0.0 % steel fiber (by total volume)
Mix # Density
Kg/m3
Compressive strength MPa Splitting tensile
strength 28days
MPa
Flexural
strength
28days MPa 7 days 34 days 41 days
M0-1 2356 75.68 93.40 107.35 7.50 13.22
M0-2 2350 90.17 110.90 127.45 9.10 16.88
M0-3 2339 80.25 99.10 113.67 6.80 14.06
b. 1.0 % steel fiber (by total volume)
Mix # Density
Kg/m3
Compressive strength MPa Splitting tensile
strength 28days
MPa
Flexural
strength
28days MPa 7 days 34 days 41 days
M1-1 2401 78.50 97.90 111.35 10.10 16.14
M1-2 2395 94.58 117.39 134.16 12.70 19.25
M1-3 2386 83.23 103.30 118.06 9.80 17.06
c. 2.0 % steel fiber (by total volume)
Mix # Density
Kg/m3
Compressive strength MPa Splitting tensile
strength 28days
MPa
Flexural
strength
28days MPa 7 days 34 days 41 days
M2-1 2471 91.37 113.42 130.60 11.46 18.15
M2-2 2465 108.24 133.39 152.45 14.55 22.56
M2-3 2414 97.04 123.30 138.25 12.30 19.31
d. 3.0 % steel fiber (by total volume)
Mix # Density
Kg/m3
Compressive strength MPa Splitting tensile
strength 28days
MPa
Flexural
strength
28days MPa 7 days 34 days 41 days
M3-1 2516 568.36 124.75 143.18 14.80 21.88
M3-2 2510 118.10 143.21 165.40 16.36 24.45
M3-3 2498 569.86 533.76 152.35 13.25 22.30
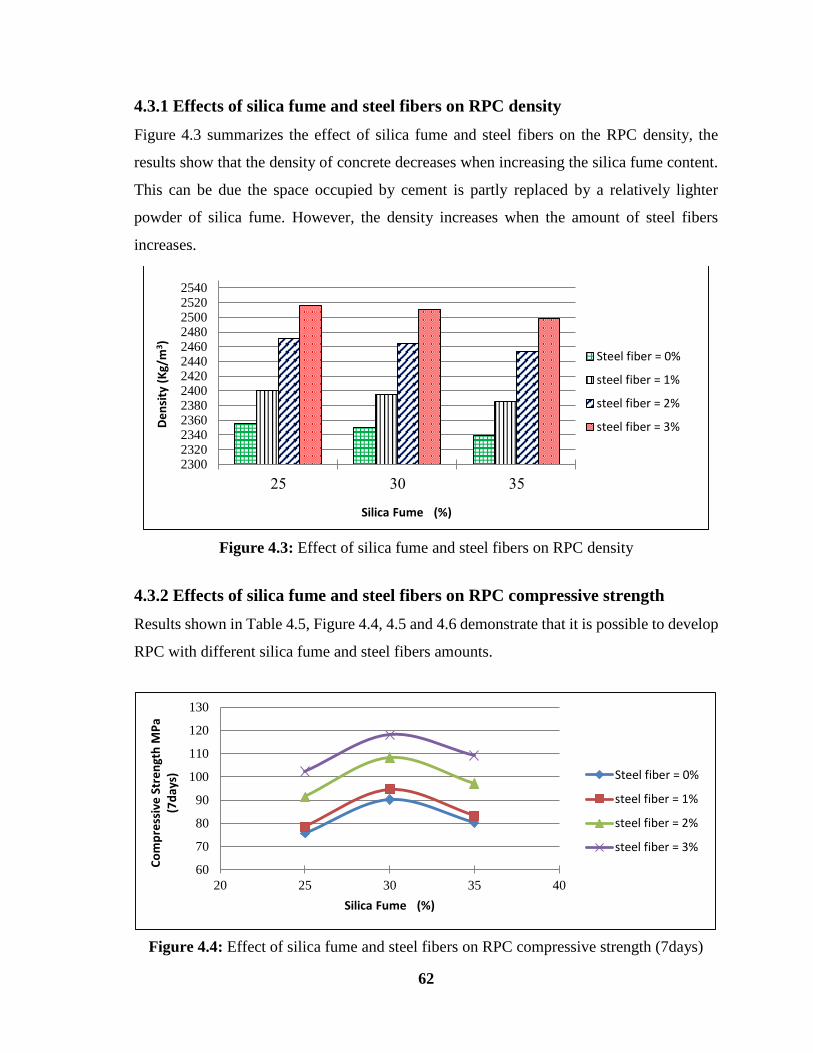
62
4.3.1 Effects of silica fume and steel fibers on RPC density
Figure 4.3 summarizes the effect of silica fume and steel fibers on the RPC density, the
results show that the density of concrete decreases when increasing the silica fume content.
This can be due the space occupied by cement is partly replaced by a relatively lighter
powder of silica fume. However, the density increases when the amount of steel fibers
increases.
Figure 4.3: Effect of silica fume and steel fibers on RPC density
4.3.2 Effects of silica fume and steel fibers on RPC compressive strength
Results shown in Table 4.5, Figure 4.4, 4.5 and 4.6 demonstrate that it is possible to develop
RPC with different silica fume and steel fibers amounts.
Figure 4.4: Effect of silica fume and steel fibers on RPC compressive strength (7days)
2300232023402360238024002420244024602480250025202540
81 36 31
De
nsi
ty (
Kg/
m3 )
Silica Fume (%)
Steel fiber = 0%
steel fiber = 1%
steel fiber = 2%
steel fiber = 3%
60
70
80
90
100
110
120
130
20 25 30 35 40
Co
mp
ress
ive
Str
en
gth
MP
a (7
day
s)
Silica Fume (%)
Steel fiber = 0%
steel fiber = 1%
steel fiber = 2%
steel fiber = 3%

63
Figure 4.5: Effect of silica fume and steel fibers on RPC compressive strength (14days)
Figure 4.6: Effect of silica fume and steel fibers on RPC compressive strength (28days)
It can be observed that increasing the silica fume content from 25% to 30% effectively
increases the compressive strength of concrete. However, increasing the silica fume content
from 30% to 35% decreases the compressive strength. It is shown that the optimal value of
silica fume is 30% (Mix M3-2) and this result agrees with Meleka et al. (2013).
This can be explained according to what have been mentioned earlier that the silica fume
works in two levels, the Pozzolanic reaction and the physical function. The hydration of
Portland cement produces many compounds; including calcium silicate hydrates (C-S-H)
80
90
100
110
120
130
140
150
160
20 25 30 35 40
Co
mp
ress
ive
Str
en
gth
MP
a (1
4d
ays)
Silica Fume (%)
Steel fiber = 0%
steel fiber = 1%
steel fiber = 2%
steel fiber = 3%
90
100
110
120
130
140
150
160
170
180
20 25 30 35 40
Co
mp
ress
ive
Str
en
gth
MP
a (2
8d
ays)
Silica Fume (%)
Steel fiber = 0%
steel fiber = 1%
steel fiber = 2%
steel fiber = 3%
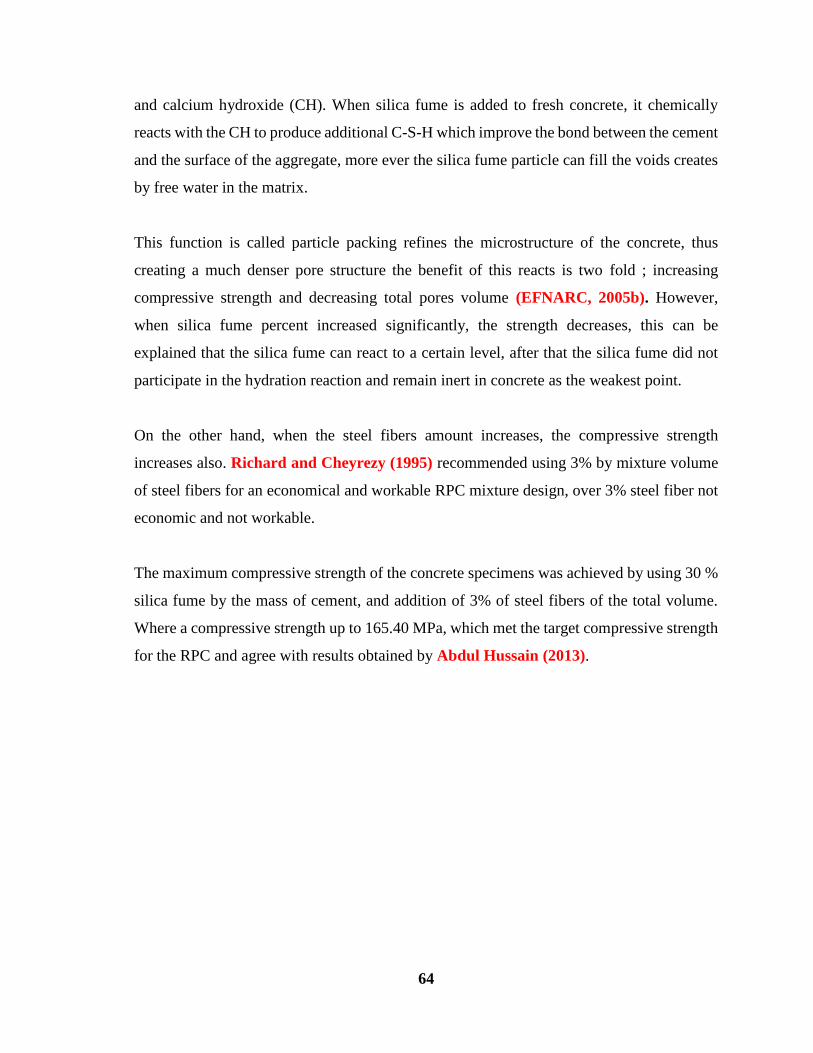
64
and calcium hydroxide (CH). When silica fume is added to fresh concrete, it chemically
reacts with the CH to produce additional C-S-H which improve the bond between the cement
and the surface of the aggregate, more ever the silica fume particle can fill the voids creates
by free water in the matrix.
This function is called particle packing refines the microstructure of the concrete, thus
creating a much denser pore structure the benefit of this reacts is two fold ; increasing
compressive strength and decreasing total pores volume (EFNARC, 2005b). However,
when silica fume percent increased significantly, the strength decreases, this can be
explained that the silica fume can react to a certain level, after that the silica fume did not
participate in the hydration reaction and remain inert in concrete as the weakest point.
On the other hand, when the steel fibers amount increases, the compressive strength
increases also. Richard and Cheyrezy (1995) recommended using 3% by mixture volume
of steel fibers for an economical and workable RPC mixture design, over 3% steel fiber not
economic and not workable.
The maximum compressive strength of the concrete specimens was achieved by using 30 %
silica fume by the mass of cement, and addition of 3% of steel fibers of the total volume.
Where a compressive strength up to 165.40 MPa, which met the target compressive strength
for the RPC and agree with results obtained by Abdul Hussain (2013).
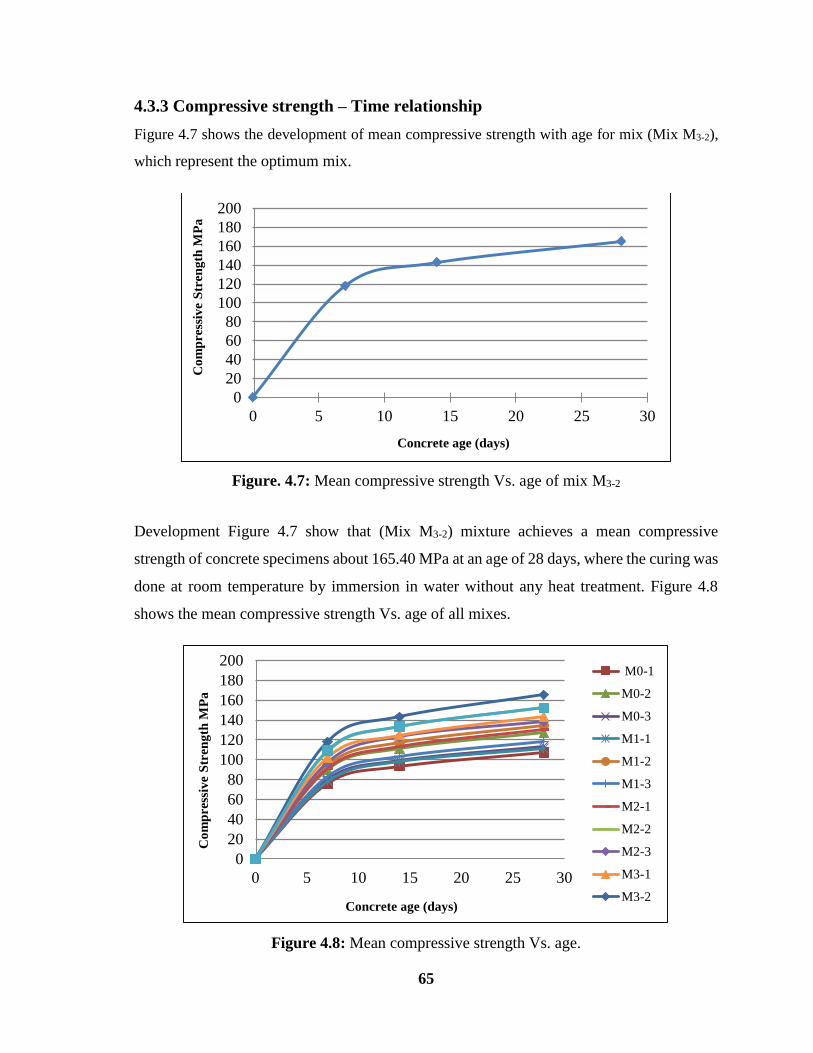
65
4.3.3 Compressive strength – Time relationship
Figure 4.7 shows the development of mean compressive strength with age for mix (Mix M3-2),
which represent the optimum mix.
Figure. 4.7: Mean compressive strength Vs. age of mix M3-2
Development Figure 4.7 show that (Mix M3-2) mixture achieves a mean compressive
strength of concrete specimens about 165.40 MPa at an age of 28 days, where the curing was
done at room temperature by immersion in water without any heat treatment. Figure 4.8
shows the mean compressive strength Vs. age of all mixes.
Figure 4.8: Mean compressive strength Vs. age.
0
20
40
60
80
100
120
140
160
180
200
0 5 10 15 20 25 30
Co
mp
ress
ive
Str
eng
th M
Pa
Concrete age (days)
0
20
40
60
80
100
120
140
160
180
200
0 5 10 15 20 25 30
Co
mp
ress
ive
Str
eng
th M
Pa
Concrete age (days)
M0-1
M0-2
M0-3
M1-1
M1-2
M1-3
M2-1
M2-2
M2-3
M3-1
M3-2
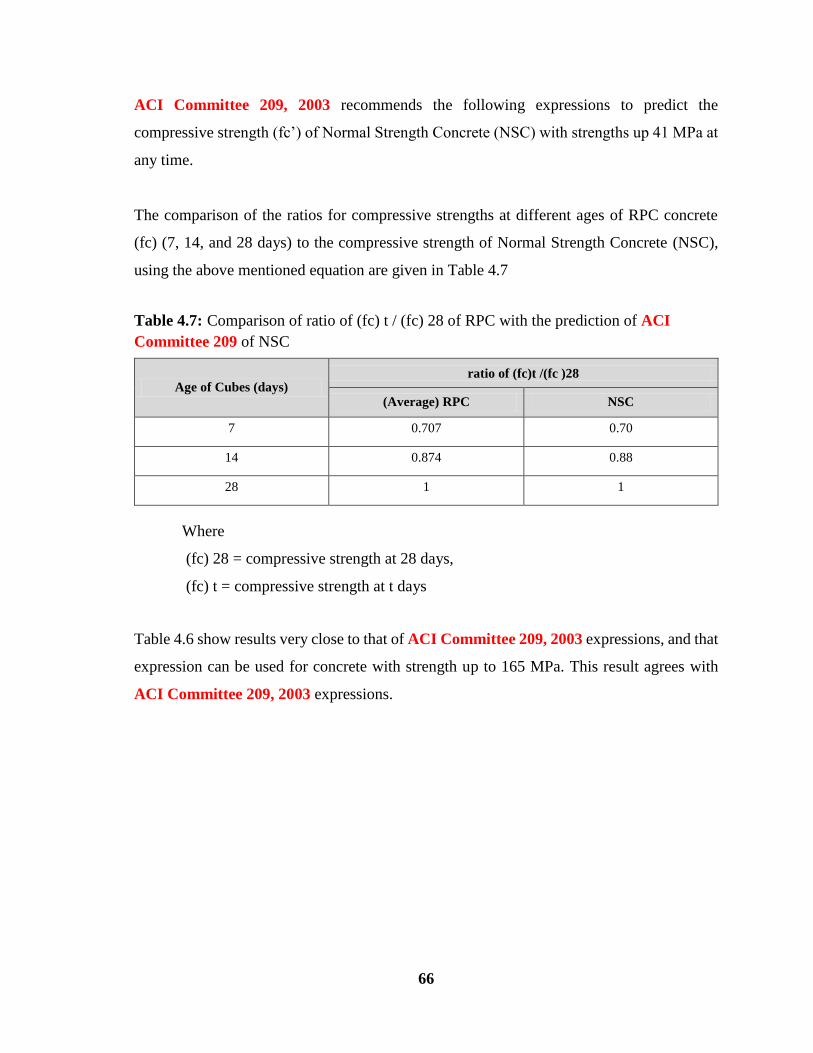
66
ACI Committee 209, 2003 recommends the following expressions to predict the
compressive strength (fc’) of Normal Strength Concrete (NSC) with strengths up 41 MPa at
any time.
The comparison of the ratios for compressive strengths at different ages of RPC concrete
(fc) (7, 14, and 28 days) to the compressive strength of Normal Strength Concrete (NSC),
using the above mentioned equation are given in Table 4.7
Table 4.7: Comparison of ratio of (fc) t / (fc) 28 of RPC with the prediction of ACI
Committee 209 of NSC
Age of Cubes (days) ratio of (fc)t /(fc )28
(Average) RPC NSC
7 0.707 0.70
14 0.874 0.88
28 1 1
Where
(fc) 28 = compressive strength at 28 days,
(fc) t = compressive strength at t days
Table 4.6 show results very close to that of ACI Committee 209, 2003 expressions, and that
expression can be used for concrete with strength up to 165 MPa. This result agrees with
ACI Committee 209, 2003 expressions.
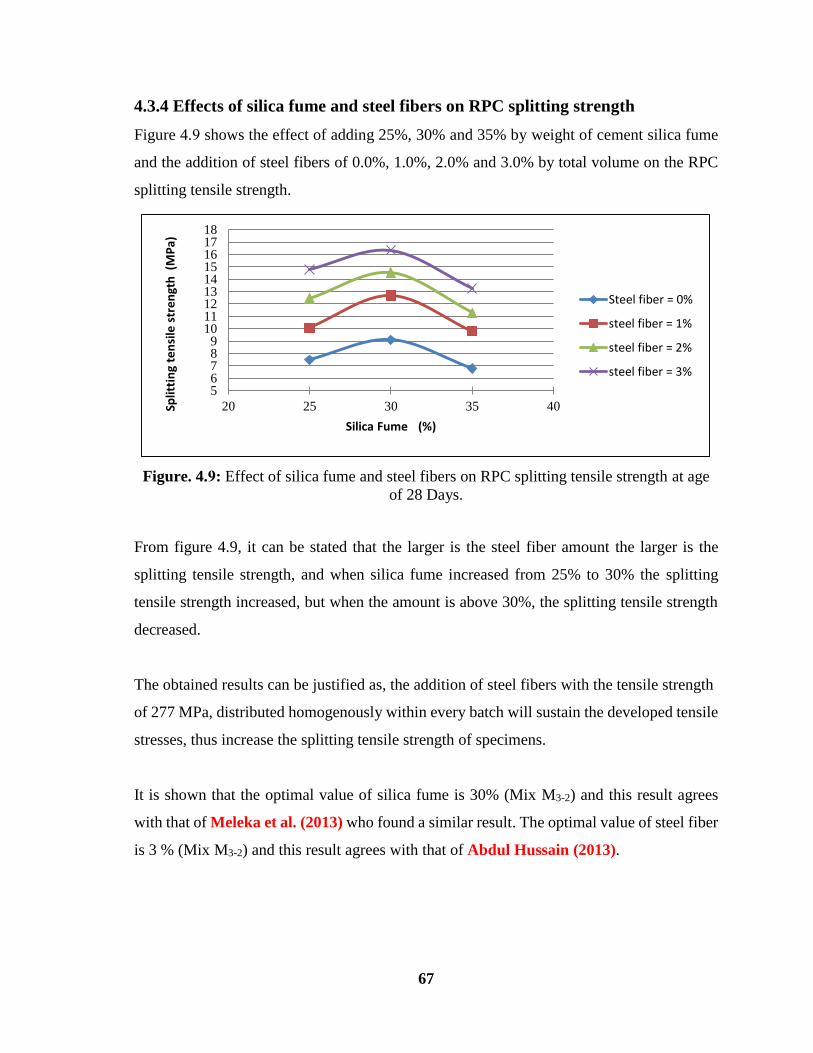
67
4.3.4 Effects of silica fume and steel fibers on RPC splitting strength
Figure 4.9 shows the effect of adding 25%, 30% and 35% by weight of cement silica fume
and the addition of steel fibers of 0.0%, 1.0%, 2.0% and 3.0% by total volume on the RPC
splitting tensile strength.
Figure. 4.9: Effect of silica fume and steel fibers on RPC splitting tensile strength at age
of 28 Days.
From figure 4.9, it can be stated that the larger is the steel fiber amount the larger is the
splitting tensile strength, and when silica fume increased from 25% to 30% the splitting
tensile strength increased, but when the amount is above 30%, the splitting tensile strength
decreased.
The obtained results can be justified as, the addition of steel fibers with the tensile strength
of 277 MPa, distributed homogenously within every batch will sustain the developed tensile
stresses, thus increase the splitting tensile strength of specimens.
It is shown that the optimal value of silica fume is 30% (Mix M3-2) and this result agrees
with that of Meleka et al. (2013) who found a similar result. The optimal value of steel fiber
is 3 % (Mix M3-2) and this result agrees with that of Abdul Hussain (2013).
56789
101112131415161718
20 25 30 35 40Split
tin
g te
nsi
le s
tre
ngt
h (
MP
a)
Silica Fume (%)
Steel fiber = 0%
steel fiber = 1%
steel fiber = 2%
steel fiber = 3%
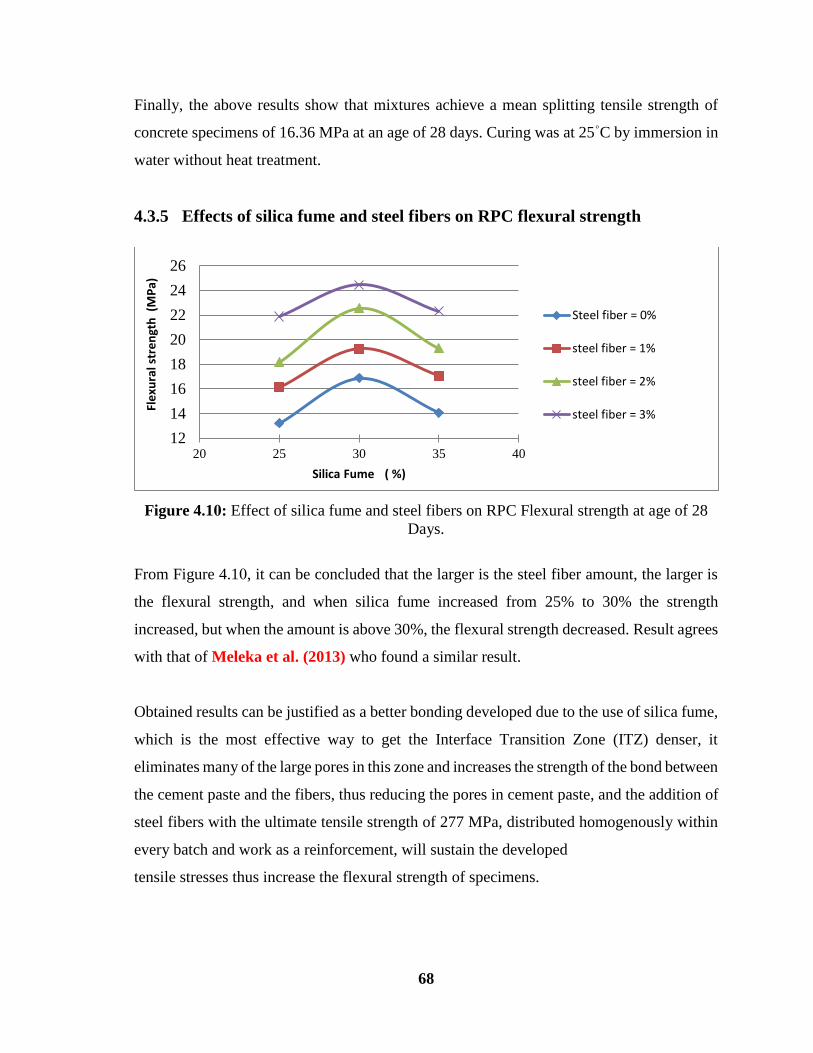
68
Finally, the above results show that mixtures achieve a mean splitting tensile strength of
concrete specimens of 16.36 MPa at an age of 28 days. Curing was at 25 ͦ C by immersion in
water without heat treatment.
4.3.5 Effects of silica fume and steel fibers on RPC flexural strength
Figure 4.11: Effect of silica fume and steel fibers on RPC Flexural strength at age of 28
Days.
From Figure 4.16, it can be concluded that the larger is the steel fiber amount, the larger is
the flexural strength, and when silica fume increased from 25% to 30% the strength
increased, but when the amount is above 30%, the flexural strength decreased. Result agrees
with that of Meleka et al. (2013) who found a similar result.
Obtained results can be justified as a better bonding developed due to the use of silica fume,
which is the most effective way to get the Interface Transition Zone (ITZ) denser, it
eliminates many of the large pores in this zone and increases the strength of the bond between
the cement paste and the fibers, thus reducing the pores in cement paste, and the addition of
steel fibers with the ultimate tensile strength of 277 MPa, distributed homogenously within
every batch and work as a reinforcement, will sustain the developed
tensile stresses thus increase the flexural strength of specimens.
12
14
16
18
20
22
24
26
20 25 30 35 40
Fle
xura
l str
en
gth
(M
Pa)
Silica Fume ( %)
Steel fiber = 0%
steel fiber = 1%
steel fiber = 2%
steel fiber = 3%
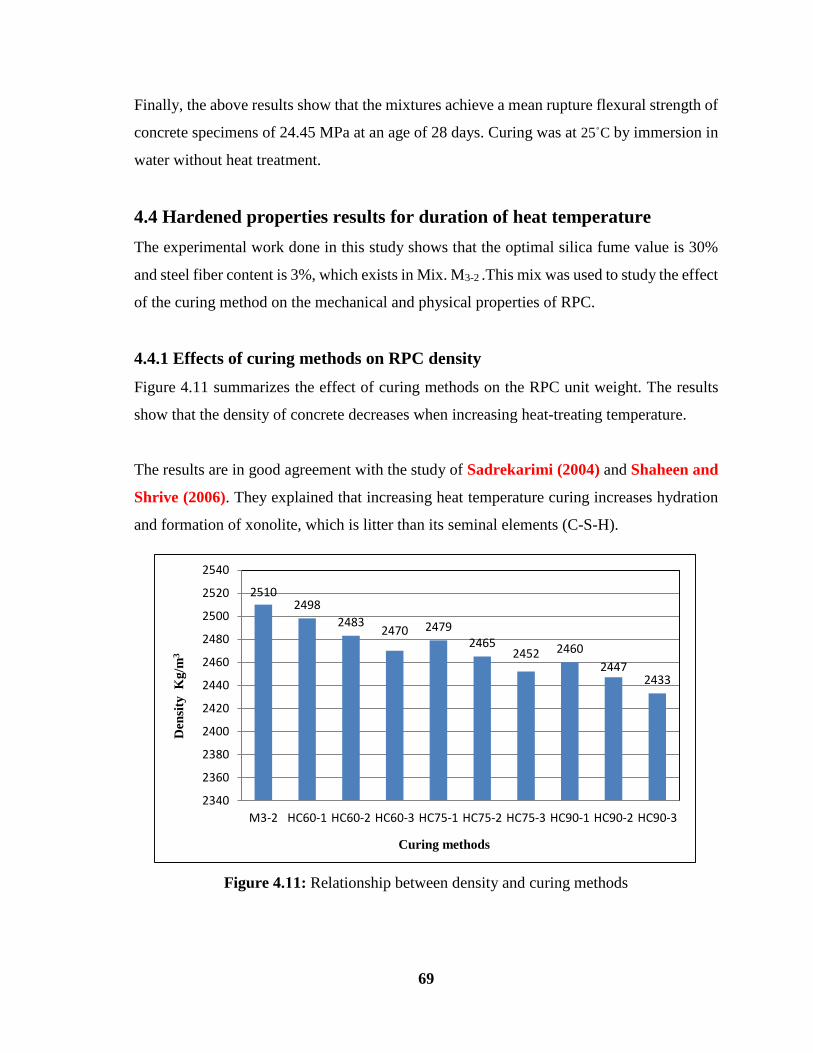
69
Finally, the above results show that the mixtures achieve a mean rupture flexural strength of
concrete specimens of 24.45 MPa at an age of 28 days. Curing was at 25 ͦ C by immersion in
water without heat treatment.
4.4 Hardened properties results for duration of heat temperature
The experimental work done in this study shows that the optimal silica fume value is 30%
and steel fiber content is 3%, which exists in Mix. M3-2 .This mix was used to study the effect
of the curing method on the mechanical and physical properties of RPC.
4.4.1 Effects of curing methods on RPC density
Figure 4.11 summarizes the effect of curing methods on the RPC unit weight. The results
show that the density of concrete decreases when increasing heat-treating temperature.
The results are in good agreement with the study of Sadrekarimi (2004) and Shaheen and
Shrive (2006). They explained that increasing heat temperature curing increases hydration
and formation of xonolite, which is litter than its seminal elements (C-S-H).
Figure 4.31: Relationship between density and curing methods
25102498
24832470 2479
24652452 2460
24472433
2340
2360
2380
2400
2420
2440
2460
2480
2500
2520
2540
M3-2 HC60-1 HC60-2 HC60-3 HC75-1 HC75-2 HC75-3 HC90-1 HC90-2 HC90-3
Den
sity
K
g/m
3
Curing methods
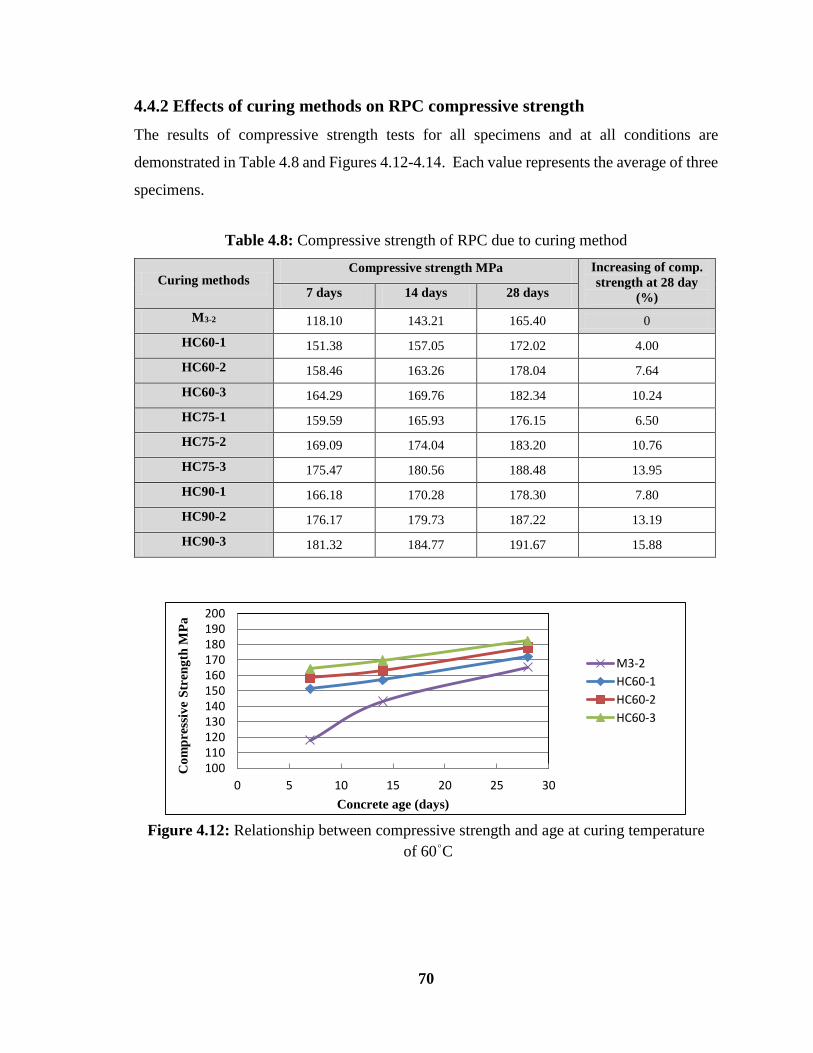
70
4.4.2 Effects of curing methods on RPC compressive strength
The results of compressive strength tests for all specimens and at all conditions are
demonstrated in Table 4.8 and Figures 4.12-4.17. Each value represents the average of three
specimens.
Table 4.8: Compressive strength of RPC due to curing method
Curing methods Compressive strength MPa Increasing of comp.
strength at 28 day
(%)
7 days 14 days 28 days
M3-2 118.16 143.21 165.46 0
HC60-1 151.38 157.05 172.02 4.00
HC60-2 158.46 163.26 178.04 7.64
HC60-3 164.29 169.76 182.34 10.24
HC75-1 159.59 165.93 176.15 6.50
HC75-2 169.09 174.04 183.20 10.76
HC75-3 175.47 180.56 188.48 13.95
HC90-1 166.18 170.28 178.36 7.80
HC90-2 176.17 179.73 187.22 13.19
HC90-3 181.32 184.77 191.67 15.88
Figure 4.12: Relationship between compressive strength and age at curing temperature
of 60 ͦ C
100110120130140150160170180190200
0 5 10 15 20 25 30
Co
mp
ress
ive
Str
eng
th M
Pa
Concrete age (days)
M3-2
HC60-1
HC60-2
HC60-3
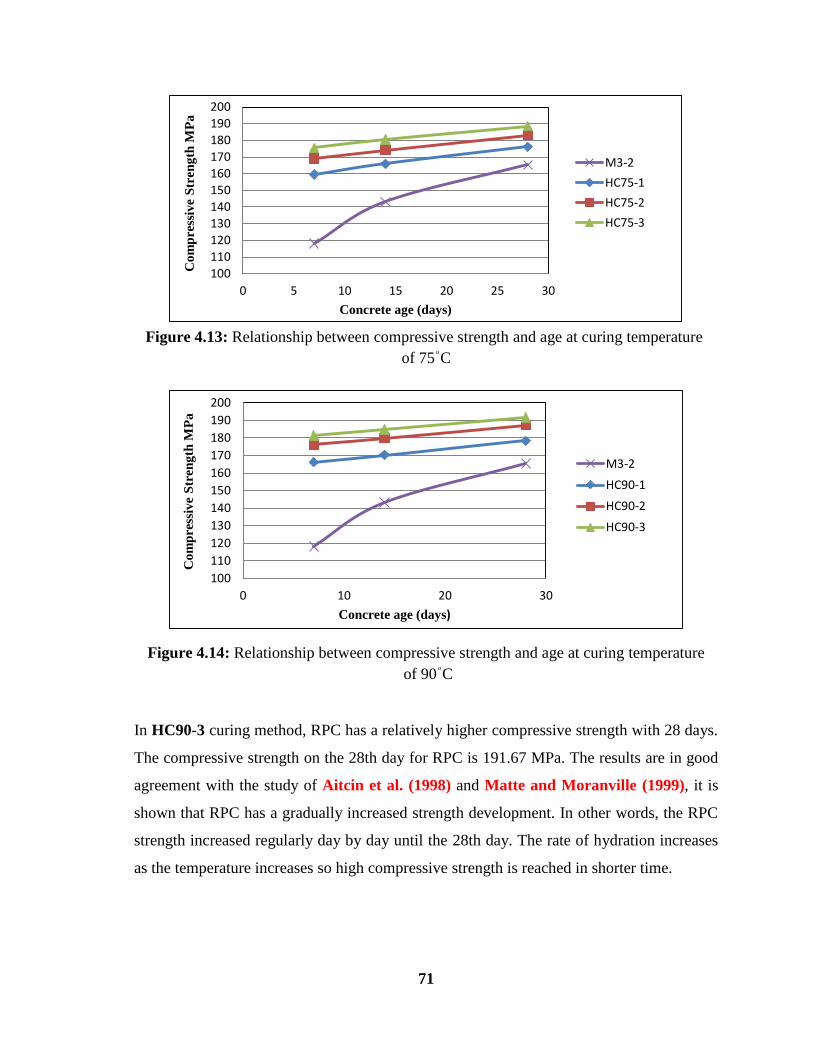
71
Figure 4.13: Relationship between compressive strength and age at curing temperature
of 75 ͦ C
Figure 4.14: Relationship between compressive strength and age at curing temperature
of 90 ͦ C
In HC90-3 curing method, RPC has a relatively higher compressive strength with 28 days.
The compressive strength on the 28th day for RPC is 191.67 MPa. The results are in good
agreement with the study of Aitcin et al. (1998) and Matte and Moranville (1999), it is
shown that RPC has a gradually increased strength development. In other words, the RPC
strength increased regularly day by day until the 28th day. The rate of hydration increases
as the temperature increases so high compressive strength is reached in shorter time.
100
110
120
130
140
150
160
170
180
190
200
0 5 10 15 20 25 30
Co
mp
ress
ive
Str
eng
th M
Pa
Concrete age (days)
M3-2
HC75-1
HC75-2
HC75-3
100
110
120
130
140
150
160
170
180
190
200
0 10 20 30
Co
mp
ress
ive
Str
eng
th M
Pa
Concrete age (days)
M3-2
HC90-1
HC90-2
HC90-3
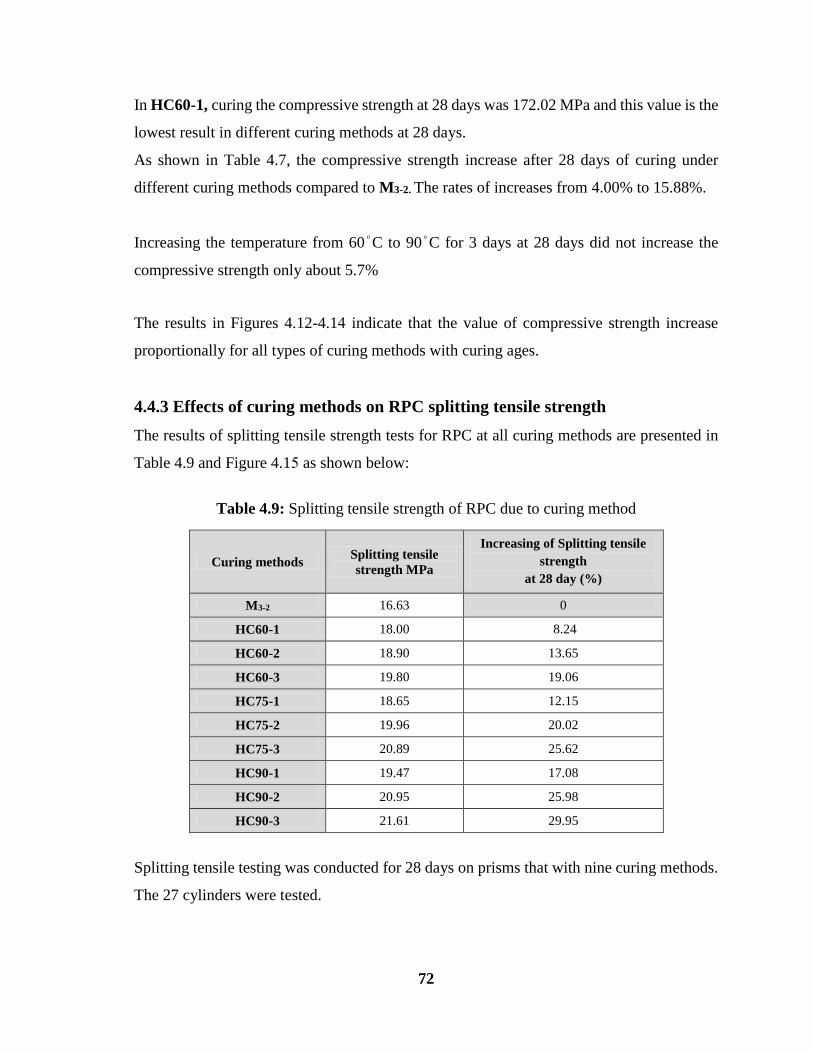
72
In HC60-1, curing the compressive strength at 28 days was 172.02 MPa and this value is the
lowest result in different curing methods at 28 days.
As shown in Table 4.7, the compressive strength increase after 28 days of curing under
different curing methods compared to M3-2. The rates of increases from 4.00% to 15.88%.
Increasing the temperature from 60 ͦ C to 90 ͦ C for 3 days at 28 days did not increase the
compressive strength only about 5.7%
The results in Figures 4.12-4.17 indicate that the value of compressive strength increase
proportionally for all types of curing methods with curing ages.
4.4.3 Effects of curing methods on RPC splitting tensile strength
The results of splitting tensile strength tests for RPC at all curing methods are presented in
Table 4.9 and Figure 4.11 as shown below:
Table 4.9: Splitting tensile strength of RPC due to curing method
Curing methods Splitting tensile
strength MPa
Increasing of Splitting tensile
strength
at 28 day (%)
M3-2 16.63 0
HC60-1 18.00 8.24
HC60-2 18.90 13.65
HC60-3 19.80 19.06
HC75-1 18.65 12.15
HC75-2 19.96 20.02
HC75-3 20.89 25.62
HC90-1 19.47 17.08
HC90-2 20.95 25.98
HC90-3 21.61 29.95
Splitting tensile testing was conducted for 28 days on prisms that with nine curing methods.
The 27 cylinders were tested.
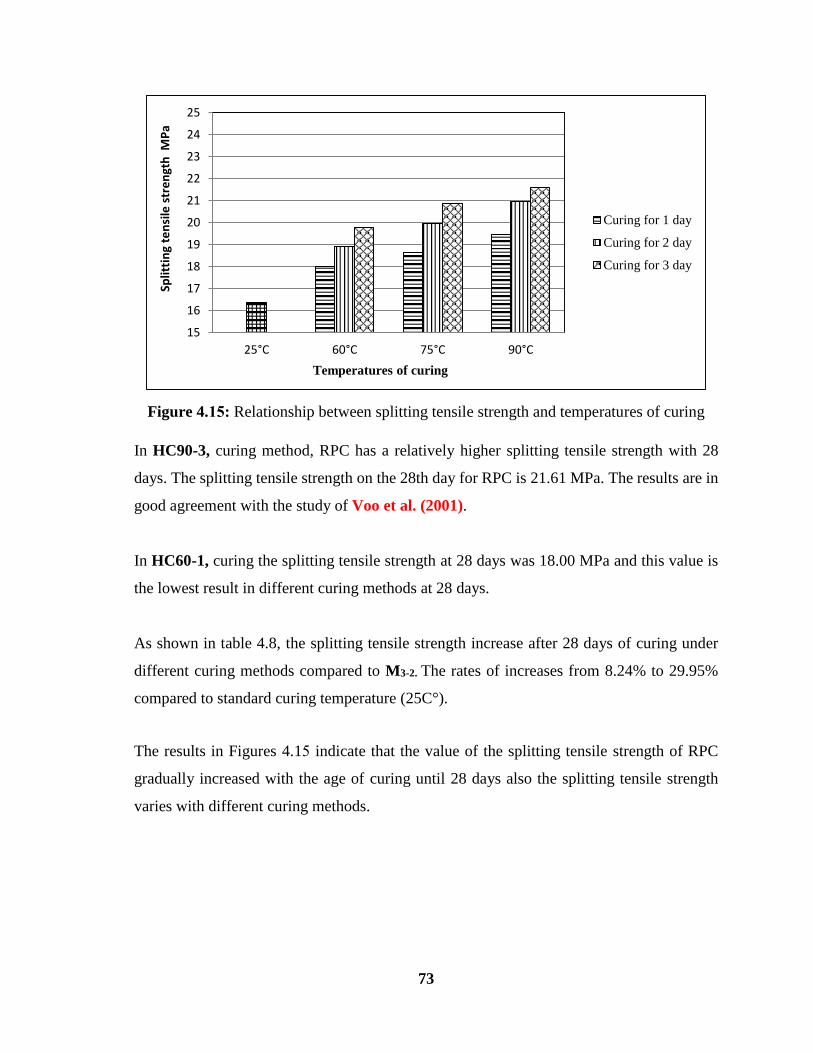
73
Figure 4.35: Relationship between splitting tensile strength and temperatures of curing
In HC90-3, curing method, RPC has a relatively higher splitting tensile strength with 28
days. The splitting tensile strength on the 28th day for RPC is 21.61 MPa. The results are in
good agreement with the study of Voo et al. (2001).
In HC60-1, curing the splitting tensile strength at 28 days was 18.00 MPa and this value is
the lowest result in different curing methods at 28 days.
As shown in table 4.8, the splitting tensile strength increase after 28 days of curing under
different curing methods compared to M3-2. The rates of increases from 8.24% to 29.95%
compared to standard curing temperature (25C°).
The results in Figures 4.11 indicate that the value of the splitting tensile strength of RPC
gradually increased with the age of curing until 28 days also the splitting tensile strength
varies with different curing methods.
15
16
17
18
19
20
21
22
23
24
25
25°C 60°C 75°C 90°C
Split
tin
g te
nsi
le s
tre
ngt
h M
Pa
Temperatures of curing
Curing for 1 day
Curing for 2 day
Curing for 3 day
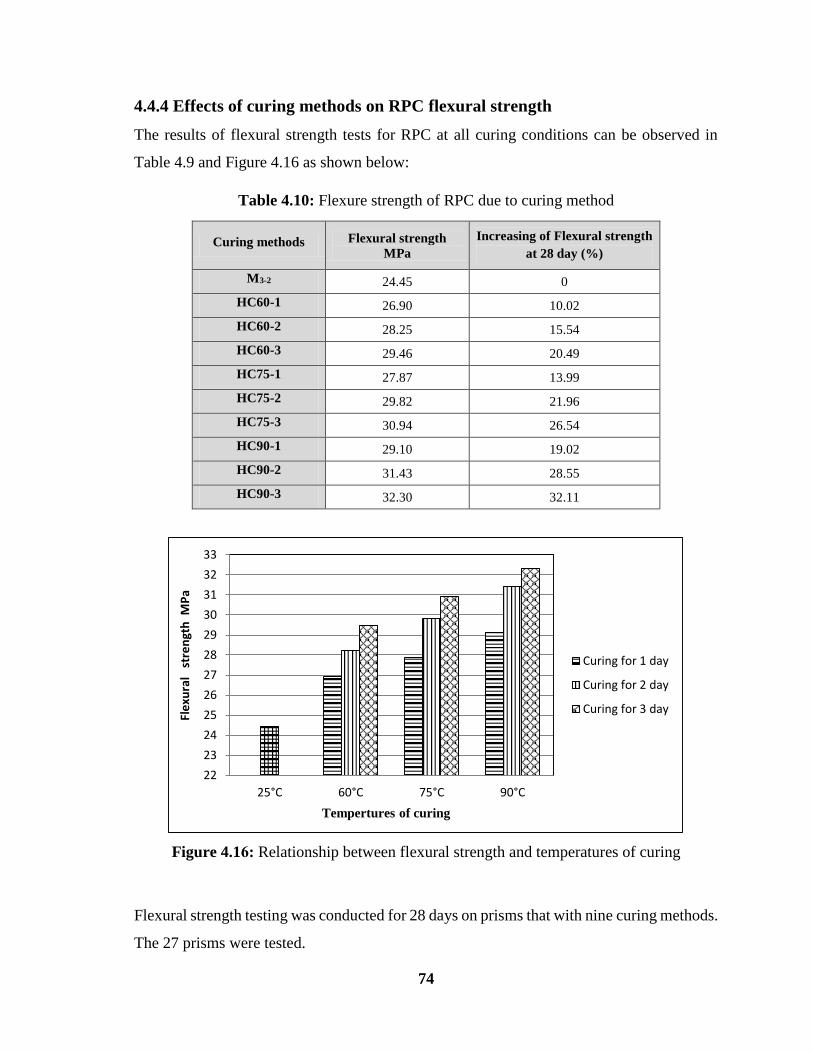
74
4.4.4 Effects of curing methods on RPC flexural strength
The results of flexural strength tests for RPC at all curing conditions can be observed in
Table 4.9 and Figure 4.16 as shown below:
Table 4.10: Flexure strength of RPC due to curing method
Curing methods Flexural strength
MPa
Increasing of Flexural strength
at 28 day (%)
M3-2 24.45 0
HC60-1 26.90 10.02
HC60-2 28.25 15.54
HC60-3 29.46 20.49
HC75-1 27.87 13.99
HC75-2 29.82 21.96
HC75-3 30.94 26.54
HC90-1 29.10 19.02
HC90-2 31.43 28.55
HC90-3 32.30 32.11
Figure 4.16: Relationship between flexural strength and temperatures of curing
Flexural strength testing was conducted for 28 days on prisms that with nine curing methods.
The 27 prisms were tested.
22
23
24
25
26
27
28
29
30
31
32
33
25°C 60°C 75°C 90°C
Fle
xura
l s
tre
ngt
h M
Pa
Tempertures of curing
Curing for 1 day
Curing for 2 day
Curing for 3 day
75
In HC90-1, curing method, RPC has a relatively higher flexural strength with 28 days. The
flexural strength on the 28th day for RPC is 32.30 MPa. The results are in good agreement
with the study of Dugat et al. (1996).
In HC60-1, curing the flexural strength at 28 days was 26.90 MPa and this value is the
lowest result in different curing methods at 28 days.
As shown in table 4.8, the flexural strength increase after 28 days of curing under different
curing methods compared to M3-2. The rates of increases from 10.02% to 32.11% compared
to standard curing temperature (25C°).
The results in Figures 4.16 indicate that the value of the flexural strength of RPC gradually
increased with the age of curing until 28 days also flexural strength varies with different
curing methods.
76
Chapter (5)
Conclusions and Recommendations
RPC is a relatively new form of concrete, which is used for general applications. The main
advantage that RPC has over standard concrete is its high compressive strength, relatively
high tensile and flexural strength, low porosity and high durability and self-compacting
properties. The objective of this research was to produce RPC using available materials in
Gaza strip. The experimental phase of this research focused on determining the mechanical
behavior of RPC. The laboratory tests determined the different fresh properties,
compressive, flexural and indirect tensile strength of RPC. The analytical phase of this
research focused and elaborated on the results obtained from the experimental phase. In
terms of effect of heat temperatures curing at 60 ͦ C, 75 ͦ C and 90 ͦ C for 1 day, 2 day and 3
day was studied. The conclusions are explained in this chapter and some recommendations
for further studies are presented.
5.1 Conclusions
5.1.1 Generals
The production of RPC in Gaza strip using materials available at the local markets are carried
out compressive strength of 165.40 MPa at the age of 28 days at normal water curing
temperature 25 ͦ C is achieved. Also compressive strength of 191.15 MPa at the age of 28
days at curing at 90 ͦ C for 3 days is obtained.
RPC is suitable for precasting concrete and can achieve compressive strength value
exceeding 191.15 MPa at heat curing.
Such concretes can be produced with cement, W/C of 0.28, steel fibers 3% (by total volume)
, quartz sand, crushed quartz powder, and silica fume 30% (by the weight of cement) as the
mineral admixture 2.0% superplasticizer (by the weight of cement).
77
5.1.2 Fresh properties
1) Increasing silica fume content from 25% to 30% and then to 35% leads to a decrease
in the slump flow values of the RPC.
2) Increasing the steel fibers content will slightly decrease the slump flow values of the
RPC. For example at silica fume content 30 % the slump flow decrease about
2.45%,4.11% and 5.53% at 1.0%, 2.0% and 3.0% steel fiber by total volume on the
RPC.
3) Increasing silica fume content from 25% to 30% leads to a slight increase in the V-
funnel time, which results in decreasing the RPC viscosity, but concrete still being
classified as self-compacted concrete.
4) Increasing silica fume percent to 35% leads to an increase in the V-funnel time which
results in decreasing the RPC viscosity, and concrete cannot be classified as self-
compacted concrete any more.
5) In all trial mixtures, where the W/C was constant and equal to 0.28, no segregation
was observed and all mixtures were homogenous and fibers were well distributed
through every batch.
5.1.3 Hardened properties
Density of RPC
1) The densities of RPC decreases as silica fume content increases, while keeping other
contents constant.
2) The densities of RPC increases as steel fibers content increases, adding steel fiber
(by the total volume) 1.0%, 2.0% and 3.0% increase the density at the 28 days by
about 2.0%, 5.0% and 6.75% with respect plain RPC while keeping other contents
constant.
78
3) The densities of RPC decreases as heat temperatures curing increases. For example,
curing temperatures at 60 ͦ C, 75 ͦ C and 90 ͦ C for 3 days decreases the density at the
28 days by about 1.60%, 2.31% and 3.07% with respect normal water curing at 25 ͦ
C.
4) The densities of RPC decreases as curing time increases. For example curing time at
90 ͦ C for 1day, 2days and 3days decreases the density at the 28 days by about 8.39%,
2.51% and 3.07% with respect normal water curing at 25 ͦ C.
Compressive strength of RPC
1) It is possible to develop RPC with different silica fume and steel fibers contents. For
25 %, 30% and 35% silica fume, very high compressive strength RPC with 143.52
MPa, 165.40 MPa, and 152.35 MPa respectively can be achieved as steel fibers
content is 3% by the total volume.
2) Increasing the silica fume content from 25% to 30% effectively increases the
compressive strength of RPC, at steel fiber content (by the total volume) 0.0%, 1.0%,
2.0% and 3.0% increases the compressive strength at the 28 days by about 18.70%,
20.50%, 16.75% and 15.25% . But increasing the silica fume content from 30% to
35% decreases the compressive strength of RPC, at steel fiber (by the total volume)
0.0%, 1.0%, 2.0% and 3.0% decreases the compressive strength at the 28 days by
about 10.80%, 12.00%, 9.50% and 7.90%.
3) When the steel fibers content increases, the compressive strength increases also. For
example at silica fume content 30% the compressive strength increase at the 28 days
by about 5.26%, 19.61% and 29.77% at steel fiber content (by the total volume)
1.0%, 2.0% and 3.0% with respect plain RPC.
4) The compressive strength of RPC increases as heat temperatures curing increases.
For example curing temperatures at 60 ͦ C, 75 ͦ C and 90 ͦ C for 3 days increases the
compressive strength at the 28 days by about 10.25%, 13.95% and 15.90% with
respect the compressive strength at normal water curing at 25 ͦ C.
79
5) The compressive strength of RPC increases as curing time increases. For example
curing time at 90 ͦ C for 1day, 2days and 3days decreases the compressive strength at
the 28 days by about 7.80%, 13.20% and 15.90% with respect normal water curing
at 25 ͦ C.
Splitting tensile strength of RPC
1) When the steel fibers content increases, the splitting tensile strength of RPC increases
also. For example at silica fume content 30% the splitting tensile strength increase at
the 28 days by about 39.55%, 59.90% and 79.80% at steel fiber content (by the total
volume) 1.0%, 2.0% and 3.0% with respect plain RPC
2) When silica fume increased from 25% to 30%, the splitting tensile strength of RPC
increased, but when the content is above 30%, the splitting tensile strength decreased.
3) The splitting tensile strength of RPC increases as heat temperatures curing increases.
For example curing temperatures at 60 ͦ C, 75 ͦ C and 90 ͦ C for 3 days increases the
splitting tensile strength at the 28 days by about 19.05%, 25.60% and 29.95% with
respect the splitting tensile strength at normal water curing at 25 ͦ C.
4) The splitting tensile strength of RPC increases as curing time increases. For example
curing time at 90 ͦ C for 1day, 2days and 3days decreases the splitting tensile strength
at the 28 days by about 17.10%, 26.00% and 30.00% with respect normal water
curing at 25 ͦ C.
Flexural strength of RPC
1) When the steel fibers content increases, the flexural strength of RPC increases also.
For example at silica fume content 30% the flexural strength increase at the 28 days
by about 14.05%, 33.65% and 44.85% at steel fiber content (by the total volume)
1.0%, 2.0% and 3.0% with respect plain RPC
2) When silica fume increased from 25% to 30%, the flexural strength of RPC
increased, but when the content is above 30%, the flexural strength decreased.
80
3) The flexural strength of RPC increases as heat temperatures curing increases. For
example curing temperatures at 60 ͦ C, 75 ͦ C and 90 ͦ C for 3 days increases the
flexural strength at the 28 days by about 20.50%, 26.55% and 32.10% with respect
the flexural strength at normal water curing at 25 ͦ C.
4) The flexural strength of RPC increases as curing time increases. For example curing
time at 90 ͦ C for 1day, 2days and 3days decreases the flexural strength at the 28 days
by about 19.00%, 28.55% and 23.10% with respect normal water curing at 25 ͦ C.
5.2 Recommendations for future research
Having carrying out this study several suggested for further research can be summarized as
follows:
1) The influences of cement type and steel fibers aspect ratio on the mechanical property
of RPC need to be taken into consideration.
2) Durability of RPC (Performance under high-temperatures, permeability, mechanism
of strength development, chemical resistance and fire resistance), need to be studies.
3) Short term mechanical properties of RPC (Drying Shrinkage, creep, the stress – strain
behavior in compression, the stress – strain behavior in tension and static and
dynamic modulus), should be investigated.
4) Benefits of different curing method of RPC can be evaluated in the research
laboratory.
5) Other curing methods for RPC can be studies.
6) Long-term performance of RPC can be evaluated.
7) Effect of curing on the microstructure of RPC will be a very important study for
future researches.
81
References
1. Aarsleff, L., Bredal-Joregensen, J. and Poulsen, E. (1985), “On the properties of ultra
high strength concrete with particular reference to heat of hydration", Very High
Strength Cement-Based Materials, Materials Research Society Symposia
Proceedings, Vol. 42, pp. 19-29.
2. Abdul Hussain, S. T. (2013), "Effect of Elevated Temperatures on Compressive and
Tensile Strengths of Reactive Powder Concrete", Journal of Engineering and
Development, Vol. 17, No.4, December 2013, ISSN 1813- 7822.
3. ACI (1979) State of the Art Report on High-Strength Concrete. American Concrete
Institute.
4. ACI (1998) Standard Specification for Curing Concrete. American Concrete
Institute.
5. ACI 209R-92, 2003, "Prediction of creep, shrinkage, and temperature effect in
concrete structures", ACI Manual of Concrete Practice part 1.
6. ACI 548.6R-96 (2003), "Guide for the Use of Silica Fume in Concrete" ACI Manual
of Concrete Practice part 2.
7. Ahlborn, T. M., Harris, D. K., Misson, D. L., and Peuse, E. J. (2008). “Ultra High
Performance Concrete”. Second International Symposium on Ultra High
Performance Concrete. Kassel, Germany.
8. Aitcin, P. C., Delagrave, Y., and Beck. B. (2000). “A 100-m High Prefabricated
Concrete Pole: Why not? ". Proceedings of the IEEE International Conference on
Transmission and Distribution, Construction, and Live Line Maintenance, pp. 365-
374.
9. Aitcin, P.C., Lachemi, M., Adeline, R., and Richard, P. (1998). "The Sherbrooke
Reactive Powder Concrete Footbridge". Structural Engineering
international,Vol.(8), No.(2), PP. 140-144
10. Alamri, A. M. (1988). “Influence of curing on the properties of concrete and mortars
in hot climates”. Leeds University, U.K.
11. Almassri, H.G., Abu-Sultan A.A.a nd Al-Nirib, S.S. (2013), " Ultra High
Performance Self Compacting Concrete with Polypropylene Fiber" Search graduated
Bachelor of Civil Engineering Department, Faculty of Engineering, Islamic
University, Gaza, Palestine.
82
12. Appa Rao, G. (2003). "Investigations on the performance of silica fume-incorporated
cement pastes and mortars". Cement and Concrete Research, Vol. 33, PP. 1765-1770
13. Arafa, M, Shihada, S. and Karmout, M. (2010). “Mechanical Properties of Ultra High
Performance Concrete Produced in Gaza Strip”. Asian Journal of Materials Science.
Vol. 2, No. 1, PP. 1-12
14. Arafa, M, Shihada, S. and Al Madhoun , A. (2013). " Mechanical Properties of Ultra
High PerformanceFiber Reinforced Self Compacted Concrete" International Journal
of Engineering and Advanced Technology (IJEAT). Volume-3, Issue-1, October,
2013
15. Arafah, A., Al-Haddad, M., Al-Zaid, R., and Siddiqi, G. (1995). “Influence of Non -
Standard Curing on the Strength of Concrete in Arid Areas”. Cement and Concrete
Research, Volume 26, No. 9, pp. 1341-1350.
16. ASTM C109, (2004). “Standard Test Method for Compressive Strength of cube
Concrete Specimens”. American Society for Testing and Materials Standard Practice
C109, Philadelphia, Pennsylvania.
17. ASTM C128, (2004). “Standard Test Method for Specific gravity and absorption of
fine aggregate”, American Society for Testing and Materials Standard Practice C128,
Philadelphia, Pennsylvania.
18. ASTM C293, (1994). “Standard Test Method for Flexural Strength of Concrete
(Using Simple Beam with center-Point Loading)”. American Society for Testing and
Materials Standard Practice C293, Philadelphia, Pennsylvania.
19. ASTM C494, (2004). Standard Specification for Chemical Admixtures for Concrete.
American Society for Testing and Materials Standard Practice C494, Philadelphia,
Pennsylvania.
20. ASTM C496. (2004). “Standard Test Method for Splitting Tensile Strength of
Cylindrical Concrete Specimens”. American Society for Testing and Materials
Standard Practice C496, Philadelphia, Pennsylvania.
21. ASTM C566. (2004). “Standard Test Method for Bulk density (" Unit weight") and
Voids in aggregate”. American Society for Testing and Materials Standard Practice
C566, Philadelphia,Pennsylvania.
22. ASTM C642. (2004). “Standard Test Method for density, absorption, and voids in
hardened concrete”. American Society for Testing and Materials Standard Practice
C642, Philadelphia, Pennsylvania.
83
23. Austin, S. A., Robins, P. J. and Issaad, A. (1992) “Influence of curing methods on
the strength and permeability of GGBFS concrete in a simulated arid climate”,
Cement and Concrete Composites, Vol. 14, PP. 157-167.
24. Baache, H. H. (1981). “Superplasticizers in Concrete”. Proceedings of the 2nd
International Conference on Superplasticizers in Concrete, Ottawa, Ontario, Canada, 10-12
June 1981. CBL RAPPORT NR. 40
25. Bamforth, P., Chisholm, D., Gibbs, J., and Harrison, T. (2008). “Properties of
Concrete for use in Eurocode 2”. The Concrete Centre, CCIP-026.
26. Behnood, A. and Ziari, H. (2008). "Effects of silica fume addition and water to
cement ratio on the properties of high-strength concrete after exposure to high
temperatures", Cement & Concrete Composites, Vol. 30, PP. 106-112.
27. Birchall, J.D. (1983). "Cement in the context of new materials for an energy-
expensive future". Phil. Trans. R. Soc. Lond. A310, PP. 31-42.
28. Blais, P. Y. and Couture, M. (1999). “Precast, Prestressed Pedestrian Bridge —
World’s First Reactive Powder Concrete Structure”. PCI Journal, Vol.44, PP. 60–71.
29. Bonneau, O., Lachemi, M., Dallaire, E., Dugat, J., and Aitcin, P.C. (1997).
"Mechanical Properties and Durability of Two Industrial Reactive Powder
Concretes". ACI Materials Journal, Vol. 94, No. 4, PP. 286-290
30. British Standard Institution, BS EN 197-1:2000, Cement- Part 1 : Compostion,
Specificatios and conformity criteria for common cements
31. Campbell, R. L., Oneil, E. F., Dowd, M. D. and Dauriac, C. (1998)." Report CPAR-
SL-98-3: Reactive powder concrete for producing sewer, culvert and pressure pipes."
US Army corps of Engineers - Waterways Experiment Station, Mississippi, USA.
32. Carrier, R. E. (1983). “Concrete curing tests”. Cement and concrete research. Vol. 5,
Issue. 4, PP. 23-26.
33. Cather, R. (1994). “How to Get Better Curing Concrete”. The Journal of the Concrete
Society, London, V. 26, No. 5, Sept.-Oct., PP. 22-25.
34. Cavill, B. (1999) "Prestressed concrete without conventional reinforcement."
Concrete 99, 19th Biennial Conference of Concrete Institute of Australia, Australia,
PP. 230-238
84
35. Cheyrezy, M., Maret, V. and Frouin, L. (1995). “Microstructural analysis of RPC
(Reactive Powder Concrete)”. Cement and Concrete Research, Vol. 25, No. 7, PP.
1491-1500.
36. Collepardi, M. (2003)"Innovative concretes for civil engineering structures: SCC,
HPC and RPC." The Workshop on New Technologies and material in Civil
Engineering, Milan, Italy, PP. 1-8
37. Collepardi, M., Collepardi, S., Troli, R., and Coppola, L. (2003). “Innovative
Concretes (SCC, HPC and RPC) in the Field of Architectural, Civil and
Environmental Engineering”. Proceedings of the Sixth CANMET / ACI International
Conference on Recent Advances in Concrete Technology Proceedings.
38. Collepardi, M., Moriconi, G, Pauri, M., Biagini, and Alvera, I. (1990).
"Superplasticized Silica Fume High-Strength Concretes ". Admixtures for Concrete:
Improvement of Properties, Proceedings of the International Symposium held by
RILEM, Barcelona, Spain; Ed. by E. Vazquez; Chapman and Hall, London, pp. 175-
182.
39. Cwirzen, A. (2007). “The effect of the heat – treatment regime on the concrete”.
Advances in Cement Research,Vol. 19, No. 1 January, PP. 25-30.
40. Cwirzen, A., Penttala, V., & Vornanen, C. (2008). “Reactive powder based
concretes: Mechanical properties, durability and hybrid use with OPC”. Cement and
Concrete Research, Vol. 38, PP. 17-27.
41. Cyr, M.F. and Shah, S. (2002). “Advances in concrete technology”. Advances in
Building Technology, Vol. 1, PP. 17-27.
42. Dallaire, E., Aitcin, P. C. and Lachemi, M. (1998)"High performance powder." Civil
Engineering-ASCE, Vol. 68, No. 1, PP. 48-51
43. Dauriac, C. (1997). “Special concrete may give steel stiff competition”. The Seattle
Daily, Journal of Commerce, website available at
http://www.djc.com/special/concrete97/10024304.html.
44. Dowd, W. (1999). “Reactive Powder Concrete – Ultra-High Performance Cement
Based composite”. NOVA award nomination, Construction Innovation Forum,
website available at http://www.cif.org/nominations/nom_319.html.
45. Dugat, J., Roux, N., and Bernier. (1996). "Mechincal properties of reactive powder
concrete". Vol.(29), PP. 233-240
46. EFNARC. (2005a). “Specifications and Guidelines for Self Compacting Concrete”.
EFNARC, UK (www.efnarc.org).
85
47. EFNARC. (2005b). The European Guidelines for Self Compacting Concrete.
Production and Use, bibm, CEMBUREAU, EFCA, EFNARC, ERMCO.
48. EUROCODE. (2006). “Execution of concrete structures”. is a Prestandard developed
by the European Committee for Standardization.
49. Feylessoufi, A., Crespin.M., Dion.P., Bergaya.F., Van Damme.H., and Richard.P.
(1997). “Controlled Rate Thermal Treatment of Reacitve Powder Concretes”.
Elsevier Science Ltd., ISSN 1065-7335/97, Advanced Cement Bas. Mat., PP. 23-27.
50. Gilbertm, R. I., Gowripalan, N., and Cavill, B. (2000). “ On the design of precast,
prestressed reactive powder concrete (DUCTAL) girders”. 4th Austroads Bridge
Engineering Conference, Adelaide, Australia, PP. 313-314.
51. Gonen, T. and Yazicioglu, S. (2009). “The influence of mineral admixtures on the
short and long term performances of concrete”. department of construction
education, Firat University, Elazig 23119,Turkey.
52. Gowripalan, N., Dumitru, I., Smorchevsky, G., Marks, R. and D'Souza, B. (1999).
"Development of modified reactive powder concrete for precast applications in
Australia." Concrete 99, 19th Biennial Conference of CIA, Australia, PP.105-112.
53. Gowripalan, N., Watters, R., Gilbert, R. I. and cavill, B. (2003) "Reactive powder
concrete for precast structural concrete-research and development in Australia." 21st
Biennial conference of the concrete institute of Australia, Brisbane, Australia, PP.
99-108
54. HDR Inc. (2002)."Concrete mixture proportions." HDR Website, HDR Inc.,Omaha
55. Hannant, D.J., Huges, D.C. and Kelly, A. (1983). “Technology in the 1990s:
Developments in Hydraulic Cements”. The Royal Society, London, PP. 175.
56. Haque, M. (1990). “Some concretes need 7 days initial curing”. Concrete
International, 12, pp. 42-46.
57. Holland, T. C. (1989). “Working With Silica Fume in Ready-Mixed Concrete-USA
Experience”. CANMET/ACI Third International Conference. Trondheim, Norway,
Proceedings, V.2, pp. 763-781.
58. Houssam, A. and Ziad, B. (1999). “Effect of curing procedures on properties of silica
fume concrete”. Cement and Concrete Research, pp. 497-501.
59. Huang, Z. and Shen, P. (1993). “Experimental study on 200 MPa ultra-high steel
fiber concrete”. Concrete, Vol. 3, pp. 3-7.
86
60. Jennings , H. (2000). "A Model for the Microstructure of Calcium Silicate Hydrate
in Cement Paste". Vol. 30. Cement and Concrete Research.
61. Ji, W.Y., An, M.Z., Yan, G.P. and Wang, J.M. (2004). “Study on Reactive Powder
Concrete used in the Sidewalk System of the Qinghai-Tibet Railway Bridge”.
Proceedings of the International Workshop on Sustainable Development and
Concrete Technology, Beijing.
62. Jungwirth, J. (2005). “Structural Behaviour of Tension Members Constructed of
Ultra-high Performance Fibre Reinforced Concrete”. PhD Thesis, Structural
Concrete Laboratory, Swiss Federal Institute of Technology, Lausanne, Switzerland.
63. Kamen, A., Denarie, E. and Bruhwiler, E. (2007). "Thermal Effects on Physic
Mechanical Properties of Ultra-High Performance Fiber-Reinforced Concrete ".ACI
Materials Journal. Vol. 104, No. 4, PP. 415-423
64. Kelham, S. (1996). “The Effect of Cement Composition and Fineness on Expansion
Associated with Delayed Ettringite Formation”. Cement and Concrete Composites,
V. 18, PP. 171-179.
65. Kern, R, Cervinka, S. and Weber, R. (1995). “Efficiency of Curing Methods".
Darmstadt Concrete. Vol. 10, PP. 117-122.
66. Khan, M. and Ayers, M. E. (1992). “Interrupted concrete curing”. Concrete
International: Design and Construction, Vol. 14, PP. 25-28
67. Kovler, K., Schamban, I., Igarashi, S. and Bentur, A. (2000). “Influence of mixture
proportions and curing conditions on compressive strength of high performance
concrete”. ACI Materials Journal,Vol. 97.
68. Kwan, A.H.K. (2003). “Development of High Performance Concrete for Hong
Kong”. Materials Science and Technology in Engineering Conference - Now, New
and Next, website available at http://www.hkpc.org/hkiemat/mastec03_notes/03.pdf.
69. Lawend, K., askar, Bassam A. Tayeh and B.H. Abu Bakar. (2013). “Effect of
Different Curing Conditions on the Mechanical Properties of UHPFC”. Iranica
Journal of Energy & Environment 4 {(3) Geo-hazards and Civil Engineering)}: ISSN
2079-2115, PP. 209-303.
70. Lee, N.P. and Chisholm, D.H. (2005). “Study Report Reactive Powder Concrete”.
BRANZ, Vol. 146, PP. 1-29.
71. Liu, C.T. and Huang, J.S. (2008). “Highly flowable reactive powder mortar as a
repair material”. Construction and Building Materials, Vol. 22, No.6, PP. 1043-1050.
87
72. Lok, Y.K. (2007). “The influence of mineral admixture and superplasticizer on the
rheological behavior of cement paste”. M. Phil. Thesis of the City University of Hong
Kong.
73. Long, G.C., Wang, X.Y. and Xie, Y.J. (2002). “Very-high-performance concrete
with ultrafine powders”. Cement and Concrete Research, Vol. 32, PP. 601-605.
74. Ma, J.X. and Schneider, H. (2002). “Properties of Ultra-High-Performance
Concrete”. LACER, Vol. 7, PP. 25-32.
75. Maeder, U. and Schober, I. (2003). “Performance of blends of polycarboxylate
polymers in different cements,Proceedings of the11th International Congress on the
Chemistry of Cement”. IN EDITOR GRIEVE, G. O. (Ed.). Durban.
76. Majmudar, A.J. and Laws, V. (1983). “Technology in the 1990s: Developments in
Hydraulic Cements”. The Royal Society, London, P. 191.
77. Mamlouk, M. and Zaniewski J. P. (1999). “Materials For Civil and Construction
Engineers”. United States of America.
78. Matte, V. and Moranville, M. (1999). "Durability of reactive powder concrete
composites : influence of silica fume on the leaching properties of very low
water/binder pastes". Cement and Concrete Composites , Vol. 21, No. 1, PP.1-9
79. Meleka, N. N., Bashandy, A. A. and Arab, M. A. (2013). "Economical Reactive
Powder Concrete Cast Using Available Materials In north Sinai, Egypt".
ARCHIVES OF CIVIL ENGINEERING, LIX, 2.
80. Mindess, S., Young, F. and Darwin, D. (2003). “Concrete”. Second Edition, Prentice
Hall.
81. Naik, T. (2005). “Sustainability of the cement and concrete industries”. Proceedings
of the Global Construction: Ultimate Concrete Opportunities, Dundee, Scotland.
82. Neville, A.M. (1995). “Properties of Concrete, 4th Edition”. Addison Wesley
Longman Ltd., London.
83. Neville, A. M. and Aitcin, P.C. (1998). “High performance concrete- an overview”.
Material Structures, Vol. 31, PP. 111-117.
84. Papadakis, V. (1999). “Experimental Investigation and theoretical Modelling of
Silica Fume Activity in Concrete”. Cement and Concrete Research, Vol. 29, PP. 79-
86.
88
85. Pigeon, M. and Plante, M. (1989). “Air-void stability part I: Influence of silica fume
and other parameters”. ACI Journal .Vol. 86, No. 5, PP. 482-490.
86. Ramachandran, V. S. (1984). “Technology Building Research”. National Research
Council TP 884. A3, C66-1984.
87. Ramezan, A. A. and Malhotra , V. M. (1995). “ Effect of curing on the compressive
strength, resistance to chloride-ion penetration and porosity of concretes
incorporating slag, fly ash or silica fume”. Cement and Concrete Composites, Vol.
17, PP. 125-133.
88. Rebentrost, M. and Cavill, B. (2006). “Reactive Powder Concrete Bridge”.
AustRoads Conference. Perth, Australia, 12-15 Sept.
89. Richard, P. and Cheyrezy, M. (1995). “Composition of reactive powder concretes”.
Cement and Concrete Research, Vol. 25, No. 7, PP. 1501-1511.
90. Richard, P. and Cheyrezy, M.H. (1994). “Reactive Powder Concretes with High
Ductility and 200-800 MPa Compressive Strength”. concrete Technology : Past,
Present, and Future-V.Mohan Malhotra Symposium, San Francisco, CA, PP. 507-
518.
91. Roux, N., Andrade, C. and Sanjuan, M. A. (1996). " Experimental study of durability
of reactive powder concretes." Journal of Materials in Civil Engineering, Vol. 8, No.
1, PP. 1-6
92. Roy, D. and Gouda, G. R. (1973). “ High strength generation in cement pastes.”.
Cement and Concrete Research, Vol. 3, No. 6, PP. 807-820.
93. Sadrekarimi, A. (2004). "Development of a Light Weight Reactive Powder Concrete
". Journal of Advanced Concrete Technology .Vol. 2, No. 3.
94. Safiuddin, M., Raman, S. N. and Zain, M. F. M. (2000). “Development of high
performance concrete using silica fume at relatively high water-binder ratios”.
Cement and Concrete Research, PP. 1501-1505.
95. Safiuddin, M., Raman, S. N. and Zain, M. F. M. (2007). “Effect of Different Curing
Methods on the Properties of Microsilica Concrete”. Australian Journal of Basic and
Applied Sciences,Vol. 1, PP. 87-95.
96. Safiuddin, Zain, M. F. M., M. and Yusof, K. (2000). “Influence of Different Curing
Conditions on the Strength and Durability of High Performance Concrete”. In the
Proceedings of the Fourth ACI International Conference on Repair, Rehabilitation
and Maintenance. American Concrete Institute, Farmington Hills, Michigan, USA.,
PP. 275-292.
89
97. Scrivener, K.L. and Kirkpatrick, R.J. (2008). “Innovation in use and research on
cementitious material”. Cement and Concrete Research, Vol. 38, PP. 128-136.
98. Semioli, W.J. (2001). “The New Concrete Technology”. Concrete International,Vol.
23, No. 11, PP. 75-79.
99. Shaheen, E. and Shrive, N.G. (2006). “Optimization of Mechanical Properties and
Durability of Reactive Powder Concrete”. ACI Materials Journal, Vol. 103, No. 6,
PP. 444-451.
100. Shannag, M.J. (2000). “High strength concrete containing natural pozzolan
and silica fume”. Cement & Concrete Composites, Vol. 22, PP. 399-406.
101. Shetty, M. S. (1982). “Concrete Technology”. India, PP. 277,285,526,527.
102. Tan, K. and Gjotv, O. E. (1996). “Performance of concrete under different curing
conditions”. Cement and Concrete Research, Vol. 26, PP. 355-361.
103. Toutanji, H. A. and El-Korchi, T. (1995). “The influence of silica fume on the
compressive strength of cement paste and mortar”. Cement and Concrete Research,
Vol. 25, PP. 1591-1602.
104. Turkmen, I. (2003). “Influence of different curing conditions on the physical and
Mechanical properties of concretes with admixtures of silica fume and blast furnace
slag”. Materials Letters Vol. 57 (2003), PP. 4560-4569.
105. Vernet, C.P. (2004). “Ultra-durable concretes: structure at the micro- and nanoscale”.
MRS Bull., Vol. 29, No. 5, PP. 324-327.
106. Voo, J. Y. L., Foster, S. J., Gilbert, R. I. and Gowripalan, N. (2001). Design of
disturbed regions in reactive powder concrete bridge girders. International
Conference on High Performance Materials in Bridges, Kona, Hawaii, PP. 117-127
107. Washer, G., Fuchs, P., Graybeal, B.A. and Hartmann, J.L. (2004). “Ultrasonic
Testing of Reactive Powder Concrete”. IEEE Transactions on ultrasonic,
ferroelectrics and frequency control, Vol. 51, No. 2, PP. 193-201.
108. Wikipedia, the free encyclopedia (2009). “Quartz”. website available at
http://en.wikipedia.org/wiki/Quartz.
109. Wong, A.C.L., Childs, P.A., Berndt, R., Macken, T., Peng, G.D. and Gowripalan, N.
(2007). “Simultaneous measurement of shrinkage and temperature of reactive powder
concrete at early-age using fibre Bragg grating sensors” . Cement and Concrete
Composites.Vol. 29, No. 7, PP. 490-497
90
110. Wong H.H.C. and Kwan A.K.H. (2005). “Packing Density: A Key Concept for Mix
Design of High Performance Concrete”. website available at
http://www.hkpc.org/hkiemat/mastec05_program_notes/Prof.%20Albert%20.
111. Wong, K. (1996). “Development of high strength concrete for Hong Kong and
investigation of their mechanical properties”. M. Phil. Thesis of the University of Hong
Kong.
112. Yamada, K. (2000). “Effects of the chemical structure on the properties of
polycarboxylate-type.superplasticizer”. Cement and Concrete Research, Vol. 30, PP.
197-207.
113. Yazici, H., Yardimci, M.Y., Aydin, S. and Karabulut, A.S. (2009). “Mechanical
properties of reactive powder concrete containing mineral admixtures under different
curing regimes”. Construction and Building Materials, Vol. 23, PP. 1223-1231.
114. Zanni, H., Cheyrezy, M., Maret, V., PHilippot, S. and Nieto, P. (1996).
“Investigation of hydration and pozzolanic reaction in Reactive Powder Concrete
(RPC) using 29Si NMR”. Cement and Concrete Research, Vol. 26, No. 1, PP. 93-100.
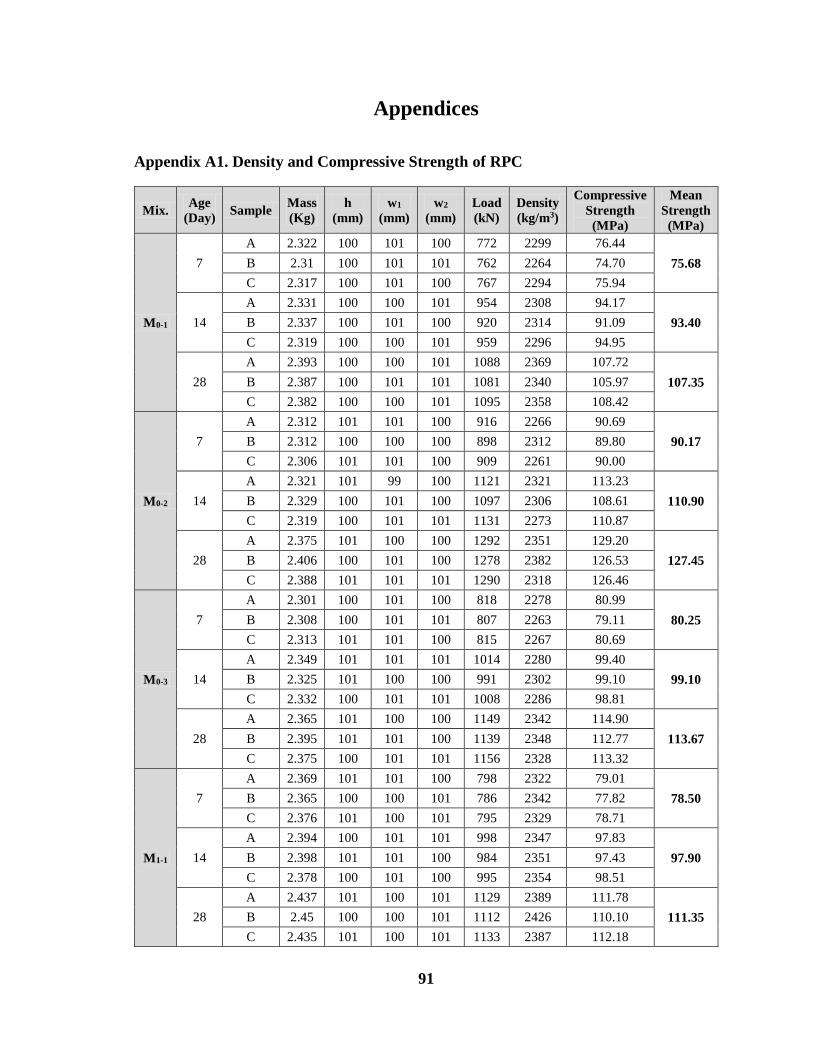
91
Appendices
Appendix A1. Density and Compressive Strength of RPC
Mix. Age
(Day) Sample
Mass
(Kg)
h
(mm)
w1
(mm)
w2
(mm)
Load
(kN)
Density
(kg/m3)
Compressive
Strength
(MPa)
Mean
Strength
(MPa)
M0-1
7
A 2.322 100 101 100 772 2299 76.44
75.68 B 2.31 100 101 101 762 2264 74.70
C 2.317 100 101 100 767 2294 75.94
14
A 2.331 100 100 101 954 2308 94.17
93.40 B 2.337 100 101 100 920 2314 91.09
C 2.319 100 100 101 959 2296 94.95
28
A 2.393 100 100 101 1088 2369 107.72
107.35 B 2.387 100 101 101 1081 2340 105.97
C 2.382 100 100 101 1095 2358 108.42
M0-2
7
A 2.312 101 101 100 916 2266 90.69
90.17 B 2.312 100 100 100 898 2312 89.80
C 2.306 101 101 100 909 2261 90.00
14
A 2.321 101 99 100 1121 2321 113.23
110.90 B 2.329 100 101 100 1097 2306 108.61
C 2.319 100 101 101 1131 2273 110.87
28
A 2.375 101 100 100 1292 2351 129.20
127.45 B 2.406 100 101 100 1278 2382 126.53
C 2.388 101 101 101 1290 2318 126.46
M0-3
7
A 2.301 100 101 100 818 2278 80.99
80.25 B 2.308 100 101 101 807 2263 79.11
C 2.313 101 101 100 815 2267 80.69
14
A 2.349 101 101 101 1014 2280 99.40
99.10 B 2.325 101 100 100 991 2302 99.10
C 2.332 100 101 101 1008 2286 98.81
28
A 2.365 101 100 100 1149 2342 114.90
113.67 B 2.395 101 101 100 1139 2348 112.77
C 2.375 100 101 101 1156 2328 113.32
M1-1
7
A 2.369 101 101 100 798 2322 79.01
78.50 B 2.365 100 100 101 786 2342 77.82
C 2.376 101 100 101 795 2329 78.71
14
A 2.394 100 101 101 998 2347 97.83
97.90 B 2.398 101 101 100 984 2351 97.43
C 2.378 100 101 100 995 2354 98.51
28
A 2.437 101 100 101 1129 2389 111.78
111.35 B 2.45 100 100 101 1112 2426 110.10
C 2.435 101 100 101 1133 2387 112.18
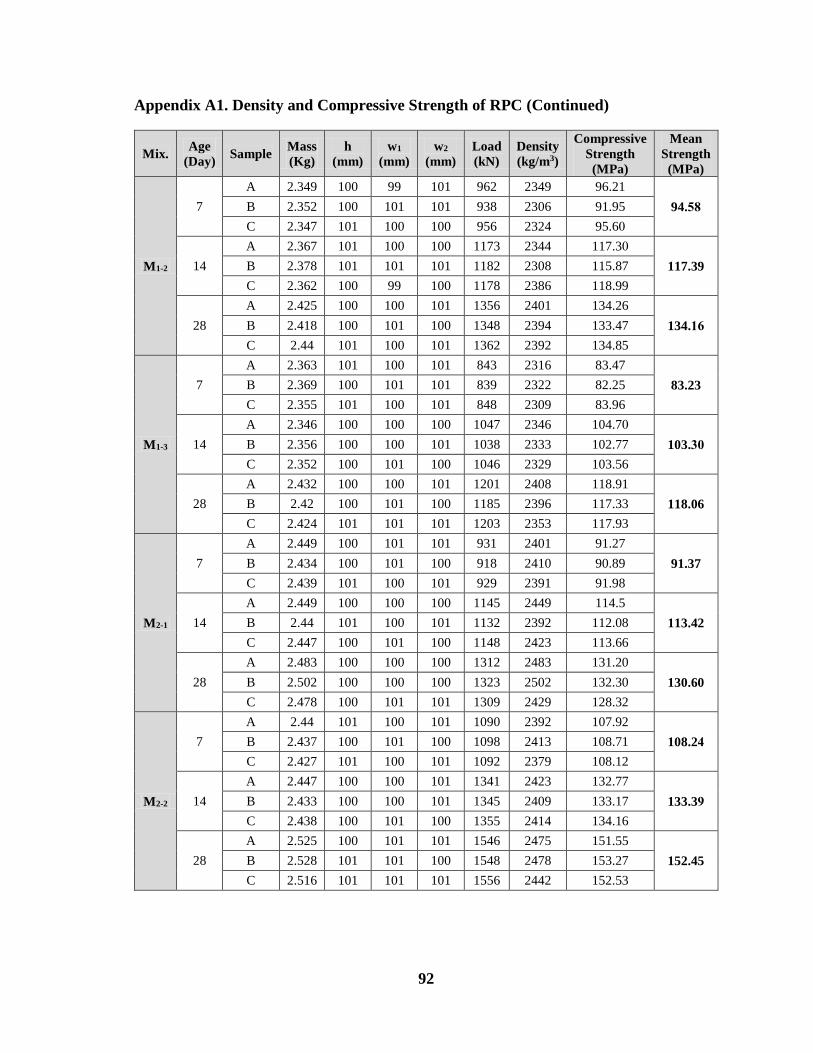
92
Appendix A1. Density and Compressive Strength of RPC (Continued)
Mix. Age
(Day) Sample
Mass
(Kg)
h
(mm)
w1
(mm)
w2
(mm)
Load
(kN)
Density
(kg/m3)
Compressive
Strength
(MPa)
Mean
Strength
(MPa)
M1-2
7
A 2.349 100 99 101 962 2349 96.21
94.51 B 2.352 100 101 101 938 2306 91.95
C 2.347 101 100 100 956 2324 95.66
14
A 2.367 101 100 100 1173 2344 117.36
117.39 B 2.378 101 101 101 1182 2308 115.87
C 2.362 100 99 100 1178 2386 118.99
28
A 2.425 100 100 101 1356 2401 134.26
134.36 B 2.418 100 101 100 1348 2394 133.47
C 2.44 101 100 101 1362 2392 134.85
M1-3
7
A 2.363 101 100 101 843 2316 83.47
83.23 B 2.369 100 101 101 839 2322 82.25
C 2.355 101 100 101 848 2309 83.96
14
A 2.346 100 100 100 1047 2346 104.76
103.11 B 2.356 100 100 101 1038 2333 102.77
C 2.352 100 101 100 1046 2329 103.56
28
A 2.432 100 100 101 1201 2408 118.91
118.06 B 2.42 100 101 100 1185 2396 117.33
C 2.424 101 101 101 1203 2353 117.93
M2-1
7
A 2.449 100 101 101 931 2401 91.27
91.37 B 2.434 100 101 100 918 2410 90.89
C 2.439 101 100 101 929 2391 91.98
14
A 2.449 100 100 100 1145 2449 114.5
113.42 B 2.44 101 100 101 1132 2392 112.08
C 2.447 100 101 100 1148 2423 113.66
28
A 2.483 100 100 100 1312 2483 131.20
130.60 B 2.502 100 100 100 1323 2502 132.30
C 2.478 100 101 101 1309 2429 128.32
M2-2
7
A 2.44 101 100 101 1090 2392 107.92
108.24 B 2.437 100 101 100 1098 2413 108.71
C 2.427 101 100 101 1092 2379 108.12
14
A 2.447 100 100 101 1341 2423 132.77
133.39 B 2.433 100 100 101 1345 2409 133.17
C 2.438 100 101 100 1355 2414 134.16
28
A 2.525 100 101 101 1546 2475 151.55
152.45 B 2.528 101 101 100 1548 2478 153.27
C 2.516 101 101 101 1556 2442 152.53
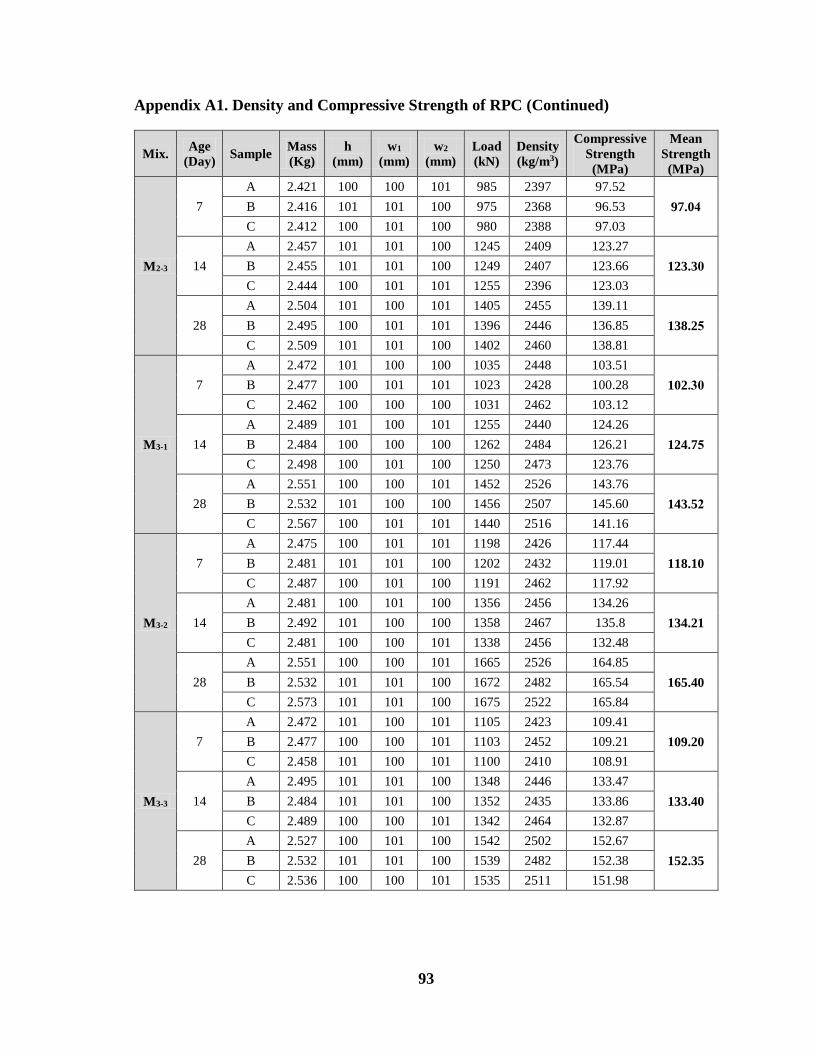
93
Appendix A1. Density and Compressive Strength of RPC (Continued)
Mix. Age
(Day) Sample
Mass
(Kg)
h
(mm)
w1
(mm)
w2
(mm)
Load
(kN)
Density
(kg/m3)
Compressive
Strength
(MPa)
Mean
Strength
(MPa)
M2-3
7
A 2.421 100 100 101 985 2397 97.52
97.04 B 2.416 101 101 100 975 2368 96.53
C 2.412 100 101 100 980 2388 97.03
14
A 2.457 101 101 100 1245 2409 123.27
123.31 B 2.455 101 101 100 1249 2407 123.66
C 2.444 100 101 101 1255 2396 123.03
28
A 2.504 101 100 101 1405 2455 139.11
138.25 B 2.495 100 101 101 1396 2446 136.85
C 2.509 101 101 100 1402 2460 138.81
M3-1
7
A 2.472 101 100 100 1035 2448 103.55
102.11 B 2.477 100 101 101 1023 2428 100.28
C 2.462 100 100 100 1031 2462 103.18
14
A 2.489 101 100 101 1255 2440 124.26
124.75 B 2.484 100 100 100 1262 2484 126.25
C 2.498 100 101 100 1250 2473 123.76
28
A 2.551 100 100 101 1452 2526 143.76
143.54 B 2.532 101 100 100 1456 2507 145.66
C 2.567 100 101 101 1440 2516 141.16
M3-2
7
A 2.475 100 101 101 1198 2426 117.44
118.10 B 2.481 101 101 100 1202 2432 119.01
C 2.487 100 101 100 1191 2462 117.92
14
A 2.481 100 101 100 1356 2456 134.26
134.21 B 2.492 101 100 100 1358 2467 135.8
C 2.481 100 100 101 1338 2456 132.48
28
A 2.551 100 100 101 1665 2526 164.85
165.40 B 2.532 101 101 100 1672 2482 165.54
C 2.573 101 101 100 1675 2522 165.84
M3-3
7
A 2.472 101 100 101 1105 2423 109.41
109.20 B 2.477 100 100 101 1103 2452 109.21
C 2.458 101 100 101 1100 2410 108.91
14
A 2.495 101 101 100 1348 2446 133.47
133.40 B 2.484 101 101 100 1352 2435 133.86
C 2.489 100 100 101 1342 2464 132.87
28
A 2.527 100 101 100 1542 2502 152.67
152.35 B 2.532 101 101 100 1539 2482 152.38
C 2.536 100 100 101 1535 2511 151.98
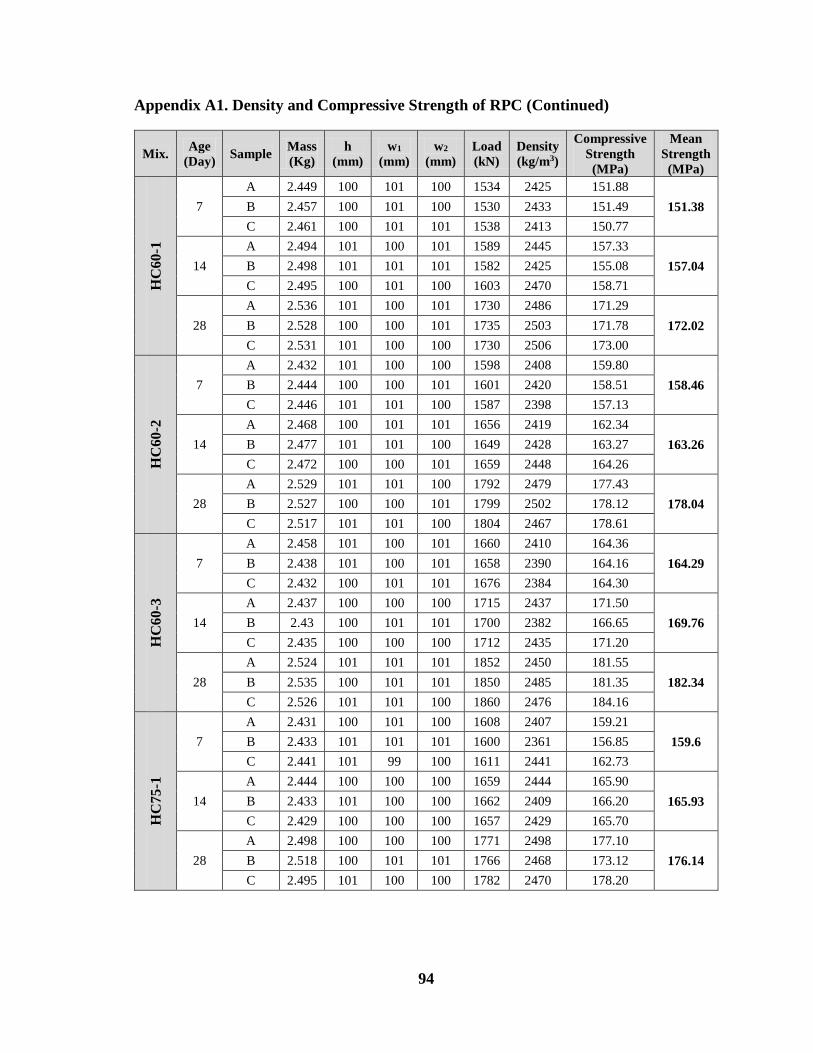
94
Appendix A1. Density and Compressive Strength of RPC (Continued)
Mix. Age
(Day) Sample
Mass
(Kg)
h
(mm)
w1
(mm)
w2
(mm)
Load
(kN)
Density
(kg/m3)
Compressive
Strength
(MPa)
Mean
Strength
(MPa) H
C6
0-1
7
A 2.449 100 101 100 1534 2425 151.88
151.38 B 2.457 100 101 100 1530 2433 151.49
C 2.461 100 101 101 1538 2413 150.77
14
A 2.494 101 100 101 1589 2445 157.33
157.04 B 2.498 101 101 101 1582 2425 155.08
C 2.495 100 101 100 1603 2470 158.71
28
A 2.536 101 100 101 1730 2486 171.29
172.02 B 2.528 100 100 101 1735 2503 171.78
C 2.531 101 100 100 1730 2506 173.00
HC
60
-2
7
A 2.432 101 100 100 1598 2408 159.80
158.46 B 2.444 100 100 101 1601 2420 158.51
C 2.446 101 101 100 1587 2398 157.13
14
A 2.468 100 101 101 1656 2419 162.34
163.26 B 2.477 101 101 100 1649 2428 163.27
C 2.472 100 100 101 1659 2448 164.26
28
A 2.529 101 101 100 1792 2479 177.43
178.04 B 2.527 100 100 101 1799 2502 178.12
C 2.517 101 101 100 1804 2467 178.61
HC
60
-3
7
A 2.458 101 100 101 1660 2410 164.36
164.29 B 2.438 101 100 101 1658 2390 164.16
C 2.432 100 101 101 1676 2384 164.30
14
A 2.437 100 100 100 1715 2437 171.50
169.76 B 2.43 100 101 101 1700 2382 166.65
C 2.435 100 100 100 1712 2435 171.20
28
A 2.524 101 101 101 1852 2450 181.55
182.34 B 2.535 100 101 101 1850 2485 181.35
C 2.526 101 101 100 1860 2476 184.16
HC
75-1
7
A 2.431 100 101 100 1608 2407 159.21
159.6 B 2.433 101 101 101 1600 2361 156.85
C 2.441 101 99 100 1611 2441 162.73
14
A 2.444 100 100 100 1659 2444 165.90
165.93 B 2.433 101 100 100 1662 2409 166.20
C 2.429 100 100 100 1657 2429 165.70
28
A 2.498 100 100 100 1771 2498 177.10
176.14 B 2.518 100 101 101 1766 2468 173.12
C 2.495 101 100 100 1782 2470 178.20
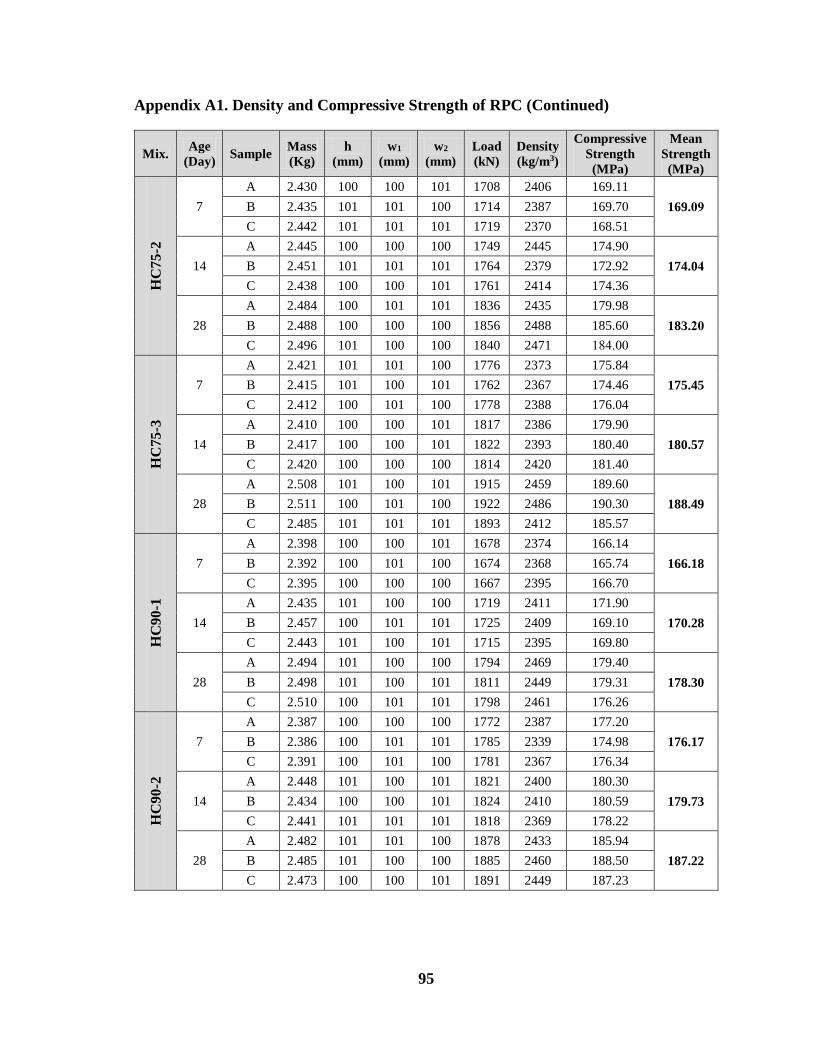
95
Appendix A1. Density and Compressive Strength of RPC (Continued)
Mix. Age
(Day) Sample
Mass
(Kg)
h
(mm)
w1
(mm)
w2
(mm)
Load
(kN)
Density
(kg/m3)
Compressive
Strength
(MPa)
Mean
Strength
(MPa) H
C7
5-2
7
A 2.430 100 100 101 1708 2406 169.11
169.19 B 2.435 101 101 100 1714 2387 169.76
C 2.442 101 101 101 1719 2370 168.51
14
A 2.445 100 100 100 1749 2445 174.96
174.04 B 2.451 101 101 101 1764 2379 172.92
C 2.438 100 100 101 1761 2414 174.36
28
A 2.484 100 101 101 1836 2435 179.98
183.41 B 2.488 100 100 100 1856 2488 185.66
C 2.496 101 100 100 1840 2471 527.66
HC
75
-3
7
A 2.421 101 101 100 1776 2373 175.84
175.45 B 2.415 101 100 101 1762 2367 174.46
C 2.412 100 101 100 1778 2388 176.04
14
A 2.410 100 100 101 1817 2386 179.96
180.57 B 2.417 100 100 101 1822 2393 180.46
C 2.420 100 100 100 1814 2420 181.46
28
A 2.508 101 100 101 1915 2459 189.66
188.49 B 2.511 100 101 100 1922 2486 190.36
C 2.485 101 101 101 1893 2412 185.57
HC
90
-1
7
A 2.398 100 100 101 1678 2374 166.14
166.18 B 2.392 100 101 100 1674 2368 165.74
C 2.395 100 100 100 1667 2395 166.70
14
A 2.435 101 100 100 1719 2411 171.90
170.28 B 2.457 100 101 101 1725 2409 169.10
C 2.443 101 100 101 1715 2395 169.80
28
A 2.494 101 100 100 1794 2469 179.40
178.30 B 2.498 101 100 101 1811 2449 179.31
C 2.510 100 101 101 1798 2461 176.26
HC
90-2
7
A 2.387 100 100 100 1772 2387 177.20
176.17 B 2.386 100 101 101 1785 2339 174.98
C 2.391 100 101 100 1781 2367 176.34
14
A 2.448 101 100 101 1821 2400 180.30
179.73 B 2.434 100 100 101 1824 2410 180.59
C 2.441 101 101 101 1818 2369 178.22
28
A 2.482 101 101 100 1878 2433 185.94
187.22 B 2.485 101 100 100 1885 2460 188.50
C 2.473 100 100 101 1891 2449 187.23
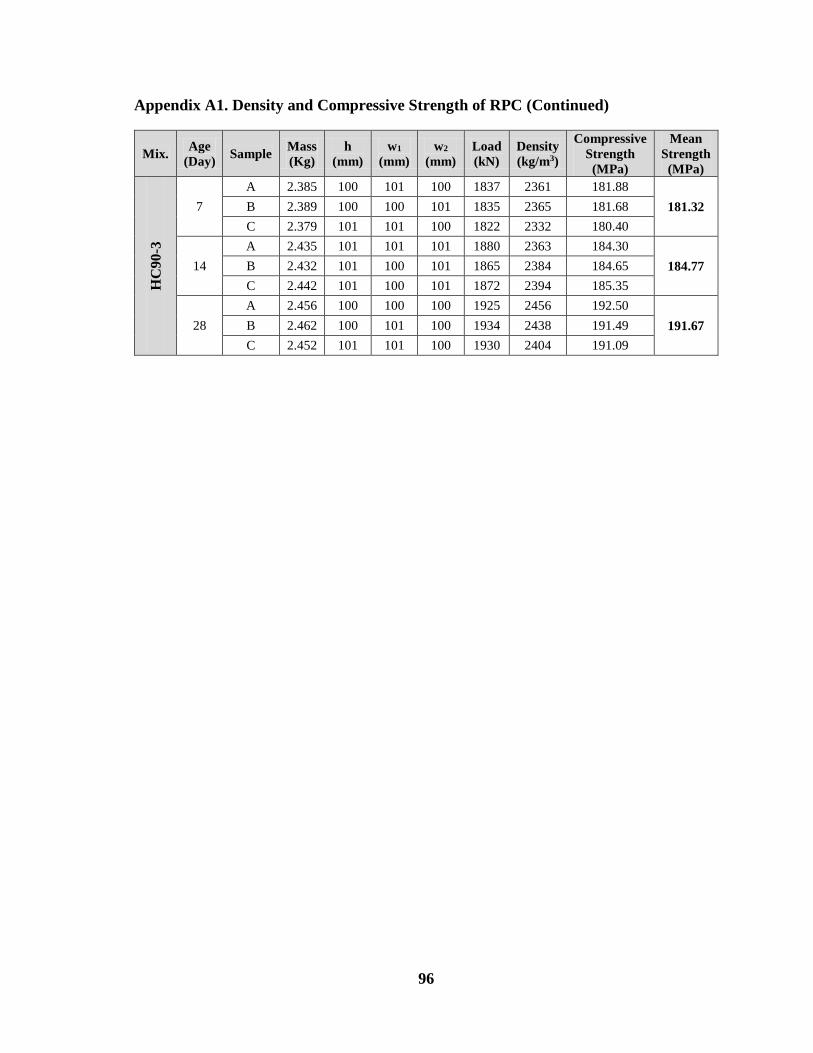
96
Appendix A1. Density and Compressive Strength of RPC (Continued)
Mix. Age
(Day) Sample
Mass
(Kg)
h
(mm)
w1
(mm)
w2
(mm)
Load
(kN)
Density
(kg/m3)
Compressive
Strength
(MPa)
Mean
Strength
(MPa) H
C9
0-3
7
A 2.385 100 101 100 1837 2361 181.88
181.32 B 2.389 100 100 101 1835 2365 181.68
C 2.379 101 101 100 1822 2332 180.40
14
A 2.435 101 101 101 1880 2363 184.30
184.77 B 2.432 101 100 101 1865 2384 184.65
C 2.442 101 100 101 1872 2394 185.35
28
A 2.456 100 100 100 1925 2456 192.50
191.67 B 2.462 100 101 100 1934 2438 191.49
C 2.452 101 101 100 1930 2404 191.09
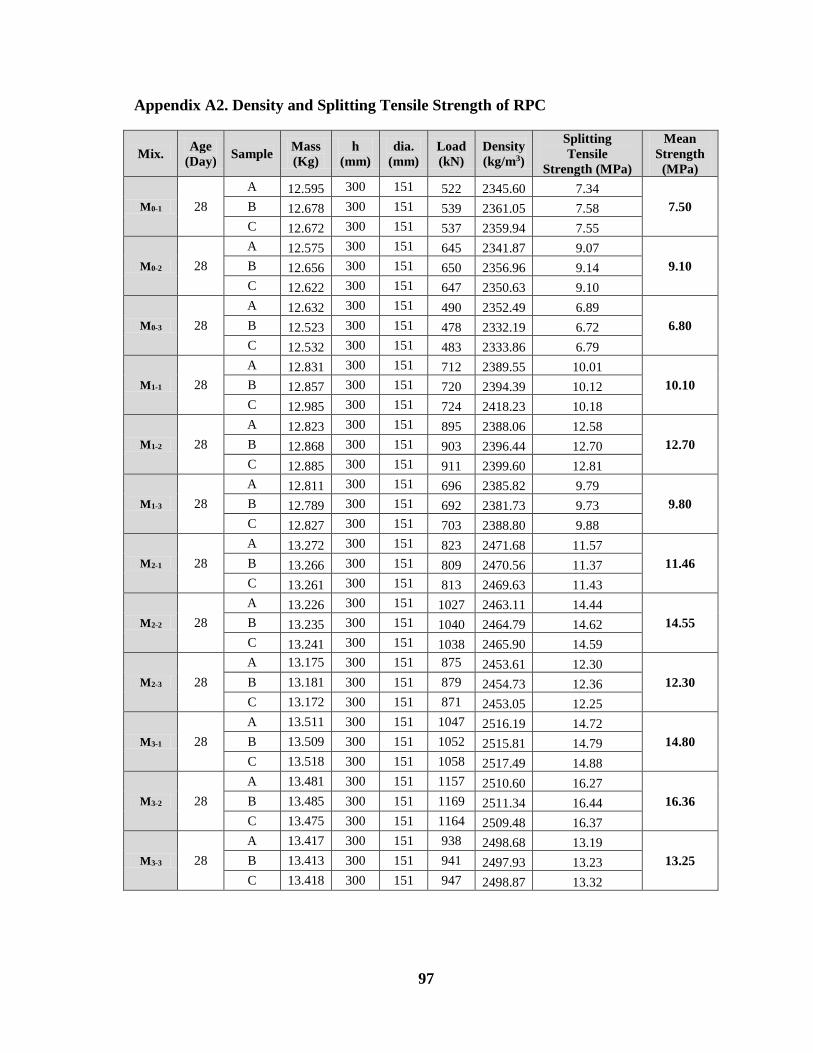
97
Appendix A2. Density and Splitting Tensile Strength of RPC
Mix. Age
(Day) Sample
Mass
(Kg)
h
(mm)
dia.
(mm)
Load
(kN)
Density
(kg/m3)
Splitting
Tensile
Strength (MPa)
Mean
Strength
(MPa)
M0-1 28
A 12.595 300 151 522 2345.60 7.34
7.50 B 12.678 300 151 539 2361.05 7.58
C 12.672 300 151 537 2359.94 7.55
M0-2 28
A 12.575 300 151 645 2341.87 9.07
9.10 B 12.656 300 151 650 2356.96 9.14
C 12.622 300 151 647 2350.63 9.10
M0-3 28
A 12.632 300 151 490 2352.49 6.89
6.80 B 12.523 300 151 478 2332.19 6.72
C 12.532 300 151 483 2333.86 6.79
M1-1 28
A 12.831 300 151 712 2389.55 10.01
10.10 B 12.857 300 151 720 2394.39 10.12
C 12.985 300 151 724 2418.23 10.18
M1-2 28
A 12.823 300 151 895 2388.06 12.58
12.70 B 12.868 300 151 903 2396.44 12.70
C 12.885 300 151 911 2399.60 12.81
M1-3 28
A 12.811 300 151 696 2385.82 9.79
9.80 B 12.789 300 151 692 2381.73 9.73
C 12.827 300 151 703 2388.80 9.88
M2-1 28
A 13.272 300 151 823 2471.68 11.57
11.46 B 13.266 300 151 809 2470.56 11.37
C 13.261 300 151 813 2469.63 11.43
M2-2 28
A 13.226 300 151 1027 2463.11 14.44
14.55 B 13.235 300 151 1040 2464.79 14.62
C 13.241 300 151 1038 2465.90 14.59
M2-3 28
A 13.175 300 151 875 2453.61 12.30
12.30 B 13.181 300 151 879 2454.73 12.36
C 13.172 300 151 871 2453.05 12.25
M3-1 28
A 13.511 300 151 1047 2516.19 14.72
14.80 B 13.509 300 151 1052 2515.81 14.79
C 13.518 300 151 1058 2517.49 14.88
M3-2 28
A 13.481 300 151 1157 2510.60 16.27
16.36 B 13.485 300 151 1169 2511.34 16.44
C 13.475 300 151 1164 2509.48 16.37
M3-3 28
A 13.417 300 151 938 2498.68 13.19
13.25 B 13.413 300 151 941 2497.93 13.23
C 13.418 300 151 947 2498.87 13.32
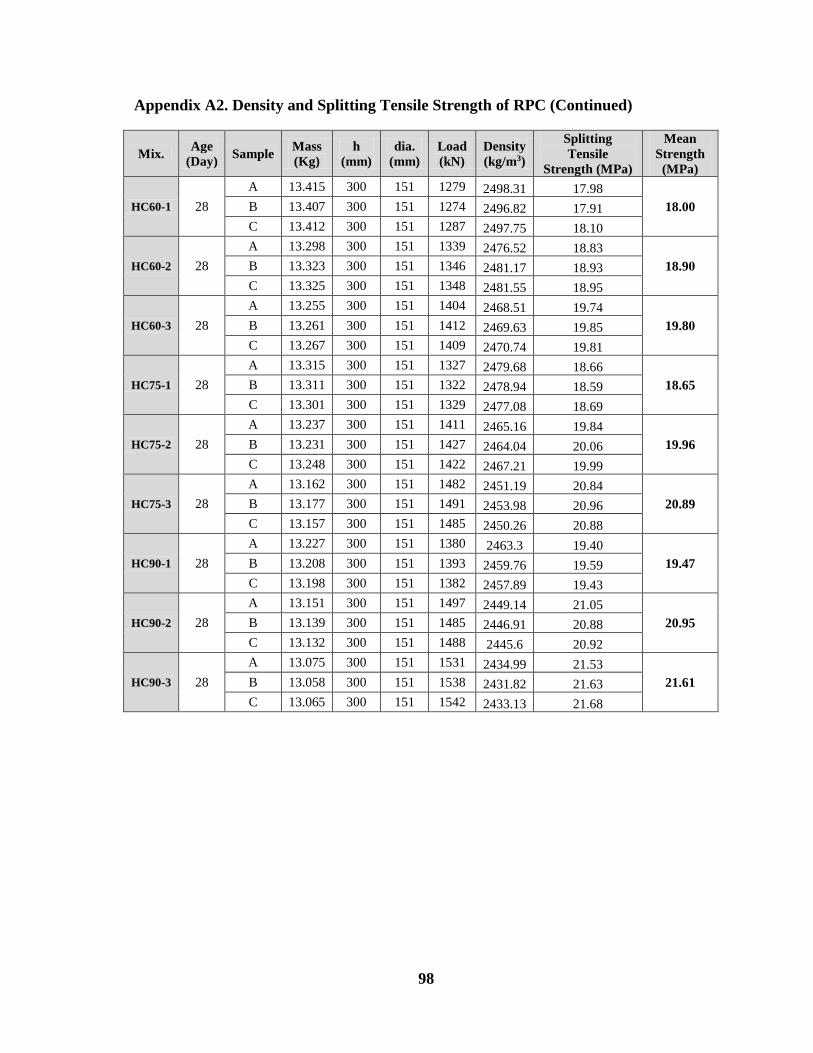
98
Appendix A2. Density and Splitting Tensile Strength of RPC (Continued)
Mix. Age
(Day) Sample
Mass
(Kg)
h
(mm)
dia.
(mm)
Load
(kN)
Density
(kg/m3)
Splitting
Tensile
Strength (MPa)
Mean
Strength
(MPa)
HC60-1 28
A 13.415 300 151 1279 2498.31 17.98
18.00 B 13.407 300 151 1274 2496.82 17.91
C 13.412 300 151 1287 2497.75 18.10
HC60-2 28
A 13.298 300 151 1339 2476.52 18.83
18.91 B 13.323 300 151 1346 2481.17 18.93
C 13.325 300 151 1348 2481.55 18.95
HC60-3 28
A 13.255 300 151 1404 2468.51 19.74
19.81 B 13.261 300 151 1412 2469.63 19.85
C 13.267 300 151 1409 2470.74 19.81
HC75-1 28
A 13.315 300 151 1327 2479.68 18.66
18.65 B 13.311 300 151 1322 2478.94 18.59
C 13.301 300 151 1329 2477.08 18.69
HC75-2 28
A 13.237 300 151 1411 2465.16 19.84
19.96 B 13.231 300 151 1427 2464.04 20.06
C 13.248 300 151 1422 2467.21 19.99
HC75-3 28
A 13.162 300 151 1482 2451.19 20.84
20.89 B 13.177 300 151 1491 2453.98 20.96
C 13.157 300 151 1485 2450.26 20.88
HC90-1 28
A 13.227 300 151 1380 2463.3 19.40
19.47 B 13.208 300 151 1393 2459.76 19.59
C 13.198 300 151 1382 2457.89 19.43
HC90-2 28
A 13.151 300 151 1497 2449.14 21.05
20.95 B 13.139 300 151 1485 2446.91 20.88
C 13.132 300 151 1488 2445.6 20.92
HC90-3 28
A 13.075 300 151 1531 2434.99 21.53
21.61 B 13.058 300 151 1538 2431.82 21.63
C 13.065 300 151 1542 2433.13 21.68
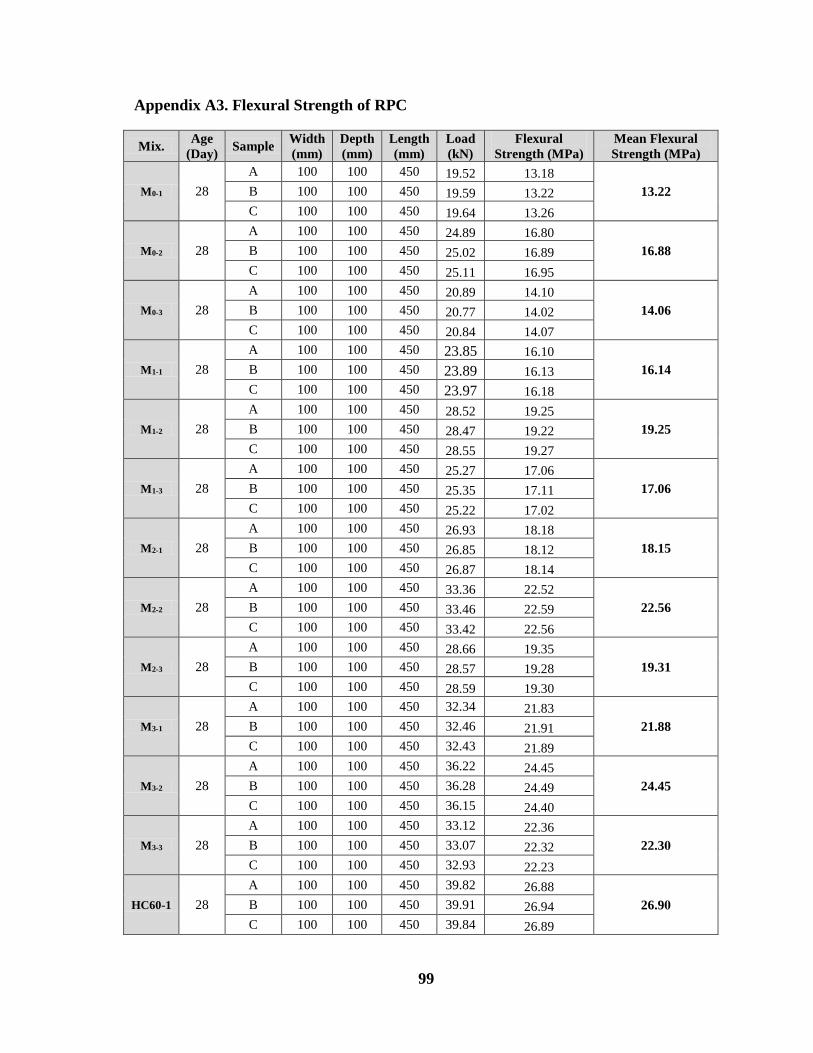
99
Appendix A3. Flexural Strength of RPC
Mix. Age
(Day) Sample
Width
(mm)
Depth
(mm)
Length
(mm)
Load
(kN)
Flexural
Strength (MPa)
Mean Flexural
Strength (MPa)
M0-1 28
A 100 100 450 19.52 13.18
13.22 B 100 100 450 19.59 13.22
C 100 100 450 19.64 13.26
M0-2 28
A 100 100 450 24.89 16.80
16.88 B 100 100 450 25.02 16.89
C 100 100 450 25.11 16.95
M0-3 28
A 100 100 450 20.89 14.10
14.06 B 100 100 450 20.77 14.02
C 100 100 450 20.84 14.07
M1-1 28
A 100 100 450 23.85 16.10
16.14 B 100 100 450 23.89 16.13
C 100 100 450 23.97 16.18
M1-2 28
A 100 100 450 28.52 19.25
19.25 B 100 100 450 28.47 19.22
C 100 100 450 28.55 19.27
M1-3 28
A 100 100 450 25.27 17.06
17.06 B 100 100 450 25.35 17.11
C 100 100 450 25.22 17.02
M2-1 28
A 100 100 450 26.93 18.18
18.15 B 100 100 450 26.85 18.12
C 100 100 450 26.87 18.14
M2-2 28
A 100 100 450 33.36 22.52
22.56 B 100 100 450 33.46 22.59
C 100 100 450 33.42 22.56
M2-3 28
A 100 100 450 28.66 19.35
19.31 B 100 100 450 28.57 19.28
C 100 100 450 28.59 19.30
M3-1 28
A 100 100 450 32.34 21.83
21.88 B 100 100 450 32.46 21.91
C 100 100 450 32.43 21.89
M3-2 28
A 100 100 450 36.22 24.45
24.45 B 100 100 450 36.28 24.49
C 100 100 450 36.15 24.40
M3-3 28
A 100 100 450 33.12 22.36
22.31 B 100 100 450 33.07 22.32
C 100 100 450 32.93 22.23
HC60-1 28
A 100 100 450 39.82 26.88
26.91 B 100 100 450 39.91 26.94
C 100 100 450 39.84 26.89
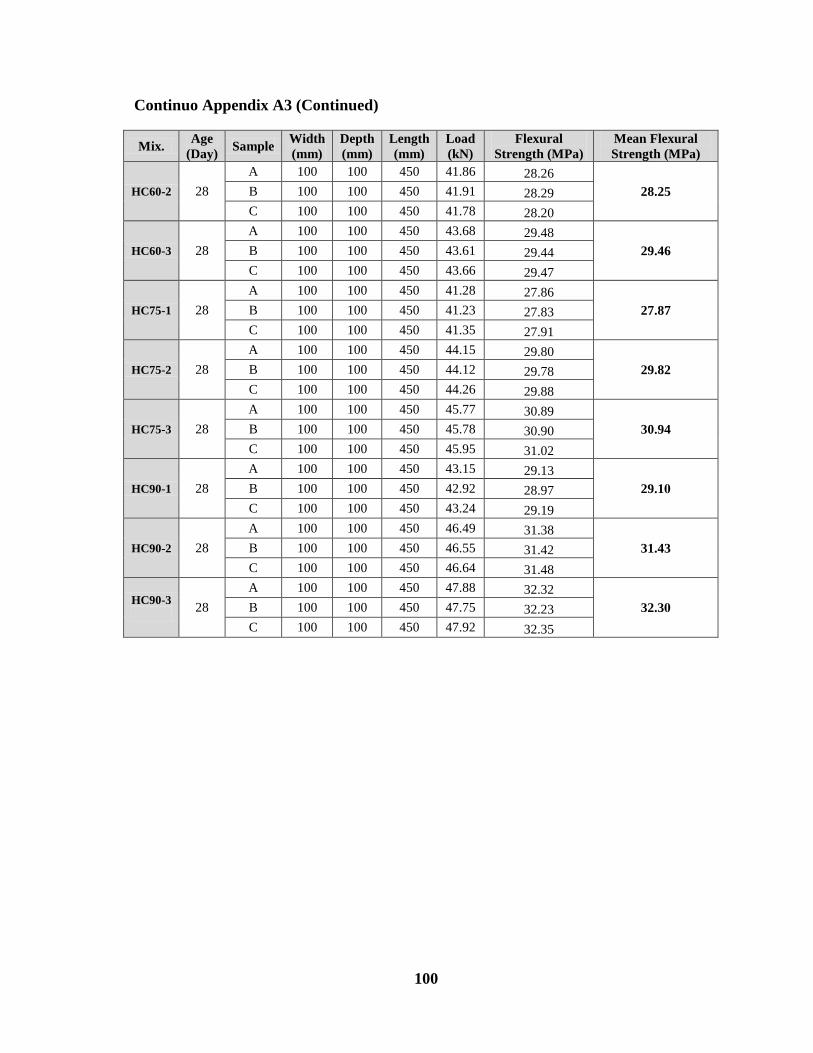
100
Continuo Appendix A3 (Continued)
Mix. Age
(Day) Sample
Width
(mm)
Depth
(mm)
Length
(mm)
Load
(kN)
Flexural
Strength (MPa)
Mean Flexural
Strength (MPa)
HC60-2 28
A 100 100 450 41.86 28.26
28.25 B 100 100 450 41.91 28.29
C 100 100 450 41.78 28.20
HC60-3 28
A 100 100 450 43.68 29.48
29.46 B 100 100 450 43.61 29.44
C 100 100 450 43.66 29.47
HC75-1 28
A 100 100 450 41.28 27.86
27.87 B 100 100 450 41.23 27.83
C 100 100 450 41.35 27.91
HC75-2 28
A 100 100 450 44.15 29.80
29.82 B 100 100 450 44.12 29.78
C 100 100 450 44.26 29.88
HC75-3 28
A 100 100 450 45.77 30.89
30.94 B 100 100 450 45.78 30.90
C 100 100 450 45.95 31.02
HC90-1 28
A 100 100 450 43.15 29.13
29.11 B 100 100 450 42.92 28.97
C 100 100 450 43.24 29.19
HC90-2 28
A 100 100 450 46.49 31.38
31.43 B 100 100 450 46.55 31.42
C 100 100 450 46.64 31.48
HC90-3
28
A 100 100 450 47.88 32.32
32.31 B 100 100 450 47.75 32.23
C 100 100 450 47.92 32.35