The Irish Farmers’ Association · Figure A1: Estimated Gini Coefficients of Inequality for the...
132
SUBMISSION TO THE DIRECTORATE-GENERAL FOR COMPETITION (DG COMP) REGARDING A PROPOSED TRANSACTION IN THE IRISH MEAT PROCESSING SECTOR M.7930 – ABP GROUP/FANE VALLEY GROUP/SLANEY FOODS Prepared for : The Irish Farmers’ Association By : DR. PAT MCCLOUGHAN PMCA Economic Consulting 25 July 2016
Transcript of The Irish Farmers’ Association · Figure A1: Estimated Gini Coefficients of Inequality for the...

SUBMISSION TO THE DIRECTORATE-GENERAL
FOR COMPETITION (DG COMP) REGARDING A
PROPOSED TRANSACTION IN THE IRISH MEAT
PROCESSING SECTOR M.7930 – ABP GROUP/FANE VALLEY GROUP/SLANEY FOODS
Prepared for:
The Irish Farmers’ Association
By:
DR. PAT MCCLOUGHAN
PMCA Economic Consulting
25 July 2016
PMCA Economic Consulting
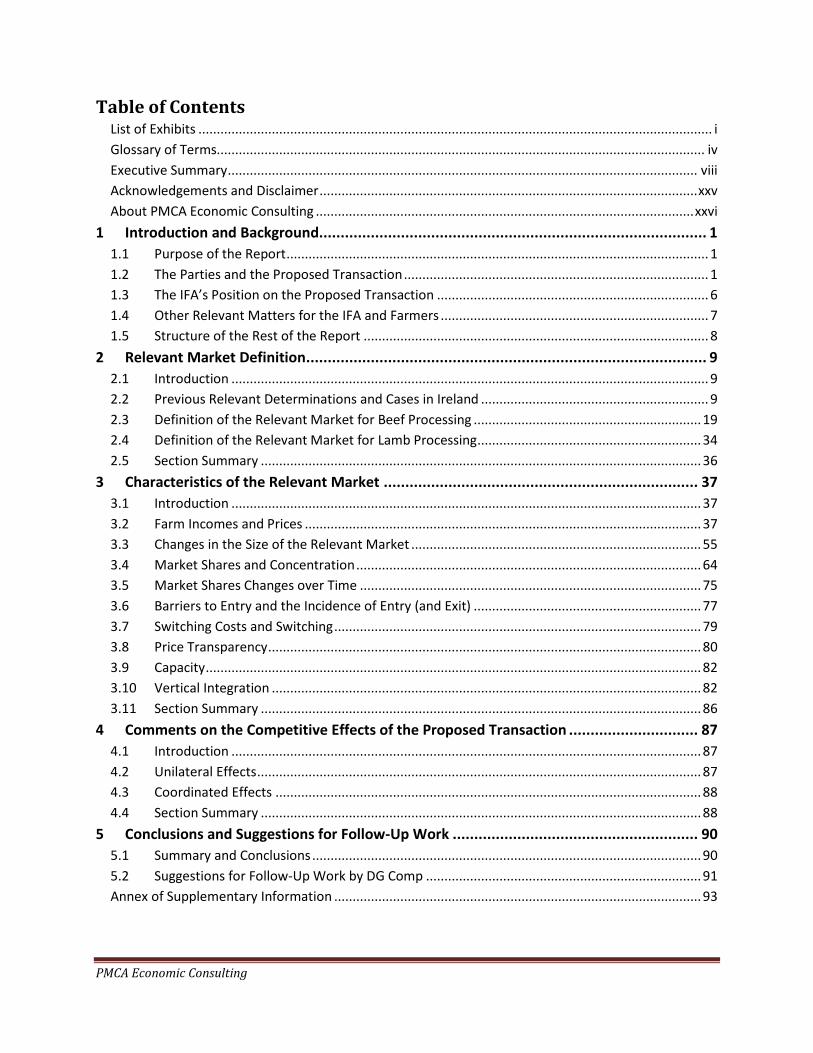
Table of Contents List of Exhibits ............................................................................................................................................ i Glossary of Terms..................................................................................................................................... iv Executive Summary ................................................................................................................................ viii Acknowledgements and Disclaimer ....................................................................................................... xxv About PMCA Economic Consulting ....................................................................................................... xxvi
1 Introduction and Background.......................................................................................... 1 1.1 Purpose of the Report ................................................................................................................... 1 1.2 The Parties and the Proposed Transaction ................................................................................... 1 1.3 The IFA’s Position on the Proposed Transaction .......................................................................... 6 1.4 Other Relevant Matters for the IFA and Farmers ......................................................................... 7 1.5 Structure of the Rest of the Report .............................................................................................. 8
2 Relevant Market Definition ............................................................................................. 9 2.1 Introduction .................................................................................................................................. 9 2.2 Previous Relevant Determinations and Cases in Ireland .............................................................. 9 2.3 Definition of the Relevant Market for Beef Processing .............................................................. 19 2.4 Definition of the Relevant Market for Lamb Processing ............................................................. 34 2.5 Section Summary ........................................................................................................................ 36
3 Characteristics of the Relevant Market ......................................................................... 37 3.1 Introduction ................................................................................................................................ 37 3.2 Farm Incomes and Prices ............................................................................................................ 37 3.3 Changes in the Size of the Relevant Market ............................................................................... 55 3.4 Market Shares and Concentration .............................................................................................. 64 3.5 Market Shares Changes over Time ............................................................................................. 75 3.6 Barriers to Entry and the Incidence of Entry (and Exit) .............................................................. 77 3.7 Switching Costs and Switching .................................................................................................... 79 3.8 Price Transparency ...................................................................................................................... 80 3.9 Capacity ....................................................................................................................................... 82 3.10 Vertical Integration ..................................................................................................................... 82 3.11 Section Summary ........................................................................................................................ 86
4 Comments on the Competitive Effects of the Proposed Transaction .............................. 87 4.1 Introduction ................................................................................................................................ 87 4.2 Unilateral Effects ......................................................................................................................... 87 4.3 Coordinated Effects .................................................................................................................... 88 4.4 Section Summary ........................................................................................................................ 88
5 Conclusions and Suggestions for Follow-Up Work ......................................................... 90 5.1 Summary and Conclusions .......................................................................................................... 90 5.2 Suggestions for Follow-Up Work by DG Comp ........................................................................... 91 Annex of Supplementary Information .................................................................................................... 93
PMCA Economic Consulting Page i
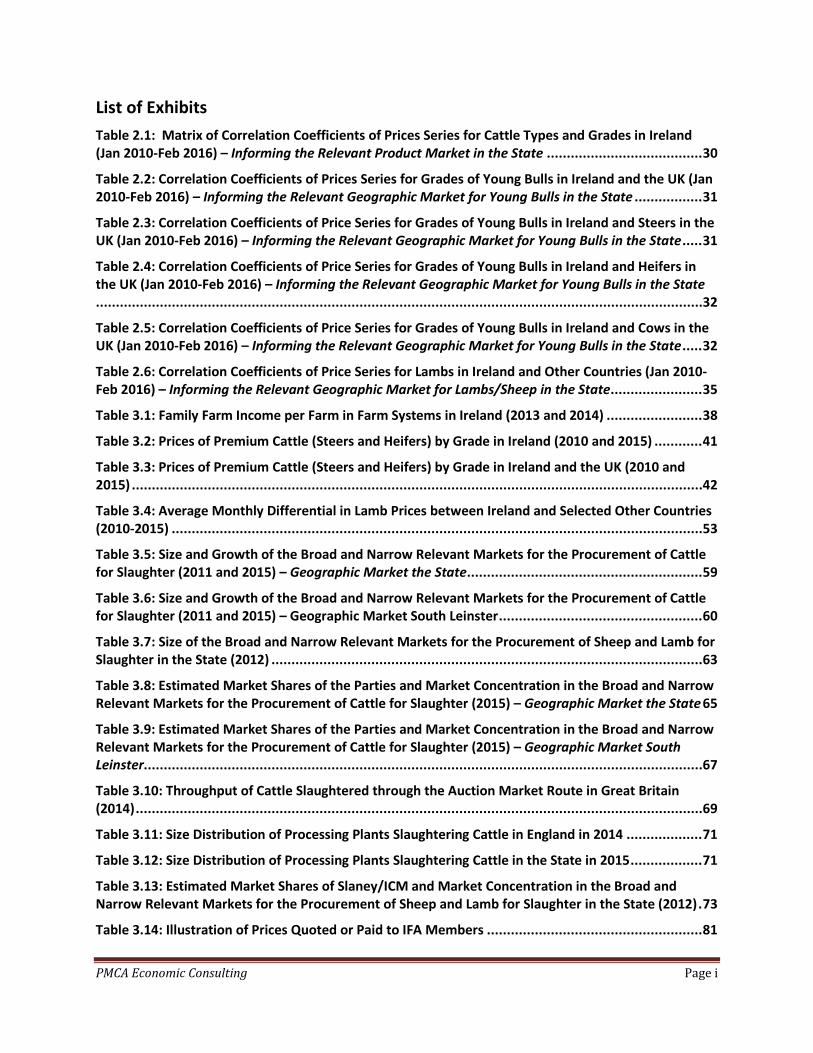
List of Exhibits Table 2.1: Matrix of Correlation Coefficients of Prices Series for Cattle Types and Grades in Ireland (Jan 2010-Feb 2016) – Informing the Relevant Product Market in the State ....................................... 30
Table 2.2: Correlation Coefficients of Prices Series for Grades of Young Bulls in Ireland and the UK (Jan 2010-Feb 2016) – Informing the Relevant Geographic Market for Young Bulls in the State ................. 31
Table 2.3: Correlation Coefficients of Price Series for Grades of Young Bulls in Ireland and Steers in the UK (Jan 2010-Feb 2016) – Informing the Relevant Geographic Market for Young Bulls in the State ..... 31
Table 2.4: Correlation Coefficients of Price Series for Grades of Young Bulls in Ireland and Heifers in the UK (Jan 2010-Feb 2016) – Informing the Relevant Geographic Market for Young Bulls in the State........................................................................................................................................................ 32
Table 2.5: Correlation Coefficients of Price Series for Grades of Young Bulls in Ireland and Cows in the UK (Jan 2010-Feb 2016) – Informing the Relevant Geographic Market for Young Bulls in the State ..... 32
Table 2.6: Correlation Coefficients of Price Series for Lambs in Ireland and Other Countries (Jan 2010-Feb 2016) – Informing the Relevant Geographic Market for Lambs/Sheep in the State ....................... 35
Table 3.1: Family Farm Income per Farm in Farm Systems in Ireland (2013 and 2014) ........................ 38
Table 3.2: Prices of Premium Cattle (Steers and Heifers) by Grade in Ireland (2010 and 2015) ............ 41
Table 3.3: Prices of Premium Cattle (Steers and Heifers) by Grade in Ireland and the UK (2010 and 2015) ............................................................................................................................................... 42
Table 3.4: Average Monthly Differential in Lamb Prices between Ireland and Selected Other Countries (2010-2015) ..................................................................................................................................... 53
Table 3.5: Size and Growth of the Broad and Narrow Relevant Markets for the Procurement of Cattle for Slaughter (2011 and 2015) – Geographic Market the State ........................................................... 59
Table 3.6: Size and Growth of the Broad and Narrow Relevant Markets for the Procurement of Cattle for Slaughter (2011 and 2015) – Geographic Market South Leinster ................................................... 60
Table 3.7: Size of the Broad and Narrow Relevant Markets for the Procurement of Sheep and Lamb for Slaughter in the State (2012) ............................................................................................................ 63
Table 3.8: Estimated Market Shares of the Parties and Market Concentration in the Broad and Narrow Relevant Markets for the Procurement of Cattle for Slaughter (2015) – Geographic Market the State 65
Table 3.9: Estimated Market Shares of the Parties and Market Concentration in the Broad and Narrow Relevant Markets for the Procurement of Cattle for Slaughter (2015) – Geographic Market South Leinster............................................................................................................................................ 67
Table 3.10: Throughput of Cattle Slaughtered through the Auction Market Route in Great Britain (2014) .............................................................................................................................................. 69
Table 3.11: Size Distribution of Processing Plants Slaughtering Cattle in England in 2014 ................... 71
Table 3.12: Size Distribution of Processing Plants Slaughtering Cattle in the State in 2015 .................. 71
Table 3.13: Estimated Market Shares of Slaney/ICM and Market Concentration in the Broad and Narrow Relevant Markets for the Procurement of Sheep and Lamb for Slaughter in the State (2012) . 73
Table 3.14: Illustration of Prices Quoted or Paid to IFA Members ...................................................... 81
PMCA Economic Consulting Page ii
Figure 1.1: Cattle Prices – Steers R3 in Ireland and the UK (2003-2016) ................................................8
Figure 2.1: The Beef Supply Chain in the State .................................................................................. 20
Figure 2.2: Illustration of the EU Beef Carcase Classification Scheme ................................................. 25
Figure 2.3: Cattle Price Series – Steers R3 in Ireland and the UK (Jan 2010-Feb 2016) .......................... 28
Figure 2.4: The Sheep/Lamb Supply Chain in the State ...................................................................... 34
Figure 3.1: Cattle Prices – Steers R3 in Ireland and the UK (Jan 2010-Feb 2016) .................................. 44
Figure 3.2: Average Monthly Differential in Cattle Prices between Ireland and the UK (2010-2015) – Steers R3 ......................................................................................................................................... 45
Figure 3.3: Average Monthly Differential in Cattle Prices between Ireland and the UK (2010-2015) – Steers (Average of All Grades) .......................................................................................................... 46
Figure 3.4: Average Monthly Differential in Cattle Prices between Ireland and the UK (2010-2015) – Heifers (Average of All Grades) ......................................................................................................... 47
Figure 3.5: Average Monthly Differential in Cattle Prices between Ireland and the UK (2010-2015) – Young Bulls (Average of All Grades) .................................................................................................. 48
Figure 3.6: Average Monthly Differential in Cattle Prices between Ireland and the UK (2010-2015) – Cows (Average of All Grades) ........................................................................................................... 49
Figure 3.7: Possible Seasonal Effects in Irish and UK Cattle Prices – Steers R3 (Jan 2010-Feb 2016) ..... 51
Figure 3.10: Trend in the Total Number of Cattle Slaughtered in the State (1996-2015) ...................... 56
Figure 3.11: Shares of Cattle Slaughtered in the State by Types of Cattle (1996, 2011 and 2015) ......... 57
Figure 3.12: Trend in the Total Number of Lambs Slaughtered in the State (1996-2015) ..................... 61
Figure 3.13: Shares of Lambs/Sheep Slaughtered in the State by Types of Sheep (1996, 2012 and 2015)........................................................................................................................................................ 62
Figure 3.15: Estimated Market Shares of Firms in the Broadest Relevant Market for the Procurement of Cattle for Slaughter in the State Comprising DAFM Export-Approved Processors and LA Abattoirs (2011 and 2015) ............................................................................................................................... 75
Table A1: Correlation Coefficients of Price Series for Grades of Steers in Ireland and Young Bulls in the UK (Jan 2010-Feb 2016) – Informing the Relevant Geographic Market for Steers in the State ............. 95
Table A2: Correlation Coefficients of Price Series for Grades of Steers in Ireland and the UK (Jan 2010-Feb 2016) – Informing the Relevant Geographic Market for Steers in the State .................................. 95
Table A3: Correlation Coefficients of Price Series for Grades of Steers in Ireland and Heifers in the UK (Jan 2010-Feb 2016) – Informing the Relevant Geographic Market for Steers in the State .................. 96
Table A4: Correlation Coefficients of Price Series for Grades of Steers in Ireland and Cows in the UK (Jan 2010-Feb 2016) – Informing the Relevant Geographic Market for Steers in the State .................. 96
Table A5: Correlation Coefficients of Price Series for Grades of Heifers in Ireland and Young Bulls in the UK (Jan 2010-Feb 2016) – Informing the Relevant Geographic Market for Heifers in the State ............ 97
PMCA Economic Consulting Page iii
Table A6: Correlation Coefficients of Price Series for Grades of Heifers in Ireland and Steers in the UK (Jan 2010-Feb 2016) – Informing the Relevant Geographic Market for Heifers in the State ................. 97
Table A7: Correlation Coefficients of Price Series for Grades of Heifers in Ireland and the UK (Jan 2010-Feb 2016) – Informing the Relevant Geographic Market for Heifers in the State ................................ 98
Table A8: Correlation Coefficients of Price Series for Grades of Heifers in Ireland and Cows in the UK (Jan 2010-Feb 2016) – Informing the Relevant Geographic Market for Heifers in the State ................. 98
Table A9: Correlation Coefficients of Price Series for Grades of Cows in Ireland and Young Bulls in the UK (Jan 2010-Feb 2016) – Informing the Relevant Geographic Market for Cows in the State .............. 99
Table A10: Correlation Coefficients of Price Series for Grades of Cows in Ireland and Steers in the UK (Jan 2010-Feb 2016) – Informing the Relevant Geographic Market for Cows in the State .................... 99
Table A11: Correlation Coefficients of Price Series for Grades of Cows in Ireland and Heifers in the UK (Jan 2010-Feb 2016) – Informing the Relevant Geographic Market for Cows in the State .................. 100
Table A12: Correlation Coefficients of Price Series for Grades of Cows in Ireland and the UK (Jan 2010-Feb 2016) – Informing the Relevant Geographic Market for Cows in the State ................................. 100
Table A13: Details of the Average Monthly Differential in Cattle Prices between Ireland and the UK (2010-2015) – Young Bulls, Steers, Heifers and Cows ....................................................................... 101
Table A14: Results of Econometric Analysis of Seasonality in Cattle Prices in Ireland and the UK (Jan 2010-Feb 2016) – Young Bulls, Steers, Heifers and Cows .................................................................. 102
Table A15: Results of Econometric Analysis of Seasonality in Lamb Prices and Selected Other Countries (Jan 2010-Feb 2016) ....................................................................................................................... 103
Figure A1: Estimated Gini Coefficients of Inequality for the Irish and English Beef Processor Plant Size Distributions (2014 England and 2015 Ireland) ................................................................................ 104
Box A1: ‘A Growing Empire’ – Article in the Irish Farmers Journal (12 December 2016) Reproduced Here (Continued Overleaf) ............................................................................................................... 93

Glossary of Terms
PMCA Economic Consulting Page iv
Glossary of Terms
£ Sterling.
€ Euro.
A priori Latin term used in economics to mean ‘from first principles’ – what an economist would expect to find in empirical data analysis from economic principles and/or prior experience before conducting the empirical analysis.
Ab initio Latin term meaning ‘from the beginning’.
ABP Anglo Beef Processors Food Group.
AHDB Agriculture and Horticulture Development Board (UK body).
AIMS Animal Identification and Movement System (maintained by the DAFM for the purposes of traceability in compliance with EU requirements).
ANOVA Analysis of variance.
AR(1) First-order autocorrelation (econometric analysis).
BIDS Beef Industry Development Scheme.
BIOD Biodiesel.
(An) Bord Bia (The) Irish Food Board. Bord Bia is responsible for the promotion of Irish agri-food products at home and in overseas markets, including beef and lamb. Its responsibilities include ensuring standards and quality of Irish food products.
Brexit Refers to the UK referendum on whether to remain in or exit the European Union due to be held on 23 June 2016. Note that while the ‘Br’ in Brexit might give the impression that the referendum will occur in Britain or Great Britain (England, Scotland and Wales), eligible people living in Northern Ireland (NI), which is also part of the UK, will also be able to vote.
Britain Another popular or shortened term for Great Britain or GB (comprising England, Scotland and Wales). GB is generally the preferred term and is used in this report. GB or Britain does not include Northern Ireland. The UK is made up of GB and NI.
BSE Bovine spongiform encephalopathy (‘mad cow disease’).
c Cent (€0.01).
CAGR Compound annual growth rate.
CAP Common Agricultural Policy.
CCPC Competition and Consumer Protection Commission (the Irish competition authority).
Ceteris paribus Latin phrase used in economics meaning ‘other things being equal’.
CMA Competition and Markets Authority (the UK competition authority).
Co. County (Ireland and NI) (e.g. Co. Wexford, Co. Armagh etc.).
Competition Authority The former Competition Authority in Ireland existed up to 31 October 2014, when it was merged with the former National Consumer Agency to form the current Competition and Consumer Protection Commission (CCPC).
CPI Consumer Price Index.

Glossary of Terms
PMCA Economic Consulting Page v
CSO Central Statistics Office (Ireland).
DAFM Department of Agriculture, Food and the Marine.
DG Directorate-General (of the European Commission, EC).
DG Comp Directorate-General for Competition (of the European Commission, EC).
DSP Deseasonalisation Payment (from the EU to Irish farmers to reduce seasonal variation in cattle production for beef supply in the 1990s).
DVO District Veterinary Office.
DW Deadweight (or carcase weight).
EC European Commission.
EEC European Economic Community.
ERS Economic Research Service (part of the USDA – see USDA).
EU European Union.
Eurostat Official statistics agency of the EU.
FFI Family farm income (per farm).
FSAI Food Safety Authority of Ireland.
Fifth quarter Offal and hide.
GB Great Britain (comprising England, Scotland and Wales). Sometimes GB is referred to as Britain for short.
HHI Herfindahl-Hirschman Index of market concentration, given as the sum of the squares of all firms’ market shares in a relevant market.
HHI delta The change in the Herfindahl-Hirschman Index of market concentration from the pre-merger to the post-merger environments. Algebraically, in a 2-firm merger or acquisition, the HHI delta is given as twice the product of the firms’ respective pre-merger market shares (infra footnote 24, p. 11 of the main body of the report).
Ibid. Latin citation term (short for ibidem, meaning ‘in the previous reference’).
ICM Irish Country Meats (part of Slaney).
IFA Irish Farmers’ Association.
IMF International Monetary Fund.
Infra Latin citation term referring to ‘below’.
Instant case Terminology used in competition work or similar for the case at hand, in this case the proposed transaction under consideration.
Inter alia Latin term meaning ‘among other things’.
Inter alios Latin term meaning ‘among other people’.
IPC Integrated pollution control (environmental licence).
Ireland ‘Ireland’ is the common name for the Republic of Ireland, which is distinct from NI and the rest of the UK and constitutes an autonomous, separate and independent country. The terms ‘Ireland’ and the ‘State’ are used interchangeably in this report to mean the same country.
Glossary of Terms
PMCA Economic Consulting Page vi
Island of Ireland Refers to Ireland or the Republic of Ireland and NI (Northern Ireland), which together make up the island of Ireland as a whole. The two countries are separate from each other – Ireland is an autonomous, separate and independent country, while NI is part of the UK, which also comprises Great Britain (GB) (England, Scotland and Wales).
JV Joint venture.
kg Kilogram (1,000 gram).
LA Local authority.
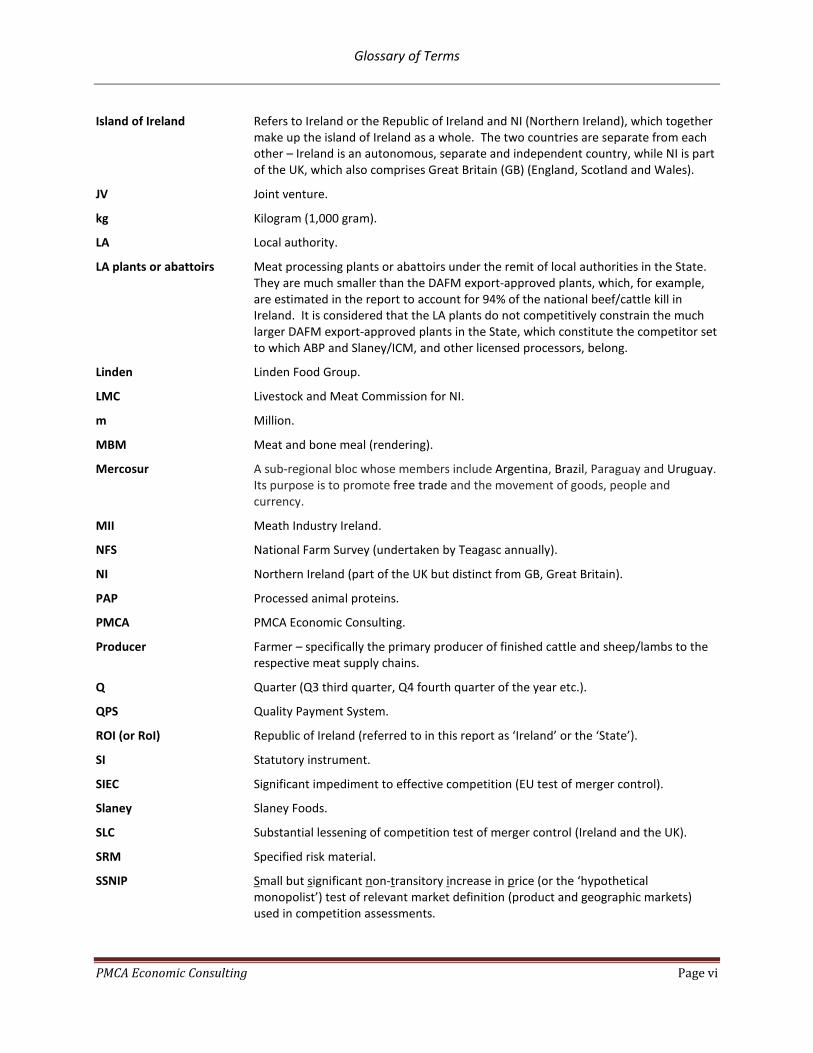
LA plants or abattoirs Meat processing plants or abattoirs under the remit of local authorities in the State. They are much smaller than the DAFM export-approved plants, which, for example, are estimated in the report to account for 94% of the national beef/cattle kill in Ireland. It is considered that the LA plants do not competitively constrain the much larger DAFM export-approved plants in the State, which constitute the competitor set to which ABP and Slaney/ICM, and other licensed processors, belong.
Linden Linden Food Group.
LMC Livestock and Meat Commission for NI.
m Million.
MBM Meat and bone meal (rendering).
Mercosur A sub-regional bloc whose members include Argentina, Brazil, Paraguay and Uruguay. Its purpose is to promote free trade and the movement of goods, people and currency.
MII Meath Industry Ireland.
NFS National Farm Survey (undertaken by Teagasc annually).
NI Northern Ireland (part of the UK but distinct from GB, Great Britain).
PAP Processed animal proteins.
PMCA PMCA Economic Consulting.
Producer Farmer – specifically the primary producer of finished cattle and sheep/lambs to the respective meat supply chains.
Q Quarter (Q3 third quarter, Q4 fourth quarter of the year etc.).
QPS Quality Payment System.
ROI (or RoI) Republic of Ireland (referred to in this report as ‘Ireland’ or the ‘State’).
SI Statutory instrument.
SIEC Significant impediment to effective competition (EU test of merger control).
Slaney Slaney Foods.
SLC Substantial lessening of competition test of merger control (Ireland and the UK).
SRM Specified risk material.
SSNIP Small but significant non-transitory increase in price (or the ‘hypothetical monopolist’) test of relevant market definition (product and geographic markets) used in competition assessments.
Glossary of Terms
PMCA Economic Consulting Page vii
State Meaning Ireland or the Republic of Ireland, a separate, autonomous and independent country.
Supra Latin citation term referring to ‘above’.
t Tonne(s).
TFEU Treaty of the Functioning of the European Union.
TSE Transmissible Spongiform Encephalopathies (BSE is a form of TSE).
TTIP Transatlantic Trade and Investment Partnership.
UCD University College Dublin.
UK United Kingdom of Great Britain and Northern Ireland.
US United States of America.
USDA United States Department of Agriculture.
VAT Value added tax.
Vice-versa Latin phrase meaning ‘the other way round’ or the ‘reverse’.
Vis-à-vis French phrase meaning ‘in relation to’ or ‘compared with’.
Viz. Latin term, and short for videlicet, meaning ‘namely’ or ‘that is to say’.
WEO World Economic Outlook (annual report from the IMF).
Executive Summary
PMCA Economic Consulting Page viii
Executive Summary
Introduction and Overview
This report is prepared for the Irish Farmers’ Association by PMCA Economic Consulting and considers the competition implications of the proposed transaction in which Anglo Beef Processors Food Group would acquire 50% of Slaney Foods. Currently (pre-transaction) Slaney is jointly owned (50:50) by the Allen family, based in County Wexford in the Republic of Ireland (henceforth Ireland or the State), and the Linden Food Group, a Northern Ireland-based beef and lamb processing company majority-owned by the NI-based farmers’ co-operative, Fane Valley Co-Op. Under the proposed deal, ABP would acquire 50% of Slaney through purchasing the Allen’s 50% share, with Linden (Fane Valley) retaining the other 50% of Slaney. The proposal would see the creation of a new joint venture company that would operate independently of its owners, ABP and Linden (Fane Valley), implying a full-function JV.
News of the proposed transaction became apparent in late 2015 and the parties subsequently issued a joint press statement regarding the proposal on 9 March 2016, where they outlined the rationale for the JV based on the need to evolve in beef processing, which the parties say is international in extent.
Farmer concerns over the possible competition implications of the proposed transaction (even if a full-function JV independent of its parents, ABP and Linden/Fane Valley) resulted in the IFA taking the decision to commission an independent expert economist report on the matter, and Dr. Pat McCloughan, Managing Director of PMCA, was retained by the IFA in early 2016 to produce this report.
The IFA and farmers in Ireland are worried by the prospect that the proposed transaction would significantly reduce competition in the primary procurement markets for the slaughter of cattle and sheep/lambs in the State (Ireland), these being the key relevant markets in respect of the proposed transaction that farmers and the IFA believe suffer already from weak competition. The IFA’s and farmers’ concerns stem from the view that the proposed transaction would give ABP, the leading meat processor in the country, insights into one of its main competitors in the State, namely Slaney, which operates the largest beef processing plant in Ireland, located at Bunclody in County Wexford, and which ranks as the fifth largest beef processor in the country, after the multi-plant processors Dawn, Kepak and Liffey as well as ABP. To the IFA and farmers, who produce the critical primary inputs to the meat supply chains that would be affected by the proposed transaction, the proposed deal would also give ABP important insights into the sheep/lamb processing market in the State, owing to the fact that Slaney/ICM is the largest processor of sheep and lamb meat in Ireland, having the country’s two largest facilitates at Camolin, Co. Wexford and Navan, Co. Meath, which operate under Irish Country Meats, which Slaney acquired in 2000. Slaney/ICM is the only multi-plant sheep/lamb processor in Ireland. While ABP is not directly active in lamb/sheep processing in the State, it is nevertheless active in this area in NI and Great Britain, where it operates facilities at Lurgan, Co. Armagh, and at Yetminster in Dorset, England. Slaney/ICM is also active in beef and lamb processing in NI and England, with respective operations in Dungannon and Newcastle (both through Linden/Fane Valley).
The ‘footprint’ of the parties (ABP and Slaney/ICM) is therefore extensive in meat processing in these islands (Ireland and Great Britain) and the proposed transaction would have competition effects in beef processing in the State and in lamb/sheep processing in the UK and in the EU, where the parties are also active in continental Europe, with ABP having beef processing interests in Poland and Slaney/ICM having sheep/lamb processing interests in Belgium. This is not to mention the competition effects of the proposal in retail markets in Ireland, the UK and the EU. The proposed deal is therefore a far-reaching and complex one, necessitating in PMCA’s view careful examination by the Directorate-General for Competition in Brussels and possibly the Irish and UK competition authorities in tandem with DG Comp.

Executive Summary
PMCA Economic Consulting Page ix
Accordingly, this report is also prepared by PMCA with a view to help inform DG Comp and possibly the Competition and Consumer Protection Commission (CCPC) in Ireland and the Competition and Markets Authority (CMA) in the UK on the likely competitive effects of the proposed transaction, where the legislative or substantive tests of merger control are broadly the same, namely the substantial lessening of competition (SLC) test in Ireland and the UK, and the significant impediment to effective competition (SIEC) test for the EU applied by DG Comp. These respective tests of merger control also apply to the competition appraisal of full-function JVs in the jurisdictions concerned, where a full-function JV generally results in the creation of an autonomous economic entity, independent of its parents (on the other hand, non-full-function JVs, such as strategic alliances or cooperative JVs between parties, are assessed in the EU under Article 101 of the Treaty of the Functioning of the European Union, which prohibits agreements between undertakings that may affect trade between Member States and that have as their object or effect the prevention, restriction or distortion of competition, noting that Article 101 TFEU is reflected in the respective competition laws of Ireland and the UK).
It is important to state at the outset that this report, which pertains in particular to the procurement-for-slaughter markets for cattle and sheep/lamb in Ireland, is produced independently by PMCA and that the conclusions are based on relevant empirical evidence examined by PMCA alone; while the IFA has necessarily been involved in providing PMCA with information about the relevant markets, all of the information and data received by PMCA from that organisation has been carefully checked and considered by PMCA independently; and further data, as required, has been obtained by PMCA from other sources, independently of the IFA.
The overall conclusion of this report is that the relevant primary procurement markets that would be affected by the proposed transaction are characterised by weak competition currently or pre-transaction, and that the proposed deal is likely to weaken competition even further, through a substantial lessening of competition in Ireland and possibly a significant impediment to effective Competition in the EU. Owing to the fact that most Irish beef and lamb/sheep meat is exported (the EU being the principal destination), intra-EU trade would be affected by the proposed JV.
The chief concern over the proposed transaction is that it would make coordinated effects in the relevant markets more likely, with consequent competitive harm to farmers as the providers of the critical inputs to the meat supply chains in the State and to consumers in relevant retail markets in Ireland, the UK and continental Europe downstream of the primary procurement markets for the slaughter/processing of cattle and lambs/sheep.
The reader is invited to carefully consider the rest of the executive summary and the whole of the main body of the report, which contains the underlying details forming the bases of the conclusions of the report, and the suggestions for further work by DG Comp (which are outlined in Section 5).
Executive Summary
PMCA Economic Consulting Page x
Summary of the Approach Taken and Key Considerations
PMCA’s approach to the assessment of the proposed deal has proceeded along the following steps:
• Relevant market definition – the relevant market provides the basis of all competition work generally speaking and the first step therefore is to delineate the boundary of the relevant market(s), by products and geography, in which the parties operate and which would be affected by the proposed transaction;
• Assessment of the level of competition in the defined relevant market(s)(pre-transaction) based on analyses of the relevant market’s salient characteristics – this step aims to address the question as to whether or not competition is working well in the relevant market(s) currently, in advance of the possibility of the proposed transaction being put into effect;
• Assessment of the competitive effects of the proposed transaction – this step in the approach seeks to address the question relating to how, if at all, competition in the relevant market(s) defined would change as result of the proposed transaction and, in particular, whether or not the proposed transaction would result in an SLC or an SIEC, as applicable to competition assessments of mergers/acquisitions and full-function JVs in Ireland or the EU respectively.
In regard to the first step, multiple relevant market definitions are often applied in competition assessments of proposed transactions, and this flexible approach is deployed too in this report. Broadly speaking, the relevant markets considered in the course of this report are primary markets in which farmers provide cattle and sheep/lambs respectively to processors, who then slaughter the animals, de-bone and cut the carcases (some meat plants also sell part/whole carcases) and then pack the processed output for home and overseas markets, where the onward business customers include retailers, butchers, food manufacturers and food service firms, and the ultimate end-users are personal consumers who purchase beef and/or lamb in retail outlets and in cafes, restaurants, hotels, bars or public houses etc. (‘pubs’ in Irish or UK parlance). Both ABP and Slaney/ICM are active in these broadly defined markets in the State and/or in other parts of the EU.
Product-wise, the cattle procurement market may be considered on the bases of the types and grades of cattle entering the beef supply chain and the export requirements imposed, implying that we should consider relevant product markets comprising all types and grades of cattle for beef (broad delineation) and narrower delineations comprising premium cattle (steers and heifers) meeting export standards. Similarly for lamb, we should consider broad and narrow product markets consisting of all sheep and lambs for slaughter and just lambs respectively.
Geographically, we consider each of the cattle and lamb/sheep procurement markets as pertaining to the State or the country as a whole. Farmers producing the critical inputs to the beef and lamb supply chains work under the direction of State authorities and deal with Irish-based processors. That said, and given how the business works in practice, it is also appropriate to consider a narrower geographical delineation and in this regard we already know from practical experience and from the previous Irish Competition Authority/CCPC merger determination Dawn/Galtee (2003) that the relevant market tends to operate locally in reality – farmers tend to deal with processors located within 60 miles or about an hour’s drive away at most from where their animals are finished, notwithstanding the possibility of there being a chain of substitution effect from one local market to other local markets, leading in turn to a country-wide geographic market, which is in any event considered in this report. In the sheep/lamb markets, we also consider imports from NI that are slaughtered and processed in the State.
Accordingly, both broad and narrow relevant product and geographic markets are considered in the course of the report.
Executive Summary
PMCA Economic Consulting Page xi
While the focus of attention is placed on the primary cattle and lamb procurement markets, a related relevant market that PMCA considers is also pertinent to the competitive assessment of the proposed transaction concerns rendering, which occurs downstream from the primary procurement markets.
Rendering generally entails the processing of slaughtered animal remains into products other than beef or lamb, such as tallow, meat and bone meal, and proteins. Both ABP and Slaney/ICM are also active in rendering in the State, along with just one other meat processor, namely Dawn, which is also active in beef and lamb/sheep processing in Ireland. These three firms (ABP, Slaney/ICM and Dawn) are the only meat processors in the State that are also active in rendering, and there are other rendering firms in the State but which are not also active in meat processing. The parties to the proposed transaction are therefore vertically integrated firms (they are active in rendering as well as meat processing in Ireland).
The significance of this fact, in the context of this report, is that provides another business activity or relevant market in which the parties overlap and it may serve to give them (ABP and Slaney/ICM) (and the other renderer that is also active in meat processing in the State, namely Dawn) information or competitive insights on the upstream meat processing activities of their competitors who may rely on the parties and Dawn for their rendering needs.
The vertical integration of the parties does not end with rendering. ABP and Slaney also have close relationships with retailers as well as being active in rendering. PMCA understands that ABP is the main supplier from Ireland to retailers into Ireland’s largest export market, the UK. ABP is the Irish processor of choice to the 3 major retail groups in the UK (Tesco, Sainsbury and Asda). In addition, ABP is the main processor supplying Tesco in Ireland and supplies Angus beef for all of Tesco’s counter sales (Tesco is the largest grocery retailer in the State). The firm also supplies Aldi in Ireland and is the supplier of choice to Pallas Foods, the largest food service/restaurant supplier in the State. Slaney is the supplier of choice for Hereford prime beef to Lidl in Ireland. Both Aldi and Lidl have gained market share in the Irish grocery market in recent years, as many shoppers have switched to the discounter multiples following the economic recession from 2008.
ABP, the largest meat processor in Ireland, is also further vertically integrated in having its own feedlot cattle, which means that it has significant capacity in terms of self-supply to its processing factories, which in turn may serve to give the company additional bargaining power vis-à-vis farmers on the prices of cattle.
In addition, vertical integration can also act as a barrier to entry or be strategically exploited by vertically integrated firms to deter entry or regulate how entry occurs, to their own advantages, particularly in markets in which regulatory barriers to entry are high – as in the instant case, as observed by the CCPC (or the then Irish Competition Authority) in the aforementioned Dawn/Galtee merger determination in 2003, on which we comment further in the main body of the report (Section 2).
In the context of the relevant markets under consideration in this report, a potential entrant might decide not to enter the Irish meat procurement/processing market because of the prospect of having to deal with a competitor in that market in regard to rendering, or because of the strength of the incumbents through their upstream and/or downstream integration via having their own feedlot cattle and/or links with retailers as well as rendering respectively.
The vertically integrated nature of the relevant markets that would be affected by the proposed transaction also implies multi-market contact, which generally speaking can provide opportunities for coordinated behaviour to soften or reduce competition in the markets where firms repeatedly meet.
Executive Summary
PMCA Economic Consulting Page xii
These considerations – vertical integration, high barriers to entry, the strength of the incumbents in terms of their associations with meat processing and with Irish beef at home and in international export markets, along with their multi-market activities – underpin the view that competition is weak in the relevant markets, currently or pre-transaction.
Summary of the Structure of the Report
The substantive sections of the report are: Section 2 (entitled Relevant Market Definition, where the relevant cattle and sheep/lamb procurement markets are delineated); Section 3 (Characteristics of the Relevant Market, in which the salient features of the relevant markets defined are considered, at the end of which we arrive at an informed assessment of the current level of competition in the relevant markets, pre-transaction); and Section 4 (Comments on the Competitive Effects of the Proposed Transaction, where we comment on the likely unilateral and coordinated effects of the proposed transaction, based on the analyses contained in the preceding section of the report and the nature of the proposed JV). Finally, in Section 5 of the report, we conclude on the competitive effects of the proposed transaction, and respectively also give suggestions for additional investigation, aimed at helping to inform DG Comp in its assessment of the proposed transaction. The suggestions for further work are based on the gaps in information identified in the course of this report, which PMCA considers should be plugged in order to reach a fully informed decision regarding the competitive effects of the proposed deal (Dr. McCloughan is mindful that DG Comp might already have plugged the information gaps identified in this report but it is nevertheless important to raise them here in any event).
The IFA’s Position on the Proposed Transaction
Representing over 75,000 farmers in Ireland, the IFA is the largest farmer representative organisation in Ireland and one of the very largest such organisations in the State. The IFA supports a strong and sustainable beef industry, which plays an important role in the performance of the national economy, generating exports of almost €3 billion annually.
To ensure that goal, there needs to be effective competition in the beef supply chain, including in the key upstream cattle procurement market that provides the critical input for the sector. To the IFA, effective competition among processors will lead to more viable prices for farmers and in turn support the sustainability of the Irish beef industry. In other words, the international competitiveness of the industry is a function of competition along the supply chain, particularly in the key cattle procurement market.
The IFA and farmers believe that competition is currently weak or ineffective in the cattle procurement market and in support of this view they cite low cattle prices, relative to those in Ireland’s main export market, and low incomes for farmers active in cattle rearing and finishing.
The IFA is concerned that the proposed transaction will weaken competition even further, thereby threatening the livelihoods and welfare of the farmers just mentioned.
The same concerns apply to lamb production – an activity that Ireland also has a trading comparative advantage because most of the lamb produced in the State is exported overseas. However, like beef, incomes among sheep farmers are relatively very low and this is due to low prices relative to those in Ireland’s main export markets of France and the UK, and a highly concentrated lamb/sheep processing sector. In short, Ireland’s comparative advantages in beef and lamb production come at a high cost for farmers at the beginning of the respective supply chains in the State.
Executive Summary
PMCA Economic Consulting Page xiii
Synopses of PMCA’s Independent Analyses of Competition in the Relevant Market
Relevant Market Definition PMCA considers that the following broad and narrow market definitions are relevant to the assessment of the competitive effects of the proposed transaction between ABP and Slaney (the narrowest markets relating to premium cattle may be judged as the most relevant delineations owing to the stringent standards on Irish beef exports – although the standards do not necessarily mean that competition in the cattle procurement markets involved works well for producers/farmers):
• Beef – procurement of cattle for slaughter; o National/State markets from broad to progressively narrower market definitions based
on the types and grades of cattle procured (which include cattle imports, which account for a relatively small proportion of the national beef/cattle kill in Ireland) All types and grades of cattle (broadest market definition) Prime cattle comprising steers, heifers and young bulls (narrower definition) Premium cattle comprising steers and heifers (narrower still but just as, if not
more, relevant owing to the importance of premium cattle in Irish beef exports) Premium cattle comprising steers and heifers meeting the Meat Industry Ireland
(MII) grade (narrower again but just as valid a relevant market definition) Premium cattle comprising steers and heifers meeting the MII grade and weight
specification (narrower still and perhaps the most relevant market definition because this particular delineation captures the standards for Irish beef exports)
Specialty breeds – Angus and Hereford cattle (a possible additional relevant market definition, although not quantified in this report due to lack of independent data but nevertheless an additional possibility that DG Comp might also consider, in view of the growing popularity of specialty breeds of cattle in the Irish beef supply chain, which are also gaining traction with consumers at retail level)
o Local versions of the above national market delineations incorporating the Irish Department of Agriculture, Food and the Marine (DAFM) export-approved processing plants within a 60-mile radius of Slaney’s Bunclody facility (the DAFM export-approved plants constitute the key set in which ABP and Slaney compete, whether the geographic market is the State or regionally/locally-based All types and grades of cattle Prime cattle comprising young bulls, steers and heifers Premium cattle comprising steers and heifers Premium cattle comprising steers and heifers meeting the MII grade Premium cattle comprising steers and heifers meeting the MII grade and weight
specification (as with the corresponding national market delineation above, PMCA considers that this market definition is particularly relevant because it captures the standards on Irish beef for export)
Specialty breeds – Angus and Hereford cattle (remarks above apply here) • Lamb – procurement of sheep and lambs for slaughter (from broadest to narrowest);
o All sheep and lambs in the State (and including live imports from NI) o Lambs in the State (excluding other forms of sheep but including live imports from NI) o Lambs in the State (excluding other forms of sheep and live imports from NI).
Executive Summary
PMCA Economic Consulting Page xiv
PMCA has been able to derive estimates of the parties’ market shares and of market concentration in the various relevant markets delineated, apart from the possible relevant market definition comprising specialty breeds of cattle (Angus and Hereford), which are becoming more popular in the State and in which ABP and Slaney are active, PMCA understands. Lack of quantitative data has meant that this niche market definition is not analysed in detail in this report but nonetheless PMCA considers that it may merit examination by DG Comp (if it has not already done so).
Characteristics of the Relevant Markets
Farm Incomes and Prices
The main findings from PMCA’s analysis of farm incomes and prices are summarised as follows (the details are outlined in Sub-Section 3.2 of the main body of the report):
• Farm incomes are very low on average compared with other occupations in Ireland – average industrial earnings were two-thirds larger than the average farm income in 2014 (Teagasc’s latest National Farm Survey at the timing of preparing this report pertains to that year; Teagasc is the State authority for the development of agriculture and food in Ireland);
• Average industrial earnings were more than 3 times the average income earned on cattle finishing farms and were 3 times the average income earned on sheep farms in Ireland in the same year, implying that average incomes on cattle finishing farms and sheep farms are significantly lower compared with average incomes across all farm systems in the State;
• In the absence of EU direct payments, it is likely that many cattle finishing farms and sheep farms in the State would cease operations, in turn giving rise to considerable adverse economic and social impacts for rural Ireland;
• In each of cattle finishing and sheep farms, direct payments from Europe have exceeded underlying farm-generated incomes per year on average since the beginning of the century;
• Such is the level of need that off-farm employment rates greater than 30% are observed in cattle finishing farms and sheep farms in the State;
• Such additional employment among farmers and/or their spouses in these farm systems is not without cost – off-farm employment deflects from farmers’ core activities, which occur year-round or on a 24/7/365 basis, and fatigue among farmers may lead to other adverse effects;
• Cattle prices, which underpin cattle finishing incomes, are substantially lower in Ireland compared with the UK, the most comparable market to that in Ireland and the main export market for Irish beef, and the gap in prices between the countries has been widening over time, and more rapidly compared with the appreciation of sterling against the euro during the period examined in this report;
• The differentials in cattle prices between Ireland and the UK are apparent in the markets for prime and premium cattle, which are important for cattle finishing farms owing to the emphasis placed on ensuring that Irish beef is a quality product at home and in overseas markets;
• Cattle prices in Ireland also exhibit statistically significant seasonal effects in which prices are lower in the third quarter of the year compared with other times of the year – this reflects the grass-based system of production on cattle finishing farms and may also serve to give processors additional bargaining power in regard to prices quoted/agreed with farmers (it is important to note that the seasonality of Irish cattle prices does not by itself explain the differential in cattle prices between Ireland and the UK, in which the growing gap is in favour of the UK)
• Independent research by the State agency Teagasc suggests that a price of €4-€4.50/kg DW (carcase) is needed to deliver a sustainable return to cattle finishing farms;
Executive Summary
PMCA Economic Consulting Page xv
• Examination of key premium cattle (steers and heifers) prices currently shows that, at best, they average at a level only marginally above €4/kg, meaning that they tend towards the bottom end of the sustainable price range implied by Teagasc’s independent estimate of a viable beef price;
• While the parties to the proposed transaction (ABP and Slaney) are correct in pointing out, in their joint press statement regarding the proposed deal issued on 9 March 2016, that steers and heifers prices have grown since the beginning of the decade (namely by 37% during 2010-2015), premium cattle prices have yet to reach a level that would be viable for beef farmers, or in other words that the growth in premium cattle prices referred to by the parties has come from a very low base initially and remains low compared with Teagasc’s independent estimate of a viable beef price (i.e. €4-€4.50/kg DW (carcase));
• By way of observation, the emphasis throughout on premium cattle further points to the importance of the relevant market definitions for steers and heifers considered in this report;
• Lamb prices are lower on average in Ireland compared with GB and the lower prices are directly related to the particularly low incomes observed in Irish sheep farms, just as the low cattle prices are related directly to the especially low incomes in cattle finishing farms in Ireland.
The IFA believes that the low incomes in cattle finishing farms and sheep farms in Ireland, stemming from the low cattle and sheep prices, are fundamentally driven by weak competition in the relevant procurement markets for cattle and sheep/lambs in the State. PMCA has independently examined this view by reference to the salient features of the relevant markets concerned, which are summarised now and treated in detail in Section 3 of the main body of the report.
Market Size and Growth
The Relevant Market of Cattle Procurement for Slaughter
At its widest delineation, approximately 1.67 million head of cattle were slaughtered in the State in 2015, placing the relevant market at about the same size as its counterpart in England (the largest beef-producing part of the UK). The buyers in the broadest relevant market definition in Ireland are processing factories together with much smaller abattoirs coming under the remit of local authorities. The much larger processors, which are approved by the DAFM, and licensed to export Irish beef, together accounted for an estimated 94% of the national beef kill in 2015. In that year, there were 30 DAFM export-approved processing plants active in the State, averaging a little over 52,000 head of cattle slaughtered per plant. ABP is the largest processor, with six (6) plants, followed by Dawn and Kepak, each with four (4) plants, and then Liffey, with three (3) plants. After the multi-plant processors, Slaney is estimated to be the next (i.e. fifth) largest beef processor by virtue of having the biggest plant in the country, where its Bunclody facility in Co. Wexford is estimated to have slaughtered over 88,000 head of cattle in 2015. In sharp contrast, at the other end of size distribution pertaining to the widest relevant market definition for cattle procurement considered in this report, PMCA understands from the Food and Safety Authority of Ireland that there are over 200 abattoirs under the remit of local authorities currently, which suggests that each such facility would on average have accounted for less than 500 head of cattle slaughtered in 2015 (this is a rough-and-ready estimate because not all of the 200+ abattoirs under local authority remit may have been active in slaughtering cattle). Nonetheless, the top line estimates illustrate the predominance of a small number of comparably large, export-approved processors in the relevant market, which includes the parties. The DAFM export-approved processing plants constitute the key competitor set for the purposes of assessing competition in the relevant cattle procurement markets in Ireland and the likely effects on competition of the proposed transaction (this also applies to the corresponding relevant sheep/lamb procurement markets).
Executive Summary
PMCA Economic Consulting Page xvi
In assessing how the size of the relevant cattle procurement market has changed over time, one must be mindful of the fundamental changes that have occurred in the industry, which have been driven by major events with cross-country ramifications that have received a lot of media attention, including the BSE crisis in the 1990s in the UK and the outbreak of foot-and-mouth disease in the UK and Ireland in 2001. The horsemeat scandal in the meat processing sector that came to light in a number of European countries in 2013 was another major event driving change in the sector. As a result of these events, one finds a different beef processing market in Ireland today compared with a decade or more ago.
In particular, the greater emphasis on safety and quality has resulted in greater demand for prime and premium cattle and the share of steers and heifers in the national cattle kill has risen in turn, mainly as a result of a reduction in the number of young bulls slaughtered. Correspondingly, though, the changes in response to the major events have also meant that the throughput at processing factories has slowed in recent years, in sharp contrast to the situation previously when the throughput was more fluid and when ‘third-country’ markets, outside of the EU, were more important to Ireland (the escalating geo-political tensions of recent years have also impacted on Ireland’s beef trade internationally).
The changes have seen a reduction in the national beef kill during the past twenty years and the focus on quality today suggests that attention should be given to the narrower product market definition of premium cattle consisting of steers and heifers, whether in the State or in the south Leinster area. The number of cattle slaughtered in each of the premium cattle markets delineated in this report declined during 2010-2015 – the details are reported in the main body of the report (Table 3.5, p. 59, and Table 3.6, p. 60).
Generally speaking (but not exclusively) in competition assessments, declining markets may present an incentive for firms to coordinate their behaviour in an attempt to mitigate the shrinking opportunities; whereas in contrast growing markets may give firms an incentive to compete, in order to capture a greater share of the increasing opportunities becoming available, ceteris paribus. However, the ability of firms to coordinate depends on other market characteristics, which also need to be taken into account and to which we return in our summary a little further below.
The Relevant Market of Lamb Procurement for Slaughter
In 2015, more than 2.8 million sheep were slaughtered at both DAFM export-approved processing plants and abattoirs under the remit of local authorities in the State (local authorities comprise city and county councils in Ireland and constitute local government in Ireland). Of these, the vast majority (more than 2.5m) were lambs, illustrating the predominance of lamb meat at home and in Ireland’s export markets. Like the cattle procurement market, the lamb market has also been in decline but the rate of contraction has been even greater among lambs compared with cattle over the past twenty years.
Within the sheep and lamb procurement market, the largest slaughterer/processor is Slaney/ICM, estimated to have a market share of over 34% in the broadest relevant market definition comprising all sheep slaughtered in the State at DAFM export-approved plants (including live imports from NI) and 32% in the narrowest definition consisting of all lambs slaughtered at DAFM export-approved plants in the State (exclusive of live imports from NI) (the estimates pertain to 2012). As mentioned earlier, the Slaney/ICM sheep/lamb processing plants in Counties Meath and Wexford are the largest plants of their kind in the State. The next largest competitors are estimated to be Kepak, Kildare Chilling Company and Dawn – all of which are also active in beef processing in the State.

Executive Summary
PMCA Economic Consulting Page xvii
Market Shares and Concentration
Cattle Procurement in the State
PMCA has estimated the parties’ respective market shares and those of the other competitors in the relevant market, and we have also estimated the degree of concentration in the relevant markets, pre- and post-transaction. The analysis carried out is instructive for illustrating the relative sizes of the parties and the changes in market structure that would ensue in the event of the proposed transaction being put into effect. The analysis is conducted in each of the relevant market definitions pertaining to the State and to the south Leinster area.
The results of the analysis of market shares and concentration for the six relevant market definitions, from broadest (number 1) to narrowest (number 6), are given in the table below, where the geographic market is the State in each case. The breadth of the market definition is thus determined by the product dimension, in which the first market definition includes all types and grades of cattle slaughtered at both DAFM export-approved and local authority plants. The second market definition excludes the LA plants and then the subsequent markets defined (3-6 in the table) take progressively narrower product market delineations focused on only the DAFM exported-approved plants, which constitutes the key set of competitors in each case (the LA plants or local abattoirs do not competitively constrain the much larger DAFM exported-approved plants, to which ABP and Slaney belong). It could well be argued that the last and narrowest relevant market defined in the table – namely that of premium cattle comprising steers and heifers meeting the Meat Industry Ireland grade and weight specification at DAFM export-approved plants – is the most appropriate delineation owing to the importance placed on promoting Irish beef as a high quality product in overseas/export markets.
Estimated Market Shares of the Parties and Market Concentration in the Broad and Narrow Relevant Markets for the Procurement of Cattle for Slaughter (2015) – Geographic Market the State
Source: This table is reproduced from the main body of the report (Table 3.8, p. 65).
ABP Slaney
Pre-Transaction
HHI
Post-Transaction
HHI HHI Delta1 All Cattle at DAFM Export-Approved Plants and LA Plants 20.5% 5.3% 1,162 1,379 217
2 All Cattle at DAFM Export-Approved Plants 21.9% 5.6% 1,275 1,522 246
3 Prime Cattle Comprising Steers, Heifers and Young Bulls at DAFM Export-Approved Plants
25.0% 6.4% 1,406 1,725 319
4 Premium Cattle Comprising Steers and Heifers at DAFM Export-Approved Plants
26.1% 7.2% 1,408 1,783 374
5 Premium Cattle Comprising Steers and Heifers meeting the MII Grade at DAFM Export-Approved Plants
26.9% 7.6% 1,480 1,888 408
6 Premium Cattle Comprising Steers and Heifers meeting the MII Grade and Weight Specification at DAFM Export-Approved Plants
27.8% 8.4% 1,541 2,010 469
Procurement of Cattle for Slaughter in the State
Parties' Market Shares Market ConcentrationEstimated Market Shares and Concentration (Cattle Slaughtered)

Executive Summary
PMCA Economic Consulting Page xviii
As we move from the broadest to the narrowest market definitions in the table above, the estimated market shares of the parties increase accordingly. In the widest delineation, ABP’s estimated market share of 21% means that it is largest firm in the market. After the other multi-plant processing firms – Dawn (4 plants), Kepak (4) and Liffey (3), with estimated market shares of 14%, 14% and 8% respectively – Slaney is the next or fifth largest processor; or in other words, it is the next largest firm after the multi-plant processing firms. In the narrowest (but perhaps the most relevant) market definition, ABP is by some margin the largest processor, with an estimated 28% market share. It is followed by Kepak (17%) and Dawn (13%), and then by Slaney, whose market share in this case is estimated at over 8%, meaning that it is larger than Liffey in this particular market delineation (Liffey’s share is estimated at 6%). In all six market definitions in the table above, ABP is consistently the largest processor.
Turning to the other numbers in the table above, the HHI is a specific measure of market concentration used by the CCPC and other national competition authorities. Generally speaking, it is based on taking every firm in a relevant market defined, squaring its market share and then adding up the sum of the squared market shares (and finally multiplying the sum by 10,000 to re-scale the measure of concentration in order to make it easier to interpret). The effect of squaring market shares means that more weight is given to larger firms. The polar values of the HHI are 0 and 10,000 – perfect competition and monopoly respectively. But these extreme values are rarely, if ever, observed in reality and instead national competition authorities conventionally discern concentration in relevant markets as follows:
• Low concentration – HHI less than 1,000; • Concentration or moderate concentration – HHI between 1,000 and 2,000; and • High concentration – HHI above 2,000.
In highly concentrated markets, the leading firms account for a significantly high proportion of market size (volume or value of output, and concentration can also be measured by capacity). It is important to note that concentration does not equate with competition or a lack of competition, and that a highly concentrated market with a firm having an especially large market share does not necessarily imply that the market lacks competition or there is a dominant position in the market. Concentration is generally an important characteristic of relevant markets in competition work but by itself is not conclusive or definitive of the level of competition; it needs to be considered alongside other features of the relevant market, which has been done with the proposed transaction in this report.
The ‘HHI delta’ referred to in the table above measures the change in the HHI level of concentration from the pre-transaction to the post-transaction situations – in other words, the HHI delta captures how concentration in the relevant market would change in the event that the proposed transaction were put into effect (when considered as effectively a merger situation or full-function JV). The Irish CCPC has produced guidelines (in 2014) on how it conducts competitive analysis of proposed transactions and these include thresholds in respect of the HHI delta. They are outlined in the main body of the report but it is sufficient to note here that “in a concentrated market a delta of less than 250 is unlikely to cause concern and in a highly concentrated market a delta of less than 150 is unlikely to cause concern”.
The pre- and post-transaction HHIs in the table above indicate that the relevant cattle procurement market in the State is concentrated (but not highly concentrated) but that as we move to the narrower market definitions the HHI delta increases to well above the 250 level indicated in the CCPC’s guidance. What is driving the sharp rise in the HHI deltas as we move to the narrower, but no less relevant, market definitions in the table above are the increasing market shares of the parties, ABP and Slaney (generally speaking, the HHI delta is given as twice the product of the parties’ respective market shares).
Executive Summary
PMCA Economic Consulting Page xix
In summary, in respect of the estimates of market shares and concentration reported in the table above, the proposed transaction, viewed as effectively a merger situation or full-function JV, raises concerns in view of the HHI deltas, which capture the significance of Slaney as a leading player in the relevant market, as well as ABP as the largest processor. The CCPC’s merger guidelines are careful, however, not to over-emphasise the HHI delta as an indicator of the overall competitive effects of a transaction (generally speaking) and it is mindful of other drivers of competition as well as concentration, and how they may change as a result of transactions.
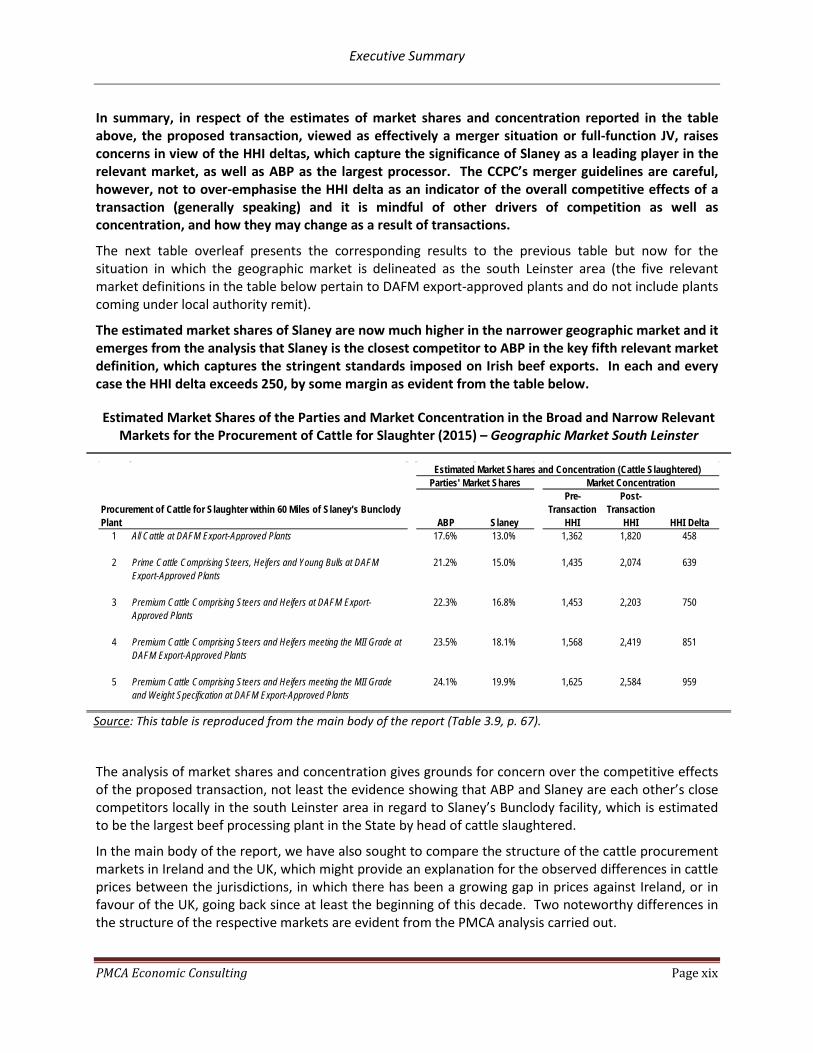
The next table overleaf presents the corresponding results to the previous table but now for the situation in which the geographic market is delineated as the south Leinster area (the five relevant market definitions in the table below pertain to DAFM export-approved plants and do not include plants coming under local authority remit).
The estimated market shares of Slaney are now much higher in the narrower geographic market and it emerges from the analysis that Slaney is the closest competitor to ABP in the key fifth relevant market definition, which captures the stringent standards imposed on Irish beef exports. In each and every case the HHI delta exceeds 250, by some margin as evident from the table below.
Estimated Market Shares of the Parties and Market Concentration in the Broad and Narrow Relevant Markets for the Procurement of Cattle for Slaughter (2015) – Geographic Market South Leinster
Source: This table is reproduced from the main body of the report (Table 3.9, p. 67).
The analysis of market shares and concentration gives grounds for concern over the competitive effects of the proposed transaction, not least the evidence showing that ABP and Slaney are each other’s close competitors locally in the south Leinster area in regard to Slaney’s Bunclody facility, which is estimated to be the largest beef processing plant in the State by head of cattle slaughtered.
In the main body of the report, we have also sought to compare the structure of the cattle procurement markets in Ireland and the UK, which might provide an explanation for the observed differences in cattle prices between the jurisdictions, in which there has been a growing gap in prices against Ireland, or in favour of the UK, going back since at least the beginning of this decade. Two noteworthy differences in the structure of the respective markets are evident from the PMCA analysis carried out.
ABP Slaney
Pre-Transaction
HHI
Post-Transaction
HHI HHI Delta1 All Cattle at DAFM Export-Approved Plants 17.6% 13.0% 1,362 1,820 458
2 Prime Cattle Comprising Steers, Heifers and Young Bulls at DAFM Export-Approved Plants
21.2% 15.0% 1,435 2,074 639
3 Premium Cattle Comprising Steers and Heifers at DAFM Export-Approved Plants
22.3% 16.8% 1,453 2,203 750
4 Premium Cattle Comprising Steers and Heifers meeting the MII Grade at DAFM Export-Approved Plants
23.5% 18.1% 1,568 2,419 851
5 Premium Cattle Comprising Steers and Heifers meeting the MII Grade and Weight Specification at DAFM Export-Approved Plants
24.1% 19.9% 1,625 2,584 959
Estimated Market Shares and Concentration (Cattle Slaughtered)
Procurement of Cattle for Slaughter within 60 Miles of Slaney's Bunclody Plant
Parties' Market Shares Market Concentration
Executive Summary
PMCA Economic Consulting Page xx
The first difference is the presence of an auction market system for finished cattle for slaughter in GB, which is in general absent in Ireland, or in NI. Analysis of publicly available data from the UK Agriculture and Horticulture Development Board shows that the auction markets (which should not be confused with the ‘cattle marts’ in Ireland or NI) accounted for an appreciably large share of the cattle throughput in GB in 2014, namely 21% in England, 17% in Wales and 15% in Scotland or 19.4% overall for Great Britain. In contrast, the only route to market for cattle finishing farms in Ireland is the route from farmer to processor (through the use of cattle agents, who act on behalf of processors). The ‘residency and movements requirements’ in Ireland, which impose restrictions on cattle finishing and underpin the Quality Payment System in respect of the key premium cattle comprising steers and heifers in the State, imply that the operation of an auction market system in Ireland is not possible, which otherwise might provide an alternative route to market for cattle finishers in addition to, and possibly in competition with, the traditional, incumbent route of farmer-to-processor (via agent, acting for processor).
The second noteworthy difference in market structure between the countries (Ireland and England, for which the publicly available AHDB data permit comparison) is that small-to-medium processors account for a much larger proportion of the national beef/cattle kill in England than in Ireland. In particular, less than 9% of the total cattle throughput in Ireland was accounted for by processing plants handling between 5,000 and 50,000 head of cattle in 2015, while 85% of the total Irish throughout was handled by processors handling more than 50,000 head of cattle in that year. In contrast, the largest processors in England handling over 50,000 head of cattle accounted for about half of that country’s total cattle throughout in 2014 and the proportion accounted for by small and medium processors in the 5,000-50,000 head category was more than 43% in that year.
In other words, the largest processors slaughtering more than 50,000 head of cattle annually hold a much smaller share of total throughout in England than they do in Ireland (50% versus 85%), while the shares of small and middle ground processors are in the opposite direction (43.4% in England as opposed to 8.9% in Ireland). Put another way, the Irish market is more concentrated than the English market, even though the market size (cattle slaughtered) is around the same size in each country (c. 1.6m head of cattle slaughtered in the latest years for which official/independent data on the respective markets are available).
The implication of the two structural differences observed is that the relevant cattle procurement market may be more competitive in England than in Ireland and, as the English market is the largest market within the UK (accounting for 61% of all cattle slaughtered in 2014), this might have a bearing on cattle prices being higher in the UK compared with Ireland.
PMCA considers that the possible relationship between the structural features of the relevant markets in the countries concerned and the returns to farmers in each case merit further consideration by DG Comp.
Lamb Procurement in the State
All relevant market definitions in respect of sheep and lamb procurement in the State are found to be highly concentrated, with the HHI exceeding the value of 2,000 in each and every case. The highly concentrated nature of the relevant market in the case of sheep and lambs is driven by the three largest processors (Slaney/ICM, Kepak and Kildare Chilling Company), of which Slaney is the largest provider, with an estimated market share greater than 30% in each relevant market delineated.
Executive Summary
PMCA Economic Consulting Page xxi
Even though ABP does not operate a sheep/lamb processing facility in the State, it nevertheless has such facilities in NI (at Lurgan, Co. Armagh) and at Yetminster in England. The parties therefore overlap in the provision of sheep and lamb meat in these islands, as well as overlapping in the beef processing and rendering markets in the State. It is feared by the IFA and farmers that the proposed transaction may increase the risk of coordinated behaviour between the parties and possibly other competitors in the markets concerned, thereby reducing competition further in the relevant markets in which cattle finishing and sheep farmers are active in Ireland.
PMCA’s Assessment of Current Competition given Market Concentration and Other Key Market Characteristics
While important to the Irish economy and comprising successful indigenous companies contributing to employment in rural parts of the country, it is PMCA’s conclusion, from the evidence considered in this report, that the beef and lamb processing markets in the State are characterised by weak competition.
The markets are characterised by high barriers to entry, high switching costs and low switching by farmers of processor, price transparency and vertical integration. Price transparency might be thought of as a positive feature but in the field of competition policy or law it can facilitate coordinated behaviour and low price competition.
As a result these features, the relevant market is predictable from a competition perspective – farmers rarely, if ever, switch processor, entry on a significant scale that would challenge the leading processors has not occurred over the years and price competition is muted or absent.
While the relevant market generally tends to work in respect of providing high quality beef and lamb for consumers at home and abroad, it comes at a high cost for farmers, manifested in the fact that cattle finishing farms and sheep farms struggle to be viable, with many liable to cease operating but for the support of direct payments.
Another salient feature of the relevant market is the fact that the farmer-agent-processor approach, in which farmers tend to deal with a single processor through an agent retained by the processor, is the only route to market for farmers in the State. In the cattle procurement market in England, which is about the same size as the Irish market and also operates on the basis of a grassland beef system, there is an additional route to market involving finished cattle auctions, which accounted for over 21% of all cattle throughput in 2014 (or over 19% GB-wide when the corresponding auctions in Scotland and Wales are also factored in). Such an additional route to market is not present in NI as well as Ireland, which otherwise might serve to enhance competition. As noted earlier, the English market is also less concentrated than its Irish counterpart, with small-to-medium processors slaughtering between 5,000 and 50,000 head of cattle annually having a much greater share of all cattle throughput compared with the situation in Ireland (43.4% compared with 8.9%).
The aforementioned residency and movements requirements regarding the procurement of cattle in the State mean that it would be very difficult, if not impossible, to develop an auction market system here. The IFA and farmers consider that the QPS (Quality Payment System) is a scientific-based system for rewarding farmers fairly and properly for quality. However, for the IFA and farmers, the problem relates to the specifications the meat plants have introduced around the QPS, which include a maximum of residencies, a final residency period of 70 days, 30 months of age and more recently penalties imposed by the meat plants on carcase weight limits. The specification issues imposed by processors around the QPS are problematic in respect of competition for farmers and the IFA.
Executive Summary
PMCA Economic Consulting Page xxii
The changes experienced in the relevant market noted earlier, in which the number of cattle slaughtered has fallen and throughput has become much less fluid, have implications for capacity and in turn to the likelihood of competitors (to ABP and Slaney) reacting in the event that the proposed transaction were to lead to an SLC in the State.
As described in the main body of the report, a fundamental change took place with Irish beef export markets from about 1999/2000 to 2005/2007. Up to 2000, Ireland had substantial exports to ‘third-country’ markets beyond the UK and the EU of around 250,000-300,000 tonnes per annum. From 2001 onwards the amount decreased to approximately 50,000-80,000 tonnes per year and then fell off to minimal volumes roughly in the range 5,000-6,000 tonnes in 2007/2008. On the other hand, exports to the UK increased from around 95,000 tonnes in 1999 to about 260,000-270,000 tonnes in 2004/2005 and exports to EU markets grew to over 200,000 tonnes from 2006 onwards. These changes were precipitated by the second BSE crisis across Europe in the early 2000s and foot-and-mouth disease outbreak in the UK in 2001.
As a result of these changes to the composition of Ireland’s beef exports, servicing the UK and EU retail and food service outlets represents a very different challenge in terms of plant capacity utilisation than supplying large volumes of commodity boxed beef to international markets with the aid of EU export refunds, which characterised operations at the turn of the century (which in turn led to the Beef Industry Development Society or BIDS scheme, which was proposed by the beef processors in Ireland in the late 1990s as a means of addressing the then spare capacity in the industry; however, it was proposed that the scheme would be operated by mutually agreement among processors to coordinate the removal of spare capacity from the market, which was ultimately found to be at variance with European competition law and was eventually withdrawn).
The relevant beef processing market today is very different compared with at the time of the proposed BIDS scheme, which was a concerted attempt by processors to reduce capacity industry-wide.
PMCA considers that the fundamental change in regard to capacity in the relevant market for beef processing in the State is likely to impact on the ability of other (competitor) processors to exploit their capacities should they be needed in the event of a possible SLC (substantial lessening of competition) arising from the proposed ABP/Slaney deal. In particular, it is felt that other processors may not have such spare capacity or may not be in a position to respond in a likely, timely and sufficient way to a threat of reduced or softened competition following the proposed JV and that, in view of this, DG Comp (possibly in conjunction with the CCPC in Ireland and the CMA in the UK) should probe this aspect of the market as part of their investigation of the proposed transaction.
The Competitive Effects of the Proposed Transaction
The proposed transaction risks giving ABP insights into one of its main competitors (Slaney/ICM), in turn raising concerns over both unilateral and coordinated effects in the State and further afield. The main worries for the cattle procurement market are in the State, where the parties overlap and compete, within which the south Leinster area, in which ABP and Slaney are (along with Dawn) the leading processors currently, in advance of the proposed transaction. In lamb processing, the proposed transaction could potentially affect competition in the UK and the EU – Slaney/ICM is the leading processor of lamb and sheep meat in the State, which is exported to the UK and the EU, and ABP is active in sheep/lamb processing in NI and GB, so there is overlap too in the UK.

Executive Summary
PMCA Economic Consulting Page xxiii
In regard to unilateral effects, the proposed transaction risks the parties themselves reducing competition in the cattle procurement market in the State or regionally/locally in the south Leinster area, where they are identified in this report as being among the leading providers in each and every relevant market defined (along with Dawn, which also happens to be the only other renderer that is also active in meat processing in the State). Such reduced competition could take the form of lower cattle or lamb/sheep prices to farmers dealing with the parties and/or higher retail prices for Irish beef or lamb for consumers in Ireland and the UK, and possibly continental Europe, owing to the fact that the parties to the proposed transaction have links/agreements with major grocery multiples in Ireland and the UK.
The concern over coordinated effects is that there are already possibilities for coordinated behaviour in the relevant beef market, in principle, and that the proposed transaction would make it more likely for coordinated behaviour to obtain in practice, giving rise to an SLC in the State. The opportunities for coordinated behaviour currently include the price transparency in the relevant market and the multi-market contact between the parties, including the rendering market in addition to meat processing. Competitors also meet at MII meetings, and the BIDS case, which originated in the 1990s and ran well into the next decade, represented a previous attempt to coordinate behaviour across the beef processing industry in Ireland. It was eventually withdrawn on competition grounds.
With these in mind, and given the high barriers to entry, low switching and the stability of the competitive environment characterising the relevant market, the proposed transaction could make it more likely that the parties and other firms would soften or reduce competition in the cattle procurement market nationally or locally in regard to the south Leinster area.
Conclusions of the Report
The overall conclusion of this report is that the relevant market affected by the proposed transaction is characterised by weak competition and that the proposed deal poses a risk of an SLC in the State or an SIEC at EU level.
The conclusion of weak competition currently in the relevant market is based on the preponderance of market characteristics giving rise to low competition common to beef and lamb slaughtering/processing in the State, including significant barriers to entry, which arise from substantial regulatory barriers to entry and other, structural features of the market reflecting the strength of the leading providers and their activities in vertical markets in respect of meat processing, including rendering and their links with leading grocery retailers in Ireland and the UK, the single biggest overseas destination for Irish beef and thus a key export market.
Taken together, the salient features of the relevant market make for a predictable or muted competitive environment. As outlined earlier, the IFA and farmers consider that the QPS is a scientific-based system for rewarding farmers fairly and properly for quality. However, the problem relates to the specifications the meat plants have introduced around the QPS, which include a maximum of residencies, a final residency period of 70 days, 30 months of age and more recently penalties imposed by the meat plants on carcase weight limits. The specification issues imposed by processors around the QPS are problematic in respect of competition for farmers and the IFA.
The conclusion that the proposed deal would lead to an SLC in the State is based on the fact that the proposal would basically mean that two leading providers in meat processing in Ireland would have a material link and given their existing links in beef and lamb, and in rendering, in the State, there is a risk that it would increase coordinated effects taking place in the relevant markets, adversely affecting producers/farmers and consumers in the process.
Executive Summary
PMCA Economic Consulting Page xxiv
Suggestions for Further Investigation by the Relevant Competition Authorities
Arising from the work conducted in the course of this report, PMCA suggests that additional examination of the relevant market, that would be helpful to informing on the competition effects of the proposed transaction, be conducted by DG Comp (possibly also involving the Irish CCPC and the UK CMA). The reader is referred to Section 5 at the end of the main body of the report, which contains suggestions for further examination in respect of the relevant market’s capacities, vertical integration and features that might serve to underpin processors’ apparent bargaining advantages over producers in Ireland. These suggestions have been informed by gaps in information encountered by PMCA, and the IFA, during the preparation of this report.

Acknowledgements and Disclaimer
PMCA Economic Consulting Page xxv
Acknowledgements and Disclaimer
Acknowledgements
PMCA Economic Consulting would like to thank staff at the IFA for their help and support in preparing this report.
Disclaimer
This report is the sole responsibility of PMCA Economic Consulting. By virtue of preparing the report or otherwise in connection with this study, PMCA Economic Consulting will not assume any responsibility or have any liability to any third party.
Nothing in this report constitutes or is meant to constitute any legal advice or opinion on competition law or any other aspect of Irish or European law.
Nothing in this report should be construed in any way as giving any indication or suggestion that any breach of competition law or any other aspect of Irish or European law has occurred or is occurring.
About PMCA Economic Consulting
PMCA Economic Consulting Page xxvi
About PMCA Economic Consulting PMCA Economic Consulting was founded in 2010 and is active in all areas of professional economic consulting, including competition (mergers, dominance, horizontal and vertical agreements, State aids etc.), regulation, litigation support, economic impact studies, cost-benefit analysis, programme evaluations, feasibility reports and economic development strategy formulations.
Dr. Pat McCloughan of PMCA has been consistently named among the world’s leading competition economists by Law Business Research/Global Competition Review for the past decade, in recognition of the esteem in which he is held by specialist competition lawyers and other users of PMCA’s professional services. He is also a member of the International Competition Network and has contributed to developments in thinking and practical approaches by the ICN in regard to mergers and other aspects of competition policy, where the members of the ICN include competition authorities with the aim of sharing best practices.
Dr. McCloughan has published in peer-reviewed economics journals and among his original contributions to the field of economics are novel techniques for estimating the Gini coefficient of inequality and the concentration ratio for the case where a researcher’s information is limited to pre-grouped data (as often encountered in official or census data sources) (the Abounoori-McCloughan estimator for the Gini coefficient and the McCloughan-Abounoori estimator for the concentration ratio – the former technique is applied subsequently in this report, when comparing the beef processor size distributions in Ireland and England).
As well as private sector enterprises and representative organisations, clients of PMCA also include central, regional and local government, other public sector bodies, such as enterprise and tourism development agencies, higher education institutions and health organisations. Organisations in the community and voluntary sector are also among the clients served by PMCA.
PMCA works on projects in Ireland, Northern Ireland, Great Britain and Europe. All economic sectors are covered by the firm.
For more information about PMCA Economic Consulting, please contact:
Dr. Pat McCloughan Managing Director PMCA Economic Consulting 30 Pembroke Street Upper Dublin 2 Ireland Tel: +353 1 234 2507 Fax: +353 1 234 2000 Email: [email protected] Web: www.pmca.ie.

Section 1 Introduction and Background
PMCA Economic Consulting Page 1
1 Introduction and Background
1.1 Purpose of the Report This report is prepared for the Irish Farmers’ Association (IFA) by Dr. Pat McCloughan, Managing Director of PMCA Economic Consulting (PMCA). It concerns the proposed transaction in which ABP Food Group (ABP)1 would acquire 50% of Slaney Foods (Slaney), with implications for competition in the meat processing sector in Ireland, specifically beef and lamb/sheep processing in the State. The report is intended to help inform the Directorate-General (DG) for Competition of the European Commission (DG Comp) to which the proposed transaction is being notified, and the study is also designed to help inform the Irish Competition and Consumer Protection Commission (CCPC), which may have an interest in the proposal, as too might an interest be expressed by the Competition and Markets Authority (CMA) in the UK, owing to the fact the UK is the largest export market (at country level) for Irish beef and that ABP has extensive beef and lamb/sheep slaughtering and processing facilities in that jurisdiction. However the principal focus of this report concerns the activities of the parties, and other processors, in the State.
The overall approach is to define the relevant markets affected by the proposed transaction in Ireland and assess the current, pre-transaction level of competition and then come to a view about how, if at all, the proposed deal would affect competition, which means addressing the question of whether or not the proposal would lead to a substantial lessening of competition (SLC) in the State – the statutory test of merger control in Ireland (and in the UK). The SLC test is broadly the same as its counterpart in the EU, namely the significant impediment to effective competition (SIEC) test applied by DG Comp.
1.2 The Parties and the Proposed Transaction
1.2.1 ABP
ABP is involved in meat processing and other activities in Ireland, the UK and continental Europe. The company comprises four divisions – ABP Ireland, ABP UK, Olleco and ABP Pet Foods.
According to its website, ABP Ireland “specialises in beef processing, de-boning and retail packing. With a long and proud tradition of working with farmers and customers, we operate highly efficient factories supplying quality beef to European and worldwide retail markets”.2 In regard to ABP UK, the website states that “A leading supplier of fresh and frozen meat and meat-free products, ABP UK continues to drive innovation in every aspect of our business in the United Kingdom. This spans collaborative partnerships with our customer base, to industry leading practices in processing and product development”.3 Olleco is described as “the largest collector of used cooking oil in the UK and Ireland, helping many of the biggest restaurants and catering groups maximise the environmentally sustainable treatment of waste food and oil products”.4 ABP Pet Foods is outlined as “one of Europe’s leading manufacturers of private label pet food ... and are the supplier of choice for leading retailers throughout Europe”.5
1 ABP is short for Anglo Beef Processors. 2 https://abpfoodgroup.com/companies. 3 Ibid. 4 Ibid. 5 Ibid.
Section 1 Introduction and Background
PMCA Economic Consulting Page 2
In the activities in which the parties overlap – beef and lamb processing – ABP operates beef processing facilities in the State, Northern Ireland (NI), Great Britain (GB) and Poland.6
ABP is the largest cattle slaughterer and beef processor in the State. It has six (6) slaughtering and/or processing facilities in the country, at Bandon (County Cork), Cahir (Co. Tipperary), Clones (Co. Monaghan), Nenagh (Co. Tipperary), Rathkeale (Co. Limerick) and at Ferry Bank in the environs of Waterford City. It is estimated that ABP accounts for over one-fifth of all types and grades of cattle slaughtered in the State, within which it has even larger market shares of prime cattle (steers, heifers and young bulls), premium cattle (steers and heifers) and premium cattle meeting the Meat Industry Ireland (MII) grade and weight requirements relating to the export of Irish beef to the UK and the EU.7
In lamb/sheep, ABP has a processing plant in Lurgan (NI) and a large processing facility in Yetminster in Dorset in the south of England.8
1.2.2 Slaney
Slaney was established by the Allen family in Co. Wexford in 1970 and is today active in the same main activities as ABP, namely beef and lamb processing.
The parties are also active in rendering in the State, which occurs downstream of cattle and lamb slaughtering and processing, and only one other meat processor (Dawn) is also active in rendering, whereas there are seventeen (17) different beef processing firms and eleven (11) different lamb/sheep processing firms in the country (including the parties). PMCA understands that ABP, Slaney and Dawn render their own animal remains as well as those of some or all of their competitors in the upstream beef and lamb processing markets (some might also be rendered by other renderers, besides the parties and Dawn). Rendering is considered in more detail subsequently in the report.
Slaney is jointly owned (50:50) by the Allen family and the Linden Food Group (Linden), a NI-based beef and lamb processing company majority-owned by the Co. Armagh-based farmers’ co-operative, Fane Valley Co-Op. Linden’s beef and lamb processing operations are in Dungannon (NI) and Newcastle (GB).
6 By reference to the newspaper article on the proposed transaction entitled ‘A Growing Empire’, Irish Farmers
Journal (12 December 2015). The article is reproduced at the end of this report (Box A1, p. 96). As illustrated in the map contained in that article, in addition to its beef processing facilities in the State, ABP also has beef processing plants in Lurgan, Co. Armagh and Newry, Co. Down in NI. In GB, the same article shows ABP as having beef processing plants in Perth (Scotland) and in England at York, Blackburn, Ellsemere, Shrewsbury, Somerset, Sturminister and Guilford. ABP also has two (2) beef processing plants in Poland.
7 In regard to the different types of cattle associated with the beef supply chain, a bull is a non-castrated adult male bovine, a young bull is generally less than 24 months old, a steer is a young castrated bull (bullock is another term for steer), a heifer is a young female bovine that has not had a calf and a cow is an adult female bovine (in addition, calves (male or female) are bovines less than one year old) (culls cows are adult female that are leaving the herd at the end of their lifespan). Prime cattle for beef production comprise steers, heifers and young bulls, within which premium cattle consist of steers and heifers. Prime and premium cattle are non-adult bovines. The MII specifications put particular requirements on the age, fat score and other objective features of steers and heifers (and young bulls) that are outlined subsequently in the report, and which help to inform the relevant market definition in respect of the proposed transaction. Breeds of bovines are manifold and include Friesian, Angus and Hereford, the latter two being niche breeds associated with high quality beef and which are apparently becoming more popular at retail level in the State. MII is the representative organisation for beef and lamb processors in Ireland. The parties are members of MII.
8 Supra footnote 6. In regard to sheep types, lambs are juvenile sheep (male or female) while ewes and rams are adult female and male sheep respectively. A hogget is a sheep between 1 and 2 years old. Mutton is adult sheep meat. Lamb is the preferred form of sheep meat in Ireland and the UK, and other western countries.
Section 1 Introduction and Background
PMCA Economic Consulting Page 3
Slaney’s beef operations in the State are based at Bunclody, Co. Wexford, and its lamb operations at Navan, Co. Meath, and Camolin, Co. Wexford, which operate under Irish Country Meats (ICM), which Slaney acquired in 2000. These operations in beef and lamb under Slaney/ICM are in addition to Linden’s beef and lamb facilities in NI and England.
After the multi-plant cattle slaughterers/beef processors – namely ABP, the largest with 6 plants and an estimated 21% of the national beef kill in the State, Dawn with 4 plants and an estimated 18% of the kill, Kepak with 14% and 4 plants, and Liffey with 3 plants and an estimated 8% of the national beef kill – Slaney is the next (i.e. the fifth) largest beef processor in the State, with an estimated 5% of the national beef kill and having the single largest beef processing facility in the country, accounting for the slaughtering of an estimated 88,000+ cattle in 2015, compared with an estimated average plant throughput of a little over 52,000 cattle slaughtered in that year, among 30 different plants over 17 processing firms. Within the overall cattle market, PMCA considers that there are justifiable narrower product markets in the State and within the State. For instance, it is estimated subsequently in the report that Slaney had a market share of all prime cattle slaughtered in the State of over 6%, more than 7% of all premium cattle, almost 8% of premium cattle meeting the MII grade and greater than 8% of premium cattle satisfying both the MII grade and the weight specification for export. PMCA also considers that a narrower geographic market within the State may be drawn for the purposes of assessing the competitive effects of the proposed transaction and the area concerned includes the south Leinster area (including parts of Munster as well). In this market delineation, ABP, Dawn and Slaney are the largest processing firms in terms of their estimated market shares and these firms are also the only meat processors that are also active in rendering downstream of meat processing in the State (in addition to other renderers not active in meat processing).9
In sheep/lamb processing, Slaney is the largest firm in the State, with an estimated market share of over 30% and close to 40% depending on how one defines the relevant market. The details are outlined subsequently in the report.
1.2.3 The Proposed Transaction
The proposed transaction in which ABP would acquire 50% of Slaney would involve ABP purchasing the Allen 50% share of Slaney. Linden would retain the other 50% stake in Slaney. The deal would see the creation of a new joint venture (JV) company that would operate independently of ABP and Linden (which is majority-owned by Fane Valley). The joint statement of the parties released on 9 March 2016 states that the rationale for the JV is based on the need to evolve in the beef market, which the parties say is international in extent. Mr. Trevor Lockhart, Chairman of Linden Foods, said that:10
“Structural change within Irish beef processing is a fact of life in 2016 and with the beef sector becoming increasingly globalized, further strategic developments of this nature within the industry are inevitable. After carefully considering our options, we are delighted that we are partnering with ABP following the decision of our current joint venture partner to exit the business. The combined expertise and resources of Slaney and ABP will grow the businesses, deliver significant benefits and contribute positively to the sustainability of our primary production base.”
9 PMCA also notes the decision of the UK CMA decision (6 January 2016) regarding the completed acquisition by
Linergy Limited of Ulster Farm By-Products Limited in rendering in NI (according to Table 3.1, p. 24 of the CMA’s report, Linden and Fane Valley had respective shares of 12% and 27.5% in Linergy (pre-merger).
10 https://abpfoodgroup.com/news/2016-03-09-statement-on-fane-valley-co-op-and-abp-food-group-5050-proposed-jv.
Section 1 Introduction and Background
PMCA Economic Consulting Page 4
ABP Chief Executive Mr. Paul Finnerty added in the joint statement that:
“There has been considerable speculation about this joint venture; however consolidation within the industry is absolutely necessary in order for our sector to remain competitive. This consolidation trend is the result of an increasingly challenging international background where we compete against global players, many of whom have processing capacity multiple times that of the entire Irish industry. We also should not underestimate the looming risks of Mercosur, TTIP and Brexit – any of which will further accelerate a more challenging market environment.”
Mr. Finnerty also said in the joint statement that:
“The long term outlook is positive as global consumption of beef is expected to increase in the coming years. However, it is important that markets such as China and the US are fully open so that we can take advantage of this demand. Similar to other Irish food sectors, we also need to build strong capabilities that can compete effectively on the international stage and this transaction is a step in the right direction.”
The notes to editor at the end of the joint statement on the proposed transaction issued by ABP and Fane Valley on 9 March 2016 include the following information on the relevant market concerned (reproduced here, including the parties’ emboldened text):
• “Cattle Prices”; o “In the period 2010 to 2015 Irish Cattle prices (Steers and Heifers) have increased by
37% (Bord Bia).” • “Sectoral Share”;
o “In 2015 ABP and Slaney processed 27% (ABP 21% and Slaney 6%) of the annual cattle kill in Ireland”
o “ABP does not process lambs or sheep in ROI and as a result the share for lamb will not change. We process a very small number of lamb and sheep in NI.”
o “The Slaney Proteins facility in Bunclody is a small on-site facility and only renders some internal Category 3 materials. There are no significant third party suppliers to Slaney Proteins. The joint venture will have no impact on the rendering share.”
• “International Competitors”; o “One international company, JBS, processes 16 million head of cattle annually and is
already present in NI through Moy Park.”11 • “Looming Threats to the Industry”;
o “Mercosur” o “TTIP” o “Brexit”
• “ABP Food Group”; o “ABP Food Group has invested over €100 million in its Irish business in the past 3 years.
This includes a €50 million investment in its Cahir facilities.” o “As independently evaluated by Oxford Economics and KPMG, ABP’s investment in Cahir
will be worth €1billion to the local economy in Tipperary and surrounding counties over the next 5 years.”
11 The notes to editor at the end of the joint statement on the proposed transaction by ABP and Fane Valley also
mention the following international competitors as well as “JBS (Brazil)”: “Marfrig (Brazil)”; “Tyson Foods (USA)”; “Cargill Foods (USA)”; “Bigard (France)”; and “Vion (Germany)”.
Section 1 Introduction and Background
PMCA Economic Consulting Page 5
o “ABP has sales hubs in Asia, America and across Europe and this will enhance the opportunity for beef and lamb sales from Slaney Foods”.
o “ABP employs in excess of 9,000 colleagues including 3,000 in Ireland and supports thousands of other jobs indirectly.”
In view of the joint statement, PMCA considers that it will be challenging to ensure that the proposed JV is maintained as independent of the parties in practice, owing to the opportunity that it would provide for Slaney to tap into ABP’s international sales network (where the penultimate sub-bullet quoted just above states that “ABP has sales hubs in Asia, America and across Europe (PMCA underlined) and this will enhance the opportunity for beef and lamb sales from Slaney Foods”).12
As a result of the proposed transaction, two currently independent competitors in the marketplace – ABP and Slaney – would have a material link (in the form of the proposed JV), which in turn risks giving rise to a weakening of competition in the market. The IFA and farmers, who provide the critical primary inputs into the beef and lamb supply chains in the State, are very concerned about the proposed transaction with regard to a reduction in competition which they believe would depress cattle and sheep/lamb prices, and in turn reduce the market incomes of cattle farmers and sheep farmers, thereby threatening the beef and lamb supply chains in the State (as shown subsequently in the report, the incomes of cattle finishing and sheep farmers are among the lowest of all farmers in the State and are considerably below average industrial earnings, the conventional barometer of earnings in Ireland; without direct payments from the EU, cattle finishing and sheep farmers would struggle to maintain viable farms).
Particular information stated on the relevant market in the joint statement by ABP and Fane Valley on the proposed JV is also worthy of comment here.
First, in regard to the statement that “In 2015 ABP and Slaney processed 27% (ABP 21% and Slaney 6%) of the annual cattle kill in Ireland”, these market share estimates broadly correspond to the estimates presented subsequently in this report, specifically the case of the national beef kill in which the competitor set includes the Department of Agriculture, Food and the Marine (DAFM) export-approved processing plants in the State and excludes the much smaller abattoirs coming under the remit of local authorities in Ireland. We also show the situations in which the LA plants are included and narrower markets pertaining to prime and premium cattle in the State and in narrower geographic markets within the State (namely south Leinster) (where the competitor set includes only the DAFM export-approved processors, which together account for the vast majority (94% in 2015) of the national cattle/beef kill in the State).
Secondly, in respect of the statement that “In the period 2010 to 2015 Irish Cattle prices (Steers and Heifers) have increased by 37% (Bord Bia)” (parties bold parts reproduced here), the price increase of 37% is correct but of equal or even greater relevance is the trend in steers and heifers prices in Ireland relative to those in the UK, where the analysis presented subsequently in this report illustrates a growing gap between Irish and UK prices in favour of the UK during 2010-2015. The comparison with the UK is directly relevant to the Irish market because it represents the closest market to that in the State in respect of cattle slaughtering for beef supply as well as being Ireland’s single largest export destination for beef, accounting for over half of all such exports.
12 This feature of the proposed JV has also been observed and commented upon by the farming press in Ireland:
see, for example, ‘A Disputed Union: The proposed joint venture by ABP and Linden to run Slaney has met widespread opposition as it awaits referral for ruling’, Irish Farmers Journal (27 February 2016).
Section 1 Introduction and Background
PMCA Economic Consulting Page 6
Thirdly, the parties’ joint press statement of 9 March 2016 also mentions rendering, and specifically Slaney’s rendering activities in Bunclody, Co. Wexford. PMCA considers that rendering merits closer examination owing to the fact that there are only three meat processors active in the activity and that they handle the rendering needs of their processor competitors as well as their own. Seen in this way, rendering is potentially significant as a form of multi-market contact between the parties (ABP and Slaney) and Dawn, the second largest beef processor in the State.
1.3 The IFA’s Position on the Proposed Transaction
1.3.1 The Importance of Competition for Irish Farmers
With over 75,000 members and as one of the largest representative organisations in the State, the IFA and farmers have a strong interest in ensuring competition in the relevant markets affected by the proposed transaction. Competition is better for consumers and also better for farmers. For consumers downstream of the markets that would be affected by the proposed transaction, competition means lower retail prices, better choice and/or higher quality. For farmers providing the critical primary inputs into the beef and lamb supply chains, competition promotes sustainability of the supply chains by giving farmers fair prices and the prospect of earning returns above the cost of production consistent with continuing in business. Market power towards processors risks adversely affecting the supply chain and such market power may arise through processors having stronger bargaining power relative to individual farmers or through reduced competition among processors (given the objective features of the relevant market such as low switching and high barriers to entry, outlined subsequently in the report). In either case, an ongoing worry for beef and sheep farmers around the country concerns the prices received from processors for their critically important role in the supply chains. This concern represents the basis of the IFA’s position in respect of the proposed transaction, where it is feared that the proposal will result in an SLC in the relevant market, in turn jeopardising the livelihoods of farmers and in the process threatening the sustainability of the respective supply chains in the country.
The meat supply chains also include rendering as well as the slaughtering and processing of beef and lamb meat. Rendering entails the process of converting less valuable animal tissue into other, value-added materials and typically occurs in or in close proximity to animal slaughterhouses. The outputs from rendering include purified fats, like lard and tallow, protein materials and bio-fuels. Both of the parties to the proposed transaction, ABP and Slaney, are active in rendering and, along with Dawn, another beef processing firm (the second largest in Ireland), are the only renderers that are also active in beef and/or lamb processing in the State. Other renderers are also active (non-meat processors).
The vertically integrated nature of meat processing in the State is also manifest in the fact that ABP and Slaney also have close relationships with retailers as well as being active in rendering. ABP is the main supplier from Ireland to retailers into Ireland’s largest export market, the UK. ABP is the Irish processor of choice to the 3 major retail groups in the UK (Tesco, Sainsbury and Asda). In addition, ABP is the main processor supplying Tesco in Ireland and supplies Angus beef for all of Tesco’s counter sales. The firm also supplies Aldi and is the supplier of choice to Pallas Foods, the largest food service/restaurant supplier in the State. Slaney is the supplier of choice for Hereford prime beef to Lidl in Ireland.
1.3.2 The IFA’s Concerns with the Proposed Transaction
The IFA is concerned about the possibility of ABP acquiring a 50% stake in Slaney through the proposed purchase of the Allen 50% share in Slaney. In the IFA’s view, there are two ways of looking at the proposed transaction – one as effectively a merger situation between the two firms and the second as a competitor acquiring a significant stake in another competitor in the same relevant market(s).

Section 1 Introduction and Background
PMCA Economic Consulting Page 7
The IFA’s concern with the proposed transaction is that it risks weakening competition in the Irish beef and lamb/sheep processing markets even further, in a situation where competition is believed to be already weak and from which cattle and sheep farmers are suffering through low prices and low levels of income.
In this report, PMCA sets out to examine, independently, the concerns of the IFA, namely its claim that competition is already weak in the relevant market and that the proposed transaction risks weakening competition further, including the possibility of giving rise to coordinated effects among processors.
DG Comp in Brussels, and the CCPC in Ireland, will already be aware of (attempted) coordinated behaviour in the relevant market in the past, in the form of the proposed Beef Industry Development Scheme (BIDS), which ultimately never came to pass due to competition concerns highlighted by the then Competition Authority (in Ireland) and by the highest court in the EU.13 While the BIDS idea may have been naïve (on competition grounds) on the part of its original proponents, it was promoted seriously by the industry and the Competition Authority’s objections to the proposal were strongly challenged by the industry over a number of years in litigation, before they were eventually withdrawn as recently as 2011. The BIDS case is considered in more detail in the next section of the report.
1.4 Other Relevant Matters for the IFA and Farmers
1.4.1 Low Farm Incomes
Reflecting the concerns over competition in the relevant market outlined above, farm incomes in the livestock and lamb sectors of Irish farming have been comparably low for many years. The IFA is concerned that the proposed transaction would exacerbate the trend through the feared further weakening of competition. Farmer incomes and the possibility that the proposed transaction would reduce competition, as feared by the IFA and farmers, are examined subsequently in Section 3.
1.4.2 Factory Prices for Cattle – Widening Differential between Ireland and UK Prices
According to the IFA, illustration of the lack of price competition in the Irish market for beef particularly and for sheep at certain times of the year are the differentials in cattle and sheep prices paid by processors between Ireland and the country’s main export market, the UK. For instance, the average differential between Irish and UK cattle prices in 2015 was 87 cent per kilogram (kg) (deadweight) compared to 27 c/kg DW for the 10-year period 2004-2013 (see Figure 1.1 overleaf, which has been provided by the IFA using independent Bord Bia data and shows the price series for the representative category of cattle in Ireland and the UK, namely steers R3 (a particular grade of steers cattle outlined in further detail in the next section) during 2003-2016). The price differentials between Ireland and the UK are examined further in Section 3, where we also compare the growth of the price gap with the corresponding appreciation of sterling against the euro.
1.4.3 Seasonal Effects in Irish Cattle Prices
Another feature of cattle prices is the pattern in which the price paid by processors to farmers shows a tendency to fall in the latter part of the year (autumn), when the weather begins to change and farmers find it more difficult to sell their cattle. This pattern is investigated subsequently in the report by reference to analysis of independent Bord Bia cattle price data conducted by PMCA, and the analysis is extended to see if the seasonal effect might also be present in the UK, Ireland’s largest export market.
13 The former Competition Authority existed up to 31 October 2014, when it was merged with the former
National Consumer Agency to form the current CCPC.
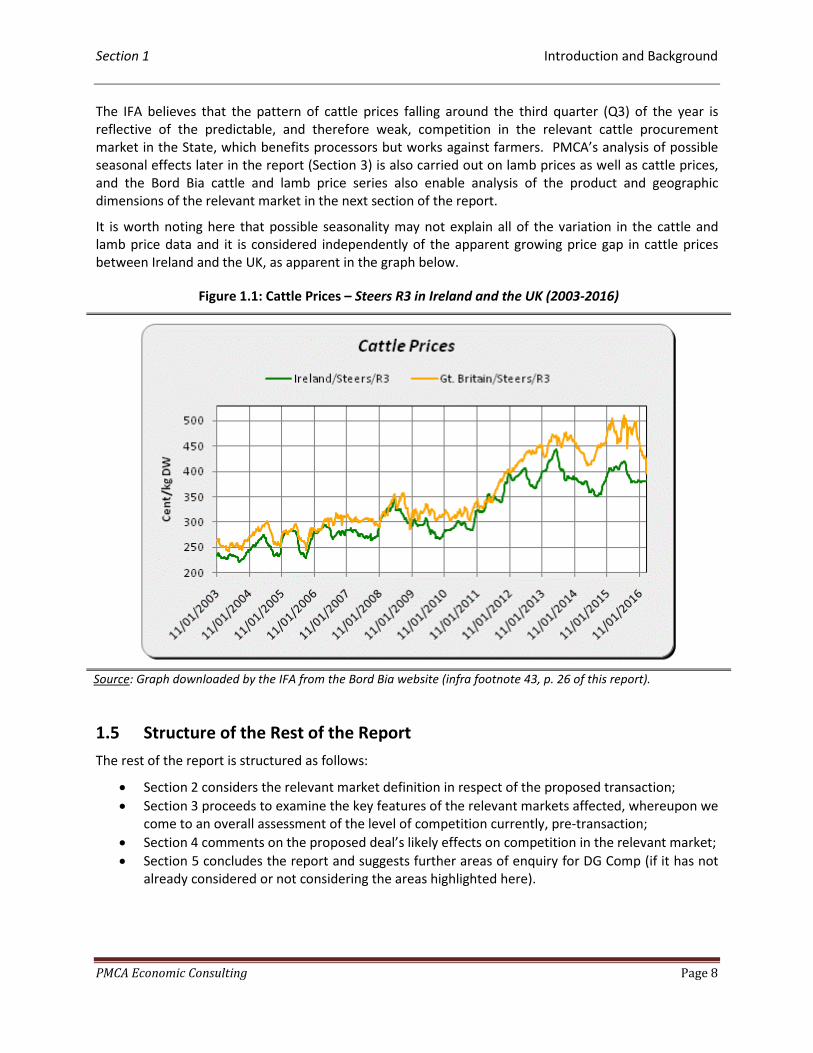
Section 1 Introduction and Background
PMCA Economic Consulting Page 8
The IFA believes that the pattern of cattle prices falling around the third quarter (Q3) of the year is reflective of the predictable, and therefore weak, competition in the relevant cattle procurement market in the State, which benefits processors but works against farmers. PMCA’s analysis of possible seasonal effects later in the report (Section 3) is also carried out on lamb prices as well as cattle prices, and the Bord Bia cattle and lamb price series also enable analysis of the product and geographic dimensions of the relevant market in the next section of the report.
It is worth noting here that possible seasonality may not explain all of the variation in the cattle and lamb price data and it is considered independently of the apparent growing price gap in cattle prices between Ireland and the UK, as apparent in the graph below.
Figure 1.1: Cattle Prices – Steers R3 in Ireland and the UK (2003-2016)
Source: Graph downloaded by the IFA from the Bord Bia website (infra footnote 43, p. 26 of this report).
1.5 Structure of the Rest of the Report The rest of the report is structured as follows:
• Section 2 considers the relevant market definition in respect of the proposed transaction; • Section 3 proceeds to examine the key features of the relevant markets affected, whereupon we
come to an overall assessment of the level of competition currently, pre-transaction; • Section 4 comments on the proposed deal’s likely effects on competition in the relevant market; • Section 5 concludes the report and suggests further areas of enquiry for DG Comp (if it has not
already considered or not considering the areas highlighted here).
Section 2 Relevant Market Definition
PMCA Economic Consulting Page 9
2 Relevant Market Definition
2.1 Introduction This section considers the definition of the relevant market in respect of the proposed transaction. The aim is to help inform DG Comp about how the meat processing industry in the State works in practice and it is suggested that both narrow and wide product and geographic market definitions are relevant in the instant case. The Irish CCPC already has some knowledge and understanding of the relevant market under consideration here, through previous merger determinations, and we begin the section with a detailed review of the Dawn/Galtee determination in 2003. We then look at the BIDS case in Ireland, which was a past attempt at coordinated behaviour in the relevant market (beef processing) in the State and is therefore relevant to the subsequent assessment of possible coordinated effects from the proposed transaction in Section 4.
2.2 Previous Relevant Determinations and Cases in Ireland
2.2.1 Dawn/Galtee
In Dawn/Galtee (2003), the then Competition Authority (which was merged with the former National Consumer Agency to form the CCPC in 2014) defined two relevant markets in respect of beef processing in the State, namely (1) the procurement of cattle for slaughter (upstream market) and (2) the sale of boneless beef (downstream market), including the retail sale of boneless beef in the State and the export of Irish beef abroad.14
In its assessment of the relevant market definition, the Competition Authority observed that the parties overlapped in Co. Cork, where Galtee operated a slaughtering and de-boning plant in Charleville, in the north of the county, and the acquirer Dawn operated a slaughtering and de-boning plant in Midleton, in the south of the county, about 40 miles from the Galtee plant. A map produced by the Competition Authority at the end of its merger determination (at Appendix 1, p. 17 of the merger determination), illustrates the location of the Charleville (Galtee) and Midleton (Dawn) plants and other beef processing plants in the vicinity, based on concentric circles with radii of 30 and 60 miles from the target’s plant at Charleville. Within the 30 mile radius of the Galtee plant at Charleville, the Competition Authority’s map shows that there were three other plants – ABP Rathkeale (Co. Limerick), Glynns (Patrickswell, Co. Limerick) and Kepak (Watergrasshill, Co. Cork); between the 30 and 60 miles radii were three further ABP plants (at Nenagh and Cahir, both in Co. Tipperary, and Bandon, Co. Cork) plus another meat plant operated by Fair Oaks Foods (Clonmel, Co. Tipperary) as well as the Dawn plant at Midleton. Since the Competition Authority’s determination in 2003, the Glynns and Fair Oaks beef plants have ceased operating.
14 ‘The proposed acquisition of Galtee Meats (Charleville) Ltd by Dawn Meats Limited’, Competition Authority
Merger Determination M/03/029p2. The merger control provisions of the current competition legislation in Ireland came into effect at the beginning of 2003 and thus Dawn/Galtee was among the first/early merger determinations to apply the SLC test. Other merger determinations relating to the instant case include (but are not necessarily limited to): Kepak/McCarren (2013) (the supply of uncooked pork ribs in the State) (M/13/026); and IFP/C&D Foods (2011) (which observes that “ABP is the Irish meat division of the IFP group” (paragraph 4) and that “IFP accounts for approximately [20-30]% of the beef processing sector in the State” (paragraph 13) (M/11/015)). In the latter determination, the proposed transaction involved IFP/ABP moving from 50:50 to sole control of C&D Foods (pet food in the State).
Section 2 Relevant Market Definition
PMCA Economic Consulting Page 10
The Competition Authority took a relatively broad view of the product market for the procurement of cattle for beef processing in the State but at the same time added the possibility of narrower product markets also being relevant for competition analysis of the beef processing market in the State:15
“The relevant product market can be defined as the procurement of cattle for slaughter. This does not preclude analysis of market segments for different types and ages of cattle, and possibly for each grade therein.”16
In regard to the geographic market for the procurement of cattle, the Competition Authority noted the local nature of the market:17
“At least 90% of an export-approved processor’s supply of cattle comes from within a 60-mile radius of the plant; and approximately 60% comes from within a 30-mile radius. Beef processing plants employ agents to source cattle within a certain area, supplemented by a procurement team which also buys direct from farmers who seek price quotes. Cattle are transported to the plant by the farmers themselves or by the agents (or hauliers employed by agents/farmers), not by the plants. This suggests that the market or catchment area of a particular processing plant may be local in nature.”
Furthermore, in the next two paragraphs of the Competition Authority’s determination, it was stated that:18
“Market enquiries indicated that farmers tend to sell their cattle to nearby plants because the prices offered do not differ significantly from plant to plant or area to area. Thus farmers choose a particular set of plants to deal with on an on-going basis, taking into consideration the convenience of the plant’s location and the longer-term relationship.”
“Farmers negotiate prices with a number of plants for each sale. Market enquiries indicated that a 3% differential in price would not be enough to induce farmers to seek a better price from a plant they don’t normally deal with, but that a 5% differential would cause them to look elsewhere. The bulk of transport costs for cattle relate to the loading and unloading of the cattle; according to market enquiries, 5% extra per kilo would more than compensate for the additional distance.”
The first of these paragraphs suggests that variation in prices paid by factories to farmers is low and this in turn suggests that switching costs and/or the extent of switching by farmers to competing plants is low, where the Competition Authority’s merger determination in Dawn/Galtee also mentions the “longer-term relationship” between plants and farmers. As shown subsequently in this report, variation in cattle prices paid by factories to farmers remains low today and the extent to which farmers switch processor also remains low, suggesting weak competition in the relevant market.
The second paragraph quoted from the Competition Authority’s merger determination above indicates the extent of price variation (3%) above which farmers would tend to consider switching to alternative processors but the next paragraph in the Competition Authority’s determination states that:19
15 Ibid., paragraph 2.9 (p. 5). 16 The grading system is outlined further in Sub-Section 2.3.3 and acts to form the basis of the definitions of the
narrower relevant markets as well as considering the market for all cattle for slaughter in the State. 17 Ibid., paragraph 2.10 (pp. 5-6). 18 Ibid., paragraphs 2.11 and 2.12 (p. 6). 19 Ibid., paragraph 2.13 (p. 6).
Section 2 Relevant Market Definition
PMCA Economic Consulting Page 11
“Indeed, the prices published in the [Irish] Farmers Journal every week confirm that there is no systematic differential in cattle prices across localities”.
While the Competition Authority interpreted this feature – namely that of no systematic variation in prices paid to farmers for their cattle – as indication of the possibility of the relevant geographic market in regard to the procurement of cattle being the State, the lack of price variation for cattle bought in by processors also points to an absence of price competition in the relevant market, the softened nature of which is apparent in the weekly price data made publicly available in the Irish Farmers Journal and on the websites of the DAFM20 and Bord Bia21 and through apparent common practices like the 3% variation mentioned in paragraph 2.12 of the Competition Authority’s merger determination in Dawn/Galtee (2003). It is considered by PMCA that the publicly available, transparent price data contribute to the low price variation in the cattle procurement market in the State. More generally in competition work, price transparency can facilitate softened or reduced price competition.
The Competition Authority did not come to a precise or definitive view regarding the geographic dimension of the relevant market in respect of the procurement of cattle for slaughter because Galtee had only one beef plant in the State at the time and, even if a local market were adopted, “there are sufficient other competitors to exercise a significant check on its plant”.22 As remarked above, there were four ABP plants within a radius of 60 miles in respect of the Galtee plant at Charleville, Co. Cork.
The Competition Authority then proceeded to consider the structure of the relevant market for the procurement of cattle for slaughter in the State, focusing on larger facilities or abattoirs required to have an EU export licence from the DAFM. According to the determination, such abattoirs “typically slaughter around 50,000 head of cattle per annum”.23
The Competition Authority observed that Dawn had a 16.25% share of the national beef kill (at or about the time of the Dawn/Galtee determination in 2003), while Galtee had a 3.25% share of the kill at or about this time (the year is not quoted). The change in the Herfindahl-Hirschman Index (HHI) of market concentration from the pre-transaction to the post-transaction situations is generally given as twice the product of the firms’ respective market shares in the pre-transaction situation and the change in the HHI (the ‘HHI delta’) is used by national competition authorities – like the current CCPC and the then Competition Authority in 2003 – as indication (but not definitive or conclusive) of the likely competitive effects of transactions.24 The specific shares mentioned implied that the proposed acquisition by Dawn of Galtee would have given rise to a HHI delta of 106 in the market for the procurement of cattle for slaughter at DAFM-approved beef processing plants in the State in or around the year 2003. Treating the proposed JV between ABP and Slaney in this report as effectively a merger situation, the HHI deltas are much larger than that in Dawn/Galtee, as we will see subsequently in this report.
20 http://www.agriculture.gov.ie/farmingsectors/beef/beeffactorypricesweeklyreports/2016/meatmarketreport-
averagepricesincludingvatforsteerscowsheifersyoungbullsandbulls/. 21 http://www.bordbia.ie/industry/farmers/pricetracking/cattle/pages/prices.aspx. 22 Ibid., paragraph 2.14 (p. 6). 23 Ibid., paragraph 2.15 (pp. 6-7). That figure is in line with the estimate reported later in this report. 24 The HHI is defined as the sum of the squared market shares of all firms in a relevant market, where the effect
of squaring is to give greater weight to firms with larger market shares. Without loss of generality to the n-firm situation, consider a market with two firms, 1 and 2, and respective market shares, s1 and s2. The pre-transaction HHI is given as s1
2 + s22. If the firms merge, the post-transaction HHI will be given as (s1+s2)2, which
by algebraic expansion is equal to s12 + s2
2 + 2s1s2. The HHI delta is then the difference in the HHI between the pre- and post-transaction situations and is equal to 2s1s2, or twice the product of the firms’ pre-transaction market shares.
Section 2 Relevant Market Definition
PMCA Economic Consulting Page 12
To interpret the meaning of this HHI delta figure (in Ireland), we may refer to the Competition Authority’s/CCPC’s guidelines in regard to the assessment of the competitive effects of transactions.
According to the CCPC’s current ‘Guidelines for Merger Analysis’, which were adopted by the organisation on 31 October 2014, the CCPC has regard to the following “thresholds” as part of its assessment of transactions:25
• “A post-merger HHI below 1,000 is unlikely to cause concern.” • “Any market with a post-merger HHI greater than 1,000 may be regarded as concentrated and
highly concentrated if greater than 2,000.” • “Except as noted above, in a concentrated market a delta of less than 250 is unlikely to cause
concern and in a highly concentrated market a delta of less than 150 is unlikely to cause concern.”
In Dawn/Galtee (2003), as well as noting the pre-transaction market shares of the parties, the Competition Authority also presented a table (Table 1, p. 7) showing the post-merger market shares of the major beef processors in terms of their share of the overall beef kill in the State. There is no analysis of the HHI delta in the determination but the aforementioned HHI delta of 106 would have placed the proposed transaction between Dawn and Galtee in the “unlikely to cause concern” bracket.
Nevertheless, the current CCPC’s ‘Guidelines for Merger Analysis’ (2014) also provide that:26
“However, a merger that falls below the HHI thresholds set out in paragraph 3.10 may still raise competition concerns in certain circumstances such as, for example, where one or more of the following factors are present:”
• “If the products of the merging parties are considered by customers to be close substitutes.” • “Where one of the merging parties is a maverick firm or has recently experienced a rapid
increase in market share, has driven innovation or has been charging lower prices than its competitors in the market under review.”
• “If a merger involves a significant potential entrant or recent entrant.” • “Where there are particularly significant regulatory barriers to entry.” • “Where there are high customer switching costs.” • “Where indications of past or ongoing coordination are present.” • “Where one of the merging parties has a pre-merger market share of 50% or more.”
In the instant case – the proposed transaction between ABP and Slaney – a number of these concerns are present in the current market, namely (as shown subsequently in Section 3):
• The parties’ products are close substitutes (and ABP and Slaney are among the largest firms in all of the relevant product markets defined where the geographic market is the south Leinster area, this spatial area arising from a 60-mile radius drawn in respect of Slaney’s beef processing plant at Bunclody, Co. Wexford, which is the largest processing factory in the country);
25 CCPC Guidelines for Merger Analysis (2014), paragraph 3.10 (pp. 13-14). The Competition Authority’s first
merger guidelines under the SLC test, ‘Notice in Respect of Guidelines for Merger Analysis’, were published in December 2002 (Competition Authority Decision No. N/02/004, 16 December 2002). The HHI provisions are broadly similar in both sets of guidelines. PMCA commented on the proposed new guidelines when they were issued for public comment/consultation in 2013 (the PMCA and other submissions are available at http://ccpc.ie/enforcement-mergers-mergers-legislation-guidance/guidelines-merger-analysis).
26 Supra footnote 25, paragraph 3.12 (p. 14).
Section 2 Relevant Market Definition
PMCA Economic Consulting Page 13
• The relevant market is characterised by substantial regulatory barriers to entry, which, along with structural features of the market, such as economies of scale and scope, vertical integration and high switching costs, might in turn be capable of being strategically exploited by incumbents within the market to deter, reduce or regulate/control the level of entry or competition, or to make competition in the market more predictable to their advantage;
• The relevant market is characterised by high switching costs – in regard to farmers providing cattle for slaughter (which is implied in the Dawn/Galtee merger determination of 2003); and
• There was an attempt to coordinate behaviour in the past, through the proposed BIDS scheme, which was ultimately withdrawn by the industry (as recently as 2011) (outlined below).
The Competition Authority’s determination in Dawn/Galtee (2003) suggests that regulatory barriers to entry are high into beef slaughtering and processing in the State, where the regulatory requirements include planning permission, integrated pollution control (IPC) licence and an export licence (for large-scale slaughtering and processing). Based on market enquiries and research undertaken by the organisation, the then Competition Authority estimated that “the time required to select an appropriate site, make all the necessary applications for planning approval and licences and have a plant built and operational is around four years”,27 which is a considerably longer period of time than the normal or conventional 2-year period or so in respect of the condition of entry in competition assessments of proposed transactions.28 Accordingly, the Competition Authority came to the view in Dawn/Galtee (2003) that greenfield entry would be rare in the market but it did note two examples of acquisition entry and development into export-approved standards (Exel Meats and Euro Farm Foods, which came into the market in the early 2000s – the latter continues to operate near Duleek, Co. Meath, with an estimated market share of around 3% in 2015, while the Exel plant at Kilbeggan, Co. Westmeath, changed hands and today is part of Kepak, which has other plants in Counties Cork, Meath and Roscommon).
Turning from the upstream market for the procurement of cattle for slaughter in the State to the downstream market for boneless beef, the then Competition Authority observed in its merger determination of Dawn/Galtee in 2003 that up to 90% of all beef output in the State is exported, with just 12.75% consumed domestically within the country. In regard to the export of beef, the Competition Authority noted that:29
“The parties have very few customers in common – the only area of overlap is in regard to traders or other processors.”
This meant that unilateral effects from the proposed transaction between Dawn and Galtee in regard to the export of beef from Ireland were not seen as an issue by the Competition Authority (unilateral effects generally refer to the possibility of a transaction giving the merged entity the power to exercise single-firm market power in the relevant market because the parties are close competitors pre-transaction and other competitors may be unlikely to constrain such market power in the post-transaction environment due to high barriers to entry, switching costs and/or high barriers to expansion, in which other competitors may have little or no spare capacity which otherwise would allow them to compete with the merger entity in the event that it tried to exercise market power post-transaction).
27 Supra footnote 14, paragraph 2.37 (p. 12). 28 According to the CCPC’s Guidelines for Merger Analysis (2014), “While entry that is effective within two years is
normally considered timely, the appropriate timeframe for effective new entry will depend on the characteristics and dynamics of the market under consideration” (supra footnote 25, paragraph 6.5, p. 29).
29 Supra footnote 14 (paragraph 2.20, p. 8).
Section 2 Relevant Market Definition
PMCA Economic Consulting Page 14
At the retail level, the Competition Authority observed that Irish beef is strongly preferred over imported beef, a fact that remains true today.
The retail multiplies were observed to account for 69% of all beef sales at retail level in Ireland in or about 2003, with the remaining 31% of retail beef sales occurring through butchers and some independently-owned grocery stores. The then Competition Authority also noted a trend in which retail butchers were being increasingly supplied by larger (DAFM export-approved) processors, which were found to account for at least 70% of all retail supply/sales of beef in the State (paragraph 2.21 of the Dawn/Galtee determination).
In the next paragraph of its determination of the Dawn/Galtee transaction (2003), the Competition Authority outlined how the retail multiples source their beef only from DAFM export-approved multiples that are vertically integrated – specifically those having both slaughtering and de-boning facilities (paragraph 2.22, p. 8). Having an export licence (from the DAFM) is seen as a sign of quality and, the Competition Authority observed, dealing with larger processors is seen as easier for retail multiples from a buying, management etc. perspective (paragraph 2.23, p. 9).
The Competition Authority’s merger determination of 2003 notes how the retail multiples in the State deal with one or a small number (2-3) of beef processors for the retail supply of Irish beef. Prices were observed to be negotiated regularly on an individual basis and “Such prices are generally not transparent” (paragraph 2.26, p. 9). The same lack of price transparency between processor and retailer continues to apply in the market today, even though the IFA has called for such information to be made available for many years. The Competition Authority also noted in its merger determination of Dawn/Galtee that switching by retail multiples of beef processors tends to be limited over time (paragraph 2.26, p. 9).
In terms of shares of the Irish retail beef market, the merger determination of 2003 observed that Kepak had a share of 20%, ABP around 15% and Dawn less than 10%. The main three processors, it was noted, together supply 40-50% of all retail beef sales in Ireland but that their individual market shares differ and have varied over time (paragraph 2.29, p. 10).
PMCA would note at this juncture that since the former Competition Authority’s Dawn/Galtee determination of 2003, the relevant market has changed (due to events like foot-and-mouth disease and more recently the horsemeat scandal of 2013) and that ABP has been the largest processor for some time now. The changes in the relevant market are considered further in Section 3, which includes analysis of changes in estimated market shares between 2011 and 2015, in which time ABP and the other three multi-plant processing firms, namely Dawn, Kepak and Liffey, together with Slaney, were the leading firms in the relevant market in respect of the national beef kill in the State.
In assessing the competitive effects of the transaction, specifically coordinated effects, which generally refer to the possibility of a transaction increasing the likelihood of coordination in the relevant market to reduce competition, the Competition Authority in Dawn/Galtee (2003) considered that:30
“There are a number of factors that might suggest the possibility for coordinated behaviour in the Irish retail market. For instance, there are a small number of relatively large firms, with roughly equal market shares and cost structures. This can often be consistent with the facilitation of co-ordinated behaviour.”
30 Supra footnote 14 (paragraphs 3.14 and 3.15, p. 15).

Section 2 Relevant Market Definition
PMCA Economic Consulting Page 15
“However, Galtee is not a constraining influence on the factors that would facilitate engaging in coordinated action by beef processors, predominantly because it does not compete in the Irish retail market, and is highly unlikely to do so given the nature and location of the Galtee plant. Also, other Irish customers of export-approved beef processors do not specifically use Galtee as a check or bargaining tool on the prices they pay for boneless beef. Thus, the merger should not enhance the likelihood of co-ordinated effects in the sale of beef to Irish retailers.”
Galtee was not active in the retail supply of beef in the State because, as noted by the Competition Authority in its merger determination (paragraph 3.11, p. 14), since the BSE crisis, major Irish retailers did not buy beef from plants where cows are slaughtered and cows accounted for around 40% of the cattle kill at Galtee’s facility in Charleville, Co. Cork, thereby excluding it from the retail beef market in the State at the time of the merger determination.
While the Competition Authority recognised the possibility for coordinated behaviour to occur in the relevant market relating to the retail supply of beef in Ireland in Dawn/Galtee (2003), it found that it was not necessary to proceed further in this regard, owing to the particular circumstances of Galtee in the market, namely that it was not seen as a constraint on coordinated behaviour in the market.
On the other hand, the circumstances of the present case are different to Dawn/Galtee, because Slaney is an integral and leading player in the relevant market, not just in beef but also in lamb, and the detailed analyses of the features of the relevant market are considered in Section 3, after which we comment on the competitive effects of the proposed transaction in Section 4. Furthermore, since Dawn/Galtee (2003), Irish retailers changed their decision regarding beef from cows and now purchase beef from plants that slaughter cows; if this was the case in 2003, it would have meant that Galtee would have been a constraining influence on coordinated behaviour by processors at that time, in turn meaning that coordinated effects would have been a bigger issue at that time, as PMCA considers it to be in the instant case (i.e. the proposed transaction between ABP and Slaney).
2.2.2 The BIDS Case
2.2.2.1 Background and Outcome
The Irish CCPC’s website contains a number of documents relating to the long-running BIDS case, which can be traced back to the 1990s and the McKinsey study (1998) of the Irish beef sector which recommended the establishment of a corporate vehicle – the Beef Industry Development Society – to rationalise capacity in the sector.31 The rationale for the BIDS proposal, which was driven by the beef processing sector, concerns the buy-sell margin on cattle throughput, which is believed to underpin the sector’s profitability and long-term viability. The buy-sell spread is thought to be inversely related to factory capacity – higher available capacity tends to result in more demand for cattle supplies, leaving farmers better off and processors worse off, ceteris paribus, and vice-versa if capacity is tight.
The then Competition Authority (which has become the CCPC) formed the view that the BIDS proposal was incompatible with both Irish and EU competition law because it represented a coordinated or concerted approach among processors to reduce capacity in the sector.32
31 The documents (bar the McKinsey report) are available at http://ccpc.ie/enforcement-mergers-civil-
competition-enforcement-cases/agreements-reduce-capacity-irish-beef. PMCA has not had sight of the McKinsey report.
32 The outline of the BIDS case and its implications for agreements among undertakings (or entities caught by competition law) to reduce capacity are provided for in the Competition Authority/CCPC publication ‘Notice on

Section 2 Relevant Market Definition
PMCA Economic Consulting Page 16
Both ABP and Slaney were members of the BIDS vehicle. PMCA understands that the IFA were initially involved in assisting with the McKinsey study but withdrew from the process, when it became apparent that the processors were moving towards a coordinated approach to reduce processing capacity.
Accordingly, the then Competition Authority initiated civil proceedings against the scheme in 2003, which were dismissed by the Irish High Court in 2006. The Competition Authority then appealed the High Court decision to the Supreme Court in Ireland, which decided to refer the matter for a preliminary ruling to the European Court of Justice in 2007.
As explained in its 2011 Notice, the Competition Authority outlines that “In essence, the Supreme Court asked the Court of Justice whether agreements with features such as those of the BIDS arrangements were to be regarded, by virtue of their object alone, as being anticompetitive and prohibited by Article 101(1) [of the EU Treaty] or whether it was necessary, in order to reach such a conclusion, first to demonstrate that such agreements had anti-competitive effects”.33
After examining the settled case law and reviewing the arguments of the parties, the Court of Justice concluded in 2008 that an agreement with the features of the BIDS agreement had as its object the prevention, restriction or distortion of competition within the meaning of Article 101(1).
The case was then referred back, through the Supreme Court, to the High Court, where the onus was on proponents of the BIDS scheme to prove that it satisfied all conditions of Article 101(3), which is reflected in Irish competition law through Section 4(5) of the Competition Act 2002 (as amended).
In January 2011, BIDS withdrew its claim before the High Court in respect of the application of Article 101(3). Consequently, the High Court did not reach any decision on the application of this provision to the BIDS agreement. As a result, the BIDS agreement remains prohibited, as it has the object of preventing, restricting or distorting competition with the meaning of the EU Treaty.
At the end of the Competition Authority’s 2011 Notice document, paragraph 7.1 (p. 17) states that:
“In light of the conclusions of the relevant courts in the BIDS case, an agreement between competitors to reduce capacity including features such as those in the BIDS agreement amounts to a restriction of competition by object and is prohibited by section 4(1) and/or Article 101(1) TFEU [Treaty of the Functioning of the EU]. Therefore, the only assessment necessary for such an agreement will be an assessment under section 4(5) and/or Article 101(3) to see whether the conditions necessary for an exemption are satisfied.”
2.2.2.2 Capacity in the Beef Processing Sector in the State
In the aforementioned High Court action brought by the Competition Authority against BIDS in 2006, the Judgment of Mr. Justice McKechnie provides the following information (overleaf) on the beef processing sector in Ireland (it will be recalled from earlier that the High Court dismissed the Competition Authority’s case, which was ultimately successful following the reasoning of the European Court of Justice, the highest court in the EU).
Agreements to Reduce Capacity’ (N/11/001, 16 June 2011), which is available at the CCPC website cited in footnote 31.
33 Ibid., paragraph 5.9 (p. 7).

Section 2 Relevant Market Definition
PMCA Economic Consulting Page 17
• The sector grew rapidly following Accession to the then EEC (European Economic Community) in 1973, which, from financial supports through the Common Agricultural Policy (CAP), saw the development of many beef processing facilities and from 1990 the slaughtering of more than 1,000 cattle required licensing approval.
• However, the rapid growth of the sector, aided to a large extent by grant aid from Europe, saw a great many cattle being slaughtered without a demand on the other side of the market and the sector became characterised by excess capacity.
• The executive summary of the 1998 McKinsey report (‘Preparing the Irish Beef Sector for the 21st Century’) (which PMCA has not seen) mentions overproduction to the extent that twice as that needed was being produced at the time and McKinsey recommended that the number of processors be reduced from around 20 to 4-6, according to the judgement report of Mr. Justice McKechnie.
• The McKinsey report outlines that, on the supply-side, the beef processing industry in Ireland was split between licensed exporters and those not licensed to export (this broad market structure continues to prevail today, where the DAFM export-approved firms account for an estimated approximately 94% of the national beef kill and the remaining much smaller and more numerous abattoirs not licensed to export come under local authority remit).
• According to the McKinsey report, the throughput of the beef processing industry averaged 32,000 per week in 1997, with a maximum weekly output of 45,000 and a capacity of 66,000, suggesting that capacity utilisation at that time averaged 48% and on occasion reached as high as 68%, in turn suggesting that there was still a large degree of spare capacity in the industry.
• The McKinsey report also suggested that a throughput of 100,000 cattle as the level at which economies of scale could be captured (at the time of the McKinsey report in 1998) (today, according to the information available to PMCA, no plant operates at this level in the State, the largest being Slaney’s Bunclody plant, estimated to slaughter 88,000+ head of cattle).
• The McKinsey report recommended coordinated and concerted action to remove 32% of the capacity from the industry, with the “stayers” compensating the “goers” for closing down and decommissioning their plants.
• Mr. Justice McKechnie’s judgement notes that there was no consumer voice on the “steering group” that interacted with McKinsey during the development of the proposed scheme (“nor were their multiples as such” according to paragraph 23(a) of the judgement).
• In addition to the McKinsey report of 1998, there were several other reports at the time broadly in agreement with the consultants from McKinsey and which called for a coordinated rationalisation of the sector, the aim being to improve the competitiveness of the sector in the increasingly international marketplace in which it operated.
• The only mention of specific plant-level capacity utilisation rates in the Mr. Justice McKechnie judgement occurs at paragraph 88 (p. 81), which states “that the capacity and throughput of export approved plants can vary considerably. Utilisation can range between 18% and 91% (1997) and 8% and 81% (2000).” However, these figures do not attribute utilisation rates to particular plants, or firms; even if they did, they would at this stage be out-of-date and of little or no use for the purposes of the proposed transaction between ABP and Slaney, not least for the reason that processor throughout has become less fluid since the BIDS case.
• At paragraph 96 (p. 86) of his judgement, Mr. Justice McKechnie states that he is “satisfied beyond question that there is overcapacity in the industry and that it is not a short term or cyclical feature of the business but rather is structural and therefore long term in nature.”
Section 2 Relevant Market Definition
PMCA Economic Consulting Page 18
The Supreme Court’s request to refer the BIDS case to the Court of Justice for a preliminary ruling in 2007, following the Competition Authority’s appeal of the High Court decision of 2006, summarises the information outlined in the High Court decision of Mr. Justice McKechnie and does not contain any additional information or data on capacity utilisation rates at plant or firm level in the beef processing sector in the State. The same applies to the Opinion of the Advocate General of the Court of Justice (Case C-209/07) and the Judgment of the Court of Justice of 20 November 2008.34
2.2.2.3 Other Relevant Information Arising from the BIDS Case
The judgement of Mr. Justice McKechnie in the aforementioned High Court case of 2006, which relied on the evidence of expert economists (Dr. Pat McCloughan was not involved in any way in the BIDS case), considers that the geographic extent of the cattle procurement market is the State and that the downstream retail markets for the supply of beef are national, with the relevant geographic markets being the State, the UK (the single largest export market for Irish beef) and national European markets (i.e. France, Italy, Germany etc.) and thus that the geographic market is not transnational (although there is a clear inter-state trade dimension).
The reports arising from the BIDS case – High Court, Supreme Court and the Court of Justice – make mention of the seasonality of cattle/beef production in the State, which was “deseasonalised” through a particular payment from the EU (namely the former Deseasonalisation Premium or DSP, which was introduced in or about 1992 but was discontinued in the latter part of that decade). Econometric analysis of cattle price series, accounting for different types and grades of cattle, subsequently in this report by PMCA suggests the presence of seasonal patterns in the prices paid by processors for cattle, with cattle prices found to be systematically lower in the third quarter of the year, which is consistent with the intuitive experience of the IFA and farmers. However, the econometric analysis undertaken by PMCA and reported on subsequently in Section 3 finds no seasonal patterns present in the price series for prime and premium cattle in the UK (steers, heifers and young bulls).
The aforementioned Supreme Court decision of 2007, which resulted in the BIDS proposal being referred to the European Court of Justice, observes (at page 3) that “annual throughput of animals through all plants is approximately 1.6 to 1.7 million (up from 1.27 million in 1994)”. The Supreme Court decision then proceeds to predict that “This annual throughput is likely to decrease by 300,000 to 400,000 per annum, due, inter alia, to removal of price supports as a result of CAP reform and increases in live animal exports”. Analysis of the long-term size and growth of the cattle procurement market in the State, reported upon subsequently in Section 3 of this report, shows that this prediction by the Supreme Court in 2007 has proved erroneous. According to data from the Central Statistics Office (CSO), which includes smaller abattoirs under the remit of local authorities/county councils as well as the export-approved processors under the aegis of the DAFM, the total number of cattle slaughtered in 2015 was 1.67m, which was 1% higher than the level recorded in 1994.
34 The same observation also applies to the judgements of the Supreme Court Justices (Fennelly and Kearns) in
2009 when the BIDS case came back to the Irish courts from the Court of Justice. All the judgements are available on the CCPC’s website (supra footnote 31).
Section 2 Relevant Market Definition
PMCA Economic Consulting Page 19
2.3 Definition of the Relevant Market for Beef Processing
2.3.1 Introduction
The CCPC’s/Competition Authority’s delineation of two relevant markets in beef processing as outlined in the Dawn/Galtee determination of 2003 – namely the upstream market for the procurement of cattle for slaughter in the State and the downstream markets for the retail sale of boneless beef in the State and the export of Irish beef abroad – are broadly correct and appropriate in the instant case.
As noted earlier, the then Competition Authority took a broad view of the product market for the procurement of cattle for beef processing in the State but at the same time recognised the possibility of narrower product markets also being relevant for competition analysis of the beef processing market in the State, based on different grades of cattle.
Recognising the different types as well as the grades of cattle underpinning the beef processing supply chain in the State is critically important to competition assessment of the relevant market under consideration here. Accordingly, it is necessary therefore to examine narrower relevant product markets based on the EU classification of cattle for slaughter in the State as well as the relevant product market for all cattle for slaughter as considered in the 2003 Dawn/Galtee determination.
Similarly, turning to the geographic dimension of the relevant market, it is also important to examine narrower, local markets as well as the wider market encompassing the State, given that at least 90% of all cattle for slaughter at any given DAFM export-approved processing plant originate from within a 60-mile radius of the facility, as noted by the Competition Authority in Dawn/Galtee.
The IFA’s position is that the proposed transaction should be assessed using narrow as well as broad relevant product and geographic market definitions – arising from how the beef processing sector in the State works in practice. PMCA considers that this is a sensible approach to adopt.
2.3.2 Beef Supply Chain in the State
A schematic summary of the beef supply chain in the State is illustrated in Figure 2.1 below.35 Of the estimated total 619,000 tonnes produced in 2014, 89,000 tonnes or 14% of the total were consumed at home, meaning that 86% were destined for overseas markets. The vast majority of Irish beef is exported to the EU (521,000 tonnes or 84% of all production in 2014), within which the UK is the single largest export market, with 272,000 tonnes or 52% of all EU exports in the year mentioned (which means that over three times the quantity of Irish beef is consumed in the UK as at home). Non-EU countries accounted for a very small proportion of Irish beef production in 2014 (9,000 tonnes or 1% of the total) and these countries’ share of exports has declined over the years, reflecting geo-political tensions and other events, such as food scares (the change is also a reflection of the better price returns from the UK and EU markets). Throughput at beef processing factories in Ireland has changed in the process. The significance of this fact, in the context of this report, is that response times are now lower compared with in the past, given the much greater emphasis placed on food safety and quality today. This in turn implies that the ability of competitor processors to respond to a possible SLC or SIEC is likely to be lower today than in times past, when the throughput tended to be more fluid.
35 The supply chain is an updated version of that presented in the IFA-commissioned report entitled ‘The
Importance of the Cattle and Sheep Sectors to the Irish Economy’ by Professor Alan Renwick of the Department of Agriculture and Food Economics at University College Dublin (UCD) in April 2013.
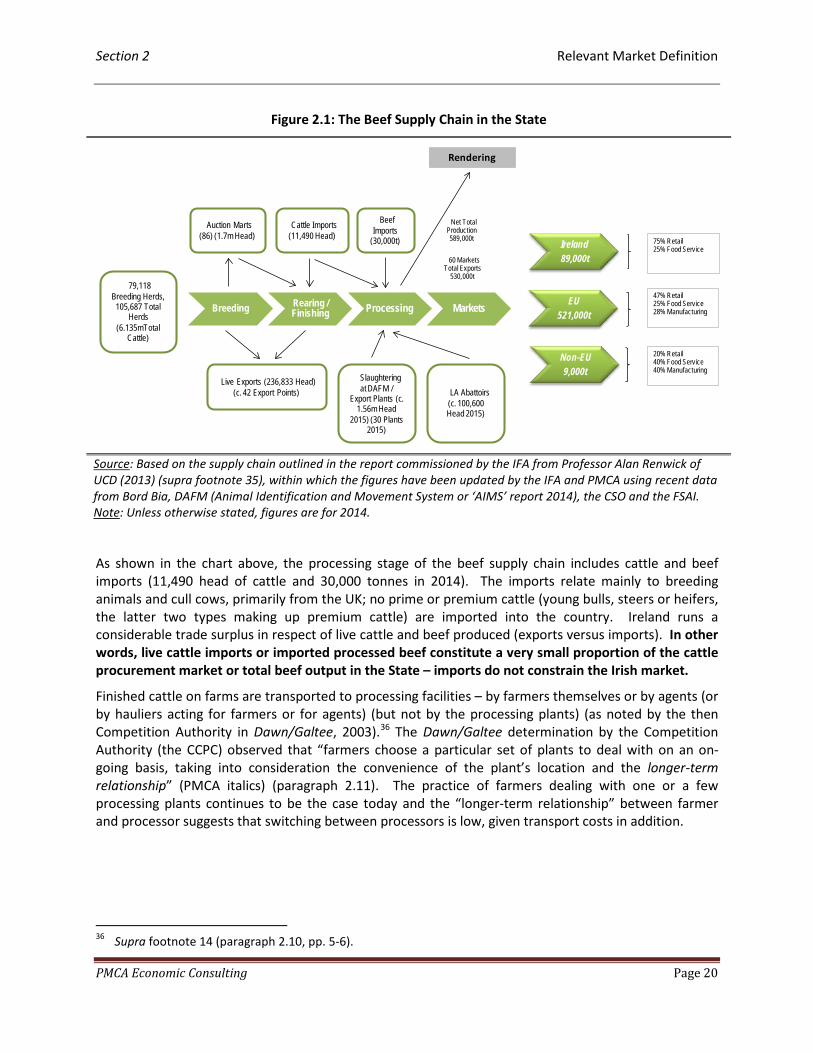
Section 2 Relevant Market Definition
PMCA Economic Consulting Page 20
Figure 2.1: The Beef Supply Chain in the State
Source: Based on the supply chain outlined in the report commissioned by the IFA from Professor Alan Renwick of UCD (2013) (supra footnote 35), within which the figures have been updated by the IFA and PMCA using recent data from Bord Bia, DAFM (Animal Identification and Movement System or ‘AIMS’ report 2014), the CSO and the FSAI. Note: Unless otherwise stated, figures are for 2014.
As shown in the chart above, the processing stage of the beef supply chain includes cattle and beef imports (11,490 head of cattle and 30,000 tonnes in 2014). The imports relate mainly to breeding animals and cull cows, primarily from the UK; no prime or premium cattle (young bulls, steers or heifers, the latter two types making up premium cattle) are imported into the country. Ireland runs a considerable trade surplus in respect of live cattle and beef produced (exports versus imports). In other words, live cattle imports or imported processed beef constitute a very small proportion of the cattle procurement market or total beef output in the State – imports do not constrain the Irish market.
Finished cattle on farms are transported to processing facilities – by farmers themselves or by agents (or by hauliers acting for farmers or for agents) (but not by the processing plants) (as noted by the then Competition Authority in Dawn/Galtee, 2003).36 The Dawn/Galtee determination by the Competition Authority (the CCPC) observed that “farmers choose a particular set of plants to deal with on an on-going basis, taking into consideration the convenience of the plant’s location and the longer-term relationship” (PMCA italics) (paragraph 2.11). The practice of farmers dealing with one or a few processing plants continues to be the case today and the “longer-term relationship” between farmer and processor suggests that switching between processors is low, given transport costs in addition.
36 Supra footnote 14 (paragraph 2.10, pp. 5-6).
Breeding Rearing / Finishing Processing Markets
Ireland89,000t
EU 521,000t
Non-EU9,000t
yAuction Marts (86) (1.7m Head)
yBeefImports
(30,000t)
yLive Exports (236,833 Head) (c. 42 Export Points)
ySSlaughteringat DAFM /
Export Plants (c. 1.56m Head
2015) (30 Plants 2015)
ySLA Abattoirs (c. 100,600 Head 2015)
75% Retail25% Food Service
47% Retail25% Food Service28% Manufacturing
20% Retail40% Food Service40% Manufacturing
yCattle Imports (11,490 Head)
y79,118Breeding Herds,
105,687 Total Herds
(6.135mTotal Cattle)
y60 MarketsTotal Exports
530,000t
yNet Total Production 589,000t
Rendering
Section 2 Relevant Market Definition
PMCA Economic Consulting Page 21
Agents are retained by processors to procure cattle and help ensure the timely delivery of cattle, which are graded (outlined below), and their presence in the supply chain is part of the longer-term relationship between the critical inputs supplier (i.e. the farmer) and processor.
Box 2.1: The Role of Agents in the Relevant Market for the Procurement of Cattle for Slaughter in the State
In general, livestock farmers in the State sell their finished cattle directly to meat plants through a cattle agent. Most farmers deal with one agent who in turn usually deals primarily with one meat plant. Relationships are established over time and farmers tend to stay with the same agent and as a consequence with the same factory.
The agent is paid by the meat plant and generally takes instructions from the plant’s procurement office or manager. The fundamental role of the agent is to ensure the purchase of stock for the factory. As a ‘middleman’ in the beef supply chain in the State, the agent must also be sensitive to the requirements of the farmer, who supplies the critical input. In practice, the work of agents entails inspecting cattle pre-sale (checking regarding their suitability for purchase), agreeing the price, arranging the delivery dates and usually organising/providing the transport of the animals to factory. In some instances, agents can also be involved in the purchase of replacement cattle for the farmer.
On price, the agent will generally quote the factory base price to the farmer. Depending on the time of year, the level of weekly supplies and factory demand, the farmer may or may not be able to negotiate on the level of the quoted base price or just have to accept the quoted price. In general, if supplies exceed 30,000 weekly, the farmer will tend to have very limited bargaining power on price and the issue will then be whether or not the farmer can sell his/her cattle immediately or else queue for a week or more to get the cattle sold. In these circumstances, getting cattle sold becomes the key issue as opposed to having some negotiating power on price with the agent. ‘Pushing back cattle’ or delaying sale can be very difficult for farmers as there are severe penalties imposed by factories if cattle go over 30 months of age or become too fat by delaying sale. These are significant factors at a micro level occurring every day in hundreds of transactions at farm level in the State, where the influence and bargaining power tends to rest with the factory procurement office/manager and the agent acting on the factory’s behalf. Illustration of the low variation in base prices quoted among processing plants in the State is provided subsequently in the report (Table 3.14, p. 81, and the discussion around that exhibit).
In regard to the approval and registration of dealers/agents engaged in the buying and selling of livestock, the European Communities (Approval and Registration of Dealers of Bovine Animals and Swine) Regulations 2007 (S.I. No. 151 of 2007) and the European Communities (Approval and Registration of Dealers of Ovine Animals) Regulations 2008 (S.I.100 of 2008) provide that all dealers engaged in the buying and selling of animals must be registered. In the case of cattle and pigs, a dealer is defined as a person who purchases and sells to another person within a period of 30 days. A person who buys and resells within 30 days less than 100 cattle in any 12-month period will be excluded from the requirements to be approved as a dealer.
In the case of sheep, a dealer is defined as a person who purchases and sells to another person within a period of 29 days. A person who buys and resells within 29 days less than 100 sheep in any 12-month period will similarly be considered to be excluded from the requirements to be approved as a dealer.
All dealers engaged must be approved and registered by the DAFM in Ireland. It is not permitted for a person to buy/acquire/source an animal from or sell/supply/dispose of an animal to a dealer unless the dealer is approved, registered and in possession of a current approval number under the aforementioned legislation. In addition, if a dealer is assembling/holding animals, he/she must have premises, which have been approved for that specific purpose. The legislation also requires those who register as dealer to comply with arrangements relating to the welfare and transport of animals, standards and the upkeep of premises, keeping of records and compliance with animal notification and disease testing procedures.
Each dealer must make a written application for approval and registration as a dealer in respect of each premises used for his/her dealing operations. The written application(s) are made to the local District Veterinary Office (DVO) of the DAFM in which the premises are situated. If the application is for approval as dealer without premises, the written application should be made to the DVO in the county where the dealer is resident or carries out most of the dealing operations.
Source: IFA, DAFM and PMCA research.
Section 2 Relevant Market Definition
PMCA Economic Consulting Page 22
The slaughtering/processing stage of the beef supply chain in the State comprises DAFM export-approved plants and much smaller abattoirs under the remit of local authorities (city and county councils, as they are known in Ireland). There are 204 of the latter currently (accounting for in the region of 100,600 cattle slaughtered) (these small processors are limited to slaughtering no more than 100 livestock/cattle units in any given week with a maximum of 5,000 livestock units in a calendar year).37 In 2015, there were 30 DAFM export-approved plants, which accounted for an estimated over 1.56m head of cattle slaughtered in the State (or an average of more than 52,000 head of cattle per plant). Over half (seventeen, 17) of these plants belong to four (4) multi-plant beef processing firms and the other thirteen (13) plants belong to that number of single-plant beef processing firms.
The largest processor in the State, ABP, has six (6) plants, namely at Bandon, Co. Cork, Cahir and Nenagh, Co. Tipperary, Clones, Co. Monaghan, Rathkeale, Co. Limerick, and at Ferrybank, Co. Waterford. Kepak has four (4) plants (at Athleague, Co. Roscommon, Clonee, Co. Meath, Kilbeggan, Co. Westmeath and Watergrasshill, Co. Cork) as does Dawn (Dawn’s four (4) plants are located at Charleville, Co. Cork, Ballyhaunis, Co. Mayo, Grannagh, Co. Waterford and Rathdowney, Co. Laois). Liffey has three (3) plants, located at Ballyjamesduff, Co. Cavan, Ballinasloe, Co. Galway and Hacketstown, Co. Carlow.
Slaney operates the single largest processing facility in the country, at Bunclody, Co. Wexford, with an estimated throughput of over 88,000 head of cattle in total in 2015.
The 30 DAFM export-approved plants operated by the 17 processing firms accounted for an estimated 94% of the national beef kill in 2015, and the remaining 6% was due to the considerably smaller abattoirs coming under the remit of local authorities in Ireland. The LA-approved plants provide only a very marginal, if any, competitive constraint on the DAFM-approved plants locally or nationally and the relevant ‘competitive set’ is the DAFM-approved plants, where ABP is the largest operator and Slaney the fifth largest in terms of head of cattle slaughtered (Slaney is the largest single-plant operator, after the four multi-plant operators).
A feature of the Irish beef ending up in the grocery shelves in the country’s shops and retailing outlets is that branding is not strong – apart from the overall quality standards associated with Irish beef etc. People generally do not associate the beef they buy with particular processor firms. Instead consumer purchasing decisions tend to be based on the types and cuts of meat (mince, steaks, roasts etc.), with health considerations (e.g. fat content) and other factors coming into play (e.g. beef from specialist breeds like Angus and Hereford cattle) as well as price. The generally absence of strong brands in retail beef contrasts with other forms of meat, notably pork-related products, where there are strong brands in Ireland (e.g. Galtee, Denny, Brady Ham etc.).38 The retail multiples in Ireland – Tesco, Dunnes, SuperValu and the discounters (Aldi and Lidl) – use own-brands in beef, supplied by the leading processors having relationships with retailers. As noted earlier in Section 1, ABP is the main processor supplying Tesco in Ireland and supplies Angus beef for all of Tesco’s counter sales. The firm also supplies Aldi and is the supplier of choice to Pallas Foods, the largest food service/restaurant supplier in the State. Slaney is the supplier of choice for Hereford prime beef to Lidl in Ireland.
37 Statutory Instrument (SI) 432 of 2009 (European Communities (Food and Feed Hygiene) Regulations 2009). The
information on the number of LA abattoirs was obtained from the Food Safety Authority of Ireland (FSAI). Some of the LA abattoirs are also involved in the slaughtering of lambs/sheep and other animals. A livestock/cattle unit does not necessarily equate with a head of livestock/cattle and the legislation provides the measurement of units among different forms of animal.
38 Curiously enough, small local beef processors tend on occasion to have strong local brands (mince, burgers etc.) and their products are often stocked locally by the retail multiples but the coverage is only local.

Section 2 Relevant Market Definition
PMCA Economic Consulting Page 23
2.3.3 Types of Cattle and the EU Beef Carcase Classification Scheme
In recognition of the possibility of narrower product markets in respect of the procurement of cattle for slaughter in the State, as accepted by the then Competition Authority in its Dawn/Galtee determination of 2003, it is necessary to consider the types of cattle entering the beef supply chain and the EU beef carcase classification system.
2.3.3.1 Types of Cattle
Beginning at the broadest level and moving to the narrowest level in respect of cattle types feeding into the beef supply chain in the State are the following:
• All cattle comprising young bulls, bulls, steers, cows, heifers and calves (i.e. adult and non-adult cattle);39
• Prime cattle comprising young bulls, steers and heifers (subset of non-adult cattle); • Premium cattle comprising steers and heifers (smaller subset of non-adult cattle); • Premium cattle comprising steers and heifers meeting the MII (Meat Industry Ireland) grade; • Premium cattle comprising steers and heifers meeting the MII grade and weight specification
(the MII grade and weight specification are outlined below under the next heading).
Data on the first/broadest grouping are available for cattle slaughtered at both DAFM-approved and LA-approved plants in the State (from the CSO), while information/estimates on the narrower groups of cattle pertain only to the DAFM-approved plants licensed to export (from Bord Bia) – the latter processors accounted for an estimated 94% of all cattle slaughtered in the State in 2015.
The delineation of the narrower groupings of cattle above reflects the key quality-based grid for beef to which we now turn.
2.3.3.2 The EU Beef Carcase Classification Scheme
The aim of the EU Beef Carcase Classification Scheme is to ensure a common classification standard for cattle going into the beef supply chain throughout the EU. It enables the EU to operate a standardised beef price reporting system. From late 2004, most beef carcases are classified by mechanical means in Ireland, with DAFM-licensed factory employees classifying the balance (by manual means).40
The criteria for classifying beef carcases are as follows:
• Conformation (the shape and development of the carcase) is denoted by the letters E, U, R, O, P, in which E signifies the best and P the poorest;
• Fat score refers to the degree of fat and is denoted by the numbers 1, 2, 3, 4, 5 in order of increasing fatness;
• Sex category is denoted by the letters A (young bull), B (bull), C (steer), D (cow) and E (heifer).
Classification information is returned to the supplier (farmer) by the slaughtering plant. Over 90% of carcases are classified by machine (non-manual) (in the State). Machine classification makes use of video image analysis to carry out various measurements of the carcase. As the determination of classification in this case is objective, no appeal is possible.
39 Supra footnote 7 (p. 2 of this report) on the different types of cattle. 40 Information on mechanical/manual classification by DAFM-approved processing plant in Ireland (there were 30
in 2015) is provided in the DAFM publication ‘Beef Carcase Classification and Price Reporting – Annual Report’ (2015 is the latest available annual report at the time of preparing this report in April 2015).
Section 2 Relevant Market Definition
PMCA Economic Consulting Page 24
Where classification is by manual means, which occurs in only a few (smaller) DAFM export-approved plants, the classification is carried out by factory employees who have been licensed by the DAFM. In these cases, the supplier/farmer can appeal the decision of the classifier to the slaughterer plant.41
According to the DAFM’s latest (2015) beef carcase classification and price reporting system report, any factory slaughtering more than 20,000 adult bovines per week must report prices on a weekly basis to the Department/DAFM. In 2015, 25 factories reported prices to DAFM. Price reporting factories slaughter an estimated c. 90% of the national beef kill in the State.
In 2015, DAFM officers carried out 56 price audits of these factories examining details of payments/returns to producers for almost 64,500 carcasses. During the course of each audit, authorised officers checked identification, weights, classification and prices paid to producers against the information reported to the DAFM to ensure the accuracy of price reporting to the DAFM and the European Commission, and to the farming press. The checks and balances in the auditing system show the seriousness by which the authorities attach to ensuring the operation of the supply chain, including accurate information to ensure incentives for producers (farmers) in working towards the rearing and finishing of cattle/bovines to meet demand for beef at home and abroad.
Figure 2.2 overleaf illustrates the EU Beef Carcase Classification Scheme in matrix form, with the numbers along the top (from 1- to 5+) referring to fat score (in order of increasing fatness) and the rows from E+ to P- referring to conformation (with P- being the poorest and E+ the best). The matrix is helpful to explaining the MII standards and thus to the two narrowest candidate product markets, viz.:
• Premium cattle comprising steers and heifers meeting the MII (Meat Industry Ireland) grade; • Premium cattle comprising steers and heifers meeting the MII (Meat Industry Ireland) grade and
weight specification.
In respect of premium cattle for beef production (steers and heifers), the MII grade requires these types of cattle to satisfy the following:
• Fat score ranging from 2+ to 4=; and • Conformation of O= or better.
Both criteria are illustrated in the shaded cells in the matrix in Figure 2.2 below. As outlined in the Irish Farmers Journal each week (in the ‘Business of Farming’ section towards the end of the main paper), there are bonus payments to producers (farmers) in respect of carcases with relatively strong conformations (in practice R+ to U+) and fat scores between 2+ and 4= (the base criteria above which the bonus payments are made are shown each week in the publication). The bonus payments over the base price (agreed between farmer and agent, acting on behalf of the DAFM export-approved processing plant, as outlined earlier in Box 2.1, p. 21) are 12 c/kg DW (and as shown subsequently in this report, there is very little or no variation in the base price quoted to farmers – Sub-Section 3.8, p. 80). See overleaf and Box 2.2 subsequently,
41 Further information can be obtained from the Beef Classification Section, Department of Agriculture, Food and
the Marine, Grattan Business Centre, Dublin Road, Portlaoise, Co Laois. The EU Regulation for beef, pig and sheep carcases is available at http://eur-lex.europa.eu/legal-content/EN/TXT/?uri=CELEX%3A32008R1249. Each week the Irish Farmers Journal reports on the quality-based pricing system for steers and heifers.

Section 2 Relevant Market Definition
PMCA Economic Consulting Page 25
Figure 2.2: Illustration of the EU Beef Carcase Classification Scheme in Ireland
Source: DAFM, MII, IFA. Note: The shaded cells refer to the MII fat score and conformation criteria in respect of steers and heifers (applying to DAFM-approved/export-licensed beef processing plants).
In addition to the MII grade criteria just outlined, premium cattle (steers and heifers) qualifying for the bonus payments must also be quality assured (Bord Bia), reared or finished on a maximum of 4 farm residences and must be on the last quality-assured farm for at least 70 days before slaughter. They must also be under 30 months old. Penalties are applied (deductions from the price paid by processors to suppliers/farmers) in the event that animals are over 30 months and not quality-assured.
In addition to the above, the MII weight specification requires that steers carcases weigh 280-380 kg and heifers 270-380 kg. If we were to superimpose the weight specification in the matrix in Figure 2.2 above, the shaded area of relevance would be reduced through the addition of the extra criterion, which varies between steers and heifers because of the differences in their sex/gender.42
The IFA and farmers consider that the QPS (Quality Payment System) is a scientific-based system for rewarding farmers fairly and properly for quality. However, for the IFA and farmers, the problem relates to the specifications the meat plants have introduced around the QPS, which include a maximum of residencies, a final residency period of 70 days, 30 months of age and more recently penalties imposed by the meat plants on carcase weight limits. The specification issues imposed by processors around the QPS are problematic in respect of competition for farmers and the IFA. The specification issues by processors may also act to prevent auction markets in Ireland for the sale of finished premium cattle to processors that might otherwise provide an alternative to the incumbent model in which farmers deal with cattle agents acting on behalf of processors (in GB, auction markets for finished cattle exist).
42 DAFM data showing the profile of all cattle slaughtered at DAFM-approved plants in the State, for each plant
and for all plants (on a percentage basis), are available at http://www.agriculture.gov.ie/farmingsectors/beef/beefcarcaseclassificationfiguresperiodic/.
1- 1= 1+ 2- 2= 2+ 3- 3= 3+ 4- 4= 4+ 5- 5= 5+E+E=E-U+U=U-R+R=R-O+O=O-P+P=P-
Conf
orm
atio
n (P
- Poo
rest
, E+ B
est)
Fat Score (In Ascending Order of Fatness of Carcase)
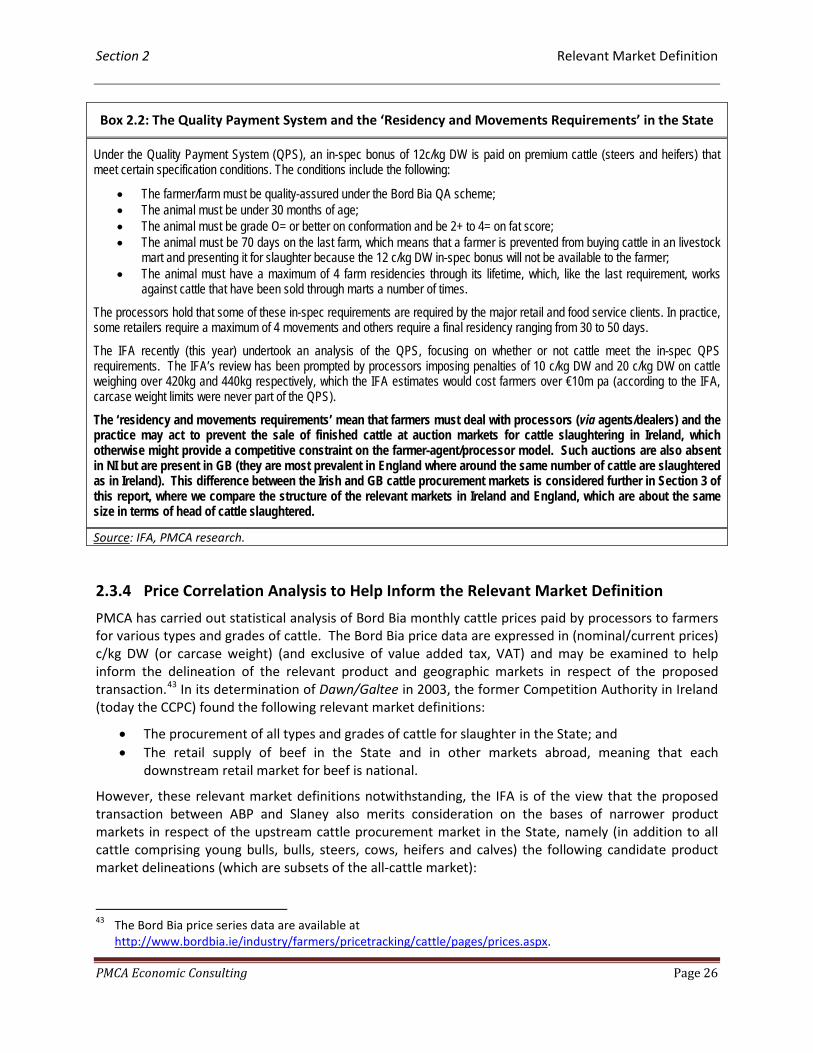
Section 2 Relevant Market Definition
PMCA Economic Consulting Page 26
Box 2.2: The Quality Payment System and the ‘Residency and Movements Requirements’ in the State
Under the Quality Payment System (QPS), an in-spec bonus of 12c/kg DW is paid on premium cattle (steers and heifers) that meet certain specification conditions. The conditions include the following:
• The farmer/farm must be quality-assured under the Bord Bia QA scheme; • The animal must be under 30 months of age; • The animal must be grade O= or better on conformation and be 2+ to 4= on fat score; • The animal must be 70 days on the last farm, which means that a farmer is prevented from buying cattle in an livestock
mart and presenting it for slaughter because the 12 c/kg DW in-spec bonus will not be available to the farmer; • The animal must have a maximum of 4 farm residencies through its lifetime, which, like the last requirement, works
against cattle that have been sold through marts a number of times.
The processors hold that some of these in-spec requirements are required by the major retail and food service clients. In practice, some retailers require a maximum of 4 movements and others require a final residency ranging from 30 to 50 days.
The IFA recently (this year) undertook an analysis of the QPS, focusing on whether or not cattle meet the in-spec QPS requirements. The IFA’s review has been prompted by processors imposing penalties of 10 c/kg DW and 20 c/kg DW on cattle weighing over 420kg and 440kg respectively, which the IFA estimates would cost farmers over €10m pa (according to the IFA, carcase weight limits were never part of the QPS).
The ‘residency and movements requirements’ mean that farmers must deal with processors (via agents/dealers) and the practice may act to prevent the sale of finished cattle at auction markets for cattle slaughtering in Ireland, which otherwise might provide a competitive constraint on the farmer-agent/processor model. Such auctions are also absent in NI but are present in GB (they are most prevalent in England where around the same number of cattle are slaughtered as in Ireland). This difference between the Irish and GB cattle procurement markets is considered further in Section 3 of this report, where we compare the structure of the relevant markets in Ireland and England, which are about the same size in terms of head of cattle slaughtered.
Source: IFA, PMCA research.
2.3.4 Price Correlation Analysis to Help Inform the Relevant Market Definition
PMCA has carried out statistical analysis of Bord Bia monthly cattle prices paid by processors to farmers for various types and grades of cattle. The Bord Bia price data are expressed in (nominal/current prices) c/kg DW (or carcase weight) (and exclusive of value added tax, VAT) and may be examined to help inform the delineation of the relevant product and geographic markets in respect of the proposed transaction.43 In its determination of Dawn/Galtee in 2003, the former Competition Authority in Ireland (today the CCPC) found the following relevant market definitions:
• The procurement of all types and grades of cattle for slaughter in the State; and • The retail supply of beef in the State and in other markets abroad, meaning that each
downstream retail market for beef is national.
However, these relevant market definitions notwithstanding, the IFA is of the view that the proposed transaction between ABP and Slaney also merits consideration on the bases of narrower product markets in respect of the upstream cattle procurement market in the State, namely (in addition to all cattle comprising young bulls, bulls, steers, cows, heifers and calves) the following candidate product market delineations (which are subsets of the all-cattle market):
43 The Bord Bia price series data are available at
http://www.bordbia.ie/industry/farmers/pricetracking/cattle/pages/prices.aspx.

Section 2 Relevant Market Definition
PMCA Economic Consulting Page 27
• Prime cattle comprising steers, heifers and young bulls; • Premium cattle comprising steers and heifers; • Premium cattle comprising steers and heifers meeting the MII (Meat Industry Ireland) grade; • Premium cattle comprising steers and heifers meeting the MII grade and weight specification.
Given the important distinctions between all cattle, prime cattle and premium cattle, and the MII requirements in respect of quality assurance and exporting outlined above, where the emphasis is placed on premium cattle (steers and heifers), PMCA considers that the four narrower product market definitions merit examination in the instant case in addition to the all-cattle procurement market.
Furthermore, as well as looking at the five product markets in the State, PMCA is also of the view that the proposed transaction should in addition be assessed on the basis of the five product markets on a local basis, in particular based on a 60-mile radius from the target, namely Slaney’s beef processing plant at Bunclody, Co. Wexford. The motivation for considering the five product markets on this local basis, as well as examining them at the level of the State, reflects the fact that virtually all cattle sourced for slaughter at a given DAFM export-approved plant originate within 60 miles of the plant, as observed in the Competition Authority’s determination in Dawn/Galtee (2003) (notwithstanding the possibility of a chain of substitution from the Bunclody plant that might eventually encompass the whole country, which in any event is being catered for in this report in the State-level geographic market definitions).
The need to consider the proposed transaction in every reasonable relevant market definition (broad and narrow) in and within the State (at least as far as market shares and concentration are concerned) is, in PMCA’s view, appropriate and sensible, not least given the concerns that the IFA and farmers have over the proposed transaction weakening competition even further in and within Ireland.
To fix ideas in regard to how price correlation analysis can inform on relevant market definition, consider the following price trends for the representative category of cattle steers R3 (the fact that steers R3 are widely considered to be representative provides further justification for considering narrower product markets in the assessment of the competitive effects of the proposed transaction between ABP and Slaney).
The graph in Figure 2.3 below has been downloaded by PMCA directly from the Bord Bia cattle price website (supra footnote 43) and shows the price series for steers R3 (c/kg DW) in Ireland and the UK during the period from the beginning of 2010 to February 2016 (monthly data comprising 74 observations). The UK is not only Ireland’s single largest export market for beef but is also Ireland’s closest market in terms of how the beef supply chain works in practice, being largely grassland-based.
Generally speaking, respective price series of products or regions making up a relevant market for the purposes of competition assessment tend to trend together over time. Even if there are differentials or gaps between price series for a given set of products or regions/countries (for a given product), the co-trending of the price series over time is generally considered to provide evidence (not necessarily definitive) that the products or regions are part of the same relevant market. Graphical inspection and statistical analysis of price series can be useful in informing the so-called SSNIP test of relevant market definition (SSNIP standing for small but significant non-transitory increase in price).44
44 The CCPC’s Guidelines for Merger Analysis (2014) outline the SSNIP or ‘hypothetical monopolist’ test of
relevant market definition, which basically defines the relevant market as the smallest group of products and regions worth monopolising. The SSNIP test is really a ‘thought experiment’ based on available information at hand rather than a well-defined procedure with a given formula. This explains why the relevant market

Section 2 Relevant Market Definition
PMCA Economic Consulting Page 28
Figure 2.3: Cattle Price Series – Steers R3 in Ireland and the UK (Jan 2010-Feb 2016)
Source: Graph downloaded by PMCA from the Bord Bia website (supra footnote 43). Note: Nominal or current price series (74 monthly observations in each case).
Looking at the price series in the graph above, it is seen that the price paid by processors to farmers for the representative category of cattle steers R3 has generally trended in the same way in Ireland and the UK. However, the extent of co-trending could not be said to be especially strong – where it is clearly evident that a growing gap between the UK and Irish price has opened up over the period.
The statistical method known as correlation analysis provides a simple means of summarising the extent of co-movement in price series in competition assessments. Correlation coefficients can be calculated for pairs of price series and the closer the correlation coefficient is to unity (the upper bound) the stronger the co-movement and the more likely the products or regions are to being in the same relevant market (generally speaking the correlation coefficient lies between 0 and 1). There is no threshold or critical value above which the correlation coefficient can be said to indicate that products or regions lie in the same relevant market but benchmarks are sometimes applied in practice (a correlation coefficient of 0.95 or more may be used for benchmarking purposes).45
definition part of competition assessment work is generally a matter of judgement (and debate among practitioners).
45 This benchmark value of the correlation coefficient is based on analysis of price series known to be part of the same relevant market. However, the correlation coefficient is a basic (linear) method of summarising price series for relevant market definition. More advanced techniques include econometric analysis of the stationarity and cointegration of price series, which, while more robust than correlation analysis, are more time-consuming to apply. PMCA considers that price correlation analysis suffices for the purposes of the

Section 2 Relevant Market Definition
PMCA Economic Consulting Page 29
The correlation coefficient between the Irish and UK price series for steers R3 during the period in question is 0.9009, which is below the reference value used here of 0.95, and accords with what one would expect on a priori grounds (given the IFA’s experience of the relevant market in practice and previous merger and litigation cases in respect of the market – Dawn/Galtee (2003) and the BIDS case), namely that the relevant geographic market for steers R3 is national in scope (the State or the UK).46
Building on these principles and the illustrative example of steers R3 shown above, Table 2.1 overleaf shows the matrix of correlation coefficients of price series among the types and grades of cattle in Ireland for which Bord Bia data are available (during January 2010-February 2016, 74 observations of data in each price series). Correlation matrices are generally symmetric – the off-diagonal elements are the same – and shown in the table are the upper diagonal correlation coefficients (e.g. the correlation coefficient between young bulls O2 and young bulls O3 in the State is 0.9987, suggesting both grades are part of the same market product market, and the diagonal elements are all unity because each series is being correlated with itself). The upper diagonal elements shaded in green are those correlation coefficients of at least the value of 0.95, with the suggestion that the cattle in question are likely to be part of the same product market in the State.
Inspection and consideration of the matrix suggests that there is likely to be a market for premium cattle (all the correlation coefficients among steers and heifers are above the benchmark). There is also likely to be a market for prime cattle consisting of young bulls, steers and heifers – although the correlation coefficients among the lower grades of young bull (O2 and O3) and each of steers and heifers are below the reference value of 0.95. It is also observed that the lower grades of cows (O2, O3, O4, P2 and P3) are less highly correlated with steers and heifers (prime cattle) than the higher grades of cows (R3 and R4).
Overall, notwithstanding the general qualifications or caveats when using price correlations to inform relevant market definition work, the pattern of correlation coefficients evident in Table 2.1 below is consistent with a priori expectations and points to a clear enough suggestion of there being a relevant market for premium cattle comprising steers and heifers, a reasonably clear relevant market consisting of prime cattle (with young bulls in addition to steers and heifers) and a less clear market for all cattle (the correlations between lower grades of cows and each of heifers and steers are less strong).
Nevertheless, we will continue to consider the relevant product market of all cattle as well as prime cattle (young bulls, heifers and steers) and premium cattle (heifers and steers).
The tables of correlation coefficients following Table 2.1 relate to the question of the relevant geographic market, where we compare the price series for different types and grades of cattle in Ireland with their counterparts in the UK, the closest beef supply system to that in Ireland.
present exercise, with the proviso that it alone does not provide definitive evidence of relevant market definition (which can also be said to apply to any method per se).
46 The price gap in favour of the UK compared with Ireland evident in Figure 2.3 above is analysed in more detail in Section 3 of the report, where the pattern of a growing price gap is evident in all of the specific categories of prime cattle (young bulls, steers and heifers) for which there are Bord Bia data.
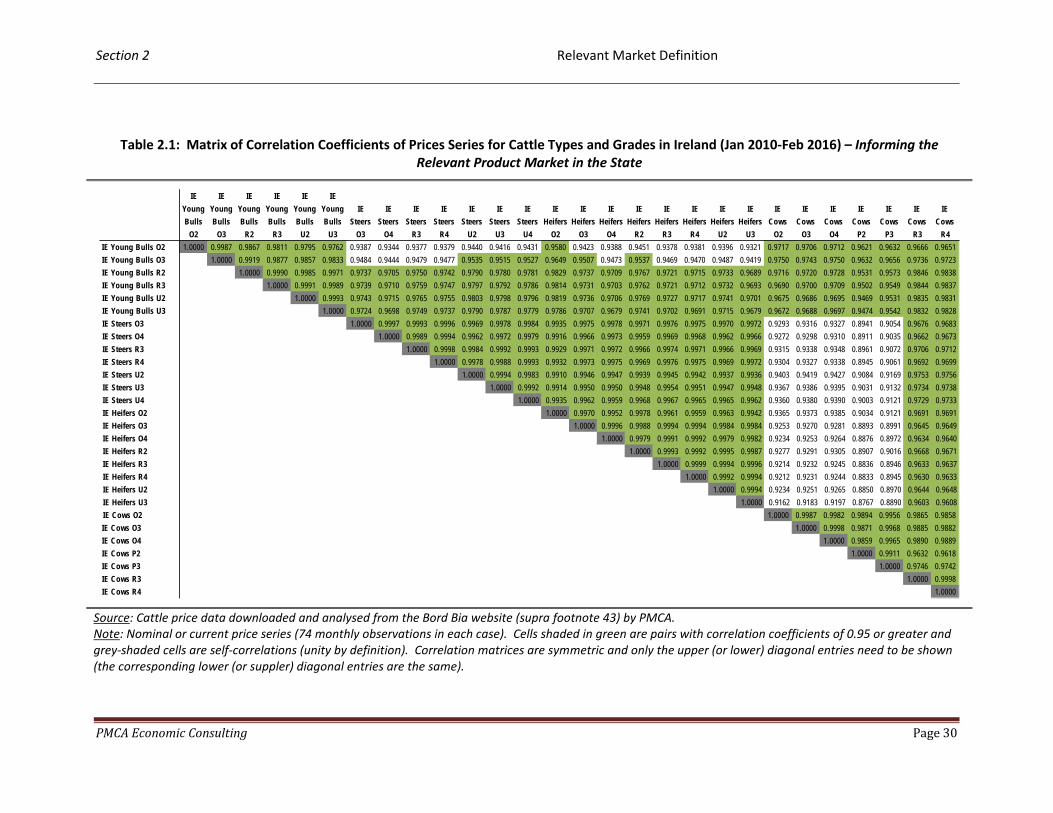
Section 2 Relevant Market Definition
PMCA Economic Consulting Page 30
Table 2.1: Matrix of Correlation Coefficients of Prices Series for Cattle Types and Grades in Ireland (Jan 2010-Feb 2016) – Informing the Relevant Product Market in the State
Source: Cattle price data downloaded and analysed from the Bord Bia website (supra footnote 43) by PMCA. Note: Nominal or current price series (74 monthly observations in each case). Cells shaded in green are pairs with correlation coefficients of 0.95 or greater and grey-shaded cells are self-correlations (unity by definition). Correlation matrices are symmetric and only the upper (or lower) diagonal entries need to be shown (the corresponding lower (or suppler) diagonal entries are the same).
IE Young Bulls
O2
IE Young Bulls
O3
IE Young Bulls
R2
IE Young Bulls
R3
IE Young Bulls
U2
IE Young Bulls
U3
IE Steers
O3
IE Steers
O4
IE Steers
R3
IE Steers
R4
IE Steers
U2
IE Steers
U3
IE Steers
U4
IE Heifers
O2
IE Heifers
O3
IE Heifers
O4
IE Heifers
R2
IE Heifers
R3
IE Heifers
R4
IE Heifers
U2
IE Heifers
U3
IE Cows
O2
IE Cows
O3
IE Cows
O4
IE Cows
P2
IE Cows
P3
IE Cows
R3
IE Cows
R4IE Young Bulls O2 1.0000 0.9987 0.9867 0.9811 0.9795 0.9762 0.9387 0.9344 0.9377 0.9379 0.9440 0.9416 0.9431 0.9580 0.9423 0.9388 0.9451 0.9378 0.9381 0.9396 0.9321 0.9717 0.9706 0.9712 0.9621 0.9632 0.9666 0.9651IE Young Bulls O3 1.0000 0.9919 0.9877 0.9857 0.9833 0.9484 0.9444 0.9479 0.9477 0.9535 0.9515 0.9527 0.9649 0.9507 0.9473 0.9537 0.9469 0.9470 0.9487 0.9419 0.9750 0.9743 0.9750 0.9632 0.9656 0.9736 0.9723IE Young Bulls R2 1.0000 0.9990 0.9985 0.9971 0.9737 0.9705 0.9750 0.9742 0.9790 0.9780 0.9781 0.9829 0.9737 0.9709 0.9767 0.9721 0.9715 0.9733 0.9689 0.9716 0.9720 0.9728 0.9531 0.9573 0.9846 0.9838IE Young Bulls R3 1.0000 0.9991 0.9989 0.9739 0.9710 0.9759 0.9747 0.9797 0.9792 0.9786 0.9814 0.9731 0.9703 0.9762 0.9721 0.9712 0.9732 0.9693 0.9690 0.9700 0.9709 0.9502 0.9549 0.9844 0.9837IE Young Bulls U2 1.0000 0.9993 0.9743 0.9715 0.9765 0.9755 0.9803 0.9798 0.9796 0.9819 0.9736 0.9706 0.9769 0.9727 0.9717 0.9741 0.9701 0.9675 0.9686 0.9695 0.9469 0.9531 0.9835 0.9831IE Young Bulls U3 1.0000 0.9724 0.9698 0.9749 0.9737 0.9790 0.9787 0.9779 0.9786 0.9707 0.9679 0.9741 0.9702 0.9691 0.9715 0.9679 0.9672 0.9688 0.9697 0.9474 0.9542 0.9832 0.9828IE Steers O3 1.0000 0.9997 0.9993 0.9996 0.9969 0.9978 0.9984 0.9935 0.9975 0.9978 0.9971 0.9976 0.9975 0.9970 0.9972 0.9293 0.9316 0.9327 0.8941 0.9054 0.9676 0.9683IE Steers O4 1.0000 0.9989 0.9994 0.9962 0.9972 0.9979 0.9916 0.9966 0.9973 0.9959 0.9969 0.9968 0.9962 0.9966 0.9272 0.9298 0.9310 0.8911 0.9035 0.9662 0.9673IE Steers R3 1.0000 0.9998 0.9984 0.9992 0.9993 0.9929 0.9971 0.9972 0.9966 0.9974 0.9971 0.9966 0.9969 0.9315 0.9338 0.9348 0.8961 0.9072 0.9706 0.9712IE Steers R4 1.0000 0.9978 0.9988 0.9993 0.9932 0.9973 0.9975 0.9969 0.9976 0.9975 0.9969 0.9972 0.9304 0.9327 0.9338 0.8945 0.9061 0.9692 0.9699IE Steers U2 1.0000 0.9994 0.9983 0.9910 0.9946 0.9947 0.9939 0.9945 0.9942 0.9937 0.9936 0.9403 0.9419 0.9427 0.9084 0.9169 0.9753 0.9756IE Steers U3 1.0000 0.9992 0.9914 0.9950 0.9950 0.9948 0.9954 0.9951 0.9947 0.9948 0.9367 0.9386 0.9395 0.9031 0.9132 0.9734 0.9738IE Steers U4 1.0000 0.9935 0.9962 0.9959 0.9968 0.9967 0.9965 0.9965 0.9962 0.9360 0.9380 0.9390 0.9003 0.9121 0.9729 0.9733IE Heifers O2 1.0000 0.9970 0.9952 0.9978 0.9961 0.9959 0.9963 0.9942 0.9365 0.9373 0.9385 0.9034 0.9121 0.9691 0.9691IE Heifers O3 1.0000 0.9996 0.9988 0.9994 0.9994 0.9984 0.9984 0.9253 0.9270 0.9281 0.8893 0.8991 0.9645 0.9649IE Heifers O4 1.0000 0.9979 0.9991 0.9992 0.9979 0.9982 0.9234 0.9253 0.9264 0.8876 0.8972 0.9634 0.9640IE Heifers R2 1.0000 0.9993 0.9992 0.9995 0.9987 0.9277 0.9291 0.9305 0.8907 0.9016 0.9668 0.9671IE Heifers R3 1.0000 0.9999 0.9994 0.9996 0.9214 0.9232 0.9245 0.8836 0.8946 0.9633 0.9637IE Heifers R4 1.0000 0.9992 0.9994 0.9212 0.9231 0.9244 0.8833 0.8945 0.9630 0.9633IE Heifers U2 1.0000 0.9994 0.9234 0.9251 0.9265 0.8850 0.8970 0.9644 0.9648IE Heifers U3 1.0000 0.9162 0.9183 0.9197 0.8767 0.8890 0.9603 0.9608IE Cows O2 1.0000 0.9987 0.9982 0.9894 0.9956 0.9865 0.9858IE Cows O3 1.0000 0.9998 0.9871 0.9968 0.9885 0.9882IE Cows O4 1.0000 0.9859 0.9965 0.9890 0.9889IE Cows P2 1.0000 0.9911 0.9632 0.9618IE Cows P3 1.0000 0.9746 0.9742IE Cows R3 1.0000 0.9998IE Cows R4 1.0000
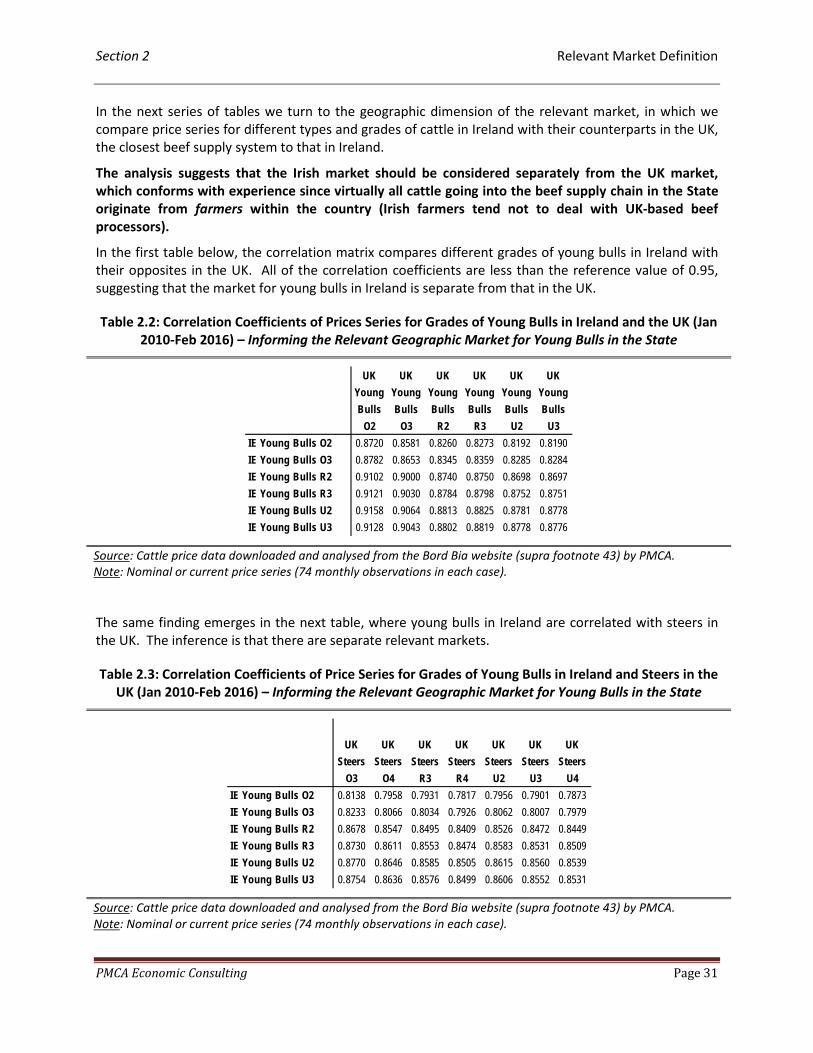
Section 2 Relevant Market Definition
PMCA Economic Consulting Page 31
In the next series of tables we turn to the geographic dimension of the relevant market, in which we compare price series for different types and grades of cattle in Ireland with their counterparts in the UK, the closest beef supply system to that in Ireland.
The analysis suggests that the Irish market should be considered separately from the UK market, which conforms with experience since virtually all cattle going into the beef supply chain in the State originate from farmers within the country (Irish farmers tend not to deal with UK-based beef processors).
In the first table below, the correlation matrix compares different grades of young bulls in Ireland with their opposites in the UK. All of the correlation coefficients are less than the reference value of 0.95, suggesting that the market for young bulls in Ireland is separate from that in the UK.
Table 2.2: Correlation Coefficients of Prices Series for Grades of Young Bulls in Ireland and the UK (Jan 2010-Feb 2016) – Informing the Relevant Geographic Market for Young Bulls in the State
Source: Cattle price data downloaded and analysed from the Bord Bia website (supra footnote 43) by PMCA. Note: Nominal or current price series (74 monthly observations in each case).
The same finding emerges in the next table, where young bulls in Ireland are correlated with steers in the UK. The inference is that there are separate relevant markets.
Table 2.3: Correlation Coefficients of Price Series for Grades of Young Bulls in Ireland and Steers in the UK (Jan 2010-Feb 2016) – Informing the Relevant Geographic Market for Young Bulls in the State
Source: Cattle price data downloaded and analysed from the Bord Bia website (supra footnote 43) by PMCA. Note: Nominal or current price series (74 monthly observations in each case).
UK Young Bulls
O2
UK Young Bulls
O3
UK Young Bulls
R2
UK Young Bulls
R3
UK Young Bulls
U2
UK Young Bulls
U3IE Young Bulls O2 0.8720 0.8581 0.8260 0.8273 0.8192 0.8190IE Young Bulls O3 0.8782 0.8653 0.8345 0.8359 0.8285 0.8284IE Young Bulls R2 0.9102 0.9000 0.8740 0.8750 0.8698 0.8697IE Young Bulls R3 0.9121 0.9030 0.8784 0.8798 0.8752 0.8751IE Young Bulls U2 0.9158 0.9064 0.8813 0.8825 0.8781 0.8778IE Young Bulls U3 0.9128 0.9043 0.8802 0.8819 0.8778 0.8776
UK Steers
O3
UK Steers
O4
UK Steers
R3
UK Steers
R4
UK Steers
U2
UK Steers
U3
UK Steers
U4IE Young Bulls O2 0.8138 0.7958 0.7931 0.7817 0.7956 0.7901 0.7873IE Young Bulls O3 0.8233 0.8066 0.8034 0.7926 0.8062 0.8007 0.7979IE Young Bulls R2 0.8678 0.8547 0.8495 0.8409 0.8526 0.8472 0.8449IE Young Bulls R3 0.8730 0.8611 0.8553 0.8474 0.8583 0.8531 0.8509IE Young Bulls U2 0.8770 0.8646 0.8585 0.8505 0.8615 0.8560 0.8539IE Young Bulls U3 0.8754 0.8636 0.8576 0.8499 0.8606 0.8552 0.8531
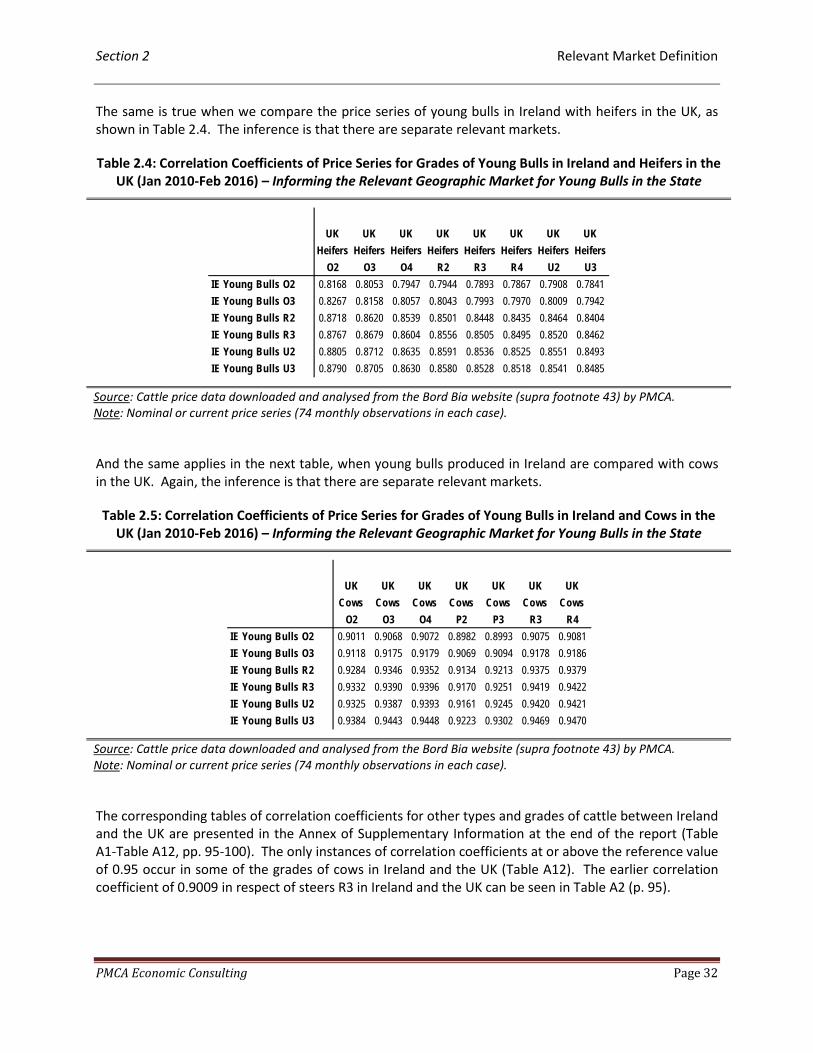
Section 2 Relevant Market Definition
PMCA Economic Consulting Page 32
The same is true when we compare the price series of young bulls in Ireland with heifers in the UK, as shown in Table 2.4. The inference is that there are separate relevant markets.
Table 2.4: Correlation Coefficients of Price Series for Grades of Young Bulls in Ireland and Heifers in the UK (Jan 2010-Feb 2016) – Informing the Relevant Geographic Market for Young Bulls in the State
Source: Cattle price data downloaded and analysed from the Bord Bia website (supra footnote 43) by PMCA. Note: Nominal or current price series (74 monthly observations in each case).
And the same applies in the next table, when young bulls produced in Ireland are compared with cows in the UK. Again, the inference is that there are separate relevant markets.
Table 2.5: Correlation Coefficients of Price Series for Grades of Young Bulls in Ireland and Cows in the UK (Jan 2010-Feb 2016) – Informing the Relevant Geographic Market for Young Bulls in the State
Source: Cattle price data downloaded and analysed from the Bord Bia website (supra footnote 43) by PMCA. Note: Nominal or current price series (74 monthly observations in each case).
The corresponding tables of correlation coefficients for other types and grades of cattle between Ireland and the UK are presented in the Annex of Supplementary Information at the end of the report (Table A1-Table A12, pp. 95-100). The only instances of correlation coefficients at or above the reference value of 0.95 occur in some of the grades of cows in Ireland and the UK (Table A12). The earlier correlation coefficient of 0.9009 in respect of steers R3 in Ireland and the UK can be seen in Table A2 (p. 95).
UK Heifers
O2
UK Heifers
O3
UK Heifers
O4
UK Heifers
R2
UK Heifers
R3
UK Heifers
R4
UK Heifers
U2
UK Heifers
U3IE Young Bulls O2 0.8168 0.8053 0.7947 0.7944 0.7893 0.7867 0.7908 0.7841IE Young Bulls O3 0.8267 0.8158 0.8057 0.8043 0.7993 0.7970 0.8009 0.7942IE Young Bulls R2 0.8718 0.8620 0.8539 0.8501 0.8448 0.8435 0.8464 0.8404IE Young Bulls R3 0.8767 0.8679 0.8604 0.8556 0.8505 0.8495 0.8520 0.8462IE Young Bulls U2 0.8805 0.8712 0.8635 0.8591 0.8536 0.8525 0.8551 0.8493IE Young Bulls U3 0.8790 0.8705 0.8630 0.8580 0.8528 0.8518 0.8541 0.8485
UK Cows
O2
UK Cows
O3
UK Cows
O4
UK Cows
P2
UK Cows
P3
UK Cows
R3
UK Cows
R4IE Young Bulls O2 0.9011 0.9068 0.9072 0.8982 0.8993 0.9075 0.9081IE Young Bulls O3 0.9118 0.9175 0.9179 0.9069 0.9094 0.9178 0.9186IE Young Bulls R2 0.9284 0.9346 0.9352 0.9134 0.9213 0.9375 0.9379IE Young Bulls R3 0.9332 0.9390 0.9396 0.9170 0.9251 0.9419 0.9422IE Young Bulls U2 0.9325 0.9387 0.9393 0.9161 0.9245 0.9420 0.9421IE Young Bulls U3 0.9384 0.9443 0.9448 0.9223 0.9302 0.9469 0.9470
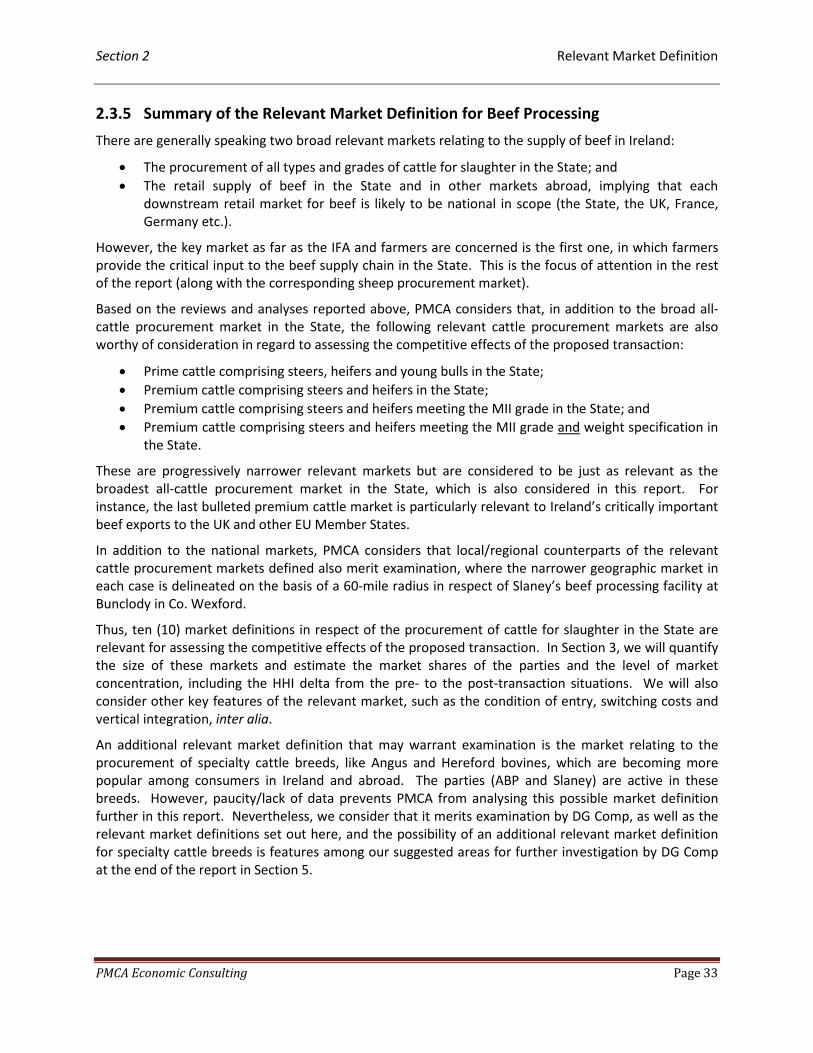
Section 2 Relevant Market Definition
PMCA Economic Consulting Page 33
2.3.5 Summary of the Relevant Market Definition for Beef Processing
There are generally speaking two broad relevant markets relating to the supply of beef in Ireland:
• The procurement of all types and grades of cattle for slaughter in the State; and • The retail supply of beef in the State and in other markets abroad, implying that each
downstream retail market for beef is likely to be national in scope (the State, the UK, France, Germany etc.).
However, the key market as far as the IFA and farmers are concerned is the first one, in which farmers provide the critical input to the beef supply chain in the State. This is the focus of attention in the rest of the report (along with the corresponding sheep procurement market).
Based on the reviews and analyses reported above, PMCA considers that, in addition to the broad all-cattle procurement market in the State, the following relevant cattle procurement markets are also worthy of consideration in regard to assessing the competitive effects of the proposed transaction:
• Prime cattle comprising steers, heifers and young bulls in the State; • Premium cattle comprising steers and heifers in the State; • Premium cattle comprising steers and heifers meeting the MII grade in the State; and • Premium cattle comprising steers and heifers meeting the MII grade and weight specification in
the State.
These are progressively narrower relevant markets but are considered to be just as relevant as the broadest all-cattle procurement market in the State, which is also considered in this report. For instance, the last bulleted premium cattle market is particularly relevant to Ireland’s critically important beef exports to the UK and other EU Member States.
In addition to the national markets, PMCA considers that local/regional counterparts of the relevant cattle procurement markets defined also merit examination, where the narrower geographic market in each case is delineated on the basis of a 60-mile radius in respect of Slaney’s beef processing facility at Bunclody in Co. Wexford.
Thus, ten (10) market definitions in respect of the procurement of cattle for slaughter in the State are relevant for assessing the competitive effects of the proposed transaction. In Section 3, we will quantify the size of these markets and estimate the market shares of the parties and the level of market concentration, including the HHI delta from the pre- to the post-transaction situations. We will also consider other key features of the relevant market, such as the condition of entry, switching costs and vertical integration, inter alia.
An additional relevant market definition that may warrant examination is the market relating to the procurement of specialty cattle breeds, like Angus and Hereford bovines, which are becoming more popular among consumers in Ireland and abroad. The parties (ABP and Slaney) are active in these breeds. However, paucity/lack of data prevents PMCA from analysing this possible market definition further in this report. Nevertheless, we consider that it merits examination by DG Comp, as well as the relevant market definitions set out here, and the possibility of an additional relevant market definition for specialty cattle breeds is features among our suggested areas for further investigation by DG Comp at the end of the report in Section 5.
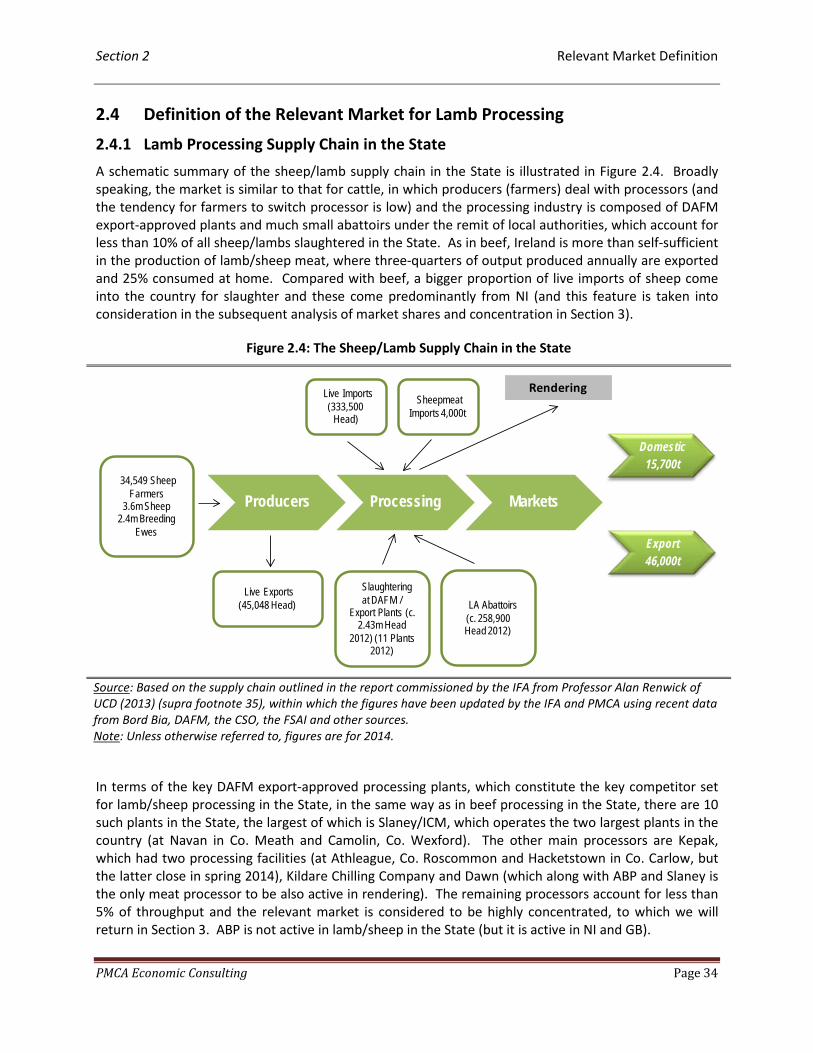
Section 2 Relevant Market Definition
PMCA Economic Consulting Page 34
2.4 Definition of the Relevant Market for Lamb Processing
2.4.1 Lamb Processing Supply Chain in the State
A schematic summary of the sheep/lamb supply chain in the State is illustrated in Figure 2.4. Broadly speaking, the market is similar to that for cattle, in which producers (farmers) deal with processors (and the tendency for farmers to switch processor is low) and the processing industry is composed of DAFM export-approved plants and much small abattoirs under the remit of local authorities, which account for less than 10% of all sheep/lambs slaughtered in the State. As in beef, Ireland is more than self-sufficient in the production of lamb/sheep meat, where three-quarters of output produced annually are exported and 25% consumed at home. Compared with beef, a bigger proportion of live imports of sheep come into the country for slaughter and these come predominantly from NI (and this feature is taken into consideration in the subsequent analysis of market shares and concentration in Section 3).
Figure 2.4: The Sheep/Lamb Supply Chain in the State
Source: Based on the supply chain outlined in the report commissioned by the IFA from Professor Alan Renwick of UCD (2013) (supra footnote 35), within which the figures have been updated by the IFA and PMCA using recent data from Bord Bia, DAFM, the CSO, the FSAI and other sources. Note: Unless otherwise referred to, figures are for 2014.
In terms of the key DAFM export-approved processing plants, which constitute the key competitor set for lamb/sheep processing in the State, in the same way as in beef processing in the State, there are 10 such plants in the State, the largest of which is Slaney/ICM, which operates the two largest plants in the country (at Navan in Co. Meath and Camolin, Co. Wexford). The other main processors are Kepak, which had two processing facilities (at Athleague, Co. Roscommon and Hacketstown in Co. Carlow, but the latter close in spring 2014), Kildare Chilling Company and Dawn (which along with ABP and Slaney is the only meat processor to be also active in rendering). The remaining processors account for less than 5% of throughput and the relevant market is considered to be highly concentrated, to which we will return in Section 3. ABP is not active in lamb/sheep in the State (but it is active in NI and GB).
Producers Processing Markets
Domestic15,700t
Export 46,000t
ySheepmeatImports 4,000t
yLive Exports (45,048 Head)
ySSlaughteringat DAFM /
Export Plants (c. 2.43m Head
2012) (11 Plants 2012)
ySLA Abattoirs (c. 258,900 Head 2012)
yLive Imports (333,500
Head)
y34,549 Sheep Farmers
3.6m Sheep2.4m Breeding
Ewes
Rendering
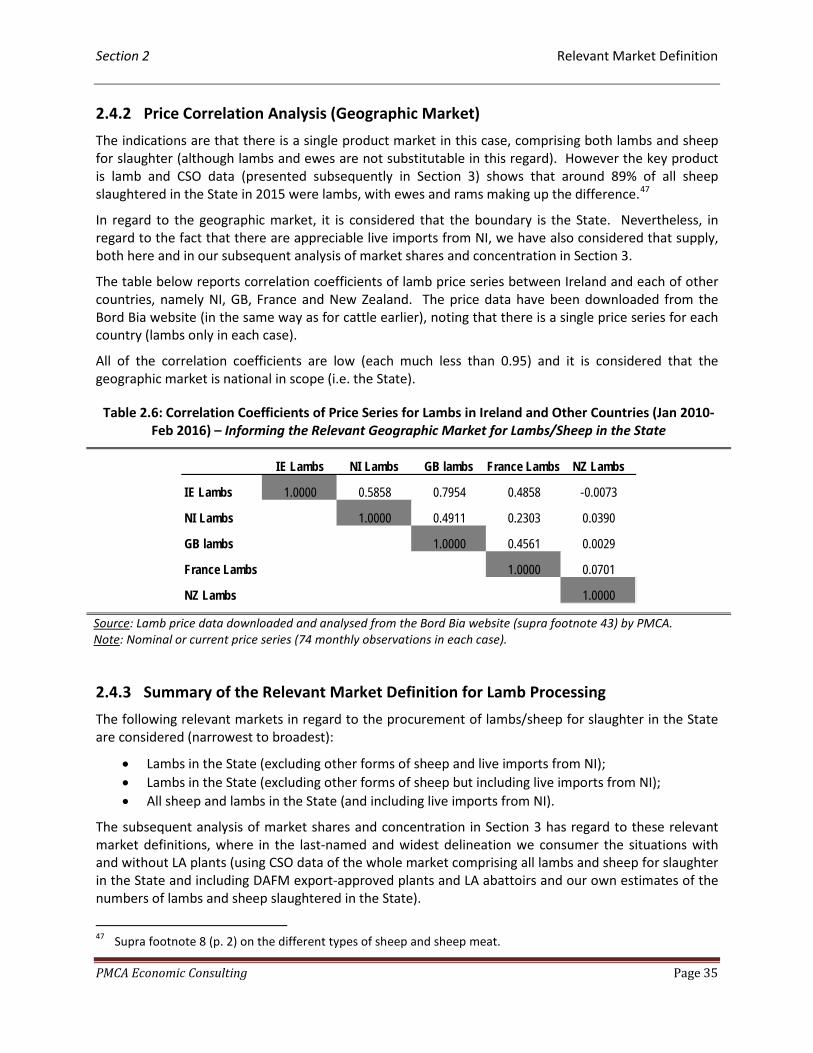
Section 2 Relevant Market Definition
PMCA Economic Consulting Page 35
2.4.2 Price Correlation Analysis (Geographic Market)
The indications are that there is a single product market in this case, comprising both lambs and sheep for slaughter (although lambs and ewes are not substitutable in this regard). However the key product is lamb and CSO data (presented subsequently in Section 3) shows that around 89% of all sheep slaughtered in the State in 2015 were lambs, with ewes and rams making up the difference.47
In regard to the geographic market, it is considered that the boundary is the State. Nevertheless, in regard to the fact that there are appreciable live imports from NI, we have also considered that supply, both here and in our subsequent analysis of market shares and concentration in Section 3.
The table below reports correlation coefficients of lamb price series between Ireland and each of other countries, namely NI, GB, France and New Zealand. The price data have been downloaded from the Bord Bia website (in the same way as for cattle earlier), noting that there is a single price series for each country (lambs only in each case).
All of the correlation coefficients are low (each much less than 0.95) and it is considered that the geographic market is national in scope (i.e. the State).
Table 2.6: Correlation Coefficients of Price Series for Lambs in Ireland and Other Countries (Jan 2010-Feb 2016) – Informing the Relevant Geographic Market for Lambs/Sheep in the State
Source: Lamb price data downloaded and analysed from the Bord Bia website (supra footnote 43) by PMCA. Note: Nominal or current price series (74 monthly observations in each case).
2.4.3 Summary of the Relevant Market Definition for Lamb Processing
The following relevant markets in regard to the procurement of lambs/sheep for slaughter in the State are considered (narrowest to broadest):
• Lambs in the State (excluding other forms of sheep and live imports from NI); • Lambs in the State (excluding other forms of sheep but including live imports from NI); • All sheep and lambs in the State (and including live imports from NI).
The subsequent analysis of market shares and concentration in Section 3 has regard to these relevant market definitions, where in the last-named and widest delineation we consumer the situations with and without LA plants (using CSO data of the whole market comprising all lambs and sheep for slaughter in the State and including DAFM export-approved plants and LA abattoirs and our own estimates of the numbers of lambs and sheep slaughtered in the State).
47 Supra footnote 8 (p. 2) on the different types of sheep and sheep meat.
IE Lambs NI Lambs GB lambs France Lambs NZ Lambs
IE Lambs 1.0000 0.5858 0.7954 0.4858 -0.0073
NI Lambs 1.0000 0.4911 0.2303 0.0390
GB lambs 1.0000 0.4561 0.0029
France Lambs 1.0000 0.0701
NZ Lambs 1.0000
Section 2 Relevant Market Definition
PMCA Economic Consulting Page 36
2.5 Section Summary
The relevant market definition is, in general, the basis of competition assessment, including coming to a view regarding whether a proposed transaction would result in an SLC (substantial lessening of competition) or an SIEC (significant impediment to effective competition) (SLC being the legislative test of merger control in Ireland and the UK, and SIEC being the corresponding test applied by the European Commission in respect of the EU). PMCA considers that both broad and narrow relevant market definitions should be applied in assessing the competitive effects of the proposed transaction between ABP and Slaney. In particular, Dr. McCloughan considers that the following market delineations are relevant to the instant case, beginning with beef before proceeding to lambs/sheep:
• Beef – procurement of cattle for slaughter; o National/State markets from broad to progressively narrower market definitions based
on the types and grades of cattle procured (including cattle imports, which account for a relatively small proportion of cattle killed in Ireland) All types and grades of cattle Prime cattle comprising young bulls, steers and heifers Premium cattle comprising steers and heifers Premium cattle comprising steers and heifers meeting the MII grade Premium cattle comprising steers and heifers meeting the MII grade and weight
specification Specialty breeds – Angus and Hereford cattle
o Local versions of the above national market delineations based on a 60-mile radius of Slaney’s Bunclody facility All types and grades of cattle Prime cattle comprising young bulls, steers and heifers Premium cattle comprising steers and heifers Premium cattle comprising steers and heifers meeting the MII grade Premium cattle comprising steers and heifers meeting the MII grade and weight
specification Specialty breeds – Angus and Hereford cattle
• Lamb – procurement of sheep and lambs for slaughter (from broad to narrower delineations); o All sheep and lambs in the State (including live imports from NI) o Lambs in the State (excluding other forms of sheep but including live imports from NI) o Lambs in the State (excluding other forms of sheep and live imports from NI).
An important (but not necessarily definitive) part of the examination of the competitive effects of the proposed transaction in the next section of the report concerns the market shares of the parties and their competitors pre-transaction and how the structure of the relevant market definitions would change in the post-transaction environment, treating the proposal as an effective merger situation. In what follows, we will estimate market shares and concentration in the pre- and post-transaction environments to assess the effects of the proposed deal on market structure, as captured by the HHI delta. In the relevant markets for beef, where both parties are active in the State, the focus will be on the DAFM export-approved processors, which together account for an estimated 94% of the national beef kill in Ireland. Nevertheless, in the relevant market definition comprising all types and grades of cattle for slaughter in the State, we will also include the much smaller abattoirs under local authority remit, which make up the remaining 6% of the market, but thereafter the analysis of market shares and concentration will be carried out with respect to the DAFM export-approved processors.

Section 3 Characteristics of the Relevant Market
PMCA Economic Consulting Page 37
3 Characteristics of the Relevant Market
3.1 Introduction This section presents the results of PMCA’s analyses of the objective features of the relevant markets defined, pre-transaction. The aim is to arrive at an independent and evidence-based assessment of the extent of competition presently in the relevant market, from which we will then proceed to assess the competitive effects of the proposed transaction in Section 4.
By way of background and context, we begin by considering two critically important issues for farmers – farm incomes and prices for cattle and sheep. Prices and incomes are interrelated and provide information on farmers’ returns as the primary producers of the critical inputs to the beef and lamb supply chains in the State. The IFA and farmers believe that the low incomes and prices in cattle finishing and sheep farming are a function of a lack of competition in the relevant procurement markets for cattle and sheep for slaughter in the State, and that the proposed transaction would serve to exacerbate the problem for farmers, in turn threatening the sustainability of the respective supply chains by making it even less attractive for farmers to produce/finish the critical input in each case.
During the hustings in the lead up to the recent election of the new IFA President, farm incomes emerged as the number one issue confronting farmers and their families across the country, and the newly elected President, Mr. Joe Healy, has made this his number one priority during his term of office.
In what follows, we examine publicly available and independent data on farm incomes and prices, which can be considered as ‘performance metrics’ in respect of the relevant market. They are in turn determined by structural features of the relevant market and by the conduct of meat processors, which are analysed in Sub-Sections 3.3-3.10. Then in Sub-Section 3.11 we draw together the strands of the analyses conducted to come to an overall, independent view regarding the level of competition in the relevant market, where the focus is on those markets mattering most to farmers and the IFA, namely the cattle and sheep procurement markets in the State.
3.2 Farm Incomes and Prices
3.2.1 Farm Incomes
Teagasc is the agriculture and food development authority in the State. Its “mission is to support science-based innovation in the agri-food sector and the broader bio-economy that will underpin profitability, competitiveness and sustainability”.48
Annual data on farm incomes are available from the Teagasc National Farm Survey (NFS), the latest results of which are for the year 2014 (at the time of preparing this report in April 2016). The NFS is based on a random, nationally representative sample of approximately 1,000 farms collected by a team of data recorders from the organisation. The NFS breaks cattle farm systems into “cattle rearing” farms and “cattle other” farms. The latter are mainly specialised in finishing animals for slaughter, while the former are suckler farms. Along with sheep farms, cattle other/finishing farms, as we will refer to them here, are the two most relevant farm systems in the context of this report.
Over the years, the NFS consistently shows the relatively low levels of income on cattle other/finishing farms and sheep farms, and also on cattle rearing/suckler farms, to which we also have regard.
48 This information on Teagasc is reproduced from the organisation’s website (http://www.teagasc.ie/).
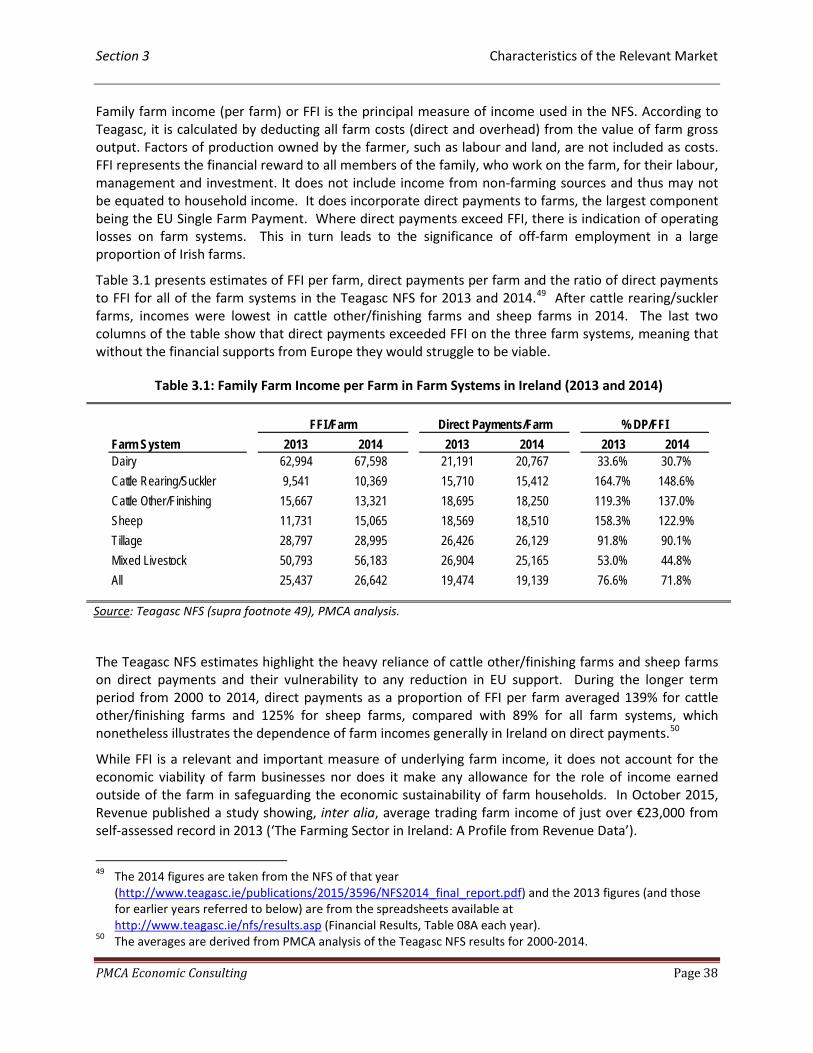
Section 3 Characteristics of the Relevant Market
PMCA Economic Consulting Page 38
Family farm income (per farm) or FFI is the principal measure of income used in the NFS. According to Teagasc, it is calculated by deducting all farm costs (direct and overhead) from the value of farm gross output. Factors of production owned by the farmer, such as labour and land, are not included as costs. FFI represents the financial reward to all members of the family, who work on the farm, for their labour, management and investment. It does not include income from non-farming sources and thus may not be equated to household income. It does incorporate direct payments to farms, the largest component being the EU Single Farm Payment. Where direct payments exceed FFI, there is indication of operating losses on farm systems. This in turn leads to the significance of off-farm employment in a large proportion of Irish farms.
Table 3.1 presents estimates of FFI per farm, direct payments per farm and the ratio of direct payments to FFI for all of the farm systems in the Teagasc NFS for 2013 and 2014.49 After cattle rearing/suckler farms, incomes were lowest in cattle other/finishing farms and sheep farms in 2014. The last two columns of the table show that direct payments exceeded FFI on the three farm systems, meaning that without the financial supports from Europe they would struggle to be viable.
Table 3.1: Family Farm Income per Farm in Farm Systems in Ireland (2013 and 2014)
Source: Teagasc NFS (supra footnote 49), PMCA analysis.
The Teagasc NFS estimates highlight the heavy reliance of cattle other/finishing farms and sheep farms on direct payments and their vulnerability to any reduction in EU support. During the longer term period from 2000 to 2014, direct payments as a proportion of FFI per farm averaged 139% for cattle other/finishing farms and 125% for sheep farms, compared with 89% for all farm systems, which nonetheless illustrates the dependence of farm incomes generally in Ireland on direct payments.50
While FFI is a relevant and important measure of underlying farm income, it does not account for the economic viability of farm businesses nor does it make any allowance for the role of income earned outside of the farm in safeguarding the economic sustainability of farm households. In October 2015, Revenue published a study showing, inter alia, average trading farm income of just over €23,000 from self-assessed record in 2013 (‘The Farming Sector in Ireland: A Profile from Revenue Data’).
49 The 2014 figures are taken from the NFS of that year
(http://www.teagasc.ie/publications/2015/3596/NFS2014_final_report.pdf) and the 2013 figures (and those for earlier years referred to below) are from the spreadsheets available at http://www.teagasc.ie/nfs/results.asp (Financial Results, Table 08A each year).
50 The averages are derived from PMCA analysis of the Teagasc NFS results for 2000-2014.
Farm System 2013 2014 2013 2014 2013 2014Dairy 62,994 67,598 21,191 20,767 33.6% 30.7%Cattle Rearing/Suckler 9,541 10,369 15,710 15,412 164.7% 148.6%Cattle Other/Finishing 15,667 13,321 18,695 18,250 119.3% 137.0%Sheep 11,731 15,065 18,569 18,510 158.3% 122.9%Tillage 28,797 28,995 26,426 26,129 91.8% 90.1%Mixed Livestock 50,793 56,183 26,904 25,165 53.0% 44.8%All 25,437 26,642 19,474 19,139 76.6% 71.8%
FFI/Farm Direct Payments/Farm % DP/FFI
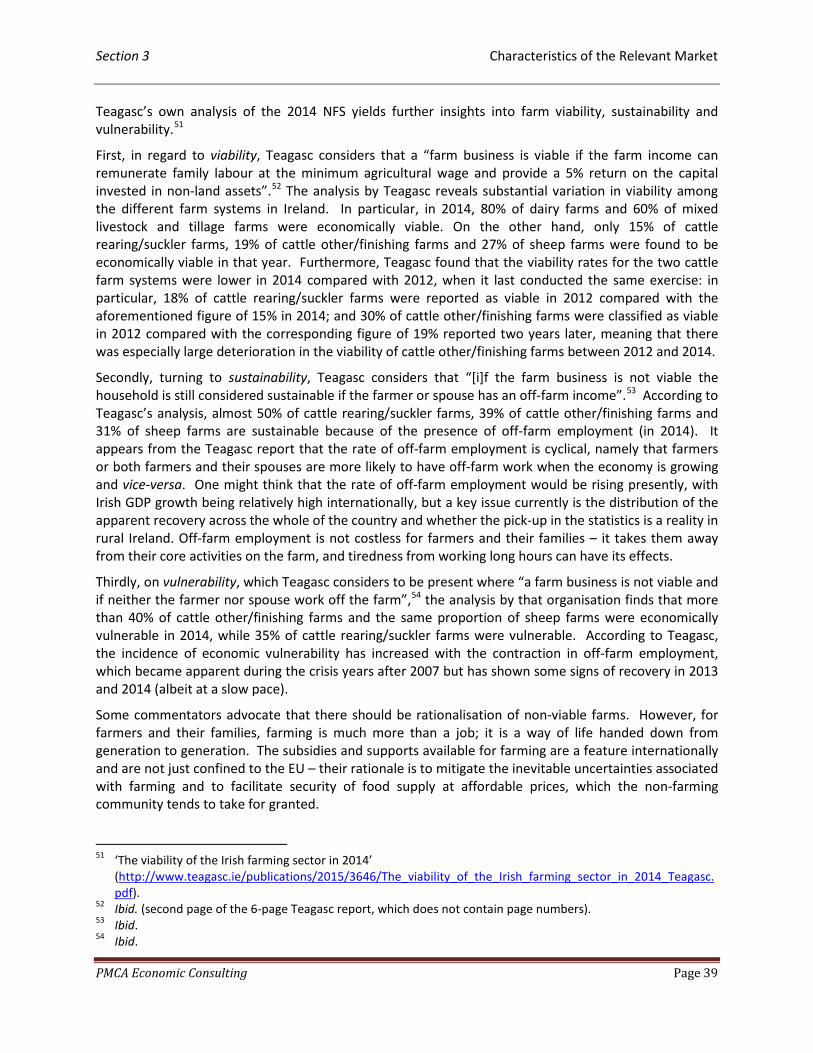
Section 3 Characteristics of the Relevant Market
PMCA Economic Consulting Page 39
Teagasc’s own analysis of the 2014 NFS yields further insights into farm viability, sustainability and vulnerability.51
First, in regard to viability, Teagasc considers that a “farm business is viable if the farm income can remunerate family labour at the minimum agricultural wage and provide a 5% return on the capital invested in non-land assets”.52 The analysis by Teagasc reveals substantial variation in viability among the different farm systems in Ireland. In particular, in 2014, 80% of dairy farms and 60% of mixed livestock and tillage farms were economically viable. On the other hand, only 15% of cattle rearing/suckler farms, 19% of cattle other/finishing farms and 27% of sheep farms were found to be economically viable in that year. Furthermore, Teagasc found that the viability rates for the two cattle farm systems were lower in 2014 compared with 2012, when it last conducted the same exercise: in particular, 18% of cattle rearing/suckler farms were reported as viable in 2012 compared with the aforementioned figure of 15% in 2014; and 30% of cattle other/finishing farms were classified as viable in 2012 compared with the corresponding figure of 19% reported two years later, meaning that there was especially large deterioration in the viability of cattle other/finishing farms between 2012 and 2014.
Secondly, turning to sustainability, Teagasc considers that “[i]f the farm business is not viable the household is still considered sustainable if the farmer or spouse has an off-farm income”.53 According to Teagasc’s analysis, almost 50% of cattle rearing/suckler farms, 39% of cattle other/finishing farms and 31% of sheep farms are sustainable because of the presence of off-farm employment (in 2014). It appears from the Teagasc report that the rate of off-farm employment is cyclical, namely that farmers or both farmers and their spouses are more likely to have off-farm work when the economy is growing and vice-versa. One might think that the rate of off-farm employment would be rising presently, with Irish GDP growth being relatively high internationally, but a key issue currently is the distribution of the apparent recovery across the whole of the country and whether the pick-up in the statistics is a reality in rural Ireland. Off-farm employment is not costless for farmers and their families – it takes them away from their core activities on the farm, and tiredness from working long hours can have its effects.
Thirdly, on vulnerability, which Teagasc considers to be present where “a farm business is not viable and if neither the farmer nor spouse work off the farm”,54 the analysis by that organisation finds that more than 40% of cattle other/finishing farms and the same proportion of sheep farms were economically vulnerable in 2014, while 35% of cattle rearing/suckler farms were vulnerable. According to Teagasc, the incidence of economic vulnerability has increased with the contraction in off-farm employment, which became apparent during the crisis years after 2007 but has shown some signs of recovery in 2013 and 2014 (albeit at a slow pace).
Some commentators advocate that there should be rationalisation of non-viable farms. However, for farmers and their families, farming is much more than a job; it is a way of life handed down from generation to generation. The subsidies and supports available for farming are a feature internationally and are not just confined to the EU – their rationale is to mitigate the inevitable uncertainties associated with farming and to facilitate security of food supply at affordable prices, which the non-farming community tends to take for granted.
51 ‘The viability of the Irish farming sector in 2014’
(http://www.teagasc.ie/publications/2015/3646/The_viability_of_the_Irish_farming_sector_in_2014_Teagasc.pdf).
52 Ibid. (second page of the 6-page Teagasc report, which does not contain page numbers). 53 Ibid. 54 Ibid.

Section 3 Characteristics of the Relevant Market
PMCA Economic Consulting Page 40
The IFA has identified that the overarching target for the drystock sector is to improve the viability of cattle and sheep farms, through strong direct payment support and viable beef prices for producers/farmers.
Other analysis carried out by Teagasc suggests that a price of €4-€4.50/kg DW is required to deliver a sustainable return for beef farm enterprises. As outlined in an article in the Irish Farmers Journal (‘Farmers need €4/kg for beef – Teagasc’, 19 June 2014):
“Farmers need a price of €4/kg to deliver a viable margin from suckler beef production. To safeguard the long-term viability of the sector from rising input prices and the impacts of weather volatility, a beef price of €4.50/kg is required.”
“The Teagasc analysis showed that, at a price of €3.50/kg, even the most efficient production systems would not be in a position to cover the costs of production.”55
As mentioned earlier, the IFA and farmers support more competition in the Irish beef sector. Their aim is to ensure fairer prices for cattle from processors in order to ensure the sustainability of the supply chain and this is also the objective of sheep farmers. The IFA and farmers (cattle and sheep) hold the view that greater competition in the respective markets will help to deliver their goals.
Finally, to give some wider perspective to the Teagasc estimates of farm incomes reported in Table 3.1 above, average industrial earnings were €44,167 in 2014, which were 3.3 times the size of the average income on cattle other/finishing farms, 2.9 that in sheep farms and 1.7 that in all farm systems.56 In the same year, and from the same source, average public sector earnings were €47,862, which were 3.6 times the magnitude of the average FFI/farm on cattle finishing farms and 3.2 that on sheep farms.
3.2.2 Cattle Prices
3.2.2.1 Patterns in Annual Cattle Price Series in Ireland and the UK
The joint statement issued by the parties (ABP and Slaney/Fane Valley) on 9 March 2016 regarding the proposed transaction included the information that (emboldened text reproduced here):
“In the period 2010 to 2015 Irish Cattle prices (Steers and Heifers) have increased by 37% (Bord Bia).”57
This statement is correct. Independent analysis of the Bord Bia cattle price data conducted by PMCA shows that steers prices grew on average by 36.9% between 2010 and 2015 and that heifers prices rose by 38% during the period on average. On average, steers and heifers prices increased by 37.5% (38% rounded) during the period (slightly more than the 37% figure in the parties’ joint statement). However, the figure of 37.5% is based on the unweighted average of the specific steers and heifers prices in 2010 and 2015. Analysis of Bord Bia throughput data shows that 60% of all steers and heifers slaughtered in 2010 were steers and 40% were heifers, and that the same proportions applied in 2015. Applying these shares gives the weighted average prices in 2010 and 2015, from which the slightly lower rate of growth (37.3% or 37% rounded) derives. A summary of the PMCA calculations is given in Table 3.2 below.
55 The article is available at http://www.farmersjournal.ie/farmers-need-4-kg-for-beef-teagasc-159332. 56 The CSO information on average industrial earnings, a commonly used barometer of the average wage in
Ireland, pertains to total wages and salaries for industry (NACE B-E) (i.e. includes overtime). 57 Supra footnote 10 (p. 3 of the present report).
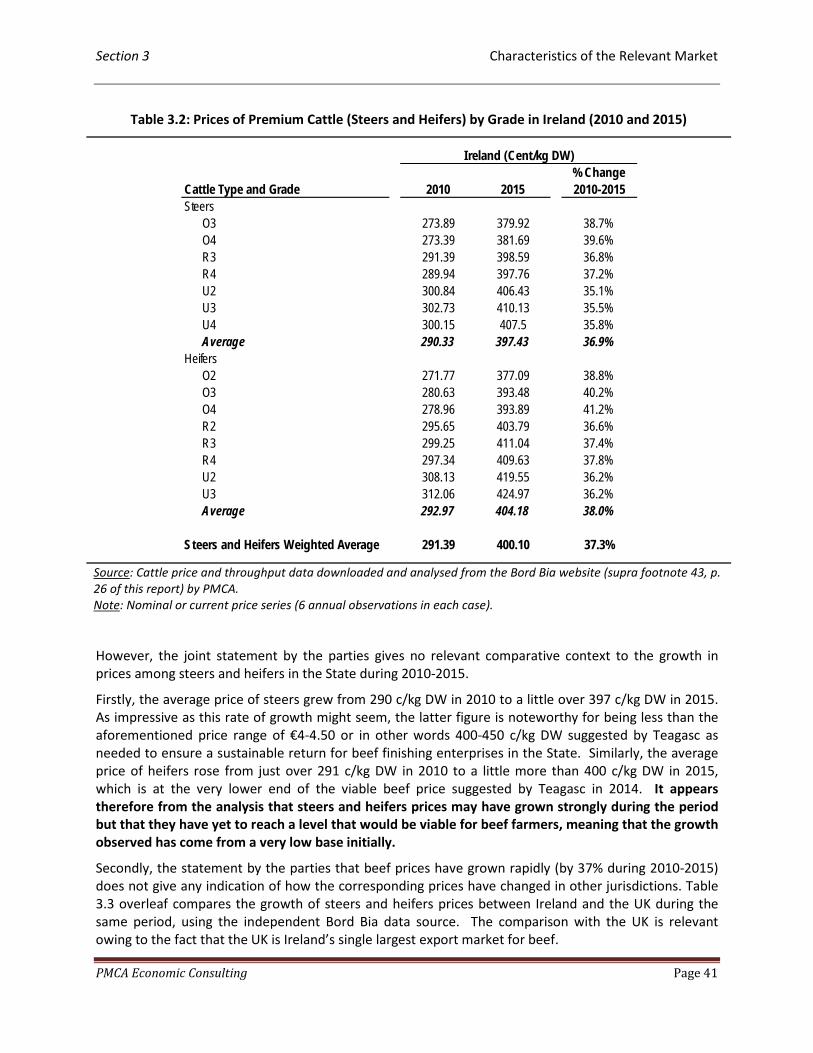
Section 3 Characteristics of the Relevant Market
PMCA Economic Consulting Page 41
Table 3.2: Prices of Premium Cattle (Steers and Heifers) by Grade in Ireland (2010 and 2015)
Source: Cattle price and throughput data downloaded and analysed from the Bord Bia website (supra footnote 43, p. 26 of this report) by PMCA. Note: Nominal or current price series (6 annual observations in each case).
However, the joint statement by the parties gives no relevant comparative context to the growth in prices among steers and heifers in the State during 2010-2015.
Firstly, the average price of steers grew from 290 c/kg DW in 2010 to a little over 397 c/kg DW in 2015. As impressive as this rate of growth might seem, the latter figure is noteworthy for being less than the aforementioned price range of €4-4.50 or in other words 400-450 c/kg DW suggested by Teagasc as needed to ensure a sustainable return for beef finishing enterprises in the State. Similarly, the average price of heifers rose from just over 291 c/kg DW in 2010 to a little more than 400 c/kg DW in 2015, which is at the very lower end of the viable beef price suggested by Teagasc in 2014. It appears therefore from the analysis that steers and heifers prices may have grown strongly during the period but that they have yet to reach a level that would be viable for beef farmers, meaning that the growth observed has come from a very low base initially.
Secondly, the statement by the parties that beef prices have grown rapidly (by 37% during 2010-2015) does not give any indication of how the corresponding prices have changed in other jurisdictions. Table 3.3 overleaf compares the growth of steers and heifers prices between Ireland and the UK during the same period, using the independent Bord Bia data source. The comparison with the UK is relevant owing to the fact that the UK is Ireland’s single largest export market for beef.
Cattle Type and Grade 2010 2015% Change 2010-2015
SteersO3 273.89 379.92 38.7%O4 273.39 381.69 39.6%R3 291.39 398.59 36.8%R4 289.94 397.76 37.2%U2 300.84 406.43 35.1%U3 302.73 410.13 35.5%U4 300.15 407.5 35.8%Average 290.33 397.43 36.9%
HeifersO2 271.77 377.09 38.8%O3 280.63 393.48 40.2%O4 278.96 393.89 41.2%R2 295.65 403.79 36.6%R3 299.25 411.04 37.4%R4 297.34 409.63 37.8%U2 308.13 419.55 36.2%U3 312.06 424.97 36.2%Average 292.97 404.18 38.0%
Steers and Heifers Weighted Average 291.39 400.10 37.3%
Ireland (Cent/kg DW)
Section 3 Characteristics of the Relevant Market
PMCA Economic Consulting Page 42
Examination of the figures tabulated below reveals that prices have been higher in the UK than in Ireland for every type and grade of premium cattle (the minus signs on the numbers in the second and third columns of Table 3.3 show the gap against Ireland in each and every case). The analysis also illustrates that the gap against Ireland has widened substantially in 2015 compared with 2010 – for example, in the ‘representative’ category of steers R3, Irish prices were lower than UK prices by 23 cent/kg DW in 2010, which grew to 82 cent/kg DW in 2015. In addition, it is also seen from the final two columns of the table that the gap in favour of the UK has been larger in the higher grades of steers and heifers (that is, as we move from the O to the R and the U grades in each case).
On average, the gap among steers and heifers prices between Ireland and the UK grew substantially from 19.81 c/kg DW in 2010 to 73.13 c/kg DW in 2015 or by over 260% proportionately, which far exceeded the rate at which sterling appreciated against the euro during the period (18%).58
Table 3.3: Prices of Premium Cattle (Steers and Heifers) by Grade in Ireland and the UK (2010 and 2015)
Source: Cattle price data downloaded and analysed from the Bord Bia website (supra footnote 43, p. 26) by PMCA. Note: Nominal or current price series (6 annual observations in each case). During the period, sterling appreciated against the euro by 18% (based on Central Bank of Ireland data obtained by PMCA).
58 Without loss of generality, the analysis of the price gaps between Ireland and the UK reported here and
subsequently in the following paragraphs are based on simple/unweighted averages, where it is noted that the Bord Bia information does not include throughput data on specific grades of premium cattle (e.g. steers R3, heifers U2 etc.) or other types of cattle, which otherwise would permit weighted averages to be calculated.
Cattle Type and Grade 2010 2015
Absolute (Cent/kg
DW) %Steers
O3 -25.81 -71.25 -45.44 176.1%O4 -31.97 -81.09 -49.12 153.6%R3 -23.37 -82.19 -58.82 251.7%R4 -27.5 -87.16 -59.66 216.9%U2 -18.69 -83.43 -64.74 346.4%U3 -19.04 -81.15 -62.11 326.2%U4 -20.1 -80.88 -60.78 302.4%Average -23.78 -81.02 -57.24 240.7%
HeifersO2 -17.26 -47.03 -29.77 172.5%O3 -17.16 -57.21 -40.05 233.4%O4 -24.61 -68.97 -44.36 180.3%R2 -15.7 -69.82 -54.12 344.7%R3 -15.22 -70.26 -55.04 361.6%R4 -17.11 -71.99 -54.88 320.7%U2 -12.37 -72.83 -60.46 488.8%U3 -11.27 -71.64 -60.37 535.7%Average -16.34 -66.22 -49.88 305.3%
Steers and Heifers Average -19.81 -73.13 -53.31 269.1%
Ireland minus UK (Cent/kg DW)Change 2010-2015
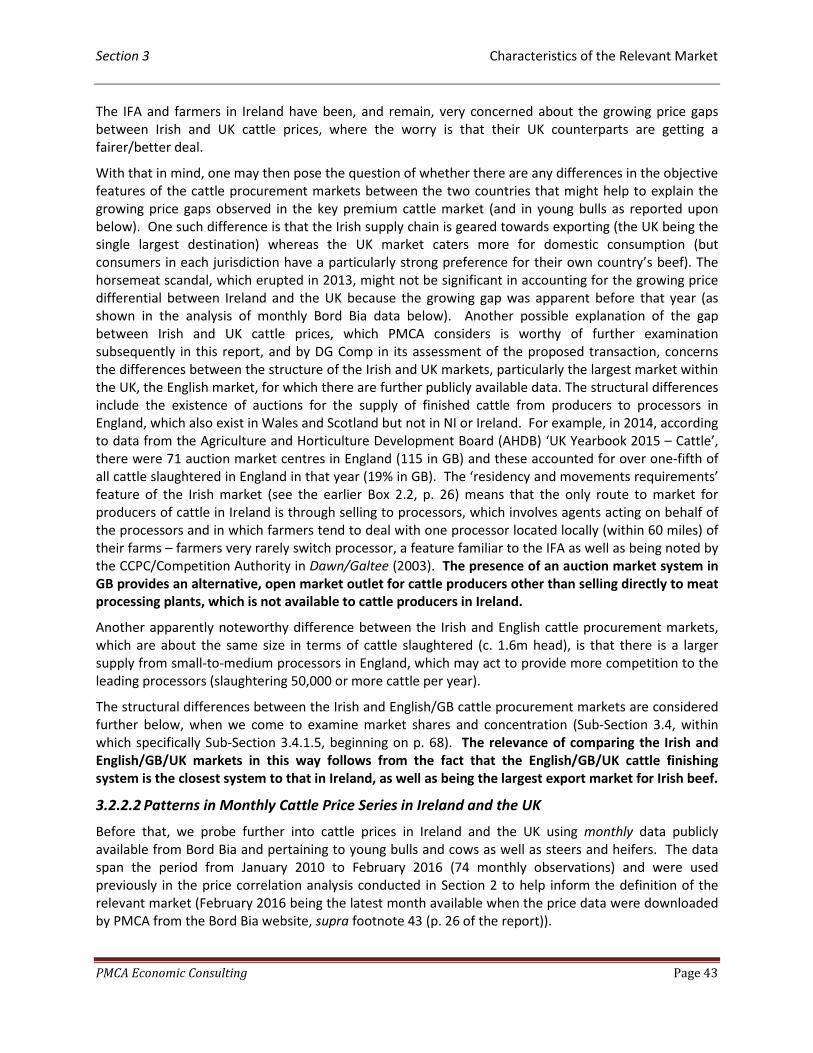
Section 3 Characteristics of the Relevant Market
PMCA Economic Consulting Page 43
The IFA and farmers in Ireland have been, and remain, very concerned about the growing price gaps between Irish and UK cattle prices, where the worry is that their UK counterparts are getting a fairer/better deal.
With that in mind, one may then pose the question of whether there are any differences in the objective features of the cattle procurement markets between the two countries that might help to explain the growing price gaps observed in the key premium cattle market (and in young bulls as reported upon below). One such difference is that the Irish supply chain is geared towards exporting (the UK being the single largest destination) whereas the UK market caters more for domestic consumption (but consumers in each jurisdiction have a particularly strong preference for their own country’s beef). The horsemeat scandal, which erupted in 2013, might not be significant in accounting for the growing price differential between Ireland and the UK because the growing gap was apparent before that year (as shown in the analysis of monthly Bord Bia data below). Another possible explanation of the gap between Irish and UK cattle prices, which PMCA considers is worthy of further examination subsequently in this report, and by DG Comp in its assessment of the proposed transaction, concerns the differences between the structure of the Irish and UK markets, particularly the largest market within the UK, the English market, for which there are further publicly available data. The structural differences include the existence of auctions for the supply of finished cattle from producers to processors in England, which also exist in Wales and Scotland but not in NI or Ireland. For example, in 2014, according to data from the Agriculture and Horticulture Development Board (AHDB) ‘UK Yearbook 2015 – Cattle’, there were 71 auction market centres in England (115 in GB) and these accounted for over one-fifth of all cattle slaughtered in England in that year (19% in GB). The ‘residency and movements requirements’ feature of the Irish market (see the earlier Box 2.2, p. 26) means that the only route to market for producers of cattle in Ireland is through selling to processors, which involves agents acting on behalf of the processors and in which farmers tend to deal with one processor located locally (within 60 miles) of their farms – farmers very rarely switch processor, a feature familiar to the IFA as well as being noted by the CCPC/Competition Authority in Dawn/Galtee (2003). The presence of an auction market system in GB provides an alternative, open market outlet for cattle producers other than selling directly to meat processing plants, which is not available to cattle producers in Ireland.
Another apparently noteworthy difference between the Irish and English cattle procurement markets, which are about the same size in terms of cattle slaughtered (c. 1.6m head), is that there is a larger supply from small-to-medium processors in England, which may act to provide more competition to the leading processors (slaughtering 50,000 or more cattle per year).
The structural differences between the Irish and English/GB cattle procurement markets are considered further below, when we come to examine market shares and concentration (Sub-Section 3.4, within which specifically Sub-Section 3.4.1.5, beginning on p. 68). The relevance of comparing the Irish and English/GB/UK markets in this way follows from the fact that the English/GB/UK cattle finishing system is the closest system to that in Ireland, as well as being the largest export market for Irish beef.
3.2.2.2 Patterns in Monthly Cattle Price Series in Ireland and the UK
Before that, we probe further into cattle prices in Ireland and the UK using monthly data publicly available from Bord Bia and pertaining to young bulls and cows as well as steers and heifers. The data span the period from January 2010 to February 2016 (74 monthly observations) and were used previously in the price correlation analysis conducted in Section 2 to help inform the definition of the relevant market (February 2016 being the latest month available when the price data were downloaded by PMCA from the Bord Bia website, supra footnote 43 (p. 26 of the report)).
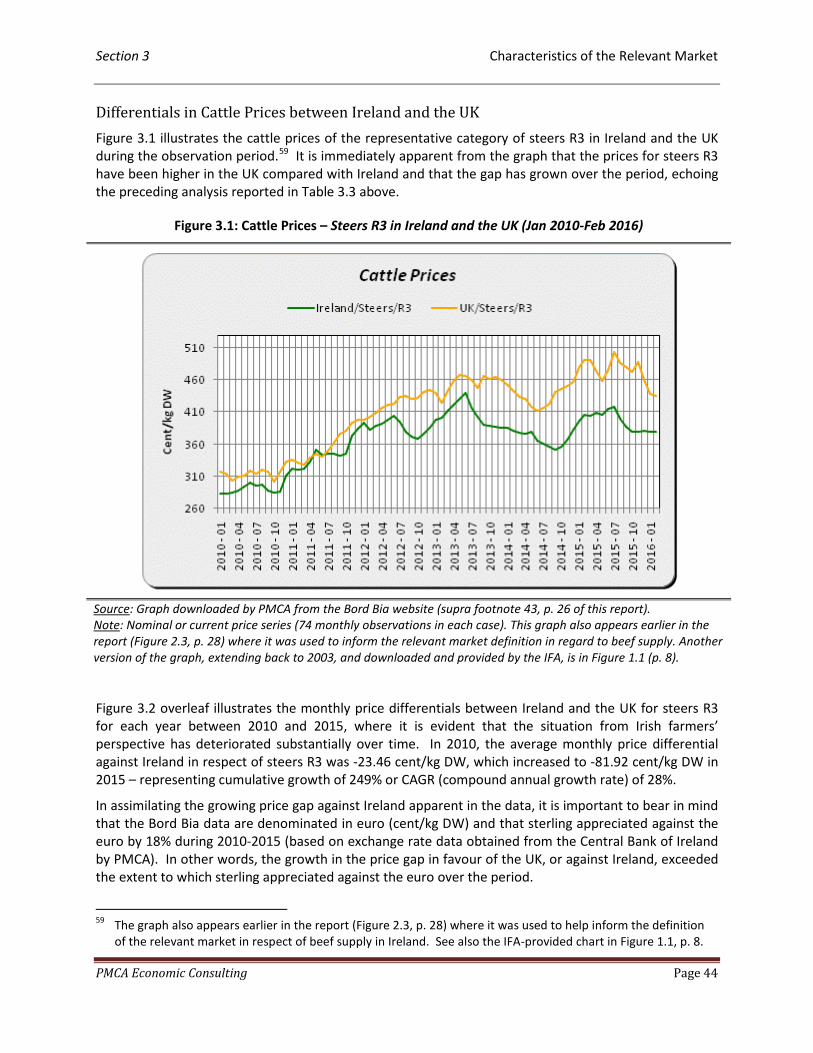
Section 3 Characteristics of the Relevant Market
PMCA Economic Consulting Page 44
Differentials in Cattle Prices between Ireland and the UK Figure 3.1 illustrates the cattle prices of the representative category of steers R3 in Ireland and the UK during the observation period.59 It is immediately apparent from the graph that the prices for steers R3 have been higher in the UK compared with Ireland and that the gap has grown over the period, echoing the preceding analysis reported in Table 3.3 above.
Figure 3.1: Cattle Prices – Steers R3 in Ireland and the UK (Jan 2010-Feb 2016)
Source: Graph downloaded by PMCA from the Bord Bia website (supra footnote 43, p. 26 of this report). Note: Nominal or current price series (74 monthly observations in each case). This graph also appears earlier in the report (Figure 2.3, p. 28) where it was used to inform the relevant market definition in regard to beef supply. Another version of the graph, extending back to 2003, and downloaded and provided by the IFA, is in Figure 1.1 (p. 8).
Figure 3.2 overleaf illustrates the monthly price differentials between Ireland and the UK for steers R3 for each year between 2010 and 2015, where it is evident that the situation from Irish farmers’ perspective has deteriorated substantially over time. In 2010, the average monthly price differential against Ireland in respect of steers R3 was -23.46 cent/kg DW, which increased to -81.92 cent/kg DW in 2015 – representing cumulative growth of 249% or CAGR (compound annual growth rate) of 28%.
In assimilating the growing price gap against Ireland apparent in the data, it is important to bear in mind that the Bord Bia data are denominated in euro (cent/kg DW) and that sterling appreciated against the euro by 18% during 2010-2015 (based on exchange rate data obtained from the Central Bank of Ireland by PMCA). In other words, the growth in the price gap in favour of the UK, or against Ireland, exceeded the extent to which sterling appreciated against the euro over the period.
59 The graph also appears earlier in the report (Figure 2.3, p. 28) where it was used to help inform the definition
of the relevant market in respect of beef supply in Ireland. See also the IFA-provided chart in Figure 1.1, p. 8.
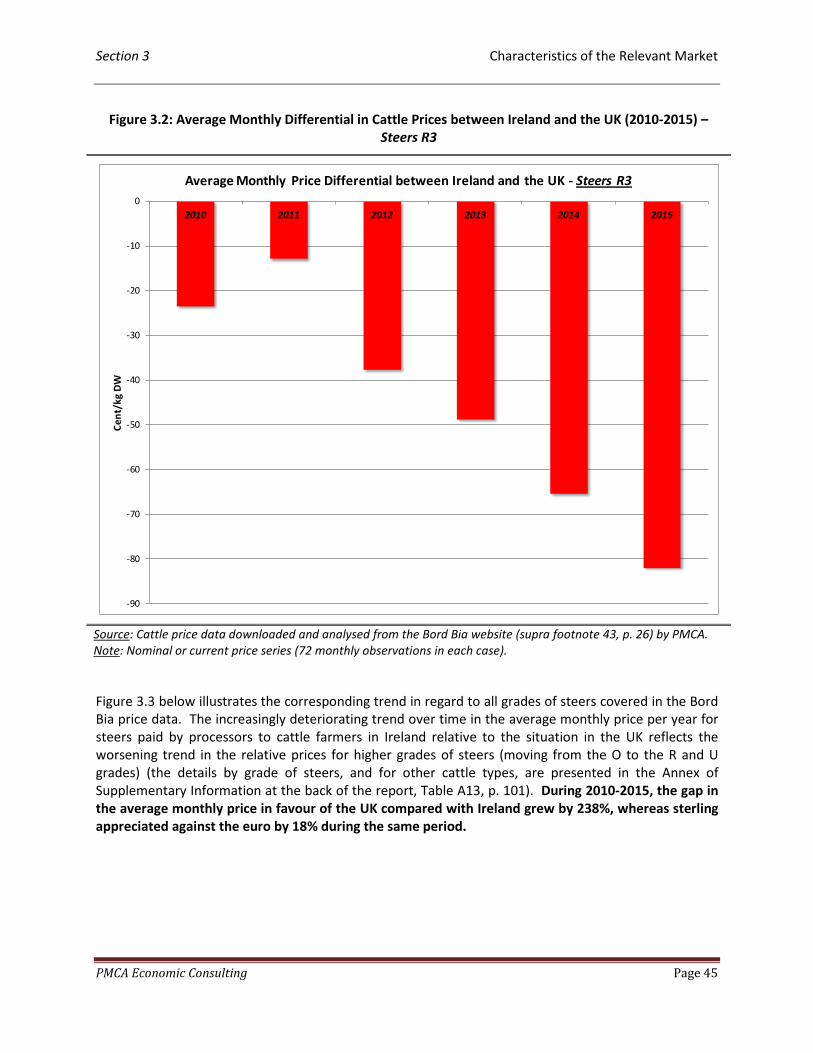
Section 3 Characteristics of the Relevant Market
PMCA Economic Consulting Page 45
Figure 3.2: Average Monthly Differential in Cattle Prices between Ireland and the UK (2010-2015) – Steers R3
Source: Cattle price data downloaded and analysed from the Bord Bia website (supra footnote 43, p. 26) by PMCA. Note: Nominal or current price series (72 monthly observations in each case).
Figure 3.3 below illustrates the corresponding trend in regard to all grades of steers covered in the Bord Bia price data. The increasingly deteriorating trend over time in the average monthly price per year for steers paid by processors to cattle farmers in Ireland relative to the situation in the UK reflects the worsening trend in the relative prices for higher grades of steers (moving from the O to the R and U grades) (the details by grade of steers, and for other cattle types, are presented in the Annex of Supplementary Information at the back of the report, Table A13, p. 101). During 2010-2015, the gap in the average monthly price in favour of the UK compared with Ireland grew by 238%, whereas sterling appreciated against the euro by 18% during the same period.
-90
-80
-70
-60
-50
-40
-30
-20
-10
02010 2011 2012 2013 2014 2015
Cent
/kg
DW
Average Monthly Price Differential between Ireland and the UK - Steers R3
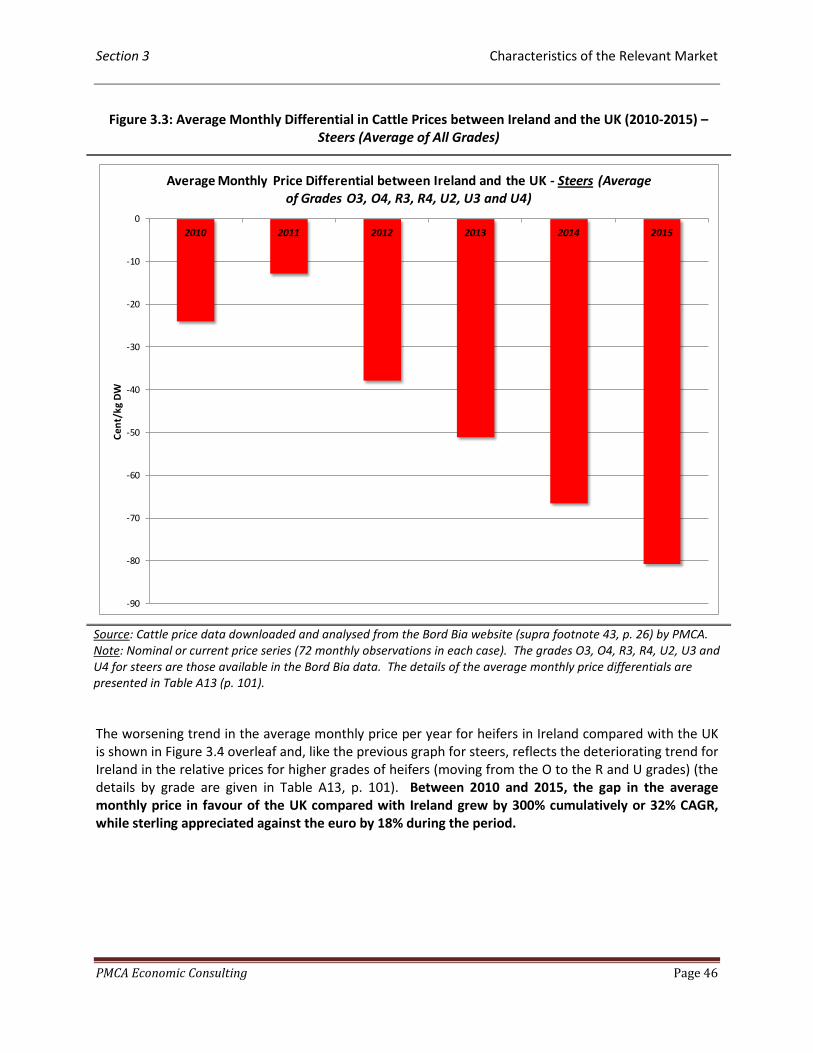
Section 3 Characteristics of the Relevant Market
PMCA Economic Consulting Page 46
Figure 3.3: Average Monthly Differential in Cattle Prices between Ireland and the UK (2010-2015) – Steers (Average of All Grades)
Source: Cattle price data downloaded and analysed from the Bord Bia website (supra footnote 43, p. 26) by PMCA. Note: Nominal or current price series (72 monthly observations in each case). The grades O3, O4, R3, R4, U2, U3 and U4 for steers are those available in the Bord Bia data. The details of the average monthly price differentials are presented in Table A13 (p. 101).
The worsening trend in the average monthly price per year for heifers in Ireland compared with the UK is shown in Figure 3.4 overleaf and, like the previous graph for steers, reflects the deteriorating trend for Ireland in the relative prices for higher grades of heifers (moving from the O to the R and U grades) (the details by grade are given in Table A13, p. 101). Between 2010 and 2015, the gap in the average monthly price in favour of the UK compared with Ireland grew by 300% cumulatively or 32% CAGR, while sterling appreciated against the euro by 18% during the period.
-90
-80
-70
-60
-50
-40
-30
-20
-10
02010 2011 2012 2013 2014 2015
Cent
/kg
DW
Average Monthly Price Differential between Ireland and the UK - Steers (Average of Grades O3, O4, R3, R4, U2, U3 and U4)
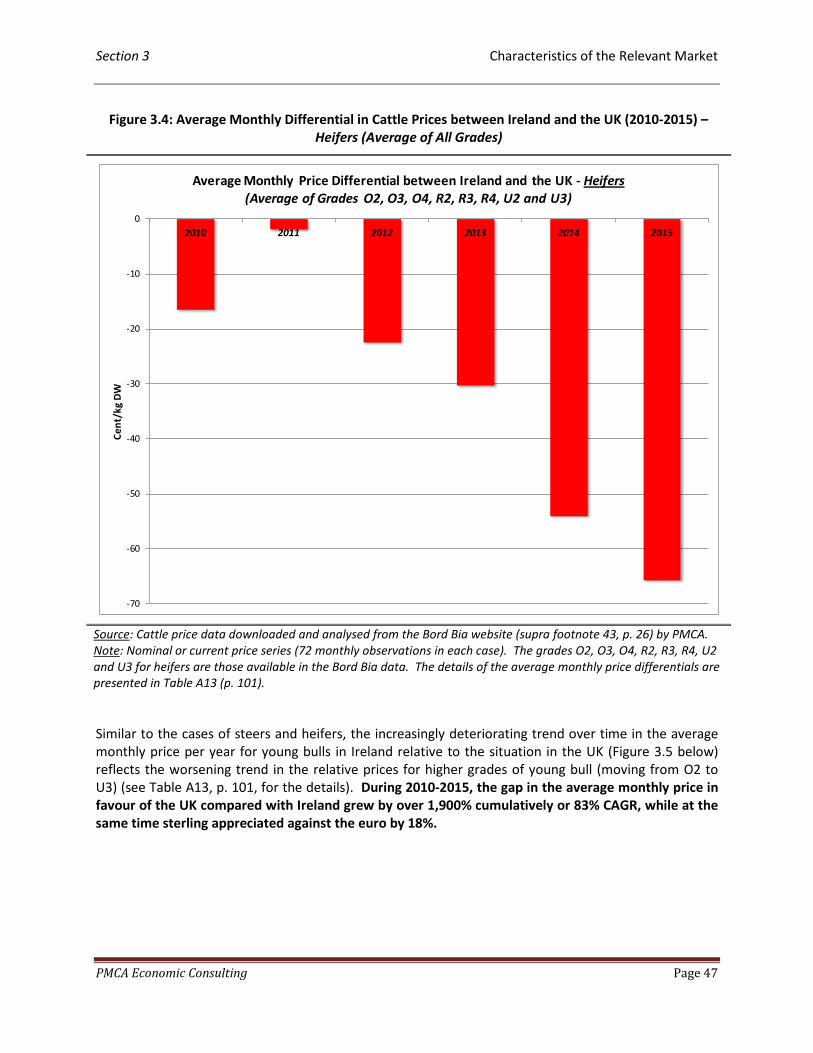
Section 3 Characteristics of the Relevant Market
PMCA Economic Consulting Page 47
Figure 3.4: Average Monthly Differential in Cattle Prices between Ireland and the UK (2010-2015) – Heifers (Average of All Grades)
Source: Cattle price data downloaded and analysed from the Bord Bia website (supra footnote 43, p. 26) by PMCA. Note: Nominal or current price series (72 monthly observations in each case). The grades O2, O3, O4, R2, R3, R4, U2 and U3 for heifers are those available in the Bord Bia data. The details of the average monthly price differentials are presented in Table A13 (p. 101).
Similar to the cases of steers and heifers, the increasingly deteriorating trend over time in the average monthly price per year for young bulls in Ireland relative to the situation in the UK (Figure 3.5 below) reflects the worsening trend in the relative prices for higher grades of young bull (moving from O2 to U3) (see Table A13, p. 101, for the details). During 2010-2015, the gap in the average monthly price in favour of the UK compared with Ireland grew by over 1,900% cumulatively or 83% CAGR, while at the same time sterling appreciated against the euro by 18%.
-70
-60
-50
-40
-30
-20
-10
02010 2011 2012 2013 2014 2015
Cent
/kg
DW
Average Monthly Price Differential between Ireland and the UK - Heifers (Average of Grades O2, O3, O4, R2, R3, R4, U2 and U3)

Section 3 Characteristics of the Relevant Market
PMCA Economic Consulting Page 48
Figure 3.5: Average Monthly Differential in Cattle Prices between Ireland and the UK (2010-2015) – Young Bulls (Average of All Grades)
Source: Cattle price data downloaded and analysed from the Bord Bia website (supra footnote 43, p. 26) by PMCA. Note: Nominal or current price series (72 monthly observations in each case). The grades O2, O3, R2, R3, U2 and U3 for young bulls are those available in the Bord Bia data. The details of the average monthly price differentials are presented in Table A13 (p. 101).
The exception to the three previous cases – steers (Figure 3.3), heifers (Figure 3.4) and young bulls (Figure 3.5) (together making up prime cattle) – are cows, where it is seen in Figure 3.6 below that the average monthly price per year has been greater in Ireland compared with the UK. The reversed price in this case reflects the fact that cows are a devalued form of cattle in the UK (following the BSE crisis in that country from the early 1990s).60 However, it is also apparent from the chart overleaf that the gap in favour of Ireland has been shrinking. Further, reference to the detailed table underpinning Figure 3.6 (namely Table A13, p. 101) shows that the highest grades of cows tracked in the Bord Bia data (namely R3 and R4) commanded higher prices in the UK than in Ireland in 2014 and 2015, in turn suggesting that the highest grades of this type of cattle may be recovering for beef supply in that country (but demand from processors in the UK is directed towards premium cattle, heifers and steers).
60 BSE is short for bovine spongiform encephalopathy (‘mad cow disease’).
-60
-50
-40
-30
-20
-10
0
10
2010 2011 2012 2013 2014
Cent
/kg
DW
Average Monthly Price Differential between Ireland and the UK - Young Bulls (Average of Grades O2, O3, R2, R3, U2 and U3)
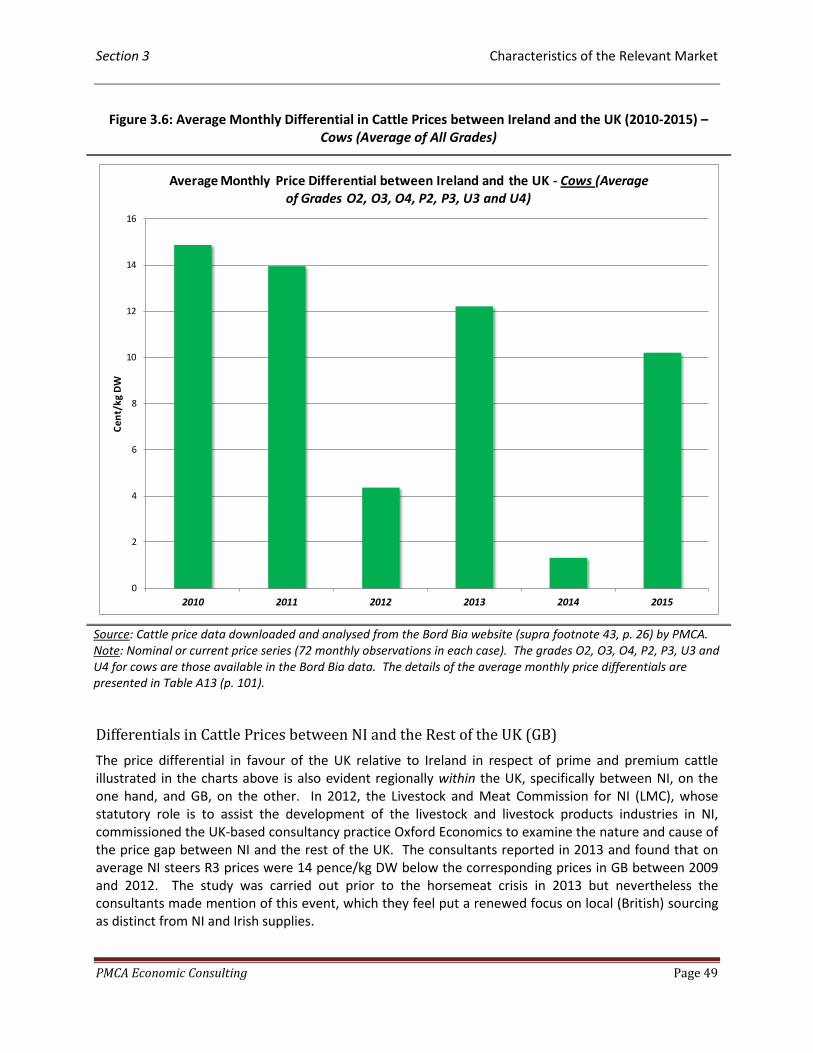
Section 3 Characteristics of the Relevant Market
PMCA Economic Consulting Page 49
Figure 3.6: Average Monthly Differential in Cattle Prices between Ireland and the UK (2010-2015) – Cows (Average of All Grades)
Source: Cattle price data downloaded and analysed from the Bord Bia website (supra footnote 43, p. 26) by PMCA. Note: Nominal or current price series (72 monthly observations in each case). The grades O2, O3, O4, P2, P3, U3 and U4 for cows are those available in the Bord Bia data. The details of the average monthly price differentials are presented in Table A13 (p. 101).
Differentials in Cattle Prices between NI and the Rest of the UK (GB) The price differential in favour of the UK relative to Ireland in respect of prime and premium cattle illustrated in the charts above is also evident regionally within the UK, specifically between NI, on the one hand, and GB, on the other. In 2012, the Livestock and Meat Commission for NI (LMC), whose statutory role is to assist the development of the livestock and livestock products industries in NI, commissioned the UK-based consultancy practice Oxford Economics to examine the nature and cause of the price gap between NI and the rest of the UK. The consultants reported in 2013 and found that on average NI steers R3 prices were 14 pence/kg DW below the corresponding prices in GB between 2009 and 2012. The study was carried out prior to the horsemeat crisis in 2013 but nevertheless the consultants made mention of this event, which they feel put a renewed focus on local (British) sourcing as distinct from NI and Irish supplies.
0
2
4
6
8
10
12
14
16
2010 2011 2012 2013 2014 2015
Cent
/kg
DW
Average Monthly Price Differential between Ireland and the UK - Cows (Average of Grades O2, O3, O4, P2, P3, U3 and U4)
Section 3 Characteristics of the Relevant Market
PMCA Economic Consulting Page 50
Comparison of the differential in cattle prices between NI and GB, on the one hand, and between Ireland and the UK as a whole, on the other hand, is not straightforward because of the trade in which producers send cattle finished in NI for slaughter and processing to GB (i.e. there is interaction between NI-based farmers and GB-based processors as well as between NI-based farmers and NI-based processors, suggesting a UK-wide cattle procurement market in that jurisdiction), whereas the supply chain in the State pertains virtually wholly to Irish-based farmers sending their finished cattle to Irish-based processors.
The concern among the IFA and farmers based in Ireland relates to the fact that, as illustrated above, prime and premium cattle prices in Ireland are substantially lower than their counterparts in the UK and that the gap has been growing significantly, taking into account sterling’s rise against the euro. The IFA and farmers believe the gap is due to weak competition, which PMCA investigates below.
Box 3.1: Gaps in Cattle Prices between NI and GB – Summary of the Oxford Economics Study (2013)
The purpose of the Oxford Economics study for the NI LMC was to enquire into the nature and cause of the disparity in cattle prices between NI and GB, where prices in the latter region were found to be higher than in the former for the same types and grades of cattle. The research was based on data covering the 4-year period 2009-2012 and consisted of a combination of qualitative and quantitative research.
Like the price gap between Ireland and the UK observed in this report by PMCA, Oxford Economics found that there was a differential in prices paid for prime cattle between NI and GB throughout the reference period and that the differential widened significantly during the last 5 months of 2012. The consultants also reported that the differential varied by grade of cattle, with wider gaps in favour of GB being observed in higher grades of premium cattle (steers R4 and heifers R4), echoing the findings of the present report in respect of cattle price differences between Ireland and the UK (the details are shown in Table A13, p. 101).
The consultants grouped the factors contributing to the differential in cattle prices between NI and GB into three headings – “major”, “medium” and “minor” (the distinctions being based in part on an element of judgement as well as on taking into account the economic potential of the factors and the reliability of the evidence arising from the study).
The major factors identified by the Oxford Economics consultants were as follows (in no particular order of importance). First, additional costs and barriers to trade for NI into GB markets, including transport costs and restrictions on movement, were found to add to the cost of producing beef in NI for the GB market, which were sought to be offset through lower cattle prices paid by GB-based processors for slaughtering and processing cattle originating in NI. Secondly, the report observed that “NI beef and Irish beef are partial substitutes and the availability of a cheaper supply in [Ireland] tends to constrain [NI] prices relative to GB” (p. x – Roman numeral page numbers in the executive summary of the report) (however, Oxford Economics did not undertake an analysis of relevant market definition in this regard). Thirdly, the consultants noted seasonal effects in the production of cattle in NI, reflecting the grass-based method of production in that part of the UK (as in Ireland), which tends to give rise to lower cattle prices during the autumn.
Among the medium factors identified by the consultants were higher costs of production experienced by NI processors relative to those in GB and differences in the structure of the production and processing industries in NI compared with GB, in which the Oxford Economics report states that (p. x – Roman numeral page number in the executive summary) (PMCA italics and bold):
“The average size of finishing herd, which accounts for the majority of cattle supply, is smaller in NI than in GB – 24% of cattle slaughtered were presented by herds finishing over 500 head compared with 29% in GB. This combined with the potential for more intense competition for cattle in GB, partly driven by the presence of a large number of small independent operators, may exert some upward pressure on GB prices relative to [NI] due to the bargaining power or producers”.
In this report we are particularly interested in examining differences in the structure (and conduct) of the cattle procurement and processing industry between Ireland and the UK (within which GB particularly) that might help to account for the gap in cattle prices between Ireland and the UK, accepting the role of other factors – notably seasonal effects, which are examined below.
Source: ‘Regional Price Disparities in Deadweight Cattle: Understanding the NI/GB Price Differential’ (Oxford Economics, December 2013), PMCA summary.
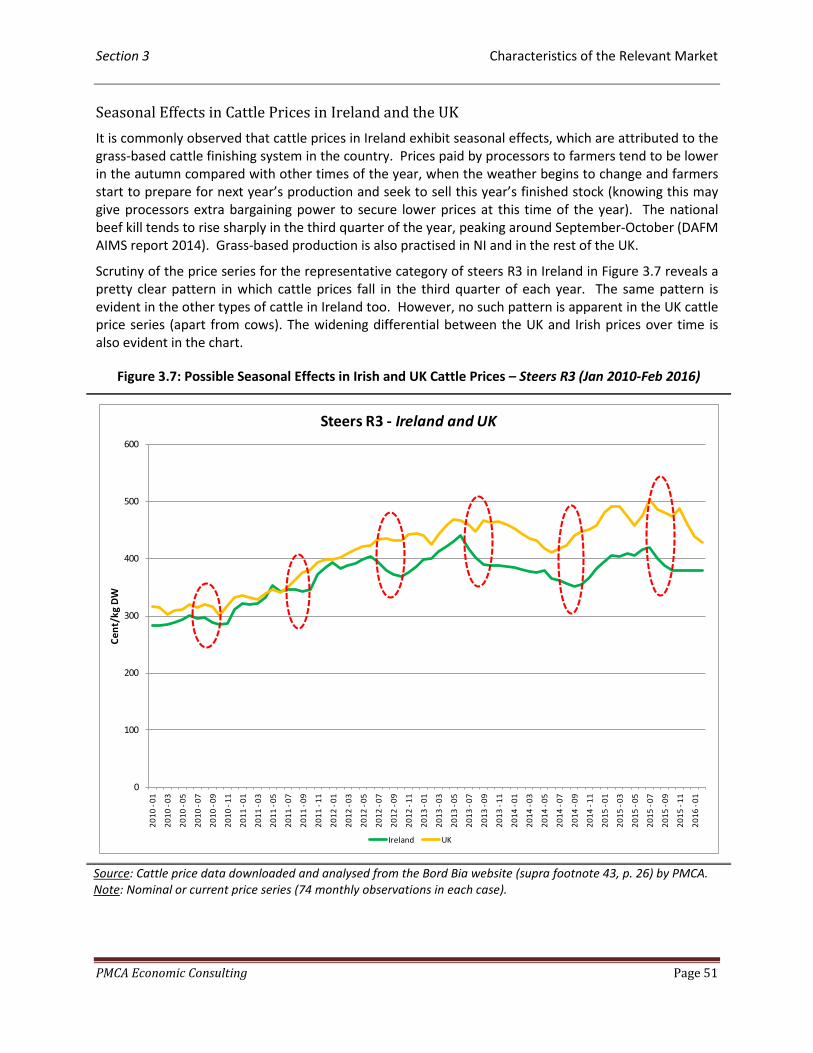
Section 3 Characteristics of the Relevant Market
PMCA Economic Consulting Page 51
Seasonal Effects in Cattle Prices in Ireland and the UK It is commonly observed that cattle prices in Ireland exhibit seasonal effects, which are attributed to the grass-based cattle finishing system in the country. Prices paid by processors to farmers tend to be lower in the autumn compared with other times of the year, when the weather begins to change and farmers start to prepare for next year’s production and seek to sell this year’s finished stock (knowing this may give processors extra bargaining power to secure lower prices at this time of the year). The national beef kill tends to rise sharply in the third quarter of the year, peaking around September-October (DAFM AIMS report 2014). Grass-based production is also practised in NI and in the rest of the UK.
Scrutiny of the price series for the representative category of steers R3 in Ireland in Figure 3.7 reveals a pretty clear pattern in which cattle prices fall in the third quarter of each year. The same pattern is evident in the other types of cattle in Ireland too. However, no such pattern is apparent in the UK cattle price series (apart from cows). The widening differential between the UK and Irish prices over time is also evident in the chart.
Figure 3.7: Possible Seasonal Effects in Irish and UK Cattle Prices – Steers R3 (Jan 2010-Feb 2016)
Source: Cattle price data downloaded and analysed from the Bord Bia website (supra footnote 43, p. 26) by PMCA. Note: Nominal or current price series (74 monthly observations in each case).
0
100
200
300
400
500
600
2010
-01
2010
-03
2010
-05
2010
-07
2010
-09
2010
-11
2011
-01
2011
-03
2011
-05
2011
-07
2011
-09
2011
-11
2012
-01
2012
-03
2012
-05
2012
-07
2012
-09
2012
-11
2013
-01
2013
-03
2013
-05
2013
-07
2013
-09
2013
-11
2014
-01
2014
-03
2014
-05
2014
-07
2014
-09
2014
-11
2015
-01
2015
-03
2015
-05
2015
-07
2015
-09
2015
-11
2016
-01
Cent
/kg
DW
Steers R3 - Ireland and UK
Ireland UK

Section 3 Characteristics of the Relevant Market
PMCA Economic Consulting Page 52
To further investigate the possibility of lower prices in Q3, we undertook econometric analysis of the Bord Bia cattle price data for the State (and the UK) for the period January 2010-February 2016 (74 monthly observations). The econometric analysis of each grade of cattle type sought to provide estimates of the extent to which prices are lower in the third quarter compared with other times of the year. The results of the econometric analysis are presented in Table A14 in the Annex of Supplementary Information (p. 102). In summary, the econometric analysis reveals the following insights regarding the seasonality of Irish cattle prices:
• In every grade within the cattle types for which the Bord Bia data are available, there is a statistically significant and quantitatively strong third quarter effect in which prices paid to producers/farmers are lower compared with other times of the year;
• On average, cattle prices are lower in Q3 compared with the other quarters (Q1, Q2 and Q3) by the following amounts;
o Young bulls – 9.24 cent/kg DW o Steers – 11.70 cent/kg DW o Heifers – 12.71 cent/kg DW o Cows – 8.05 cent/kg DW.61
No quarterly effects are found in the UK cattle price series, apart from cows, where Q4 as well as Q3 effects are found.62
In summary, the graphical and econometric analyses carried out by PMCA confirm the seasonal effect in Ireland, in which cattle prices are lower in Q3 compared with other times of the year.
However, the seasonality in the price series still does not account for all of the differentials in cattle prices between Ireland and the UK. If one ignores or eliminates seasonality, there is still a substantial, and unexplained, price differential between Ireland and the UK. It is therefore necessary to consider the possibility of additional factors, which we look at in regard to market structure differences between the countries subsequently in Sub-Section 3.4, within which specifically Sub-Section 3.4.1.5.
61 The approach applied to each price series in Ireland and the UK was to begin with a general model with each
price series regressed on lagged values of itself (12 lags) and three quarterly dummies (Q2, Q3 and Q4, with Q1 as the base case) and then to test down, eliminating statistically insignificant lagged dependent variables and quarters. In the reduced model, first-order autocorrelation (AR(1)) was tested for and, where found to be present, was corrected for using the Prais-Winston method. The regressions were carried out using Stata. The results in Table A14 (p. 104) include, for each specific cattle price series, the lag length of the reduced equation together with the Q3 effect and the presence or not of AR(1).
62 The econometric analysis reveals the following quarterly effects regarding prices for cows in the UK: the price of cows O2 is lower by 7.20 c/kg DW on average in Q3 compared with Q1 and Q2 and by 11.45 c/kg DW on average in Q4 compared with Q1 and Q2; the price of cows O3 is lower by 8.07 c/kg DW on average in Q3 compared with Q1 and Q2 and by 11.06 c/kg DW on average in Q4 compared with Q1 and Q2; the price of cows O4 is lower by 7.83 c/kg DW on average in Q3 compared with Q1 and Q2 and by 11.05 c/kg DW on average in Q4 compared with Q1 and Q2; the price of cows P2 is lower by 6.94 c/kg DW on average in Q3 compared with Q1 and Q2 and by 12.72 c/kg DW on average in Q4 compared with Q1 and Q2; the price of cows P3 is lower by 7.31 c/kg DW on average in Q3 compared with Q1 and Q2 and by 12.26 c/kg DW on average in Q4 compared with Q1 and Q2; the price of cows R3 is lower by 6.56 c/kg DW on average in Q3 compared with Q1 and Q2 and by 10.85 c/kg DW on average in Q4 compared with Q1 and Q2; and the price of cows R4 is lower by 6.52 c/kg DW on average in Q3 compared with Q1 and Q2 and by 10.25 c/kg DW on average in Q4 compared with Q1 and Q2.
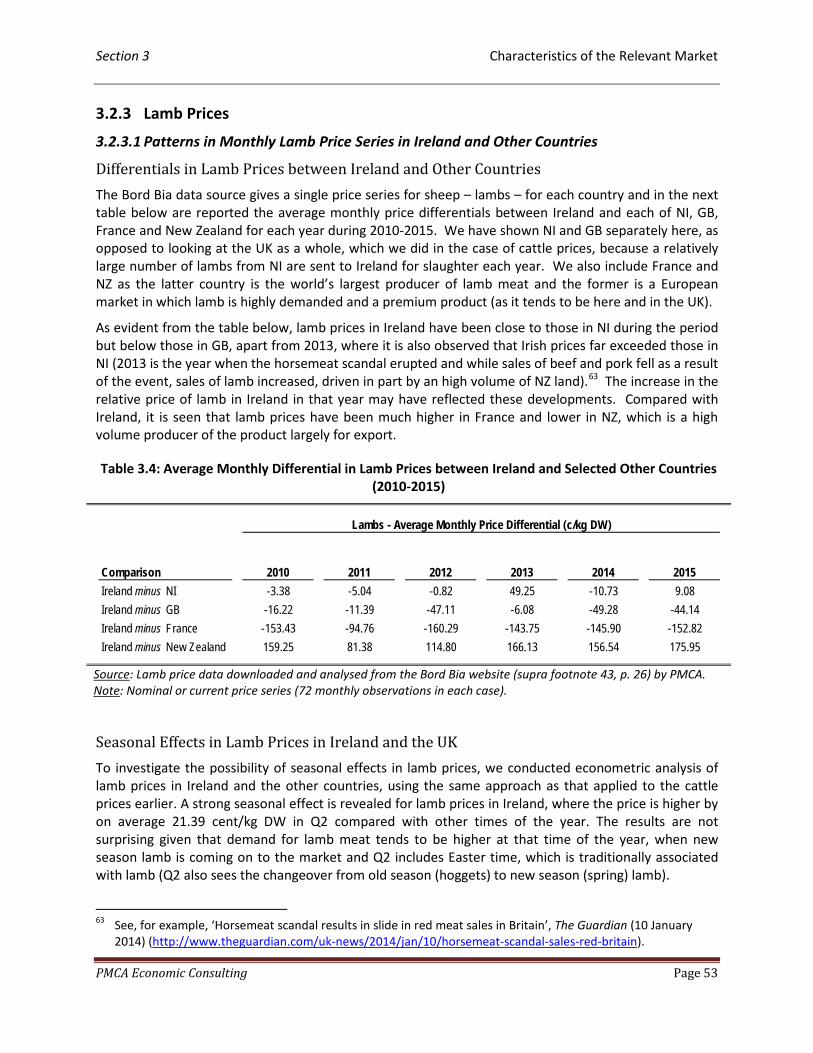
Section 3 Characteristics of the Relevant Market
PMCA Economic Consulting Page 53
3.2.3 Lamb Prices
3.2.3.1 Patterns in Monthly Lamb Price Series in Ireland and Other Countries
Differentials in Lamb Prices between Ireland and Other Countries The Bord Bia data source gives a single price series for sheep – lambs – for each country and in the next table below are reported the average monthly price differentials between Ireland and each of NI, GB, France and New Zealand for each year during 2010-2015. We have shown NI and GB separately here, as opposed to looking at the UK as a whole, which we did in the case of cattle prices, because a relatively large number of lambs from NI are sent to Ireland for slaughter each year. We also include France and NZ as the latter country is the world’s largest producer of lamb meat and the former is a European market in which lamb is highly demanded and a premium product (as it tends to be here and in the UK).
As evident from the table below, lamb prices in Ireland have been close to those in NI during the period but below those in GB, apart from 2013, where it is also observed that Irish prices far exceeded those in NI (2013 is the year when the horsemeat scandal erupted and while sales of beef and pork fell as a result of the event, sales of lamb increased, driven in part by an high volume of NZ land).63 The increase in the relative price of lamb in Ireland in that year may have reflected these developments. Compared with Ireland, it is seen that lamb prices have been much higher in France and lower in NZ, which is a high volume producer of the product largely for export.
Table 3.4: Average Monthly Differential in Lamb Prices between Ireland and Selected Other Countries (2010-2015)
Source: Lamb price data downloaded and analysed from the Bord Bia website (supra footnote 43, p. 26) by PMCA. Note: Nominal or current price series (72 monthly observations in each case).
Seasonal Effects in Lamb Prices in Ireland and the UK To investigate the possibility of seasonal effects in lamb prices, we conducted econometric analysis of lamb prices in Ireland and the other countries, using the same approach as that applied to the cattle prices earlier. A strong seasonal effect is revealed for lamb prices in Ireland, where the price is higher by on average 21.39 cent/kg DW in Q2 compared with other times of the year. The results are not surprising given that demand for lamb meat tends to be higher at that time of the year, when new season lamb is coming on to the market and Q2 includes Easter time, which is traditionally associated with lamb (Q2 also sees the changeover from old season (hoggets) to new season (spring) lamb).
63 See, for example, ‘Horsemeat scandal results in slide in red meat sales in Britain’, The Guardian (10 January
2014) (http://www.theguardian.com/uk-news/2014/jan/10/horsemeat-scandal-sales-red-britain).
Comparison 2010 2011 2012 2013 2014 2015Ireland minus NI -3.38 -5.04 -0.82 49.25 -10.73 9.08Ireland minus GB -16.22 -11.39 -47.11 -6.08 -49.28 -44.14Ireland minus France -153.43 -94.76 -160.29 -143.75 -145.90 -152.82Ireland minus New Zealand 159.25 81.38 114.80 166.13 156.54 175.95
Lambs - Average Monthly Price Differential (c/kg DW)
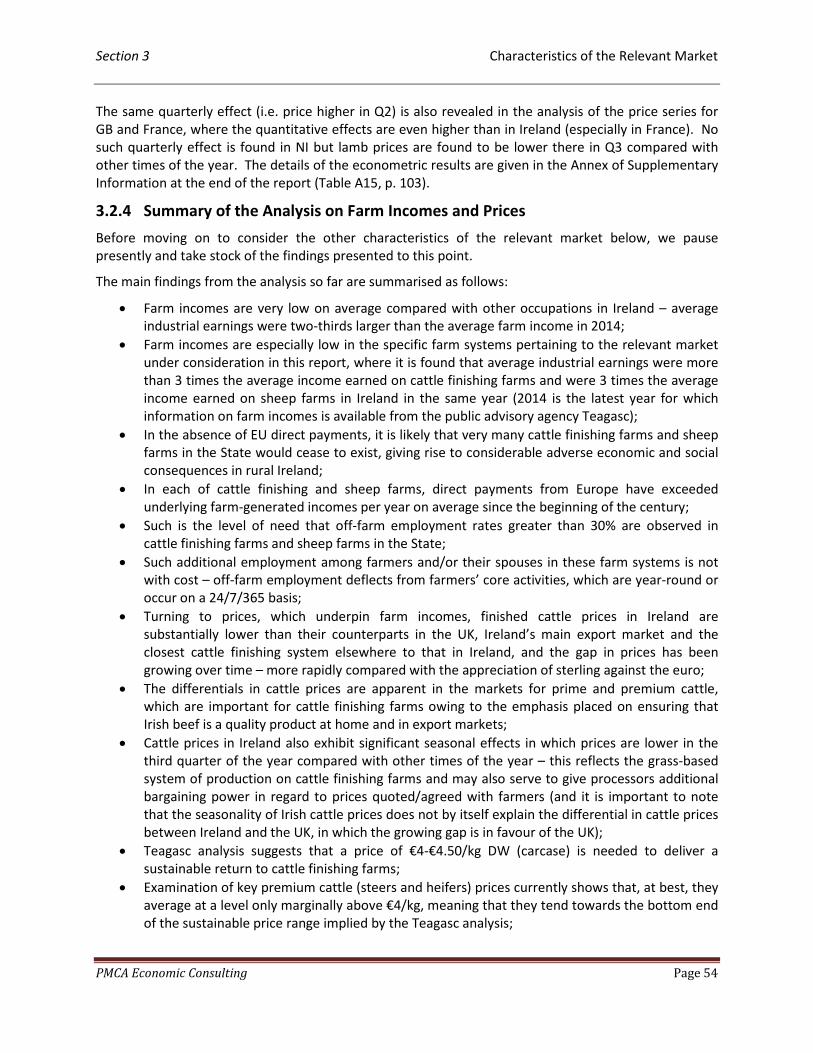
Section 3 Characteristics of the Relevant Market
PMCA Economic Consulting Page 54
The same quarterly effect (i.e. price higher in Q2) is also revealed in the analysis of the price series for GB and France, where the quantitative effects are even higher than in Ireland (especially in France). No such quarterly effect is found in NI but lamb prices are found to be lower there in Q3 compared with other times of the year. The details of the econometric results are given in the Annex of Supplementary Information at the end of the report (Table A15, p. 103).
3.2.4 Summary of the Analysis on Farm Incomes and Prices
Before moving on to consider the other characteristics of the relevant market below, we pause presently and take stock of the findings presented to this point.
The main findings from the analysis so far are summarised as follows:
• Farm incomes are very low on average compared with other occupations in Ireland – average industrial earnings were two-thirds larger than the average farm income in 2014;
• Farm incomes are especially low in the specific farm systems pertaining to the relevant market under consideration in this report, where it is found that average industrial earnings were more than 3 times the average income earned on cattle finishing farms and were 3 times the average income earned on sheep farms in Ireland in the same year (2014 is the latest year for which information on farm incomes is available from the public advisory agency Teagasc);
• In the absence of EU direct payments, it is likely that very many cattle finishing farms and sheep farms in the State would cease to exist, giving rise to considerable adverse economic and social consequences in rural Ireland;
• In each of cattle finishing and sheep farms, direct payments from Europe have exceeded underlying farm-generated incomes per year on average since the beginning of the century;
• Such is the level of need that off-farm employment rates greater than 30% are observed in cattle finishing farms and sheep farms in the State;
• Such additional employment among farmers and/or their spouses in these farm systems is not with cost – off-farm employment deflects from farmers’ core activities, which are year-round or occur on a 24/7/365 basis;
• Turning to prices, which underpin farm incomes, finished cattle prices in Ireland are substantially lower than their counterparts in the UK, Ireland’s main export market and the closest cattle finishing system elsewhere to that in Ireland, and the gap in prices has been growing over time – more rapidly compared with the appreciation of sterling against the euro;
• The differentials in cattle prices are apparent in the markets for prime and premium cattle, which are important for cattle finishing farms owing to the emphasis placed on ensuring that Irish beef is a quality product at home and in export markets;
• Cattle prices in Ireland also exhibit significant seasonal effects in which prices are lower in the third quarter of the year compared with other times of the year – this reflects the grass-based system of production on cattle finishing farms and may also serve to give processors additional bargaining power in regard to prices quoted/agreed with farmers (and it is important to note that the seasonality of Irish cattle prices does not by itself explain the differential in cattle prices between Ireland and the UK, in which the growing gap is in favour of the UK);
• Teagasc analysis suggests that a price of €4-€4.50/kg DW (carcase) is needed to deliver a sustainable return to cattle finishing farms;
• Examination of key premium cattle (steers and heifers) prices currently shows that, at best, they average at a level only marginally above €4/kg, meaning that they tend towards the bottom end of the sustainable price range implied by the Teagasc analysis;

Section 3 Characteristics of the Relevant Market
PMCA Economic Consulting Page 55
• While the parties to the proposed transaction (ABP and Slaney) are right in pointing out that steers and heifers prices have grown rapidly since the beginning of this decade (namely by 37% during 2010-2015, a figure that has been confirmed independently by PMCA), premium cattle prices have yet to reach a level that would be viable for beef farmers, or in other words that the growth in prices referred to by the parties has come from a very low base initially and remains low compared with Teagasc’s independent estimate of a viable beef price (i.e. €4-€4.50/kg DW (carcase));
• By way of observation, the emphasis throughout on premium cattle further points to the importance of the relevant market definitions for steers and heifers;
• Lamb prices are lower on average in Ireland compared with GB and the low prices are directly related to the particularly low incomes observed in Irish sheep farms, just as the low cattle prices are related directly to the especially low incomes in cattle finishing farms in the country.
The IFA believes that the very low incomes in cattle finishing and sheep farms in the State, stemming from the low prices paid by processors, are fundamentally driven by a lack of competition in the provision of beef and lamb meat in the country – that is, weak competition among processors. The rest of this section of the report independently investigates the salient features of the relevant market and at the end of the piece seeks to come to an evidence-based view as to whether the IFA’s view is correct.
3.3 Changes in the Size of the Relevant Market
3.3.1 The Significance of Market Growth or Shrinkage in Competition Assessments
Generally speaking, but not exclusively, contracting or declining markets may present an incentive for firms to coordinate their behaviour in an attempt to mitigate the shrinking opportunities; whereas growing markets may give firms an incentive to compete, in order to capture a greater share of the increasing opportunities becoming available, ceteris paribus. However, the ability for firms to coordinate their behaviour will depend on other features of the relevant market, including market shares and concentration, and the extent to which they change over time, entry barriers and the incidence of entry to the market, barriers to expansion and switching costs. Another factor that may influence the ability of firms to coordinate their behaviour concerns conduits for coordination, such as trade meetings and/or conferences in which firms gather together, multi-market contact (where firms in one market ‘meet each other’ in another market, which might be related to the first market) and past instances of actual or planned coordination. Price transparency may also be relevant as offering a particularly subtle route to coordination because price is observable by competing firms and might provide a ‘focal point’ upon which firms can coordinate, without having to meet (here the incentive from higher returns from coordination drives convergence towards the focal point).
3.3.2 Beef Supply – Procurement of Cattle for Slaughter in the State
3.3.2.1 Trend in the Number of Cattle Slaughtered in the State over the Past Twenty Years
Commencing with the widest delineation of the relevant market – consisting of all types of cattle slaughtered in the State (cows, calves and bulls as well as young bulls, steers and heifers) – publicly available CSO data on cattle slaughtering comprise cattle slaughtered at DAFM export-approved plants and at the much smaller abattoirs under the remit of local authorities in the State. As shown in Figure 3.8 overleaf, there has been a gradual decline in the total number of cattle slaughtered in the State over the past two decades. During the period, the number of cattle slaughtered peaked at 2,133,300 in 1999 and decreased to a trough of 1,484,400 in 2012. In 2015, 1,665,600 cattle were slaughtered in the State (including at local authority abattoirs as well as DAFM export-approved plants).
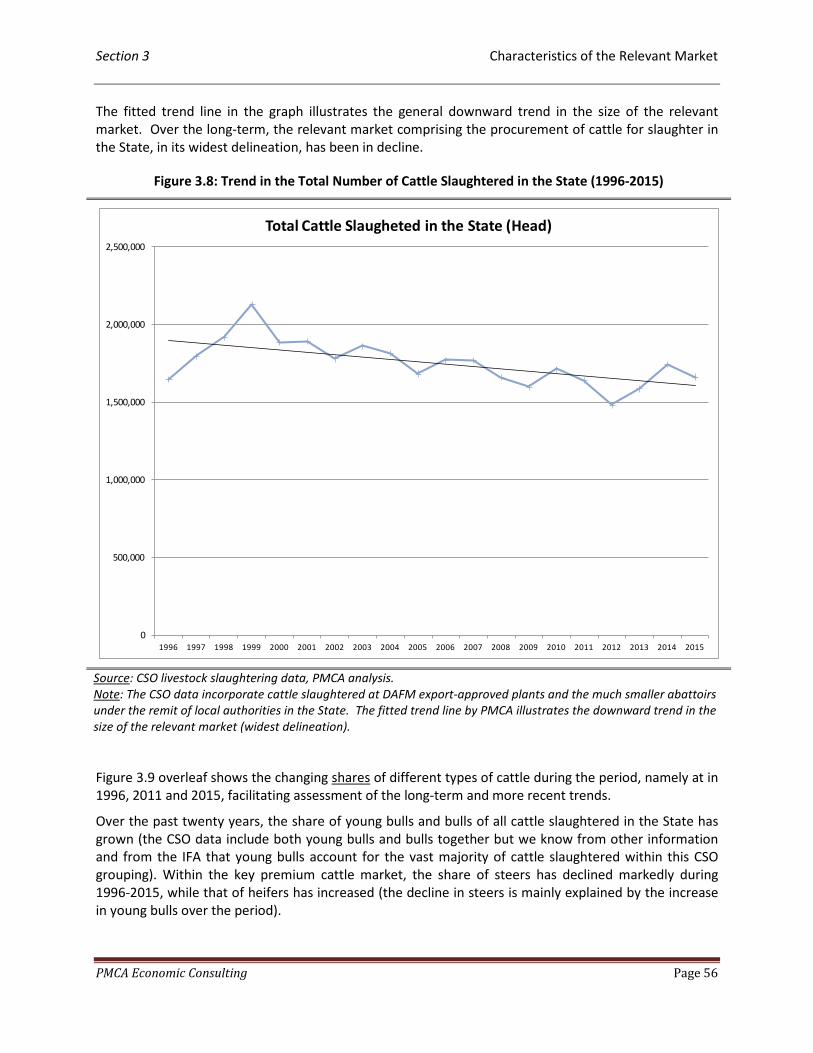
Section 3 Characteristics of the Relevant Market
PMCA Economic Consulting Page 56
The fitted trend line in the graph illustrates the general downward trend in the size of the relevant market. Over the long-term, the relevant market comprising the procurement of cattle for slaughter in the State, in its widest delineation, has been in decline.
Figure 3.8: Trend in the Total Number of Cattle Slaughtered in the State (1996-2015)
Source: CSO livestock slaughtering data, PMCA analysis. Note: The CSO data incorporate cattle slaughtered at DAFM export-approved plants and the much smaller abattoirs under the remit of local authorities in the State. The fitted trend line by PMCA illustrates the downward trend in the size of the relevant market (widest delineation).
Figure 3.9 overleaf shows the changing shares of different types of cattle during the period, namely at in 1996, 2011 and 2015, facilitating assessment of the long-term and more recent trends.
Over the past twenty years, the share of young bulls and bulls of all cattle slaughtered in the State has grown (the CSO data include both young bulls and bulls together but we know from other information and from the IFA that young bulls account for the vast majority of cattle slaughtered within this CSO grouping). Within the key premium cattle market, the share of steers has declined markedly during 1996-2015, while that of heifers has increased (the decline in steers is mainly explained by the increase in young bulls over the period).
0
500,000
1,000,000
1,500,000
2,000,000
2,500,000
1996 1997 1998 1999 2000 2001 2002 2003 2004 2005 2006 2007 2008 2009 2010 2011 2012 2013 2014 2015
Total Cattle Slaugheted in the State (Head)
Section 3 Characteristics of the Relevant Market
PMCA Economic Consulting Page 57
More recently, in the past five years (2011-2015), the shares of steers and heifers of all cattle slaughtered in the State have grown, while those of young bulls and bulls, and of cows, have fallen.
Figure 3.9: Shares of Cattle Slaughtered in the State by Types of Cattle (1996, 2011 and 2015)
Source: CSO livestock slaughtering data, PMCA analysis. Note: The CSO data incorporate cattle slaughtered at DAFM export-approved plants and the much smaller abattoirs under the remit of local authorities in the State. The CSO (publicly available) data do not separate young bulls and bulls.
3.3.2.2 Size and Growth of the Relevant Market during the Past Five Years
The preceding analysis of the trend in the number of all cattle slaughtered in the State over the long-term period (1996-2015) is instructive for showing that the relevant market, at its widest delineation, has been in decline for many years. What follows in the next two exhibits is further analysis concerning the recent trends in the relevant markets delineated in Section 2, where the first table of analysis shows the situation where the geographic market is the State and the second table the situation where the geographic market is the south Leinster area (comprising DAFM export-approved plants within a 60-mile radius of Slaney’s Bunclody plant in Co. Wexford). Both geographic markets are, in PMCA’s view, equally valid (the IFA’s and farmers’ experience would be that the local geographic market is the more appropriate – but we will work on the basis that each geographic market is as valid as the other).
2.0%
51.0%
19.8%
27.0%
0.2%
14.1%
35.3%
20.5%
29.5%
0.5%
11.6%
38.2%
19.4%
30.5%
0.4%0%
10%
20%
30%
40%
50%
60%
Young Bulls and Bulls Steers Cows Heifers Calves
% Shares of All Cattle Slaughtered in the State by Types of Cattle
Share 1996 Share 2011 Share 2015
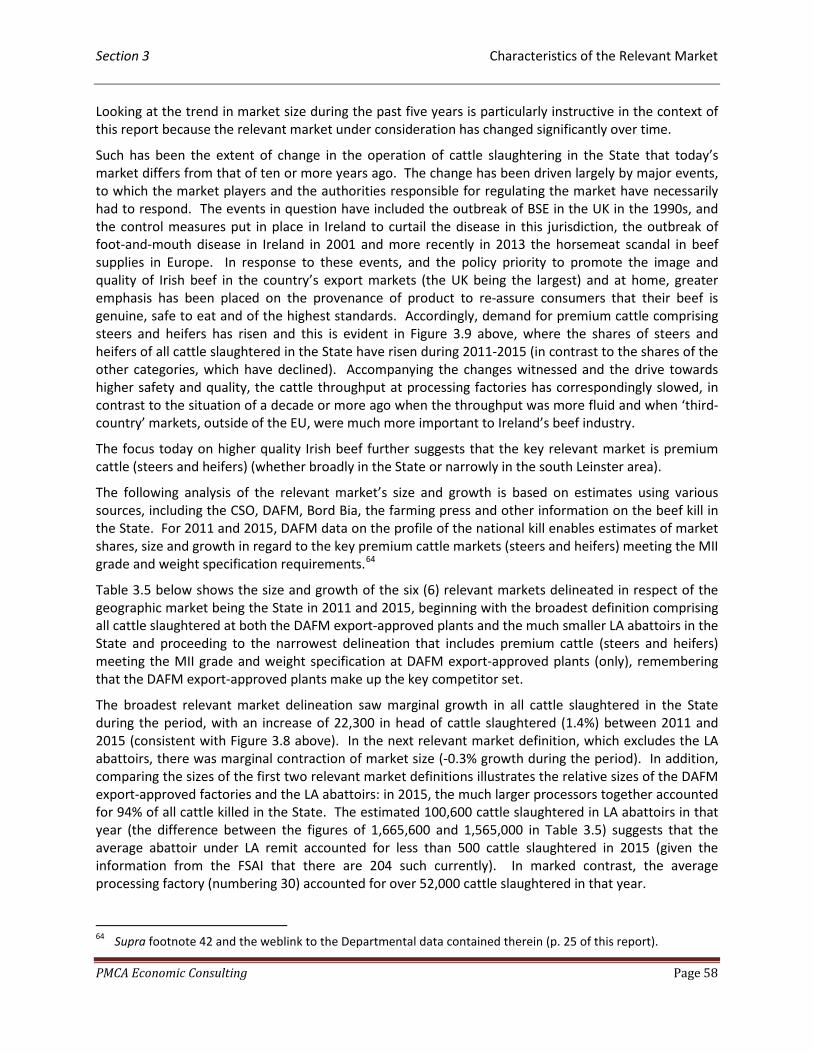
Section 3 Characteristics of the Relevant Market
PMCA Economic Consulting Page 58
Looking at the trend in market size during the past five years is particularly instructive in the context of this report because the relevant market under consideration has changed significantly over time.
Such has been the extent of change in the operation of cattle slaughtering in the State that today’s market differs from that of ten or more years ago. The change has been driven largely by major events, to which the market players and the authorities responsible for regulating the market have necessarily had to respond. The events in question have included the outbreak of BSE in the UK in the 1990s, and the control measures put in place in Ireland to curtail the disease in this jurisdiction, the outbreak of foot-and-mouth disease in Ireland in 2001 and more recently in 2013 the horsemeat scandal in beef supplies in Europe. In response to these events, and the policy priority to promote the image and quality of Irish beef in the country’s export markets (the UK being the largest) and at home, greater emphasis has been placed on the provenance of product to re-assure consumers that their beef is genuine, safe to eat and of the highest standards. Accordingly, demand for premium cattle comprising steers and heifers has risen and this is evident in Figure 3.9 above, where the shares of steers and heifers of all cattle slaughtered in the State have risen during 2011-2015 (in contrast to the shares of the other categories, which have declined). Accompanying the changes witnessed and the drive towards higher safety and quality, the cattle throughput at processing factories has correspondingly slowed, in contrast to the situation of a decade or more ago when the throughput was more fluid and when ‘third-country’ markets, outside of the EU, were much more important to Ireland’s beef industry.
The focus today on higher quality Irish beef further suggests that the key relevant market is premium cattle (steers and heifers) (whether broadly in the State or narrowly in the south Leinster area).
The following analysis of the relevant market’s size and growth is based on estimates using various sources, including the CSO, DAFM, Bord Bia, the farming press and other information on the beef kill in the State. For 2011 and 2015, DAFM data on the profile of the national kill enables estimates of market shares, size and growth in regard to the key premium cattle markets (steers and heifers) meeting the MII grade and weight specification requirements.64
Table 3.5 below shows the size and growth of the six (6) relevant markets delineated in respect of the geographic market being the State in 2011 and 2015, beginning with the broadest definition comprising all cattle slaughtered at both the DAFM export-approved plants and the much smaller LA abattoirs in the State and proceeding to the narrowest delineation that includes premium cattle (steers and heifers) meeting the MII grade and weight specification at DAFM export-approved plants (only), remembering that the DAFM export-approved plants make up the key competitor set.
The broadest relevant market delineation saw marginal growth in all cattle slaughtered in the State during the period, with an increase of 22,300 in head of cattle slaughtered (1.4%) between 2011 and 2015 (consistent with Figure 3.8 above). In the next relevant market definition, which excludes the LA abattoirs, there was marginal contraction of market size (-0.3% growth during the period). In addition, comparing the sizes of the first two relevant market definitions illustrates the relative sizes of the DAFM export-approved factories and the LA abattoirs: in 2015, the much larger processors together accounted for 94% of all cattle killed in the State. The estimated 100,600 cattle slaughtered in LA abattoirs in that year (the difference between the figures of 1,665,600 and 1,565,000 in Table 3.5) suggests that the average abattoir under LA remit accounted for less than 500 cattle slaughtered in 2015 (given the information from the FSAI that there are 204 such currently). In marked contrast, the average processing factory (numbering 30) accounted for over 52,000 cattle slaughtered in that year.
64 Supra footnote 42 and the weblink to the Departmental data contained therein (p. 25 of this report).
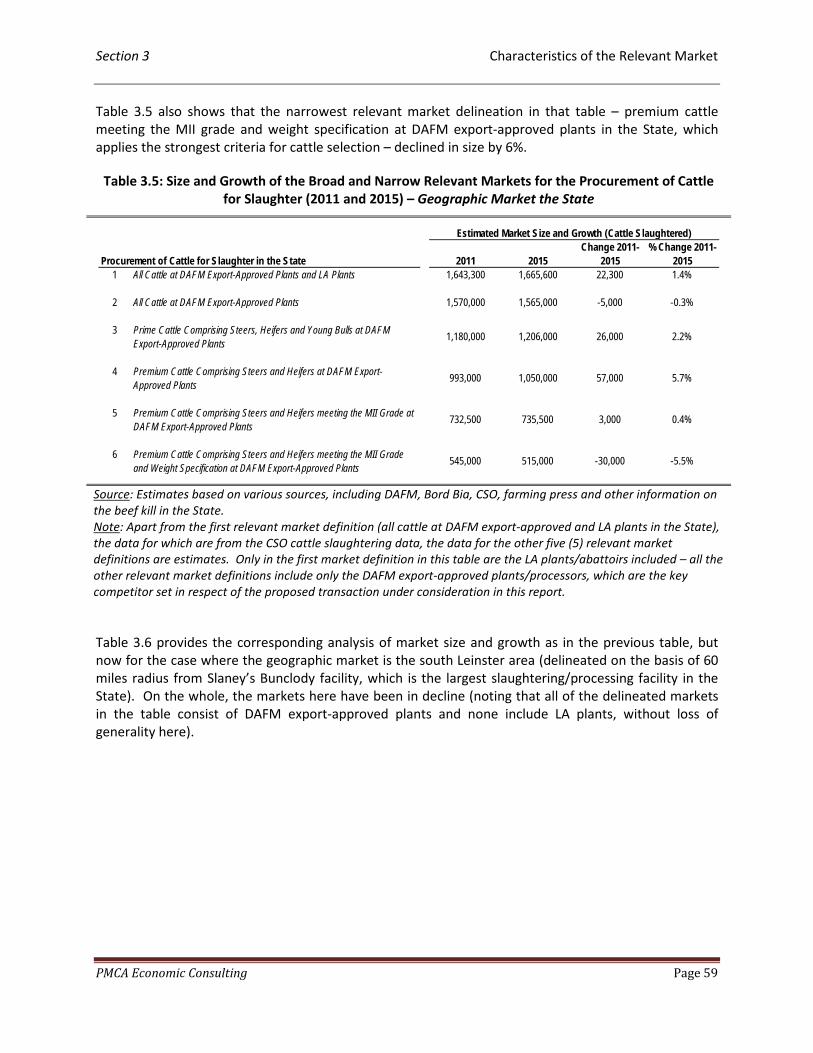
Section 3 Characteristics of the Relevant Market
PMCA Economic Consulting Page 59
Table 3.5 also shows that the narrowest relevant market delineation in that table – premium cattle meeting the MII grade and weight specification at DAFM export-approved plants in the State, which applies the strongest criteria for cattle selection – declined in size by 6%.
Table 3.5: Size and Growth of the Broad and Narrow Relevant Markets for the Procurement of Cattle for Slaughter (2011 and 2015) – Geographic Market the State
Source: Estimates based on various sources, including DAFM, Bord Bia, CSO, farming press and other information on the beef kill in the State. Note: Apart from the first relevant market definition (all cattle at DAFM export-approved and LA plants in the State), the data for which are from the CSO cattle slaughtering data, the data for the other five (5) relevant market definitions are estimates. Only in the first market definition in this table are the LA plants/abattoirs included – all the other relevant market definitions include only the DAFM export-approved plants/processors, which are the key competitor set in respect of the proposed transaction under consideration in this report.
Table 3.6 provides the corresponding analysis of market size and growth as in the previous table, but now for the case where the geographic market is the south Leinster area (delineated on the basis of 60 miles radius from Slaney’s Bunclody facility, which is the largest slaughtering/processing facility in the State). On the whole, the markets here have been in decline (noting that all of the delineated markets in the table consist of DAFM export-approved plants and none include LA plants, without loss of generality here).
2011 2015Change 2011-
2015% Change 2011-
20151 All Cattle at DAFM Export-Approved Plants and LA Plants 1,643,300 1,665,600 22,300 1.4%
2 All Cattle at DAFM Export-Approved Plants 1,570,000 1,565,000 -5,000 -0.3%
3 Prime Cattle Comprising Steers, Heifers and Young Bulls at DAFM Export-Approved Plants
1,180,000 1,206,000 26,000 2.2%
4 Premium Cattle Comprising Steers and Heifers at DAFM Export-Approved Plants
993,000 1,050,000 57,000 5.7%
5 Premium Cattle Comprising Steers and Heifers meeting the MII Grade at DAFM Export-Approved Plants
732,500 735,500 3,000 0.4%
6 Premium Cattle Comprising Steers and Heifers meeting the MII Grade and Weight Specification at DAFM Export-Approved Plants
545,000 515,000 -30,000 -5.5%
Procurement of Cattle for Slaughter in the State
Estimated Market Size and Growth (Cattle Slaughtered)

Section 3 Characteristics of the Relevant Market
PMCA Economic Consulting Page 60
Table 3.6: Size and Growth of the Broad and Narrow Relevant Markets for the Procurement of Cattle for Slaughter (2011 and 2015) – Geographic Market South Leinster
Source: Please refer to Table 3.5. Plants under the remit of LAs are not included in these relevant market definitions.
Summarising so far, the evidence considered shows that there has been decline in the total number of cattle slaughtered in the State during the long-term period from 1996 to 2015 (Figure 3.8, p. 56) and that there has been decline too in the markets comprising all cattle slaughtered at DAFM export-approved plants in the State and in the south Leinster area, and declines in addition in the narrowest (yet key) markets comprising premium cattle (steers and heifers) meeting the MII grade and weight specification at DAFM export approved plants in the State and in south Leinster (these particular declines of 5.5% and 8.4% during 2011-2015 are apparent in Table 3.5 and Table 3.6).
Other things being equal, these declines, particularly those in the key narrowest markets where the relevant geographic market is the State or the south Leinster area, might have increased the incentive for processors to coordinate their behaviour, other things being equal; however, to examine the ability for such action, we also need to consider the other salient features of the relevant market, which we do below.
2011 2015Change 2011-
2015% Change 2011-
20151 All Cattle at DAFM Export-Approved Plants 680,000 677,000 -3,000 -0.4%
2 Prime Cattle Comprising Steers, Heifers and Young Bulls at DAFM Export-Approved Plants
518,000 511,000 -7,000 -1.4%
3 Premium Cattle Comprising Steers and Heifers at DAFM Export-Approved Plants
444,000 447,000 3,000 0.7%
4 Premium Cattle Comprising Steers and Heifers meeting the MII Grade at DAFM Export-Approved Plants
321,000 308,000 -13,000 -4.0%
5 Premium Cattle Comprising Steers and Heifers meeting the MII Grade and Weight Specification at DAFM Export-Approved Plants
239,000 219,000 -20,000 -8.4%
Procurement of Cattle for Slaughter within 60 Miles of Slaney's Bunclody Plant
Estimated Market Size and Growth (Cattle Slaughtered)
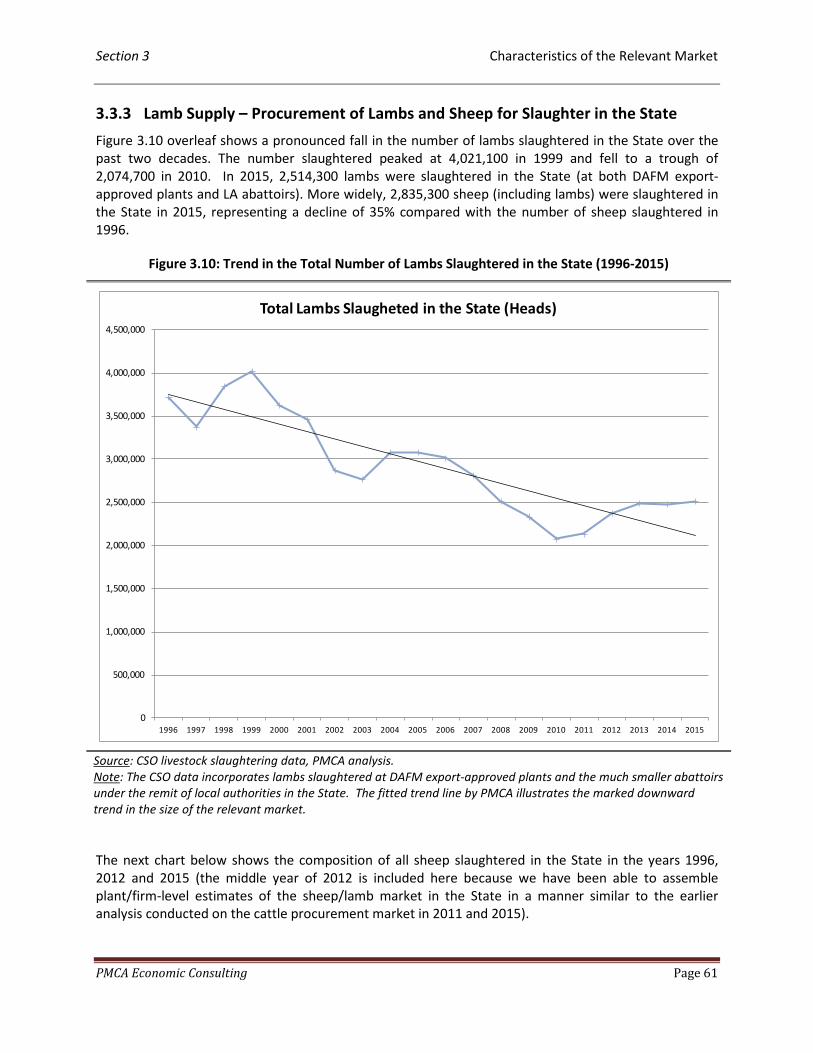
Section 3 Characteristics of the Relevant Market
PMCA Economic Consulting Page 61
3.3.3 Lamb Supply – Procurement of Lambs and Sheep for Slaughter in the State
Figure 3.10 overleaf shows a pronounced fall in the number of lambs slaughtered in the State over the past two decades. The number slaughtered peaked at 4,021,100 in 1999 and fell to a trough of 2,074,700 in 2010. In 2015, 2,514,300 lambs were slaughtered in the State (at both DAFM export-approved plants and LA abattoirs). More widely, 2,835,300 sheep (including lambs) were slaughtered in the State in 2015, representing a decline of 35% compared with the number of sheep slaughtered in 1996.
Figure 3.10: Trend in the Total Number of Lambs Slaughtered in the State (1996-2015)
Source: CSO livestock slaughtering data, PMCA analysis. Note: The CSO data incorporates lambs slaughtered at DAFM export-approved plants and the much smaller abattoirs under the remit of local authorities in the State. The fitted trend line by PMCA illustrates the marked downward trend in the size of the relevant market.
The next chart below shows the composition of all sheep slaughtered in the State in the years 1996, 2012 and 2015 (the middle year of 2012 is included here because we have been able to assemble plant/firm-level estimates of the sheep/lamb market in the State in a manner similar to the earlier analysis conducted on the cattle procurement market in 2011 and 2015).
0
500,000
1,000,000
1,500,000
2,000,000
2,500,000
3,000,000
3,500,000
4,000,000
4,500,000
1996 1997 1998 1999 2000 2001 2002 2003 2004 2005 2006 2007 2008 2009 2010 2011 2012 2013 2014 2015
Total Lambs Slaugheted in the State (Heads)
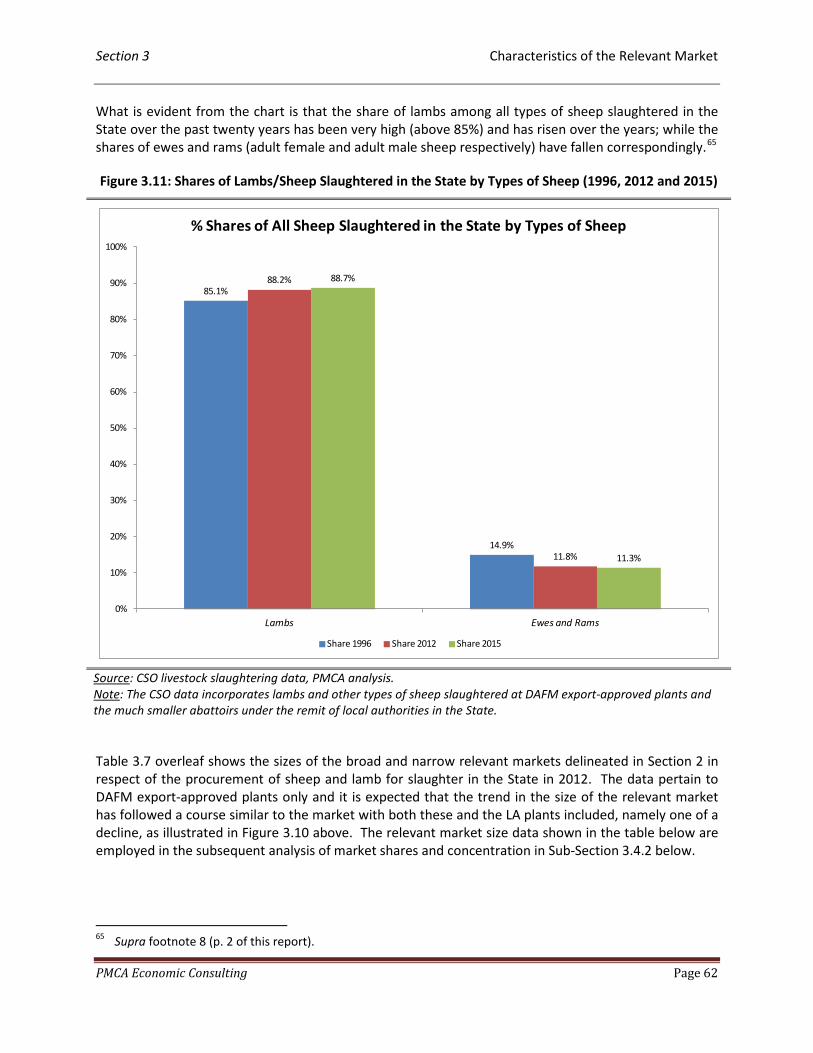
Section 3 Characteristics of the Relevant Market
PMCA Economic Consulting Page 62
What is evident from the chart is that the share of lambs among all types of sheep slaughtered in the State over the past twenty years has been very high (above 85%) and has risen over the years; while the shares of ewes and rams (adult female and adult male sheep respectively) have fallen correspondingly.65
Figure 3.11: Shares of Lambs/Sheep Slaughtered in the State by Types of Sheep (1996, 2012 and 2015)
Source: CSO livestock slaughtering data, PMCA analysis. Note: The CSO data incorporates lambs and other types of sheep slaughtered at DAFM export-approved plants and the much smaller abattoirs under the remit of local authorities in the State.
Table 3.7 overleaf shows the sizes of the broad and narrow relevant markets delineated in Section 2 in respect of the procurement of sheep and lamb for slaughter in the State in 2012. The data pertain to DAFM export-approved plants only and it is expected that the trend in the size of the relevant market has followed a course similar to the market with both these and the LA plants included, namely one of a decline, as illustrated in Figure 3.10 above. The relevant market size data shown in the table below are employed in the subsequent analysis of market shares and concentration in Sub-Section 3.4.2 below.
65 Supra footnote 8 (p. 2 of this report).
85.1%
14.9%
88.2%
11.8%
88.7%
11.3%
0%
10%
20%
30%
40%
50%
60%
70%
80%
90%
100%
Lambs Ewes and Rams
% Shares of All Sheep Slaughtered in the State by Types of Sheep
Share 1996 Share 2012 Share 2015
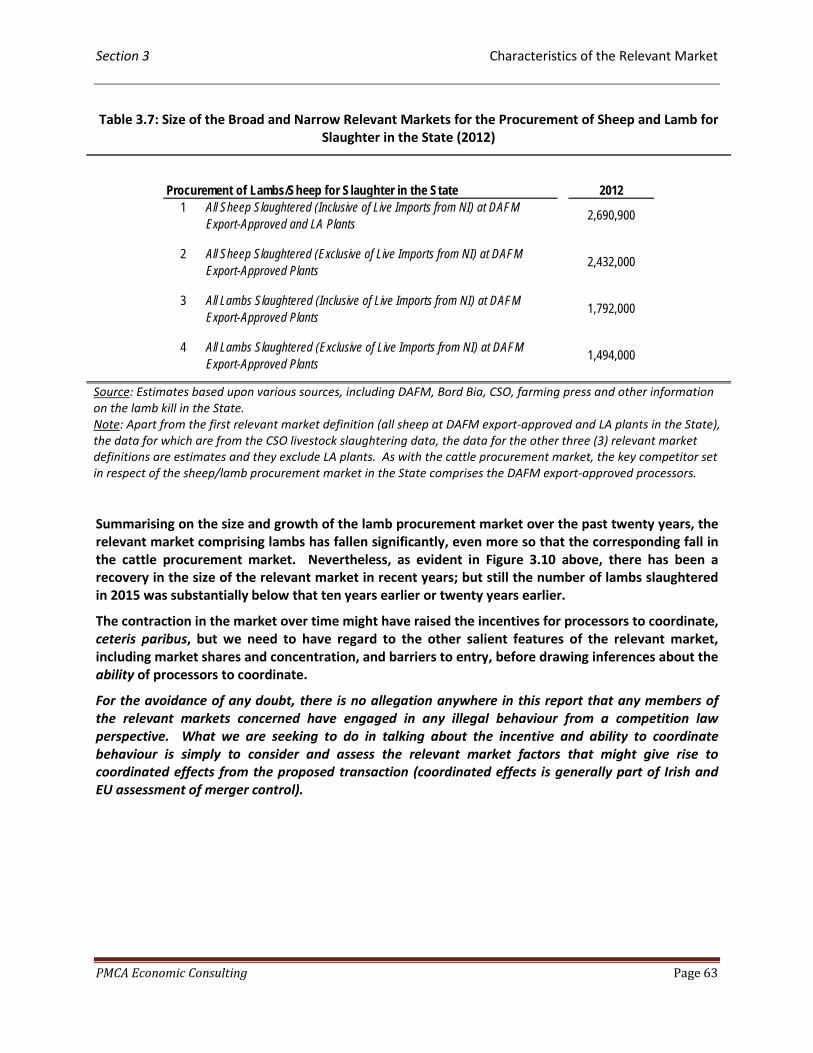
Section 3 Characteristics of the Relevant Market
PMCA Economic Consulting Page 63
Table 3.7: Size of the Broad and Narrow Relevant Markets for the Procurement of Sheep and Lamb for Slaughter in the State (2012)
Source: Estimates based upon various sources, including DAFM, Bord Bia, CSO, farming press and other information on the lamb kill in the State. Note: Apart from the first relevant market definition (all sheep at DAFM export-approved and LA plants in the State), the data for which are from the CSO livestock slaughtering data, the data for the other three (3) relevant market definitions are estimates and they exclude LA plants. As with the cattle procurement market, the key competitor set in respect of the sheep/lamb procurement market in the State comprises the DAFM export-approved processors.
Summarising on the size and growth of the lamb procurement market over the past twenty years, the relevant market comprising lambs has fallen significantly, even more so that the corresponding fall in the cattle procurement market. Nevertheless, as evident in Figure 3.10 above, there has been a recovery in the size of the relevant market in recent years; but still the number of lambs slaughtered in 2015 was substantially below that ten years earlier or twenty years earlier.
The contraction in the market over time might have raised the incentives for processors to coordinate, ceteris paribus, but we need to have regard to the other salient features of the relevant market, including market shares and concentration, and barriers to entry, before drawing inferences about the ability of processors to coordinate.
For the avoidance of any doubt, there is no allegation anywhere in this report that any members of the relevant markets concerned have engaged in any illegal behaviour from a competition law perspective. What we are seeking to do in talking about the incentive and ability to coordinate behaviour is simply to consider and assess the relevant market factors that might give rise to coordinated effects from the proposed transaction (coordinated effects is generally part of Irish and EU assessment of merger control).
20121 All Sheep Slaughtered (Inclusive of Live Imports from NI) at DAFM
Export-Approved and LA Plants2,690,900
2 All Sheep Slaughtered (Exclusive of Live Imports from NI) at DAFM Export-Approved Plants
2,432,000
3 All Lambs Slaughtered (Inclusive of Live Imports from NI) at DAFM Export-Approved Plants
1,792,000
4 All Lambs Slaughtered (Exclusive of Live Imports from NI) at DAFM Export-Approved Plants
1,494,000
Procurement of Lambs/Sheep for Slaughter in the State

Section 3 Characteristics of the Relevant Market
PMCA Economic Consulting Page 64
3.4 Market Shares and Concentration
3.4.1 Beef Supply – Procurement of Cattle for Slaughter in the State
3.4.1.1 Introduction
The CCPC’s ‘Guidelines for Merger Analysis’, adopted in October 2014, have regard to the following “thresholds” as part of the way the organisation assesses proposed transactions under the SLC test:66
• “A post-merger HHI below 1,000 is unlikely to cause concern.” • “Any market with a post-merger HHI greater than 1,000 may be regarded as concentrated and
highly concentrated if greater than 2,000.” • “Except as noted above, in a concentrated market a delta of less than 250 is unlikely to cause
concern and in a highly concentrated market a delta of less than 150 is unlikely to cause concern.”
According to the CCPC’s guidance, the likelihood of concern with a proposed transaction depends on other market features as well as the HHI delta, including barriers to entry, switching costs and evidence of coordinated behaviour in the past. As shown below, the relevant market here is characterised by high barriers to entry, switching costs and conduits for coordination exist; and the BIDS case represents a past attempt by firms to come together to re-structure the market, which was eventually withdrawn.
Treating the proposed transaction between ABP and Slaney as effectively a merger situation, we estimate the pre- and post-transaction HHIs, and also show the HHI deltas, for each relevant market definition, beginning with the widest delineation and moving to the narrower delineations. The magnitudes of the HHI deltas in particular – that is, the changes in the HHI from the pre- to the post-transaction situations – are instructive for indicating the sizes of ABP and Slaney relative to their competitors in each case. We begin with the relevant market definitions where the geographic market is the State and then move to the situation where the geographic market is the south Leinster area.
3.4.1.2 Estimated Market Shares of the Parties and Market Concentration in the Broad and Narrow Relevant Market Definitions in which the Geographic Market is the State
The estimates of the parties’ market shares (pre-transaction) and of market concentration pre- and post-transaction for the six relevant market definitions encompassing the State as the geographic market are presented in Table 3.8 below. To get a sense of market structure and the relatives sizes of the parties, consider firstly the widest relevant market definition.
In the broadest relevant market definition comprising all cattle slaughtered at DAFM export-approved and abattoirs under the remit of local authorities in the State, the former group of processors together accounted for an estimated 94% of all cattle slaughtered in the State in 2015, meaning that the much smaller LA plants had the remaining 6% of the market. There were thirty (30) DAFM export-approved plants active in that year, with the average throughput per factory estimated at over 52,000 head of cattle slaughtered. PMCA understands from the FSAI that there are 204 LA abattoirs in the State currently, suggesting as a rough estimate that each facility slaughtered on average less than 500 head of cattle in 2015 (this estimate assumes that all the LA plants were active in the slaughter of cattle, which may not necessarily be the case because some may specialise in particular animals (e.g. sheep/lambs or pigs as distinct from cattle). Nonetheless, it is clear that the much smaller LA facilities provide only a very marginal, if any, competitive constraint on the much larger DAFM export-approved plants.
66 Supra footnote 25 (p. 12 of this report).
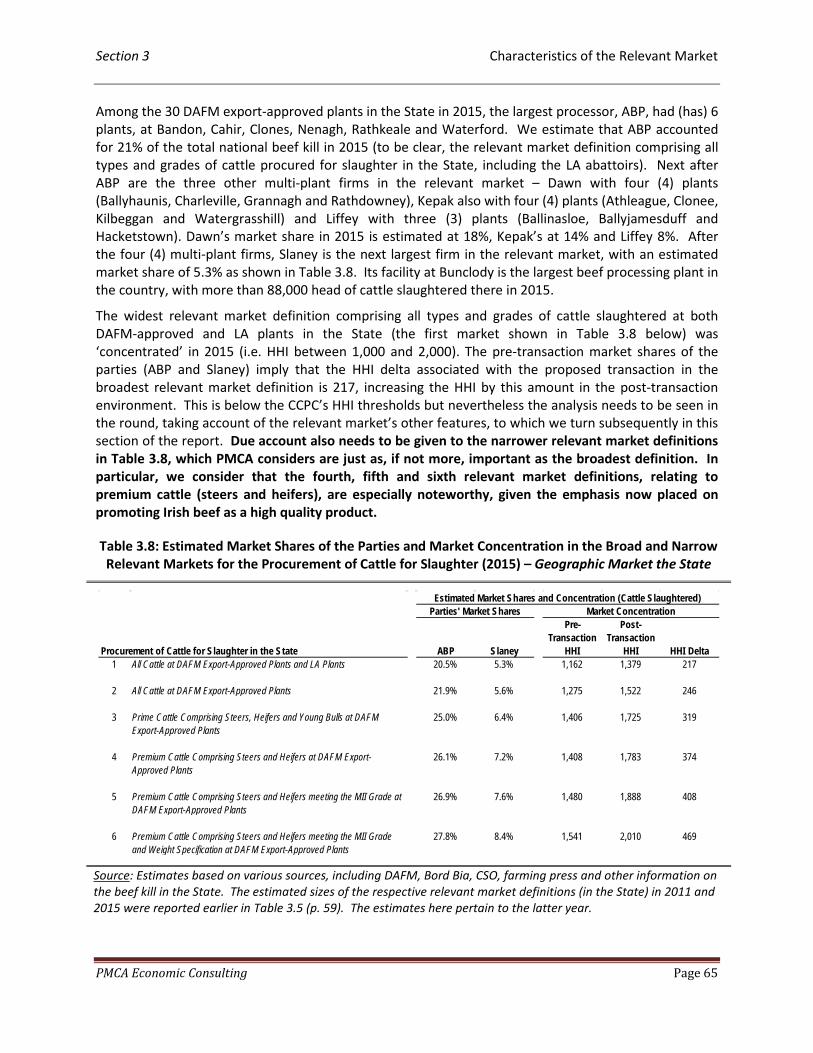
Section 3 Characteristics of the Relevant Market
PMCA Economic Consulting Page 65
Among the 30 DAFM export-approved plants in the State in 2015, the largest processor, ABP, had (has) 6 plants, at Bandon, Cahir, Clones, Nenagh, Rathkeale and Waterford. We estimate that ABP accounted for 21% of the total national beef kill in 2015 (to be clear, the relevant market definition comprising all types and grades of cattle procured for slaughter in the State, including the LA abattoirs). Next after ABP are the three other multi-plant firms in the relevant market – Dawn with four (4) plants (Ballyhaunis, Charleville, Grannagh and Rathdowney), Kepak also with four (4) plants (Athleague, Clonee, Kilbeggan and Watergrasshill) and Liffey with three (3) plants (Ballinasloe, Ballyjamesduff and Hacketstown). Dawn’s market share in 2015 is estimated at 18%, Kepak’s at 14% and Liffey 8%. After the four (4) multi-plant firms, Slaney is the next largest firm in the relevant market, with an estimated market share of 5.3% as shown in Table 3.8. Its facility at Bunclody is the largest beef processing plant in the country, with more than 88,000 head of cattle slaughtered there in 2015.
The widest relevant market definition comprising all types and grades of cattle slaughtered at both DAFM-approved and LA plants in the State (the first market shown in Table 3.8 below) was ‘concentrated’ in 2015 (i.e. HHI between 1,000 and 2,000). The pre-transaction market shares of the parties (ABP and Slaney) imply that the HHI delta associated with the proposed transaction in the broadest relevant market definition is 217, increasing the HHI by this amount in the post-transaction environment. This is below the CCPC’s HHI thresholds but nevertheless the analysis needs to be seen in the round, taking account of the relevant market’s other features, to which we turn subsequently in this section of the report. Due account also needs to be given to the narrower relevant market definitions in Table 3.8, which PMCA considers are just as, if not more, important as the broadest definition. In particular, we consider that the fourth, fifth and sixth relevant market definitions, relating to premium cattle (steers and heifers), are especially noteworthy, given the emphasis now placed on promoting Irish beef as a high quality product.
Table 3.8: Estimated Market Shares of the Parties and Market Concentration in the Broad and Narrow Relevant Markets for the Procurement of Cattle for Slaughter (2015) – Geographic Market the State
Source: Estimates based on various sources, including DAFM, Bord Bia, CSO, farming press and other information on the beef kill in the State. The estimated sizes of the respective relevant market definitions (in the State) in 2011 and 2015 were reported earlier in Table 3.5 (p. 59). The estimates here pertain to the latter year.
ABP Slaney
Pre-Transaction
HHI
Post-Transaction
HHI HHI Delta1 All Cattle at DAFM Export-Approved Plants and LA Plants 20.5% 5.3% 1,162 1,379 217
2 All Cattle at DAFM Export-Approved Plants 21.9% 5.6% 1,275 1,522 246
3 Prime Cattle Comprising Steers, Heifers and Young Bulls at DAFM Export-Approved Plants
25.0% 6.4% 1,406 1,725 319
4 Premium Cattle Comprising Steers and Heifers at DAFM Export-Approved Plants
26.1% 7.2% 1,408 1,783 374
5 Premium Cattle Comprising Steers and Heifers meeting the MII Grade at DAFM Export-Approved Plants
26.9% 7.6% 1,480 1,888 408
6 Premium Cattle Comprising Steers and Heifers meeting the MII Grade and Weight Specification at DAFM Export-Approved Plants
27.8% 8.4% 1,541 2,010 469
Procurement of Cattle for Slaughter in the State
Parties' Market Shares Market ConcentrationEstimated Market Shares and Concentration (Cattle Slaughtered)
Section 3 Characteristics of the Relevant Market
PMCA Economic Consulting Page 66
In the second relevant market definition in Table 3.8 above, the LA plants/abattoirs are excluded (as they are for all the other relevant market definitions in that table) and the market shares of the parties, and of the other firms in the market, increase accordingly as does the level of concentration (remembering that the HHI generally includes all firms in a relevant and that the HHI delta is given as twice the product of the parties’ market shares in a merger situation – supra footnote 24, p. 11). In this case, ABP’s share is 22% and Slaney’s is 6%. As a result, the HHI delta in the second case exceeds that in the first case but is just below the CCPC’s threshold value of 250. However, the same comments as for the first relevant market definition apply here too – namely that other market features need to be considered as well as market shares and concentration.
Turning to the prime cattle market and the premium cattle markets in Table 3.8 (namely markets 3 and 4-6 respectively) it is observed that the shares of the parties increase accordingly, as do the HHI deltas – all of which are greater than the CCPC’s threshold value of 250. In the narrowest market definition of premium cattle comprising steers and heifers meeting the MMI grade and weight specification at DAFM export-approved processing plants in the State, ABP’s share is estimated at 28% and Slaney’s at 8%, and the HHI delta is 469. In this key market delineation – which incorporates the critical Irish beef supply to the UK and other EU export markets – ABP is by some margin the largest provider, followed by Dawn and Kepak (each with estimated market share of 17%), while Slaney’s estimated 8% market share means that it is larger than Liffey in this particular relevant market definition (Liffey’s share in the last market shown in Table 3.8 above is estimated at 6%).
If one were to work on the assumption that all six market definitions provided for in Table 3.8 above are equally relevant or appropriate for assessment of the competition implications of the proposed transaction between ABP and Slaney then one would have concerns about the competitive effects of the proposed deal at this stage in the proceedings, owing to the relative size and significance of the parties involved, as reflected in the estimates of their market shares and of the HHI deltas in the table above. However, we must consider the proposed transaction in the round by reference to other features of the relevant market as well, which we do below.
3.4.1.3 Estimated Market Shares of the Parties and Market Concentration in the Broad and Narrow Relevant Market Definitions in which the Geographic Market is South Leinster
The corresponding analysis of the broad and narrow relevant market definitions for the case where the geographic market is the south Leinster area is presented in Table 3.9 overleaf (with one very small difference, namely that the LA plants are not included among the geographically narrower relevant market definitions, which in any event is unlikely to matter because of the tiny sizes of the local abattoirs and therefore that the relevant competitor set to the parties is among the DAFM export-approved processors).67
67 In deciding on the DAFM export-approved plants and then firms to be included in the south Leinster area
relevant market delineation, we identified all such plants within a 60-mile radius of Slaney’s Bunclody plant (the radius being informed by the then Competition Authority’s merger determination in Dawn/Galtee (2003) (supra footnote 14, p. 9 of this report)). The following plants were identified (in addition to Slaney’s Bunclody facility) – ABP Waterford, Ashbourne Meats Roscrea, B&F Thomastown, Ballon, Dawn Grannagh, Dawn Rathdowney, Kavanagh Enniscorthy, Kildare Chilling Company (Kildare Town), Liffey Hacketstown. In addition, the following plants located more than 60 miles (drive) from Bunclody were also included – ABP Cahir, Kepak Clonee and Moyvalley (i.e. 12 plants in total). Note that some of these plants had no supply in the narrowest, but important premium cattle markets (market definitions 4 and 5 in Table 3.9) (infra footnote 68 overleaf).

Section 3 Characteristics of the Relevant Market
PMCA Economic Consulting Page 67
Table 3.9: Estimated Market Shares of the Parties and Market Concentration in the Broad and Narrow Relevant Markets for the Procurement of Cattle for Slaughter (2015) – Geographic Market South
Leinster
Source: Estimates based on various sources, including DAFM, Bord Bia, CSO, farming press and other information on the beef kill in the State. The estimated sizes of the respective relevant market definitions (in south Leinster) in 2011 and 2015 were reported earlier in Table 3.5 (p. 59). The estimates here pertain to the latter year.
In every relevant market definition in the narrower geographic area, the HHI delta is well in excess of the CCPC’s threshold 250 level and it is seen that the market becomes highly concentrated in each of the relevant markets relating to premium cattle for slaughter (market definitions 3-5), with the HHI value greater than 2,000 (highly concentrated markets) (market definition 2 is also highly concentrated).
What is particularly noteworthy about the relevant market definitions in the south Leinster area (which includes plants in Munster as well as in Leinster) is the closeness in scale of ABP, Dawn and Slaney: they are present in each and every one of the five markets and they are the largest providers in each case – the parties to the proposed transaction are the number 1 and 2 firms in market definition 5, namely the key relevant market definition of premium cattle consisting of steers and heifers meeting both the MII grade and weight specification at DAFM export-approved plants.68
The apparent closeness of competition between ABP and Slaney in the south Leinster area, and the fact that they are among the largest competitors in each relevant market definition, gives further grounds for concern over the likely competitive effects of the proposed transaction, which we consider subsequently in Section 4 following the analyses of the characteristics of the relevant market in the present section. The three largest processors in the south Leinster area – ABP, Dawn and Slaney – are also the only meat processors that are also active in rendering in the State.
68 Moving into the premium markets numbered 4 and 5 in Table 3.9, we find that B&F (Thomastown), Ballon
Meats (Co. Carlow) and Kavanagh Meats (Enniscorthy, Co. Wexford) were not active in 2015, based the DAFM national kill profile data used in part to estimate the market shares in those particular premium cattle markets in the south Leinster area (supra footnote 42, p. 25 of this report).
ABP Slaney
Pre-Transaction
HHI
Post-Transaction
HHI HHI Delta1 All Cattle at DAFM Export-Approved Plants 17.6% 13.0% 1,362 1,820 458
2 Prime Cattle Comprising Steers, Heifers and Young Bulls at DAFM Export-Approved Plants
21.2% 15.0% 1,435 2,074 639
3 Premium Cattle Comprising Steers and Heifers at DAFM Export-Approved Plants
22.3% 16.8% 1,453 2,203 750
4 Premium Cattle Comprising Steers and Heifers meeting the MII Grade at DAFM Export-Approved Plants
23.5% 18.1% 1,568 2,419 851
5 Premium Cattle Comprising Steers and Heifers meeting the MII Grade and Weight Specification at DAFM Export-Approved Plants
24.1% 19.9% 1,625 2,584 959
Estimated Market Shares and Concentration (Cattle Slaughtered)
Procurement of Cattle for Slaughter within 60 Miles of Slaney's Bunclody Plant
Parties' Market Shares Market Concentration
Section 3 Characteristics of the Relevant Market
PMCA Economic Consulting Page 68
3.4.1.4 Specialty Breeds of Cattle
PMCA understands that there is no specific information relating to plants’ or firms’ throughputs in regard to speciality breeds enabling estimation of market shares in the provision of meat from Angus and Hereford cattle. It is nevertheless believed that ABP is the main slaughterer of both of these breeds and Slaney is a major slaughter of both. PMCA believes that DG Comp should consider looking further at market shares and concentration in this possible additional relevant market definition.
3.4.1.5 Comparison of the Structure of the Market for the Procurement of Cattle for Slaughter between Ireland and the UK (Specifically England owing to Available Relevant Data)
Auction Markets for Cattle Slaughtering in Great Britain Earlier in this section of the report, after noting the growing differentials in the prices paid by processors to producers (farmers) for prime and premium cattle (young bulls, steers and heifers) between Ireland and the UK, with cattle prices appreciably higher in the latter jurisdiction,69 reference was made to the possibility that differences in the structure of, and competition in, the cattle procurement markets between the two countries might account for the price differentials observed, at least in part. We noted in particular two features of the UK market – or rather the GB market – that are absent from the Irish market, namely auction markets for finished cattle slaughtering (which exist in England, Wales and Scotland but not in NI as well as not in Ireland) and the presence of a larger share of small-to-medium processors in England compared with Ireland. In what follows, we examine publicly available information allowing examination of these differences, beginning with the auction markets for finished cattle in GB. The data on the GB market are obtained from the aforementioned AHDB ‘UK Yearbook 2015 – Cattle’. Of particular interest is the market in England, which is about the same size as the market in Ireland in terms of total cattle slaughtered (the latest year covered in the AHDB publication is 2014).
There were 115 auction market centres in GB in 2014 (71 in England, 26 in Wales and 18 in Scotland), which together accounted for a throughout of cattle slaughtered of 437,000 or 19.4% of all cattle slaughtered in GB in that year (including cull cows as well as prime cattle, as shown in Table 3.10 below).
The use of auction markets is greatest within GB in England. Out of the total of 1.6m cattle slaughtered in England in 2014, 21.1% were sold through auction markets (with 17.3% in Wales and 14.5% in Scotland).
69 See Figure 3.2-Figure 3.5 (pp. 45-48) and the discussion around those exhibits.

Section 3 Characteristics of the Relevant Market
PMCA Economic Consulting Page 69
Table 3.10: Throughput of Cattle Slaughtered through the Auction Market Route in Great Britain (2014)
Source: Agriculture and Horticulture Development Board (AHDB) ‘UK Yearbook 2015 – Cattle’, PMCA analysis.
The AHDB publication from which the auction market data are obtained also gives information on the largest auction markets in GB, all occurring in England and appertaining to prime cattle (young bulls, heifers and steers). The ten largest auction market centres together account for about half of all prime cattle slaughtered through the auction market route in GB.70
Such auction markets (for finished cattle for slaughter) do not occur in NI or the State (and should not be confused with the ‘cattle marts’ in either part of the island). The participants (buyers and sellers) in the cattle marts in the State, and in NI, are largely farmers, whereas the auction markets in GB represent an alternative route to market from farmer to processor. The ‘residency and movements requirements’ characteristic of the market in the State means that the only route to market for producers of cattle is through selling to processors, which typically involves agents and in which farmers tend to deal with one processor located locally (within 60 miles) of their farms.
As outlined earlier in Section 2 on the definition of the relevant market, under the QPS or Quality Payment System, an in-spec bonus of 12c/kg is paid on steers and heifers (premium cattle) that meet certain specification conditions (see Box 2.2, p. 26). These conditions include the following:
• The farmer/farm must be Quality Assured under the Bord Bia QA scheme; • The animals must be under 30 months of age; • The animals must grade O= or better on conformation and 2+ to 4= on fat score; • The animals must be 70 days on the last farm (i.e. farm of slaughter) (in practice this means that
one could not buy an animal in an livestock mart and present it for slaughter and receive the 12 c/kg in-spec bonus.);
• The animal must have a maximum of 4 farm residencies through its lifetime (this requirement works against cattle that have been sold through marts a number of times).
70 The 10 largest auction markets are located in Bridgnorth, Darlington, Ludlow, Market Drayton, Newark,
Northallerton, Sedgemoor, Selby, Thirsk and York – all in the northern parts of England.
Type of Cattle England Wales Scotland GBSteers 60,000 5,000 10,000 75,000Heifers 85,000 5,000 14,000 104,000Young Bulls 74,000 1,000 2,000 77,000
Sub-Total Prime Cattle at Auction 219,000 11,000 26,000 256,000
Cull Cows 124,000 15,000 42,000 181,000
Total Cattle at Auction 343,000 26,000 68,000 437,000
Total Cattle Slaughtered (All Routes) 1,629,000 150,000 468,000 2,247,000
% Throughput through Auction 21.1% 17.3% 14.5% 19.4%
Throughput at Auction (Head Slaughtered)

Section 3 Characteristics of the Relevant Market
PMCA Economic Consulting Page 70
The rationale for the in-spec requirements is to meet the needs of retailers, some of whom require a maximum of 4 movements and others require a final residency ranging from 30 to 50 days.
The IFA recently undertook an analysis of the QPS, focusing on whether or not cattle meet the in-spec QPS requirements (2015). The IFA’s review has been prompted by processors imposing penalties of 10 c/kg DW and 20 c/kg DW on cattle weighing over 420kg and 440kg respectively, which the IFA estimates would cost farmers over €10m pa. PMCA understands that the IFA has consistently pointed out that carcase weight limits were never part of the QPS.
The existence of the auction market system in GB provides an alternative, open market outlet for cattle producers other than selling finished cattle directly to processing plants and may act to make the markets within the GB (in England, Wales and Scotland and within parts of these countries) more competitive compared with the Irish and NI markets, ceteris paribus. No such alternative route exists in Ireland or NI.
Accordingly, PMCA considers that DG Comp should take this additional feature of the GB supply chain into consideration when assessing the competitive effects of the proposed transaction and seek to probe the effects of the auction market system in GB further, either qualitatively or quantitatively or a combination of both.
Analysis of the Size Distribution of Plants Another (second) difference between the Irish and English cattle procurement markets, which are about the same size in terms of cattle numbers slaughtered (c. 1.6m head in each case), is that there is a larger group of small-to-medium processors in the English market, which are understood to provide further competition to the leading processors (slaughtering 50,000 or more cattle per year) (in addition to the competition among the largest processors themselves). The AHDB ‘UK Yearbook 2015 – Cattle’ provides information on the size distribution of abattoirs of all sizes slaughtering cattle in England in 2014, which we have reproduced in Table 3.11 overleaf.71
What is revealing about the size distribution is that over 43% of the beef kill in England in 2014 was accounted for by small and medium processors, and that the largest processors (plants with a throughput of over 50,000 head slaughtered) did not dominate the market as many believe is the case in Ireland. The largest processors in England together accounted for marginally more than half of all cattle slaughtered in that country in 2014. Both statistics are apparent from Table 3.11 overleaf.
71 The AHDB yearbook does not present corresponding size distribution data for the other parts of the UK, namely
Wales, Scotland or NI.

Section 3 Characteristics of the Relevant Market
PMCA Economic Consulting Page 71
Table 3.11: Size Distribution of Processing Plants Slaughtering Cattle in England in 2014
Source: Agriculture and Horticulture Development Board (AHDB) ‘UK Yearbook 2015 – Cattle’, PMCA analysis.
Employing the plant level information underlying the earlier analysis of market shares and concentration in the State (Table 3.8-Table 3.9, pp. 65-67), we can construct an Irish version of the AHDB size distribution as reproduced here in Table 3.11 in order to compare the English and Irish markets. The corresponding table for the national kill in the State is presented in Table 3.12 below. The Irish data/estimates of plant sizes pertain to 2015 and include the abattoirs under LA control as well as the much larger processing facilities under the remit of the DAFM. The use of the same size classes (head of cattle) in each case is appropriate given the fact that the Irish and English markets are about the same size (all 204 LA plants are in the first and smallest size class, an assumption that does not affect the key statistics on the Irish distribution vis-à-vis the English distribution discussed overleaf).
Table 3.12: Size Distribution of Processing Plants Slaughtering Cattle in the State in 2015
Source: Estimates based on various sources, including DAFM, Bord Bia, CSO, farming press and other information. The total throughput figure is obtained from the CSO and the size distribution also incorporates FSAI information that there are 204 LA abattoirs in the State currently (the assumption that all are active in cattle slaughtering does not affect the key statistic that <9% of all cattle slaughtered were by processors handling 5,001-50,000 cattle).
Size Group (Head)Number of Abattoirs
Total Throughput
(Head)
Average Throughput
(Head)
Share of Throughout
(%)1-1,100 77 21,575 280 1.4%1,001-5,000 32 79,336 2,479 5.1%5,001-10,000 15 95,365 6,358 6.2%10,001-20,000 9 129,076 14,342 8.3%20,001-30,000 6 159,605 26,601 10.3%30,001-50,000 7 286,856 40,979 18.5%>50,000 11 775,492 70,499 50.1%
Total 157 1,547,305 9,855 100.0%
43.4%
All Cattle Slaughtered in England (2014)
Size Group (Head)Number of Abattoirs
Total Throughput
(Head)
Average Throughput
(Head)
Share of Throughout
(%)1-1,100 204 101,545 498 6.1%1,001-5,000 1 2,500 0 0.2%5,001-10,000 1 6,290 6,290 0.4%10,001-20,000 2 30,160 15,080 1.8%20,001-30,000 2 47,900 23,950 2.9%30,001-50,000 2 64,685 32,343 3.9%>50,000 22 1,412,520 64,205 84.8%
Total 234 1,665,600 7,118 100.0%
8.9%
All Cattle Slaughtered in the State (2015)
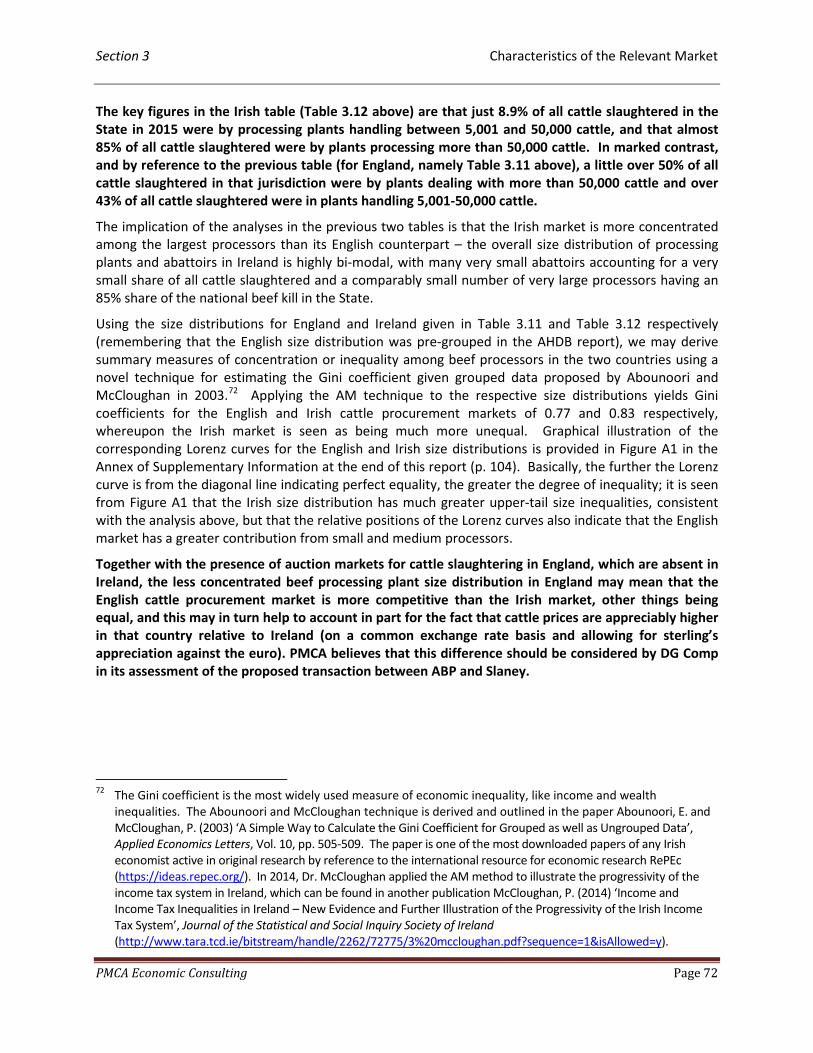
Section 3 Characteristics of the Relevant Market
PMCA Economic Consulting Page 72
The key figures in the Irish table (Table 3.12 above) are that just 8.9% of all cattle slaughtered in the State in 2015 were by processing plants handling between 5,001 and 50,000 cattle, and that almost 85% of all cattle slaughtered were by plants processing more than 50,000 cattle. In marked contrast, and by reference to the previous table (for England, namely Table 3.11 above), a little over 50% of all cattle slaughtered in that jurisdiction were by plants dealing with more than 50,000 cattle and over 43% of all cattle slaughtered were in plants handling 5,001-50,000 cattle.
The implication of the analyses in the previous two tables is that the Irish market is more concentrated among the largest processors than its English counterpart – the overall size distribution of processing plants and abattoirs in Ireland is highly bi-modal, with many very small abattoirs accounting for a very small share of all cattle slaughtered and a comparably small number of very large processors having an 85% share of the national beef kill in the State.
Using the size distributions for England and Ireland given in Table 3.11 and Table 3.12 respectively (remembering that the English size distribution was pre-grouped in the AHDB report), we may derive summary measures of concentration or inequality among beef processors in the two countries using a novel technique for estimating the Gini coefficient given grouped data proposed by Abounoori and McCloughan in 2003.72 Applying the AM technique to the respective size distributions yields Gini coefficients for the English and Irish cattle procurement markets of 0.77 and 0.83 respectively, whereupon the Irish market is seen as being much more unequal. Graphical illustration of the corresponding Lorenz curves for the English and Irish size distributions is provided in Figure A1 in the Annex of Supplementary Information at the end of this report (p. 104). Basically, the further the Lorenz curve is from the diagonal line indicating perfect equality, the greater the degree of inequality; it is seen from Figure A1 that the Irish size distribution has much greater upper-tail size inequalities, consistent with the analysis above, but that the relative positions of the Lorenz curves also indicate that the English market has a greater contribution from small and medium processors.
Together with the presence of auction markets for cattle slaughtering in England, which are absent in Ireland, the less concentrated beef processing plant size distribution in England may mean that the English cattle procurement market is more competitive than the Irish market, other things being equal, and this may in turn help to account in part for the fact that cattle prices are appreciably higher in that country relative to Ireland (on a common exchange rate basis and allowing for sterling’s appreciation against the euro). PMCA believes that this difference should be considered by DG Comp in its assessment of the proposed transaction between ABP and Slaney.
72 The Gini coefficient is the most widely used measure of economic inequality, like income and wealth
inequalities. The Abounoori and McCloughan technique is derived and outlined in the paper Abounoori, E. and McCloughan, P. (2003) ‘A Simple Way to Calculate the Gini Coefficient for Grouped as well as Ungrouped Data’, Applied Economics Letters, Vol. 10, pp. 505-509. The paper is one of the most downloaded papers of any Irish economist active in original research by reference to the international resource for economic research RePEc (https://ideas.repec.org/). In 2014, Dr. McCloughan applied the AM method to illustrate the progressivity of the income tax system in Ireland, which can be found in another publication McCloughan, P. (2014) ‘Income and Income Tax Inequalities in Ireland – New Evidence and Further Illustration of the Progressivity of the Irish Income Tax System’, Journal of the Statistical and Social Inquiry Society of Ireland (http://www.tara.tcd.ie/bitstream/handle/2262/72775/3%20mccloughan.pdf?sequence=1&isAllowed=y).
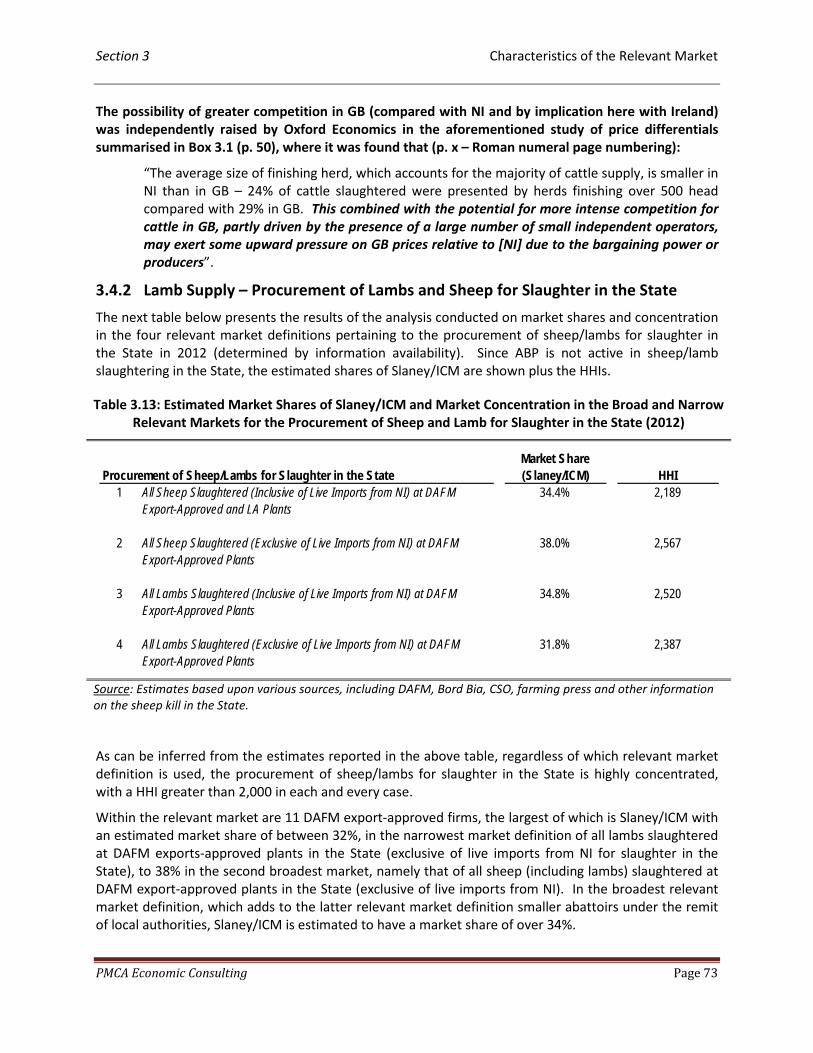
Section 3 Characteristics of the Relevant Market
PMCA Economic Consulting Page 73
The possibility of greater competition in GB (compared with NI and by implication here with Ireland) was independently raised by Oxford Economics in the aforementioned study of price differentials summarised in Box 3.1 (p. 50), where it was found that (p. x – Roman numeral page numbering):
“The average size of finishing herd, which accounts for the majority of cattle supply, is smaller in NI than in GB – 24% of cattle slaughtered were presented by herds finishing over 500 head compared with 29% in GB. This combined with the potential for more intense competition for cattle in GB, partly driven by the presence of a large number of small independent operators, may exert some upward pressure on GB prices relative to [NI] due to the bargaining power or producers”.
3.4.2 Lamb Supply – Procurement of Lambs and Sheep for Slaughter in the State
The next table below presents the results of the analysis conducted on market shares and concentration in the four relevant market definitions pertaining to the procurement of sheep/lambs for slaughter in the State in 2012 (determined by information availability). Since ABP is not active in sheep/lamb slaughtering in the State, the estimated shares of Slaney/ICM are shown plus the HHIs.
Table 3.13: Estimated Market Shares of Slaney/ICM and Market Concentration in the Broad and Narrow Relevant Markets for the Procurement of Sheep and Lamb for Slaughter in the State (2012)
Source: Estimates based upon various sources, including DAFM, Bord Bia, CSO, farming press and other information on the sheep kill in the State.
As can be inferred from the estimates reported in the above table, regardless of which relevant market definition is used, the procurement of sheep/lambs for slaughter in the State is highly concentrated, with a HHI greater than 2,000 in each and every case.
Within the relevant market are 11 DAFM export-approved firms, the largest of which is Slaney/ICM with an estimated market share of between 32%, in the narrowest market definition of all lambs slaughtered at DAFM exports-approved plants in the State (exclusive of live imports from NI for slaughter in the State), to 38% in the second broadest market, namely that of all sheep (including lambs) slaughtered at DAFM export-approved plants in the State (exclusive of live imports from NI). In the broadest relevant market definition, which adds to the latter relevant market definition smaller abattoirs under the remit of local authorities, Slaney/ICM is estimated to have a market share of over 34%.
Market Share (Slaney/ICM) HHI
1 All Sheep Slaughtered (Inclusive of Live Imports from NI) at DAFM Export-Approved and LA Plants
34.4% 2,189
2 All Sheep Slaughtered (Exclusive of Live Imports from NI) at DAFM Export-Approved Plants
38.0% 2,567
3 All Lambs Slaughtered (Inclusive of Live Imports from NI) at DAFM Export-Approved Plants
34.8% 2,520
4 All Lambs Slaughtered (Exclusive of Live Imports from NI) at DAFM Export-Approved Plants
31.8% 2,387
Procurement of Sheep/Lambs for Slaughter in the State
Section 3 Characteristics of the Relevant Market
PMCA Economic Consulting Page 74
Slaney/ICM operates two sheep/lamb processing facilities in the State, at Camolin in Co. Wexford and Navan, Co. Meath. These are the largest sheep/lamb processing plants in the country.
After Slaney/ICM, the next largest processors are Kepak, Kildare Chilling Company and Dawn. Kepak’s market share is estimated to be around 22% in the first and broadest relevant market definition and around 29% in the narrower lamb markets (3 and 4 in Table 3.13) and the company operated two processing plants at Athleague, Co. Roscommon and Hacketstown in Co. Carlow in 2012 (the latter closed in the spring of 2014). Kildare Chilling Company’s estimated market share varies between 18-21% in the broad and narrow markets respectively, while Dawn’s market share is estimated to be a little lower than 10% in each case.
Along with Slaney/ICM, the top four processors in respect of sheep/lamb meat in the State are estimated to account for the vast majority of the relevant market in the country, averaging a combined approximately 90% of the total throughput (i.e. four-firm concentration ratio of around 90% in the four relevant market definitions, further illustrating the highly concentrated nature of the relevant market for lamb/sheep processing in Ireland).
While ABP is not active in the sheep/lamb processing market in the State, it is active in the same market in NI, where its processing facility at Lurgan, Co. Armagh, is estimated to have an annual throughput in the region of 180,000 head. In addition, ABP is also responsible for a very large sheep processing facility at Yetminster, in the county of Dorset in the south west of England (catering for an estimatedthroughput of up to approximately 1,000,000 sheep/lambs per year).73
PMCA considers that the proposed transaction risks augmenting the possible opportunities for the parties to coordinate in different markets in the EU, given Slaney’s/ICM’s presence in the sheep/lamb processing market in Ireland and ABP’s presence in the same market in the UK (with its operations in NI and GB), as well as the parties’ significant overlap in the beef processing market in the State, not to mention the activities of the parties in the rendering market in the State downstream of the meat processing markets (along with Dawn, which is also prominent in lamb/sheep processing as well as beef processing in the State, ABP and Slaney are the only renderers that are also active in meat processing in Ireland, showing that the parties, and Dawn, meet in three (3) related processing markets within the State (multi-market contact in the relevant market is strong)).
We will comment further on possible coordinated effects in the assessment of the competitive effects of the proposed transaction subsequently in Section 4 of the report, following our consideration of the additional features of the relevant market presently.
73 Supra footnote 6 (p. 2 of this report). See also the article from the Irish Farmers Journal reproduced in Box A1
at the end of this report (p. 94).
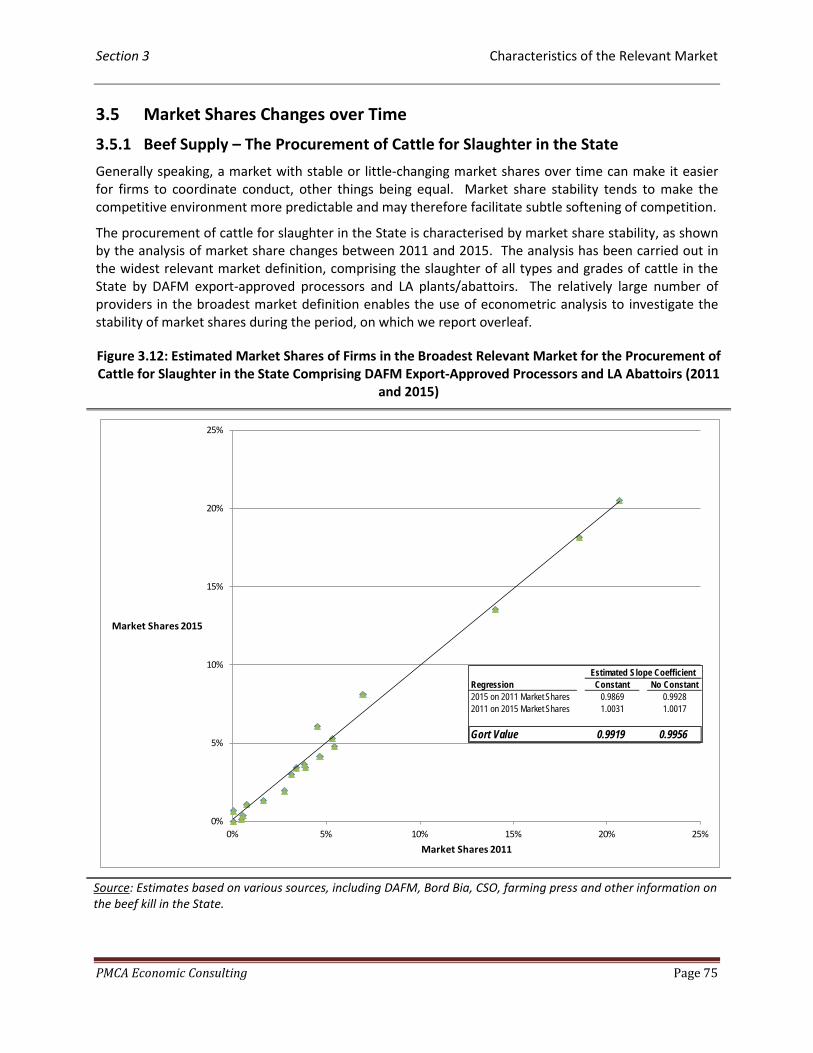
Section 3 Characteristics of the Relevant Market
PMCA Economic Consulting Page 75
3.5 Market Shares Changes over Time
3.5.1 Beef Supply – The Procurement of Cattle for Slaughter in the State
Generally speaking, a market with stable or little-changing market shares over time can make it easier for firms to coordinate conduct, other things being equal. Market share stability tends to make the competitive environment more predictable and may therefore facilitate subtle softening of competition.
The procurement of cattle for slaughter in the State is characterised by market share stability, as shown by the analysis of market share changes between 2011 and 2015. The analysis has been carried out in the widest relevant market definition, comprising the slaughter of all types and grades of cattle in the State by DAFM export-approved processors and LA plants/abattoirs. The relatively large number of providers in the broadest market definition enables the use of econometric analysis to investigate the stability of market shares during the period, on which we report overleaf.
Figure 3.12: Estimated Market Shares of Firms in the Broadest Relevant Market for the Procurement of Cattle for Slaughter in the State Comprising DAFM Export-Approved Processors and LA Abattoirs (2011
and 2015)
Source: Estimates based on various sources, including DAFM, Bord Bia, CSO, farming press and other information on the beef kill in the State.
0%
5%
10%
15%
20%
25%
0% 5% 10% 15% 20% 25%
Market Shares 2015
Market Shares 2011
Regression Constant No Constant2015 on 2011 Market Shares 0.9869 0.99282011 on 2015 Market Shares 1.0031 1.0017
Gort Value 0.9919 0.9956
Estimated Slope Coefficient
Section 3 Characteristics of the Relevant Market
PMCA Economic Consulting Page 76
The chart in Figure 3.12 above plots the estimated market shares of the firms in the widest relevant market definition in 2015 (on the vertical axis) against the corresponding market shares in 2011 (on the horizontal axis). The market shares in 2015 are strongly positively correlated with those in 2011, with the observations lying in close proximity to the fitted regression line, indicating in turn market share stability.
We can further examine market share stability in the relevant market by applying a method for this purpose proposed by Michael Gort in 1962.
The Gort measure of market share stability/mobility is defined as the geometric mean of the regression of current on base year market shares and the reciprocal of the regression of base year on current year market shares.74 A geometric mean greater than unity signifies market share changes in favour of initially larger firms, while the opposite for a mean of less than unity. The reference value of 1 indicates perfect stability. The inset in Figure 3.12 above shows calculations of the Gort formula for the market shares at hand based on regressions with and without an intercept/constant term (it would appear that the regression without an intercept is more appropriate judging by the scatter diagram). Either way, the Gort value is very close to unity and indicative of market share stability in the beef processing market in Ireland in recent years.
Another way to see the stability of market shares during the period is by reference to the degree of market concentration: as shown earlier (Table 3.8, p. 65), the estimated HHI in the broadest relevant market definition comprising both DAFM export-approved and LA plants was 1,162 in 2015; in 2011, the estimated HHI in the same relevant market definition was virtually the same at 1,172 (remembering that the HHI generally reflects the distribution of market shares among all firms in a relevant market).
In summary, the analysis of market share stability indicates that competition among beef processors for the procurement of cattle for slaughter in Ireland is stable or predictable – market shares have changed very little in recent years. Other things being equal, the stability of market shares may indicate weak competition or a lack of aggressive competition among processors, and may in principle make it easier for processors to coordinate their behaviour (although we are not suggesting here that any anti-competitive behaviour has actually occurred). To add further to our assessment of competition in the relevant market, we next turn to the condition of entry.
74 Gort, M., 1963, ‘Analysis of Stability and Change in Market Shares’, Journal of Political Economy, Vol. 71, pp. 51-
63. Formally speaking, the Gort measure is given by the geometric mean of two numbers, φ1 and φ2, where φ1 = Σx0x1/Σx0
2 and φ2 = Σx12/Σx0x1, and where x0 denotes deviations from the mean share in the base year and x1
deviations from the mean share in the current year. The significance of taking the geometric, as opposed to the arithmetic, mean of the regression slope coefficients is that it overcomes the bias that would arise if the regressions were taken separately – a bias that results from the general tendency that firms that are largest at the end of the period to have grown more than average and those that are largest at the beginning of the period to have grown less than average during the period. The statistical justification for this class of measure is provided by the earlier paper: Prais, S. J., 1958, ‘The Statistical Conditions for a Change in Concentration’, Review of Economics and Statistics, 40, pp. 268-272.
Section 3 Characteristics of the Relevant Market
PMCA Economic Consulting Page 77
3.6 Barriers to Entry and the Incidence of Entry (and Exit)
3.6.1 Barriers to Entry
In its determination in Dawn/Galtee in 2003, the then Competition Authority found that regulatory barriers to entry are high into the relevant market for cattle slaughtering and processing in the State.75 The regulatory requirements mentioned by the Competition Authority include planning permission, integrated pollution control (IPC) licence and an export licence (DAFM). The Competition Authority’s determination also mentions “rendering” (paragraph 2.36, p. 11). Rendering is a by-product of meat processing and a potential entrant contemplating entry to the relevant market has basically two options in regard to rendering – either it can seek to establish a rendering facility of its own or it can contract with an existing renderer in the State. Further details about rendering are outlined below in Sub-Section 3.10.3 but it is relevant to note here that three meat processors are currently active in rendering in the State, namely ABP, Slaney and Dawn. Given the additional costs, time and effort associated with setting up one’s own rendering facility ab initio, on top of the conditions needed in respect of entering meat processing itself, plus the presence already of three meat processors in rendering in the State, it might be the case that the only realistic option for a potential entrant thinking about entering the relevant meat processing market would be to deal with an existing renderer, which may imply that the potential entrant would be faced with the prospect of having to deal with a competitor in the primary meat processing market also active in the downstream rendering market in the State (ABP, Slaney or Dawn). This prospect might deter a potential competitor contemplating entry to the meat processing market on a large scale, where it would likely have need for onward rendering facilities for its remains.
Based on market enquiries and research it undertook to inform its determination of the proposed Dawn/Galtee merger in 2003, the Competition Authority estimated that “the time required to select an appropriate site, make all the necessary applications for planning approval and licences and have a plant built and operational is around four years”.76 This period of time for entry to the relevant market is considerably longer than the conventional 2-year period in respect of assessing the condition to entry in competition assessments of transactions generally speaking,77 and would be even longer again when one factors in the possible additional requirements for rendering. In Dawn/Galtee, the Competition Authority came to the view that greenfield entry would be rare in the market but did note two examples of acquisition entry and development into export-approved standards, namely Exel Meats in 2000 and Euro Farm Foods in 2003 (information on the post-entry performance of these firms is given below).
PMCA considers that regulatory barriers are high in the relevant market. There has been no new player coming into the market on a greenfield site in over 20 years. While acquisition entry is more likely than greenfield entry, the former means that new competitors have to buy their way into the market, and market entry by any means is likely to be difficult and expensive. Apart from the costs associated with buying or building a processing plant, getting access to retail market share at UK or EU level is very difficult and expensive, in addition to the requirements regarding rendering and the prospect that a new entrant might have to deal with a competitor in meat processing (ABP, Dawn or Slaney) in respect of its rendering requirements. Knowing this is likely to give existing processors an incumbency advantage, particularly the main processors, which includes Slaney as well as ABP.
75 Supra footnote 14 (p. 9 of this report). 76 Supra footnote 14, paragraph 2.37 (p. 12). 77 According to the CCPC’s Guidelines for Merger Analysis (2014), “While entry that is effective within two years is
normally considered timely, the appropriate timeframe for effective new entry will depend on the characteristics and dynamics of the market under consideration” (supra footnote 25, paragraph 6.5, p. 29).
Section 3 Characteristics of the Relevant Market
PMCA Economic Consulting Page 78
3.6.2 Incidence of Entry and Exit
The relevant market has been characterised by acquisition entry and by exits over the past twenty or more years. The two cases referred to by the Competition Authority in Dawn/Galtee (2003) are indicative of such entry. In particular, Exel Meats entered the market by acquiring existing plants in Newgrange/Slane, Co. Meath and Kilbeggan, Co. Westmeath in or about 2000. Exel was linked to Dunbia and subsequently Dunbia took over the operations in both Kilbeggan and Newgrange/Slane in the early 2000s (Dunbia’s Slane plant is a processing facility, while the Kilbeggan facility entails de-boning). Based on our estimates of market shares, Dunbia’s Slane plant accounted for around 69,500 head of cattle slaughtered in the State in 2015 or approximately 4% of the national beef kill in that year. It is understood that Kepak took over the plant in Kilbeggan from Dunbia in 2007 as part of a business arrangement whereby Dunbia acquired a Kepak plant in Preston in the UK. The Euro Farm meat processing plant near Duleek, Co. Meath, which commenced exporting in 2004, is estimated to have had a throughput of a little over 50,000 head of cattle in 2015 or about 3% of the national beef kill.
Just as entry has occurred through acquisition, so exit has taken place by firms disposing of facilities to others. PMCA understands that food group Kerry sold its former Midleton plant to Dawn in 1994. Kerry also sold its former Clones plant to ABP in 1995, which is estimated to have accounted for a kill of over 58,000 cattle in 2015. As part of the same firm’s withdrawal from beef processing, it also sold its Meadow Meats processing facility at Rathdowney in Co. Laois to Dawn in the mid-1990s – this facility is one of the largest in the country, accounting for an estimated 75,000+ head of cattle slaughtered in 2015. Another major food group, Glanbia, sold its beef plants in Ballyhaunis and Ballaghadereen to Dawn in 1999 and its lamb plants in Camolin and Navan to ICM, which was acquired by Slaney in 2000. As part of internal rationalisation, Dawn closed its beef processing plants in Midleton and Ballaghadereen in 2009 and 2010 respectively. Yet another Irish food processor, Dairygold, sold its beef processing plant in Charleville to Dawn in 2003, which in 2015 accounted for an estimated almost 81,000 head of cattle slaughtered and is one of the largest such facilities in the State. Dairygold, Glanbia and Kerry are today among the most successful indigenous or Irish-owned companies in the State and are best-known for their dairy products (milk, butter, cheese and infant formula in emerging markets).
The proposed parties have also disposed or closed down operations. For example, Slaney acquired its former Freshford beef processing facility from Honeyclover in the 2000s, which Slaney subsequently closed. ABP sold its beef processing plant in Carrigans, Co. Donegal to Foyle Group in 1998.
In addition to the above, the Glynns and Fair Oaks beef processing plants mentioned in the Competition Authority’s determination in Dawn/Galtee (2003) are no longer operating.
3.6.3 Potential Entrants
In view of the pattern of entry into the relevant market to date, the most likely form of entry in the future would be via acquisition of an existing plant by an existing group/company operating in Ireland. There has been very little or no outside/foreign investment in the Irish beef processing industry and it seems unlikely that there would be any change in the situation in the coming years. In the event that such entry were to occur, it might emanate from the UK, continental Europe or South America, but with a very low probability given the structure of the market and the vertically integrated nature of the leading players, including ABP and Slaney, and the strength of their associations with Irish beef.78
78 Marfrig, the Brazilian beef processor, purchased Moy Park, the NI poultry processor in 2008; then in 2015, JBS,
the world’s largest meat processor, purchased Moy Park from Marfrig.
Section 3 Characteristics of the Relevant Market
PMCA Economic Consulting Page 79
3.6.4 Major Investments (by Incumbents)
The largest Irish companies – ABP, Dawn, Kepak, Liffey, Slaney and Kildare Chilling Company – which together had about two-thirds of the national beef kill in the State in 2015 – have invested in their plants in recent years. While this development has been beneficial for the companies concerned, and positive in respect of ensuring high quality Irish beef, and employment, at the same time the investments might have the effect of making entry into the relevant market even more difficult given the strength of the incumbent firms and their strong association with the product internationally, and the fact that regulatory barriers to entry are high – the investments by the main incumbents and their activities in entries and exits to and from the relevant market may be seen as having strategic value in a relevant market where regulatory barriers are high. The companies, and Dunbia and Foyle, as well as Linden, have also invested in the UK and/or in Europe.
3.6.5 Lamb Processing
The same observations made above in regard to beef processing also apply to lamb processing in the State, which is even more concentrated than beef processing (based on the number of sheep or lambs slaughtered in the State) and in which the leading four processors account for around 90% of all sheep/lamb slaughtered, with Slaney/ICM being the largest. The estimates of market shares and concentration presented earlier Table 3.13 (p. 73) pertain to 2012; since that time, Kepak’s processing facility in Hacketstown, Co. Carlow has closed (in 2014), meaning that the relative size of Slaney/ICM has increased, having the two largest sheep/lamb processing plants in the country at Camolin and Navan.
3.7 Switching Costs and Switching The Dawn/Galtee (2003) decision by the Competition Authority observes that “farmers choose a particular set of plants to deal with on an on-going basis, taking into consideration the convenience of the plant’s location and the longer-term relationship” (PMCA italics) (paragraph 2.11, p. 6).79 As outlined earlier in Section 2, agents acting on behalf of processors are an important part of the beef supply chain in the State. Farmers generally tend to deal with one agent who in turns deals primarily with one processor. Relationships are established over time and farmers tend to stay with the same agent and as a consequence with the same factory (Box 2.1, p. 21).
The practice in which long-term relationships are built up over many years between farmer, agent and processor mean that switching costs are high for farmers and accordingly the incidence of switching agent and processor is very low among farmers. This feature of the relevant market is reinforced by the fact that the base price varies little between processors, and farmers have little or no alternatives in regard to switch in practice. There is little or no price competition in the cattle procurement market in the State and the bargaining power tends to rest with the processor (and agents, who are remunerated by the processor). The lack of negotiating power among farmers is evident at certain times of the year when it is difficult to sell cattle – the econometric analysis of seasonality reported on above revealed that the price paid for finished cattle is statistically significantly lower in the third quarter of the year compared with other times of the year.
In sheep/lamb, farmers also tend to deal with the same factory; with the relevant market here having much fewer plants and firms compared with beef (12 plants among 11 firms, with Slaney/ICM being the only multi-plant firm versus 30 plants and 17 firms in beef) and sheep/lamb is highly concentrated.
79 Supra footnote 14 (p. 9 of this report).
Section 3 Characteristics of the Relevant Market
PMCA Economic Consulting Page 80
3.8 Price Transparency
A factor reinforcing the relationship between farmer, on the one hand, and agents and processors, on the other, is the fact that cattle prices are transparent and there is very little variation in the base price quoted by agents/processors to farmers. This is a key part of the feature of the very low switching in the relevant market. As a result of the way in which the relevant market is organised or works in practice, the market is characterised by softened or predictable competition (price competition) and the outcome is that cattle finishing farmers have relatively low incomes (as illustrated earlier in Sub-Section 3.2, beginning on page 37), which, where it not for direct payments, would mean that many producers would have no option but to cease their farming businesses (with significant implications for rural Ireland and the State more widely as a result).
In contrast to the transparency in respect of cattle (and sheep/lamb) prices, there are no corresponding prices or price series published relating to the wholesale prices that processors sell to retailers. The IFA has sought this information and believes that it would bring some real openness to the supply chain. In the US, it is mandatory for processors to provide this information twice daily across all of the different cuts (details are available on the USDA website).80
To illustrate the predictability of prices quoted or paid to IFA member farmers by processors (or their agents), we can make use of information assembled by the IFA and reported weekly by that organisation in the Irish Farmers Journal (in the ‘Business of Farming’ section towards the end of the main newspaper). The prices quoted or paid to IFA members for the week ending 6 April 2016, as reported in the edition of the Irish Farmers Journal of 9 April 2016, are reproduced in Table 3.14 below. The data pertain to 17 different beef processing plants among 10 different processing firms and show, for each of steers and heifers (premium cattle), the low and high base prices quoted or paid by plant and the range between the low and high prices. It is clearly evident from the information that there was no variation in the low base price and some variation in the high base price – what variation existed in the latter was precisely the same in respect of both steers and heifers among the processors.81
The price data are also of interest in the context of what price differential might induce a farmer to switch processor. In Dawn/Galtee (2003),82 and as referred earlier in this report, the former Competition Authority (at paragraph 2.12 (p. 6) of its determination in that proposed merger), observed that a 3% price differential would not be enough to induce farmers to seek a higher price from another processing plant but that a 5% differential would cause them to look elsewhere. The little variation in base prices among processors quoted or paid to the IFA members, as reproduced in Table 3.14 below, is are all well below 2% and, while the data considered here are for one week only, PMCA understands that they are not unusual over the season.
80 See, for example, the article on the USDA’s website entitled ‘ERS [Economic Research Service] Tracks Meat
Prices at the Retail, Wholesale and Farm Level’ (http://www.ers.usda.gov/amber-waves/2015-october/ers-tracks-meat-prices-at-the-retail,-wholesale,-and-farm-levels.aspx#.Vt2l5X2LQsY). The article includes a graph showing that wholesale-to-retail prices for choice beef (equating to steers and heifers in Ireland) have trended upwards during 2000-2015 while farm-to-wholesale prices (i.e. from farmer to processor) have been stable during the same period.
81 Corresponding information for cows are also shown in the edition of the Irish Farmers Journal (but these are not shown here, without any loss of argument). The in-spec bonus payment of 12 cent per kg DW is paid above the agreed base price.
82 Supra footnote 14 (p. 9 of this report).

Section 3 Characteristics of the Relevant Market
PMCA Economic Consulting Page 81
Analysis of variance (ANOVA) conducted by PMCA on the price series for steers and heifers – that is, among the high base prices quoted or paid to IFA farmers only (because there is no variation in the low base price) – reveals insignificant variation among the prices by plant but statistically significant variation by firm. However, the pattern of firm-level price variation among steers and heifers is exactly the same, illustrating the predictability of price competition (among processors) in the relevant market.
Table 3.14: Illustration of Prices Quoted or Paid to IFA Members
Source: Irish Farmers Journal (9 April 2016), PMCA analysis. Note: The price data reproduced here pertain to the week ending 6 April 2016. Analysis of variance (ANOVA) of steers’ prices (base – high) by processing plant results in a p-value of 0.0609 and for the same prices by processing firm gives a p-value of 0.0474. Precisely the same pattern of variation arises in regard to the prices quoted or paid for heifers (base – high). The ANOVA was conducted by PMCA using Stata.
The predictable nature of competition alluded to earlier, in regard to the analysis of market share stability 2011-2015, is also apparent in the base prices quoted by processors to farmers in respect of the key premium cattle market comprising steers and heifers. PMCA considered a recent weekly breakdown of the quoted base prices from the Irish Farmers Journal (9 April 2016) and the firm-level variation in the high base price is precisely the same for the two types of premium cattle. In addition, in none of the cases reported in that edition of the newspaper was variation in the base prices quoted by processors above 2%, remembering that the former Competition Authority found that a 5% price differential would be needed to entice a farmer to switch processor. The analysis illustrates both the price transparency in the relevant market and the low switching, which favour the processors.
Processor/PlantBase Low
Base High
Base Range
Base Low
Base High
Base Range
Dunbia 395 400 5 405 410 5Kepak Athleague 395 400 5 405 410 5Moyvalley Meats 395 395 0 405 405 0Dawn Ballyhaunis 395 395 0 405 405 0Euro Farm Foods 395 400 5 405 410 5Slaney Foods 395 400 5 405 410 5Kepak Kilbeggan 395 400 5 405 410 5Liffey Meats 395 395 0 405 405 0Kildare Chilling 395 395 0 405 405 0Ashbourne Meats 395 400 5 405 410 5Meadowmeat Rathdowney (Dawn) 395 395 0 405 405 0Charleville Foods (Dawn) 395 395 0 405 405 0Kapak Watergrasshill 395 400 5 405 410 5ABP Bandon 395 395 0 405 405 0ABP Waterford 395 395 0 405 405 0ABP Grannagh 395 395 0 405 405 0ABP Nenagh 395 395 0 405 405 0
Mean 395 397 2 405 407 2Standard Deviation 0 3 3 0 3 3
Steers HeifersFactory Base Quotes (c/kg DW)
Section 3 Characteristics of the Relevant Market
PMCA Economic Consulting Page 82
3.9 Capacity
The materials arising from the BIDS case, which we considered in Sub-Section 2.2.2 of the report, indicated that there was, at the time of the case in the 1990s, significant spare capacity in the relevant market for beef processing in the State, which in turn provided the rationale for the proposed BIDS scheme, which was ultimately found to be at variance with European competition law and was withdrawn. It is relevant presently to comment on the changes to the market since the BIDS case and how the changes would likely impact on the ability of other processors to react should it arise from any actions as a result of the proposed ABP/Slaney deal.
A fundamental change took place with Irish beef export markets from about 1999/2000 to 2005/2007. Up to 2000, Ireland had substantial exports to ‘third-country’ markets beyond the EU of around 250,000-300,000 tonnes per annum. From 2001 onwards the amount decreased to approximately 50,000-80,000 tonnes per year and then fell off to minimal volumes roughly in the range 5,000-6,000 tonnes in 2007/2008. On the other hand, exports to the UK increased from around 95,000 tonnes in 1999 to about 260,000-270,000 tonnes in 2004/2005 and exports to EU markets grew to over 200,000 tonnes from 2006 onwards. These changes were precipitated by the second BSE crisis across Europe in the early 2000s and the FMD (foot-and-mouth disease) outbreak in the UK in 2001. As a result of these changes to the composition of Ireland’s beef exports, servicing the UK and EU retail and food service outlets represents a very different challenge in terms of plant capacity utilisation than supplying large volumes of commodity boxed beef to international markets with the aid of EU export refunds.
PMCA considers that the fundamental change in regard to capacity in the relevant market for beef processing in the State is likely to impact on the ability of other (competitor) processors to exploit their capacities should they be needed in the event of a possible SLC (substantial lessening of competition) arising from the proposed ABP/Slaney deal. In particular, it is felt that other processors may not have such spare capacity or may not be in a position to respond in a likely, timely and sufficient way to a threat of reduced or softened competition following the proposed JV and that, in view of this, DG Comp and possibly the CCPC (in tandem with DG Comp) should probe this aspect of the market as part of the examination of the proposed transaction.
3.10 Vertical Integration
3.10.1 Introduction
We now turn to another salient feature of the relevant cattle and sheep/lamb procurement markets in the State, namely vertical integration or the presence of (some) processors in related markets upstream or downstream of the relevant markets with the capability of influencing competition in the relevant markets, and the related markets. In what follows, we consider two vertical markets in relation to the cattle procurement market, namely the upstream market in which processors own and control their own cattle supplies and the downstream rendering market, where the products from rendering arise from the remains of meat processing and may include purified fats, such as tallow, protein materials and bio-fuels (rendering also applies to lambs and sheep as well as cattle). Both ABP and Slaney, and Dawn, are active in rendering in the State and the significance of this fact in the context of this report is that these processors handle the remains of their competitor meat processors as well as their own, meaning that there is multi-market contact and possible opportunities for coordinated behaviour (in principle). ABP (and some other processors) is (are) also active in having its (their) own feedlot cattle, which may give them additional bargaining power vis-à-vis farmers as well as strategic advantages over others or potential entrants to the relevant cattle procurement market in the State.
Section 3 Characteristics of the Relevant Market
PMCA Economic Consulting Page 83
3.10.2 Upstream Integration – Processor-Owned and Controlled (Feedlot) Cattle
It is estimated that ABP has facilities of its own to feed and fatten in the region of 7,000-8,000 cattle at any one time. It is further estimated that the company would turn such cattle about 2.5 times per year, giving an annual throughput of 20,000 cattle of its own (cattle self-supply). It is understood that a significant proportion of these cattle are Hereford and Angus cattle. In addition, ABP hire or contract feeding facilities from other large-scale feeders throughout the country, and the company purchases store cattle and places them on feeding in these feedlots. It is further estimated that ABP may have at least another 20,000 cattle available under this arrangement. Moreover, it is also understood that ABP also engages in contract supply and price arrangements with cattle feeders whereby the company enters into contracts with feeders to supply certain volumes at certain times of the year.
In the context of ABP’s annual slaughtering, these arrangements can prove to be very significant in terms of competition as they are equivalent to close on 1,000 head of cattle per week or at high demand times like November/December for the Christmas market they can prove to be very important.
It is important to note that the majority of ABP’s cattle on feed are premium cattle (steers and heifers) in-spec (i.e. meeting the MII grade and weight specification requirements) (as shown in the earlier Table 3.8, p. 65, ABP accounted for an estimated 28% of all premium cattle comprising steers and heifers meeting the MII grade and weight specification requirements in the State).
The additional cattle supply available to ABP not only gives the firm added bargaining power with farmers, in a situation where the company (and other processors) already has (have) the upper-hand over producers, but it is also likely to afford the company flexibility and competitive advantage in the relevant market, not least in respect with potential competition (realising this, a potential entrant would need to be especially well-resourced to come into the market and compete on a significant scale with ABP).
As regards other large processors, it is estimated that Kepak has feedlot facilities for about 3,000 cattle. On the basis that the firm could turn these numbers about 2.5 times per year, it is reckoned that Kepak is in a position to supply about 7,500 cattle of its own to its plants in the State. Moyvalley has facilities for about 1,000 cattle providing an estimated 2,500 feedlot cattle per year to its plant in Co. Kildare. Liffey also has substantial grazing and feeding facilities in Kells, Co. Meath.
PMCA considers that it would be of benefit to DG Comp’s assessment of the competitive effects of the proposed transaction in the State if the organisation investigated further the extent of processor-owned and controlled (self-supply) cattle among all of the processors currently active in the State.
3.10.3 Downstream Integration – Rendering
Both of the parties to the proposed transaction (ABP and Slaney/ICM) are active in rendering as well as slaughtering. Along with Dawn, they are the only meat processors active in rendering in the State. These rendering providers would handle the remains of their competitors in the meat processing market as well as their own, giving rise to additional information, multi-market contact and/or the possibility of coordination, in principle.
Rendering generally entails the process of converting less valuable animal tissue into other, value-added materials and typically occurs in or in close proximity to animal slaughterhouses.
It is understood that three types of product are produced from rendering in the State – meat and bone meal (MBM), processed animal proteins (PAP) and biodiesel (BIOD).

Section 3 Characteristics of the Relevant Market
PMCA Economic Consulting Page 84
Given that rendering products have their origin in animal by-products, and the risks posed to animal and human health (e.g. BSE from contaminated animals entering into the human food chain), rendering is governed strictly by legislation. Regulation (EC) No. 1069 of 2009 (as amended by Regulation (EC) No. 142 of 2011) governing animal by-products was adopted by the EU on 21 October 2009. The regulation lays down strict rules for the collection, transport, storage, handling, processing and use or disposal of all animal by-products. The regulations were transposed into Irish Law on 17 April 2014, as part of the European Union (Animal By-Products Regulations) 2014 (S.I. No. 187of 2014). Article 3 of Regulation (EC) No. 1069/2009 defines animal by-products as any part of an animal carcase or any material of animal origin not intended for human consumption. They are a product of the livestock and food industry, particularly from food processing and dairy plants, and include fallen animals, surplus or waste materials from slaughterhouses and a range of surplus or rejected foodstuffs including catering wastes that contain products of animal origin, whether cooked or uncooked.
The regulations divide animal by-products into 3 categories based on their potential risk to animals, the public or the environment (and set out how each category must or may be disposed). The regulations restrict the type of by-products that may be used for feeding animals and they also prohibit intra-species recycling and the feeding of catering waste to livestock.
The categories provided for in the regulations are summarised as follows:
• Category 1 – very high risk material including specified risk material (SRM), namely the carcases of animals suspected or confirmed of being infected with Transmissible Spongiform Encephalopathies (TSE), of which BSE is a particular form;
• Category 2 – animals presenting a risk of contamination with other animal diseases (e.g. animals which die or are killed in the context of disease control measures on farm): and
• Category 3 – which comprises material that has previously been fit for human consumption, including parts of slaughtered animals fit for human consumption but which are not intended for human consumption for commercial reasons, or due to problems of manufacturing or packaging defects, animal by-products derived from the processing of products intended for human consumption (e.g. degreased bones and greaves) which did not show any signs of disease communicable to humans or animals, blood from non-diseased ruminants that did not show any signs of disease communicable to humans or animals and catering wastes containing products of animal origin, whether cooked or uncooked.
The rendering plants currently in the State by category are as follows (owners in parentheses):
• Category 1 – MBM products; o Dublin Products, Dunlavin, Co. Wicklow (Ronan Group) o College Proteins, Nobber, Co. Meath (College Proteins) o Waterford Proteins, Waterford (ABP)
• Category 3 – PAP products; o Munster Proteins, Cahir, Co. Tipperary (ABP) o Slaney Proteins, Bunclody, Co. Wexford (Slaney) o Western Proteins, Ballyhaunis, Co. Mayo (Dawn) o Farragh Proteins, Monnery, Crossdowney, Co. Cavan (College Proteins) o Dublin Products, Dunlavin, Co. Wicklow (Ronan Group) o United Fish Industries, Killybegs, Co. Donegal, which is active in PAP (Fish) (Welcon
Invest AS, a Norwegian-based producer of fishmeal and fish oil products)
Section 3 Characteristics of the Relevant Market
PMCA Economic Consulting Page 85
• Categories 1, 2 and 3 – Green Biofuels Ireland and Irish Biofuels Production at Wexford and Wicklow respectively.83
Thus, the parties to the proposed transaction (ABP and Slaney), along with Dawn, overlap in the production of PAP, which entails the use of fifth quarter materials from slaughtered remains (offal and hide) to manufacture pet food. ABP is also active in the production of MBM at its Waterford facility. All these plants are approved by the DAFM under the aforementioned EU regulations relating to rendering.
The CCPC, which might have a role in examining the proposed transaction, will be familiar with the pet food industry in the State, following its determination in 2011 that the proposed acquisition by ABP of C&D Foods (Ireland) could be put into effect. Prior to the decision, ABP held a 50% shareholding agreement in C&D; and, as a result of deal, now has sole control of C&D. According to the CCPC’s merger determination, ABP supplied in the region of 20-30% of the beef ingredients to C&D and the remainder was obtained from other beef processors in the State (but, we note here, PAP products would come from Slaney and Dawn as well as from ABP as none of the other beef processors in the State were or are active in PAP production). The proposed (full) acquisition by ABP of C&D did not raise competition concerns for the CCPC owing to the relatively small market shares of C&D in wet pet foods for cats and dogs in the State (less than 10% in each case, with much larger providers also present).
PMCA considers that the rendering market is potentially important in appraising the competitive effects of the proposed transaction between ABP and Slaney. Accordingly, the Irish rendering market should be considered further by DG Comp, where it is felt that data should be requested from the parties on the features of the rendering market(s) in the State, where the parties are active, including the market shares of the parties and other competitors, not least in regard to the production of PAP, where the three meat processors are active (ABP, Slaney and Dawn). The need to examine the rendering market in this way arises from the lack or paucity of quantitative, up-to-date information on the rendering market in the public domain, including market shares and the specific ways in which it interacts with the upstream meat processing markets, including the relationships between the three renderers (ABP, Slaney and Dawn) and other meat processors (which renderer handles which meat processors’ animal remains etc.).
3.10.4 Downstream Integration – Relationships with Retailers
Both ABP and Slaney also have relationships with retailers (as well as being active in rendering). In particular, it is understood that ABP is the main supplier from Ireland to retailers into Ireland’s single largest export market, the UK. ABP is the Irish processor of choice to the 3 major retail groups in the UK (Tesco, Sainsbury and Asda). In addition, ABP is the main processor supplying Tesco in Ireland and supplies Angus beef for all of Tesco’s counter sales. The firm also supplies Aldi and is the supplier of choice to Pallas Foods, the largest food service/restaurant supplier in the State. Slaney is the supplier of choice for Hereford prime to Lidl.
83 The firms that are active in rendering in the State may also include SRCL Limited, which is active in hazardous
waste management, inter alia. The UK CMA’s report on the completed acquisition by Linergy Limited of Ulster Farm By-Products Limited mentions (at paragraph 2.6, p. 14) that “there are no dedicated Category 2 plants in the UK or the RoI [Ireland]”. In regard to BSE, the same report observes that “Both the UK and the RoI currently have controlled risk status ... and the RoI will not be able to regain negligible risk status until 2021 at the earlier” (paragraph 2.8, pp. 14-15). That report by the CMA also considers ‘gate fees’ for rendering between meat processors and renderers and transport costs, and estimates/figures for volumes and other potentially relevant information regarding rendering in Ireland are redacted in that report (supra footnote 9 of this report, p. 3).
Section 3 Characteristics of the Relevant Market
PMCA Economic Consulting Page 86
These important links with retailers are not only beneficial for the performance of the meat processors themselves but they may also act as a (strategic) barrier to entry to the relevant market in Ireland – a new competitor with ambitions to develop a significant or leading position in the market in challenge to the parties and other processors would have to acquire retail relationships of its own.
Accordingly, PMCA considers that DG Comp should further examine the relationships between the meat processors and the retailers in Ireland and the UK: to ascertain which meat processors supply which of the grocery multiplies, including the discounters, in each of beef and lamb meat in Ireland; and what is the corresponding situation in the UK and the rest of the EU.
3.11 Section Summary
Taking all of the analyses presented in this section into account, PMCA considers that, while the meat processing sector is important to the Irish economy and comprises successful indigenous companies contributing to employment in largely rural parts of the country, the beef and lamb processing markets in the State are also characterised by weak competition.
This conclusion is based on the preponderance of market characteristics giving rise to weak competition, including significant barriers to entry, which arise from substantial regulatory barriers to entry and other, structural features of the market reflecting the strength of the leading providers and their activities in vertical markets in respect of meat processing, including rendering and their links with leading grocery retailers in Ireland and the UK, the single biggest overseas destination for Irish beef and thus a key export market. Given the way the market works in practice and the fact that the leading processors have the ability to self-supply their own cattle on an appreciably large scale, which means the presence of upstream integration in the relevant market as well as the downstream integration arising from the links processors have with major retailers and their activities in rendering, the bargaining power is tilted in favour of the processors – cattle agents act on their behalf, cattle prices quoted or paid to farmers are openly transparent on a regular (weekly) basis, switching costs are high and the incidence of switching processor by farmers is very low. The high degree of price transparency is seen in the very low or absent price variation among processors from week to week – even the bonus payments for cattle meeting the quality standards are common among processors, as are the recent penalties for exceeding weights, which the IFA has criticised on the grounds that they were never part of the QPS/quality process.
Taken together, the salient features of the relevant market make for a predictable or muted competitive environment. The IFA and farmers consider that the QPS is a scientific-based system for rewarding farmers fairly and properly for quality. However, the problem relates to the specifications the meat plants have introduced around the QPS, which include a maximum of residencies, a final residency period of 70 days, 30 months of age and more recently penalties imposed by the meat plants on carcase weight limits. The specification issues imposed by processors around the QPS are problematic in respect of competition for farmers and the IFA.
PMCA’s assessment of the competitive effects of the proposed transaction is outlined in Section 4 next.
Section 4 Comments on the Competitive Effects of the Proposed Transaction
PMCA Economic Consulting Page 87
4 Comments on the Competitive Effects of the Proposed Transaction
4.1 Introduction This section comments on the possible unilateral and coordinated effects of the proposed transaction, which risks giving ABP insights into one of its main competitors (Slaney/ICM) in the State, in turn raising concerns over both unilateral and coordinated effects in this jurisdiction. In addition, there may be further risks in the UK, if not wider in the EU, owing to the fact that Slaney/ICM is the leading processor of lamb and sheep meat in the State, which is exported to the UK and the EU, and given that ABP is active in sheep/lamb processing in NI and GB.
4.2 Unilateral Effects Generally speaking, unilateral effects in competition assessments of transactions refer to the possibility of a proposed transaction bringing about an SLC or SIEC through an increase in unilateral market power in a relevant market. The reasoning behind the concept is that pre-transaction the parties involved are constrained from individually raising their own prices or reducing competition in other ways due to the fear of losing business, partly to each other and to other rivals in the relevant market. Post-transaction, the incentives driving competitive behaviour may change and the features of the relevant market may mean that the post-transaction entity would have the ability to unilaterally reduce competition, giving rise to an SLC. Unilateral effects are more likely where the parties to a proposed transaction are each other’s closest competitors in the relevant market pre-transaction and where certain market characteristics mean that competition from other rivals and/or potential competitors would be insufficient to counter the threat of unilateral market power in the post-transaction environment. Thus, high barriers to entry, high switching costs and high barriers to expansion mean that unilateral effects would be more likely because existing rivals or potential entrants would not be in a position to respond in time or in a significant way to the threat of unilateral market power in the post-transaction environment. Unilateral effects is related to dominance but is not necessarily the same thing, and unilateral effects can be judged to be an issue following a proposed transaction without resulting in a dominant position (a dominant position as a result of a proposed transaction would lead to the conclusion of unilateral effects arising).84
PMCA considers that there are two risks regarding unilateral effects from the proposed transaction.
84 A dominant position, in a relevant market, is where a firm is to a large extent immune from normal competitive
pressures, which include rivalry from existing firms, potential competition and bargaining ability on the part of customers and consumers more widely. A dominant firm is one having the ability to unilaterally exercise significant market power without fear of losing market position. The well-established ‘United Brands’ or ‘Hoffman-La Roche’ principle states that dominance is “a position of economic strength enjoyed by an undertaking [firm] which enables it to prevent effective competition being maintained on the relevant market by giving it the power to behave to an appreciable extent independently of its competitors, customers and ultimately of its consumers”. Competition law recognises the aspiration of firms to become dominant and the holding of a dominant per se does not offend against competition law; what competition law outlaws is abuse of a dominant position, which can take many different forms, exploitative or exclusionary. To show or prove an abuse of a dominant position, one must first define the relevant market, before showing a dominant position in the relevant market, and then demonstrate that an abuse of the dominant position has occurred. Each step of the process requires supporting evidence.
Section 4 Comments on the Competitive Effects of the Proposed Transaction
PMCA Economic Consulting Page 88
First, in the beef processing market, the parties to the proposed transaction are observed to be close competitors. Across the State as a whole, ABP is the largest processor of all types and grades of cattle and Slaney is the fifth largest processor, after ABP and the three other multi-plant processors (namely Dawn, Kepak and Liffey). In the key relevant market definition for premium cattle comprising steers and heifers meeting the MII grade and weight specification at DAFM export-approved plants in the State, Slaney is estimated to be the fourth largest competitor, after ABP, Kepak and Dawn, thereby overtaking Liffey in this important market definition for Irish beef. In the narrower, but no less relevant, market again, namely for premium cattle comprising steers and heifers meeting the MII grade and weight specification at DAFM export-approved plants in the south Leinster area, ABP and Slaney are the number one and two largest processors, with estimated market shares of 24% and 20% respectively, and are accordingly deemed to be each other’s closest competitors in this case (see Table 3.9, p. 67). In this particular market, which we consider is especially relevant owing to the stringent conditions in respect of the high quality of the product associated with the market, the next competitor after Slaney is Kepak, with an estimated market share of 10.5%, followed by Moyvalley (10%), Dawn (9%), Meadow Meats (9%) and Kildare Chilling Company (8%).
The risk is that the proposed transaction (full-function JV) could give rise to coordinated behaviour between the parties themselves in the relevant markets in the south Leinster area (at least), where the proposed transaction would permit them to effectively act together by reducing competition, which could take the form of lower prices to cattle finishers in that part of the State.
The second risk is that the proposed transaction would permit ABP to gain insights about an important competitor (i.e. Slaney/ICM) with possible ramifications in the beef and lamb processing markets in the State and overseas. For instance, given the fact that Slaney/ICM is the largest lamb processor in the State and that ABP is active on a large scale in lamb/sheep processing in the UK, the proposed transaction could permit each company to coordinate with potential adverse effects for consumers in the UK and EU markets.
4.3 Coordinated Effects In general, coordinated effects refer to the possibility that a proposed transaction would give rise to coordinated behaviour by the parties and other rivals in a relevant market post-transaction. The concern is that a transaction would facilitate competitors (not just the parties or the new entity) engaging in collusion (tacit or otherwise) leading to an SLC in the post-transaction environment.85
The worry over coordinated effects stemming from the proposed transaction in the instant case is that there are already possibilities for coordinated behaviour in the relevant market, in principle, and that the proposed JV would make it more likely for coordinated behaviour to obtain in practice, in turn making it more likely for there to be an SLC in the State. The opportunities for coordinated behaviour currently (pre-transaction) include the price transparency in the relevant market and the multi-market contact between the parties in the rendering market in addition to meat processing. Competitors also meet at MII meetings and the BIDS case, which originated in the 1990s and ran well into the next decade, represented a previous attempt to coordinate behaviour across the beef processing industry in Ireland, even though it was eventually withdrawn.
4.4 Section Summary
85 Coordinated effects are related to the concept of joint or collective dominance similar to the relationship
between unilateral effects and dominance (single-firm).
Section 4 Comments on the Competitive Effects of the Proposed Transaction
PMCA Economic Consulting Page 89
In summary, based on the empirical evidence assembled and considered on the current state of competition in the relevant markets that would be affected by the proposed transaction between ABP and Slaney, PMCA considers that the proposed JV risks giving rise to an SLC in the State and an SIEC in the EU stemming from unilateral effects and coordinated effects. Both effects in the instant case relate to enhanced opportunities to coordinate behaviour and reduce competition, for the detriment of farmers and consumers at the retail end of the beef and lamb supply chains in the State and in Ireland’s main beef and lamb export markets, which are the UK and the EU. In particular, the unilateral effects envisaged here pertain to localised coordination between ABP and Slaney/ICM as a result of the proposed transaction, and the coordinated effects to more widespread coordination involving other competitors in beef and lamb processing as well as the parties. This conclusion derives from the fact that there are other conduits for coordinated behaviour in the relevant markets that would be affected by the proposed transaction and that the proposal itself would have the effect of making local or more general coordination more likely in the State and in Ireland’s main export markets.

Section 5 Conclusions and Suggestions for Follow-Up Work
PMCA Economic Consulting Page 90
5 Conclusions and Suggestions for Follow-Up Work
5.1 Summary and Conclusions This report has been prepared for the Irish Farmers’ Association by PMCA Economic Consulting and has examined the proposed transaction in which Anglo Beef Processors Food Group would acquire 50% of Slaney Foods/ICM, which the IFA and farmers have been concerned about for fear that the proposed transaction would reduce competition further in the primary procurement markets for the slaughter of cattle and sheep/lambs in the State. The parties are competitors currently and the concerns among farmers and the IFA is that the proposed joint venture would give ABP, the leading meat processor in the country, insights into one of its main competitors in the State, namely Slaney, which operates the single largest beef processing plant in Ireland, located at Bunclody, Co. Wexford, and which ranks as the fifth largest beef processor after the multi-plant processors that include Dawn, Kepak and Liffey as well as ABP, the largest beef processor. In the eyes of the IFA and farmers, who produce the critical primary inputs into the meat supply chains that would be affected by the proposed transaction, the proposed deal would also give ABP insights into the sheep/lamb processing market in the State, owing to the fact that Slaney/ICM is the largest processor of sheep and lamb meat in Ireland, with the two biggest plants in the country at Camolin, Co. Wexford and Navan, Co. Meath, operating under the brand of Irish Country Meats, which Slaney acquired in 2000. While ABP is not directly active in the slaughter or processing of lamb and sheep meat in the State, it is nevertheless active in these areas in Northern Ireland and in Great Britain, where it operates facilities in Lurgan, Co. Armagh and at Yetminster in Dorset in England.
It is immediately apparent, therefore, that the proposed transaction would give rise to competition effects in beef processing in the State and in lamb/sheep processing in the UK and potentially in the EU, where the parties are also active in continental Europe, with ABP having beef processing interests in Poland and Slaney/ICM sheep/lamb processing interests in Belgium. It is therefore also apparent that the proposed JV is a complex one, necessitating in PMCA’s view careful examination by DG Comp, possibly involving the Irish CCPC (Competition and Consumer Protection Commission) as well.
Accordingly, this report has been compiled by PMCA in order to help inform DG Comp, and possibly CCPC (and possibly the Competition and Markets Authority, CMA in the UK) regarding the likely competitive effects of the proposed transaction. As the report has been commissioned by the IFA, the focus throughout has been on the primary procurement markets for cattle and sheep/lambs, which are the critical inputs into the respective beef and lamb supply chains. The report has been compiled independently by PMCA and the conclusions are based on relevant empirical evidence examined by PMCA acting alone; while the IFA has been necessarily involved by providing PMCA with relevant information about the relevant market, all of the information and data received by PMCA from that organisation has been carefully checked and considered by PMCA, and further data, as required, as been obtained by PMCA, independently of the IFA.
The overall conclusion of this report is that the relevant market that would be affected by the proposed transaction is characterised by weak competition currently or pre-transaction and the proposed deal risks further weakening of competition, with the possibility of threatening the operation of the meat supply chains in the process (which are already precarious). These findings have been based on the information available to PMCA during the time when the report was prepared. However, the report does not purport to contain all information on the sector and suggestions for follow-up work by DG Comp (and possibly the CCPC and CMA) – are offered overleaf.
Section 5 Conclusions and Suggestions for Follow-Up Work
PMCA Economic Consulting Page 91
5.2 Suggestions for Follow-Up Work by DG Comp
Arising from the work conducted in the course of this report, PMCA suggests that additional scrutiny of the relevant markets, that would be helpful to informing the competition effects of the proposed transaction, be conducted by DG Comp. The suggestions are as follows (in no particular order of importance or priority other than they all be considered, without prejudice to any of the investigative work of DG Comp on the proposed transaction to date, of which PMCA or the IFA has not had any sight).
1. Capacity levels at plant and firm level in the relevant market for the procurement of cattle for slaughter in the State. This would entail obtaining estimates of the levels of capacity (as opposed to slaughtering or throughput) for each plant currently in the State, from which estimates of capacity at the firm level could be derived and in turn market shares by capacity estimated. These estimates would help to inform how well, if at all, other processors in the Irish market would be able to respond to an attempted reduction in competition among the parties to the proposed transaction; they would also help to inform on barriers to expansion; and on the capacity shares of the parties (ABP and Slaney) compared with the other competitors in the relevant market.
2. Upstream integration – whether firms, besides ABP, also have processor-owned and controlled cattle and to what extent? The aim here would be to arrive at estimates of the extent of processor-owned and controlled cattle in the State, from which further analysis of market shares and concentration, measured in this way, could be derived. The aim here would be to examine the positions of the parties (ABP and Slaney) relative to other competitors in the Irish market.
3. Downstream integration (rendering) – what is the relevant market definition in this activity downstream of the relevant cattle and sheep/lamb procurement markets in the State? The rendering market in Ireland is, PMCA feels, important to examination of the competitive effects of the proposed transaction owing to the fact that only three meat processors are involved, two of which are ABP and Slaney (the other one being Dawn). Specific questions arising from PMCA’s consideration of rendering in this report include (but are not necessarily limited to) the following:
a. Are there separate relevant markets for each of processed animal proteins (PAP), where the parties overlap and in which Dawn is also active, meat and bone meal (MBM), where ABP is active, and biodiesel (BIOD)?
b. What are the particular patterns in which other meat processors supply slaughtered animal remains to ABP, Slaney and Dawn for rendering (who supplies who and how)?
c. Is the geographic market for rendering in the State the country as a whole or does it operate on a regional or local basis (PMCA notes the names of the companies involved, which suggests that there is a regional element to the geographic market in rendering)?
d. What are the market shares of the parties and Dawn in the possible PAP market for rendering in the State or within the State?
e. What are the market shares in the other possible specific rendering markets in the State, namely MBM and BIOD?
f. What are the market shares in the event that there is a wider product market for rendering in the State, comprising all forms of rendering activity together?
g. How, if at all, might the strict statutory guidelines underpinning rendering in the State affect competition (e.g. market entry)?
h. In what ways does the rendering market in Ireland differ from its counterparts in other countries of the EU, such as the UK?
Section 5 Conclusions and Suggestions for Follow-Up Work
PMCA Economic Consulting Page 92
i. Who are the customers/users of rendering products in the State and how, if at all, might they be affected by the proposed transaction? In particular, what are customers’ perceptions of current competition in rendering in the State and how might competition in the rendering market be affected by the proposed transaction, if at all?
4. Downstream integration (retailing) – in Ireland, which meat processors supply which of the grocery multiplies, including the discounters, in each of beef and lamb meat; and what is the corresponding situation in the UK, Ireland’s single largest export market, and in other parts of the EU? In addition, how long do the contracts between the processors and retailer last and what has been the extent of changes (retailers switching processors) during the past 5-10 years? Do the retail multiples continue to source their beef from DAFM export-approved plants having both slaughtering and de-boning facilities (as observed by the former Competition Authority in Dawn/Galtee, 2003)? What would be retailers’ views on the competition implications of the proposed transaction – in Ireland and the UK?
5. Downstream integration (other activities) – for example, the remains skins/hides from the slaughtered bovines and their onward use in tanning and leather in the State etc.? To what extent, if at all, are the parties and/or other processors also involved in these activities in the State?
6. The competitive effects of the residency and movement requirements in Ireland whereby cattle producers are required to sell directly to processors and specifically whether the practice might serve to foreclose alternative routes to sale for farmers, such as auction markets in the UK, which are not present in the Irish or Northern Irish cattle procurement markets.
7. Auction markets in GB for the procurement of cattle – what effects they might have on competition in the Irish market as an additional option for route-to-market for cattle producers?
8. Differences in the structure of the relevant procurement markets for cattle between Ireland and GB, within which particularly England, which is about the same size as the Irish market in terms of head of cattle slaughtered annually. As well as examining the auction markets in England, Scotland and Wales, as per the preceding suggestion, PMCA suggests that DG Comp should also examine the fact that there is a much larger supply from small-to-medium processors in England compared with Ireland and that these processors may provide a greater competitive constraint to the largest processors, which is absent from the Irish market. In this report, PMCA relied on publicly available information from the Agriculture and Horticulture Development Board in the UK but further information might be able to be obtained from that organisation that would allow further probing of the apparently noteworthy structural differences in the markets, which might in turn help to explain the differentials in prime cattle prices (steers, heifers and young bulls) between Ireland and the UK, as reported upon in this report.
9. Finally, we have made reference in this report to specialty breeds of cattle in Ireland – Angus and Hereford cattle, which are growing in popularity in the country. It is understood that the parties are active in these breeds. The absence of publicly available data or detailed information within the IFA has meant that this report has not been able to probe further into this possible additional relevant market definition, besides those delineated and analysed in the course of this report. DG Comp may consider seeking such information, which may enable estimates of market shares and concentration in this regard and also to examine in more detail the links between processors and retailers in Ireland and the UK in respect of these breeds of bovine.
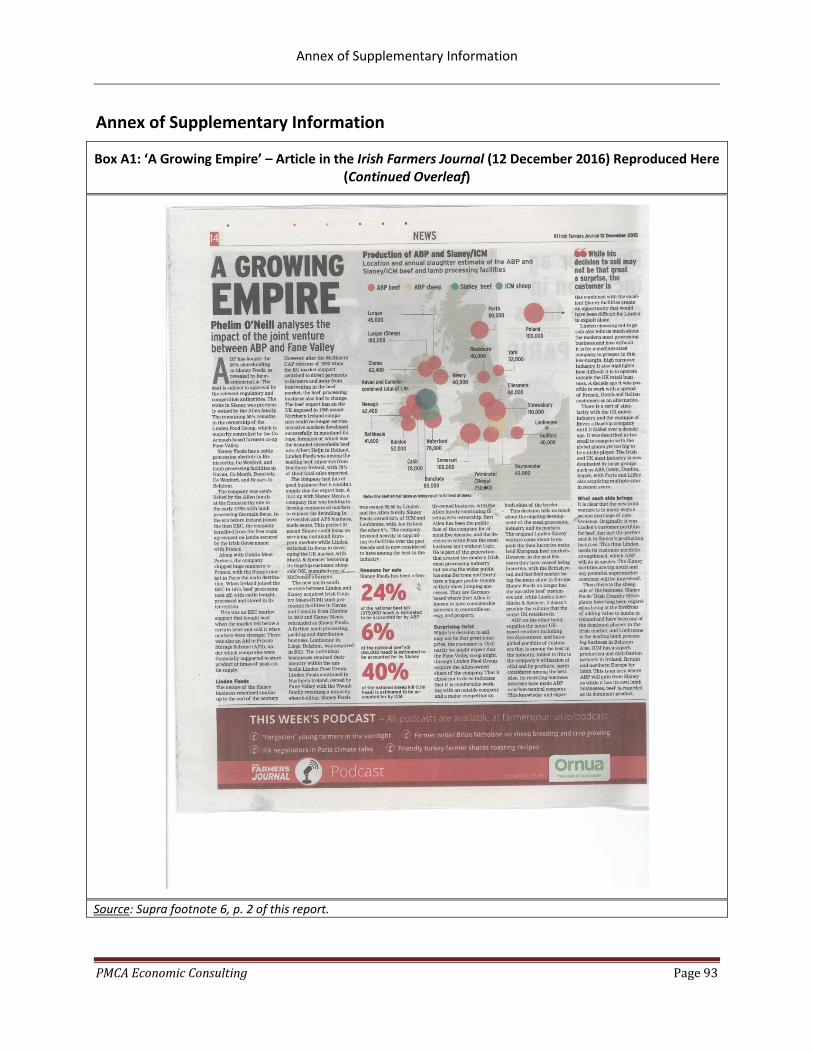
Annex of Supplementary Information
PMCA Economic Consulting Page 93
Annex of Supplementary Information
Box A1: ‘A Growing Empire’ – Article in the Irish Farmers Journal (12 December 2016) Reproduced Here (Continued Overleaf)
Source: Supra footnote 6, p. 2 of this report.

Annex of Supplementary Information
PMCA Economic Consulting Page 94
‘A Growing Empire’ ... Continued from the Previous Page
Source: Supra footnote 6, p. 2 of this report.
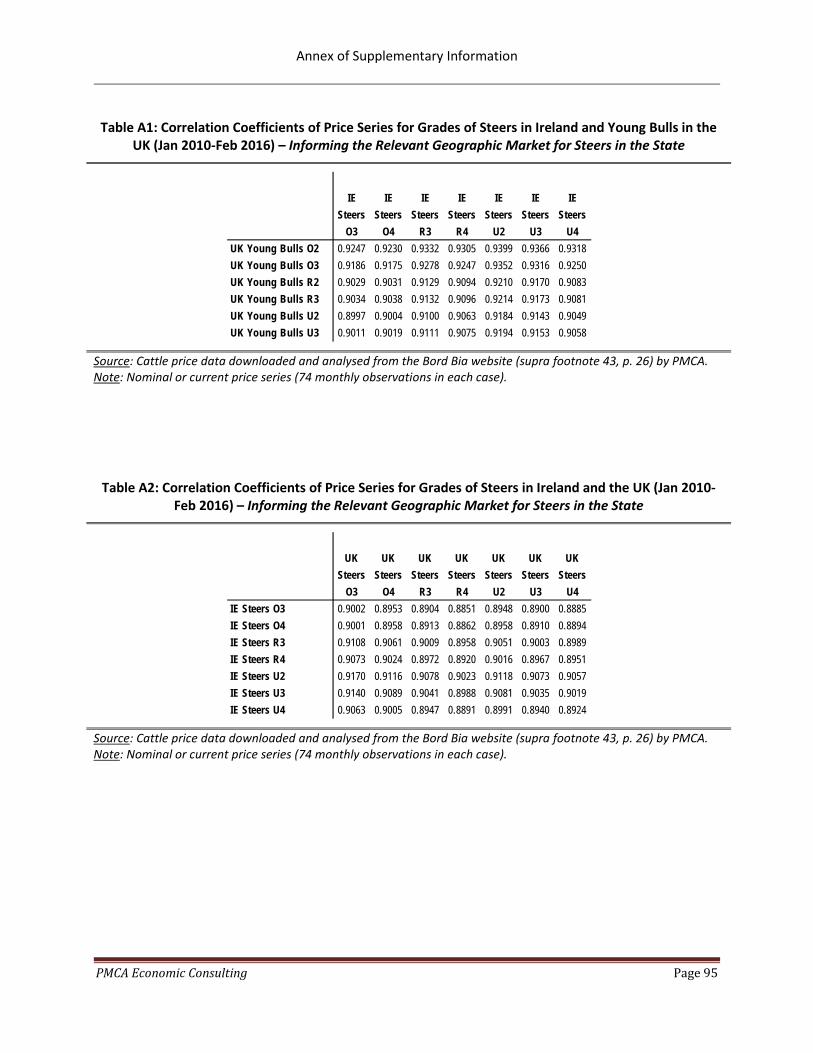
Annex of Supplementary Information
PMCA Economic Consulting Page 95
Table A1: Correlation Coefficients of Price Series for Grades of Steers in Ireland and Young Bulls in the UK (Jan 2010-Feb 2016) – Informing the Relevant Geographic Market for Steers in the State
Source: Cattle price data downloaded and analysed from the Bord Bia website (supra footnote 43, p. 26) by PMCA. Note: Nominal or current price series (74 monthly observations in each case).
Table A2: Correlation Coefficients of Price Series for Grades of Steers in Ireland and the UK (Jan 2010-Feb 2016) – Informing the Relevant Geographic Market for Steers in the State
Source: Cattle price data downloaded and analysed from the Bord Bia website (supra footnote 43, p. 26) by PMCA. Note: Nominal or current price series (74 monthly observations in each case).
IE Steers
O3
IE Steers
O4
IE Steers
R3
IE Steers
R4
IE Steers
U2
IE Steers
U3
IE Steers
U4UK Young Bulls O2 0.9247 0.9230 0.9332 0.9305 0.9399 0.9366 0.9318UK Young Bulls O3 0.9186 0.9175 0.9278 0.9247 0.9352 0.9316 0.9250UK Young Bulls R2 0.9029 0.9031 0.9129 0.9094 0.9210 0.9170 0.9083UK Young Bulls R3 0.9034 0.9038 0.9132 0.9096 0.9214 0.9173 0.9081UK Young Bulls U2 0.8997 0.9004 0.9100 0.9063 0.9184 0.9143 0.9049UK Young Bulls U3 0.9011 0.9019 0.9111 0.9075 0.9194 0.9153 0.9058
UK Steers
O3
UK Steers
O4
UK Steers
R3
UK Steers
R4
UK Steers
U2
UK Steers
U3
UK Steers
U4IE Steers O3 0.9002 0.8953 0.8904 0.8851 0.8948 0.8900 0.8885IE Steers O4 0.9001 0.8958 0.8913 0.8862 0.8958 0.8910 0.8894IE Steers R3 0.9108 0.9061 0.9009 0.8958 0.9051 0.9003 0.8989IE Steers R4 0.9073 0.9024 0.8972 0.8920 0.9016 0.8967 0.8951IE Steers U2 0.9170 0.9116 0.9078 0.9023 0.9118 0.9073 0.9057IE Steers U3 0.9140 0.9089 0.9041 0.8988 0.9081 0.9035 0.9019IE Steers U4 0.9063 0.9005 0.8947 0.8891 0.8991 0.8940 0.8924
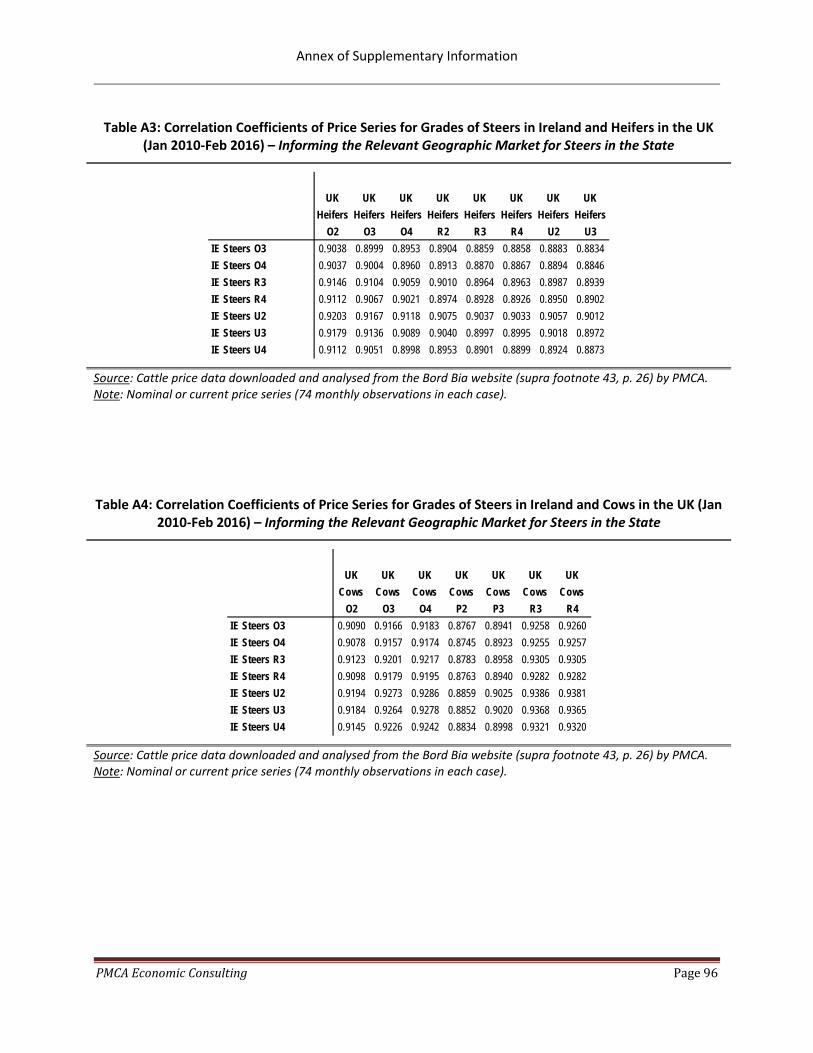
Annex of Supplementary Information
PMCA Economic Consulting Page 96
Table A3: Correlation Coefficients of Price Series for Grades of Steers in Ireland and Heifers in the UK (Jan 2010-Feb 2016) – Informing the Relevant Geographic Market for Steers in the State
Source: Cattle price data downloaded and analysed from the Bord Bia website (supra footnote 43, p. 26) by PMCA. Note: Nominal or current price series (74 monthly observations in each case).
Table A4: Correlation Coefficients of Price Series for Grades of Steers in Ireland and Cows in the UK (Jan 2010-Feb 2016) – Informing the Relevant Geographic Market for Steers in the State
Source: Cattle price data downloaded and analysed from the Bord Bia website (supra footnote 43, p. 26) by PMCA. Note: Nominal or current price series (74 monthly observations in each case).
UK Heifers
O2
UK Heifers
O3
UK Heifers
O4
UK Heifers
R2
UK Heifers
R3
UK Heifers
R4
UK Heifers
U2
UK Heifers
U3IE Steers O3 0.9038 0.8999 0.8953 0.8904 0.8859 0.8858 0.8883 0.8834IE Steers O4 0.9037 0.9004 0.8960 0.8913 0.8870 0.8867 0.8894 0.8846IE Steers R3 0.9146 0.9104 0.9059 0.9010 0.8964 0.8963 0.8987 0.8939IE Steers R4 0.9112 0.9067 0.9021 0.8974 0.8928 0.8926 0.8950 0.8902IE Steers U2 0.9203 0.9167 0.9118 0.9075 0.9037 0.9033 0.9057 0.9012IE Steers U3 0.9179 0.9136 0.9089 0.9040 0.8997 0.8995 0.9018 0.8972IE Steers U4 0.9112 0.9051 0.8998 0.8953 0.8901 0.8899 0.8924 0.8873
UK Cows
O2
UK Cows
O3
UK Cows
O4
UK Cows
P2
UK Cows
P3
UK Cows
R3
UK Cows
R4IE Steers O3 0.9090 0.9166 0.9183 0.8767 0.8941 0.9258 0.9260IE Steers O4 0.9078 0.9157 0.9174 0.8745 0.8923 0.9255 0.9257IE Steers R3 0.9123 0.9201 0.9217 0.8783 0.8958 0.9305 0.9305IE Steers R4 0.9098 0.9179 0.9195 0.8763 0.8940 0.9282 0.9282IE Steers U2 0.9194 0.9273 0.9286 0.8859 0.9025 0.9386 0.9381IE Steers U3 0.9184 0.9264 0.9278 0.8852 0.9020 0.9368 0.9365IE Steers U4 0.9145 0.9226 0.9242 0.8834 0.8998 0.9321 0.9320
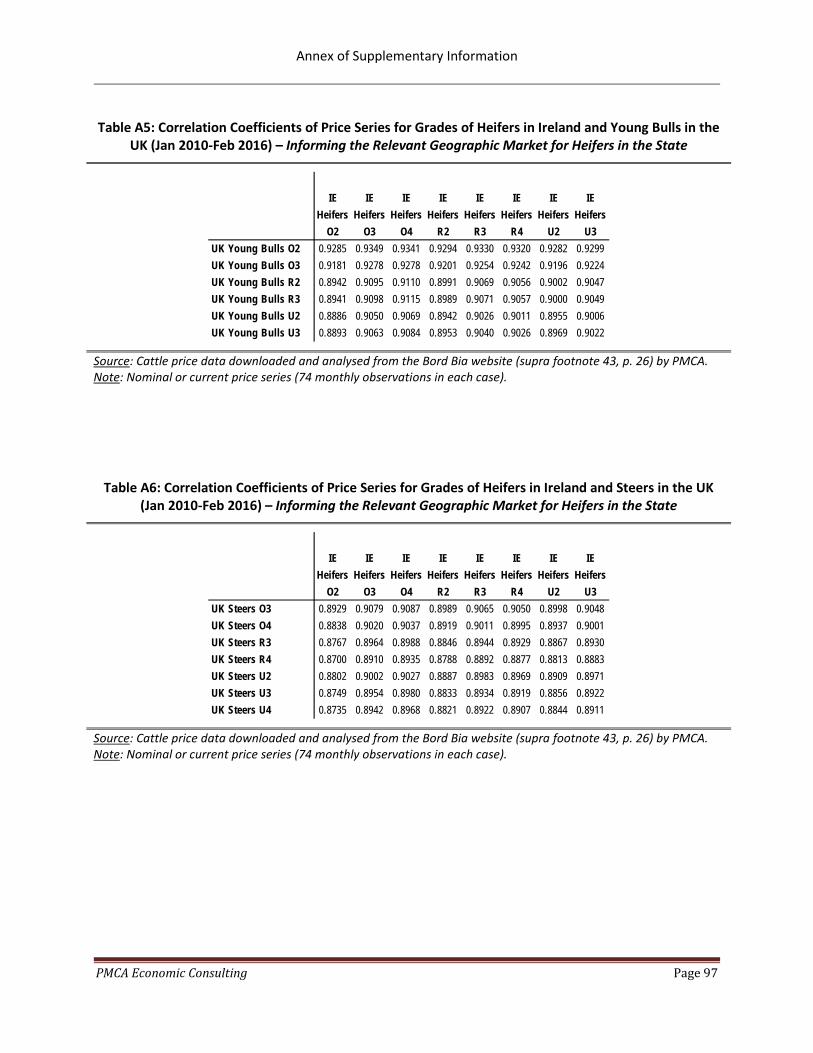
Annex of Supplementary Information
PMCA Economic Consulting Page 97
Table A5: Correlation Coefficients of Price Series for Grades of Heifers in Ireland and Young Bulls in the UK (Jan 2010-Feb 2016) – Informing the Relevant Geographic Market for Heifers in the State
Source: Cattle price data downloaded and analysed from the Bord Bia website (supra footnote 43, p. 26) by PMCA. Note: Nominal or current price series (74 monthly observations in each case).
Table A6: Correlation Coefficients of Price Series for Grades of Heifers in Ireland and Steers in the UK (Jan 2010-Feb 2016) – Informing the Relevant Geographic Market for Heifers in the State
Source: Cattle price data downloaded and analysed from the Bord Bia website (supra footnote 43, p. 26) by PMCA. Note: Nominal or current price series (74 monthly observations in each case).
IE Heifers
O2
IE Heifers
O3
IE Heifers
O4
IE Heifers
R2
IE Heifers
R3
IE Heifers
R4
IE Heifers
U2
IE Heifers
U3UK Young Bulls O2 0.9285 0.9349 0.9341 0.9294 0.9330 0.9320 0.9282 0.9299UK Young Bulls O3 0.9181 0.9278 0.9278 0.9201 0.9254 0.9242 0.9196 0.9224UK Young Bulls R2 0.8942 0.9095 0.9110 0.8991 0.9069 0.9056 0.9002 0.9047UK Young Bulls R3 0.8941 0.9098 0.9115 0.8989 0.9071 0.9057 0.9000 0.9049UK Young Bulls U2 0.8886 0.9050 0.9069 0.8942 0.9026 0.9011 0.8955 0.9006UK Young Bulls U3 0.8893 0.9063 0.9084 0.8953 0.9040 0.9026 0.8969 0.9022
IE Heifers
O2
IE Heifers
O3
IE Heifers
O4
IE Heifers
R2
IE Heifers
R3
IE Heifers
R4
IE Heifers
U2
IE Heifers
U3UK Steers O3 0.8929 0.9079 0.9087 0.8989 0.9065 0.9050 0.8998 0.9048UK Steers O4 0.8838 0.9020 0.9037 0.8919 0.9011 0.8995 0.8937 0.9001UK Steers R3 0.8767 0.8964 0.8988 0.8846 0.8944 0.8929 0.8867 0.8930UK Steers R4 0.8700 0.8910 0.8935 0.8788 0.8892 0.8877 0.8813 0.8883UK Steers U2 0.8802 0.9002 0.9027 0.8887 0.8983 0.8969 0.8909 0.8971UK Steers U3 0.8749 0.8954 0.8980 0.8833 0.8934 0.8919 0.8856 0.8922UK Steers U4 0.8735 0.8942 0.8968 0.8821 0.8922 0.8907 0.8844 0.8911
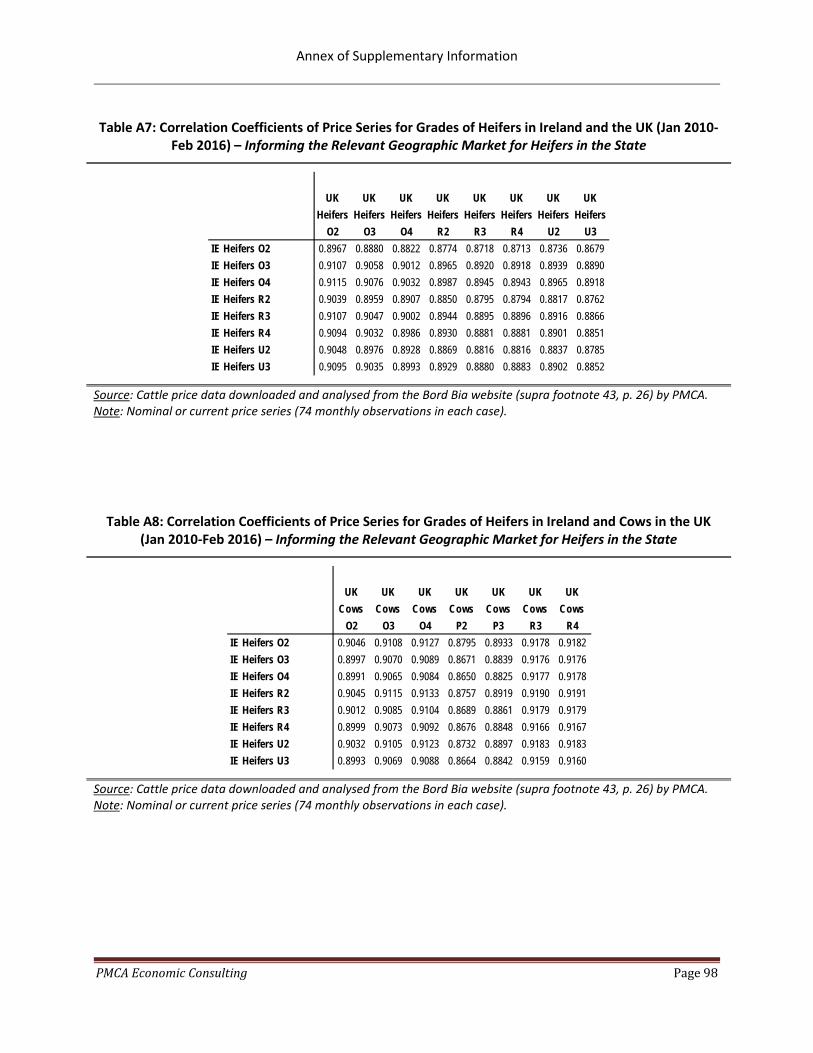
Annex of Supplementary Information
PMCA Economic Consulting Page 98
Table A7: Correlation Coefficients of Price Series for Grades of Heifers in Ireland and the UK (Jan 2010-Feb 2016) – Informing the Relevant Geographic Market for Heifers in the State
Source: Cattle price data downloaded and analysed from the Bord Bia website (supra footnote 43, p. 26) by PMCA. Note: Nominal or current price series (74 monthly observations in each case).
Table A8: Correlation Coefficients of Price Series for Grades of Heifers in Ireland and Cows in the UK (Jan 2010-Feb 2016) – Informing the Relevant Geographic Market for Heifers in the State
Source: Cattle price data downloaded and analysed from the Bord Bia website (supra footnote 43, p. 26) by PMCA. Note: Nominal or current price series (74 monthly observations in each case).
UK Heifers
O2
UK Heifers
O3
UK Heifers
O4
UK Heifers
R2
UK Heifers
R3
UK Heifers
R4
UK Heifers
U2
UK Heifers
U3IE Heifers O2 0.8967 0.8880 0.8822 0.8774 0.8718 0.8713 0.8736 0.8679IE Heifers O3 0.9107 0.9058 0.9012 0.8965 0.8920 0.8918 0.8939 0.8890IE Heifers O4 0.9115 0.9076 0.9032 0.8987 0.8945 0.8943 0.8965 0.8918IE Heifers R2 0.9039 0.8959 0.8907 0.8850 0.8795 0.8794 0.8817 0.8762IE Heifers R3 0.9107 0.9047 0.9002 0.8944 0.8895 0.8896 0.8916 0.8866IE Heifers R4 0.9094 0.9032 0.8986 0.8930 0.8881 0.8881 0.8901 0.8851IE Heifers U2 0.9048 0.8976 0.8928 0.8869 0.8816 0.8816 0.8837 0.8785IE Heifers U3 0.9095 0.9035 0.8993 0.8929 0.8880 0.8883 0.8902 0.8852
UK Cows
O2
UK Cows
O3
UK Cows
O4
UK Cows
P2
UK Cows
P3
UK Cows
R3
UK Cows
R4IE Heifers O2 0.9046 0.9108 0.9127 0.8795 0.8933 0.9178 0.9182IE Heifers O3 0.8997 0.9070 0.9089 0.8671 0.8839 0.9176 0.9176IE Heifers O4 0.8991 0.9065 0.9084 0.8650 0.8825 0.9177 0.9178IE Heifers R2 0.9045 0.9115 0.9133 0.8757 0.8919 0.9190 0.9191IE Heifers R3 0.9012 0.9085 0.9104 0.8689 0.8861 0.9179 0.9179IE Heifers R4 0.8999 0.9073 0.9092 0.8676 0.8848 0.9166 0.9167IE Heifers U2 0.9032 0.9105 0.9123 0.8732 0.8897 0.9183 0.9183IE Heifers U3 0.8993 0.9069 0.9088 0.8664 0.8842 0.9159 0.9160
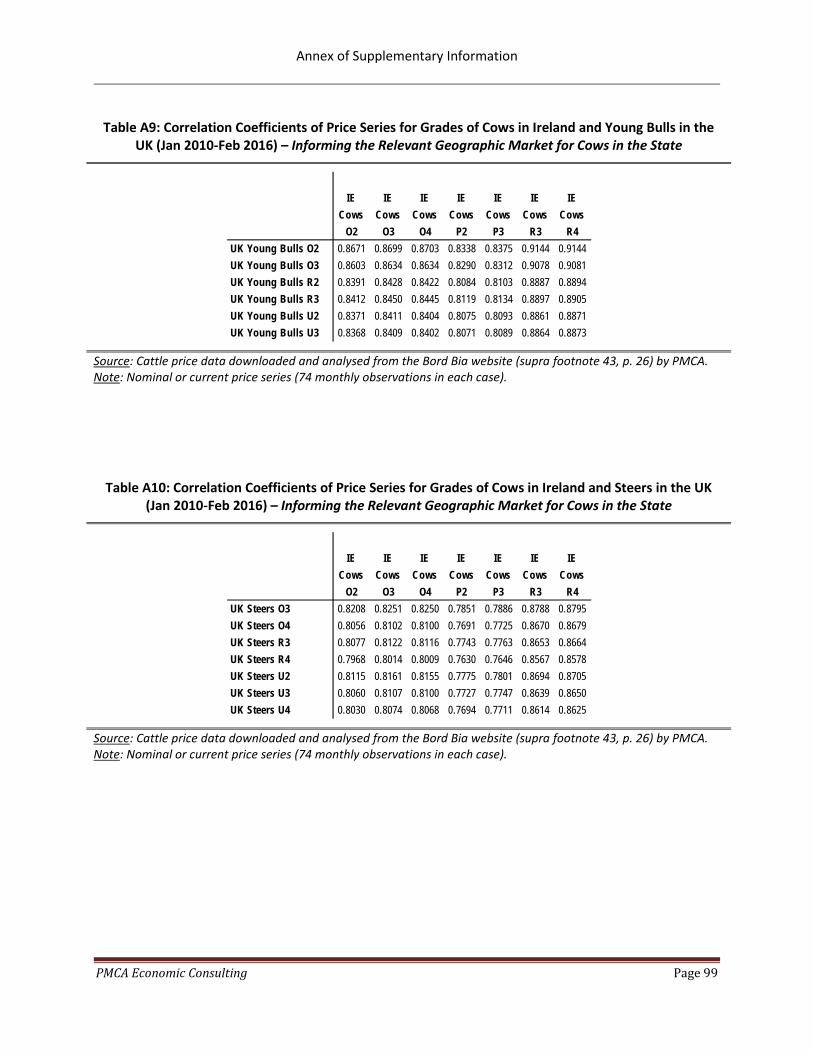
Annex of Supplementary Information
PMCA Economic Consulting Page 99
Table A9: Correlation Coefficients of Price Series for Grades of Cows in Ireland and Young Bulls in the UK (Jan 2010-Feb 2016) – Informing the Relevant Geographic Market for Cows in the State
Source: Cattle price data downloaded and analysed from the Bord Bia website (supra footnote 43, p. 26) by PMCA. Note: Nominal or current price series (74 monthly observations in each case).
Table A10: Correlation Coefficients of Price Series for Grades of Cows in Ireland and Steers in the UK (Jan 2010-Feb 2016) – Informing the Relevant Geographic Market for Cows in the State
Source: Cattle price data downloaded and analysed from the Bord Bia website (supra footnote 43, p. 26) by PMCA. Note: Nominal or current price series (74 monthly observations in each case).
IE Cows
O2
IE Cows
O3
IE Cows
O4
IE Cows
P2
IE Cows
P3
IE Cows
R3
IE Cows
R4UK Young Bulls O2 0.8671 0.8699 0.8703 0.8338 0.8375 0.9144 0.9144UK Young Bulls O3 0.8603 0.8634 0.8634 0.8290 0.8312 0.9078 0.9081UK Young Bulls R2 0.8391 0.8428 0.8422 0.8084 0.8103 0.8887 0.8894UK Young Bulls R3 0.8412 0.8450 0.8445 0.8119 0.8134 0.8897 0.8905UK Young Bulls U2 0.8371 0.8411 0.8404 0.8075 0.8093 0.8861 0.8871UK Young Bulls U3 0.8368 0.8409 0.8402 0.8071 0.8089 0.8864 0.8873
IE Cows
O2
IE Cows
O3
IE Cows
O4
IE Cows
P2
IE Cows
P3
IE Cows
R3
IE Cows
R4UK Steers O3 0.8208 0.8251 0.8250 0.7851 0.7886 0.8788 0.8795UK Steers O4 0.8056 0.8102 0.8100 0.7691 0.7725 0.8670 0.8679UK Steers R3 0.8077 0.8122 0.8116 0.7743 0.7763 0.8653 0.8664UK Steers R4 0.7968 0.8014 0.8009 0.7630 0.7646 0.8567 0.8578UK Steers U2 0.8115 0.8161 0.8155 0.7775 0.7801 0.8694 0.8705UK Steers U3 0.8060 0.8107 0.8100 0.7727 0.7747 0.8639 0.8650UK Steers U4 0.8030 0.8074 0.8068 0.7694 0.7711 0.8614 0.8625

Annex of Supplementary Information
PMCA Economic Consulting Page 100
Table A11: Correlation Coefficients of Price Series for Grades of Cows in Ireland and Heifers in the UK (Jan 2010-Feb 2016) – Informing the Relevant Geographic Market for Cows in the State
Source: Cattle price data downloaded and analysed from the Bord Bia website (supra footnote 43, p. 26) by PMCA. Note: Nominal or current price series (74 monthly observations in each case).
Table A12: Correlation Coefficients of Price Series for Grades of Cows in Ireland and the UK (Jan 2010-Feb 2016) – Informing the Relevant Geographic Market for Cows in the State
Source: Cattle price data downloaded by PMCA from the Bord Bia website (supra footnote 43, p. 26). Note: Nominal or current price series (74 monthly observations in each case). Cells shaded in green are pairs with correlation coefficients of 0.95 or greater.
IE Cows
O2
IE Cows
O3
IE Cows
O4
IE Cows
P2
IE Cows
P3
IE Cows
R3
IE Cows
R4UK Heifers O2 0.8255 0.8301 0.8302 0.7872 0.7932 0.8860 0.8866UK Heifers O3 0.8191 0.8238 0.8236 0.7838 0.7880 0.8777 0.8785UK Heifers O4 0.8080 0.8126 0.8123 0.7727 0.7757 0.8684 0.8694UK Heifers R2 0.8097 0.8145 0.8141 0.7749 0.7785 0.8675 0.8686UK Heifers R3 0.8056 0.8101 0.8094 0.7728 0.7746 0.8620 0.8631UK Heifers R4 0.8022 0.8067 0.8060 0.7693 0.7707 0.8598 0.8608UK Heifers U2 0.8074 0.8121 0.8114 0.7742 0.7765 0.8642 0.8654UK Heifers U3 0.8016 0.8062 0.8054 0.7690 0.7705 0.8582 0.8594
UK Cows
O2
UK Cows
O3
UK Cows
O4
UK Cows
P2
UK Cows
P3
UK Cows
R3
UK Cows
R4IE Cows O2 0.9399 0.9445 0.9442 0.9337 0.9336 0.9482 0.9473IE Cows O3 0.9439 0.9489 0.9489 0.9372 0.9371 0.9528 0.9523IE Cows O4 0.9451 0.9499 0.9500 0.9388 0.9386 0.9533 0.9530IE Cows P2 0.9250 0.9288 0.9275 0.9227 0.9208 0.9312 0.9302IE Cows P3 0.9405 0.9447 0.9441 0.9401 0.9368 0.9457 0.9453IE Cows R3 0.9484 0.9540 0.9546 0.9303 0.9367 0.9604 0.9598IE Cows R4 0.9488 0.9545 0.9553 0.9306 0.9370 0.9612 0.9607

Annex of Supplementary Information
PMCA Economic Consulting Page 101
Table A13: Details of the Average Monthly Differential in Cattle Prices between Ireland and the UK (2010-2015) – Young Bulls, Steers, Heifers and Cows
Source: Cattle price data downloaded and analysed from the Bord Bia website (supra footnote 43, p. 26) by PMCA. Note: Nominal or current price series (72 monthly observations in each case). The specific grades within each type of cattle (young bulls, steers, heifers and cows) are those available in the Bord Bia data. This table underpins the graphs shown in Figure 3.2-Figure 3.6 in the main body of the report (pp. 45-49).
2010 2011 2012 2013 2014 2015
Type Grade IE minus UK IE minus UK IE minus UK IE minus UK IE minus UK IE minus UKYoung Bulls O2 0.54 11.27 -8.57 -27.62 -41.93 -34.64Young Bulls O3 -1.29 8.27 -13.39 -31.91 -49.32 -46.29Young Bulls R2 -5.33 4.44 -20.89 -34.93 -56.01 -65.72Young Bulls R3 -3.94 4.67 -19.45 -32.28 -52.75 -64.59Young Bulls U2 -4.12 3.46 -24.50 -37.92 -60.27 -73.09Young Bulls U3 -3.37 4.16 -23.04 -36.98 -58.96 -70.91
Young Bulls Average -2.92 6.04 -18.31 -33.61 -53.21 -59.21
Steers O3 -25.89 -13.42 -36.08 -49.66 -56.76 -70.63Steers O4 -32.09 -18.03 -41.23 -57.25 -68.28 -80.72Steers R3 -23.46 -12.92 -37.67 -48.79 -65.44 -81.92Steers R4 -27.62 -15.08 -40.53 -53.61 -72.66 -86.93Steers U2 -18.75 -11.34 -38.92 -53.80 -68.53 -83.19Steers U3 -19.17 -9.62 -35.72 -47.85 -66.45 -80.86Steers U4 -20.23 -8.82 -34.78 -45.87 -67.15 -80.61
Steers Average -23.89 -12.75 -37.85 -50.97 -66.47 -80.69
Heifers O2 -17.25 0.99 -15.91 -27.42 -45.80 -46.54Heifers O3 -17.29 -1.68 -21.19 -28.40 -49.83 -56.53Heifers O4 -24.76 -8.47 -29.46 -40.53 -60.14 -68.38Heifers R2 -15.85 -2.37 -22.46 -31.06 -55.31 -69.38Heifers R3 -15.36 -2.16 -22.39 -28.46 -54.36 -69.81Heifers R4 -17.26 -3.71 -24.35 -31.21 -57.39 -71.57Heifers U2 -12.58 1.06 -22.82 -29.42 -55.93 -72.40Heifers U3 -11.40 1.58 -20.66 -25.86 -53.26 -71.19
Heifers Average -16.47 -1.84 -22.40 -30.29 -54.00 -65.73
Cows O2 16.98 17.68 4.47 11.65 0.29 11.53Cows O3 11.59 9.41 -2.61 3.89 -6.35 2.96Cows O4 10.23 8.32 -3.58 2.73 -7.82 1.27Cows P2 28.35 29.46 21.46 24.54 20.26 34.44Cows P3 31.19 31.48 23.04 26.20 18.16 36.66Cows R3 2.60 0.00 -6.83 7.45 -8.70 -9.04Cows R4 3.16 1.28 -5.46 9.04 -6.45 -6.36
Cows Average 14.87 13.95 4.36 12.21 1.34 10.21
Cattle Grade and TypeAverage Monthly Price Differential (c/kg DW)
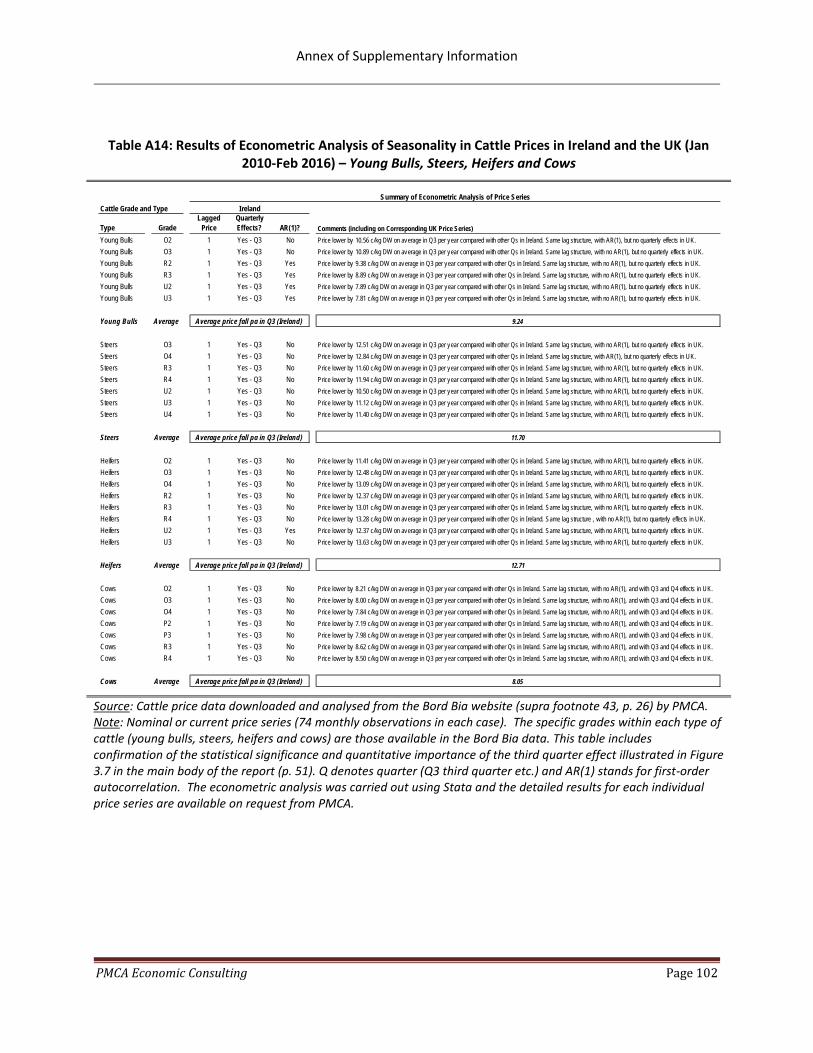
Annex of Supplementary Information
PMCA Economic Consulting Page 102
Table A14: Results of Econometric Analysis of Seasonality in Cattle Prices in Ireland and the UK (Jan 2010-Feb 2016) – Young Bulls, Steers, Heifers and Cows
Source: Cattle price data downloaded and analysed from the Bord Bia website (supra footnote 43, p. 26) by PMCA. Note: Nominal or current price series (74 monthly observations in each case). The specific grades within each type of cattle (young bulls, steers, heifers and cows) are those available in the Bord Bia data. This table includes confirmation of the statistical significance and quantitative importance of the third quarter effect illustrated in Figure 3.7 in the main body of the report (p. 51). Q denotes quarter (Q3 third quarter etc.) and AR(1) stands for first-order autocorrelation. The econometric analysis was carried out using Stata and the detailed results for each individual price series are available on request from PMCA.
Type GradeLagged
PriceQuarterly Effects? AR(1)? Comments (including on Corresponding UK Price Series)
Young Bulls O2 1 Yes - Q3 No Price lower by 10.56 c/kg DW on average in Q3 per year compared with other Qs in Ireland. Same lag structure, with AR(1), but no quarterly effects in UK.Young Bulls O3 1 Yes - Q3 No Price lower by 10.89 c/kg DW on average in Q3 per year compared with other Qs in Ireland. Same lag structure, with no AR(1), but no quarterly effects in UK. Young Bulls R2 1 Yes - Q3 Yes Price lower by 9.38 c/kg DW on average in Q3 per year compared with other Qs in Ireland. Same lag structure, with no AR(1), but no quarterly effects in UK.Young Bulls R3 1 Yes - Q3 Yes Price lower by 8.89 c/kg DW on average in Q3 per year compared with other Qs in Ireland. Same lag structure, with no AR(1), but no quarterly effects in UK.Young Bulls U2 1 Yes - Q3 Yes Price lower by 7.89 c/kg DW on average in Q3 per year compared with other Qs in Ireland. Same lag structure, with no AR(1), but no quarterly effects in UK.Young Bulls U3 1 Yes - Q3 Yes Price lower by 7.81 c/kg DW on average in Q3 per year compared with other Qs in Ireland. Same lag structure, with no AR(1), but no quarterly effects in UK.
Young Bulls Average 9.24
Steers O3 1 Yes - Q3 No Price lower by 12.51 c/kg DW on average in Q3 per year compared with other Qs in Ireland. Same lag structure, with no AR(1), but no quarterly effects in UK.Steers O4 1 Yes - Q3 No Price lower by 12.84 c/kg DW on average in Q3 per year compared with other Qs in Ireland. Same lag structure, with AR(1), but no quarterly effects in UK.Steers R3 1 Yes - Q3 No Price lower by 11.60 c/kg DW on average in Q3 per year compared with other Qs in Ireland. Same lag structure, with no AR(1), but no quarterly effects in UK.Steers R4 1 Yes - Q3 No Price lower by 11.94 c/kg DW on average in Q3 per year compared with other Qs in Ireland. Same lag structure, with no AR(1), but no quarterly effects in UK.Steers U2 1 Yes - Q3 No Price lower by 10.50 c/kg DW on average in Q3 per year compared with other Qs in Ireland. Same lag structure, with no AR(1), but no quarterly effects in UK.Steers U3 1 Yes - Q3 No Price lower by 11.12 c/kg DW on average in Q3 per year compared with other Qs in Ireland. Same lag structure, with no AR(1), but no quarterly effects in UK.Steers U4 1 Yes - Q3 No Price lower by 11.40 c/kg DW on average in Q3 per year compared with other Qs in Ireland. Same lag structure, with no AR(1), but no quarterly effects in UK.
Steers Average 11.70
Heifers O2 1 Yes - Q3 No Price lower by 11.41 c/kg DW on average in Q3 per year compared with other Qs in Ireland. Same lag structure, with no AR(1), but no quarterly effects in UK.Heifers O3 1 Yes - Q3 No Price lower by 12.48 c/kg DW on average in Q3 per year compared with other Qs in Ireland. Same lag structure, with no AR(1), but no quarterly effects in UK.Heifers O4 1 Yes - Q3 No Price lower by 13.09 c/kg DW on average in Q3 per year compared with other Qs in Ireland. Same lag structure, with no AR(1), but no quarterly effects in UK.Heifers R2 1 Yes - Q3 No Price lower by 12.37 c/kg DW on average in Q3 per year compared with other Qs in Ireland. Same lag structure, with no AR(1), but no quarterly effects in UK.Heifers R3 1 Yes - Q3 No Price lower by 13.01 c/kg DW on average in Q3 per year compared with other Qs in Ireland. Same lag structure, with no AR(1), but no quarterly effects in UK.Heifers R4 1 Yes - Q3 No Price lower by 13.28 c/kg DW on average in Q3 per year compared with other Qs in Ireland. Same lag structure , with no AR(1), but no quarterly effects in UK.Heifers U2 1 Yes - Q3 Yes Price lower by 12.37 c/kg DW on average in Q3 per year compared with other Qs in Ireland. Same lag structure, with no AR(1), but no quarterly effects in UK.Heifers U3 1 Yes - Q3 No Price lower by 13.63 c/kg DW on average in Q3 per year compared with other Qs in Ireland. Same lag structure, with no AR(1), but no quarterly effects in UK.
Heifers Average 12.71
Cows O2 1 Yes - Q3 No Price lower by 8.21 c/kg DW on average in Q3 per year compared with other Qs in Ireland. Same lag structure, with no AR(1), and with Q3 and Q4 effects in UK.Cows O3 1 Yes - Q3 No Price lower by 8.00 c/kg DW on average in Q3 per year compared with other Qs in Ireland. Same lag structure, with no AR(1), and with Q3 and Q4 effects in UK.Cows O4 1 Yes - Q3 No Price lower by 7.84 c/kg DW on average in Q3 per year compared with other Qs in Ireland. Same lag structure, with no AR(1), and with Q3 and Q4 effects in UK.Cows P2 1 Yes - Q3 No Price lower by 7.19 c/kg DW on average in Q3 per year compared with other Qs in Ireland. Same lag structure, with no AR(1), and with Q3 and Q4 effects in UK.Cows P3 1 Yes - Q3 No Price lower by 7.98 c/kg DW on average in Q3 per year compared with other Qs in Ireland. Same lag structure, with no AR(1), and with Q3 and Q4 effects in UK.Cows R3 1 Yes - Q3 No Price lower by 8.62 c/kg DW on average in Q3 per year compared with other Qs in Ireland. Same lag structure, with no AR(1), and with Q3 and Q4 effects in UK.Cows R4 1 Yes - Q3 No Price lower by 8.50 c/kg DW on average in Q3 per year compared with other Qs in Ireland. Same lag structure, with no AR(1), and with Q3 and Q4 effects in UK.
Cows Average 8.05
Cattle Grade and TypeSummary of Econometric Analysis of Price Series
Average price fall pa in Q3 (Ireland)
Average price fall pa in Q3 (Ireland)
Average price fall pa in Q3 (Ireland)
Ireland
Average price fall pa in Q3 (Ireland)
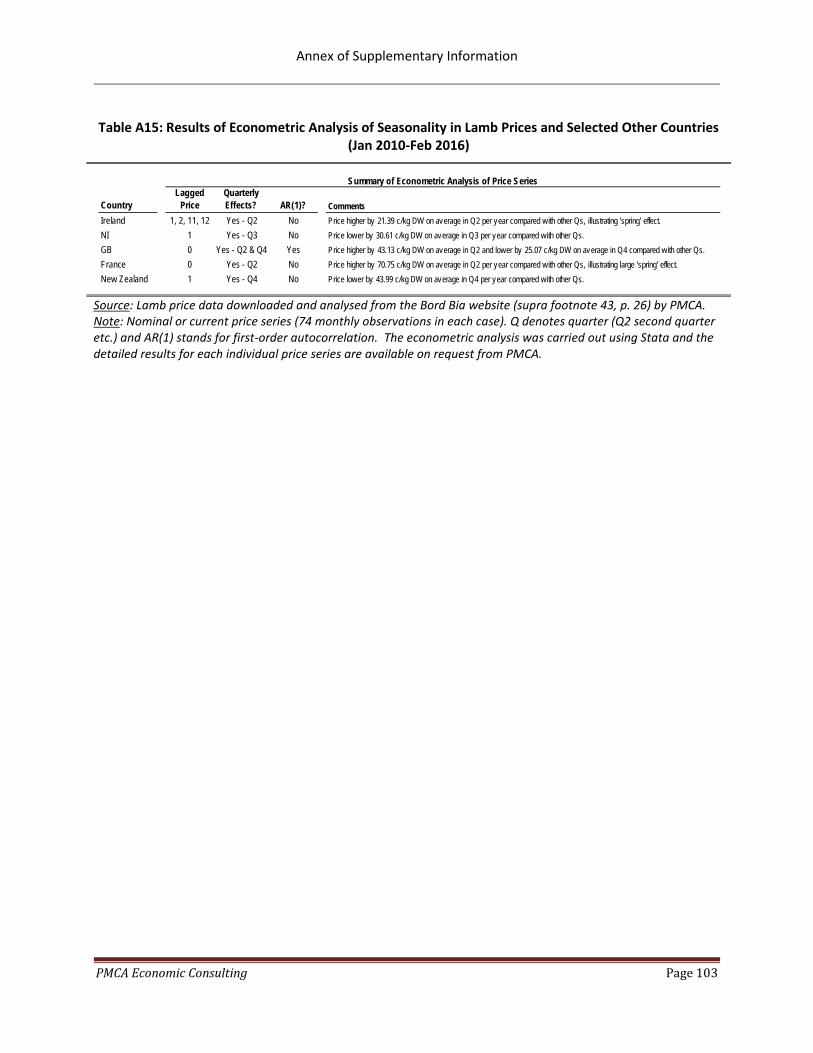
Annex of Supplementary Information
PMCA Economic Consulting Page 103
Table A15: Results of Econometric Analysis of Seasonality in Lamb Prices and Selected Other Countries (Jan 2010-Feb 2016)
Source: Lamb price data downloaded and analysed from the Bord Bia website (supra footnote 43, p. 26) by PMCA. Note: Nominal or current price series (74 monthly observations in each case). Q denotes quarter (Q2 second quarter etc.) and AR(1) stands for first-order autocorrelation. The econometric analysis was carried out using Stata and the detailed results for each individual price series are available on request from PMCA.
CountryLagged
PriceQuarterly Effects? AR(1)? Comments
Ireland 1, 2, 11, 12 Yes - Q2 No Price higher by 21.39 c/kg DW on average in Q2 per year compared with other Qs, illustrating 'spring' effect.NI 1 Yes - Q3 No Price lower by 30.61 c/kg DW on average in Q3 per year compared with other Qs.GB 0 Yes - Q2 & Q4 Yes Price higher by 43.13 c/kg DW on average in Q2 and lower by 25.07 c/kg DW on average in Q4 compared with other Qs.France 0 Yes - Q2 No Price higher by 70.75 c/kg DW on average in Q2 per year compared with other Qs, illustrating large 'spring' effect.New Zealand 1 Yes - Q4 No Price lower by 43.99 c/kg DW on average in Q4 per year compared with other Qs.
Summary of Econometric Analysis of Price Series
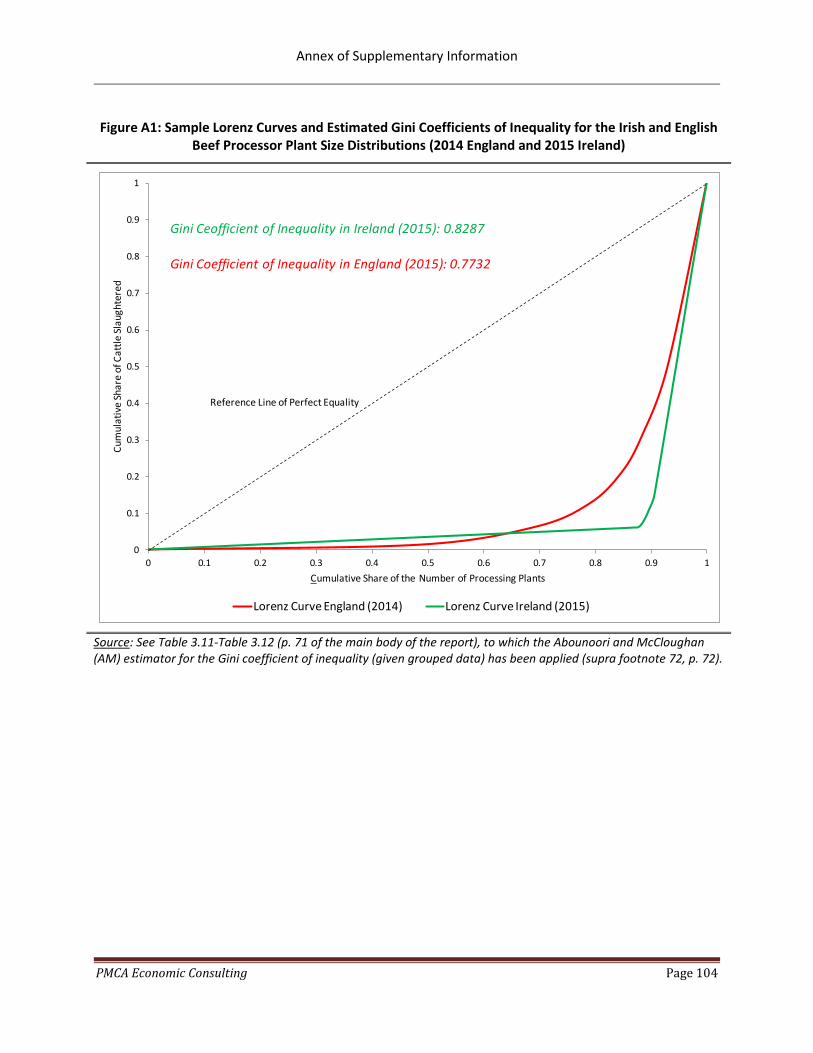
Annex of Supplementary Information
PMCA Economic Consulting Page 104
Figure A1: Sample Lorenz Curves and Estimated Gini Coefficients of Inequality for the Irish and English Beef Processor Plant Size Distributions (2014 England and 2015 Ireland)
Source: See Table 3.11-Table 3.12 (p. 71 of the main body of the report), to which the Abounoori and McCloughan (AM) estimator for the Gini coefficient of inequality (given grouped data) has been applied (supra footnote 72, p. 72).
0
0.1
0.2
0.3
0.4
0.5
0.6
0.7
0.8
0.9
1
0 0.1 0.2 0.3 0.4 0.5 0.6 0.7 0.8 0.9 1
Cum
ulat
ive
Shar
e of
Cat
tle S
laug
hter
ed
Cumulative Share of the Number of Processing Plants
Lorenz Curve England (2014) Lorenz Curve Ireland (2015)
Gini Ceofficient of Inequality in Ireland (2015): 0.8287
Gini Coefficient of Inequality in England (2015): 0.7732
Reference Line of Perfect Equality