The investment platform for the Energy Transition
33
22 April 2021 Q1 2021 Results Forming for the Energy Transition The investment platform Neste refinery - Singapore
Transcript of The investment platform for the Energy Transition
22 April 2021Q1 2021 Results
Formingfor the Energy TransitionThe investment platform
Nes
tere
finer
y-S
inga
pore
2Technip Energies – Q1 2021 Results
DisclaimerThis document is intended for informational purposes only for the shareholders of Technip Energies. This Press Release contains information within the meaning of Article 7(1) of the EU Market Abuse Regulation. It is not intended for distribution in jurisdictions that require prior regulatory review and authorization to distribute a document of this nature.
Forward looking statementsThis document contains “forward-looking statements” as defined in Section 27A of the United States Securities Act of 1933, as amended, and Section 21E of the United States Securities Exchange Act of 1934, as amended. Forward-looking statements usually relate to future events and anticipated revenues, earnings, cash flows or other aspects of Technip Energies’ operations or operating results.
Forward-looking statements are often identified by the words “believe”, “expect”, “anticipate”, “plan”, “intend”, “foresee”, “should”, “would”, “could”, “may”, “estimate”, “outlook”, and similar expressions, including the negative thereof. The absence of these words, however, does not mean that the statements are not forward-looking. These forward-looking statements are based on Technip Energies’ current expectations, beliefs and assumptions concerning future developments and business conditions and their potential effect on Technip Energies. While Technip Energies believes that these forward-looking statements are reasonable as and when made, there can be no assurance that future developments affecting Technip Energies will be those that Technip Energies anticipates. All of Technip Energies’ forward-looking statements involve risks and uncertainties (some of which are significant or beyond Technip Energies’ control) and assumptions that could cause actual results to differ materially from Technip Energies’ historical experience and Technip Energies’ present expectations or projections. Should one or more of these risks or uncertainties materialize, or should underlying assumptions prove incorrect, actual results may vary materially from those set forth in the forward-looking statements. For information regarding known material factors that could cause actual results to differ from projected results, please see Technip Energies’ risk factors set forth in Technip Energies’ filings with the U.S. Securities and Exchange Commission, which include amendment no. 4 to Technip Energies’ registration statement on Form F1 filed on February 11, 2021.
Forward-looking statements involve inherent risks and uncertainties and speak only as of the date they are made. Technip Energies undertakes no duty to and will not necessarily update any of the forward-looking statements in light of new information or future events, except to the extent required by applicable law.
3Technip Energies – Q1 2021 Results
Welcome
Business highlights
Financial highlights
Outlook
Arnaud PietonCEO
Bruno VibertCFO

4Technip Energies – Q1 2021 Results
Business highlightsArnaud Pieton - CEO

5Technip Energies – Q1 2021 Results
A leading E&T company for the Energy TransitionWhy invest in Technip Energies
• Leadership1 in LNG, H2 & ethylene • Growing in blue and green H2, sustainable chemistry & CO2
management
Strong positioning
Relevant capabilities • Global project delivery partner – with local expertise, smart
energy engineers and trusted execution • Extensive and evolving technology portfolio – ability to
integrate & scale up technologies
Financially robust• Extensive backlog & pipeline, strong revenue visibility with
margin expansion potential• Asset light with strong balance sheet – early cash conversion,
high ROIC2 potential and dividend commitment1World leader in LNG - based on delivery of over 20% of operating LNG capacity. Percentage is based on operating capacity. delivered by Technip Energies / total industry operating capacity as of December 2019; source: IHS; Market leader position based on installed base of hydrogen plants; World leader in ethylene - based on the number of ethylene production facilities awarded or technology licences selected since 2010; source IHS.2 Return on invested capital calculated as: NOPAT (Net Operating Profit After Tax) / Invested Equity (Equity + Financial Debt excl. IFRS 16 lease).
6Technip Energies – Q1 2021 Results
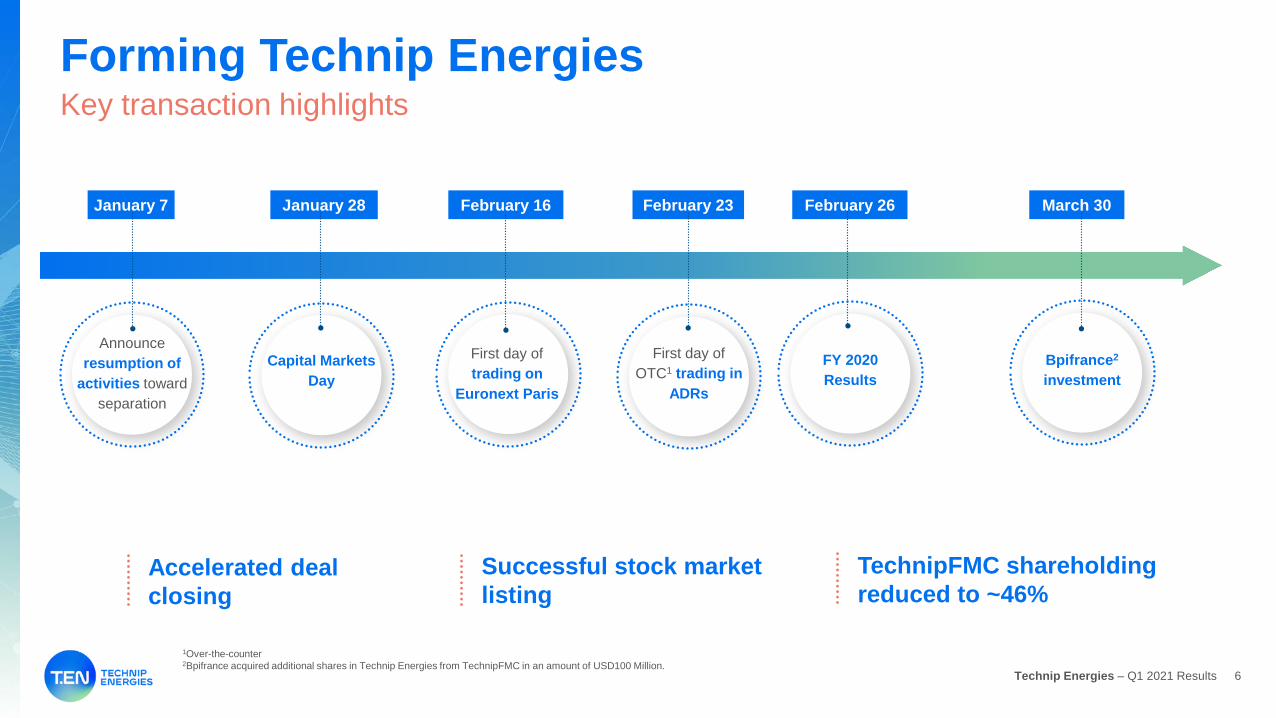
Forming Technip EnergiesKey transaction highlights
January 7
Announce resumption of
activities toward separation
January 28 February 23 February 26 March 30February 16
Successful stock market listing
TechnipFMC shareholding reduced to ~46%
Accelerated deal closing
Capital Markets Day
First day of trading on
Euronext Paris
First day of OTC1 trading in
ADRs
FY 2020 Results
Bpifrance2
investment
1Over-the-counter2Bpifrance acquired additional shares in Technip Energies from TechnipFMC in an amount of USD100 Million.
7Technip Energies – Q1 2021 Results
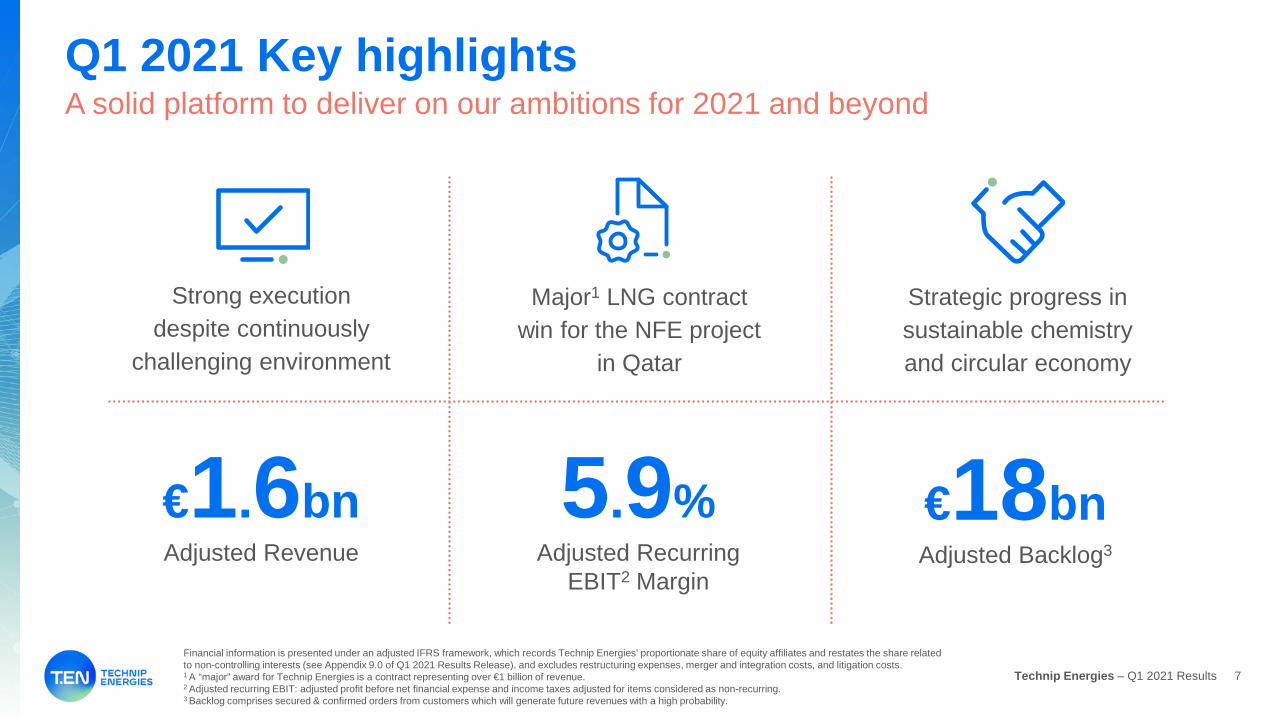
A solid platform to deliver on our ambitions for 2021 and beyond Q1 2021 Key highlights
5.9%Adjusted Recurring
EBIT2 Margin
€18bnAdjusted Backlog3
€1.6bnAdjusted Revenue
Major1 LNG contract win for the NFE project
in Qatar
Strategic progress in sustainable chemistry and circular economy
Strong execution despite continuously
challenging environment
Financial information is presented under an adjusted IFRS framework, which records Technip Energies’ proportionate share of equity affiliates and restates the share related to non-controlling interests (see Appendix 9.0 of Q1 2021 Results Release), and excludes restructuring expenses, merger and integration costs, and litigation costs. 1 A “major” award for Technip Energies is a contract representing over €1 billion of revenue.2 Adjusted recurring EBIT: adjusted profit before net financial expense and income taxes adjusted for items considered as non-recurring.3 Backlog comprises secured & confirmed orders from customers which will generate future revenues with a high probability.

8Technip Energies – Q1 2021 Results
Solid progress despite the challenging environment worldwideKey operational highlights
Offshore• Arctic LNG 2: Module
construction for train 1 reached 50% completion.
• Coral FLNG: Installation of 3 Turret Mooring System modules and first gas turbine generator.
LNG / FLNG
Downstream • Neste bio-refinery
expansion: Completion of all heavy lift activities.
• Hengli liquid ethylene cracker: Passed final performance acceptance test.
TPS1
• BP Tortue gas FPSO: Successful launch of hull, installation of Living Quarters.
• Energean Power gas FPSO: Successful completion of last heavy lift campaign in Singapore.
• Bapco Refinery expansion: Completion of heavy lifts in all areas of the refinery.
• ENOC Jebel Ali: Commercial completion certificate received.
Arctic LNG2
Neste SingaporeBapco
1Technology, Products & Services.
Jebel Ali
Energean

9Technip Energies – Q1 2021 Results
A leading partner for projects, services and productsSpotlight on recent major awards
NFE
North Field Expansion, Qatar• Delivery of four mega trains, each of 8Mtpa
capacity.• Significant CCS1 facility for 2.5 Mtpa of CO2;
>25% reduction in GHG emissions vs similar facilities.
• Early engagement: 50/50 JV with long-time partner Chiyoda, FEED provider.
1Carbon capture and sequestration.2Project management consultancy.
Barauni Refinery upgrade, India• Engineering, procurement, construction and
commissioning contract for BR9 Expansion Project.
• Upgrade enables production of cleaner fuels (BS VI Grade, similar to Euro VI) and petrochemicals.
Project Management Consultancy services (Middle East)• Multi-year PMC2 services award. • Consultancy, Project Engineering and
Management services for various projects.
Tianjin Nangang LNG Emergency Storage Project (China)• Notification of Award from Beijing Gas
Group Co., Ltd for the supply of 5 LNG marine loading arms.
Technology, Products & Services
Project Delivery

10Technip Energies – Q1 2021 Results
11%
40%
49%
Providing strong medium-term revenue visibilityA strengthened backlog
Backlog maturity per date of entry
19%
9%
30%
33%
10%
28%
7%
18%16%
32%
Q1 2021 ~ €18bn
2018~ €7bn
Backlog by geography in %
2020 & Q1 2021
2019
2018 & earlier
Russia
Middle East
Americas
Europe & AfricaAsia Pacific
• Strong backlog growth; geographically diversified• Early engagement strategy on all major projects
• Only 11% awarded before 2019• >70% Energy Transition, inc. LNG
Backlog comprises secured & confirmed orders from customers which will generate future revenues with a high probability.

11Technip Energies – Q1 2021 Results
Financial highlightsBruno Vibert - CFO

12Technip Energies – Q1 2021 Results
1.7Book-to-bill, TTM3
Q1 2021 Financial Highlights
Robust start to 2021; confirming full year guidance
€91mAdjusted Recurring EBIT1
€44mAdjusted Net profit2
€1.6bnAdjusted Revenue
€2.5bnNet cash
€6.5bnOrder Intake
Financial information is presented under an adjusted IFRS framework, which records Technip Energies’ proportionate share of equity affiliates and restates the share related to non-controlling interests (see Appendix 9.0 of Q1 2021 Results Release), and excludes restructuring expenses, merger and integration costs, and litigation costs. 1Adjusted recurring EBIT: adjusted profit before net financial expense and income taxes adjusted for items considered as non-recurring.2Net profit attributable to Technip Energies Group3Trailing 12 months.
13Technip Energies – Q1 2021 Results
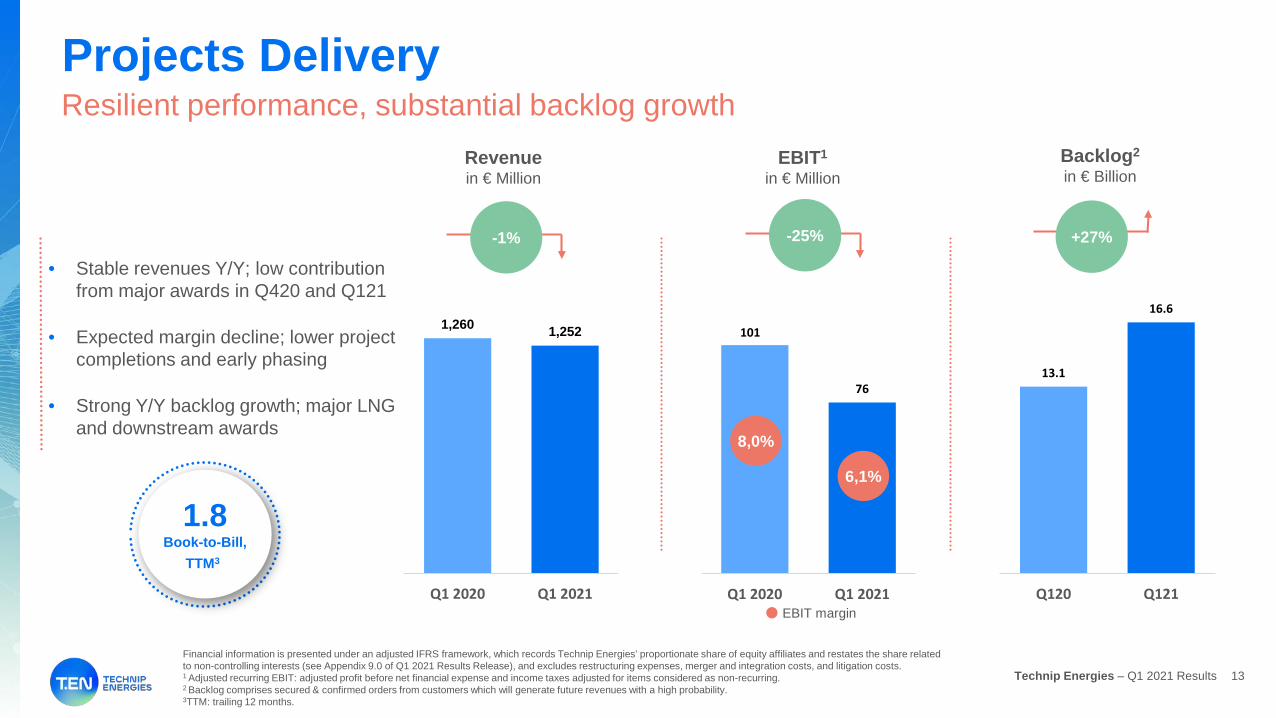
101
76
0
20
40
60
80
100
120
Q1 2020 Q1 2021
1,260 1,252
1,000
1,050
1,100
1,150
1,200
1,250
1,300
Q1 2020 Q1 2021
Resilient performance, substantial backlog growthProjects Delivery
• Stable revenues Y/Y; low contribution from major awards in Q420 and Q121
• Expected margin decline; lower project completions and early phasing
• Strong Y/Y backlog growth; major LNG and downstream awards
+X%
Revenuein € Million
13.1
16.6
3.0
7.0
11.0
15.0
Q120 Q121
-1% +27%
EBIT1
in € Million
-25%
Financial information is presented under an adjusted IFRS framework, which records Technip Energies’ proportionate share of equity affiliates and restates the share related to non-controlling interests (see Appendix 9.0 of Q1 2021 Results Release), and excludes restructuring expenses, merger and integration costs, and litigation costs. 1 Adjusted recurring EBIT: adjusted profit before net financial expense and income taxes adjusted for items considered as non-recurring.2 Backlog comprises secured & confirmed orders from customers which will generate future revenues with a high probability.3TTM: trailing 12 months.
1.8Book-to-Bill,
TTM3
Backlog2
in € Billion
EBIT margin
8,0%
6,1%
14Technip Energies – Q1 2021 Results
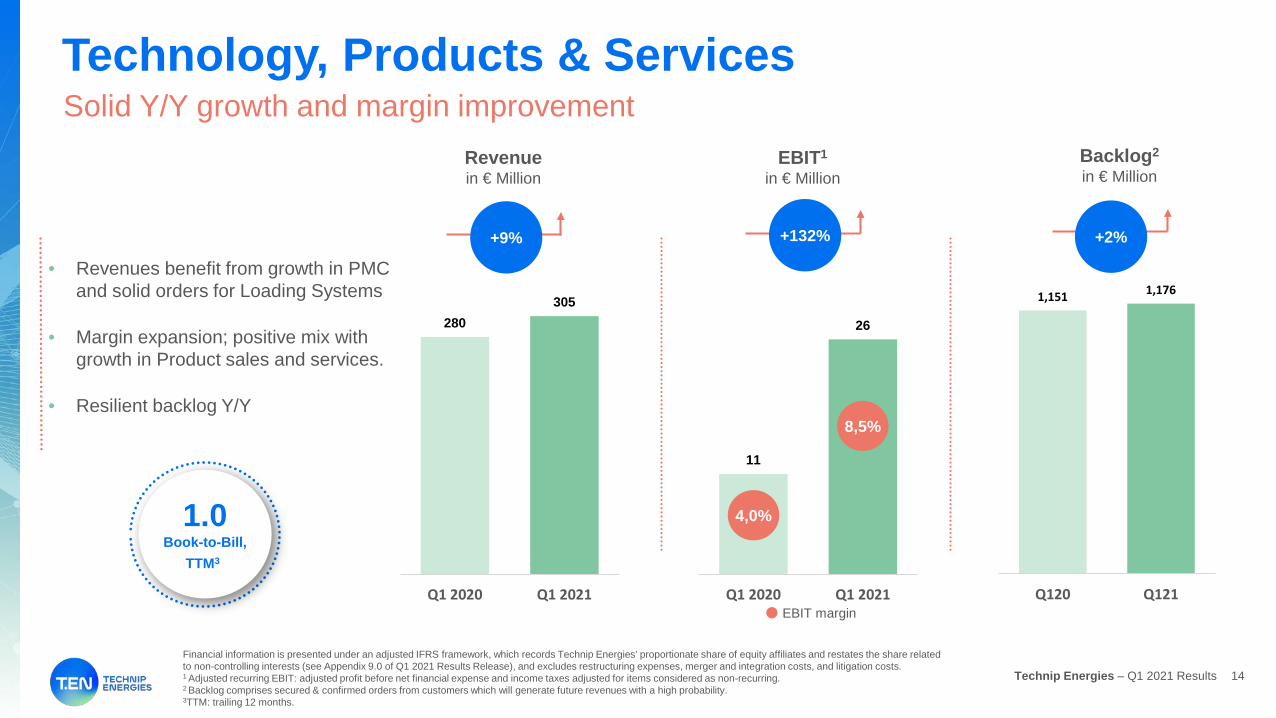
11
26
0
5
10
15
20
25
30
Q1 2020 Q1 2021
Solid Y/Y growth and margin improvement Technology, Products & Services
280305
0
50
100
150
200
250
300
Q1 2020 Q1 2021
+X%
1,151 1,176
200.0
300.0
400.0
500.0
600.0
700.0
800.0
900.0
1000.0
1100.0
1200.0
Q120 Q121
Financial information is presented under an adjusted IFRS framework, which records Technip Energies’ proportionate share of equity affiliates and restates the share related to non-controlling interests (see Appendix 9.0 of Q1 2021 Results Release), and excludes restructuring expenses, merger and integration costs, and litigation costs. 1 Adjusted recurring EBIT: adjusted profit before net financial expense and income taxes adjusted for items considered as non-recurring.2 Backlog comprises secured & confirmed orders from customers which will generate future revenues with a high probability.3TTM: trailing 12 months.
• Revenues benefit from growth in PMC and solid orders for Loading Systems
• Margin expansion; positive mix with growth in Product sales and services.
• Resilient backlog Y/Y
Revenuein € Million
+9% +2%
EBIT1
in € Million
+132%
Backlog2
in € Million
1.0Book-to-Bill,
TTM3
4,0%
8,5%
EBIT margin
15Technip Energies – Q1 2021 Results
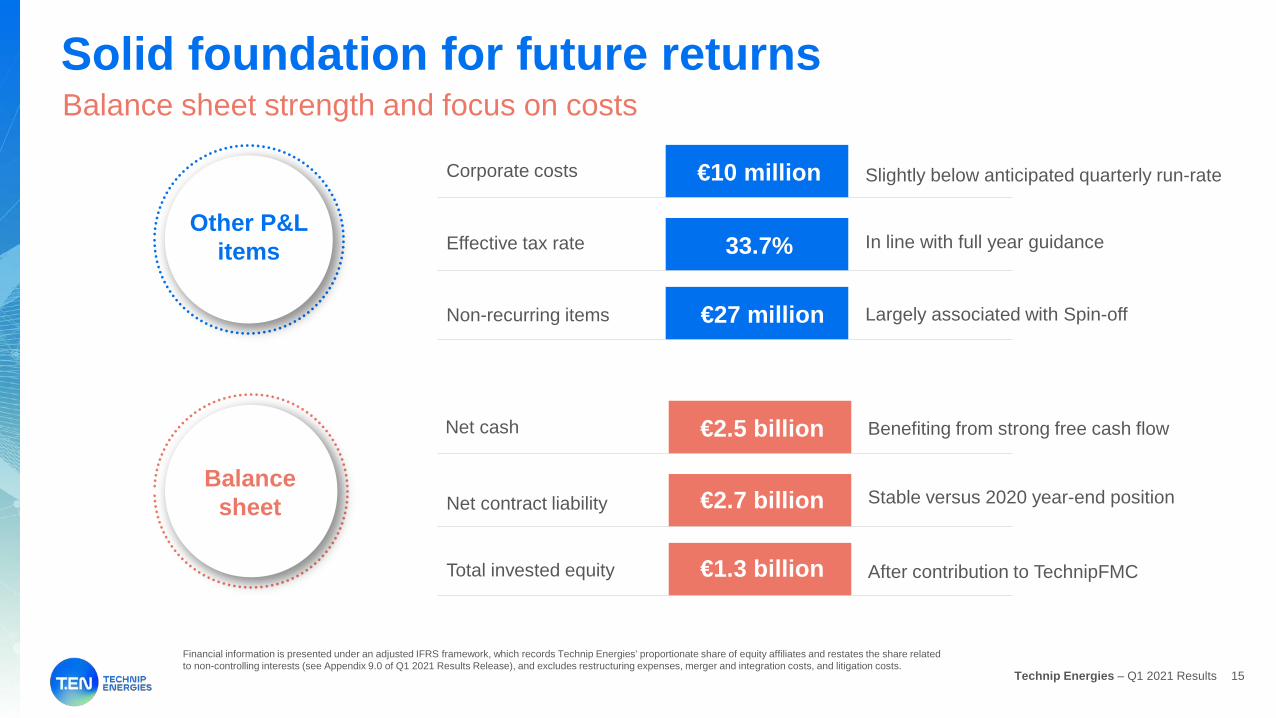
Balance sheet strength and focus on costsSolid foundation for future returns
Corporate costs
Effective tax rate
Non-recurring items
Net cash
Net contract liability
Total invested equity
€10 million Slightly below anticipated quarterly run-rate
In line with full year guidance
Largely associated with Spin-off
Benefiting from strong free cash flow
Stable versus 2020 year-end position
After contribution to TechnipFMC
Balance sheet
33.7%
€27 million
€2.5 billion
€2.7 billion
€1.3 billion
Other P&L items
Financial information is presented under an adjusted IFRS framework, which records Technip Energies’ proportionate share of equity affiliates and restates the share related to non-controlling interests (see Appendix 9.0 of Q1 2021 Results Release), and excludes restructuring expenses, merger and integration costs, and litigation costs.
16Technip Energies – Q1 2021 Results
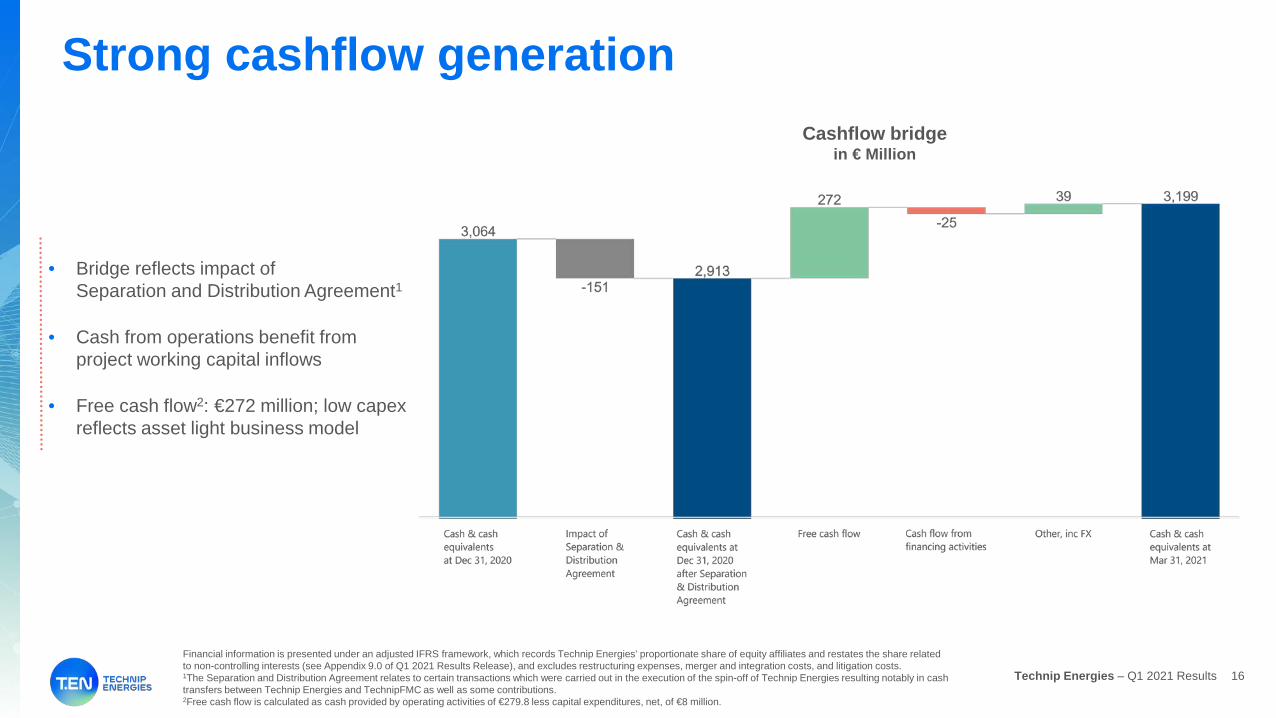
Strong cashflow generationCashflow bridge
in € Million
Financial information is presented under an adjusted IFRS framework, which records Technip Energies’ proportionate share of equity affiliates and restates the share related to non-controlling interests (see Appendix 9.0 of Q1 2021 Results Release), and excludes restructuring expenses, merger and integration costs, and litigation costs. 1The Separation and Distribution Agreement relates to certain transactions which were carried out in the execution of the spin-off of Technip Energies resulting notably in cash transfers between Technip Energies and TechnipFMC as well as some contributions.2Free cash flow is calculated as cash provided by operating activities of €279.8 less capital expenditures, net, of €8 million.
• Bridge reflects impact of Separation and Distribution Agreement1
• Cash from operations benefit from project working capital inflows
• Free cash flow2: €272 million; low capex reflects asset light business model

17Technip Energies – Q1 2021 Results
OutlookArnaud Pieton - CEO

18Technip Energies – Q1 2021 Results
Fueling Growth markets• Blue hydrogen, CO2 management,
Sustainable Chemistry
• Industry collaboration and innovation to deliver economic solutions
Strongly influencing Traditional markets• LNG, downstream &
petrochemical
• Key solutions: hydrogen, CCS, energy efficiency
Rising to the decarbonization challengeGrowth market solutions for traditional markets
Why Technip Energies is relevantTechnology integration skills Unique combination of LNG, hydrogen, renewables and CCUS expertise
Accelerating decarbonization
19Technip Energies – Q1 2021 Results
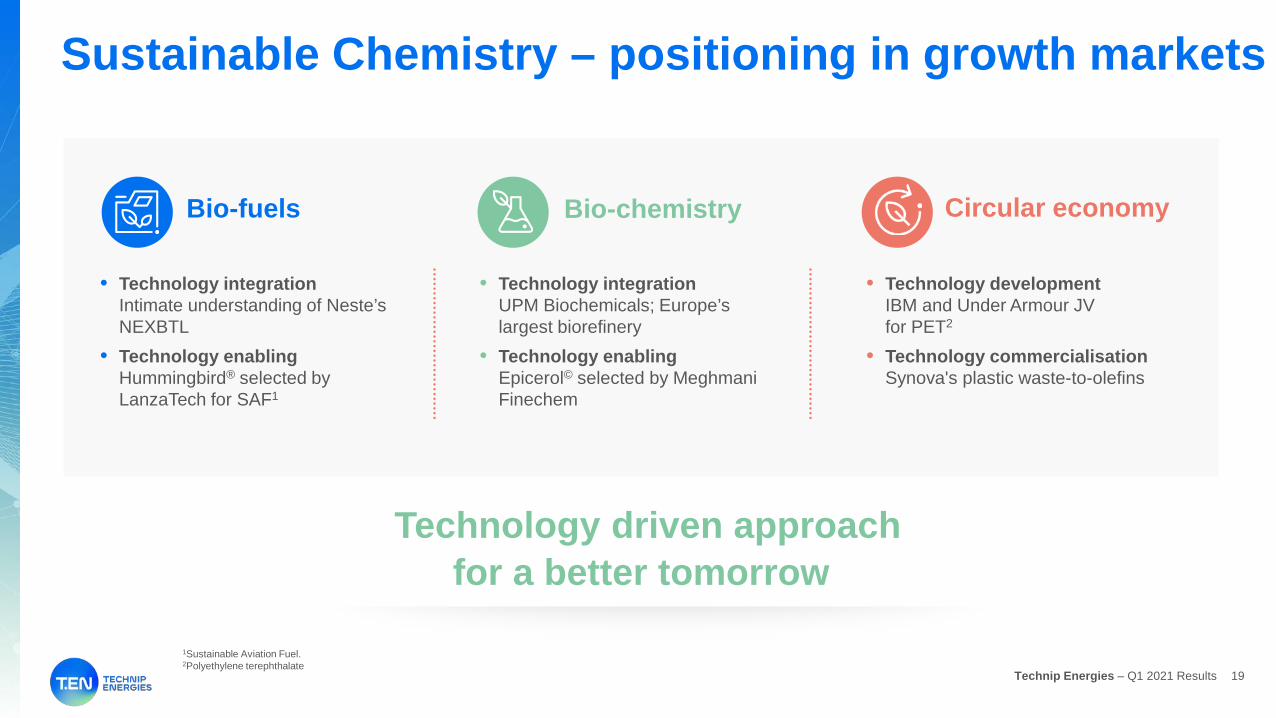
Sustainable Chemistry – positioning in growth markets
Technology driven approach for a better tomorrow
Bio-fuels Circular economyBio-chemistry
• Technology integrationIntimate understanding of Neste’s NEXBTL
• Technology enablingHummingbird® selected by LanzaTech for SAF1
• Technology developmentIBM and Under Armour JV for PET2
• Technology commercialisationSynova's plastic waste-to-olefins
• Technology integration UPM Biochemicals; Europe’s largest biorefinery
• Technology enabling Epicerol© selected by MeghmaniFinechem
1Sustainable Aviation Fuel.2Polyethylene terephthalate

20Technip Energies – Q1 2021 Results
23%
9%
37%
32%
80%
20%
Energy Transition contractsby project phase, 2020 – Q1 2021
Strong engagement in major growth marketsPositioning in Energy Transition
• Strong momentum in Energy Transition contract awards
1”Contracts” include concept and feasibility studies, FEEDs, EPC and services projects.
Energy Transition contracts By end market, 2020 – Q1 2021
EPC phase
Concept studies / FEED phase
Sustainable Chemistry
LNG
Carbon FreeEnergies
Decarbonization
• Majority of prospects remain in concept and study phase
• Notable activity in LNG, bio-fuels, bio-chemistry, hydrogen and CCUS
Energy Transition contracts1
secured 2020 – Q1 2021
>100

21Technip Energies – Q1 2021 Results
Integrating our sustainability strategy across our businessESG in action during Q1 2021
• Expose 90% of employees to inclusive leadership in 2021
• Hire 50% of women in 2021 graduate intake
• Garima initiative on women empowerment in India
Including• ESG roadmap and materiality
assessment launched
• Signatory of UN Global Compact
• ESG component in management compensation for 2021
Engaging
• Solid TTM1 safety performance: TRIR2 of 0.04
• Virtual site visits as part of our Covid-19 response plan
• >5%3 for re-used water consumption / waste recycling
Protecting• Dedicated “train the trainer”
compliance program
• Anti-Bribery and Corruption microlearning sessions
Complying
1Trailing 12-months.2TRIR: total recordable incident rate for 2020 of 0.04 compares with 5-year average of 0.12.3Target for 2021.
22Technip Energies – Q1 2021 Results
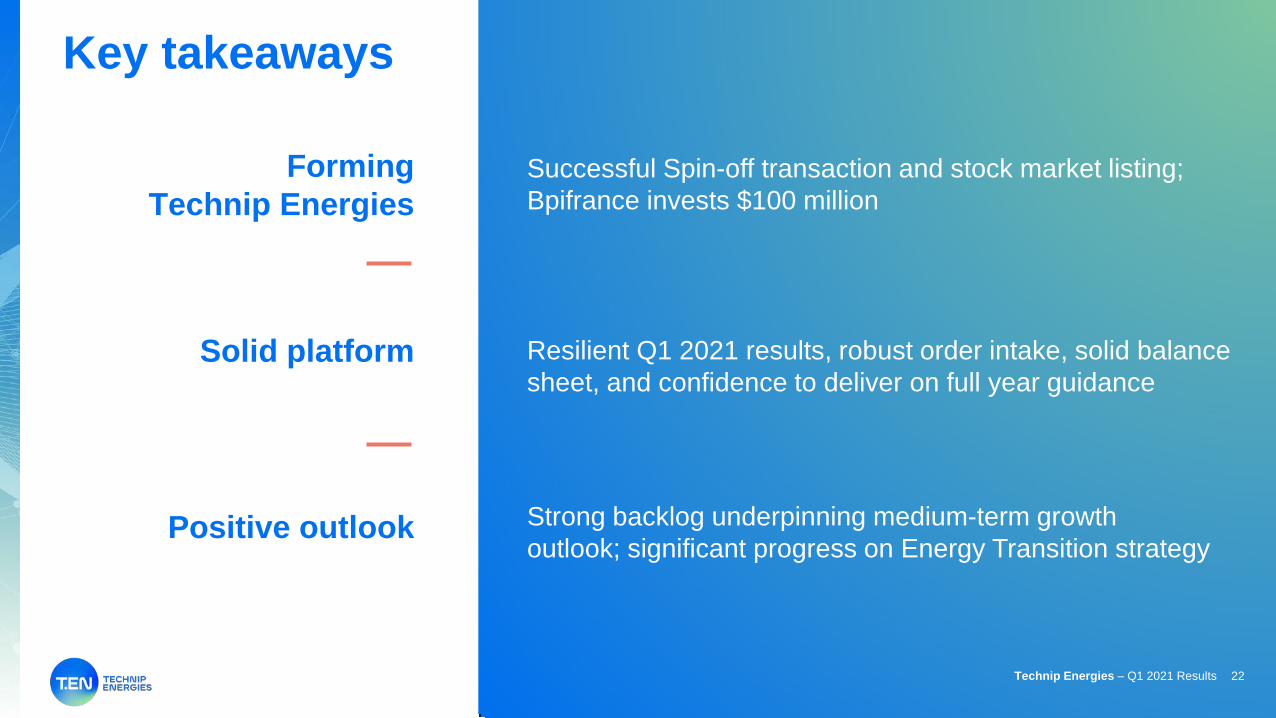
Key takeaways
Forming Technip Energies
Solid platform
Positive outlook
Successful Spin-off transaction and stock market listing; Bpifrance invests $100 million
Resilient Q1 2021 results, robust order intake, solid balance sheet, and confidence to deliver on full year guidance
Strong backlog underpinning medium-term growth outlook; significant progress on Energy Transition strategy
22Technip Energies – Q1 2021 Results

stability Q&A

stability Appendix
25Technip Energies – Q1 2021 Results
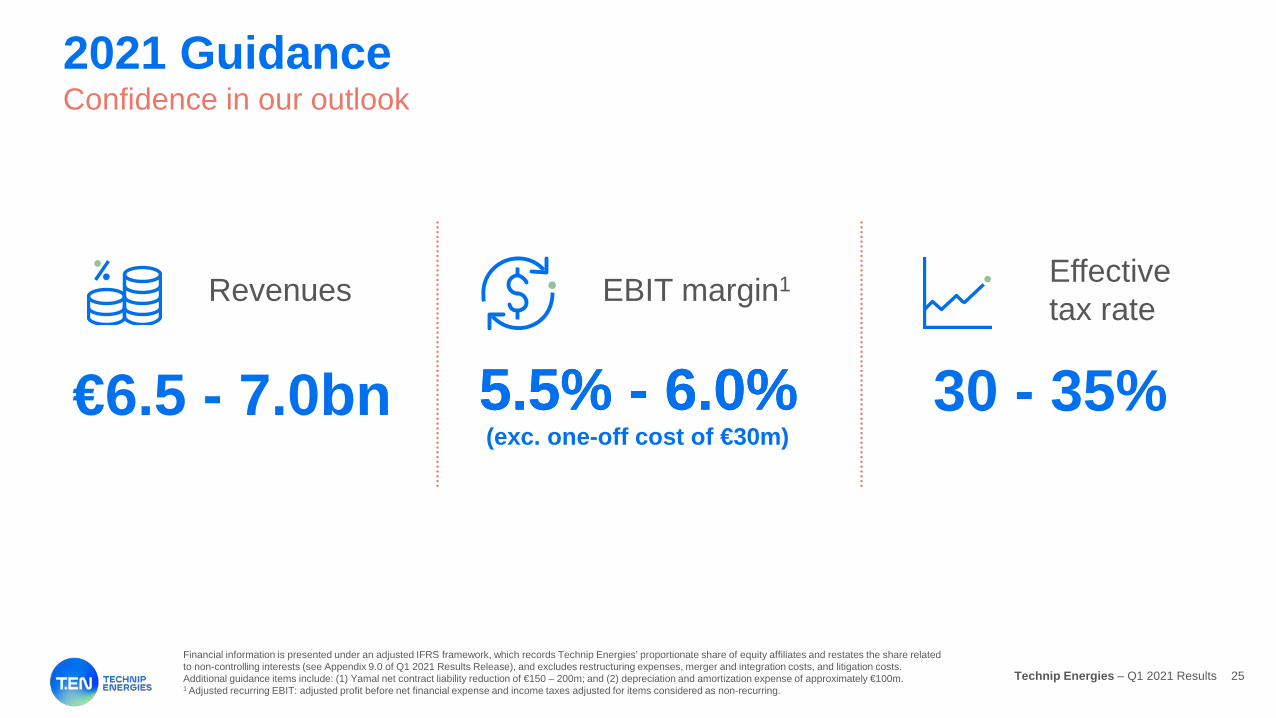
Confidence in our outlook2021 Guidance
Revenues
€6.5 - 7.0bn
EBIT margin1
(exc. one-off cost of €30m)5.5% - 6.0%5.5% - 6.0%
Effective tax rate
30 - 35%
Financial information is presented under an adjusted IFRS framework, which records Technip Energies’ proportionate share of equity affiliates and restates the share related to non-controlling interests (see Appendix 9.0 of Q1 2021 Results Release), and excludes restructuring expenses, merger and integration costs, and litigation costs. Additional guidance items include: (1) Yamal net contract liability reduction of €150 – 200m; and (2) depreciation and amortization expense of approximately €100m.1 Adjusted recurring EBIT: adjusted profit before net financial expense and income taxes adjusted for items considered as non-recurring.
26Technip Energies – Q1 2021 Results
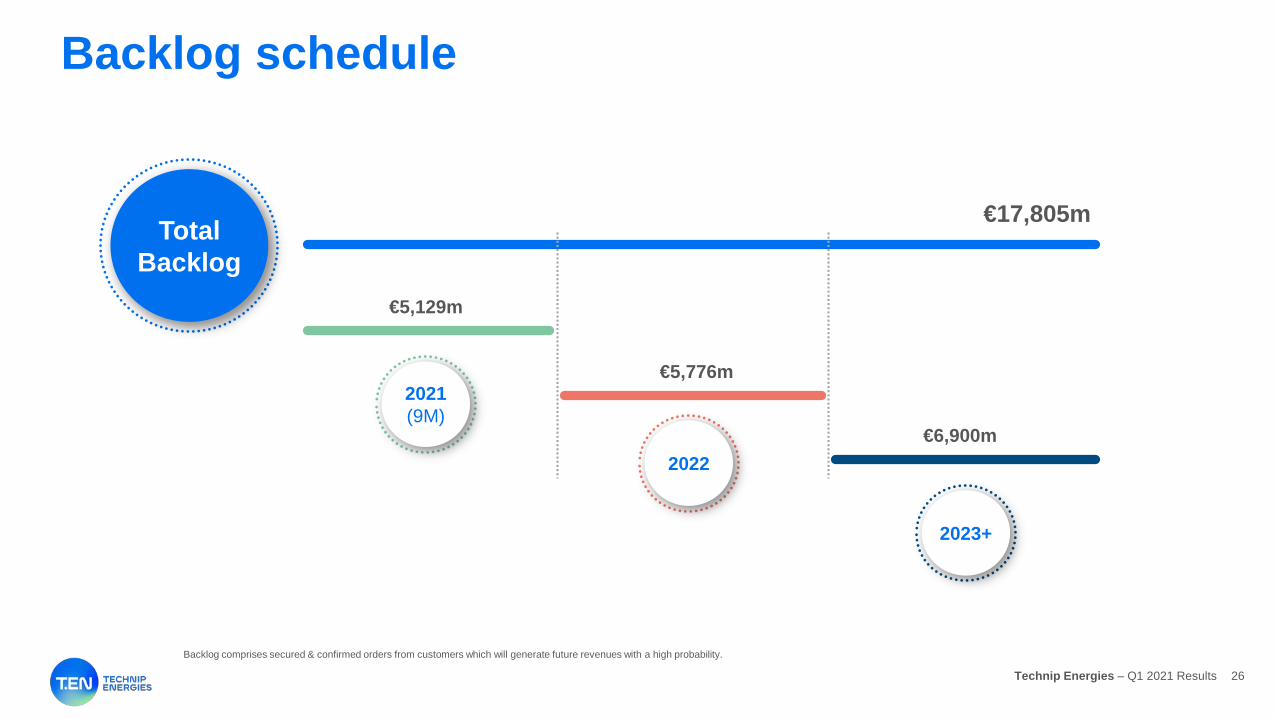
Backlog schedule
€17,805m
€5,129m
€6,900m
€5,776m2021(9M)
2022
2023+
TotalBacklog
Backlog comprises secured & confirmed orders from customers which will generate future revenues with a high probability.
27Technip Energies – Q1 2021 Results
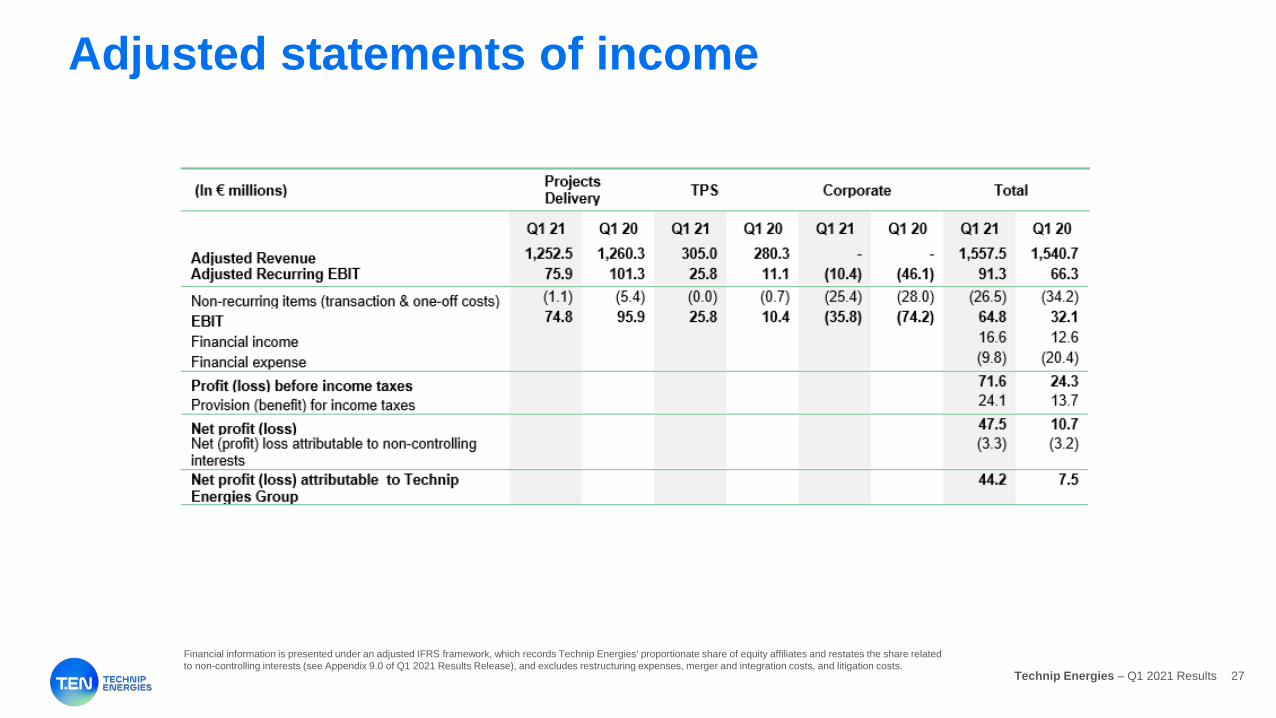
Adjusted statements of income
Financial information is presented under an adjusted IFRS framework, which records Technip Energies’ proportionate share of equity affiliates and restates the share related to non-controlling interests (see Appendix 9.0 of Q1 2021 Results Release), and excludes restructuring expenses, merger and integration costs, and litigation costs.

28Technip Energies – Q1 2021 Results
Adjusted statements of financial position
Financial information is presented under an adjusted IFRS framework, which records Technip Energies’ proportionate share of equity affiliates and restates the share related to non-controlling interests (see Appendix 9.0 of Q1 2021 Results Release), and excludes restructuring expenses, merger and integration costs, and litigation costs.
29Technip Energies – Q1 2021 Results
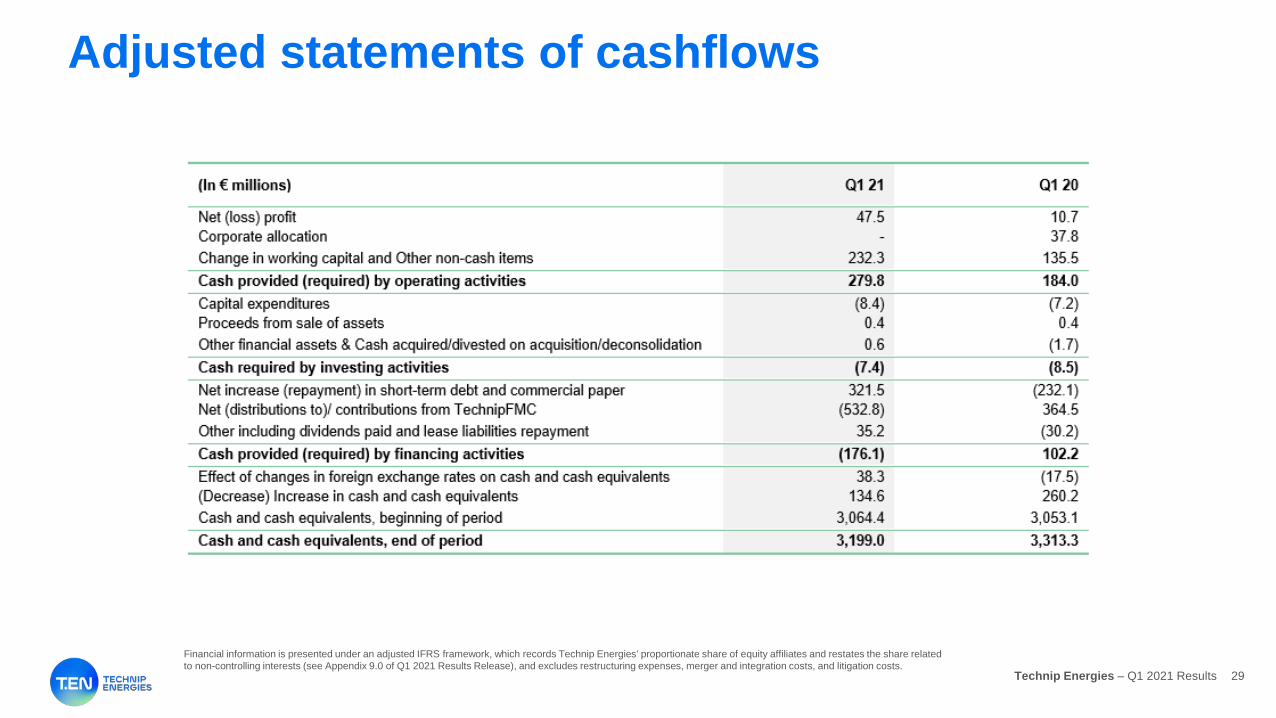
Adjusted statements of cashflows
Financial information is presented under an adjusted IFRS framework, which records Technip Energies’ proportionate share of equity affiliates and restates the share related to non-controlling interests (see Appendix 9.0 of Q1 2021 Results Release), and excludes restructuring expenses, merger and integration costs, and litigation costs.
30Technip Energies – Q1 2021 Results
3,199
620
2,471
108
1,000
1,500
2,000
2,500
3,000
3,500
Cash Gross Debt Net Cash
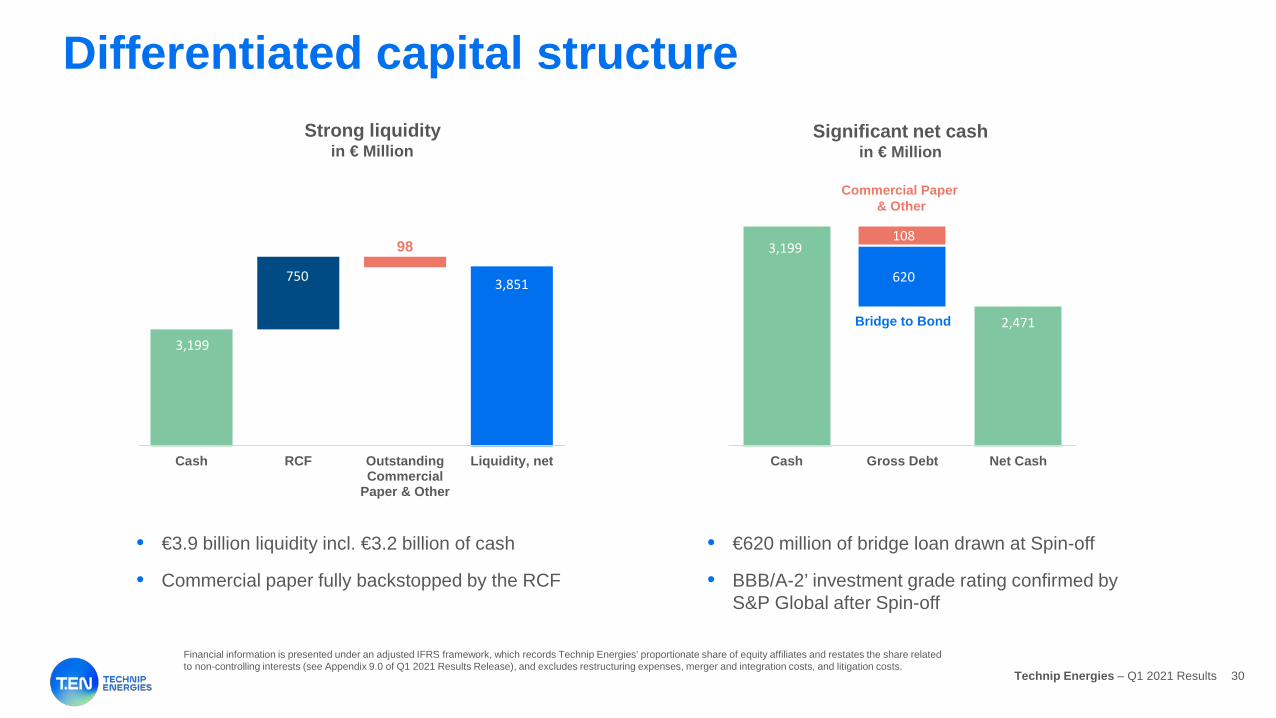
Differentiated capital structure Strong liquidity
in € Million
• €3.9 billion liquidity incl. €3.2 billion of cash
• Commercial paper fully backstopped by the RCF
• €620 million of bridge loan drawn at Spin-off
• BBB/A-2’ investment grade rating confirmed by S&P Global after Spin-off
3,199
750
98
3,851
Cash RCF OutstandingCommercial
Paper & Other
Liquidity, net
Commercial Paper & Other
Bridge to Bond
Significant net cashin € Million
Financial information is presented under an adjusted IFRS framework, which records Technip Energies’ proportionate share of equity affiliates and restates the share related to non-controlling interests (see Appendix 9.0 of Q1 2021 Results Release), and excludes restructuring expenses, merger and integration costs, and litigation costs.
31Technip Energies – Q1 2021 Results
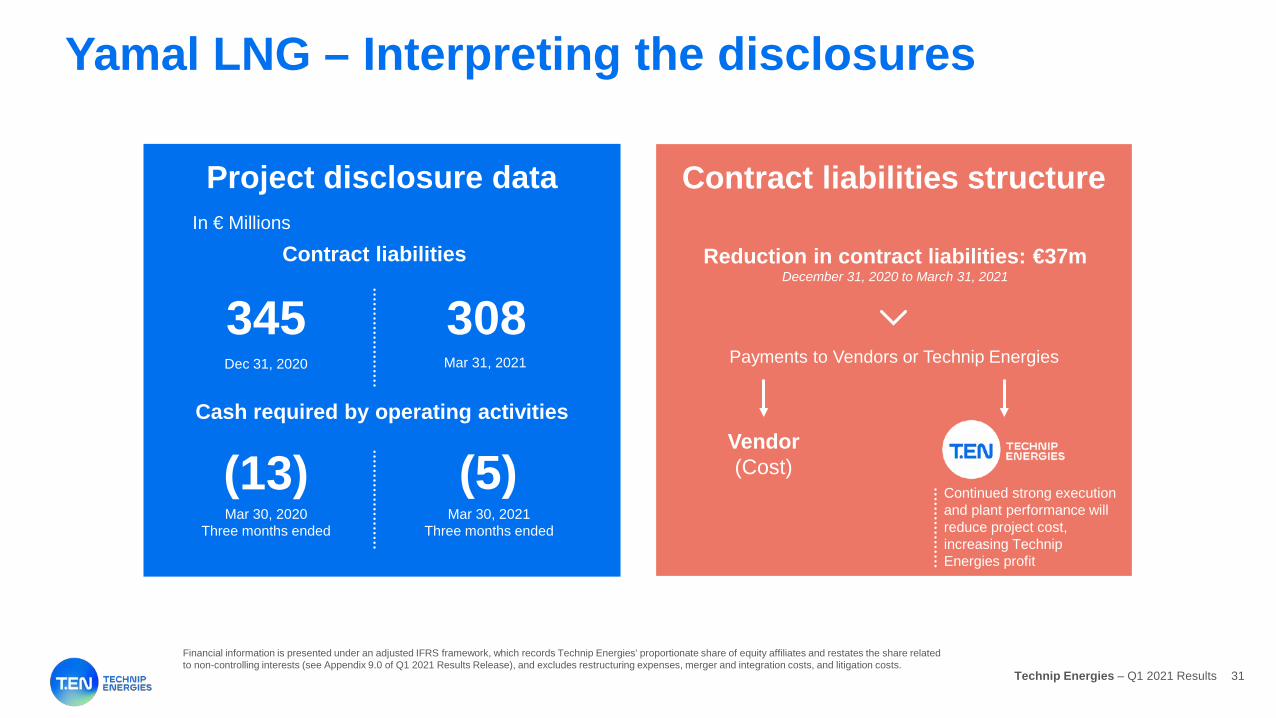
Yamal LNG – Interpreting the disclosures
In € Millions
345Contract liabilities
308Dec 31, 2020 Mar 31, 2021
(13)Cash required by operating activities
(5)Mar 30, 2021
Three months ended
Contract liabilities structure
Vendor (Cost)
Reduction in contract liabilities: €37mDecember 31, 2020 to March 31, 2021
Payments to Vendors or Technip Energies
Continued strong execution and plant performance will reduce project cost, increasing Technip Energies profit
Financial information is presented under an adjusted IFRS framework, which records Technip Energies’ proportionate share of equity affiliates and restates the share related to non-controlling interests (see Appendix 9.0 of Q1 2021 Results Release), and excludes restructuring expenses, merger and integration costs, and litigation costs.
Mar 30, 2020Three months ended
Project disclosure data
32Technip Energies – Q1 2021 Results
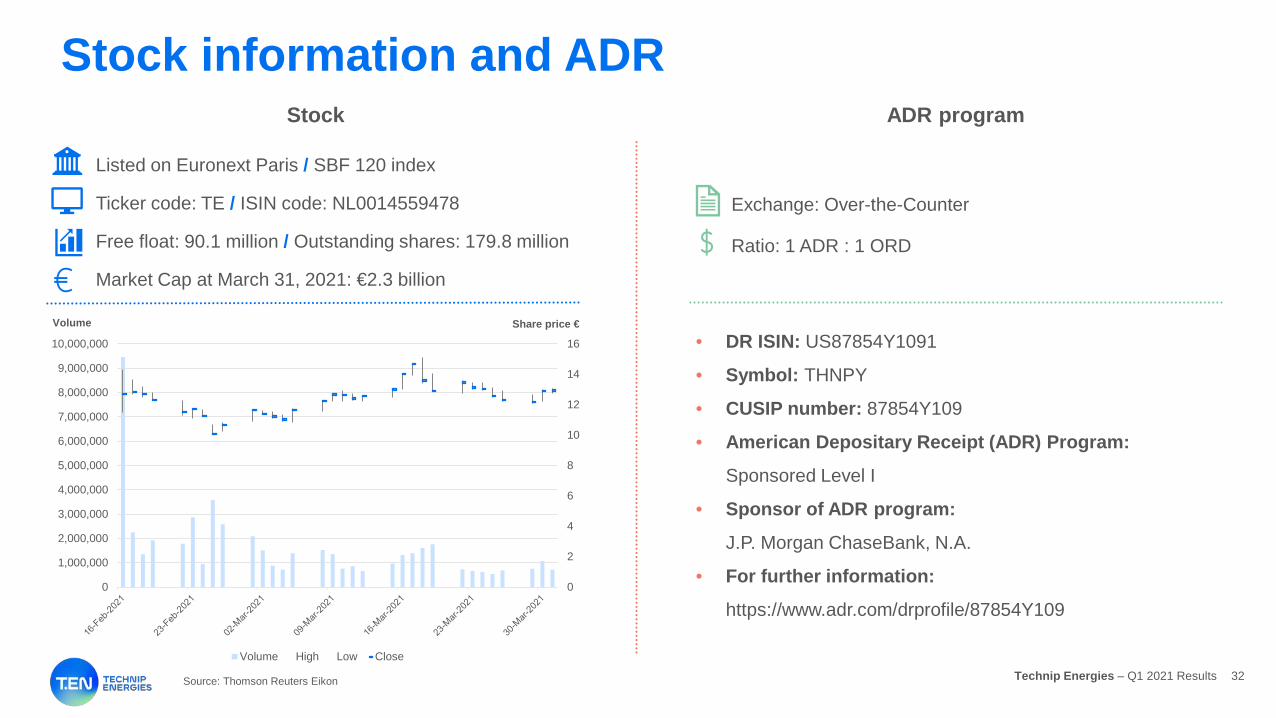
Stock information and ADRStock
Listed on Euronext Paris / SBF 120 index
Ticker code: TE / ISIN code: NL0014559478
ADR program
Exchange: Over-the-Counter
Ratio: 1 ADR : 1 ORD
• DR ISIN: US87854Y1091
• Symbol: THNPY
• CUSIP number: 87854Y109
• American Depositary Receipt (ADR) Program:
Sponsored Level I
• Sponsor of ADR program:
J.P. Morgan ChaseBank, N.A.
• For further information:
https://www.adr.com/drprofile/87854Y109
Volume Share price €
0
2
4
6
8
10
12
14
16
0
1,000,000
2,000,000
3,000,000
4,000,000
5,000,000
6,000,000
7,000,000
8,000,000
9,000,000
10,000,000
Volume High Low Close
Market Cap at March 31, 2021: €2.3 billion
Free float: 90.1 million / Outstanding shares: 179.8 million
Source: Thomson Reuters Eikon

Investor RelationsPhillip Lindsay Vice President, Investor RelationsTel: +44 20 3429 [email protected]