
The Influence of Recurrent Modes of Climate Variability on...
19
The Influence of Recurrent Modes of Climate Variability on the Occurrence of Winter and Summer Extreme Temperatures over North America PAUL C. LOIKITH Jet Propulsion Laboratory, California Institute of Technology, Pasadena, California ANTHONY J. BROCCOLI Department of Environmental Sciences, Rutgers University, New Brunswick, New Jersey (Manuscript received 23 January 2013, in final form 29 July 2013) ABSTRACT The influence of the Pacific–North American (PNA) pattern, the northern annular mode (NAM), and the El Ni~ no–Southern Oscillation (ENSO) on extreme temperature days and months over North America is examined. Associations between extreme temperature days and months are strongest with the PNA and NAM and weaker for ENSO. In general, the association with extremes tends to be stronger on monthly than daily time scales and for winter as compared to summer. Extreme temperatures are associated with the PNA and NAM in the vicinity of the centers of action of these circulation patterns; however, many extremes also occur on days when the amplitude and polarity of these patterns do not favor their occurrence. In winter, synoptic-scale, transient weather disturbances are important drivers of extreme temperature days; however, many of these smaller-scale events are concurrent with amplified PNA or NAM patterns. Associations are weaker in summer when other physical mechanisms affecting the surface energy balance, such as anomalous soil moisture content, also influence the occurrence of extreme temperatures. 1. Introduction Extreme temperatures are expected to change owing to anthropogenic climate warming with an increase in the severity, frequency, and duration of extreme heat events a likely and potentially dangerous anticipated climate impact (Meehl and Tebaldi 2004; Tebaldi et al. 2006; Meehl et al. 2007, 2009). Recent extreme heat events, such as those experienced in Europe in the sum- mer of 2003 and Russia in 2011, are examples of highly unusual occurrences that are likely to become more common in the future (e.g., Beniston 2004; Sch€ ar et al. 2004; Stott et al. 2004; Dole et al. 2011; Rahmstorf and Coumou 2011). Trends in extremes have already been observed through the analysis of extremes indices (Frich et al. 2002; Alexander et al. 2006; Griffiths and Bradley 2007) with a warming of the cold tail of the temperature distribution and an increase in warm nights being the most robust trends. Additionally, recent work has shown that much of the warming to date can be attributed to external forcing (Christidis et al. 2005, 2011; Morak et al. 2011, 2013; Zwiers et al. 2011). While changes in extreme heat will be associated with the most severe climate im- pacts, local circulation changes may cause an increase in extreme cold events regionally, resulting from the com- plicated relationship between forced changes in large- scale circulation and local infrequent events (Vavrus et al. 2006; Kodra et al. 2011). To better understand how these events will change regionally, a stronger understanding of the mechanisms associated with extreme temperatures is essential for accurate projection and interpretation of future extreme events. Several recurrent modes of natural climate variability are associated with characteristic teleconnections that impact regional mean temperature over North America, especially in winter. The Pacific–North American (PNA) pattern is associated with geopotential height anomaly centers southwest of the Aleutian Islands, inland of the Pacific Northwest, and over the southeastern United States, which correspond to temperature anomalies of the same sign (Wallace and Gutzler 1981; Barnston and Corresponding author address: Paul C. Loikith, Jet Propulsion Laboratory, California Institute of Technology, 4800 Oak Grove Drive, Pasadena, CA 91109. E-mail: [email protected] 1600 JOURNAL OF CLIMATE VOLUME 27 DOI: 10.1175/JCLI-D-13-00068.1 Ó 2014 American Meteorological Society
Transcript of The Influence of Recurrent Modes of Climate Variability on...

The Influence of Recurrent Modes of Climate Variability on the Occurrenceof Winter and Summer Extreme Temperatures over North America
PAUL C. LOIKITH
Jet Propulsion Laboratory, California Institute of Technology, Pasadena, California
ANTHONY J. BROCCOLI
Department of Environmental Sciences, Rutgers University, New Brunswick, New Jersey
(Manuscript received 23 January 2013, in final form 29 July 2013)
ABSTRACT
The influence of the Pacific–North American (PNA) pattern, the northern annular mode (NAM), and the
El Ni~no–Southern Oscillation (ENSO) on extreme temperature days and months over North America is
examined. Associations between extreme temperature days and months are strongest with the PNA and NAM
andweaker for ENSO. In general, the associationwith extremes tends to be stronger onmonthly than daily time
scales and for winter as compared to summer. Extreme temperatures are associated with the PNA andNAM in
the vicinity of the centers of action of these circulation patterns; however, many extremes also occur on days
when the amplitude and polarity of these patterns do not favor their occurrence. In winter, synoptic-scale,
transient weather disturbances are important drivers of extreme temperature days; however, many of these
smaller-scale events are concurrent with amplified PNA or NAM patterns. Associations are weaker in summer
when other physical mechanisms affecting the surface energy balance, such as anomalous soil moisture content,
also influence the occurrence of extreme temperatures.
1. Introduction
Extreme temperatures are expected to change owing
to anthropogenic climate warming with an increase in
the severity, frequency, and duration of extreme heat
events a likely and potentially dangerous anticipated
climate impact (Meehl and Tebaldi 2004; Tebaldi et al.
2006; Meehl et al. 2007, 2009). Recent extreme heat
events, such as those experienced in Europe in the sum-
mer of 2003 and Russia in 2011, are examples of highly
unusual occurrences that are likely to become more
common in the future (e.g., Beniston 2004; Sch€ar et al.
2004; Stott et al. 2004; Dole et al. 2011; Rahmstorf and
Coumou 2011). Trends in extremes have already been
observed through the analysis of extremes indices (Frich
et al. 2002; Alexander et al. 2006; Griffiths and Bradley
2007) with a warming of the cold tail of the temperature
distribution and an increase in warm nights being the
most robust trends. Additionally, recent work has shown
that much of the warming to date can be attributed to
external forcing (Christidis et al. 2005, 2011; Morak et al.
2011, 2013; Zwiers et al. 2011). While changes in extreme
heat will be associated with the most severe climate im-
pacts, local circulation changes may cause an increase in
extreme cold events regionally, resulting from the com-
plicated relationship between forced changes in large-
scale circulation and local infrequent events (Vavrus et al.
2006; Kodra et al. 2011). To better understand how these
events will change regionally, a stronger understanding of
the mechanisms associated with extreme temperatures is
essential for accurate projection and interpretation of
future extreme events.
Several recurrent modes of natural climate variability
are associated with characteristic teleconnections that
impact regional mean temperature over NorthAmerica,
especially in winter. The Pacific–North American (PNA)
pattern is associated with geopotential height anomaly
centers southwest of the Aleutian Islands, inland of the
Pacific Northwest, and over the southeastern United
States, which correspond to temperature anomalies of
the same sign (Wallace and Gutzler 1981; Barnston and
Corresponding author address: Paul C. Loikith, Jet Propulsion
Laboratory, California Institute of Technology, 4800 Oak Grove
Drive, Pasadena, CA 91109.
E-mail: [email protected]
1600 JOURNAL OF CL IMATE VOLUME 27
DOI: 10.1175/JCLI-D-13-00068.1
� 2014 American Meteorological Society

Livezey 1987). TheElNi~no–SouthernOscillation (ENSO)
phenomenon has well-documented associations with re-
gional temperature impacts across the midlatitudes in-
cluding over North America (e.g., Horel and Wallace
1981; Ropelewski and Halpert 1987; Kiladis and Diaz
1989; Gershunov and Barnett 1998). The northern annular
mode (NAM), also referred to as the Arctic Oscillation, is
characterized by an annular structure of latitudinally
stratified geopotential height anomalies of opposing sign
with one band at high northern latitudes and the other over
the midlatitudes. When the NAM is in the positive phase,
the midlatitude westerlies are anomalously strong, in-
hibiting the southward penetration of surges of cold air
into the continental United States. This corresponds to
anomalously warm temperatures in the midlatitudes and
anomalously cold temperature in the Arctic. The negative
phase of the NAM consists of a similar pattern but with
anomalies opposite in sign (Thompson and Wallace 1998,
2000, 2001). Recent unusually cold winters in the boreal
midlatitudes (2009/10 and 2010/11) have been associated
with a strong negative phase of the North Atlantic Oscil-
lation (NAO), a pattern that is highly correlated with the
NAM, consistent with a relationship between the ampli-
tude of the pattern and the magnitude of the temperature
anomalies (Guirguis et al. 2011;Wang et al. 2010; Cattiaux
et al. 2010).
A number of studies suggest a strong linkage between
the amplitude and phase of these recurrent circulation
patterns and extreme temperatures. Significant impacts
on temperature extremes are found by Higgins et al.
(2002) owing to changes in the phase of ENSO and the
NAM across the United States. Gershunov and Barnett
(1998) show that changes in the probability of extreme
temperature days in winter over the continental United
States related to the phase of ENSO do not necessarily
follow systematic shifts in central tendency of the tem-
perature frequency distribution that are characteristic of
ENSO.Kenyon andHegerl (2008) also show statistically
significant associations between phases of ENSO and
extreme temperature days. Both of these studies show
substantial nonlinearity in the response of temperature
extremes to opposing phases of ENSO.
Several studies have specifically focused on the asso-
ciation between modes of climate variability and tem-
perature extremes in the northeastern United States
and southeastern Canada. Wettstein and Mearns (2002)
show a dipole in the sign of the association between
temperature extremes and the phase of the NAO/NAM.
Griffiths and Bradley (2007) show that extreme warm
temperatures preferentially occur during a positive
phase of the NAM and extreme cold temperatures
during a negative phase. Brown et al. (2010) suggest
that the influence on extremes from modes of climate
variability over long time periods is not robust in this
region.
Loikith and Broccoli (2012, hereafter LB12) system-
atically identified and described the principal atmo-
spheric circulation patterns associated with temperature
extremes over North America. Their results suggest
that local, transient weather patterns, generally char-
acteristic of the synoptic scale, are the key mechanisms
associated with daily temperature extremes. Such pat-
terns were found to be especially robust in winter, while
summer circulation anomalies were shown to be weaker
and smaller in spatial scale. LB12 hypothesize that
surface–atmosphere coupling plays an important role in
the occurrence of extreme summer temperature days
when a preferred circulation pattern is not evident. This
work builds on the analysis of LB12 and aims to answer
the question: how important is the phase of influential
modes of climate variability in the occurrence of ex-
treme temperatures over North America in relation to
other, smaller-scale circulation patterns and physical
processes?
The focus of this paper is on the NAM, PNA, and
ENSO (using the Ni~no-3.4 index). The NAM and PNA
were chosen because they account for the majority of
the atmospheric variability in the Northern Hemisphere
and both have been shown to impact North American
climate (Quadrelli and Wallace 2004). ENSO is also
examined separately as it has the most important in-
fluence on global climate on seasonal to interannual
time scales. The association between ENSO and the
PNA has been discussed at length in the literature
(Straus and Shukla 2002 and references therein); how-
ever, the relationship between the two modes during
the time period used in this study appears weak, so both
are treated as separate phenomena. Other modes of
variability with characteristic temperature teleconnections
for North America were considered but are not the
focus of this paper as most are either highly correlated
with one of the patterns already being analyzed or are
less closely associated with climate impacts over North
America. For example, the NAO is an important mode
of variability for portions of North American climate
(Hurrell et al. 2003), but the pattern is highly correlated
with the NAM. The annular nature of the NAMalso has
potential to impact a larger portion of the domain
compared with the NAO. Data and methods are de-
scribed in the next section and the associations between
extreme temperatures and the NAM, PNA, and ENSO
are presented in section 3. Section 4 discusses the spatial
scale of circulation patterns associated with extremes
and section 5 looks at the influence of surface wetness
on summertime extremes. Concluding remarks follow
in section 6.
15 FEBRUARY 2014 LO IK I TH AND BROCCOL I 1601

2. Data and methods
a. Data
Daily temperature extremes were extracted from the
HadGHCND gridded daily temperature dataset (Caesar
et al. 2006), a joint collaboration between the U. K. Met
Office’s Hadley Centre for Climate Prediction and Re-
search and the U.S. National Climatic Data Center
(NCDC). The dataset has a resolution of 2.58 latitude by3.758 longitude and consists largely of observations from
the NCDC Global Historical Climatology Network–
Daily (GHCND). The HadGHCND has two products,
observed daily maximum and minimum temperatures
and daily maximum and minimum temperature anoma-
lies. The latter dataset, which spans the years 1950–2007,
was used. While the HadGHCND has a global domain,
only data over North America, defined here as all land
north of 17.58N between the Pacific and Atlantic Oceans,
were used. The anomalies are computed by subtracting
the 5-day running mean from a 30-yr climatology span-
ning 1961–90 from the actual temperature (Caesar et al.
2006). Composites of circulation patterns were calculated
using data from the National Centers for Environmental
Prediction’s Reanalysis-1 (Kalnay et al. 1996), which has
a slightly higher resolution than theHadGHCNDdataset
at 2.58 by 2.58.NAM and PNA index values were obtained from the
Climate Prediction Center (CPC) website (http://www.
cpc.ncep.noaa.gov/). TheNAM index is calculated in this
dataset by projecting the mean 1000-hPa height anoma-
lies on the leading EOF of the 1000-hPa field north of
208N. The PNA is defined using the first and second ro-
tated empirical orthogonal functions of the 500-hPa geo-
potential height field following the methods of Barnston
and Livezey (1987). Monthly or daily index values are
obtained using least squares regression. The Ni~no-3.4 in-
dex data were obtained from the National Center for
Atmospheric Research’s Climate and Global Dynamics
division and are freely available via the web (http://www.
cgd.ucar.edu/cas/catalog/climind/Nino_3_3.4_indices.html)
and discussed in Trenberth (1997). The Ni~no-3.4 index
is defined as the standard deviation of the monthly sea
surface temperature anomaly in the Ni~no-3.4 region,
smoothed by a 5-month running mean. The NAM and
PNA are both available as daily and monthly values
while the Ni~no-3.4 index is only monthly. Daily tem-
perature extremes were therefore associated with the
Ni~no-3.4 index value of the month in which the extreme
day occurred. This is a reasonable approximation be-
cause the SST anomalies that define ENSO evolve more
slowly than the other two modes of variability. In the
case of missing index value data, the missing days are
removed from both the index value dataset and the
temperature anomaly dataset. This was only an issue for
a few days for the NAM in summer.
b. Methodology
Temperature extremes and composites of circulation
anomalies are defined largely in the manner of LB12
except that a slightly different threshold is used. Ex-
treme temperature days in this work are defined as those
days ormonths falling above the 90th and below the 10th
percentile in the temperature anomaly frequency dis-
tribution for the months of December–February (DJF)
and June–August (JJA), representing boreal winter and
summer, respectively, at each grid point. The results
presented in LB12 indicate that circulation patterns as-
sociated with extremes in transition seasons had com-
monalities with both summer and winter, so fall and
spring associations are not presented in this paper. The
sample size was expanded from that used in LB12 to
include 3-month datasets and the percentile threshold
defining an extreme was expanded to 10% to increase
the sample size for evaluating the association between
extreme temperature months and the modes of variabil-
ity.DailyDJF and JJA cold andwarmextremes consist of
270 and 276 days, respectively, for each extreme [90 days
(DJF) or 92 days (JJA) yr21 3 30 yr 3 0.10]. Monthly
extremes consist of nine months for both DJF and JJA
(3 months yr21 3 30yr 3 0.10). The sample size can be
larger in the case of a tie with the 270th (276th) most
extreme day or 9th most extreme month. As in LB12, the
analysis was performed using the years 1961–90 (DJF is
December 1960 through February 1990 to keep seasons
coherent). This period was chosen as a compromise be-
tween the need for a sample size large enough to evaluate
significance and the desire to reduce any long-term trend
in temperature during the period of analysis.
The associations between extreme temperature days
and the phase of each circulation mode were identified
by calculating the percentage of extreme temperature
events (i.e., warm and cold daily and monthly maximum
and minimum temperature extremes) that were con-
current with index values falling in the upper or lower
quartiles of the distribution. Thus, the expected per-
centage that would occur by chance is 25%.A percentile
threshold was chosen as opposed to an index value
threshold to equally represent the low and high tails of
the distribution of index values, even in the case of an
asymmetric distribution. Results from the same analysis
with different thresholds do not yield appreciable dif-
ferences in the pattern and significance of association
percentage values.
Extreme temperature days often occur in series of
consecutive days, so each extreme is not necessarily in-
dependent. To assess statistical significance without
1602 JOURNAL OF CL IMATE VOLUME 27

assuming that the data are free of serial correlation,
a Monte Carlo simulation was performed. The simula-
tion is performed following this example: the 30-yr time
series of temperature and circulation index values were
divided into 30 individual 1-yr time series for each of the
two variables. Next, the time series are randomly paired
and the analysis described in the previous paragraph is
performed. This process was repeated 10 000 times,
producing a frequency distribution for the association
between temperature and circulation index for randomly
paired time series. The 5th and 95th percentiles of this
synthetic frequency distribution are used as thresholds of
statistical significance at the 5% level. This process was
repeated for all three modes and for all types of tem-
perature extremes (warm and cold, minimum and max-
imum) separately so that all association calculations have
a confidence threshold for each grid cell.
Soil moisture reanalysis data used here is a product of
the Variable Infiltration Capacity (VIC) model (Liang
et al. 1994) and is available for the continental United
States for the time period and resolution needed for
this analysis. The limited spatial coverage is sufficient for
this analysis as areas north of this region are more
influenced by synoptic-scale circulation patterns in the
summer than the continental United States while only
a small fraction of the domain used in this paper lies to
the south. The data were originally on a 0.58 by 0.58 grid,but smoothed to a 2.58 by 3.758 grid to match the
HadGHCND temperature dataset. Only soil moisture
amounts (in millimeters) for the topmost soil layer were
used to calculate soil moisture anomalies. Anomalies
were calculated relative to normal values for each day
obtained using a 5-day window centered on each day of
a 30-yr climatology for each day. Anomalies are ex-
pressed as percentage of normal soil moisture for each
grid cell in the domain.
3. Temperature extreme–circulation indexassociations
In this section, daily and monthly statistical associa-
tions between extreme temperatures and the NAM,
PNA, and ENSO are presented. A closer look at in-
dividual cases is also taken to investigate the influence of
these circulation patterns at specific locations versus
other mechanisms that may be important for the oc-
currence of extreme temperatures. Results for the NAM
and PNA are presented separately from the ENSO
analysis because the NAM and PNA are defined by
anomalies in atmospheric circulation, while the ENSO
index is indicative of the state of the ocean and less di-
rectly related to atmospheric circulation. While associ-
ations of all types of extremes in both seasons were
examined, for brevity only DJF extreme cold minimum
and JJA extreme warm maximum events are presented
here as these extremes account for the most severe cli-
mate impacts. Hereafter, the use of a plus sign as a suffix
(e.g., NAM1 and PNA1) indicates days when the index
values are in the upper quartile (i.e., large positive) and
a minus sign (e.g., NAM2 and PNA2) indicates index
values that are in the lower quartile (i.e., large negative).
Temperature extremes are labeled as Tx90 and Tn10 for
extreme warm maximum and cold minimum daily or
monthly temperatures, respectively.
Statistical associations
1) PNA AND NAM
The percentage of extreme temperature days con-
current with days in the upper and lower quartiles for the
NAM and PNA are plotted in Fig. 1. While a given grid
cell could have an association percentage significantly
lower than expected by chance (i.e., 25%), only associ-
ations significantly higher than this value at the 5% level
are shaded. This method of shading emphasizes areas
where there is an increased probability of extreme tem-
peratures when the index value is outside of the indicated
threshold. The color scheme is such that cold colors
represent an increased probability of extreme cold tem-
peratures during the indicated phase of the circulation
pattern while warm colors represent an increased prob-
ability of extreme warm temperatures. Locations with an
enhanced probability of a particular type of extreme
generally have a reduced probability of that type when
the mode of variability has the opposite polarity.
The PNA has the most robust association in DJF with
a strong increase in the probability of extreme cold
minimum temperatures over much of the western and
northwestern portions of the continent during negative
PNA events. Positive PNA events tend to favor extreme
cold temperatures over southeastern North America.
Both the northwest and southeast portions of North
America are located in the vicinity of the characteristic
centers of action that define the PNA. The relatively
higher association values found over northwestern
North America in the PNA2 case when compared with
southeastern North America in the PNA1 case is likely
a result of the tendency for the geopotential height
anomalies associated with the PNA to be stronger near
northwest North America than over southeast North
America. In southeastern North America, while a sig-
nificant increase in the probability of extreme cold
minimum temperatures is associated with highly posi-
tive PNA days, many such days (;50%) occur when the
PNA is not exceeding this threshold. This suggests that
the PNA, while an important influence on local daily
15 FEBRUARY 2014 LO IK I TH AND BROCCOL I 1603

FIG. 1. The percentage of (a)–(d) extreme cold DJF minimum and (e)–(h) extreme warm JJA maximum
temperature days that occur when the PNA or NAM are in the upper (1) or lower (2) quartile of the index
value distribution. Only grid cells where the percentage is significantly greater than expected by chance at the
5% level are shaded.
1604 JOURNAL OF CL IMATE VOLUME 27

temperature, is only one influential mechanism for this
region. Association patterns and percentage values (not
shown) are similar for Tx10 days while Tn90 and Tx90
association patterns are nearly opposite those for ex-
treme cold days.
A positive NAM is associated with an increase in the
probability of extreme coldminimum temperatures over
the far northeast and northwest portions of the conti-
nent, where the positive phase of the NAM is associated
with lower than average geopotential heights. The area
of increased probability of cold events is shifted south-
ward during negative NAM days as a weakening of the
prevailing westerlies associated with the negative phase
of the NAM allows colder air to penetrate equatorward.
The increased probability is much lower for the NAM
compared with the PNA and suggests that the NAM
may be a less dominant influence in extreme daily
temperatures over North America compared with the
PNA. Some of the area in southeast North America that
has more frequent cold days with NAM2 also has more
frequent cold days with PNA1. This indicates that cold
extremes in this region are subject to a relatively high
influence from large-scale circulation, and concurrence
of modes could also be important here. Warm extremes
(not shown) are more influenced by the NAM over the
northeastern part of the continent than cold extremes,
with the negative phase of the NAM being highly asso-
ciated with extreme warm temperatures here.
Summertime associations are weaker in general, es-
pecially at lower latitudes where weak baroclinicity re-
sults in circulation patterns that are smaller in scale and
weaker in magnitude than in the winter (LB12). There is
an increased probability for extreme warm days over
much of Alaska and northwestern Canada during both
PNA1 and NAM2 events. Similarly, the east-central
portion of the continent has an increased probability of
extreme warm days during PNA2 and NAM1 days.
TheNAMassociations in summer still suggest an annular
structure with a zonal band of significant association
values across much of the continent during NAM1 days.
The southeast North America area of association that
would be expected for the PNA2 case based on the re-
sults of DJF is not present as this is likely too far south to
be strongly influenced by the extratropical circulation.
Because these patterns evolve and persist over mul-
tiple days, it is of interest to examine the association
between extremes in both temperature and index value
on longer time scales. Figure 2 shows the same analysis,
except the associations are between extremely warm
and cold months and unusually positive or negative in-
dex value months. In winter, the patterns are generally
similar to those in Fig. 1 except the percentages are
generally higher. Nearly all months with extremely cold
meanminimum temperature values occur during PNA2months over much of northwest North America, while
the same is true in southeastern North America for
PNA1 months. The NAM also has similarities with the
daily associations but with stronger percentages for
NAM1 over northeast North America and more areas
of significant association that are more scattered for
NAM2. Some of this scatter may be due to the rela-
tively small sample size of months that exceed the
temperature and index value threshold compared with
the daily analysis.
Months with extreme warm mean maximum tem-
perature in JJA have some commonalities with the
daily associations, especially over northeastern North
America for the PNA2 case, Alaska for the NAM2case, and eastern Canada for the NAM1 case. There are
few significant associations with PNA1 months when
compared with the other association maps. The interior
of the northern half of the continent is strongly associ-
ated withNAM1months while only the southern half of
this region shows comparable associations in the daily
analysis. This may suggest more influence on tempera-
ture extremes over longer time scales from the NAM in
north-central Canada.
Figure 3 shows the percentage of extreme tempera-
ture days that occur when neither mode is prominent,
that is, for cases in which both the PNA and the NAM
are in the middle half of the distribution. In this case, all
associations greater than 25% (the expected probability
if the association is random assuming that the PNA and
NAM operate independently) are shaded in color while
associations less than 25% are shaded in gray. In winter,
most extreme temperature days occur when the index
value of at least one pattern is in the upper or lower
quartile of the distribution inmost places. In the summer,
a larger area of the domain experiences extreme tem-
peratures when neither pattern is in the upper or lower
quartile for the index value distribution. This emphasizes
that numerous extremely warm days in the summer occur
when the index value for either pattern is not unusually
amplified, suggesting a weak relationship between the
phase and strength of the PNA and NAM and extreme
warm summer temperatures in these regions.
2) ENSO
Figure 4 shows the associations between extreme
temperature events and ENSO for both daily and
monthly time scales. In these maps, shading indicates
associations that are stronger than would be expected
by chance irrespective of statistical significance, while
those grid cells with statistically significant relation-
ships at the 5% level are highlighted. The change in
plotting convention is made because of the overall
15 FEBRUARY 2014 LO IK I TH AND BROCCOL I 1605

FIG. 2. As in Fig. 1, but for monthly mean temperature.
1606 JOURNAL OF CL IMATE VOLUME 27

small number of statistically significant grid cells in
the ENSO association calculations. Overall, associa-
tions are weak, and the area of statistical significance is
much less than that seen in the PNA and NAM cases.
The relative weakness of the relationship between
extreme temperature events and ENSO as contrasted
with the results for NAM and PNA is likely due to
the more direct relationship between temperature and
local atmospheric circulation. Although ENSO tele-
connections clearly affect atmospheric circulation, the
influence on temperature is less direct than that of the
other two patterns, which are defined by atmospheric
circulation anomalies directly over North America.
There is an increased probability of extreme cold days
over much of the northern and western portions of the
continent during La Ni~na events, but only a few grid
cells in Alaska are statistically significant. Associations
are generally weak for Ni~no1 days and months while
Alaska has more statistical significance in Ni~no2months. There is also an increased probability of ex-
treme cold minimum temperature months over the Rocky
Mountains and over northeastern North America during
Ni~no2 months.
In JJA, the northern tier of the continent shows
significantly increased probabilities of extremely warm
days and months during La Ni~na events while Alaska
tends to have an increased probability during El Ni~no
months. Ni~no1 days and months are also associated
with an increased probability of warm summer days
and months over Mexico and the south-central United
States. Places where ENSO is associated with extreme
warm temperatures in the summer, especially at lower
latitudes, may experience circulation patterns that in-
hibit precipitation and cloudiness rather than circulation
that influences advection of warm air.
The relatively modest areas of significant association
between ENSO and temperature in this study contrast
with the results of Kenyon and Hegerl (2008), who show
more widespread statistically significant associations
between the sign of ENSO and extreme temperature
days in their analysis of station data over North Amer-
ica. One aspect of the design of this study that could
explain this difference is the smaller sample size of the
dataset used here. Kenyon and Hegerl (2008) used
available data from 1849 to 2005 while this work uses
1961–90. Another difference is that Kenyon and Hegerl
FIG. 3. The percentage of extreme coldDJFminimum temperature (a) days and (b)months and extremewarm JJA
maximum temperature (c) days and (d) months that occur when neither the PNA nor the NAM is in the upper or
lower quartile. Grid cells shaded in blue (red) for DJF (JJA) are where the percentage of extreme cold (warm) is
greater than expected by chance (25%)when neithermode is amplified.Gray shaded grid cells arewhere percentages
are lower than expected by chance.
15 FEBRUARY 2014 LO IK I TH AND BROCCOL I 1607

FIG. 4. The percentage of extreme coldDJFminimum temperature (a),(b) days and (c),(d) months and
extreme warm JJA maximum temperature (e),(f) days and (g),(h) months that occur when the Ni~no-3.4
index is in the upper or lower quartile. All grid cells where the percentage is greater than expected by
chance are shaded and grid cells where the percentage is significantly greater than expected by chance at
the 5% level are highlighted.
1608 JOURNAL OF CL IMATE VOLUME 27

use temperature extreme index values based onmonthly
counts of daily exceedances, while this study uses the top
and bottom 10% of the daily and monthly temperature
distribution. The percentage anomalies in both studies
are relatively small for many locations (generally within
5%–10% of the expected value), but they can be statis-
tically significant when the sample size is larger although
not significant according to the Monte Carlo tests em-
ployed in this study. In addition to the shorter time period
used in this work, the 30-yr period used here may in-
fluence the diagnosed relationship between extremes and
ENSO. The weak association percentages and the large
number of extreme days that occur when ENSO is not in
the upper or lower quartile of index values suggests that
ENSO is not a dominant influence on extremes at this
time scale and during the 30-yr period used in this analysis.
3) INDIVIDUAL CASES
Individual locations were chosen to more closely ex-
amine the interaction between temperature extremes
and the modes of variability. Here we present results
from four locations represented by grid cells located in
Alaska, the U.S. central Gulf Coast, Baffin Island, and
the Great Lakes. Extreme temperatures at the Alaska
location are strongly influenced by the PNA and to
a lesser extent ENSO. Extremes in the vicinity of the
Gulf Coast are influenced by the PNA and the NAM
while Baffin Island is affected by the NAM and the
Great Lakes is an example of a location not within
a major region of influence from any mode. The Alaska,
Gulf Coast, and Baffin Island cases are examples of as-
sociations that are stronger than the majority of the
continent while results from the Great Lakes location
are more representative of areas outside of the main
regions of influence from these patterns.
Figure 5 shows the index values for all extreme DJF
and JJA days and months at the four locations using
a box-and-whisker format with each dot representing
one extreme temperature day/month. For the daily case,
a large spread of index values, regardless of association
value or significance, is evident for both modes. Loca-
tions where the boxes (outlining the days/months be-
tween the 25th and 75th percentile) do not overlap are
indicative of cases where the association with tempera-
ture is relatively strong. Some notably strong associa-
tions with daily extremes, such as Baffin Island with the
NAM and Alaska with the PNA in winter, do not have
overlap between the boxes while there is still substantial
overlap between the dots. These areas of relatively
strong association also have extremes occurring during
the opposite phase of preferred association.
The Baffin Island case exhibits some asymmetry as the
NAM values for daily Tx90 deviate from zero in the
negative direction with greater magnitude (median
21.5) than the values for daily Tn10 (median 0.14) in the
positive direction. Only the Baffin Island daily Tx90
NAM case and the Alaska daily Tx90 and Tn10 PNA
cases have boxes that fall entirely within one phase of
the mode. This ubiquitous spread in daily cases further
indicates that extreme daily temperatures are strongly
influenced by mechanisms other than the phase and
strength of these modes of variability, even where the
NAM and PNA are highly influential on mean temper-
ature or significantly associated with extreme tempera-
ture in a statistical sense.
Monthly extremes show less overlap between boxes
and, in the cases of Baffin Island with the NAM and
Alaska with the PNA, there is no overlap between ex-
treme months. There is a greater tendency toward a
positive phase of the NAM for Baffin Island with
monthly than daily Tn10, but the deviation from zero is
still higher for monthly Tx90, indicating some asym-
metry at monthly time scales as well. The Gulf Coast
location shows strong tendencies toward opposing pha-
ses of the NAM and the PNA for extreme months while
this is not the case for daily extremes. The Great Lakes
location also shows association with the phase of the
NAM that is not present with daily extremes. This sug-
gests that the influence from the NAM on temperature
at this location is present at monthly time scales while
other mechanisms are more important for daily ex-
tremes. Plotted in the same manner, JJA box-and-
whisker plots show little or no tendency toward either
positive or negative phases of either mode for daily or
monthly extremes.
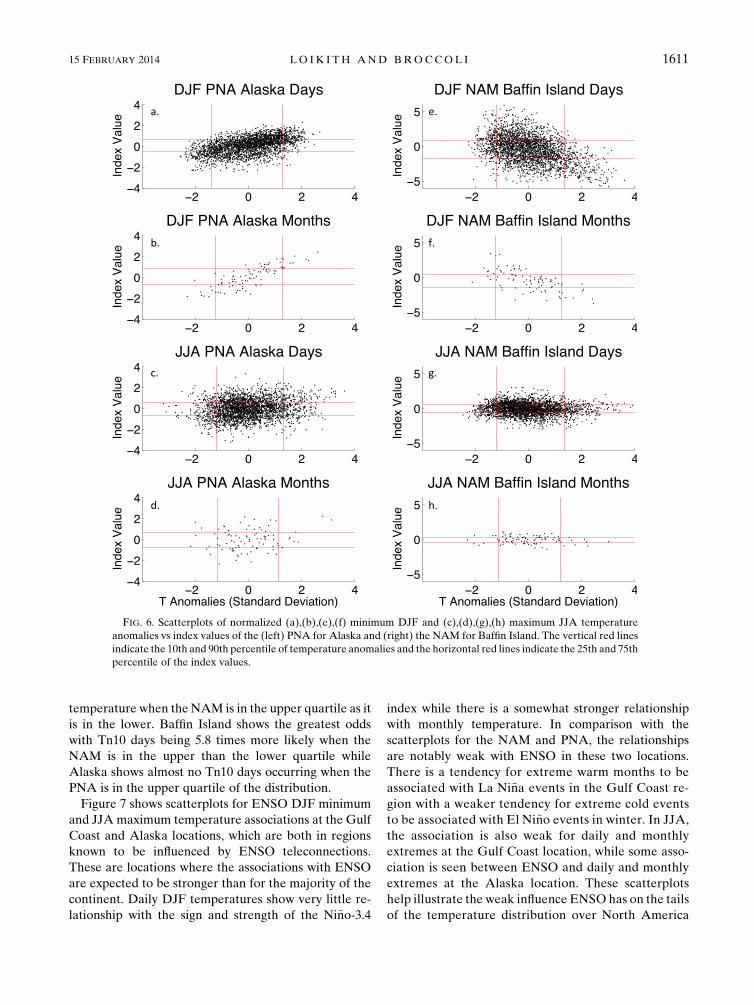
The scatterplots in Fig. 6 illustrate the relationship
between minimum temperature and index value for
every day in the 30-yr climatology at Baffin Island and
Alaska in DJF and maximum temperature for JJA.
These are two places where the associations are among
the strongest in the continent for both daily andmonthly
extremes, especially in winter; however, the daily scat-
terplots show many extreme DJF days that occur when
the modes are not in a NAM6 or PNA6 state. Overall,
there is a relationship between temperature and the
phase and strength of the modes as indicated by the slope
of the scatterplot, but even locations with the strongest
associations in North America still have many extreme
days occurring outside of the index value threshold and
in some cases during phases opposite in sign to the pre-
ferred phase of association.
The Baffin Island daily DJF scatterplot illustrates
the asymmetry seen in the box-and-whisker plots. The
temperature probability density function for this region
(not shown) has a long warm tail, largely associated with
a negative phase of the NAM, which allows advection of
15 FEBRUARY 2014 LO IK I TH AND BROCCOL I 1609

relatively mild marine air from the south and southeast
into this relatively cold location. Days in the cold tail are
less associated with a preferred mechanism that can
cause outbreaks of equally cold air because this location
is already in close proximity to the climatologically
coldest regions in the hemisphere.
Monthly scatterplots for DJF are narrower in shape
and have few extreme months occurring during an op-
posing sign from the preferred association than for the
daily case. In the daily case there is a higher proportion
of Tn10 days falling outside of NAM1 days and even
some occurring with NAM2 days, than in the monthly
case. This is also true for the PNA Alaska case as very
few months occur with an index value that is outside of
the expected phase. The longer time scale increases the
association in these two places in a manner consistent
with the difference between the daily and monthly
percentage values depicted in Figs. 1 and 2. In contrast,
JJA daily and monthly scatterplots show weak associa-
tion compared with DJF in all cases, consistent with the
findings in section 2.
To summarize the results shown in Figs. 4–6, Table 1
shows the odds of having an extreme temperature con-
current with days in the upper quartile of the NAM or
PNAversus days in the lower quartile at select locations.
For example, if 50% of extreme temperature days occur
when the NAM is in the upper quartile of the index
distribution and 25% occur when the NAM is in the
lower quartile of the distribution, the ratio would be 2,
meaning it is twice as likely to have an extreme
FIG. 5. Box-and-whisker plots showing the (a)–(d)NAMand (e)–(h) PNA index values concurrent with cold (blue)
and warm (red) extreme minimum DJF temperature (a),(e) days and (b),(f) months and extreme warm maximum
JJA temperature (c),(g) days and (d),(h) months. Each dot represents one extreme temperature day/month. The box
outlines the 25th and the 75th percentiles of index values for that location while the vertical line in the box marks the
median. The black vertical lines delineate the lower and upper quartiles of the index values for all days or months
for reference with Fig. 1. The locations are the Great Lakes (GL), Alaska (AK), Baffin Island (BI), and the Gulf
Coast (GC).
1610 JOURNAL OF CL IMATE VOLUME 27
temperature when the NAM is in the upper quartile as it
is in the lower. Baffin Island shows the greatest odds
with Tn10 days being 5.8 times more likely when the
NAM is in the upper than the lower quartile while
Alaska shows almost no Tn10 days occurring when the
PNA is in the upper quartile of the distribution.
Figure 7 shows scatterplots for ENSO DJF minimum
and JJA maximum temperature associations at the Gulf
Coast and Alaska locations, which are both in regions
known to be influenced by ENSO teleconnections.
These are locations where the associations with ENSO
are expected to be stronger than for the majority of the
continent. Daily DJF temperatures show very little re-
lationship with the sign and strength of the Ni~no-3.4
index while there is a somewhat stronger relationship
with monthly temperature. In comparison with the
scatterplots for the NAM and PNA, the relationships
are notably weak with ENSO in these two locations.
There is a tendency for extreme warm months to be
associated with La Ni~na events in the Gulf Coast re-
gion with a weaker tendency for extreme cold events
to be associated with El Ni~no events in winter. In JJA,
the association is also weak for daily and monthly
extremes at the Gulf Coast location, while some asso-
ciation is seen between ENSO and daily and monthly
extremes at the Alaska location. These scatterplots
help illustrate the weak influence ENSOhas on the tails
of the temperature distribution over North America
FIG. 6. Scatterplots of normalized (a),(b),(e),(f) minimum DJF and (c),(d),(g),(h) maximum JJA temperature
anomalies vs index values of the (left) PNA for Alaska and (right) the NAM for Baffin Island. The vertical red lines
indicate the 10th and 90th percentile of temperature anomalies and the horizontal red lines indicate the 25th and 75th
percentile of the index values.
15 FEBRUARY 2014 LO IK I TH AND BROCCOL I 1611

and suggest that other mechanisms are substantially
more important for the occurrence of extreme tem-
peratures especially on daily time scales in the cases
examined here.
4. Dependence of circulation patterns on time scale
In LB12, composite analysis was used to identify and
describe the concurrent circulation anomaly patterns in
sea level pressure (SLP) and 500-hPa geopotential
height (Z500) associated with temperature extremes over
NorthAmerica. To determine if the resulting circulation
patterns are dependent on time scale, composite pat-
terns were computed for a longer period centered on the
day of the extreme temperature day. Figure 8 shows
composite anomalies for Z500 for the day of the extreme
(labeled60) and for a 15-day period centered on the day
of the extreme (labeled67), and Fig. 9 shows composite
anomalies for extreme temperature months. All DJF
plots are for extreme cold minimum temperature days
and all JJA plots are for extreme warm maximum tem-
perature days or months.
The 60 composites for cold minimum temperature
days in DJF show robust negative Z500 height anomalies
nearby or downstream of the location with weaker
positive anomalies upstream. The pattern of height
anomalies resembles the characteristic wave train asso-
ciated with the positive phase of the PNA for the Gulf
Coast example and the negative phase of the PNA for
the Alaska example. When the composite includes the
entire 15-day period centered on the extreme day, the
local anomaly center weakens in greater proportion to
the anomaly centers farther away while maintaining the
PNA-like wave train. A disproportional weakening of
the local anomaly center in relation to the more remote
anomalies is suggestive of the larger-scale teleconnection
pattern playing an important role as local synoptic-scale
weather events are averaged out. The local anomaly
pattern in the 60-day composites can therefore be con-
sidered a combination of a larger-scale circulation pat-
tern like the NAM or PNA and local weather that
contribute together to cause an extreme temperature
day. In the Alaska and Gulf Coast cases, the PNA may
act as an important factor in the occurrence of extreme
temperature days, but local weather plays a role in de-
termining which specific days breach the 10% tempera-
ture threshold.
A similar result is seen at Baffin Island, except with
the positive phase of the NAM in this case. The Great
Lakes example exhibits some commonalities with the
negative phase of the NAM but with a very strong
weakening of the local negative anomaly center; weather
likely plays a strong role in this region. Here, influence
from the NAM or other modes of variability is weaker
than in the other cases, which helps explain the larger
dependency on transient synoptic-scale circulation that is
important here. SLP anomaly composites (not shown)
further support the hypothesis that a local weather pat-
tern being superimposed on a teleconnection pattern is
typically associated with extreme temperature days in
these locations.
In JJA, Z500 anomalies are weaker, especially at the
two midlatitude locations (Gulf Coast and Great Lakes).
The weakening of the anomalies in the 67-day cases is
more proportional between all anomaly centers. While
this is subtle, it is consistent with a summertime pattern
that is dominated by local, smaller-scale circulation that
often persists for time scales shorter than 15 days. At
higher latitudes, as in the Alaska and Baffin Island cases,
strong anomalies are still present even in the67-day case.
Here the atmosphere is relatively baroclinic in summer
when compared with lower latitudes, so large-scale cir-
culation patterns that evolve over long time periods
are still common. These results support the lower asso-
ciation percentages seen in JJA and are consistent with
the overall weaker atmospheric circulation in theNorthern
Hemisphere summer months.
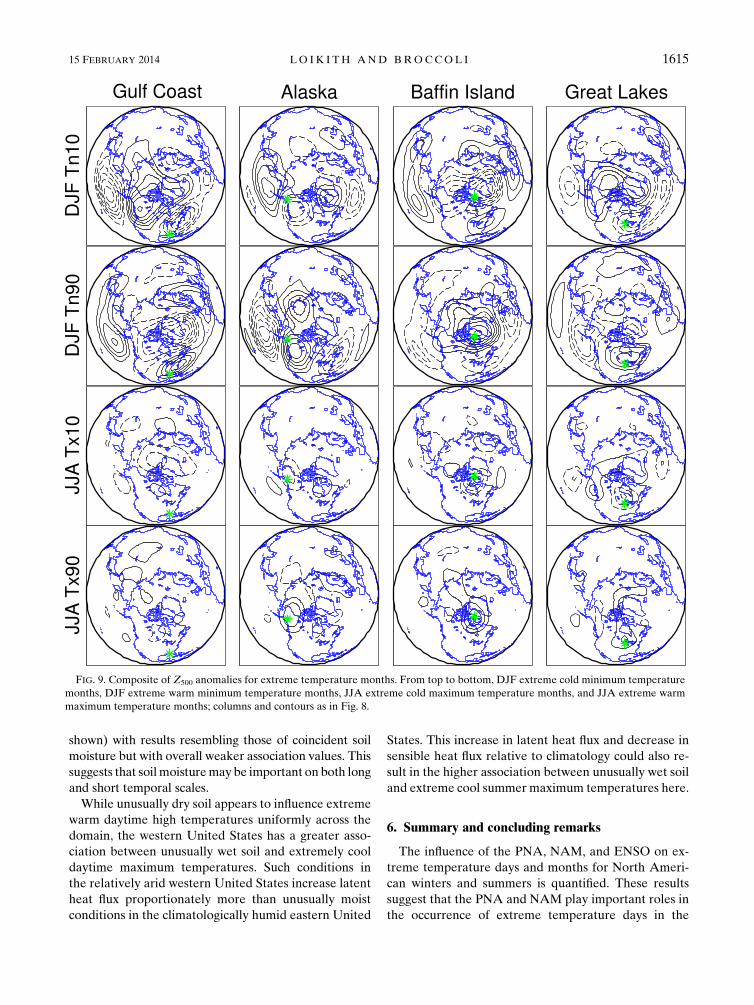
The composites of monthly mean Z500 anomalies
shown in Fig. 9 more closely resemble the characteristic
circulation patterns associated with the NAM and PNA.
In winter, the composite pattern for Tn10 months re-
sembles both the PNA1 and the NAM2 patterns for
the Gulf Coast location. The Alaska location has a
composite pattern resembling PNA2 for Tn10 and
PNA1 for Tn90. The composite pattern for Baffin
Island resembles NAM1 for Tn10 months and NAM2for Tn90months. The Great Lakes location has some
commonalities with NAM2 and PNA1 for Tn10 while
the Tn90 composite pattern does not strongly resemble
either pattern. JJA patterns are weak and generally
TABLE 1. Ratio of extreme temperature days concurrent with
days in the upper quartile to those concurrent with days in the
lower quartile of the NAM and PNA. All extremes are Tn10 for
DJF and Tx90 for JJA. A value of 1 would mean that the odds of
having an extreme temperature are the same for both quartiles of
the circulation pattern.
NAM PNA
DJF Tn10 Gulf Coast 0.75 3.4
DJF Tn10 Alaska 1.1 0.01
DJF Tn10 Baffin Island 5.8 0.94
DJF Tn10 Great Lakes 0.51 1.1
JJA Tx90 Gulf Coast 1.2 1.1
JJA Tx90 Alaska 1.4 0.47
JJA Tx90 Baffin Island 0.86 1.5
JJA Tx90 Great Lakes 0.67 1.3
1612 JOURNAL OF CL IMATE VOLUME 27

localized for extreme months. These results further il-
lustrate the greater influence the NAM and PNA have
on extreme temperatures on monthly time scales com-
pared with daily and on winter extremes compared with
summer.
5. Soil moisture influences
The weaker association percentages and lack of evi-
dence of large-scale circulation patterns in JJA lead to
the question: if large-scale, recurrent modes of climate
variability are not highly associated with extreme tem-
peratures in the summer, what other mechanisms are
important? One possible mechanism is anomalous near-
surface soil moisture content. To test the hypothesis that
extreme temperatures in summer are strongly associated
with anomalous soil moisture, Fig. 10 shows the associa-
tion percentages between extreme warm JJA maximum
and minimum temperature days and extremely dry soil
moisture (lower quartile of days) and extreme cool JJA
maximum and minimum temperature days with un-
usually moist soil (upper quartile of days).
In almost all locations, extreme warm maximum
temperature days have a higher probability of occurring
when soil moisture is unusually low. This is consistent
with the expected association as dry soil can enhance
surface temperatures because of decreased evaporation
and evapotranspiration and has been associated with
extreme heat episodes, like the European heat wave of
2003 (e.g., Fischer et al. 2007). Extreme warm minimum
temperature days are less associated with unusually
dry conditions. Because minimum temperatures occur
FIG. 7. As in Fig. 6, but for Ni~no-3.4 at the (a)–(d) Gulf Coast and (e)–(h) Alaska locations.
15 FEBRUARY 2014 LO IK I TH AND BROCCOL I 1613

during the night when there is no insolation, dry surface
conditions would not be expected to enhance heating
or inhibit cooling, all other things being equal. Areas
where there is a significant increase in the probability of
extremely warm nights when soil moisture is low may
be due to residual extreme daytime heat that was
influenced by dry surface conditions.
Similar to the enhancement effect on surface tem-
perature that unusually dry surface conditions have,
unusually wet soil can inhibit surface heating during the
daytime. There is a strong association between ex-
tremely cool JJAmaximum temperatures and unusually
moist soil over the western half of theUnited States with
weaker but still significant associations along the Gulf
Coast. This association could indicate that unusually
moist surface conditions inhibit daytime warming, but it
could also suggest that weather patterns that cause
precipitation in this region decrease the temperature
through cloudiness or evaporative cooling of the lower
atmospheric column by precipitation. The same associ-
ation is not seen in extreme cold minimum JJA tem-
peratures where unusually moist surface conditions can
inhibit diurnal cooling. Additionally, if wet days are as-
sociated with cloudiness, this could also inhibit nighttime
radiational cooling. Analysis of soil moisture as a pre-
cursor to extreme temperatures was also performed (not
FIG. 8. Composites of Z500 anomalies for all extreme cold DJF minimum temperature days and all extreme warm JJA maximum
temperature days for each of the four locations that are centered on the green star. Negative (positive) anomalies are contoured with
dashed (solid) lines. The contour interval is 20m and the zero contour is omitted. Rows labeled as60 days are composites of anomalies for
only the extreme temperature days, while rows labeled as67 days are composites of the 15-day mean anomaly centered on the extreme
temperature day.
1614 JOURNAL OF CL IMATE VOLUME 27
shown) with results resembling those of coincident soil
moisture but with overall weaker association values. This
suggests that soilmoisturemay be important on both long
and short temporal scales.
While unusually dry soil appears to influence extreme
warm daytime high temperatures uniformly across the
domain, the western United States has a greater asso-
ciation between unusually wet soil and extremely cool
daytime maximum temperatures. Such conditions in
the relatively arid western United States increase latent
heat flux proportionately more than unusually moist
conditions in the climatologically humid eastern United
States. This increase in latent heat flux and decrease in
sensible heat flux relative to climatology could also re-
sult in the higher association between unusually wet soil
and extreme cool summer maximum temperatures here.
6. Summary and concluding remarks
The influence of the PNA, NAM, and ENSO on ex-
treme temperature days and months for North Ameri-
can winters and summers is quantified. These results
suggest that the PNA and NAM play important roles in
the occurrence of extreme temperature days in the
FIG. 9. Composite of Z500 anomalies for extreme temperature months. From top to bottom, DJF extreme cold minimum temperature
months, DJF extreme warm minimum temperature months, JJA extreme cold maximum temperature months, and JJA extreme warm
maximum temperature months; columns and contours as in Fig. 8.
15 FEBRUARY 2014 LO IK I TH AND BROCCOL I 1615

regions in the vicinity of the characteristic atmospheric
circulation anomalies associated with these modes of
variability. Many extreme temperature events also oc-
cur when an influential mode of variability is not in the
preferred phase and in some cases is opposite in sign
from the preferred phase. More extreme temperature
days are influenced by the PNA than the NAM over
the continent in winter than in summer. Areas in
northwestern North America are strongly influenced by
the PNA while the PNA affects southeastern North
America in the opposite way in wintertime. The NAM is
also particularly influential over the northeastern parts
of the continent and in a band running from the north-
western to southeastern parts of North America in
winter. Few locations have an increased probability of
extreme temperatures when neither the PNA nor the
NAM are unusually positive or negative in the winter
while numerous extreme warm days occur when neither
pattern is outside of the upper or lower quartiles of the
index value distribution in the summer. In general,
summertime associations with both modes are weaker
and less systematic than wintertime associations.
Local, transient, synoptic-scale weather patterns are
also key to causing a given day to have an extreme
temperature in most locations, but this is often in con-
junction with an unusually strong phase of an influential
mode of climate variability. Composite analysis of anom-
alies in SLP and Z500 at four locations illustrate the dom-
inance of the PNA and NAM in the areas of influence
for these patterns while also showing that synoptic-scale
weather patterns superimposed on these larger-scale
teleconnection patterns are present. Summertime as-
sociations are weaker and largely limited to higher
latitudes where large-scale circulation is more domi-
nant compared with the less baroclinic atmosphere
farther south.
Association between ENSO and extreme temperature
days tends to be weak in the analysis performed in this
work. There is a slight increase in significant association
between ENSO and extreme temperaturemonths.While
ENSO can have an impact on local temperature, these
results suggest that other mechanisms are substantially
more important for the occurrence of extremes in both
winter and summer. Because ENSO is defined by SST
anomalies in the equatorial Pacific Ocean, it follows that
associations would be weaker over North America than
in the cases of the PNA and NAM, which are defined by
atmospheric circulation anomalies with centers of action
over the continent.
It is also possible that variability in the characteristics
of an ENSO event has an impact on the type and strength
of the associated impacts on extremes. For example, two
different types of El Ni~no events have been identified,
each with different temperature teleconnections over
North America. The traditional warm event is character-
ized by warm sea surface temperature anomalies centered
over the eastern tropical Pacific (EP) while the other type
is centered over the central tropical Pacific (CP) (Yu et al.
2012, and references therein). The CP events are asso-
ciated with a temperature anomaly dipole with warm
anomalies over the northwestern United States and cold
anomalies over the southeastern United States. The EP
events are characterized by warm anomalies primarily
FIG. 10. Percentage of extremely warm JJA (a) maximum and
(b) minimum temperature days that occurred when soil moisture
was in the driest quartile of days at each grid cell and extremely
cold (c) maximum and (d) minimum temperature days that oc-
curred when the soil moisture was in the wettest quartile of days at
each grid cell.
1616 JOURNAL OF CL IMATE VOLUME 27

over the northern tier of the United States. Because these
two varieties of ENSO events influencemean temperature
differently, it follows that these two varieties influence
temperature extremes differently also.
Anomalous soil moisture, affecting the local surface
energy budget, is influential in many cases for the oc-
currence of extremes in summer. Over the continental
United States, extreme warm summer days tend to be
associated with unusually dry surface soil moisture and
extreme cool days are often associated with unusually
moist soil moisture (especially in the western United
States). A more comprehensive analysis of mechanisms
that affect the surface radiation balance in summer
months would help identify other important mecha-
nisms and their causes for summer extremes.
Acknowledgments. This study was supported by the
Office of Science (BER), U.S. Department of Energy,
Award DE-SC0005467. We thank John Lanzante for his
insight and extremely helpful advice during this work.
We also thank Justin Sheffield for providing the VIC
data. This work was done as a private venture and not in
the author’s capacity as an employee of the Jet Pro-
pulsion Laboratory, California Institute of Technology.
REFERENCES
Alexander, L. V., and Coauthors, 2006: Global observed changes
in daily climate extremes of temperature and precipitation.
J. Geophys. Res., 111, D05109, doi:10.1029/2005JD006290.
Barnston, A. G., and R. E. Livezey, 1987: Classification, season-
ality, and persistence of low-frequency atmospheric circula-
tion patterns. Mon. Wea. Rev., 115, 1083–1126.
Beniston, M., 2004: The 2003 heat wave in Europe: A shape of
things to come? An analysis based on Swiss climatological
data and model simulations. Geophys. Res. Lett., 31, L02202,
doi:10.1029/2003GL018857.
Brown, P. J., R. S. Bradley, and F. T. Keimig, 2010: Changes in
extreme climate indices for the Northeastern United States,
1870–2005. J. Climate, 203, 6555–6572.
Caesar, J., L. Alexander, and R. Vose, 2006: Large-scale changes in
observed daily maximum and minimum temperatures: Crea-
tion and analysis of a new gridded data set. J. Geophys. Res.,
111, D05101, doi:10.1029/2005JD006280.
Cattiaux, J., R. Vautard, C. Cassou, P. Yiou, V. Masson-Delmotte,
and F. Codron, 2010: Winter 2010 in Europe: A cold ex-
treme in a warming world. Geophys. Res. Lett., 37, L20704,
doi:10.1029/2010GL044613.
Christidis, N., P. A. Stott, S. Brown, G. Hegerl, and J. Caesar, 2005:
Detection of changes in temperature extremes during the sec-
ond half of the 20th century. Geophys. Res. Lett., 32, L20716,
doi:10.1029/2005GL023885.
——,——, and——, 2011: The role of human activity in the recent
warming of extremely warm daytime temperatures. J. Climate,
24, 1922–1930.
Dole, R., and Coauthors, 2011: Was there a basis for anticipating
the 2010 Russian heat wave? An analysis based on Swiss cli-
matological data and model simulations. Geophys. Res. Lett.,
38, L06702, doi:10.1029/2010GL046582.
Fischer, E. M., S. I. Seneviratne, P. L. Vidale, D. L€uthi, and
C. Sch€ar, 2007: Soil moisture–atmosphere interactions during
the 2003 European summer heat wave. J. Climate, 20, 5081–5099.
Frich, P., V. Alexander, P. Della-Marta, B. Gleason, M. Haylock,
A. M. G. Klein Tank, and T. Peterson, 2002: Observed co-
herent changes in climatic extremes during the second half of
the twentieth century. Climate Res., 19, 193–212.
Gershunov, A., and T. P. Barnett, 1998: ENSO influence on in-
traseasonal extreme rainfall and temperature frequencies in
the contiguous United State: Observations and model results.
J. Climate, 11, 1575–1586.
Griffiths, M. L., and R. S. Bradley, 2007: Variations of twentieth-
century temperature and precipitation extreme indicators in
the northeast United States. J. Climate, 20, 5401–5417.
Guirguis, K., A. Gershunov, R. Schwartz, and S. Bennett, 2011:
Recent warm and cold daily winter temperature extremes in
the Northern Hemisphere. Geophys. Res. Lett., 38, L17701,
doi:10.1029/2011GL048762.
Higgins, R.W., A. Leetmaa, andV. E. Kousky, 2002: Relationships
between climate variability and winter temperature extremes
in the United States. J. Climate, 15, 1555–1572.
Horel, J. D., and J. M. Wallace, 1981: Planetary-scale atmospheric
phenomena associated with the Southern Oscillation. Mon.
Wea. Rev., 109, 813–829.
Hurrell, J. W., Y. Kushnir, G. Ottersen, and M. Visbeck, 2003: An
overview of the NorthAtlantic Oscillation.The NorthAtlantic
Oscillation: Climate Significance an Environmental Impact,
Geophys. Monogr., Vol. 134, Amer. Geophys. Union, 1–35.
Kalnay, E., and Coauthors, 1996: NCEP/NCAR 40-Year Re-
analysis Project. Bull. Amer. Meteor. Soc., 77, 437–471.Kenyon, J., and G. C. Hegerl, 2008: Influence of modes of climate
variability on global temperature extremes. J. Climate, 21,
3872–3889.
Kiladis, G. N., and H. F. Diaz, 1989: Global climatic anomalies
associated with extremes in the Southern Oscillation. J. Cli-
mate, 2, 1069–1090.
Kodra, E., K. Steinhaeuser, and A. R. Ganguly, 2011: Persisting
cold extremes under 21st-century warming scenarios. Geo-
phys. Res. Lett., 38, L08705, doi:10.1029/2011GL047103.
Liang, X., D. P. Lettenmaier, E. F. Wood, and S. J. Burges, 1994: A
simple hydrologically based model of land surface water and
energy fluxes forGSMs. J.Geophys. Res., 99 (D7), 14 415–14428.
Loikith, P. C., and A. J. Broccoli, 2012: Characteristics of observed
atmospheric circulation patterns associated with temperature
extremes over North America. J. Climate, 25, 7266–7281.
Meehl, G. A., and C. Tebaldi, 2004: More intense, more frequent,
and longer lasting heat waves in the 21st century. Science, 305,
994–997.
——, and Coauthors, 2007: Global climate projections. Climate
Change 2007: The Physical Science Basis, S. Solomon et al.,
Eds., Cambridge University Press, 747–846.
——, C. Tebaldi, G.Walton, D. Easterling, and L. McDaniel, 2009:
Relative increase of record high maximum temperatures
compared to record low minimum temperatures in the U.S.
Geophys. Res. Lett., 36, L23701, doi:10.1029/2009GL040736.
Morak, S., G. C. Hegerl, and J. Kenyon, 2011: Detectable regional
changes in the number of warm nights.Geophys. Res. Lett., 38,
L17703, doi:10.1029/2011GL048531.
——, ——, and N. Christidis, 2013: Detectable changes in the
frequency of temperature extremes. J. Climate, 26, 1561–1574.Quadrelli, R., and J. M. Wallace, 2004: A simplified linear frame-
work for interpreting patterns of Northern Hemisphere win-
tertime climate variability. J. Climate, 17, 3728–3744.
15 FEBRUARY 2014 LO IK I TH AND BROCCOL I 1617

Rahmstorf, S., andD. Coumou, 2011: Increase of extreme events in
a warming world. Proc. Natl. Acad. Sci. USA, 108, 17 905–
17 909, doi:10.1073/pnas.1101766108.
Ropelewski, C. F., and M. S. Halpert, 1987: Global and regional
scale precipitation patterns associated with the El Nino/
Southern Oscillation. Mon. Wea. Rev., 115, 1606–1626.
Sch€ar, C., P. L. Vidale, D. L€uthi, C. Frei, C. H€aberli, M. A. Liniger,
and C. Appenzeller, 2004: The role of increasing temperature
variability inEuropean summer heatwaves.Nature, 427, 332–336.
Stott, P.A.,D.A. Stone, andM.R.Allen, 2004:Human contribution
for the European heatwave of 2003. Nature, 432, 610–614.
Straus, D. M., and J. Shukla, 2002: Does ENSO force the PNA?
J. Climate, 15, 2340–2358.
Tebaldi, C., K. Hayhoe, J. M. Arblaster, and G. A. Meehl, 2006:
Going to the extremes, an intercomparison of model-simulated
historical and future changes in extreme events. Climatic
Change, 79, 185–211.
Thompson, D. W. J., and J. M. Wallace, 1998: The Arctic Oscilla-
tion signature in the wintertime geopotential height and
temperature fields. Geophys. Res. Lett., 25, 1297–1300.
——, and ——, 2000: Annular modes in the extratropical circula-
tion. Part I: Month-to-month variability. J. Climate, 13, 1000–
1016.
——, and ——, 2001: Regional climate impacts of the Northern
Hemisphere annular mode. Science, 293, 85–89.
Trenberth, K. E., 1997: The definition of El Ni~no. Bull. Amer.
Meteor. Soc., 78, 2771–2777.Vavrus, S., J. E. Walsh, W. L. Chapman, and D. Portis, 2006: The
behavior of extreme cold air outbreaks under greenhouse
warming. Int. J. Climatol., 26, 1133–1147.
Wallace, J. M., and D. S. Gutzler, 1981: Teleconnections in the
geopotential height field during the Northern Hemisphere
winter. Mon. Wea. Rev., 109, 784–812.
Wang, C., H. Liu, and S.-K. Lee, 2010: The record-breaking cold
temperatures during the winter of 2009/2010 in the Northern
Hemisphere. Atmos. Sci. Lett., 11, 161–168.
Wettstein, J. J., and L. O. Mearns, 2002: The influence of the North
Atlantic–Arctic Oscillation on mean, variance, and extremes
of temperature in the northeastern United States and Canada.
J. Climate, 15, 3586–3600.
Yu, J.-Y., Y. Zou, S. T. Kim, and T. Lee, 2012: The changing impact
of El Ni~no onUSwinter temperatures.Geophys. Res. Lett., 39,L15702, doi:10.1029/2012GL052483.
Zwiers, F. W., X. Zhang, and Y. Feng, 2011: Anthropogenic in-
fluence on long return period daily temperature extremes at
regional scales. J. Climate, 24, 881–892.
1618 JOURNAL OF CL IMATE VOLUME 27