The Interrelationship between Intellectual Capital and ... PAPERS/JSSH Vol... · The...
16
Pertanika J. Soc. Sci. & Hum. 24 (S): 83 – 98 (2016) ISSN: 0128-7702 © Universiti Putra Malaysia Press SOCIAL SCIENCES & HUMANITIES Journal homepage: http://www.pertanika.upm.edu.my/ ARTICLE INFO Article history: Received: 19 November 2015 Accepted: 04 May 2016 E-mail addresses: [email protected] (Hidayat, C.), [email protected] (Putong, I.), [email protected] (Puspokusumo, R. A. A. W.) * Corresponding author The Interrelationship between Intellectual Capital and Financial Performance: A Case Study of Indonesian Insurance Companies Hidayat, C.*, Putong, I. and Puspokusumo, R. A. A. W. Department of Management, School of Business Management, Bina Nusantara University, Jakarta 11480, Indonesia ABSTRACT This study aims to confirm the interrelationship between intellectual capital and financial performance by examining 9 (nine) public-listed Indonesian insurance companies’ financial statements from 2009 to 2013. Through this, it expects to determine which variables were more influential to intellectual capital and financial performance using secondary, time series, and panel data. Based on Canonical analysis results, the dominant influence on the financial performance of intellectual capital rather than vice versa. Granger causality analysis results indicate that all the variables of intellectual capital and financial performance can be mutually influential. Not all variables have a significant influence one with another. The variables that have significant influence among one another is HCE to ROA, ROE to SCE, and ROA to ROE (not vice versa). It shows that for the case of Indonesian, insurance company’s financial performance has more dominant effect than intellectual capital. Keywords: Intellectual Capital, Human Capital Efficiency, Structural Capital Efficiency, Physical Employed Efficiency, Financial Performance, Canonical Model, Granger Causality Model INTRODUCTION Human resources are the most important of organisational resources. It needs to be balanced with other production inputs in order to be beneficial to a company’s performance. Intellectual Capital is an intangible asset that is not easy to measure, according to Marko (2013), intellectual resources and intellectual capital can only have a competitive advantage when management recognizes the importance of the individual experience. According to Sharma (2013), human capital includes the character, attitude, health, and self-
Transcript of The Interrelationship between Intellectual Capital and ... PAPERS/JSSH Vol... · The...

Pertanika J. Soc. Sci. & Hum. 24 (S): 83 – 98 (2016)
ISSN: 0128-7702 © Universiti Putra Malaysia Press
SOCIAL SCIENCES & HUMANITIESJournal homepage: http://www.pertanika.upm.edu.my/
ARTICLE INFOArticle history:Received: 19 November 2015Accepted: 04 May 2016
E-mail addresses:[email protected] (Hidayat, C.),[email protected] (Putong, I.),[email protected] (Puspokusumo, R. A. A. W.)* Corresponding author
The Interrelationship between Intellectual Capital and Financial Performance: A Case Study of Indonesian Insurance Companies
Hidayat, C.*, Putong, I. and Puspokusumo, R. A. A. W.Department of Management, School of Business Management, Bina Nusantara University, Jakarta 11480, Indonesia
ABSTRACT
This study aims to confirm the interrelationship between intellectual capital and financial performance by examining 9 (nine) public-listed Indonesian insurance companies’ financial statements from 2009 to 2013. Through this, it expects to determine which variables were more influential to intellectual capital and financial performance using secondary, time series, and panel data. Based on Canonical analysis results, the dominant influence on the financial performance of intellectual capital rather than vice versa. Granger causality analysis results indicate that all the variables of intellectual capital and financial performance can be mutually influential. Not all variables have a significant influence one with another. The variables that have significant influence among one another is HCE to ROA, ROE to SCE, and ROA to ROE (not vice versa). It shows that for the case of Indonesian, insurance company’s financial performance has more dominant effect than intellectual capital.
Keywords: Intellectual Capital, Human Capital Efficiency, Structural Capital Efficiency, Physical Employed Efficiency, Financial Performance, Canonical Model, Granger Causality Model
INTRODUCTION
Human resources are the most important of organisational resources. It needs to be balanced with other production inputs in order to be beneficial to a company’s performance. Intellectual Capital is an intangible asset that is not easy to measure,
according to Marko (2013), intellectual resources and intellectual capital can only have a competitive advantage when management recognizes the importance of the individual experience. According to Sharma (2013), human capital includes the character, attitude, health, and self-

Pertanika J. Soc. Sci. & Hum. 24 (S): 83 – 98 (2016)
Hidayat, C., Putong, I. and Puspokusumo, R. A. A. W.
84
motivation. Meanwhile knowledge assets are just part of the intangible factors that contribute to a person’s performance.
The service sector accounts for over 70 percent of business, with the insurance services sector being an important business activity. Based on a selection criteria centered on organizational performance some insurance companies were identified. Organizational performance is a variable that is thought to have close links with the intellectual capital. Intellectual capital with the existing dimensions can be analyzed by the contribution to the overall good performance of a company. In this study, organizational performance variables are limited to financial measures as a mean of organizational performance of the most common and often used in previous studies.
Several previous studies suggested that the intellectual capital significantly affect organizational performance (Bollen, Vergauwen, & Schnieders, 2005; Salicru, Perryer, & Hancock, 2007; Choudhury, 2010). In this regard, the authors are interested to analyze the interrelationship between the variables of intellectual capital and organizational performance of insurance companies, especially insurance companies in Indonesia that have gone public. The
purpose of this study was to analyze the interrelationship model of intellectual capital and corporate performance based on the interpretation of 9 (nine) Indonesian insurance companies financial statement. Other study aimed at determining which variables were more influential among intellectual capital and financial performance.
Based on previous research that examines the relationship between intellectual capital and corporate performance, it is found that the majority states that intellectual capital has a positive and significant impact on the firm financial performance. Theoretically, the better intellectual capital of the company, the better company’s financial performance would be. Empirically, the development of the company’s intellectual capital tends to remain in the long term, increase and dropped precipitously (constant trend) while financial performance is likely to vary with the trend tends to decline. The results of statistical test based on secondary data derived from the financial statements of the nine Indonesia Insurance company showed that the average intellectual capital with the Financial Performance for a variance, median and mean total significance which indicates the difference, meaning the two variables are not linear, homogenous, and normal correlation (figure 1).
Figure 1. Intellectual Capital and Financial performance

Pertanika J. Soc. Sci. & Hum. 24 (S): 83 – 98 (2016)
Intellectual Capital and Financial Performance
85
Based on above arguments and figure 1, as the underline phenomenon of why this research needs to be conducted, especially for Indonesian companies engaged in insurance. Research results obtained are expected to answer the question of why the intellectual capital and financial performance has a tendency of inequality.
LITERATURE REVIEW
Human capital also referred to as intellectual capital is an intangible asset that is not easy to measure, because initially you need to have a dynamic nature and relatively change with changing circumstances. According to Sharma (2013), human capital concerns not only at the skills and expertise of a person in an organization, but also includes character, attitude, health, and self-motivation. In the opinion of Marko (2013), intellectual resources and intellectual capital can only be a competitive advantaged when management recognizes the importance of individual experience, as well as knowledge of an individual has a positive influence on the current development and future of the organization. Dae-Bong (2009) says that the concept of human capital consists of three aspects, namely individual, human capital itself, and production-oriented perspective. Intellectual capital indicator variable in this study refers to the opinion of Pulic (2008), which consists of three indicators, namely human capital efficiency (HCE), structural capital efficiency (SCE), and physical capital efficiency or physical employed efficiency (PEE). Physical
capital efficiency sometimes called also capital employed efficiency (CEE). Value added intellectual coefficient (VAIC) method developed by Ante Pulic in 1998 will be used in this research.
The Value added (VA) indicator is measured in monetary units. It is the difference between the output (OUT) and input (IN) and represents the value created by the organization during a year. VA = OUT- IN, where output (OUT) is total income or total revenue generated by an organization during the year by selling goods or services. Input (IN) is costs that are incurred by the organization towards purchase of inputs for business operations.
Human capital (HC) is one of the most important components of intellectual capital. It covers all expenditure on employees’ compensation and development. Structural capital (SC) is a skeleton of organization. It includes institutionalized knowledge and comprehensive experiences based on routine activities and processes. Structural capital refers to the organization structures, systems and processes that enable an organization to exploit the intellectual capital. Capital employed (CE) includes the net physical and material assets of the organization employed for attaining financial goals.
Value added intellectual coefficient (VAIC) indicates the intellectual capability of the organization. VAIC is the sum total of the three components for example HCE, SCE and CEE, and indicates the intellectual capability of the organization. The formula of Value Added Intellectual Coefficient:
Pertanika J. Soc. Sci. & Hum. 24 (S): 83 – 98 (2016)
Hidayat, C., Putong, I. and Puspokusumo, R. A. A. W.
86
VAIC = HCE + CEE+ SCE (1)
Where, Human capital efficiency (HCE) is the ratio of value added (VA) to human capital (HC). This ratio gives the contribution made by every unit of money invested in HC to the VA in the organization. It is an indicator of value added efficiency of human capital and calculated as a follow:
HCE = VA/HC (2)
Physical employed efficiency (PEE) is the ratio of value added (VA) to capital employed (CE); this ratio shows the contribution made by every unit of CE to the VA in the organization. It is an indicator of value added efficiency of capital employed and calculated as a follow:
PEE = VA / CE (3)
Structural capital efficiency (SCE) is the ratio of structural capital (SC) to value added (VA). It is an indicator of value added efficiency of structural capital and calculated as a follow:
SCE = SC / VA (4)
The concept of intellectual capital has been getting great attention from various parties, especially accountants and academics. This phenomenon requires them to seek more detailed information on matters related to the management of intellectual capital. A company’s intellectual capital can be seen from the knowledge and skills possessed by employees, structures and
corporate strategy, information technology, customer loyalty and suppliers. The measurement can be done by various methods now widely experienced growth. Human capital can be increased if the company can exploit and develop the knowledge, competence and skills of its employees efficiently. Therefore, human capital is a key resource that can create a competitive advantage companies so that companies are able to compete and survive in a dynamic business environment. By having skilled employees, it can improve the performance of the company and ensure the sustainability of the company. Increased performance of the company will also increase the market perception
Organizational performance illustrates how far an organization is able to achieve its targets. The performance of an organization can generally be divided into two, namely the performance of financial and non-financial performance. Rauch, Wiklund, Lumpkin, & Frese (2009: 9) states that business performance is a multidimensional concept. One distinction is between financial and non-financial measures. The size of the non-financial dealt with matter such as satisfaction and success rates determined by the owner or manager of the company. Financial measures include an assessment of factors such as sales growth and return on investment. In this study given with regard to the availability of data, used as a performance measure of financial performance of insurance companies. The financial performance indicators are used as benchmarks in this study are two financial
Pertanika J. Soc. Sci. & Hum. 24 (S): 83 – 98 (2016)
Intellectual Capital and Financial Performance
87
ratios most frequently and commonly used are: return on assets (ROA) and return on equity (ROE).
Return on equity (ROE) is a measure of profitability that calculates how many dollars of profit a company generates with each dollar of shareholders’ equity. ROE is an indicator that measures how effective management using equity financing to fund operations and grow the company. The investors want to see a high return on equity ratio because this indicates that the company is using its investors’ funds effectively. The formula for ROE is: ROE = Net Income/Shareholders’ Equity. ROE is sometimes called return on net worth. Net income is for the full fiscal year (before dividends paid to common stock holders but after dividends to preferred stock) Shareholder’s equity does not include preferred shares.
The return on assets (ROA), often called the return on total assets, is a profitability ratio that measures the net income produced by total assets during a period by comparing net income to the average total assets. The assets of the company are comprised of both debt and equity. Both of these types of financing are used to fund the operations of the company. ROA is an indicator that measures how efficient management is at using its assets to generate earnings. ROA calculated by dividing a company’s annual earnings by its total assets, ROA is displayed as a percentage. Annual earning is a company’s total revenue for a calendar or fiscal year less its annual operating expenses,
interest paid, depreciation, and taxes. Total asset is the sum of all cash, investments, furniture, fixtures, equipment, receivables, intangibles, and any other items of value owned by a person or a business entity.
Another study describes the relationship between intellectual capital and organizational performance is research Salicru et al. (2007) argued that there is a significant relationship between the two variables
Bollen et al. (2005) in his research suggests that the three main elements of intellectual capital are human capital, structural capital and relationship capital affect the performance indirectly, because there are other variables that mediate namely intellectual property. In the study also noted that the three main elements of intellectual capital are human capital, structural capital and relationship capital have a reciprocal relationship of mutual influence. The study of Chen, Cheng, & Hwang (2012) revealed that the greater company’s intellectual capital efficiency results greater profitability and revenue growth both the current and the following years. Research from Mondal and Ghosh (2012), indicates that intellectual capital is an important determinant of profitability and productivity.
The Research to determine the opposite relationship, namely the relationship of the financial performance on human resources has been conducted by several researchers, although very limited. One is research Micah, Ofurum, & Ihendinihu (2012), showed that one indicator of the
Pertanika J. Soc. Sci. & Hum. 24 (S): 83 – 98 (2016)
Hidayat, C., Putong, I. and Puspokusumo, R. A. A. W.
88
financial performance of ROE has a strong positive influence on the human resources disclosure accounting (HRA). El-Bannany (2012), states that one of the findings that one indicator of financial performance namely profitability affect the increased efficiency of intellectual capital performance.
Most of the previous studies revealed a positive relationship between intellectual capital and organizational performance. A
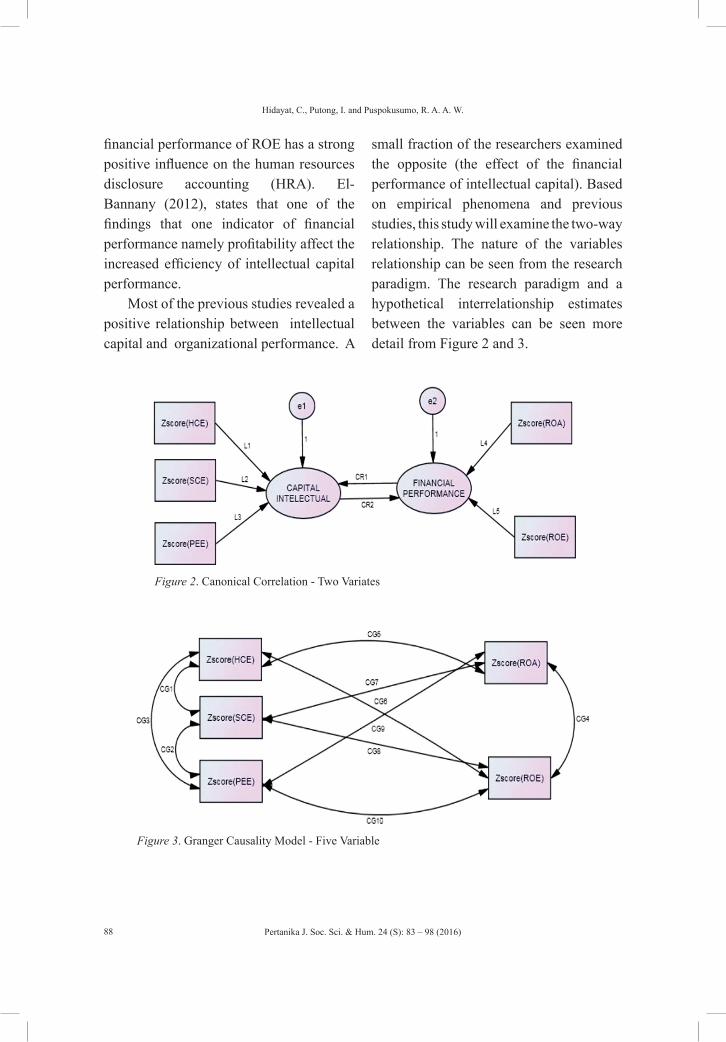
small fraction of the researchers examined the opposite (the effect of the financial performance of intellectual capital). Based on empirical phenomena and previous studies, this study will examine the two-way relationship. The nature of the variables relationship can be seen from the research paradigm. The research paradigm and a hypothetical interrelationship estimates between the variables can be seen more detail from Figure 2 and 3.
Figure 2. Canonical Correlation - Two Variates
Figure 3. Granger Causality Model - Five Variable
Pertanika J. Soc. Sci. & Hum. 24 (S): 83 – 98 (2016)
Intellectual Capital and Financial Performance
89
Based on the theoretical framework that have been discussed previously, it can be arranged several hypotheses as follows: (1) There is a significant interrelationship between intellectual capital and firm performance; (2) One of the variables (intellectual capital or financial performance) has a more dominant influence than the others; (3) There is a significant interrelationship between human capital efficiency, structural capital efficiency, physical capital efficiency, return on asset, and return on equity.
The benefits of this research are: (1) Provide the development of concept in human resource management for the company based on the latest findings, particularly for insurance companies to develop and harness the power of business through intellectual capital; (2) Provide input for the insurance company on its corporate intellectual capital; (3) Add insight and knowledge of intellectual capital by using financial statement data.
RESEARCH METHODOLOGY
The main focus of the study was to analyze the interrelationship between intellectual capital variables and the company financial performance. The population of study is the insurance companies that have go public and is listed on the Indonesia Stock Exchange at the time of the study. The suggests that there are only 9 companies both national companies and affiliated national companies: Asuransi Bina Dana Arta Tbk, Asuransi Harta Aman Pratama Tbk, Asuransi Bintang Tbk, Asuransi Dayin
Mitra Tbk, Asuransi Multi Artha Guna Tbk, Asuransi Jasa Tania Tbk Asuransi Ramayana Tbk, Lippo General Insurance Tbk, and Panin Insurance Tbk.
The main data sources used in this research is secondary data derived from the financial statements of insurance companies in Indonesia that have go public were chosen as a unit of observation. The data were analyzed is time series panel data between 2009 and 2013 that consist of 9 insurance companies already listed on stock trading in the Indonesia Stock Exchange. The study uses secondary, time series, and panel data with the main analysis tools using Canonical model in multivariate and Granger causality model in bivariate.
Canonical correlation analysis is a method for exploring the relationships between two multivariate sets of variables. Canonical correlation analysis does not make strong normality assumptions. However, as with all least squares procedures, outliers can cause severe problems. In this case, the study needed to analyse scatter plots of each pair of variables, watching carefully for curvilinear patterns and for outliers. The occurrence of curvilinear relationship will reduce the effectiveness of the analysis.
Multicollinearity occurs when one variable is almost a weighted average of the others. Singularity occurs when this relationship is exact. Try running a principal components analysis on each set of variables, separately. If there is eigenvalues at or near zero, that means there is a multicollinearity problem. In this case, omit the offending variables.
Pertanika J. Soc. Sci. & Hum. 24 (S): 83 – 98 (2016)
Hidayat, C., Putong, I. and Puspokusumo, R. A. A. W.
90
The correlation matrix of all the variables is divided into four parts:
1. RXX , The correlations among the X variables.
2. Ryy , The correlations among the Y variables.
3. Rxy , The correlations between the X and Y variables.
4. Ryx, The correlations between the Y and X variables.
Canonical correlation analysis may be defined using the singular value decomposition of a matrix C where:
(5)
The average squared loadings are given by:
(6)
The redundancy indices are given by:
(7)
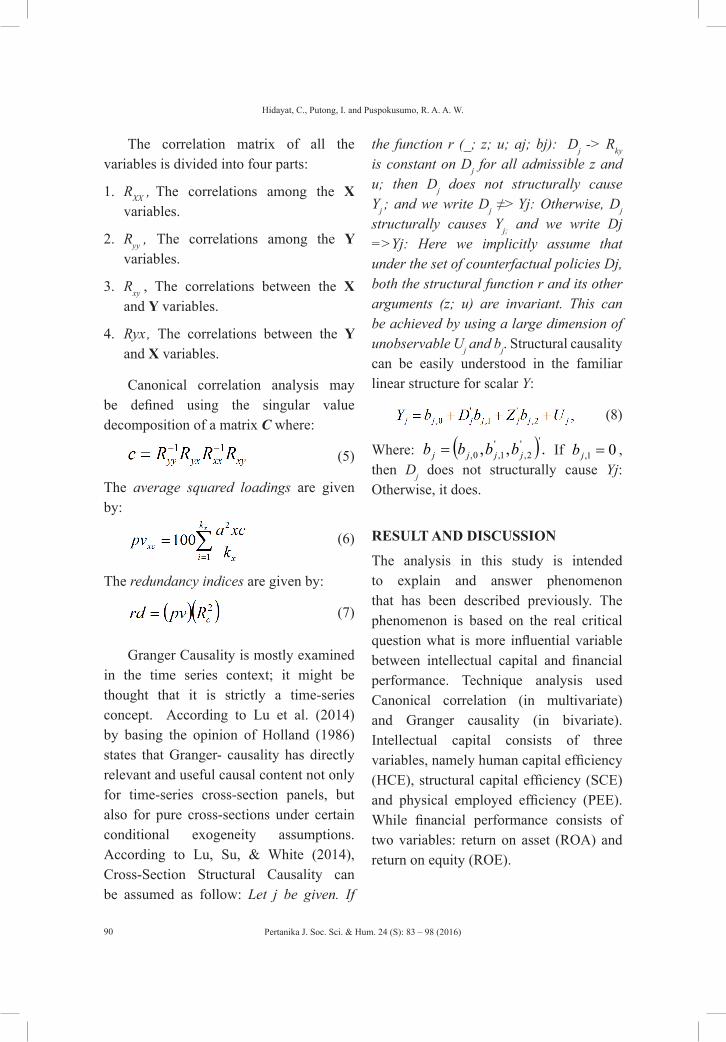
Granger Causality is mostly examined in the time series context; it might be thought that it is strictly a time-series concept. According to Lu et al. (2014) by basing the opinion of Holland (1986) states that Granger- causality has directly relevant and useful causal content not only for time-series cross-section panels, but also for pure cross-sections under certain conditional exogeneity assumptions. According to Lu, Su, & White (2014), Cross-Section Structural Causality can be assumed as follow: Let j be given. If
the function r (_; z; u; aj; bj): Dj -> Rky is constant on Dj for all admissible z and u; then Dj does not structurally cause Yj ; and we write Dj ≠> Yj: Otherwise, Dj structurally causes Yj; and we write Dj =>Yj: Here we implicitly assume that under the set of counterfactual policies Dj, both the structural function r and its other arguments (z; u) are invariant. This can be achieved by using a large dimension of unobservable Uj and bj. Structural causality can be easily understood in the familiar linear structure for scalar Y:
(8)
Where: ( ) .,, ''2,
'1,0, jjjj bbbb = If 01, =jb ,
then Dj does not structurally cause Yj: Otherwise, it does.
RESULT AND DISCUSSION
The analysis in this study is intended to explain and answer phenomenon that has been described previously. The phenomenon is based on the real critical question what is more influential variable between intellectual capital and financial performance. Technique analysis used Canonical correlation (in multivariate) and Granger causality (in bivariate). Intellectual capital consists of three variables, namely human capital efficiency (HCE), structural capital efficiency (SCE) and physical employed efficiency (PEE). While financial performance consists of two variables: return on asset (ROA) and return on equity (ROE).
Pertanika J. Soc. Sci. & Hum. 24 (S): 83 – 98 (2016)
Intellectual Capital and Financial Performance
91
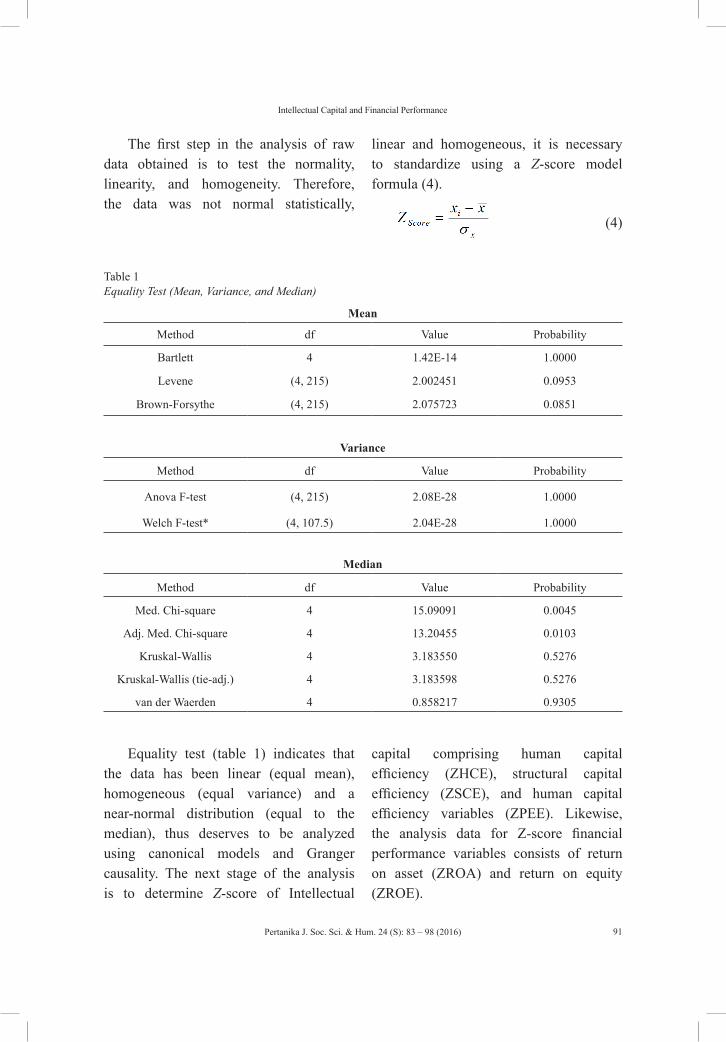
The first step in the analysis of raw data obtained is to test the normality, linearity, and homogeneity. Therefore, the data was not normal statistically,
linear and homogeneous, it is necessary to standardize using a Z-score model formula (4).
(4)
Table 1 Equality Test (Mean, Variance, and Median)
Mean
Method df Value Probability
Bartlett 4 1.42E-14 1.0000
Levene (4, 215) 2.002451 0.0953
Brown-Forsythe (4, 215) 2.075723 0.0851
Variance
Method df Value Probability
Anova F-test (4, 215) 2.08E-28 1.0000
Welch F-test* (4, 107.5) 2.04E-28 1.0000
Median
Method df Value Probability
Med. Chi-square 4 15.09091 0.0045
Adj. Med. Chi-square 4 13.20455 0.0103
Kruskal-Wallis 4 3.183550 0.5276
Kruskal-Wallis (tie-adj.) 4 3.183598 0.5276
van der Waerden 4 0.858217 0.9305
Equality test (table 1) indicates that the data has been linear (equal mean), homogeneous (equal variance) and a near-normal distribution (equal to the median), thus deserves to be analyzed using canonical models and Granger causality. The next stage of the analysis is to determine Z-score of Intellectual
capital comprising human capital efficiency (ZHCE), structural capital efficiency (ZSCE), and human capital efficiency variables (ZPEE). Likewise, the analysis data for Z-score financial performance variables consists of return on asset (ZROA) and return on equity (ZROE).
Pertanika J. Soc. Sci. & Hum. 24 (S): 83 – 98 (2016)
Hidayat, C., Putong, I. and Puspokusumo, R. A. A. W.
92
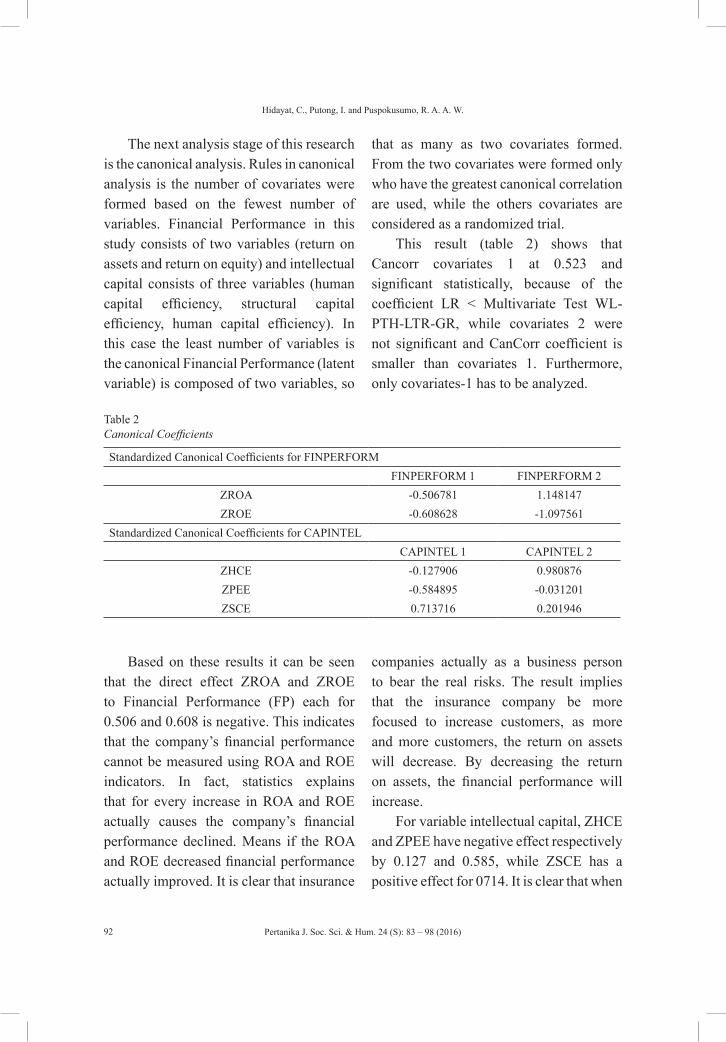
The next analysis stage of this research is the canonical analysis. Rules in canonical analysis is the number of covariates were formed based on the fewest number of variables. Financial Performance in this study consists of two variables (return on assets and return on equity) and intellectual capital consists of three variables (human capital efficiency, structural capital efficiency, human capital efficiency). In this case the least number of variables is the canonical Financial Performance (latent variable) is composed of two variables, so
that as many as two covariates formed. From the two covariates were formed only who have the greatest canonical correlation are used, while the others covariates are considered as a randomized trial.
This result (table 2) shows that Cancorr covariates 1 at 0.523 and significant statistically, because of the coefficient LR < Multivariate Test WL-PTH-LTR-GR, while covariates 2 were not significant and CanCorr coefficient is smaller than covariates 1. Furthermore, only covariates-1 has to be analyzed.
Table 2Canonical Coefficients
Standardized Canonical Coefficients for FINPERFORMFINPERFORM 1 FINPERFORM 2
ZROA -0.506781 1.148147ZROE -0.608628 -1.097561
Standardized Canonical Coefficients for CAPINTELCAPINTEL 1 CAPINTEL 2
ZHCE -0.127906 0.980876ZPEE -0.584895 -0.031201ZSCE 0.713716 0.201946
Based on these results it can be seen that the direct effect ZROA and ZROE to Financial Performance (FP) each for 0.506 and 0.608 is negative. This indicates that the company’s financial performance cannot be measured using ROA and ROE indicators. In fact, statistics explains that for every increase in ROA and ROE actually causes the company’s financial performance declined. Means if the ROA and ROE decreased financial performance actually improved. It is clear that insurance
companies actually as a business person to bear the real risks. The result implies that the insurance company be more focused to increase customers, as more and more customers, the return on assets will decrease. By decreasing the return on assets, the financial performance will increase.
For variable intellectual capital, ZHCE and ZPEE have negative effect respectively by 0.127 and 0.585, while ZSCE has a positive effect for 0714. It is clear that when
Pertanika J. Soc. Sci. & Hum. 24 (S): 83 – 98 (2016)
Intellectual Capital and Financial Performance
93
ZHCE and ZPEE increase the company’s intellectual capital is decreasing, but when ZSCE increase the intellectual capital of the company increased. Generally, means the company does not require hard effort to raise some intellectual capital variables, except HCE. It means companies can cut funding to improve the quality of human resources.
In general, when a company wants to improve financial performance, it must increase the intellectual capital. This condition explains that the 62.2% the company’s financial performance influence directly by the company’s employee intellectual. The better company’s intellectual employees, better
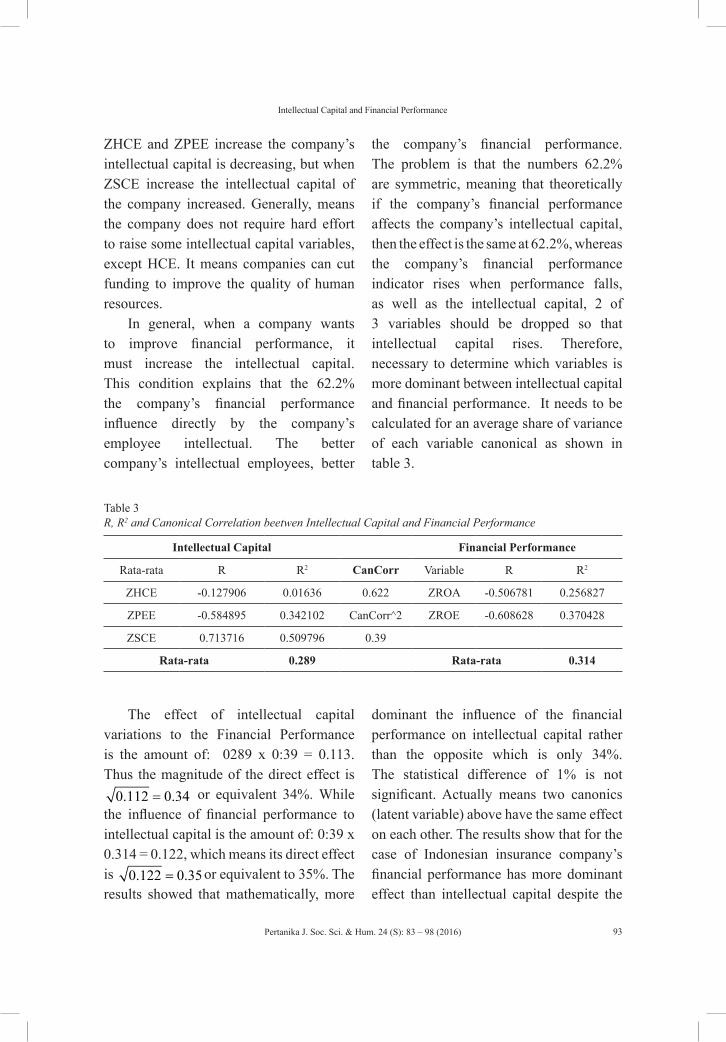
the company’s financial performance. The problem is that the numbers 62.2% are symmetric, meaning that theoretically if the company’s financial performance affects the company’s intellectual capital, then the effect is the same at 62.2%, whereas the company’s financial performance indicator rises when performance falls, as well as the intellectual capital, 2 of 3 variables should be dropped so that intellectual capital rises. Therefore, necessary to determine which variables is more dominant between intellectual capital and financial performance. It needs to be calculated for an average share of variance of each variable canonical as shown in table 3.
Table 3R, R2 and Canonical Correlation beetwen Intellectual Capital and Financial Performance
Intellectual Capital Financial Performance
Rata-rata R R2 CanCorr Variable R R2
ZHCE -0.127906 0.01636 0.622 ZROA -0.506781 0.256827
ZPEE -0.584895 0.342102 CanCorr^2 ZROE -0.608628 0.370428
ZSCE 0.713716 0.509796 0.39
Rata-rata 0.289 Rata-rata 0.314
The effect of intellectual capital variations to the Financial Performance is the amount of: 0289 x 0:39 = 0.113. Thus the magnitude of the direct effect is
0.112 0.34= or equivalent 34%. While the influence of financial performance to intellectual capital is the amount of: 0:39 x 0.314 = 0.122, which means its direct effect is 0.122 0.35= or equivalent to 35%. The results showed that mathematically, more
dominant the influence of the financial performance on intellectual capital rather than the opposite which is only 34%. The statistical difference of 1% is not significant. Actually means two canonics (latent variable) above have the same effect on each other. The results show that for the case of Indonesian insurance company’s financial performance has more dominant effect than intellectual capital despite the
Pertanika J. Soc. Sci. & Hum. 24 (S): 83 – 98 (2016)
Hidayat, C., Putong, I. and Puspokusumo, R. A. A. W.
94
relatively small difference. If the insurance company must determine priorities between intellectual capital and financial performance, the financial performance
should be prioritized. Although intellectual capital should still be considered because the difference was not significant statistically.
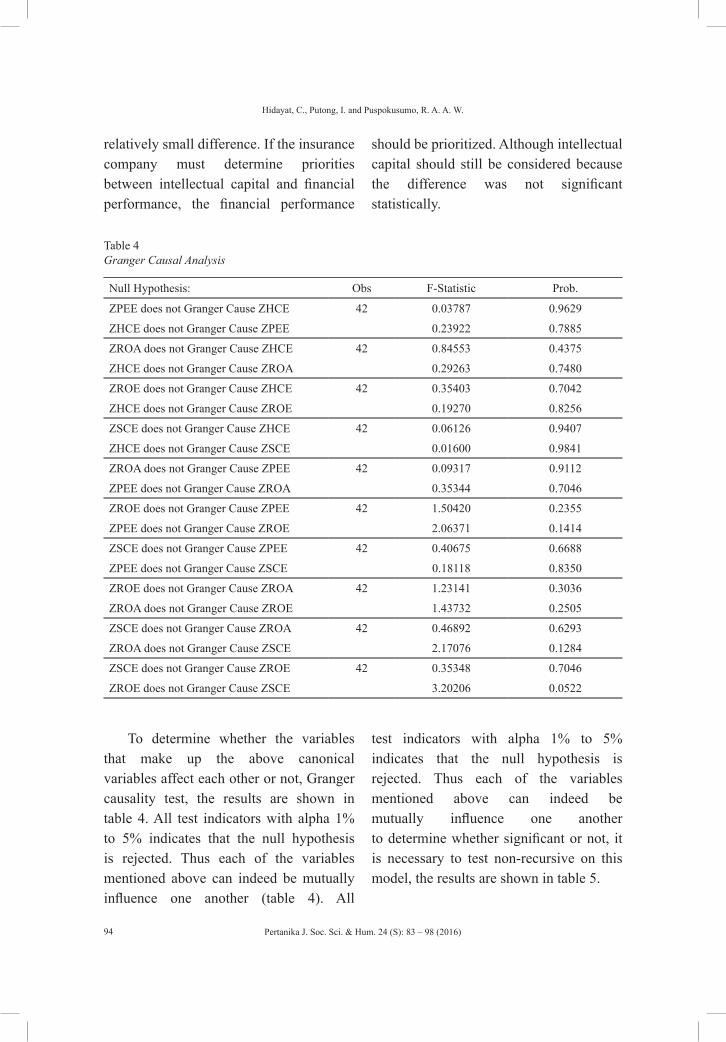
Table 4 Granger Causal Analysis
Null Hypothesis: Obs F-Statistic Prob.
ZPEE does not Granger Cause ZHCE 42 0.03787 0.9629
ZHCE does not Granger Cause ZPEE 0.23922 0.7885
ZROA does not Granger Cause ZHCE 42 0.84553 0.4375
ZHCE does not Granger Cause ZROA 0.29263 0.7480
ZROE does not Granger Cause ZHCE 42 0.35403 0.7042
ZHCE does not Granger Cause ZROE 0.19270 0.8256
ZSCE does not Granger Cause ZHCE 42 0.06126 0.9407
ZHCE does not Granger Cause ZSCE 0.01600 0.9841
ZROA does not Granger Cause ZPEE 42 0.09317 0.9112
ZPEE does not Granger Cause ZROA 0.35344 0.7046
ZROE does not Granger Cause ZPEE 42 1.50420 0.2355
ZPEE does not Granger Cause ZROE 2.06371 0.1414
ZSCE does not Granger Cause ZPEE 42 0.40675 0.6688
ZPEE does not Granger Cause ZSCE 0.18118 0.8350
ZROE does not Granger Cause ZROA 42 1.23141 0.3036
ZROA does not Granger Cause ZROE 1.43732 0.2505
ZSCE does not Granger Cause ZROA 42 0.46892 0.6293
ZROA does not Granger Cause ZSCE 2.17076 0.1284
ZSCE does not Granger Cause ZROE 42 0.35348 0.7046
ZROE does not Granger Cause ZSCE 3.20206 0.0522
To determine whether the variables that make up the above canonical variables affect each other or not, Granger causality test, the results are shown in table 4. All test indicators with alpha 1% to 5% indicates that the null hypothesis is rejected. Thus each of the variables mentioned above can indeed be mutually influence one another (table 4). All
test indicators with alpha 1% to 5% indicates that the null hypothesis is rejected. Thus each of the variables mentioned above can indeed be mutually influence one another to determine whether significant or not, it is necessary to test non-recursive on this model, the results are shown in table 5.
Pertanika J. Soc. Sci. & Hum. 24 (S): 83 – 98 (2016)
Intellectual Capital and Financial Performance
95
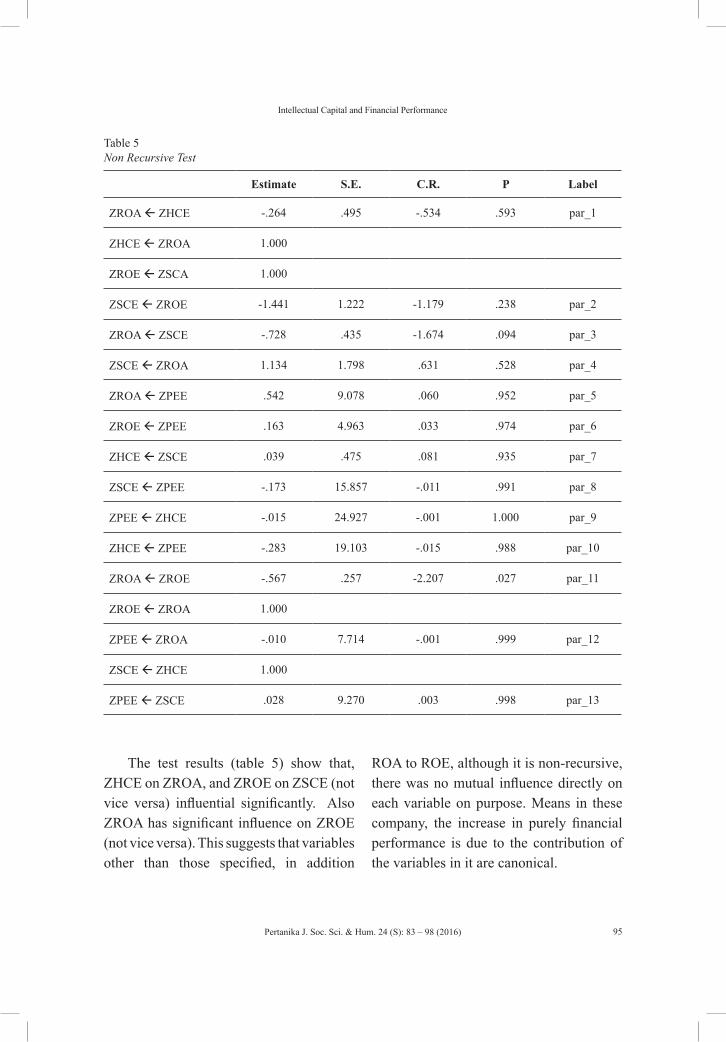
Table 5Non Recursive Test
Estimate S.E. C.R. P Label
ZROA ZHCE -.264 .495 -.534 .593 par_1
ZHCE ZROA 1.000
ZROE ZSCA 1.000
ZSCE ZROE -1.441 1.222 -1.179 .238 par_2
ZROA ZSCE -.728 .435 -1.674 .094 par_3
ZSCE ZROA 1.134 1.798 .631 .528 par_4
ZROA ZPEE .542 9.078 .060 .952 par_5
ZROE ZPEE .163 4.963 .033 .974 par_6
ZHCE ZSCE .039 .475 .081 .935 par_7
ZSCE ZPEE -.173 15.857 -.011 .991 par_8
ZPEE ZHCE -.015 24.927 -.001 1.000 par_9
ZHCE ZPEE -.283 19.103 -.015 .988 par_10
ZROA ZROE -.567 .257 -2.207 .027 par_11
ZROE ZROA 1.000
ZPEE ZROA -.010 7.714 -.001 .999 par_12
ZSCE ZHCE 1.000
ZPEE ZSCE .028 9.270 .003 .998 par_13
The test results (table 5) show that, ZHCE on ZROA, and ZROE on ZSCE (not vice versa) influential significantly. Also ZROA has significant influence on ZROE (not vice versa). This suggests that variables other than those specified, in addition
ROA to ROE, although it is non-recursive, there was no mutual influence directly on each variable on purpose. Means in these company, the increase in purely financial performance is due to the contribution of the variables in it are canonical.
Pertanika J. Soc. Sci. & Hum. 24 (S): 83 – 98 (2016)
Hidayat, C., Putong, I. and Puspokusumo, R. A. A. W.
96
CONCLUSION AND RECOMENDATION
Intellectual capital has a positive and significant influence on financial performance. If the insurance company wants to improve its financial performance, it should increase its intellectual capital. The direct effect of financial performance on the intellectual capital is greater than the reverse. It shows that for the case of Indonesian insurance company’s financial performance has more dominant effect than intellectual capital despite the relatively small difference.
The direct effect of return on asset and return on equity to financial performance is negative. This indicates that the company’s financial performance cannot be measured using return on asset and return on equity indicators. For every increase in return on asset and return on equity actually causes the company’s financial performance declined. If the return on asset and return on equity decreased, financial performance actually improved. It is clear that insurance companies actually as a business person to bear the real risks. This result implies that the insurance company be more focused to increase customers, as more and more customers, the return on assets will decrease. By decreasing the return on assets, the financial performance will increase.
The results analysis also showed that human capital efficiency and physical employed efficiency have a negative effect on intellectual capital. Meanwhile structural capital efficiency
effects positively on intellectual capital. Therefore, the company should prioritize structural capital efficiency to increase its intellectual capital. The company does not require hard effort to raise some intellectual capital variables, excepted human capital efficiency. It means companies can cut funding to improve the quality of human resources.
REFERENCESBollen, L., Vergauwen, P., & Schnieders, S. (2005).
Linking intellectual capital and intellectual property to company performance. Management Decision, 43(9), 1161 – 1185.
Chen, M. C., Cheng, S. J., & Hwang, Y. (2005). An empirical investigation of the relationship between intellectual capital and firms’ market value and financial performance. Journal of Intellectual Capital, 6(2), 159-176.
Dae-Bong, K. (2009). Human capital and its measurement. The 3rd OECD World Forum on “Statistics, Knowledge and Policy”.
El-Bannany, M., (2012). Global financial crisis and the intellectual capital performance of UAE banks. Journal of Human Resource Costing, & Accounting, 16(1), 20-36.
Lu, X., Su, L., & White, H., (2014). Granger causality and structural causality in cross-section and panel data. White’s Econometric Theory Lectures at the 7th Symposium on Econometric Theory and Application (SETA, 2011).
Marko, G. (2013). Human capital and knowledge audit as the competitive advantage of companies. Net Journal of Social Sciences, 1(1), 1-4.
Pertanika J. Soc. Sci. & Hum. 24 (S): 83 – 98 (2016)
Intellectual Capital and Financial Performance
97
Micah, L. C., Ofurum, C. O., & Ihendinihu, J. U. (2012). Firms Financial Performance and Human Resource Accounting Disclosure in Nigeria. International Journal of Business and Management, 7(14), 67-75.
Mondal, A., & Ghosh, S. K. (2012). Intellectual capital and financial, performance of Indian banks. Journal of Intellectual Capital, 13(4), 515-530.
Pulic, A. (2008). The Principles of Intellectual Capital Efficiency - A Brief Description. Retrieved December 5, 2014 from http://www.cik-hr.com/data/principles_2008.pdf.
Rauch, A., Wiklund, J., Lumpkin, G. T., & Frese, M. (2009). Entrepreneurial orientation and business performance: an assessment of past research and suggestion for the future. Entrepreneurship Theory and Practice, 33(3), 1-54.
Salicru, S., Perryer, C., & Hancock, P. (2007). Intellectual capital and company performance - literature review and research opportunities in Australia. In R. Chapman (Ed.), 21st ANZAM 2007 Conference. (p. 20). Sydney, Australia: Australian and New Zealand Academy of Management.
Sharma, A. (2013). Potential role it in the support of it in the support of organizational knowledge management. International Journal of Marketing, Financial Services & Management Research, 2(5), 141-150.