Interrelationship between-dollar-gold-oil (animation-filled)
THE INTERRELATIONSHIP BETWEEN FERROCHELATASE AND
PROTOPORPHYRINOGEN OXIDASE WITH PARTICULAR REFERENCE TO
PORPHYRIA VARIEGATA AND ERYTHROPOIETIC PROTOPORPHYRIA
Lydia Johanna Siepker
This thesis is submitted to the Faculty of Medicine, University of the Witwatersrand, Johannesburg for the Degree of Doctor of Philosophy.
Johannesburg June 1986
This is to certify that the thesis entitled
"THE INTERRELATIONSHIP BETWEEN FERROCHELATASE AND PROTOPORPHYRINOGEN OXIDASE WITH PARTICULAR REFERENCE TO PORPHYRIA VARIEGATA AND ERYTHROPOIETIC PROTOPORPHYRIA"
presented for the degree of Doctor of Philosophy at the University of the Witwatersrand, Johannesburg, is my own
work, and has not been presented at any other University.
LYDIA JOHANNA SIEPKER B.Sc. (Hons.). Stellenbosch.
June 1986.

2.
To my parents

ACKNOWLEDGEMENTS
I wish to express my sincere thanks to Dr. S. Kramer for initiating and supervising this thesis and for his encouragement and constant enthusiasm. I would like to thank Reenen de Kock for his invaluable advice and assistance in the purification of protoporphyrinogen oxidase, especially in the characterization of the chromophore, and his interest and constructive criticism for the rest of this thesis.
I am also much obliged to and wish to thank the following people
Professor J. Metz, Director of the South African Institute for Medical Research, Johannesburg, for providing the necessary facilities to carry out this research.
The financial assistance of the South African Medical Research Council and the South African Institute for Medical Research.
Stephen Lambert for his advice and assistance with the Elder mapping and SDS-PAGE techniques, and proof reading of the manuscript.
Mrs. A. Jenkinson for her hard work and extra time she devoted in typing this manuscript.
Mrs. L. Battaglia and her staff for their helpfullness and assistance in the library.
Max Joffe for his advice on the culturing and transformation of lymphocytes.
Mavis Ford for her assistance on immunological studies.
Mr. M. Anderson and his staff for the photographic work.
Mrs. A. Erasmus and J. Gallant for the graphics and illustrations.
To my husband Martin, for his encouragement, patience and moral support, while I devoted so much time to this thesis.
PUBLICATIONS
Siepker L. and Kramer S. Protoporphyrin accumulation by mitogen stimulated lymphocytes and protoporphyrinogen oxidase activity in patients with Porphyria Variegata and Erythropoietic Protoporphyria; evidence for deficiency of protoporphyrinogen oxidase and ferrochelatase in both diseases. British Journal of Haematology, 60, 65-74,1985.
Kramer S. and Siepker L. Recent advances in the porphyrias. South African Journal of Science, 81_, 347-349, 1985.
Siepker L., McCulloch J. and Kramer S. Protoporphyrinogen oxidase activity in seven families with Porphyria Variegata. South African Medical Journal, (in press).
Siepker L., Kramer S., de Kock R. Purification of bovine protoporphrinogen oxidase by FPLC; evidence for a flavin prosthetic group (submitted).
Siepker L., Ford M., de Kock R., Kramer S. Ferrochelatase and protoporphyrinogen oxidase have common epitopes and peptides (submitted).
IV
ABSTRACT
This thesis was undertaken to determine if there is any interrelationship between the two terminal enzymes of the haem bio
synthetic pathway, protoporphyrinogen oxidase (PPO) and ferrochelatase,
with particular reference to porphyria variegata (PV) and erythropoietic protoporphyria (EPP)• It has previously been found that both enzymes were deficient in PV and EPP, there being a qualitative
difference in so far as ferrochelatase deficiency is concerned.
Protoporphyrinogen oxidase (PPO) activity was measured in both EPP
and PV patients and in the offspring of PV patients. In the same subjects, protoporphyrin formation by mitogen stimulated lymphocytes
with 6-amino-laevulinic acid as substrate and in the presence of an
iron chelator or iron, provided an indirect measurement for ferro
chelatase. The results provided strong evidence that PPO and
ferrochelatase were both defective in both diseases. Furthermore,
the studies in the offspring of PV subjects showed normal ferrochelatase
activity which would suggest that ferrochelatase deficiency is only
manifested after puberty. Detailed studies in PV families suggested
that reduced PPO activity may be a marker for carriers who evolve
into PV patients in adulthood. Ferrochelatase was purified according
to a method previously described. PPO was purified by anion exchange
chromatography using a Pharmacia FPLC apparatus. A chromophore was
found to be associated with PPO and preliminary studies suggested that it was FAD. Antibodies raised against ferrochelatase and PPO
showed marked cross reactivity against the other enzyme and peptide
maps for each enzyme showed marked structural similarities between
them. In addition to clinical evidence interrelating PPO and
ferrochelatase, these studies provided evidence for structural
homology between them.
CONTENTSv
INTRODUCTION ............................................ 1
CHAPTER 1 MEASUREMENT OF PPO AND FERROCHELATASEACTIVITY IN HUMAN LYMPHOCYTES ............. 23
Materials and Methods
1. Preparation of lymphocytes and cellculture.................................... 24
2. Incubation of stimulated lymphocyteswith ALA............. 29
2.1 Preparation of CaMgEDTA.................... 30
2.2 Measurement of protoporphyrin formation.... 31
3. Protein determination...................... 31
4. Measurement of protoporphyrinogenoxidase activity........................... 37
4.1 Preparation of protoporphyrinogen.......... 38
4.2 Assay of protoporphyrinogen oxidaseactivity................................... 39
Results
A. Ferrochelatase activity.......................... 32
B. Protoporphyrinogen oxidase acticity.............. 40
Discussion
CHAPTER 2 PROTOPORPHYRINOGEN OXIDASE ACTIVITY IN SEVENFAMILIES WITH PORPHYRIA VARIEGATA.......... 5Q
Materials and Methods...................... 52
Results.......................................... 52
Page
Discussion 57
viPage
CHAPTER 3 PURIFICATION OF FERROCHELATASE ............ 61
Introduction.............................. 62
Materials and Methods
1. Purification of ferrochelatase............ 67
2. Protein determination..................... 71
3. Ferrochelatase activity assay............. 73
4. Gel electrophoresis....................... 755. Determination of molecular weight......... 78
6. Preparation of antibodies to ferrochelatase. 79
7. Preparation of immunoglobulin G............ 80
8. Enzyme linked immunosorbent assay......... 81
Results and discussion
A. Purification of bovine liver ferrochelatase..... 83
B. ELISA results......................... 86
CHAPTER 4 PURIFICATION OF PROTOPORPHYRINOGEN OXIDASE 90
Introduction..................... 91
Materials and Methods
1. Purification of protoporphyrinogen oxidase. 962. Protein determination............ 99
3. Protoporphyrinogen oxidase assay. gg
4. Gel electrophoresis............. 10o
5. Determination of molecular weight. iqo
6. Preparation of antibodies to protoporphyrinogen igioxidase...................................
7. Affinity purification of anti-PPO IgG..... 102
V l l
Page
7A. Coupling of PPO........................7B. Purification of IgG.................... 1038. Studies on the chromophore............. 103
8A. Determination of fluorescence.......... 103
8A.1 Fluorescence of the chromophore duringthe enzyme reaction.................... 103
8A.2 Enzymatic digestion.................... 104
8A.3 Acid hydrolysis........................ 1058B. Purification of the chromophore and
determination of absorption....... . 105
Results
A. Purification of PPO.................... 106
B. Molecular weight....................... 109
C. Kinetic properties..................... 109
D. Effects of various compounds onenzyme activity........................ 109
E. ELISA results.......................... 113F. Characteristics of the chromophore..... 115
FI. Fluorescence spectra of the bound andreleased chromophore................... 115
F2. Fluorescence of the chromophore duringthe enzyme reaction............ *....... 115
F3. Absorption spectra...................... 117
G. Identification and quantification ofthe flavin............................. 119
Discussion................................... 121
Hypothesis................................... 124
viiiPage
CHAPTER 5 COMPARISON OF PROTOPORPHYRINOGENOXIDASE AND FERROCHELATASE............... 128
Materials and Methods
A. Immunological studies..................... 129
B. Two dimensional peptide analysis.......... 130
Results
A. ELISA results............................. 133
B. Two dimensional peptide analysis.......... 135
Discussion................................ 137
Conclusion.............................................. 138
References 144
IX
LIST OF TABLES
Page
CHAPTER 1
Table 1 Stool porphyrins in propositi...... 25
Table 2 Protoporphyrinogen oxidase activityin lymphocytes..................... 46
CHAPTER 2
Table 1 Composite table of 7 PV families... 60
CHAPTER 3
Table 1 Purification of bovineferrochelatase.................... 84
Table 2 Effect of antigen concentrationof antibody reaction.............. 88
Table 3 Effect of anti-serum dilution and IgG concentrations on antibody reaction.......................... 89
CHAPTER 4
Table 1 Purification of bovine protoporphyrinogen oxidase............. 107
Table 2 Effect of IgG concentration onantibody reaction................. 114
CHAPTER 5Table 1 Cross reaction of anti-ferrochelatase
IgG and anti-PPO IgG.............. 133,134
X
LIST OF FIGURESPage
INTRODUCTION
Fig. 1 The haem biosynthetic pathway ........ 2Fig 2 Enzymic changes in the porphyrias..... 6
Fig 3 Conversion of protoporphyrinogento haem............................... 18
CHAPTER 1
Fig 1 Flow diagram.......................... 26
Fig 2 Protoporphyrin formation bystimulated lymphocytes incubatedwith ALA over time.................... 33
Fig 3 Effect of ALA on protoporphyrin IXformation............................. 34
Fig 4 Effect of CaMgEDTA on protoporphyrin IX formation................ 34
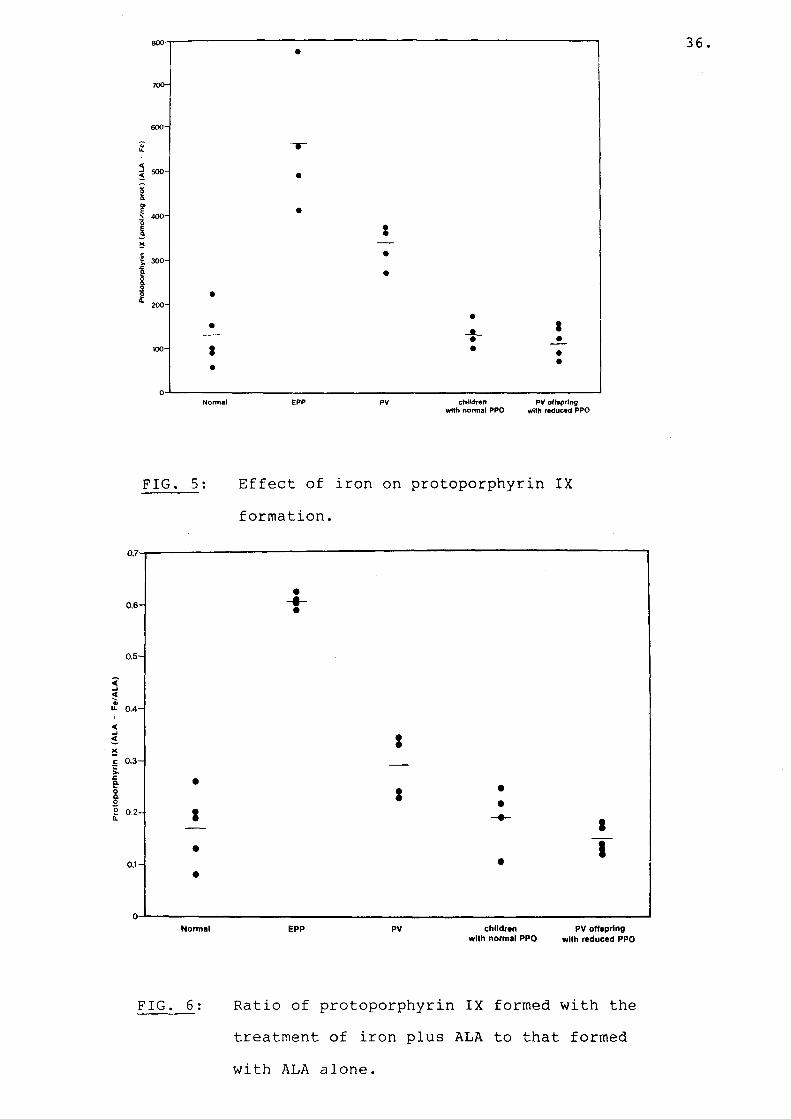
Fig 5 Effect of iron on proporphyrin IXformation. *........................... 36
Fig 6 Ratio of protoporphyrin IX formedwith the treatment of iron plus ALAto that formed with ALA alone......... 36
Fig 7 Effect of substrate concentrationon protoporphyrin formation........... 41
Fig 8 PPO activity over time................ 43
Fig 9 Effect of protein concentration onprotoporphyrin formation.............. 45
CHAPTER 3
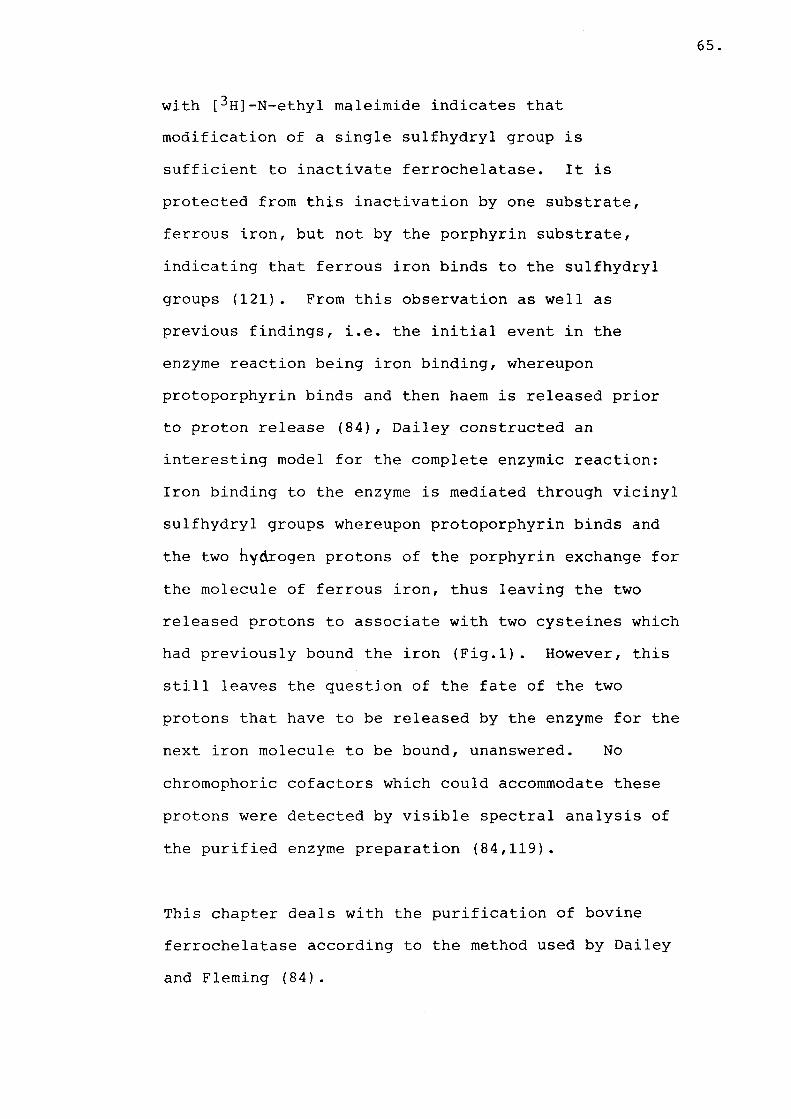
Fig 1 Model for the active site offerrochelatase and the role ofsulfhydryl groups.................... 66
Fig 2 The differential centrifugation procedure to obtain livermi tochondr ia......................... 69
Page
Fig 3 SDS-PAGE of bovine ferrochelatase.... 85Fig 4 Molecular weight determination of
ferrochelatase...................... 87
CHAPTER 4
Fig 1 Structure of FAD.................... 95
Fig 2 Elution profile of a PPO preparationfrom the anion exchange column..... 98
Fig 3 SDS-PAGE of bovine protoporphyrinogenoxidase................................ 108
Fig 4 Molecular weight determination ofPPO by SDS-PAGE........................ 110
Fig 5 Molecular weight determination ofPPO by gel filtration chromatography. Ill
Fig 5 Effect of substrate concentrationon PPO activity..................... 112
Fig 7 Fluorescence excitation and emissionspectra of trypsin treated PPO....... 116
Fig 8 Absorption spectra of PPO............ 118
Fig 9 Absorption spectra of the partiallypurified chromophore................. 120
Fig 10 Formation of haem by protoporphyrinogenoxidase and ferrochelatase........... 125
CHAPTER 5
Fig 1 Ferrochelatase and PPO have verysimilar peptide maps................. 136
ABBREVIATIONS
Ci curiecm centimetre
EDTA disodium ethylenediaminetetraacetate
g • gram
M molar
mA millampere
mCi millicurie
ml millilitre
mg milligram
mM millimolar
^uCi microcurie
/ug microgram
,uM micromolarN-terminal aminoterminal
pM picomolar
Tris Tris(hydroxymethyl) aminomethane
U unit
V volume
W weight
INTRODUCTION
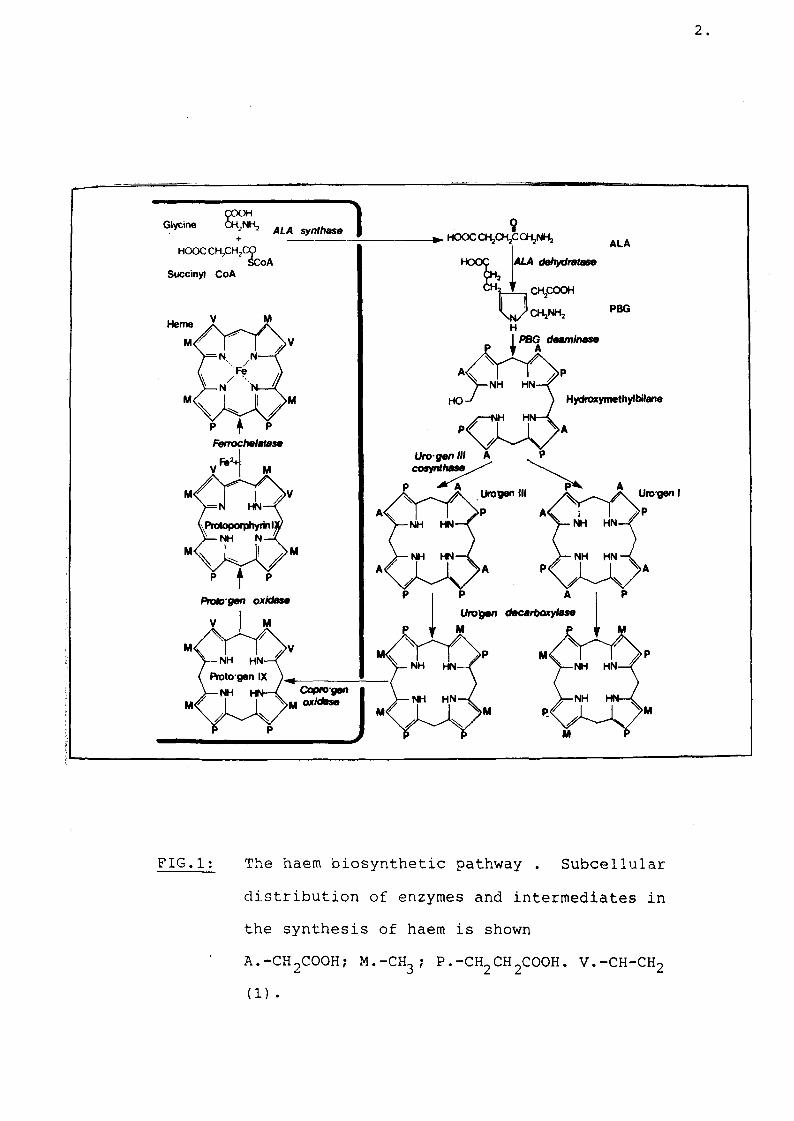
In any study of the human porphyrias it is essential to begin with a review of the haem biosynthetic pathway (Fig 1). The enzyme ALA-synthetase (ALA-synthase) combines glycine and succinyl CoA to form the first precursor, delta-aminolaevulinic acid (ALA). Porphobilinogen (PBG) is formed from two molecules of ALA by the enzyme ALA dehydrase. Two enzymes, uroporphyrinogen-I-synthetase (porphobilinogen deaminase) and uroporphyrinogen cosynthase are required for condensation of four molecules of porphobilinogen for the formation of uroporphyrinogen. Uroporphyrinogen-cosynthase ensures that uroporphyrinogen type III isomer and not type I is produced. It is from the type III isomer that protoporphyrin IX is formed into which iron is inserted for the formation of haem. Uroporphyrinogen is an 8-carboxymolecule which is progressively decarboxilated by the enzyme urodecarboxylase to coproporphyrinogen, a 4-carboxy group. Coproporphyrinogen is further decarboxylated by coproporphyrinogen oxidase to form protoporphyrinogen; the latter is oxidised by protoporphyrinogen oxidase to protoporphyrin. Finally iron is inserted into protoporphyrin by ferrochelatase to form haem (1). ALA-synthetase is a mitochondrial enzyme but is not membrane bound (1). On the other hand the terminal three enzymes coproporphyrinogen oxidase,
2
FIG.1; The haem biosynthetic pathway . Subcellular distribution of enzymes and intermediates in the synthesis of haem is shown
' A.-CH2COOH; M.-CH3 ; P.-CH2CH2COOH. V.-CH-CH2(1)
protoporphyrinogen oxidase and ferrochelatase are associated with or bound to the inner mitochondrial membrane (2,3). The rest of the enzymes in the haem biosynthetic pathway are in the cytosol (1). Biosynthesis of haem in the liver is controlled largely by the rate of production of ALA-synthetase (4). While the activity of ALA-synthetase is low and rate-limiting in the liver, activity of the other enzymes are in excess.
About 65 percent of haem produced in the liver isutilized for the formation of microsomal P450, about15 percent for the synthesis of catalase in theperoxisomes, 6 percent for the formation ofmitochondrial cytochromes and 8 percent for theformation of cytochrome b5 (5). A negative feedbackcontrol by haem at the level of ALA-synthetase existsin the liver. ALA-synthetase activity is stimulatedin the presence of xenobiotics and natural steroids(7-10) and ALA synthetase activity is suppressed by
7hemm (6, 11-14) at concentrations as low as 10- M.
Porphyrins produced in the haem biosynthetic pathway are cyclic tetrapyrroles that display a distinctive absorption spectrum (15). The absorption spectrum consists of a major absorption band in the 400 nm region, called the Soret band, and four smaller absorption bands at longer wavelengths between 500 and 630 nm (16). Metal free porphyrins omit an intense
4 .
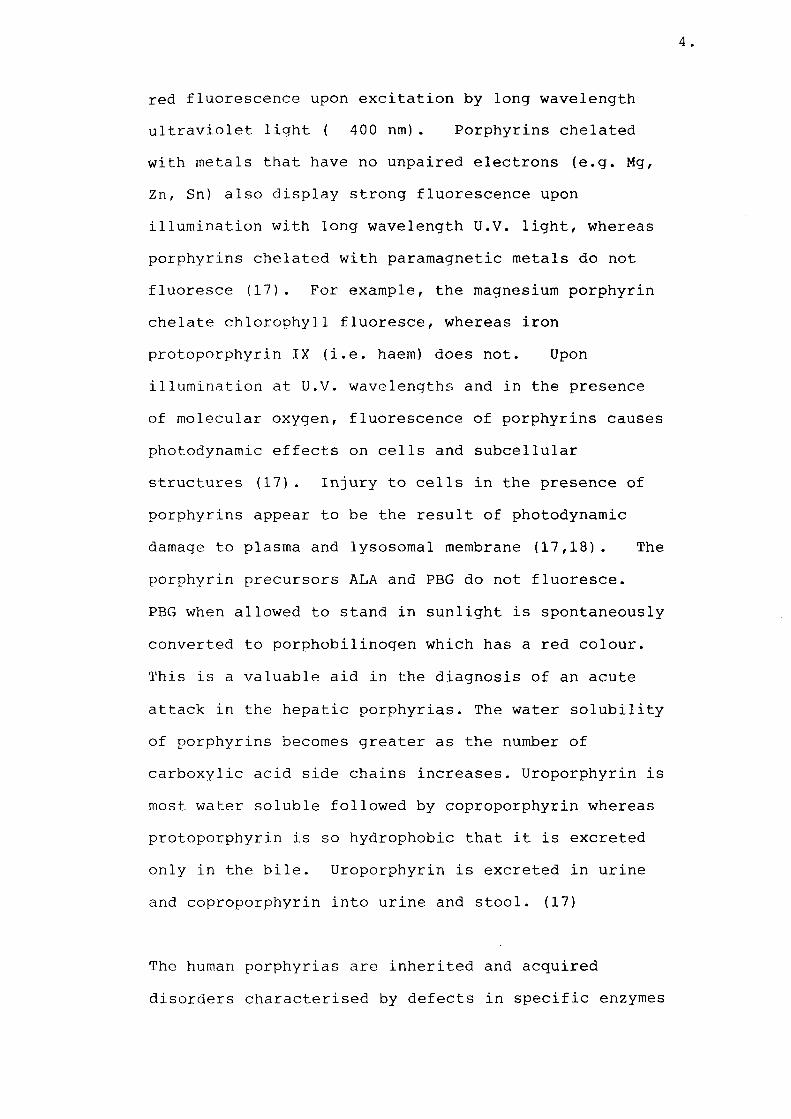
red fluorescence upon excitation by long wavelength ultraviolet light ( 400 nm). Porphyrins chelatedwith metals that have no unpaired electrons (e.g. Mg, Zn, Sn) also display strong fluorescence upon illumination with long wavelength U.V. light, whereas porphyrins chelated with paramagnetic metals do not fluoresce (17). For example, the magnesium porphyrin chelate chlorophyll fluoresce, whereas iron protoporphyrin IX (i.e. haem) does not. Upon illumination at U.V. wavelengths and in the presence of molecular oxygen, fluorescence of porphyrins causes photodynamic effects on cells and subcellular structures (17). Injury to cells in the presence of porphyrins appear to be the result of photodynamic damage to plasma and lysosomal membrane (17,18). The porphyrin precursors ALA and PBG do not fluoresce.PBG when allowed to stand in sunlight is spontaneously converted to porphobilinogen which has a red colour. This is a valuable aid in the diagnosis of an acute attack in the hepatic porphyrias. The water solubility of porphyrins becomes greater as the number of carboxylic acid side chains increases. Uroporphyrin is most water soluble followed by coproporphyrin whereas protoporphyrin is so hydrophobic that it is excreted only in the bile. Uroporphyrin is excreted in urine and coproporphyrin into urine and stool. (17)
The human porphyrias are inherited and acquired disorders characterised by defects in specific enzymes
5.
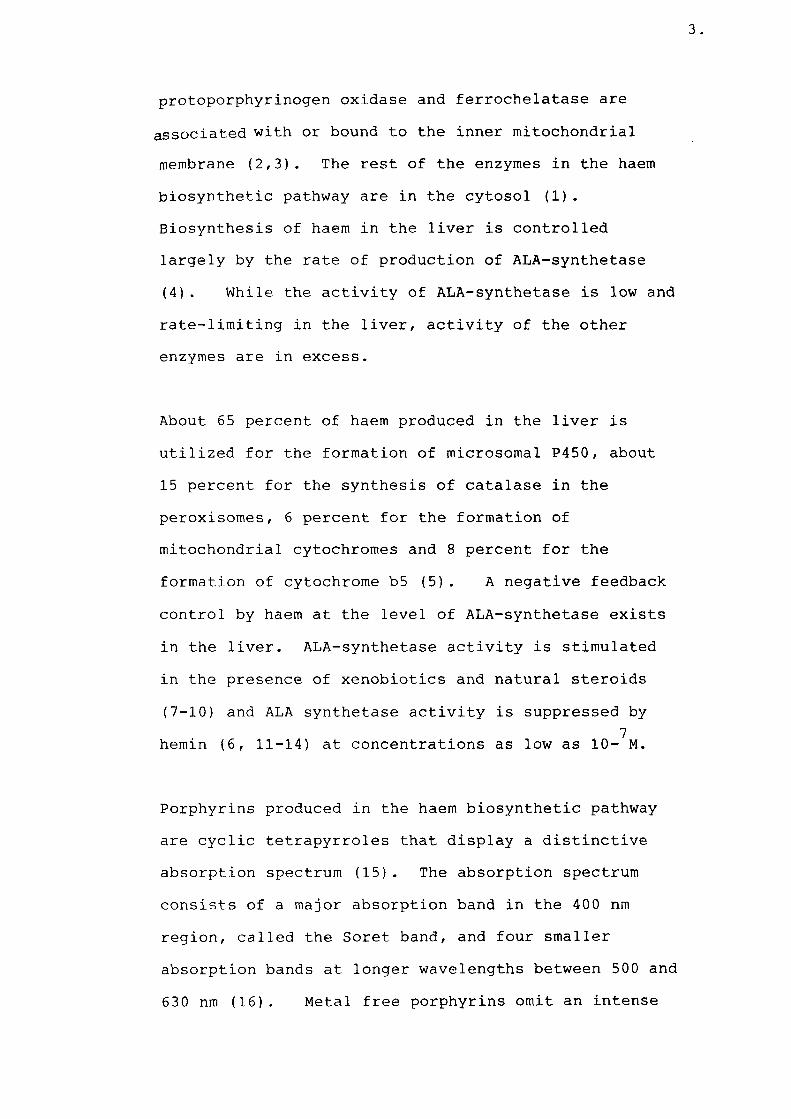
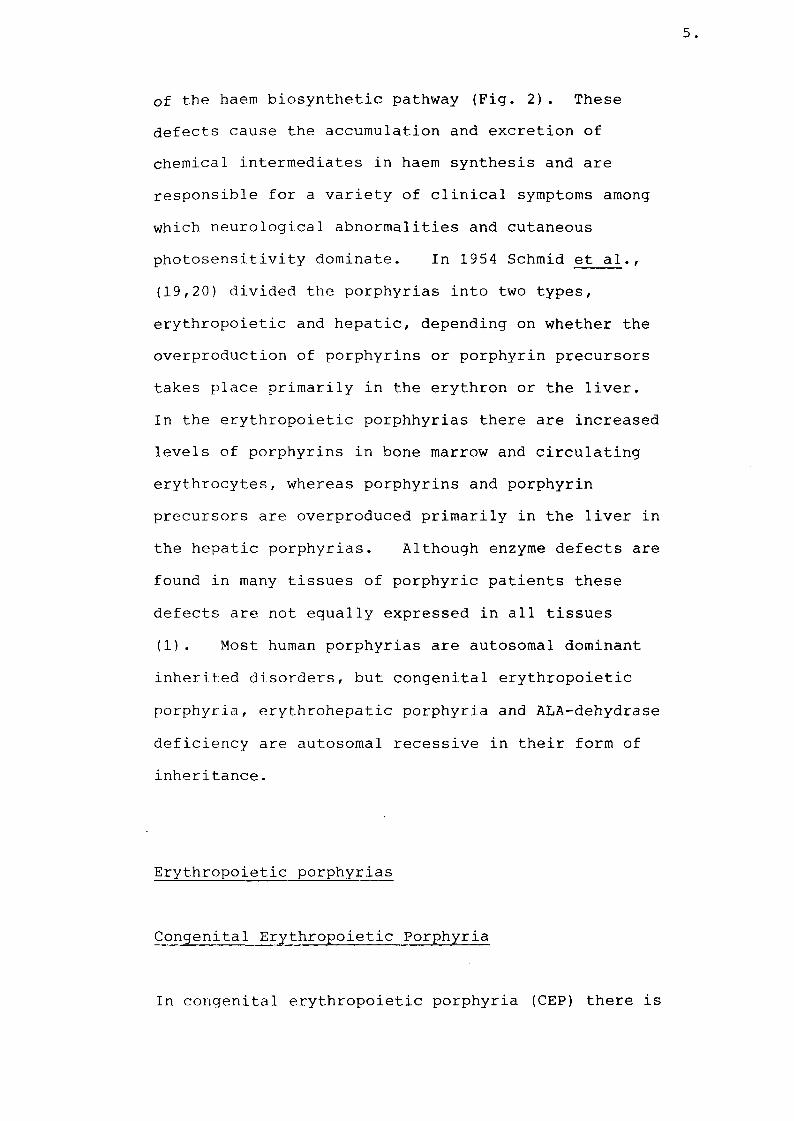
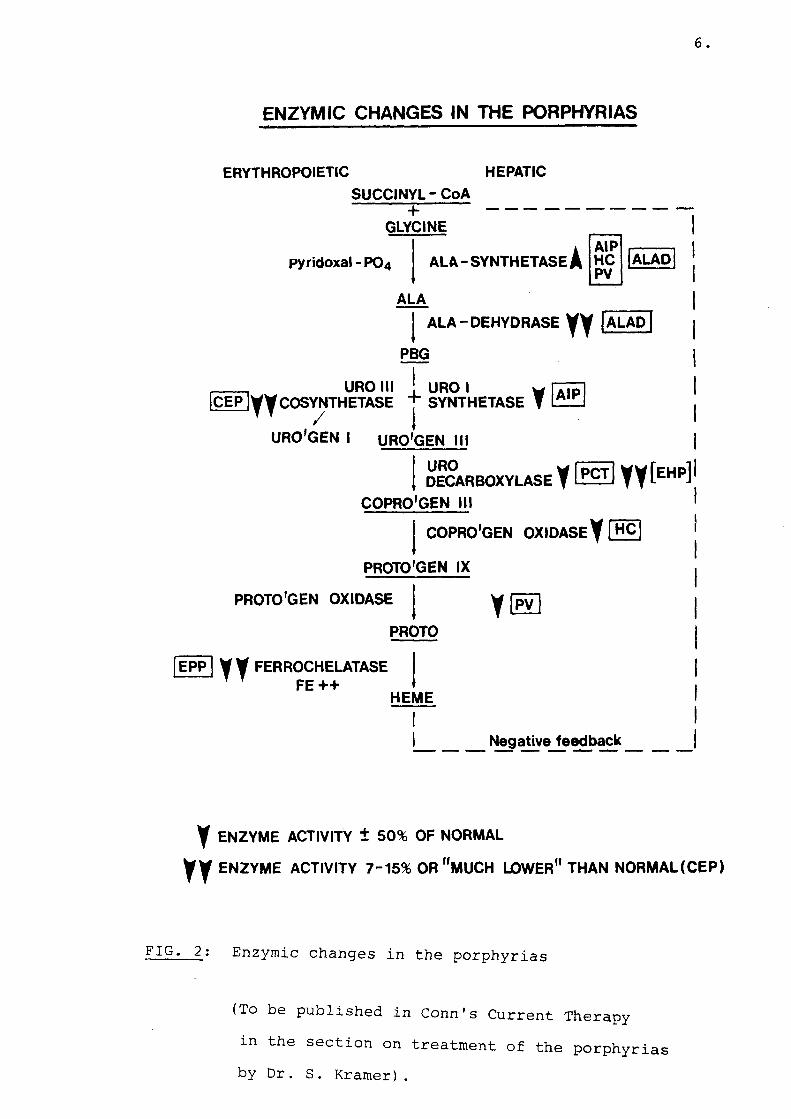
of the haem biosynthetic pathway (Fig. 2). These defects cause the accumulation and excretion of chemical intermediates in haem synthesis and are responsible for a variety of clinical symptoms among which neurological abnormalities and cutaneous photosensitivity dominate. In 1954 Schmid et al., (19,20) divided the porphyrias into two types, erythropoietic and hepatic, depending on whether the overproduction of porphyrins or porphyrin precursors takes place primarily in the erythron or the liver.In the erythropoietic porphhyrias there are increased levels of porphyrins in bone marrow and circulating erythrocytes, whereas porphyrins and porphyrin precursors are overproduced primarily in the liver in the hepatic porphyrias. Although enzyme defects are found in many tissues of porphyric patients these defects are not equally expressed in all tissues (1). Most human porphyrias are autosomal dominant inherited disorders, but congenital erythropoietic porphyria, erythrohepatic porphyria and ALA-dehydrase deficiency are autosomal recessive in their form of inheritance.
Erythropoietic porphyrias
Congenital Erythropoietic Porphyria
In congenital erythropoietic porphyria (CEP) there is
6.
ENZYMIC CHANGES IN THE PORPHYRIAS
ERYTHROPOIETIC HEPATICSUCCINYL - CoA
+GLYCINE
pyridoxal - PO4 ALA-SYNTHETASE]AIPHCPV
ALAD
ALA
ALA-DEHYDRASE VV 1ALAD
PBG
,____ _ URO IIIIC E P jy y COSYNTHETASE
URO ISYNTHETASE y [aipj
URO'GEN I URO'GEN III
URO DEC/
COPRO'GEN IIIDECARBOXYLASE f LE£l] Y Y fEHPl
PROTO'GEN OXIDASE
COPRO'GEN OXIDASE Y [H C ]
PROTO'GEN IX
PROTO
EPP | y y FERROCHELATASE T T FE ++
HEME
Negative feedback
y ENZYME ACTIVITY ± 50% OF NORMAL
y y ENZYME ACTIVITY 7-15% OR "MUCH LOWER" THAN NORMAL (CEP)
FIG. 2: Enzymic changes in the porphyrias
(To be published in Conn's Current Therapy m the section on treatment of the porphyrias by Dr. S. Kramer).
7.
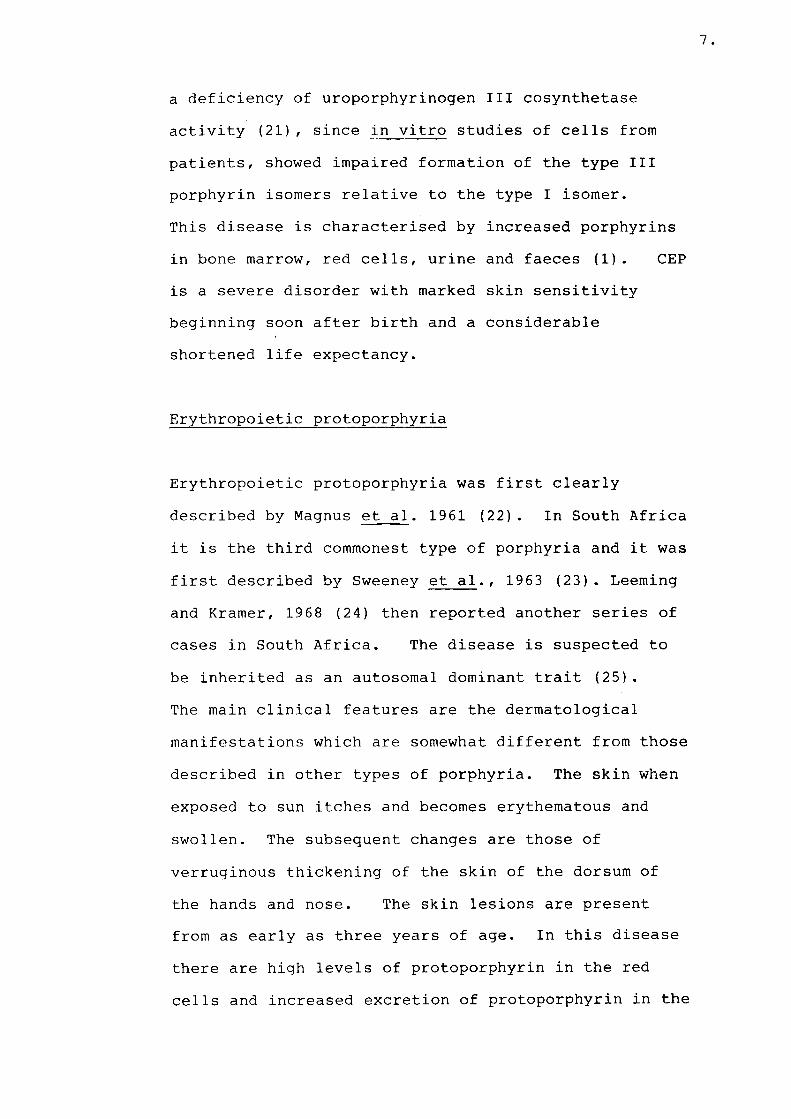
a deficiency of uroporphyrinogen III cosynthetase activity (21), since in vitro studies of cells from patients, showed impaired formation of the type III porphyrin isomers relative to the type I isomer.This disease is characterised by increased porphyrins in bone marrow, red cells, urine and faeces (1). CEP is a severe disorder with marked skin sensitivity beginning soon after birth and a considerable shortened life expectancy.
Erythropoietic protoporphyria
Erythropoietic protoporphyria was first clearly described by Magnus et al. 1961 (22) . In South Africa it is the third commonest type of porphyria and it was first described by Sweeney et al., 1963 (23). Leeming and Kramer, 1968 (24) then reported another series of cases in South Africa. The disease is suspected to be inherited as an autosomal dominant trait (25).The main clinical features are the dermatological manifestations which are somewhat different from those described in other types of porphyria. The skin when exposed to sun itches and becomes erythematous and swollen. The subsequent changes are those of verruginous thickening of the skin of the dorsum of the hands and nose. The skin lesions are present from as early as three years of age. In this disease there are high levels of protoporphyrin in the red cells and increased excretion of protoporphyrin in the
8.
stool in some cases. The dermatological manifestations are not the only features of the disease.Hepatic changes with portal fibrosis and intrahepatic deposits of pigment have been described in a number of cases who died in hepatic failure.
Assays of ferrochelatase activity in bone marrow reticulocytes (27,28),1iver, cultured fibroblast (29) and buffy coat lysates (28,30,31) showed that this enzyme is deficient in EPP. In this disease protoporphyrin starts to accumulate in bone marrow normoblasts just before the nucleus is extruded and continues through the reticulocyte stage until mitochondria are lost from the cell (1). In circulating erythrocytes protoporphyrin content decreases with red cell ageing which is not observed in other states in which red cell protoporphyrin is increased, such as iron deficiency and lead poisoning (32,33). This loss in protoporphyrin occurs because the excess protoporphyrin is free and not chelated with zinc as in lead poisoning and iron deficiency.In the latter disorders which are not associated with photosensitivity, zinc protoporphyrin is bound to haemoglobin and remains in the erythrocyte for as long as it circulates. Free protoporphyrin however is less easily bound to haemoglobin within the red cell and diffuses more easily into plasma (33,34).
9 .
Although ferrochelatase might be deficient in all body tissues in EPP patients, it seems as though bone marrow reticulocytes are the major source of excess protoporphyrin (35) . The hepatic disease may well be due to protoporphyrin deposition. Functional ferrochelatase deficiency has been demonstrated in cultured skin fibroblasts (36) and mitogen stimulated lymphocytes of EPP by incubating these cells with ALA and measuring protoporphyrin accumulation (37) . In cells from EPP patients protoporphyrin accumulation from ALA was greater than in normal cells and the responses to added iron (36,38) or CaMgEdta (an iron chelator) were smaller than in normal cells (37).These results indicated that ferrochelatase activity in EPP was approximately one half of normal, which is the level that might be expected for an autosomal dominant enzyme deficiency. When ferrochelatase activity was measured directly in various tissue lysates of EPP patients, activity of 10 - 25 percent of normal was reported (27,29,30,31,39). This might be due to technical difficulties in measuring the mitochondrial enzyme in tissues with low enzyme activity. The indirect measurement therefore reflects more accurately the functional activity of ferrochelatase.
Hepatic porphyrias
Acute attacks occur in four of the hepatic porphyrias;
10.
acute intermittent porphyria (AIP), porphyria variegata (PV), hereditary coproporphyria (HCP) and ALA dehydrase deficiency. These attacks are probably due to excess production of ALA by the rate limiting enzyme ALA synthetase, when it is activated by factors like barbiturates or steroids. ALA is an analogue of gamma amino butyric acid (GABA), the most potent neuro inhibitor of the brain (40,41). ALA has agonistic properties, it impairs the re-uptake of GABA into presynaptosomes (42) stimulates the action of GABA and inhibits the (Na + K)+ dependant ATPase enzyme which is vital for nerve condition (40,41). In an acute attack, visceral autonomic neuropathy and peripheral neuropathy that can progress to total paralysis are' especially prominent. An experimental model has been produced which suggests another way in which acute attacks may develop in the porphyrias. Haem depletion can be induced in porphyric rats with reduction in tryptophane pyrrolase activity (a haem dependant enzyme). This will elevate tryptophane and 5HT* turnover in the brain and these two compounds may bring about some of the neurological disturbances found in acute attacks (43).
Acute intermittent porphyria
Generally porphobilinogen deaminase is 50% of normal in red cells, liver and fibroblasts of patients that suffer from acute intermittent porphyria (AIP)
* 5-hydroxy-tryptamine
(44,45,46). The disease in the quiescent phase is generally associated with increased excretion of ALA and PBG in the urine. There are no increased porphyrins, hence no dermatological manifestations.The enzyme deficiency is presumably associated with a decrease in the rate of haem synthesis with de-repression of ALA synthetase and the risk of acute attacks.
There are cases described with AIP who had normal red cell PBG deaminase levels, although they had increased excretion of PBG and ALA in the urine (47). Four different types of PBG-deaminase mutations were also identified by immunological and enzymatic studies in erythrocytes of patients with AIP from 33 unrelated families in Finland. This provided evidence for the occurrence of genetic heterogeneity at the locus for PBG-deaminase (48,49).
Hereditary coproporphyria
Coproporphyrinogen oxidase is deficient in hereditary coproporphyria (50,51). It is a rare porphyria first described by Goldberg (52) . There is only one description of this disease in South Africa (53). Coproporphyrin is excreted in urine and stool and there are dermatological manifestations, albeit less severe than the other types of porphyria with dermatological manifestations. This enzyme
12.
deficiency is also associated with a decrease in the rate of haem synthesis, consequently increased ALA-synthetase activity is found and acute attacks may occur (54).
Porphyria cutanea tarda (PCT)
This disease is probably the most common type of porphyria seen in Europe and America and is also common in the South African black, white and coloured populations (55,56,57). The enzyme uroporphyrinogen decarboxylase is deficient in this disease (58,59) and it is autosomal dominantly inherited. Cutaneous photosensitivity is the major symptom, while uroporphyrin and 7-carboxylate porphyrin is present in the urine in large amounts, with some increase in porphyrins in the stool. Deficiency of the enzyme alone will not cause PCT since there is a need for a further insult i.e. alcohol, iron, oestrogens and drugs. A drug which has recently been found to induce PCT in familial enzyme deficiency is dioxin(60) . Another drug which induced an epidemic of PCT was hexachlorobenzene and in this situation the disease was acquired, known as the Turkish epidemic(61) .
The entity of hepato erythrohepatic porphyria is probably a homozygous deficiency of uroporphyrinogen decarboxylase. The condition manifests itself in
13.
childhood, is severe, autosomal recessively inherited and not drug induced (62).
Porphyria Variegata
Porphyria variegata (PV) is particularly common among South African whites and it is estimated that 3 out of every 1000 whites in this country have inherited the disease (63,64). Detailed investigations by Dean (63,64) indicated that most cases can be traced back to an early Dutch Cape settler - Gerrit Janse who married Ariaantje Jacobs in Cape Town in 1688. One of their four porphyric children (they had eight) married Cornells van Rooyen. There are now several hundred families with PV in S.A. especially of Afrikaans speaking origin and certain names are common among them: van Rooyen, van Deventer, Nel, van der Vyver, Becker and Lombard (64).
Porphyria variegata does not manifest itself clinically or biochemically before puberty.Cutaneous sensitivity occur in at least 80% of cases (65) and increased fragility of sun exposed areas of the skin is quite common. Cutaneous lesions are less common in patients living in Europe and Northern America than in S.A. (66). The dermatological manifestations are more common in males and acute attacks are more common in females, probably because of dieting, hormonal imbalance, menstruation and
14.
infection. They are also more likely to take pills, some of which may be potent inducers of an acute attack. Over the past decade with the identification of most porphyric families and factors known to precipitate acute attacks, the incidence of the latter has significantly decreased (67). The skin manifestations occur on the exposed part. The patient complains that the skin is easily abraded and this may be the only cutaneous manifestation. A striking feature are bullae which may become infected in which case scarring is inevitable. Pigmentation and hypertrichosis involving particularly the temple areas are very common (67). Large amounts of protoporphyrin and to a lesser extent coproporphyrin is present in the stool (68). There is also increased coproporphyrin and uroporphyrin in the urine. Day et al., suspected deficiency of uroporphyrinogen decarboxylase and coined the name Dual Porphyria (69). Abdominal pain and neuropathy are the same as in AIP. Acute attacks are mainly induced by drugs like barbiturates, sulphonamides and oral contraceptives when large amounts of ALA and PBG are excreted in urine. Coproporphyrin (mostly type III) is often increased as well, and excess uroporphyrin may form nonenzymatically from excess PBG (65) .
A fifty percent reduction of protoporphyrinogen oxidase activity has been found in PV (70, 71, 72).
However variable results have been reported for ferrochelatase activity in PV. Becker et al., (39) and Viljoen et al., (73) found reduced ferrochelataseactivity in bone marrow, fibroblasts and leucocytes in South African cases of PV, while normal activity was found in muscle tissue (74). On the other hand Brenner and Bloomer, (75) reported normal ferrochelatase activity in fibroblasts from PV patients while Deybach et al., (72) found 20%reduction in enzyme activity in peripheral lymphocytes in PV patients. When ALA is added to PV fibroblasts, protoporphyrinogen does not accumulate and protoporphyrin levels increase to the same degree as in normal cells, whereas in EPP protoporphyrin accumulation in fibroblasts (75) or mitogen stimulated lymphocytes with ALA incubation is about twice normal (37). Therefore ferrochelatase is clearly limiting for ALA metabolism to haem in fibroblasts from normal PV or EPP subjects, but a 50% loss of normal activity of protoporphyrinogen oxidase does not appear to limit ALA metabolism to protoporphyrin in these cells.This is similar to what has been observed with cultured cells from HCP patients with 50% of normal activity of coproporphyrinogen oxidase, i.e. there is no increased accumulation of protoporphyrin. This suggests that factors that induce ALA synthetase in the liver but not in other cells such as fibroblsts are important in the full expression of disordered porphyrin metabolism in PV (1). It is of interest
that even gross enzyme deficiencies along the haem biosynthetic pathway e.g. uroporphyrinogen decarboxylase deficiency in EHP,are not followed by lack of haem formation. The enzyme deficiency underlying AIP,PV and HCP is presumably associated with a decrease in the rate of haem synthesis and the consequent de-repression of ALA-synthetase. When there is an increase in the demand for haem, e.g. for the synthesis of the enzyme P450 to detoxify barbiturates and sulphonamides there is a further increase in ALA-synthetase activity with excessive formation and excretion of ALA and PBG.
In 1977 in an annotation in the British Journal of Haematology, it was suggested that each porphyria could be due to a single enzyme deficiency along the haem biosynthetic pathway (76). There is now however considerable evidence that in several of the porphyrias more than one enzyme may be deficient.The first example described was in AIP where a second enzyme defect, that of steroid 4-5 alpha reductase was found in some patients (77) . This defect is characterised by increased formation of 5 beta metabolites (potent inducers of ALA synthetase) from natural steroids, testosterone and 11-beta hydroxyandost-4-en 3,17 dione. In this way hormonal disturbances could induce an acute attack in AIP. Of greater interest has been the accumulating clinical and biochemical evidence that in PV there might be
17.
four enzyme deficiencies. In South African cases of PV there is evidence for deficiency of PPO (71), ferrochelatase (39), uroporphyrinogen decarboxylase (Dual Porphyria) (69), and evenuroporphyrinogen-I-synthetase (78). In this regard the report by Yamada et al., (79) is of great interest. A patient died in an acute attack. The porphyrin profile suggested that the patient had PV.At post-mortem, liver, marrow and sciatic nerve tissue were taken and several enzymes along the haem biosynthetic pathway studied. Both ferrochelatase and uro-l-synthetase were reduced by more that 50% in liver and bone marrow and uro-I-syhthetase was also reduced in sciatic nerve. In Chester Porphyria which appears to be similar to PV,PPO and uro-I-synthetase deficiency were described and ferrochelatase activity may also be decreased (80) . In South African cases of EPP, deficiency of PPO in addition to ferrochelatase has been reported (71). The fact that both PPO and ferrochelatase might be deficient in EPP and PV is not altogether surprising, since these two enzymes, responsible for the last two steps in the haem biosynthetic pathway, have a similar action and are both situated in the inner mitochondrial membrane.PPO removes six hydrogens from the porphyrin ring,while ferrocheltase removes two protons and inserts iron into the ring for the formation of heam (Fig. 3). While deficiency in both these enzymes were described in South African cases of PV and EPP a
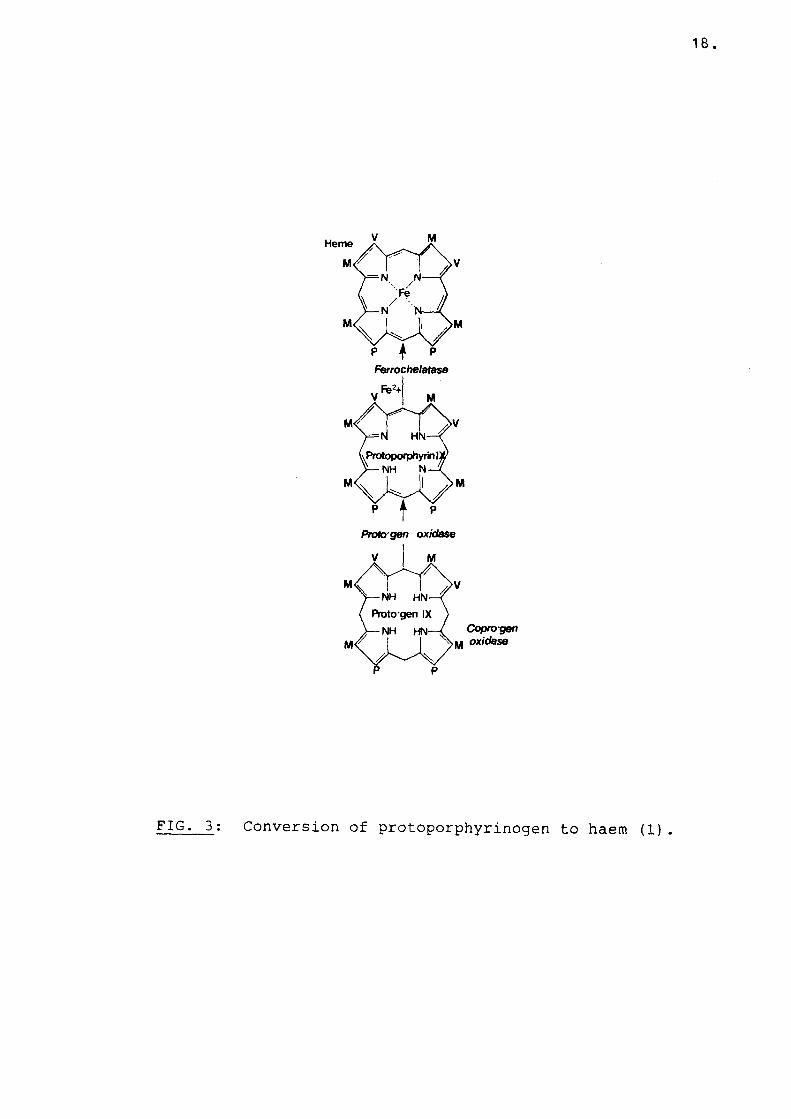
18.
FIG. 3: Conversion of protoporphyrinogen to haem (1).
19.
different pattern emerged between the decrease in ferrochelatase in these two diseases. Becker and Viljoen et a_l. (39) found a 50% reduction in ferrochelatase activity in sonicated normoblasts and fibroblasts of PV patients, whilst in marrow lysates of EPP patients ferrochelatase activity was 15% of normal. Viljoen et al., (71) reported a 50% decreasein ferrochelatase in leucocytes of PV patients when activity was measured with ferrous sulphate and protoporphyrin as substrate in the presence of ascorbic acid. However a 65% increase in enzyme activity was reported when ferric chloride and protoporphyrin was used as substrates (in the presence of reduced glutathione). These findings indicated a structural change in ferrochelatase from PV patients which might be the result of a dominantly inherited structural gene mutation. It was suggested that a quantitative reduction of ferrochelatase activity is present in PV. When erythroid ferrochelatase activity was measured at different pH and temperature values in EPP and PV patients the the pH activity curves were similar. However in PV patients and normal subjects the plots of ferrochelatase activity vs temperature were monophasic but in EPP they were truncated. In addition zinc did not form a zinc protoporphyrin complex in fibroblasts from EPP patients (81). These results indicated that in EPP the genetic mutation results in a variant or unstable ferrochelatase. These different ferrochelatase
20.
patterns in EPP and PV could explain the different clinical expression for these diseases.
If both enzymes are deficient in PV and EPP, then there is likely to be common subunits or polipeptides between them. This thesis was undertaken to (A) confirm that these two enzymes are indeed deficient in EPP and PV and (B) to purify both enzymes and to establish structural and immunological similarities between them.
A. Since ferrochelatase activity in fibroblasts and most other cultured cells is markedly lower than in liver and erythroid precursor cells (27,29) it is extremely difficult to assay ferrochelatase activity in isolated mitochondrial fractions from non-hepatic or non-erythroid cells, the results are difficult to reproduce with a wide standard error of the mean for controls and it has already been applied to PV and EPP cases (71) . However protoporphyrin IX accumulation in cultured lymphocytes after a three day pre-incubation with mitogens was 10-15 fold greater than in cells from the same subjects that were not incubated with mitogens (90) . These lymphocytes undergo transformation and metabolic activation after treatment with the mitogens pokeweed mitogen (PWM) or phytohaemagglutinin (PHA). Significant ferrochelatase deficiency can be shown indirectly by incubating mitogen stimulated lymphocytes with ALA and
determination of protoporphyrin IX synthesised. With decreased ferrochelatase activity as in EPP there is increased protoporphyrin formation as compared to controls (37). It is proposed to measure ferrochelatase activity in mitogen stimulated lymphocytes from PV patients and their offspring, EPP patients and normal subjects, using the indirect method (37,90). Furthermore, protoporphyrinogen oxidase activity will be measured fluorometrically as described by Brenner and Bloomer (82) in untreated lymphocytes from these subjects. PPO activity has not been measured in prepubertal children before and has only been measured in two EPP patients (71).
B. While the early, soluble enzymes in the haem biosynthetic pathway have now been studied and characterised in several systems (83), the terminal membrane bound enzymes protoporphyrinogen oxidase and ferrochelatase have been proven difficult to isolate and purify partly due to the membrane bound nature of these proteins. In fact mammalian ferrochelatase have only recently been purified to homogeneity (84,85) while PPO has only been partially purified from rat liver mitochondria (86) . In order to test the hypothesis that there might be structural similarities between PPO and ferrochelatase it is proposed to isolate and study both enzymes as follows:
22.
Ferrochelatase will be purified from bovine liver mitochondria by the method of Dailey et al., (84) and PPO will be purified from the same source using the same basic method and anion exchange chromatography using a high pressure liquid chromatography apparatus as additional purification step. The purity of the enzyme will be determined and enzyme kinetics done to characterise the enzyme. Monospecific antibodies to both of the enzymes will be raised in rabbits and the immunological cross-reactivity between ferrochelatase and PPO will be tested using the ELISA technique (87). Thereafter tryptic peptide analysis of the two enzymes will be done by two dimensional chromatography according to the method of Elder et al., (88).
CHAPTER 1
MEASUREMENT OF PPO AND FERROCHELATASE
ACTIVITY IN HUMAN LYMPHOCYTES
CHAPTER 1
In the present chapter PPO activity in lymphocytes, and protoporphyrin formation by mitogen stimulated lymphocytes (incubated with ALA) in the presence of CaMgEDTA or iron was measured in EPP and PV patients and their offspring. The results suggest deficiency of both PPO and ferrochelatase in these diseases.
MATERIALS AND METHODS
Blood was obtained from 18 adult volunteers, 6 patients with EPP and 12 with PV. Fifteen children (mean age 6) from seven PV families were studied. Informed consent was obtained from every individual or their parents. The porphyrin profile of these cases are illustrated in Table 1.
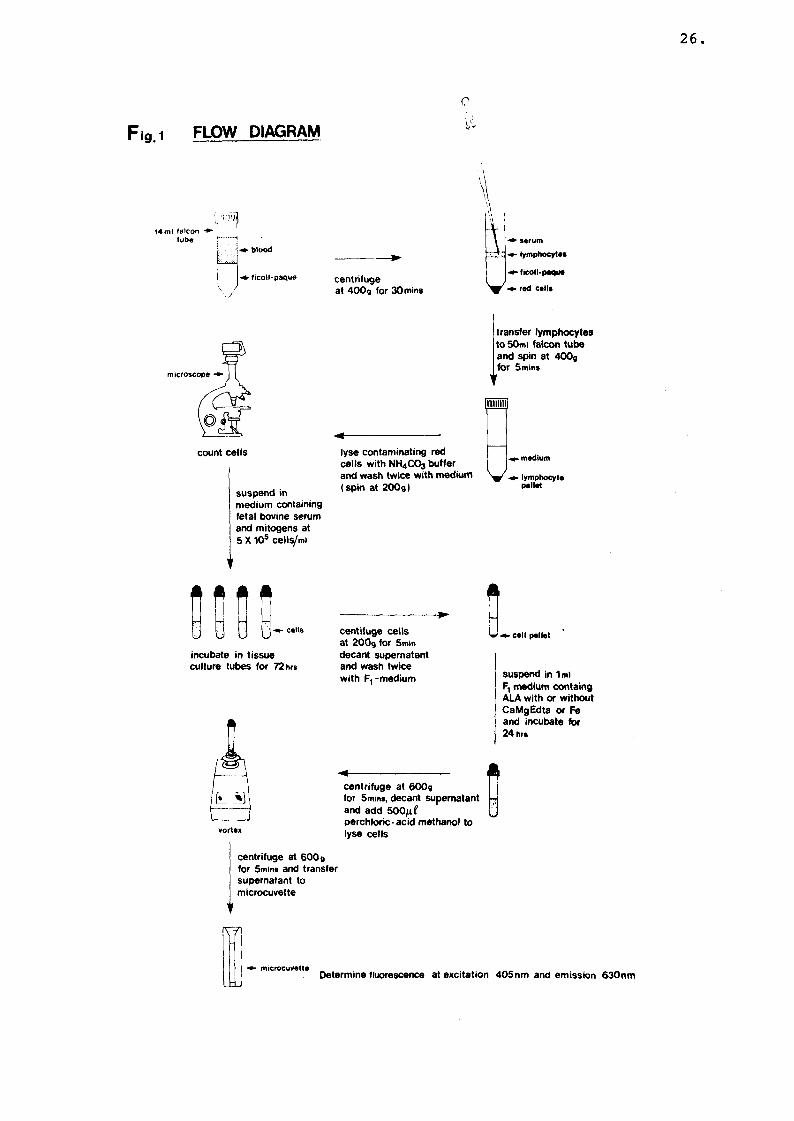
1. Preparation of lymphocytes and cell culture
The method as described by Sassa et al., (37,90)is illustrated by the flow diagram (Fig. 1) and was used as follows: All preparations were performed under sterile conditions. 25 ml of venous blood was withdrawn from adults and 8 ml from children and immediately heparanized with 10 units of heparin solution (Glaxo (Pty.), Ltd. S.A.) per ml of blood.
25
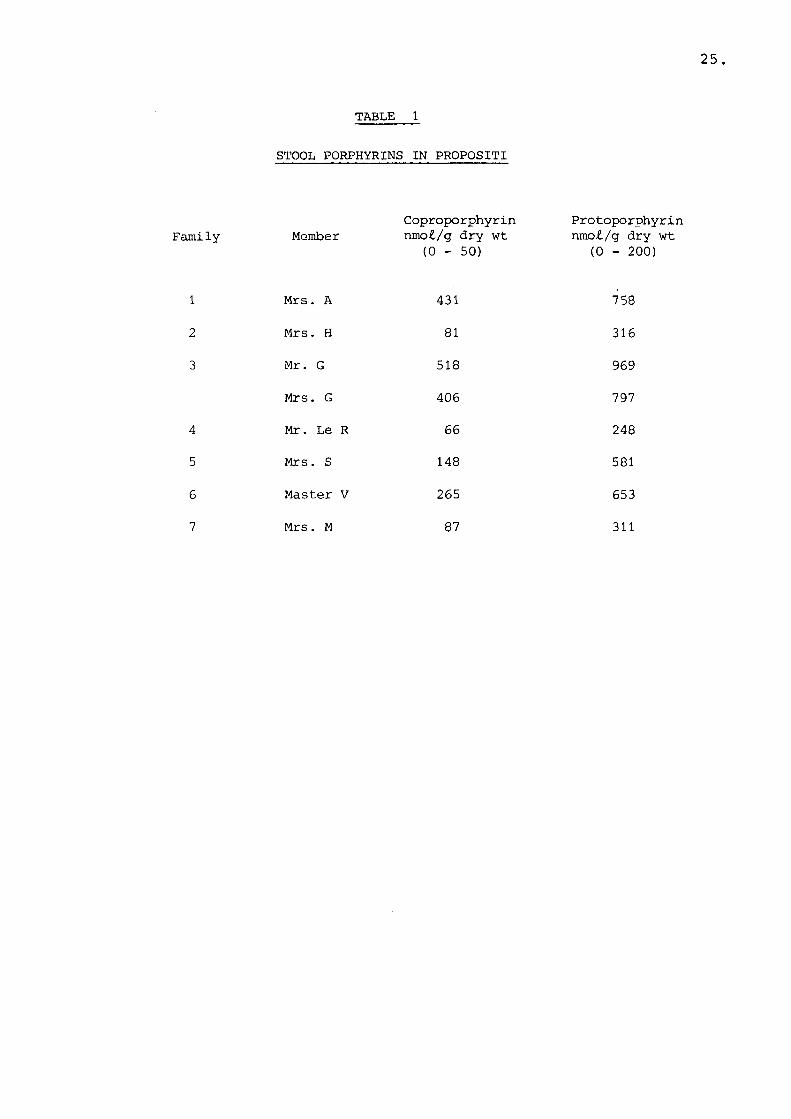
TABLE 1
STOOL PORPHYRINS IN PROPOSITI
Family MemberCoproporphyrin nmo£./g dry wt
(0 - 50)Protoporphyrin nmo£/g dry wt (0 - 200)
1 Mrs. A 431 758
2 Mrs. H 81 3163 Mr. G 518 969
Mrs. G 406 797
4 Mr. Le R 66 2485 Mrs. S 148 581
6 Master V 265 6537 Mrs. M 87 311
26
jg 1 FLOW DIAGRAM 1
0
14 ml falcon tube
blood
ficoll-paque centrifuge at 400g for 30 mins
1 serum
t ~t : lymphocytes
«*■ ficoll-paqueV -a - rad calla
suspend in medium containing fetal bovine serum and mitogens at5 X 10s cells/mi
M----------lyse contaminating red cells with NH4CO3 buffer and wash twice with medium (spin at 200g)
transfer lymphocytes to 5 0 m i falcon tube and spin at 4 0 0 g for 5 mins
Vpil
Vmedium
lymphocytepellet
v
incubate in tissue culture tubes for 72hrs
vortex
Acentifuge cells at 2 0 0 g for 5m in
decant supernatant and wash twice with F, -medium
U - a -c e l l pellet
suspend in 1ml F, medium containg ALA with or without CaMgEdta or Fe and incubate for 2 4 hra
4 ------------------------------------------- 11 [centrifuge at 600g for Smina, decant supernatant - and add 500/xf £perchloric-acid methanol to lyse cells
centrifuge at 600g for Smina and transfer supernatant to microcuvette
(Y7l
microcuvetteDetermine fluorescence at excitation 405nm and emission 630nm
27.
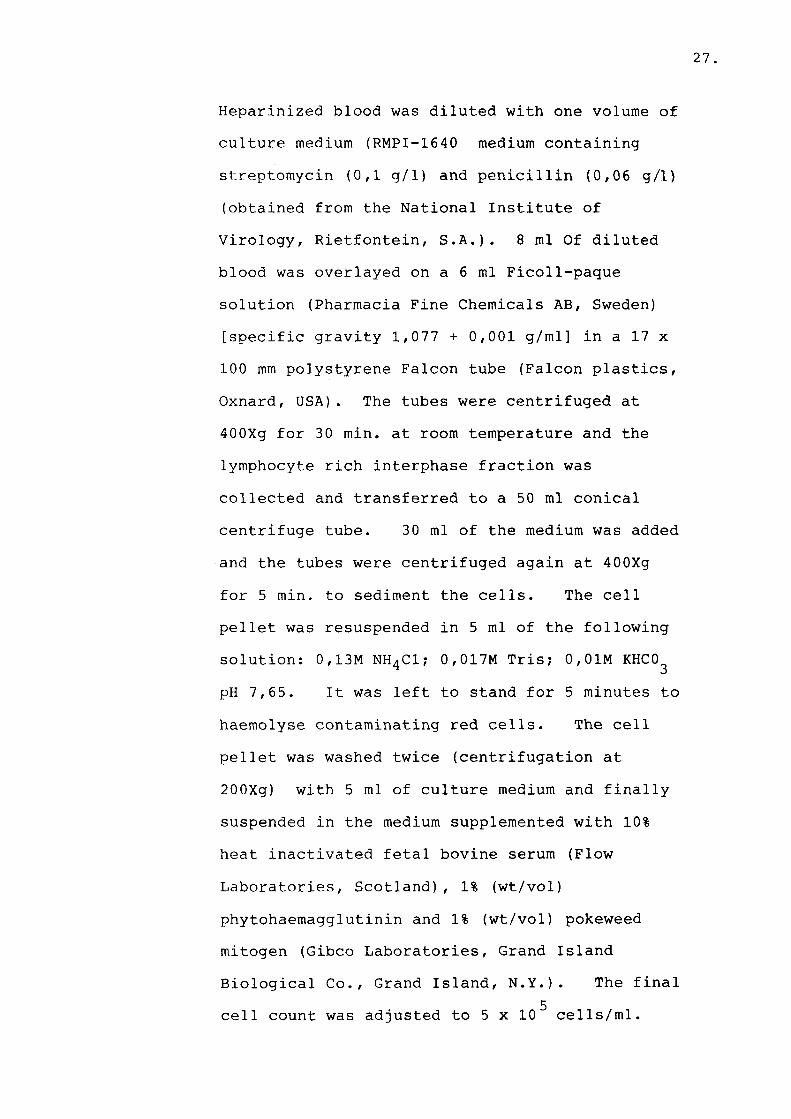
Heparinized blood was diluted with one volume of culture medium (RMPI-1640 medium containing streptomycin (0,1 g/1) and penicillin (0,06 g/1) (obtained from the National Institute of Virology, Rietfontein, S.A.). 8 ml Of dilutedblood was overlayed on a 6 ml Ficoll-paque solution (Pharmacia Fine Chemicals AB, Sweden) [specific gravity 1,077 + 0,001 g/ml] in a 17 x 100 mm polystyrene Falcon tube (Falcon plastics, Oxnard, USA). The tubes were centrifuged at 400Xg for 30 min. at room temperature and the lymphocyte rich interphase fraction was collected and transferred to a 50 ml conical centrifuge tube. 30 ml of the medium was added and the tubes were centrifuged again at 400Xg for 5 min. to sediment the cells. The cell pellet was resuspended in 5 ml of the following solution: 0,13M NH4C1; 0,017M Tris; 0,01M KHC03 pH 7,65. It was left to stand for 5 minutes to haemolyse contaminating red cells. The cell pellet was washed twice (centrifugation at 200Xg) with 5 ml of culture medium and finally suspended in the medium supplemented with 10% heat inactivated fetal bovine serum (Flow Laboratories, Scotland), 1% (wt/vol) phytohaemagglutinin and 1% (wt/vol) pokeweed mitogen (Gibco Laboratories, Grand IslandBiological Co., Grand Island, N.Y.). The final
5cell count was adjusted to 5 x 10 cells/ml.
Cells were stained with Turk's stain (0.2 g gentian violet/250g glacial acetic acid, 5M) and counted on a Neubauer counting chamber. Usually
g+ 2 x 10 cells were obtained from adults and +g0,5 x 10 from children. The cell suspension
was transferred into 12 x 100mm Falcon tubes (1 ml/tube) and incubated at 37 degrees C for 72 hours in an atmosphere of 5% C02 and 100% relative humidity. Incubation time of lymphocytes with mitogens and optimal lymphocyte and mitogen concentrations for optimal stimulation of lymphocytes have previously been determined (90,38).
As excess protoporphyrin and coproporphyrin are only found in PV subjects after puberty, lymphocytes from children who were suspected to have a propensity for the disease, i.e. low PPO activity (Chapter 2) were incubated with steroids to see if hormones had any effect on protoporphyrin synthesis (90) . 17B-oestradiol and testosterone (4 ug/ml) were added respectively to additional vials containing lymphocytes from PV children with reduced PPO activity (stock solutions of 1 mg/ml of the hormones were prepared in ethanol) (90). For the protoporphyrinogen oxidase assay, cells were suspended in culture medium supplemented with 10% heat inactivated fetal bovine serum and kept overnight on ice.
29.
2. Incubation of stimulated lymphoytes with ALA
Each experiment included one or two PV subjects, one EPP subject and a normal control.Experiments were repeated two to three times on each PV and EPP subject. The coefficient of variation for PV patients was 11% and ~ 6% for EPP patients. After 3 days of incubation in the presence of mitogens, the cells were centrifuged at 200Xg and washed twice with 1 ml of serum free F-l medium supplemented with crystalline insulin (1 ug/ml). This medium (devoid of serum and phenol red) was earlier found to be more effective than a serum containing medium in supporting the formation of porphyrins and inhibiting release of porphyrins into growth medium from cultured skin fibroblasts (92) . These findings were confirmed in human lymphocytes (37) . Cells were suspended in Fl-medium (prepared by Flow Laboratories, Scotland), containing 0,6 mM ALA (Sigma, St. Louis, USA) with or without 5 mM CaMgEDTA or 25 uM ferrous ammonium sulfate, and then incubated for 24 h at 37 degrees C in 5%CO2 atmosphere. Concentrations of ALA, CaMgEDTA and ferrous ammonium sulphate have previously been optimised for this experiment (90,38). Each experiment was carried out in quadruplicate, which had a coefficient of variation of ~ 4%.
30.
CaMgEDTA is a potent iron chelator and inhibits ferrochelatase in cultured cells since iron is a substrate for the enzyme. This inhibitor does not however, interfere with the cellular balance of calcium and magnesium which, if it occurred, would interfere with the viability of the cells (11) .
2.1 Preparation of CaMgEDTA 0,1M (91)
Deionised and distilled water was used for preparing solutions.
2.1.1 4,38g EDTA plus 2,8g NaOH was dissolved in 100 ml H 2 O.
2.1.2 2,2 g CaC^ 1^0 and 3,05 g MgC^ GH^O was dissolved in 40 ml H2 0 in a separate flask.
2.1.3 The salt solution was added slowly to the EDTA solution. When the pH dropped below 6,0, strong NaOH was slowly added. Care was taken not to exceed pH 9,0, as above pH 9,0 the hydroxides precipitate.
2.1.4 The pH was adjusted to 7,0 with eitherdilute HC1 or NaOH.
2.1.5 The volume was adjusted to 150 ml.
2.2 Measurement of protoporphyrin formation
After incubation with ALA for 24 hours, cells were harvested by centrifuation at 600 g for 5 min. 500 ul Of a 0,5 M perchloric acid-50% methanol solution was added to the cell pellet and the tube was vortexed for 30 sec. This mixture was centrifuged at 600 g for 5 min. and the supernate was transferred to a 500 ul microcuvette. The fluorescence was determined at excitation wavelength 405 nm and emission 630 nm on a Perkin Elmer 203 fluorescence spectrophotometer.
7Protoporphyrin IX disodium salt (1 x 10- M) (Sigma) dissolved in the perchloric acid methanol solution was used as a standard.
Protein determination
Protein concentrations were determined by the method of Lowry et al., (94) with crystallinebovine albumin as standard (Chapter 3). The measurements were made on the cellular precipitate in the tissue culture tubes as well as on 10 ul aliquots from the cell sonicates.The cellular precipitate was dissolved in 500 ul0,2 M NaOH and heated at 60 degrees C for 30 min. for solubilization.
32.
RESULTS
Ferrochelatase activity
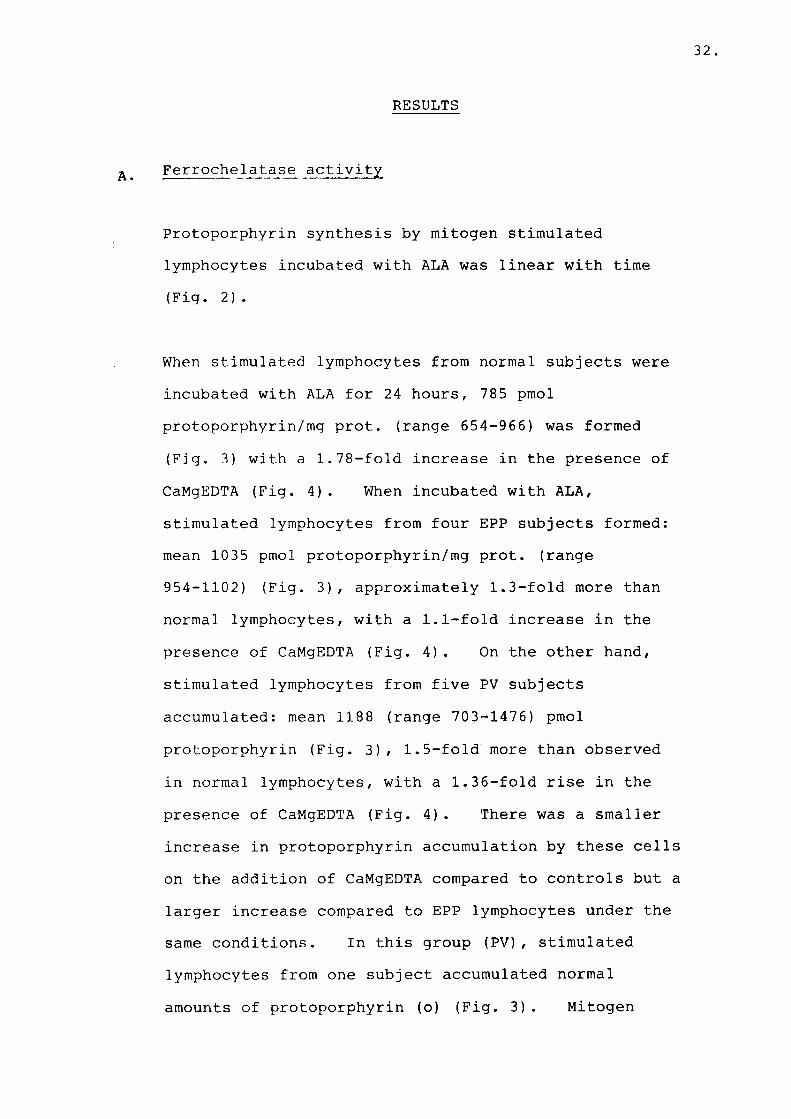
Protoporphyrin synthesis by mitogen stimulated lymphocytes incubated with ALA was linear with time (Fig. 2).
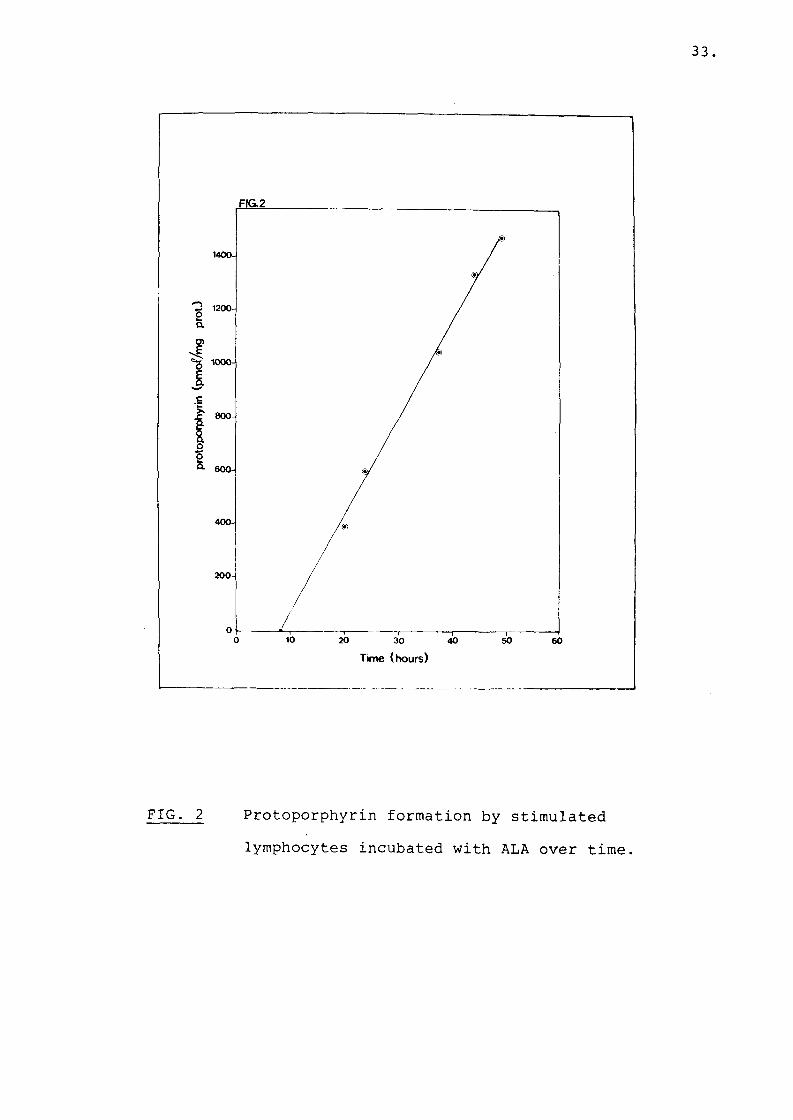
When stimulated lymphocytes from normal subjects were incubated with ALA for 24 hours, 785 pmol protoporphyrin/mg prot. (range 654-966) was formed (Fig. 3) with a 1.78-fold increase in the presence of CaMgEDTA (Fig. 4). When incubated with ALA, stimulated lymphocytes from four EPP subjects formed: mean 1035 pmol protoporphyrin/mg prot. (range 954-1102) (Fig. 3), approximately 1.3-fold more than normal lymphocytes, with a 1.1-fold increase in the presence of CaMgEDTA (Fig. 4). On the other hand, stimulated lymphocytes from five PV subjects accumulated: mean 1188 (range 703-1476) pmol protoporphyrin (Fig. 3), 1.5-fold more than observed in normal lymphocytes, with a 1.36-fold rise in the presence of CaMgEDTA (Fig. 4). There was a smaller increase in protoporphyrin accumulation by these cells on the addition of CaMgEDTA compared to controls but a larger increase compared to EPP lymphocytes under the same conditions. In this group (PV), stimulated lymphocytes from one subject accumulated normal amounts of protoporphyrin (o) (Fig. 3). Mitogen
33.
FIG. 2 Protoporphyrin formation by stimulated lymphocytes incubated with ALA over time.
Pro
top
orp
hyr
in I
X (
pm
ol/
mg
pro
t)
34.
FIG. 3: Effect of ALA on protoporphyrin IX formation
FIG. 4 Effect of CaMgEDTA on protoporphyrin IX formation. Data were expressed as the ratio of protoporphyrin IX formed with the treatment of CaMgEDTA plus ALA to that formed with ALA alone. (o) Represents the patient described in the text.
35.
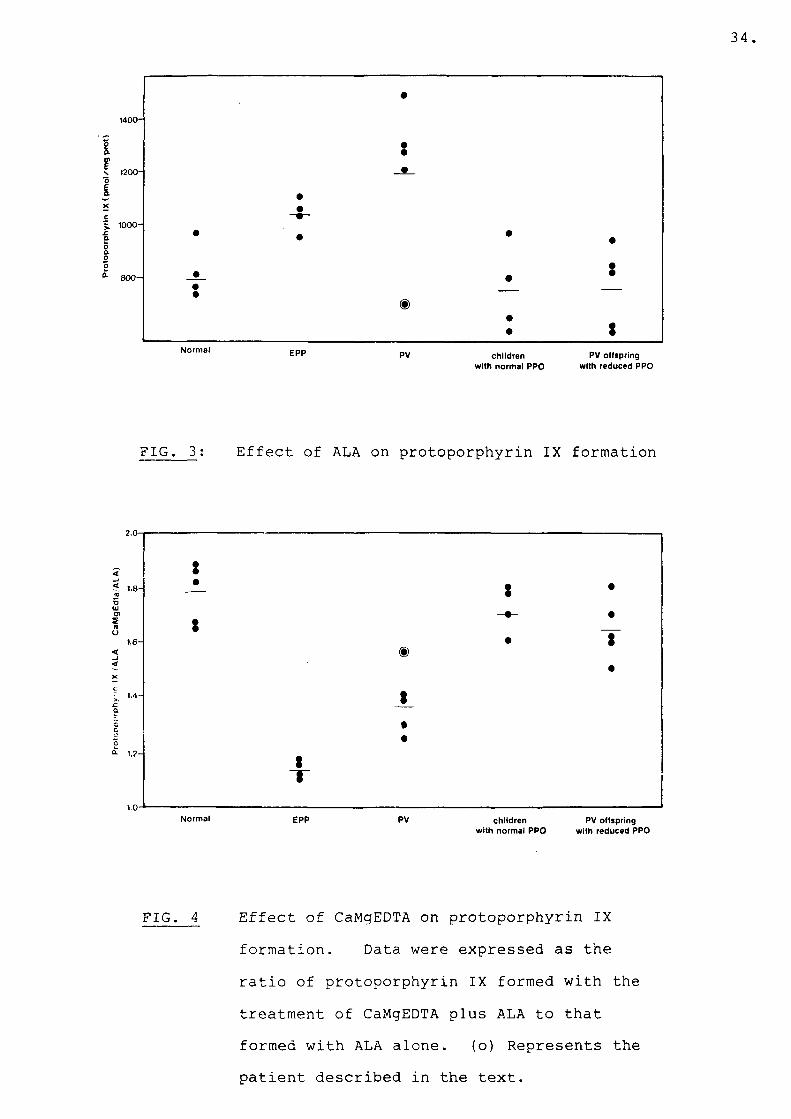
stimulated lymphocytes from PV offspring with normal PPO activity as well as PV offspring with reduced PPO activity accumulated normal amounts of protoporphyrin, mean: 750 (range 599-961) and (range 546-925)(Fig.3). With approximately a 1.7-fold increase in the presence of CaMgEDTA (Fig. 4). The effect of iron on mitogen stimulated lymphocytes incubated with ALA and iron is shown in Figs. 5 and 6. When lymphocytes of normal adults were incubated with iron and ALA, 129 pmol protoporphyrin/mg prot. (range 58-221) accumulated, an 83% reduction in protoporphyrin accumulation. When EPP lymphocytes were treated similarly, protoporphyrin accumulation was reduced by only 40%: mean 557 pmol/mg prot. (range 412-769).The effect of iron on stimulated lymphocytes of four PV patients who showed elevated protoporphyrin levels when incubated with ALA was also studied. In the presence of iron 335 pmol protoporphyrin (mean) accumulated (range 272-368), a 70% reduction in protoporphyrin accumulation by their lymphocytes.There was a significant difference in the ratio of protoporphyrin accumulation by PV lymphocytes incubated with ALA and iron to that formed with ALA alone as compared to the same ratio in normal lymphocytes (Fig. 6) (P<0.05). The difference in thisratio was even more marked between normal and EPP lymphocytes (Fig. 6) (P<0.001). Stimulatedlymphocytes of PV offspring with reduced or normal PPO activity behaved like normal adult lymphocytes when incubated with iron and ALA. ** Statistical probability
Prot
opor
phyr
in I
X (A
LA -
Fe/
ALA
)
FIG. 5: Effect of iron on protoporphyrin IXformation.
FIG. 6 Ratio of protoporphyrin IX formed with thetreatment of iron plus ALA to that formed
36.
with ALA alone
37.
There was no difference in protoporphyrin synthesis when hormones (oestrogen or testosterone) were added to the lymphocytes from children with reduced PPO activity and incubated with ALA (results not included). The hormonal profile of the one PV patient whose stimulated lymphocytes synthesized normal amounts of protoporphyrin and who previously was found to have normal ferrochelatase, was normal.
4. Measurement of protoporphyrinogen oxidaseactivity
Lymphocytes were prepared as described in section (1) and kept overnight on ice. PPO activity was measured in duplicate by means of a fluorometric assay (see below) as described by Brenner and Bloomer (82), but with modifications in the volume of the assay.
VP, EPP and control samples were assayed in the same batch. The lymphocytes were washed twice with phosphate buffered saline pH 7,4, resuspended in 0,02 M Tris HC1 (pH 8,7) containing 2% Tween 20 (v/v) and sonicated three times at 50 W/s for 20 sec.
38.
4.1 Preparation of protoporphyrinogen
A stock solution of 1 mM protoporphyrin (Porphyrin products, Logan, Utah, USA), dissolved in 0,01 M KOH containing 20% ethanol (v/v) was diluted to 200 uM with ethanol/KOH. Sodium amalgam (3%) was freshly prepared prior to use, by the addition of 0,4 g Na to 9,6 Hg and heating it under nitrogen (93) . The hot amalgam was cooled to room temperature and pulverized with a mortar and pestle to a fine sand. It was then transferred in the dark under nitrogen to a flask containing the protoporphyrin solution. The concentration of sodium amalgam was 2 g/ml of protoporphyrin solution. The flask was stoppered under nitrogen and shaken until the fluorescence under ultraviolet light had disappeared (approximately 2-3 min). The solution was then filtered in the dark under nitrogen through a fine scintered glass filter by vacuum. The solution of protoporphyrinogen was adjusted to pH 8 with 40% (v/v) phosphoric acid. After standing in the air in the dark overnight, 50-70% of the protoporphyrinogen reoxidized to protoporphyrin.
39.
4.2 Assay of protoporphyrinogen oxidase activity
Previous studies demonstrated that the activity of PPO was greater at pH 8,7 than at physiological pH in sonicates of human fibroblasts (82) as well as lymphocytes (72). Therefore all assays were performed at pH 8,7. The reaction mixture (500 ul) consisted of 5 mM glutathione, 1 mM EDTA,100 mM Tris HC1 (pH 8,7), Tween 20, 1% (v/v) and 50 uM protoporphyrinogen with the cell sonicate. A reagent blank, non-enzymatic control, and protoporphyrin standard were also prepared. The reagent blank consisted of the standard reaction mixture except that 0,01 M KOH/20% ethanol was substituted for the protoporphyrinogen solution. In the non-enzymatic control, the tissue preparation was first heated at 75 degrees C for 15 min. In the protoporphyrin standard, 5 uM protoporphyrin was substituted for the protoporphyrinogen. The assay was started by adding the protoporphyrinogen to the untreated tissue preparation and the non-enzymatic control.Each flask was incubated at 37 degrees C in the dark in room air without shaking. This was done to minimize the non-enzymatic formation of
40.
protoporphyrin from protoporphyrinogen. Periodically 20 ul of reaction mixture was added to 480 ul of a mixture consisting of 5 mM glutathione, 1 mM EDTA and 100 mM Tris HC1 pH 8,7. The fluorescence emission at 635 nm was measured in microcuvettes with a Perkin Elmer 203 spectrofluorometer at excitation wavelength 405 nm.
RESULTSB. Protoporphyrinogen oxidase activity
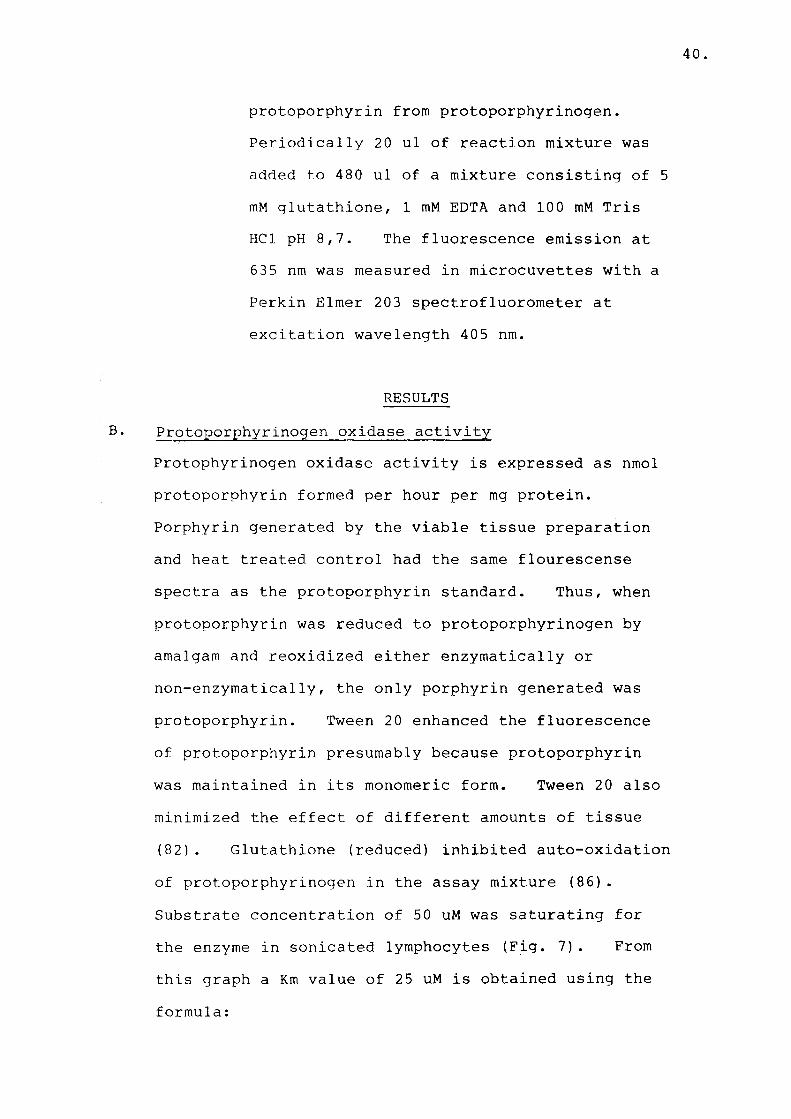
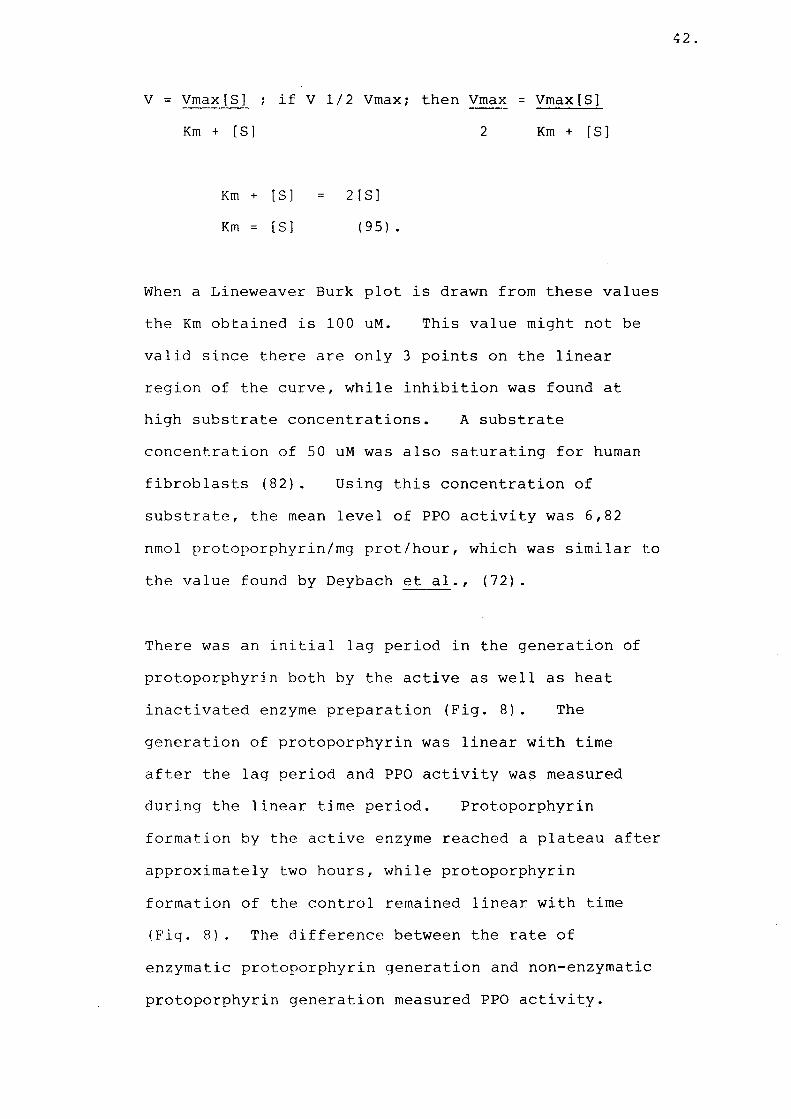
Protophyrinogen oxidase activity is expressed as nmol protoporphyrin formed per hour per mg protein. Porphyrin generated by the viable tissue preparation and heat treated control had the same flourescense spectra as the protoporphyrin standard. Thus, when protoporphyrin was reduced to protoporphyrinogen by amalgam and reoxidized either enzymatically or non-enzymatically, the only porphyrin generated was protoporphyrin. Tween 20 enhanced the fluorescence of protoporphyrin presumably because protoporphyrin was maintained in its monomeric form. Tween 20 also minimized the effect of different amounts of tissue (82). Glutathione (reduced) inhibited auto-oxidation of protoporphyrinogen in the assay mixture (86). Substrate concentration of 50 uM was saturating for the enzyme in sonicated lymphocytes (Fig. 7). From this graph a Km value of 25 uM is obtained using theformula:
41 .
FIG. 7; Effect of substrate concentration onprotoporphyrin formation. Values are expressed as fluorescent units produced by the active enzyme preparation minus that of the heat inactivated control per hour.Fifty fluorescent units represents a full scale deflection on a Perkin Elmer spectrofluorimeter at 11.0 sensitivity.
42.
V = Vmax[S] ; if V 1/2 Vmax; then Vmax = Vmax[S]Km + [S] 2 Km + [S]
Km + [S] = 2[S]Km = [S] (95) .
When a Lineweaver Burk plot is drawn from these values the Km obtained is 100 uM. This value might not be valid since there are only 3 points on the linear region of the curve, while inhibition was found at high substrate concentrations. A substrate concentration of 50 uM was also saturating for human fibroblasts (82). Using this concentration of substrate, the mean level of PPO activity was 6,82 nmol protoporphyrin/mg prot/hour, which was similar to the value found by Deybach et al., (72).
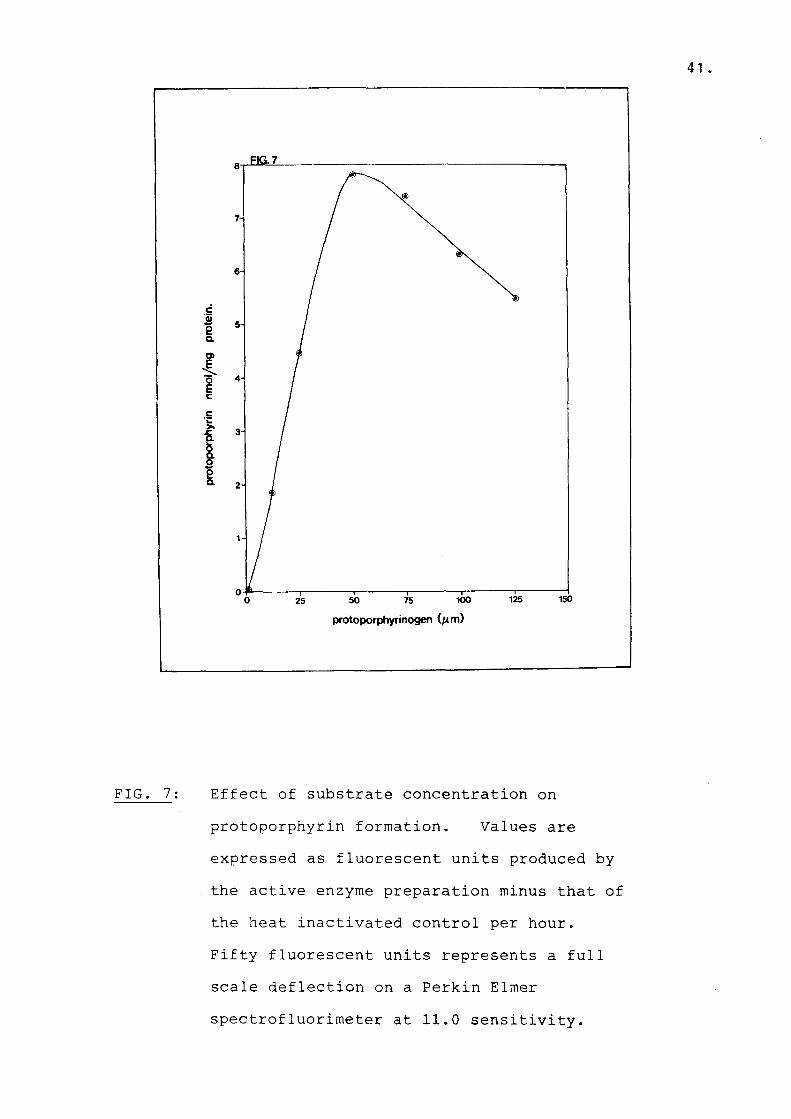
There was an initial lag period in the generation of protoporphyrin both by the active as well as heat inactivated enzyme preparation (Fig. 8). The generation of protoporphyrin was linear with time after the lag period and PPO activity was measured during the linear time period. Protoporphyrin formation by the active enzyme reached a plateau after approximately two hours, while protoporphyrin formation of the control remained linear with time (Fig. 8). The difference between the rate of enzymatic protoporphyrin generation and non-enzymatic protoporphyrin generation measured PPO activity.
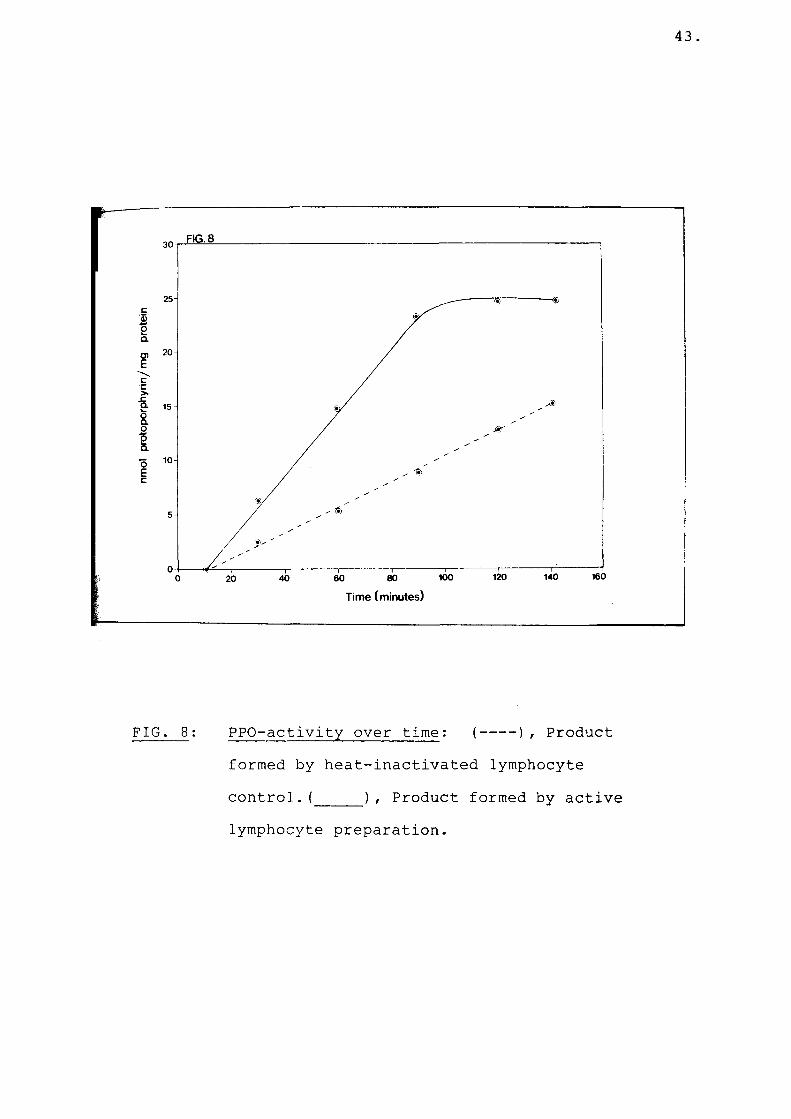
FIG. 8: PPO-activity over time: (--- ), Productformed by heat-inactivated lymphocyte control. (_____), Product formed by activelymphocyte preparation.
44.
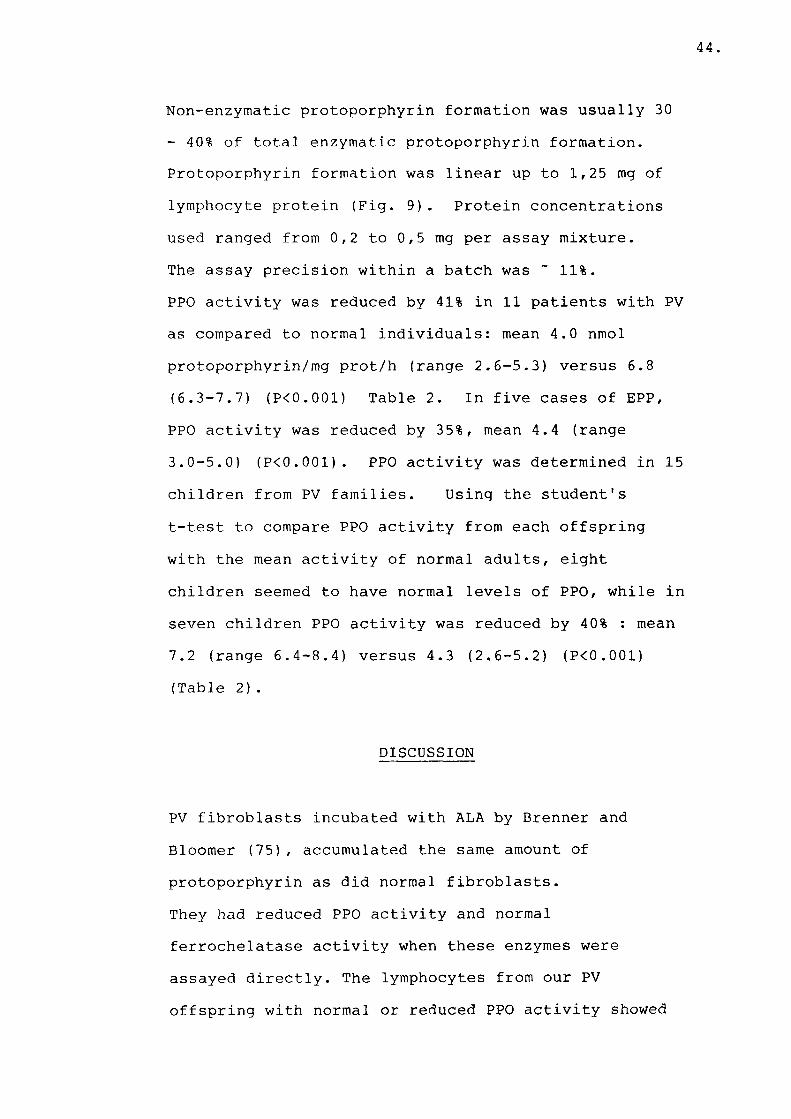
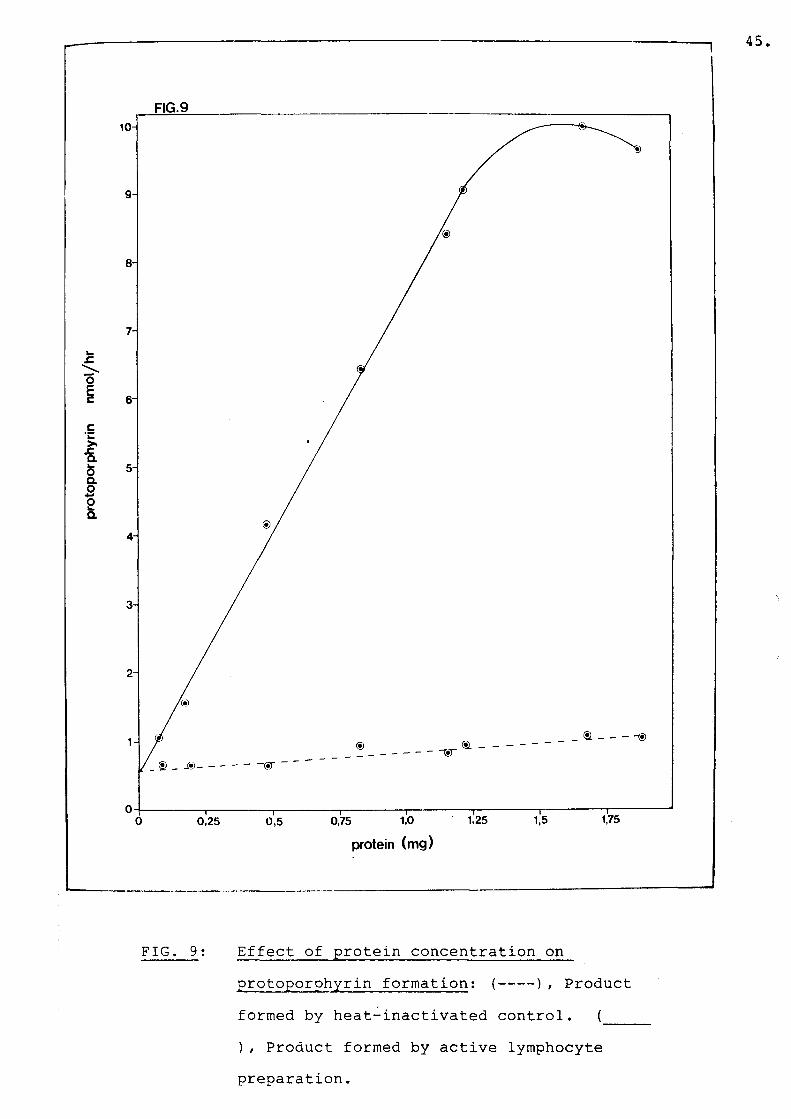
Non-enzymatic protoporphyrin formation was usually 30 - 40% of total enzymatic protoporphyrin formation. Protoporphyrin formation was linear up to 1,25 mg of lymphocyte protein (Fig. 9). Protein concentrations used ranged from 0,2 to 0,5 mg per assay mixture.The assay precision within a batch was ~ 11%.PPO activity was reduced by 41% in 11 patients with PV as compared to normal individuals: mean 4.0 nmol protoporphyrin/mg prot/h (range 2.6-5.3) versus 6.8 (6.3-7.7) (P<0.001) Table 2. In five cases of EPP,PPO activity was reduced by 35%, mean 4.4 (range 3.0-5.0) (PC0.001). PPO activity was determined in 15children from PV families. Using the student's t-test to compare PPO activity from each offspring with the mean activity of normal adults, eight children seemed to have normal levels of PPO, while in seven children PPO activity was reduced by 40% : mean 7.2 (range 6.4-8.4) versus 4.3 (2.6-5.2) (PC0.001)(Table 2).
DISCUSSION
PV fibroblasts incubated with ALA by Brenner and Bloomer (75), accumulated the same amount of protoporphyrin as did normal fibroblasts.They had reduced PPO activity and normal ferrochelatase activity when these enzymes were assayed directly. The lymphocytes from our PV offspring with normal or reduced PPO activity showed
45
FIG. 9: Effect of protein concentration onprotoporphyrin formation: (--- ), Productformed by heat-inactivated control. (___), Product formed by active lymphocyte preparation.
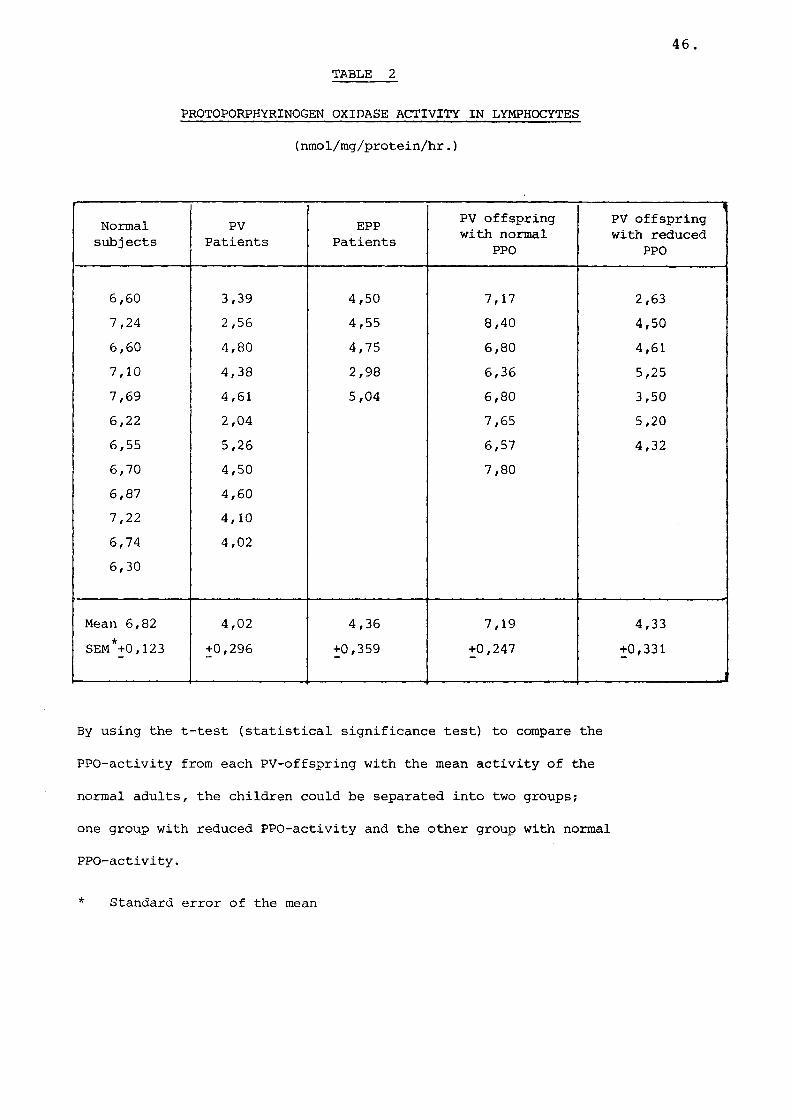
46TABLE 2
PROTOPORPHYRINOGEN OXIDASE ACTIVITY IN LYMPHOCYTES (nmol/mg/protein/hr.)
Normalsubjects
PVPatients
EPPPatients
PV offspring with normal
PPOPV offspring with reduced
PPO
6,60 3,39 4,50 7,17 2,637,24 2,56 4,55 8,40 4,506,60 4,80 4,75 6,80 4,617,10 4,38 2,98 6,36 5,257,69 4,61 5,04 6,80 3,506,22 2,04 7,65 5,206,55 5,26 6,57 4,326,70 4,50 7,806,87 4,607,22 4,106,74 4,026,30
Mean 6,82 4,02 4,36 7,19 4,33SEM*+0,123 +0,296 +0,359 +0,247 +0,331
By using the t-test (statistical significance test) to compare the
PPO-activity from each PV-offspring with the mean activity of the
normal adults, the children could be separated into two groups;
one group with reduced PPO-activity and the other group with normal
PPO-activity.
* Standard error of the mean
47.
normal protoporphyrin accumulation when stimulated with mitogens and incubated with ALA, alone or with the addition of chelators or iron and it is inferred that ferrochelatase is not reduced in those PV offspring with reduced PPO activity. By contrast, there was a marked increase in protoporphyrin accumulated in mitogen stimulated lymphocytes incubated with ALA from four out of five PV patients with reduced PPO activity. This is not surprising since reduced ferrochelatase activity has been reported previously in their leucocytes (71). The findings in case (o) are of particular interest.She has reduced PPO activity and normal accumulation of protoporphyrin when her mitogen stimulated lymphocytes were incubated with ALA. She was the only patient in a previous study (Viljoen et al., (71)case 10) who had normal ferrochelatase activity when estimated by two different methods. This supports the theme that increased protoporphyrin accumulation by mitogen stimulated lymphocytes incubated with ALA reflects decreased ferrochelatase activity and is not altered by reduced PPO activity alone. The results were interpreted as follows: In children from PVfamilies, reduced PPO activity may reflect the PV trait but their ferrochelatase is normal. In adult PV patients both PPO and ferrochelatase activity may be reduced. Although PV becomes clinically and biochemically manifest after puberty, it was not possible to show that the decrease in ferrochelatase
48.
activity after puberty, was due to hormones (oestrogen and testosterone).
There was a 36% reduction in PPO activity in EPP lymphocytes. This was not due to inhibition of protoporphyrinogen oxidase by protoporphyrin.Trace amounts only of protoporphyrin were present in EPP or PV lymphocytes before these cells were stimulated with mitogens. Since it has repeatedly been shown that ferrochelatase is reduced in EPP it would appear, therefore, that both PPO and ferrochelatase are decreased in EPP and PV. However, these two diseases are clinically and biochemically distinct. Tissue specificity (i.e. EPP is primarily a disorder in erythroid tissue whereas PV is an hepatic porphyria) may explain the different clinical expressions of these diseases but there must also be an enzymatic difference between them. There is no statistically significant difference in PPO activity between EPP and PV lymphocytes. There are however, distinct differences between ferrochelatase activity in EPP and PV, as has been outlined in the discussion section of this thesis.
A further difference is the finding of a higher level of protoporphyrin accumulation in mitogen stimulated PV lymphocytes when incubated with ALA than in EPP (Fig. 3). There was a further 37% increase on the addition of CaMgEDTA to the PV cultures, whereas the
49.
rise of protoporphyrin in mitogen stimulated EPP lymphocytes incubated with ALA and CaMgEDTA was only 14%. When stimulated lymphocytes from normal subjects were incubated with ALA and iron there was an 83% decrease in protoporphyrin accumulation; compared with a 70% decrease in cases of PV and 43% decrease in those from EPP subjects. It is of great interest that there was a 50% decrease in ferrochelatase activity by EPP stimulated lymphocytes when the difference between protoporphyrin formation from ALA by replete (+iron) and iron deficient (+CaMgEDTA) cells is compared to normal stimulated lymphocytes treated similarly. However, there was no difference in protoporphyrin formation by iron replete and iron deficient stimulated lymphocyte from PV patients compared to controls; yet PV stimulated lymphocytes incubated with ALA alone; ALA +iron and ALA + CaMgEDTA accumulated increased protoporphyrin as compared to normal lymphocytes. This would suggest that the disturbance in ferrochelatase in PV is a change in enzyme affinity for the substrate iron whereas in EPP, ferrochelatase activity is reduced. It is suggested that in EPP the defect in ferrochelatase is primarily in the red cell and that a different disturbance in ferrochelatase which is present in the liver accounts for the different clinical and biochemical manifestations of these diseases. The present results demonstrate a further difference in ferrochelatase characteristics between PV and EPP.
CHAPTER 2
PROTOPORPHYRINOGEN OXIDASE ACTIVITY IN
SEVEN FAMILIES WITH PORPHYRIA VARIEGATA
CHAPTER 2
Porphyria variegata (PV) is a disease which manifestsitself both clinically and biochemically afterpuberty. Children from PV families have no clinicalfeatures of the disease and their stools are negativefor porphyrins. In 80% of adult cases there aredermatological features but few show severe lesionsand acute attacks are rare (96). The diagnosis of PVin adults is established when excess copro-andprotoporphyrins are found in the stool even in thequiescent phase of the disease (68), however, a normalvalue is occasionally found in a probable carrier.High excretion of porphyrins in the stool has beenreported in cases of carcinoma (97). It is possiblethat more sophisticated techniques such as TLC+and
*HPLC used on stool samples (98) and plasma porphyrins measured either chromatographically (99) or by the fluorescence emmision spectra (100) may identify more adults with PV. It is however doubtful if any of these techniques will identify those children in PV families who carry the gene (Pp) and for this reason it is essential to measure the enzyme defect. This chapter deals with the findings regarding protoporphyrinogen oxidase (PPO) activity in seven PV families. It may now be possible to identify PV carriers and their offspring before puberty, who at puberty will develop into overt cases of PV. * *
+ Thin layer chromatography* High pressure liquid chromatography
52.
MATERIALS AND METHODS
Blood and stool samples were collected from 7 PV families. In all, 16 adults; (in one family there were three generations), and 16 children were studied. The age of the children ranged from 6 - 1 3 years. The sexes were equal in numbers. Stools were analysed for porphyrins by the method of Rimington (101) and PPO was measured in leucocytes as described in,Chapter 1.
RESULTS
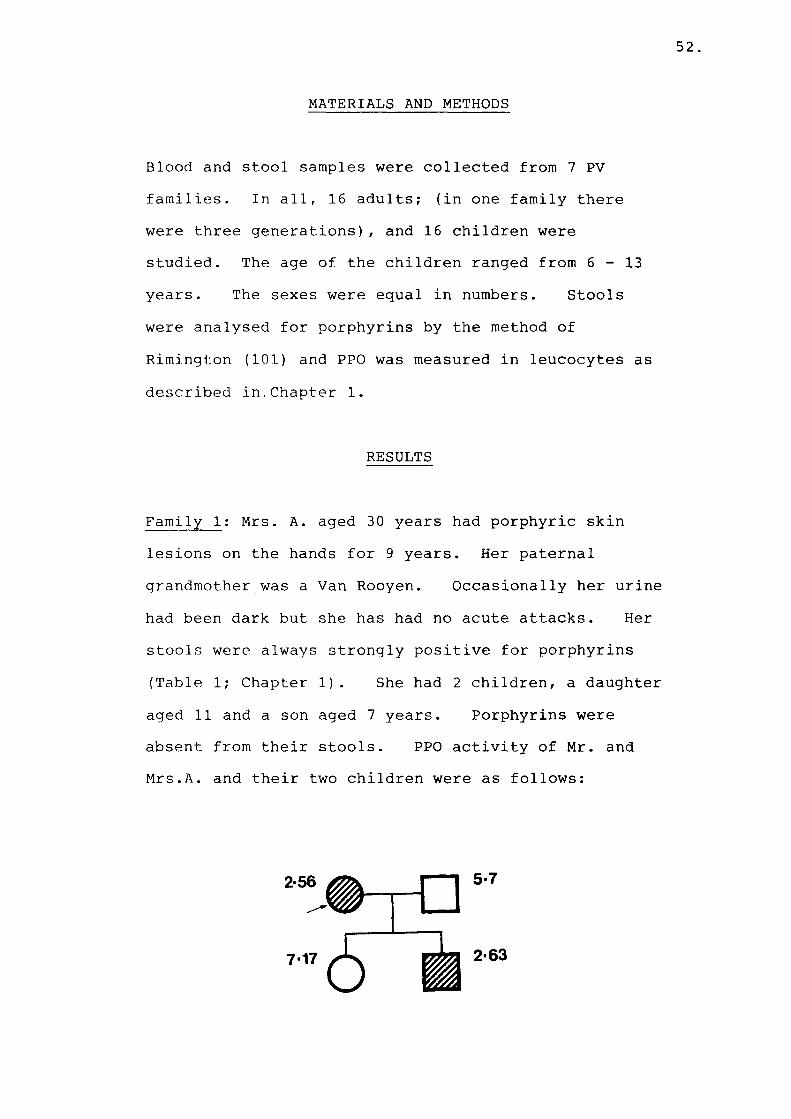
Family 1: Mrs. A. aged 30 years had porphyric skin lesions on the hands for 9 years. Her paternal grandmother was a Van Rooyen. Occasionally her urine had been dark but she has had no acute attacks. Her stools were always strongly positive for porphyrins (Table 1; Chapter 1). She had 2 children, a daughter aged 11 and a son aged 7 years. Porphyrins were absent from their stools. PPO activity of Mr. and Mrs.A. and their two children were as follows:
2-63
53.
Male subjects with PV are represented by hatched squares and females by hatched circles. Normal members are denoted by open symbols. PPO activity is expressed as nmol protoporphyrin synthesised per hour per mg protein
Conclusion: The son carries the gene for PV.
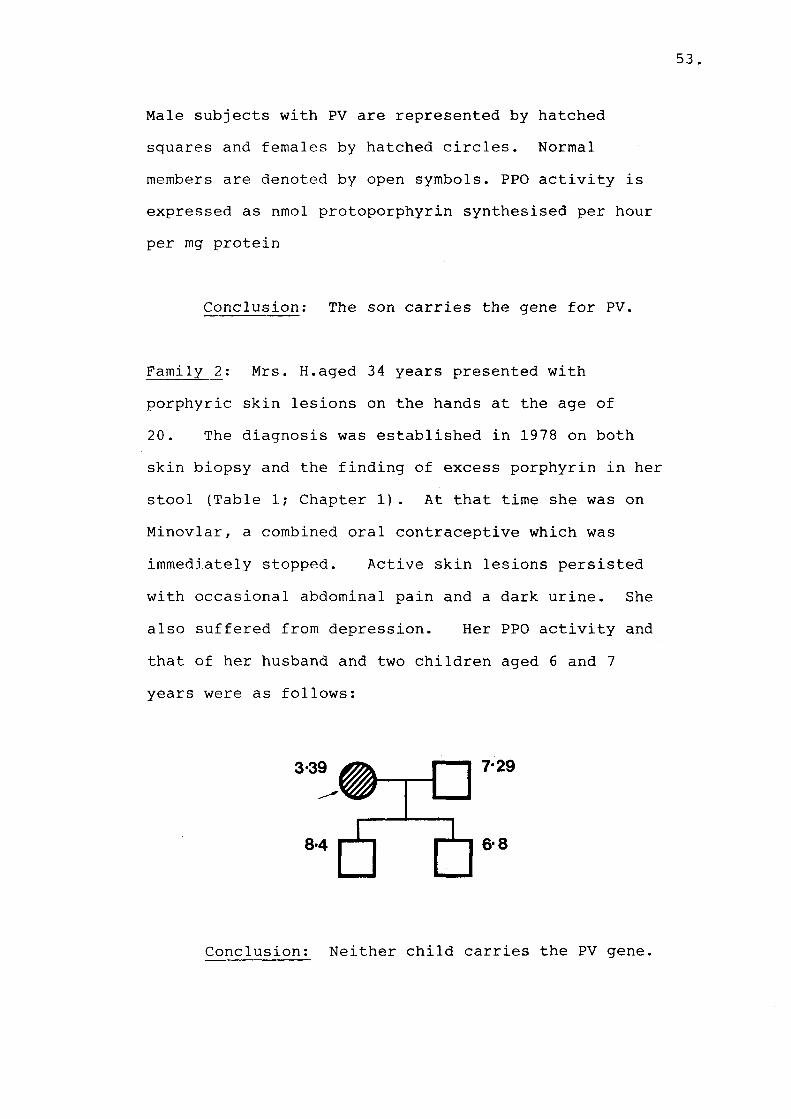
Family 2: Mrs. H.aged 34 years presented with porphyric skin lesions on the hands at the age of 20. The diagnosis was established in 1978 on both skin biopsy and the finding of excess porphyrin in her stool (Table 1; Chapter 1). At that time she was on Minovlar, a combined oral contraceptive which was immediately stopped. Active skin lesions persisted with occasional abdominal pain and a dark urine. She also suffered from depression. Her PPO activity and that of her husband and two children aged 6 and 7 years were as follows:
7-29
6-8
Conclusion: Neither child carries the PV gene.
54.
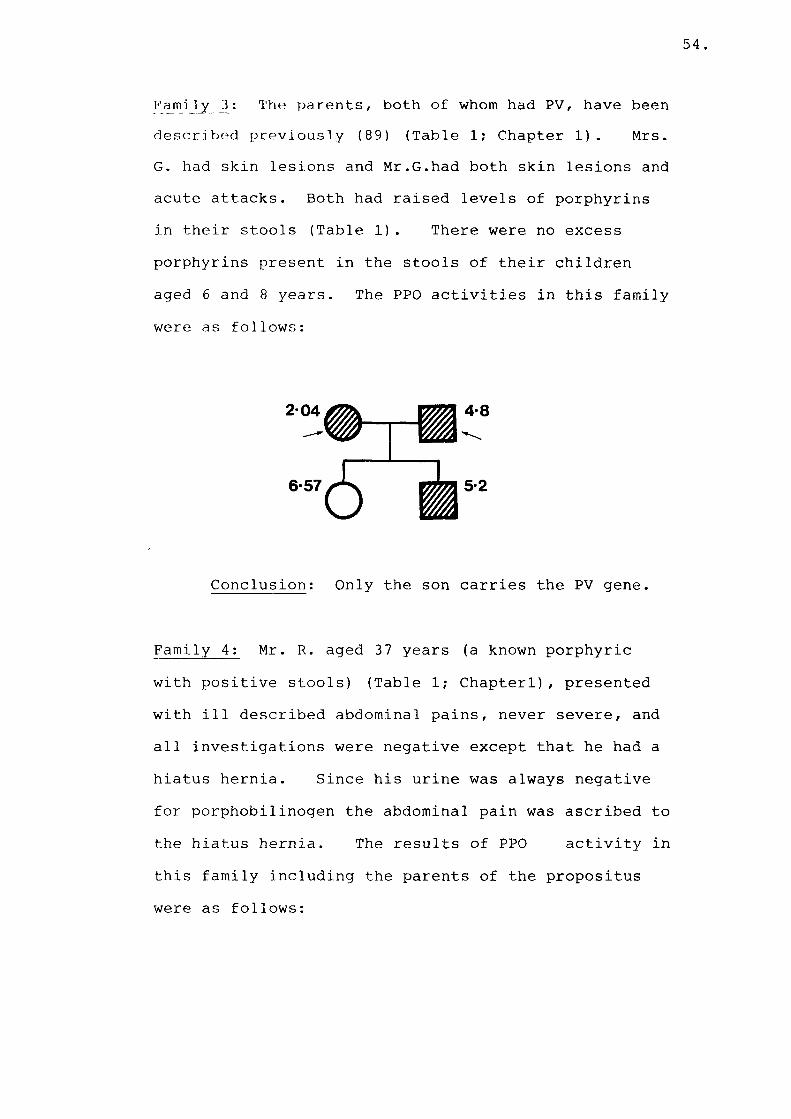
Farni_1_Y_Ji: T^e parents, both of whom had PV, have been described previously (89) (Table 1; Chapter 1). Mrs. G. had skin lesions and Mr.G.had both skin lesions and acute attacks. Both had raised levels of porphyrins in their stools (Table 1). There were no excess porphyrins present in the stools of their children aged 6 and 8 years. The PPO activities in this family were as follows:
Conclusion: Only the son carries the PV gene.
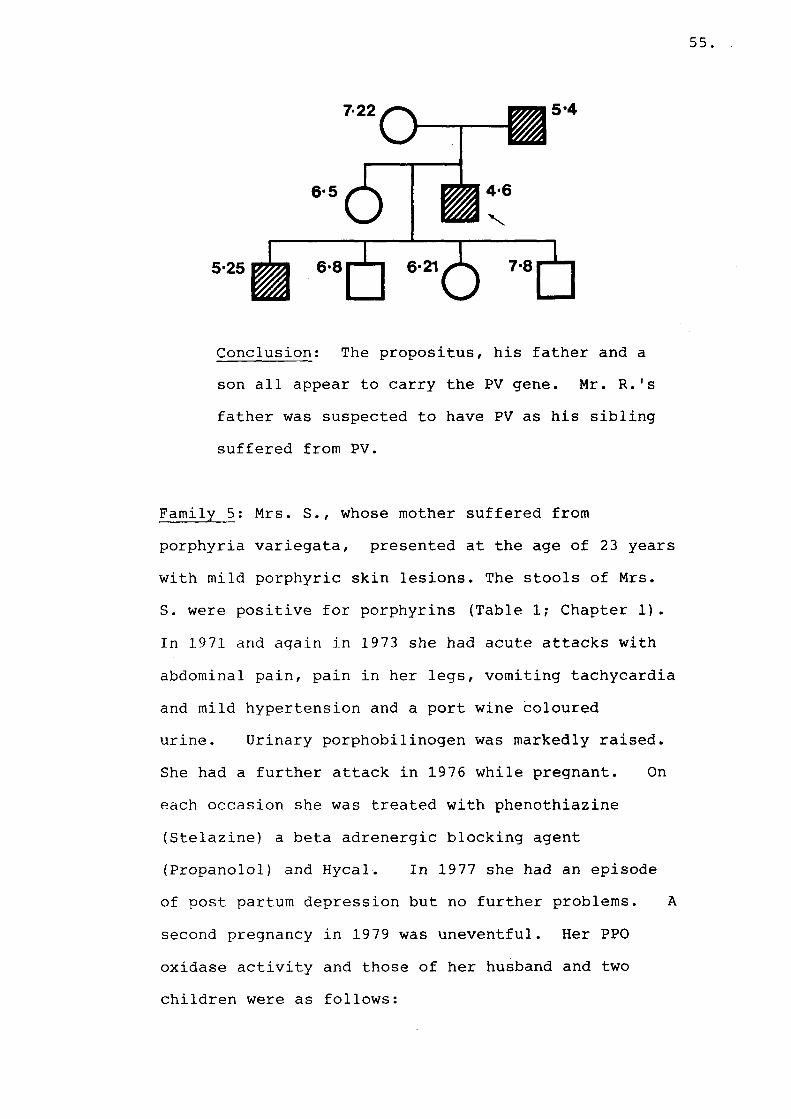
Family 4: Mr. R. aged 37 years (a known porphyric with positive stools) (Table 1; Chapterl), presented with ill described abdominal pains, never severe, and all investigations were negative except that he had a hiatus hernia. Since his urine was always negative for porphobilinogen the abdominal pain was ascribed to the hiatus hernia. The results of PPO activity in this family including the parents of the proposituswere as follows:
55.
Conclusion: The propositus, his father and ason all appear to carry the PV gene. Mr. R.'s father was suspected to have PV as his sibling suffered from PV.
Family 5: Mrs. S., whose mother suffered from porphyria variegata, presented at the age of 23 years with mild porphyric skin lesions. The stools of Mrs.S. were positive for porphyrins (Table 1; Chapter 1). In 1971 and again in 1973 she had acute attacks with abdominal pain, pain in her legs, vomiting tachycardia and mild hypertension and a port wine coloured urine. Urinary porphobilinogen was markedly raised. She had a further attack in 1976 while pregnant. On each occasion she was treated with phenothiazine (Stelazine) a beta adrenergic blocking agent (Propanolol) and Hycal. In 1977 she had an episode of post partum depression but no further problems. A second pregnancy in 1979 was uneventful. Her PPO oxidase activity and those of her husband and twochildren were as follows:
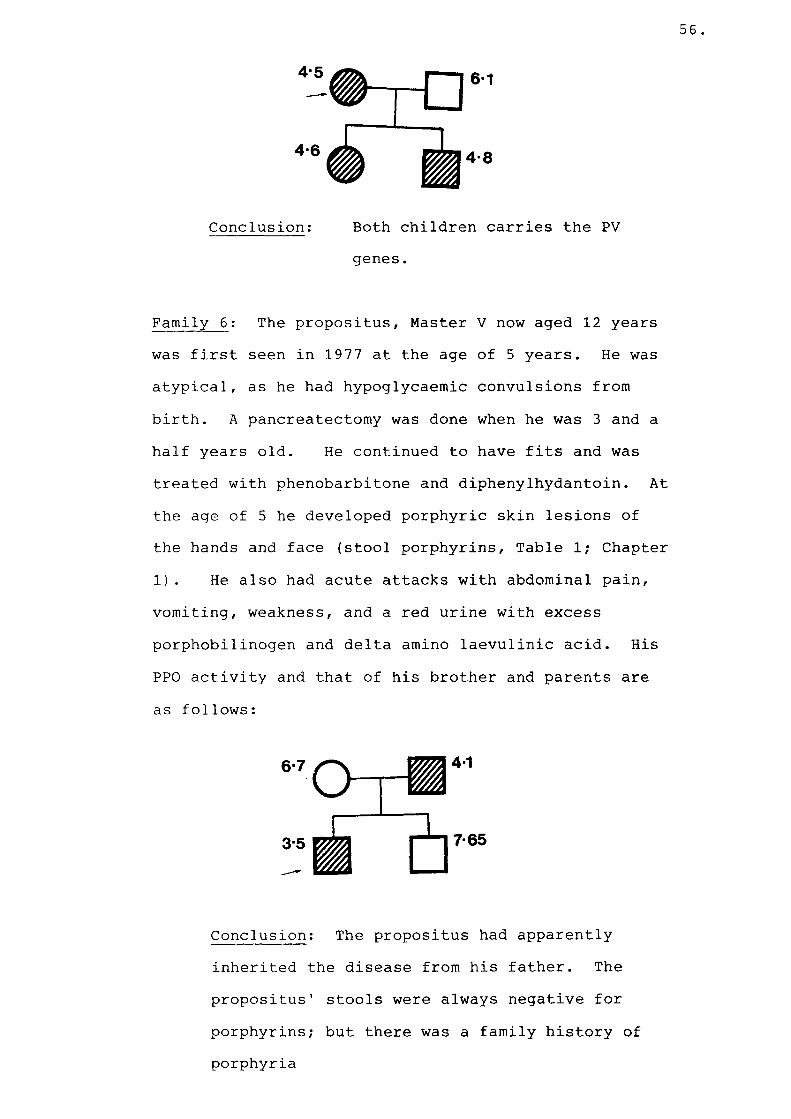
56 .
Conclusion: Both children carries the PVgenes.
Family 6: The propositus, Master V now aged 12 years was first seen in 1977 at the age of 5 years. He was atypical, as he had hypoglycaemic convulsions from birth. A pancreatectomy was done when he was 3 and a half years old. He continued to have fits and was treated with phenobarbitone and diphenylhydantoin. At the age of 5 he developed porphyric skin lesions of the hands and face (stool porphyrins, Table 1; Chapter 1). He also had acute attacks with abdominal pain, vomiting, weakness, and a red urine with excess porphobilinogen and delta amino laevulinic acid. His PPO activity and that of his brother and parents are as follows:
6-7
3-5
4-1
7-65
Conclusion: The propositus had apparentlyinherited the disease from his father. The propositus' stools were always negative for porphyrins; but there was a family history of porphyria
57.
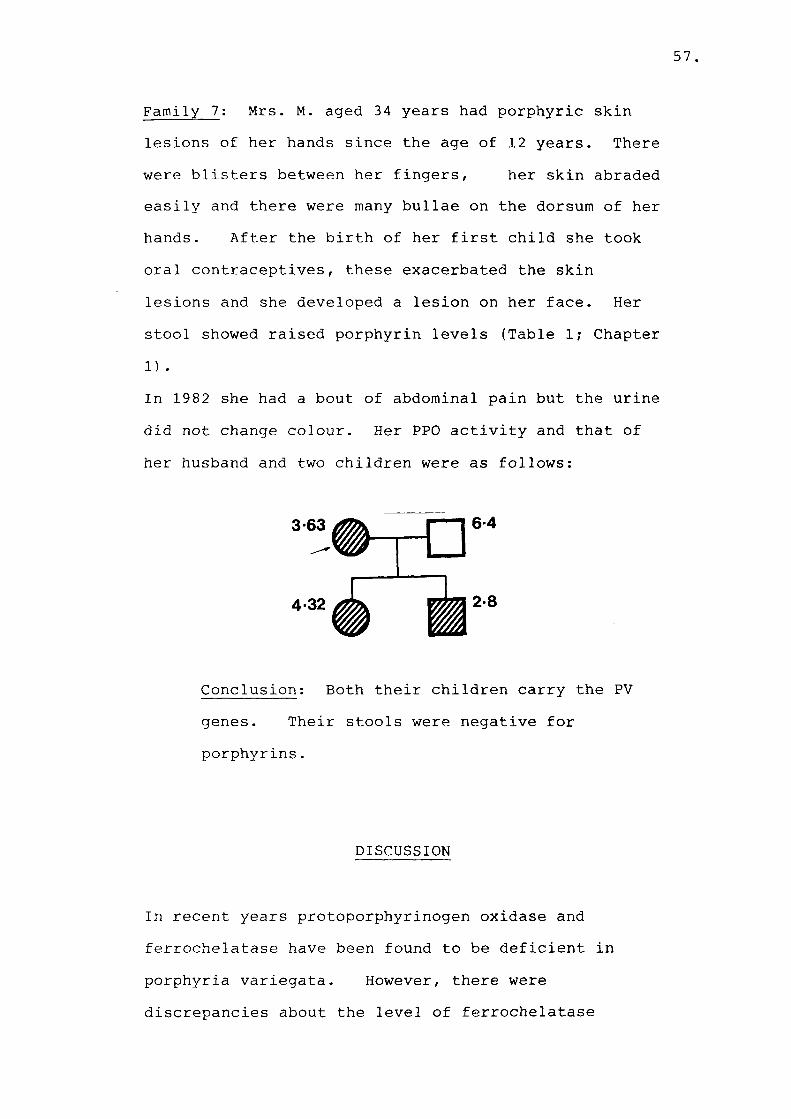
Family 7: Mrs. M. aged 34 years had porphyric skin lesions of her hands since the age of 12 years. There were blisters between her fingers, her skin abraded easily and there were many bullae on the dorsum of her hands. After the birth of her first child she took oral contraceptives, these exacerbated the skin lesions and she developed a lesion on her face. Her stool showed raised porphyrin levels (Table 1; Chapter 1) .In 1982 she had a bout of abdominal pain but the urine did not change colour. Her PPO activity and that of her husband and two children were as follows:
Conclusion: Both their children carry the PVgenes. Their stools were negative for porphyrins.
DISCUSSION
In recent years protoporphyrinogen oxidase and ferrochelatase have been found to be deficient in porphyria variegata. However, there were discrepancies about the level of ferrochelatase

5 8 .
activity in PV. The method generally used to measure ferrochelatase activity is tedious and takes 4 days to complete. The results are difficult to reproduce with a wide scatter for controls and only one case and a control can be studied simultaneously. It is therefore not suitable for family studies. Of greater importance in this regard was our finding that ferrochelatase is normal in children of PV families (Chapter 1). The deficiency is only manifested after puberty. For these reasons ferrochelatase is not suitable for family studies, where the children are prepubertal.
The method used to measure PPO activity is relatively simple, reproducable and can be measured in leucocytes. At least 4 cases and a control can be studied simultaneously in two days. Therefore this enzyme is clearly more suitable for genetic studies.
As no single large family was available, we elected to study 7 families with PV.
Quantitative stool porphyrins were positive in all 8 propositi. Stools were negative in the fathers of the propositi in families 4 and 6, who were suspected on family history to carry the PV trait. In all 8 propositi PPO activity (nm/mg/prot/hr) was reduced by an average of ~ 50% (mean 3.7 range 2.04-4.8) as compared to controls (mean 6.45 range 5.7 - 7.29).
59.
There was no overlap between the patients and the controls but the number of people studied was small. The 2 suspected carriers mentioned above had reduced PPO activity (5.4 and 4.1 nmoles respectively). Sixteen prepubertal offspring were studied, in all of whom stools were negative for porphyrins. In 8 cases the PPO activity was reduced by “ 50%. Both sexes were equally affected. The results are in keeping with the concept that PV is inherited as an autosomal dominant disease.
The finding of reduced PPO activity in all PV cases, in 2 suspected carriers with negative stools and in 50% of their offspring does suggest that reduced PPO activity is a reliable method for identifying most if not all cases of PV and their offspring who could evolve at puberty into PV. Unlikeuro-porphyrinogen-l-synthetase in AIP (90) there was no overlap between controls and patients but the series was too small to be definitive.
It must however be pointed out that reduced PPO activity has also been found in (EPP) (71, Chapter 1) and the enzyme has not been measured in another porphyria or haematological disorder. In lead poisoning in particular where there is decreased activity of several enzymes along the haem biosynthetic pathway (including ferrochelatase) with raised red cell protoporphyrin, reduced PPO activity
60.
may also be found. Whilst reduced PPO activity is a good marker for PV cases, suspected carriers and their offspring who may develop PV at puberty, it is not specific. In particular when EPP is suspected, red cell and stool porphyrins must also be measured.
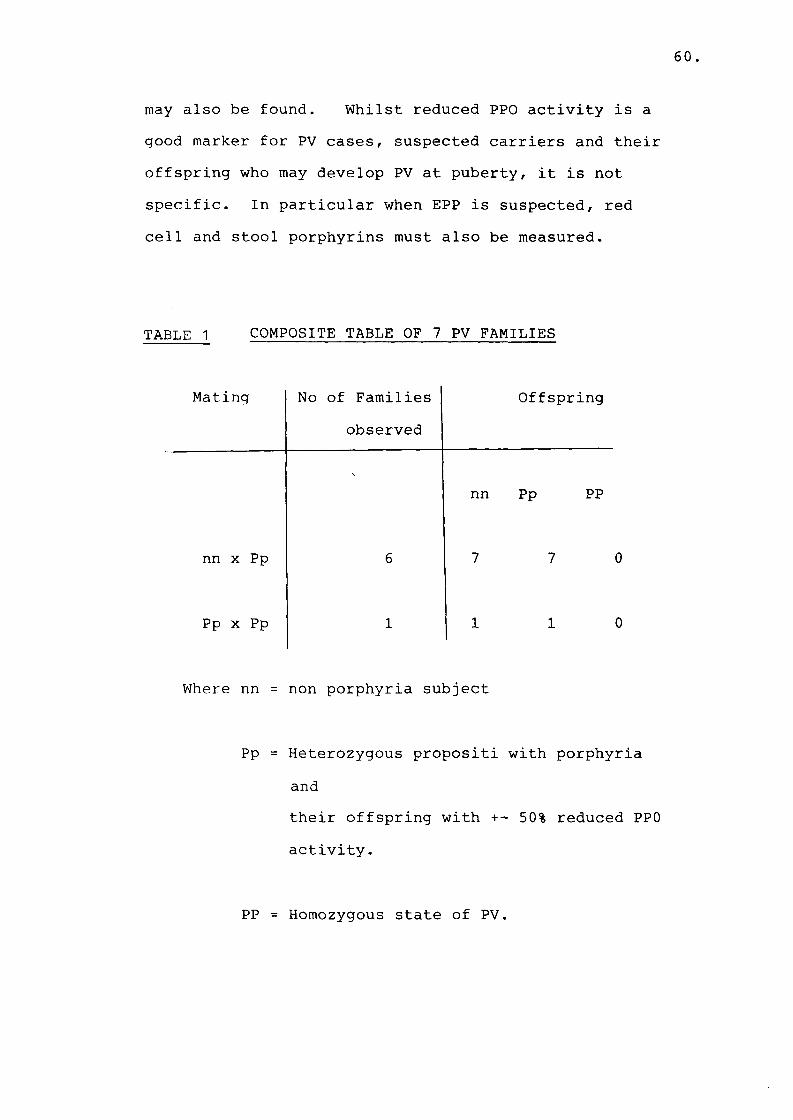
TABLE 1 COMPOSITE TABLE OF 7 PV FAMILIES
Mating No of Families observed
Offspring
'nn Pp PP
nn x Pp 6 7 7
Pp x Pp 11
1
Where nn = non porphyria subject
Pp = Heterozygous propositi with porphyria andtheir offspring with +- 50% reduced PPO activity.
PP = Homozygous state of PV.
CHAPTER 3
PURIFICATION OF FERROCHELATASE
62.
CHAPTER 3
Ferrochelatase (EC 4.99.1.1)
The terminal step in the haem biosynthetic pathway is the removal of two protons from and the insertion of iron into protoporphyrin to form haem. The enzyme ferrochelatase which catalyses this reaction has been detected in a wide variety of tissues and organisms and in all cases the activity has been associated with the mitochondrial membrane fraction. The insertion of iron into protoporphyrin can also take place in the absence of enzyme under certain conditions (102,103). In eukaryotes ferrochelatase is bound to the inner mitochiondrial membrane (104,105,106). It has been demonstrated that in bovine liver mitochondria, the active site for ferrochelatase is located on the matrix side of the inner mitochondrial membrane, while physically the enzyme spans the membrane with portions of the protein exposed on both sides of the membrane(107) . In plants, activity is found in chloroplasts(108) while in bacteria the enzyme is bound to the cytoplasmic membrane (109,110). Ferrochelatase utilizes protoporphyrin IX and other 2- carboxylate porphyrins, e.g. deutero-and mesoporphyrin as substrates in vitro (104,111,112). It also catalyses the insertion of Co^+,Zn^+ and Fe^+ into protoporphyrin IX; in fact Co^+ and Zn^+, are more
63.
efficient enzyme substrates than Fe^ + (113).Ferrochelatase will not insert Mg^+ or ferric iron(Fe^+) into protoporphyrin IX (108,109,110,114,115).Various rates of activity are found depending on themetal and porphyrin substrates used (111). In humanliver mitochondria, endogenous Zn^ + lowers the rate ofwhich ferrochelatase is able to add iron to protoporphyrin
2 +because of the enzyme's higher affinity for Zn (116).
Ferrochelatase has been purified to apparent homogeneity from a photosynthetic bacterium Rhodopseudomonas sphaeroides (117), chicken erythrocytes (118), rat liver (119) and bovine liver (120, 84).
Bovine ferrochelatase has a molecular weight of 42,500 as determined by SDS-gel electrophoresis and an apparent molecular weight of 200,000 as determined by gel filtration chromatography (Taketani et al., (120). Dailey et al., (84) however reported a molecular weight of 42,000 as determined by gel filtration chromatography indicating that the enzyme is a monomer under non-denaturing conditions. The pH optimum of the bovine enzyme reaction is pH 8 and mesoporphyrin and deuteroporphyrin are more active substrates than protoporphyrin (84). Enzyme activity with Fe^+assubstrate is inhibi-ted by metals such as Zn, Co, Cu or
64.
Mn and it is also inhibited by the end product, hemin. Phospholipids and fatty acids markedly stimulate chicken erythrocyte ferrochelatase (118) and are essential for rat ferrochelatase activity (119), although no stimulation was observed with bacterial enzyme (117) . Added lipids stimulate bovine ferrochelatase only slightly. This might be explained by the fact that endogenous lipid or exogenous detergent might be bound by the isolated enzyme in a way which could mask any stimulatory effects of added lipid (84) . Apparently detergents or phospholipids facilitate the solubilization of otherwise poorly soluble protoporphyrin and provide a similar environment as in the membrane for the enzyme to act under optimal conditions.
Two divalent cations, Hg2+ and Pb2 + were found to be strongly inhibitory, possibly due to their ability to interact with free sulfhydryl groups. Activity is also inhibited by sulfhydryl reactive compounds such as iodoacetamide and N-ethyl-maleimide. Reducing agents including glutathione, cysteine and dithiothreitol are indispensible in the ferrochelatase assay (84,117,120). It is believed that these reagents not only reduce ferric iron and maintain ferrous iron in the reduced state, but also protect the enzyme against auto-oxidation. It would appear that ferrochelatase contains sulfhydryl groups essential for enzymic activity. For instance reaction
65.
with [3H]-N-ethyl maleimide indicates that modification of a single sulfhydryl group is sufficient to inactivate ferrochelatase. It is protected from this inactivation by one substrate, ferrous iron, but not by the porphyrin substrate, indicating that ferrous iron binds to the sulfhydryl groups (121). From this observation as well as previous findings, i.e. the initial event in the enzyme reaction being iron binding, whereupon protoporphyrin binds and then haem is released prior to proton release (84), Dailey constructed an interesting model for the complete enzymic reaction: Iron binding to the enzyme is mediated through vicinyl sulfhydryl groups whereupon protoporphyrin binds and the two hydrogen protons of the porphyrin exchange for the molecule of ferrous iron, thus leaving the two released protons to associate with two cysteines which had previously bound the iron (Fig.l). However, this still leaves the question of the fate of the two protons that have to be released by the enzyme for the next iron molecule to be bound, unanswered. No chromophoric cofactors which could accommodate these protons were detected by visible spectral analysis of the purified enzyme preparation (84,119).
This chapter deals with the purification of bovine ferrochelatase according to the method used by Dailey and Fleming (84).
FIG. 1; Model for the active site of ferrochelatase and the role of sulfhydryl groups. PP is protoporphyrin and the porphyrin ring is shown as a planar square for diagrammatic
• simplification
67.
MATERIALS AND METHODS
1. Purification of ferrochelatase
All reagents and chemicals used were of the highest purity available. Buffers containing the following reagents were prepared in one liter of distilled and deionised water:
Buffer I (pH 8,1) 0,25 M sucrose 10 mM Tris-acetate 1 mM EDTA
Buffer C (pH 8,1) 20 mM Tris-acetate 1 mM DTT 10 ug/ml PMSF 20% glycerol 1M KC1
Buffer A (pH 8,1)20 mM Tris-acetate 1 mM DTT (dithiothreitol) 10 ug/ml PMSF 20% v/v glycerol 1% w/v Na-cholate
Buffer D (pH 8,1) 20 mM Tris-acetate 1 mM DTT 10 ug/ml PMSF 20% glycerol 0.5% Na-cholate
0,1 M KC1 1 M KC1
68.
Buffer B (pH 8,1) Buffer E (pH 8,1)20 mM Tris-acetate 20 mM Tris-acetate1 mM DTT 1 mM DTT10 ug/ml PMSF 10 ug/ml PMSF20% glycerol 1% Na-cholate1% Triton X-100 1,5M KC10,5M KC1
The pH of the buffer was adjusted to 8,1 with acetic acid before Na-cholate was added, since Na-cholate precipitates in the presence of acid.
Beef liver (1,5 kg) from a freshly slaughtered animal was cut into small pieces and immediately packed on ice. All subsequent procedures were carried out at 4 degrees C. The pieces were washed in 1,15% cold KC1 and then homogenized for five X 1 minute intervals with 4 volumes of buffer I in a Waring blender. Mitochondria were isolated by differential centrifugation (122) as outlined in Fig. 2. The mitochondria were washed twice in buffer I containing 10 ug/ml PMSF (phenylmethylsulfonylfluoride) and sonicated for two X 30 second intervals with a sonicator at 60W (setting 18). The resulting suspension was centrifuged at 100,000 Xg for 90 min to separate the mitochondrial membrane fraction from the soluble matrix fraction. The mitochondrial membrane fraction thus obtained was then suspended at a
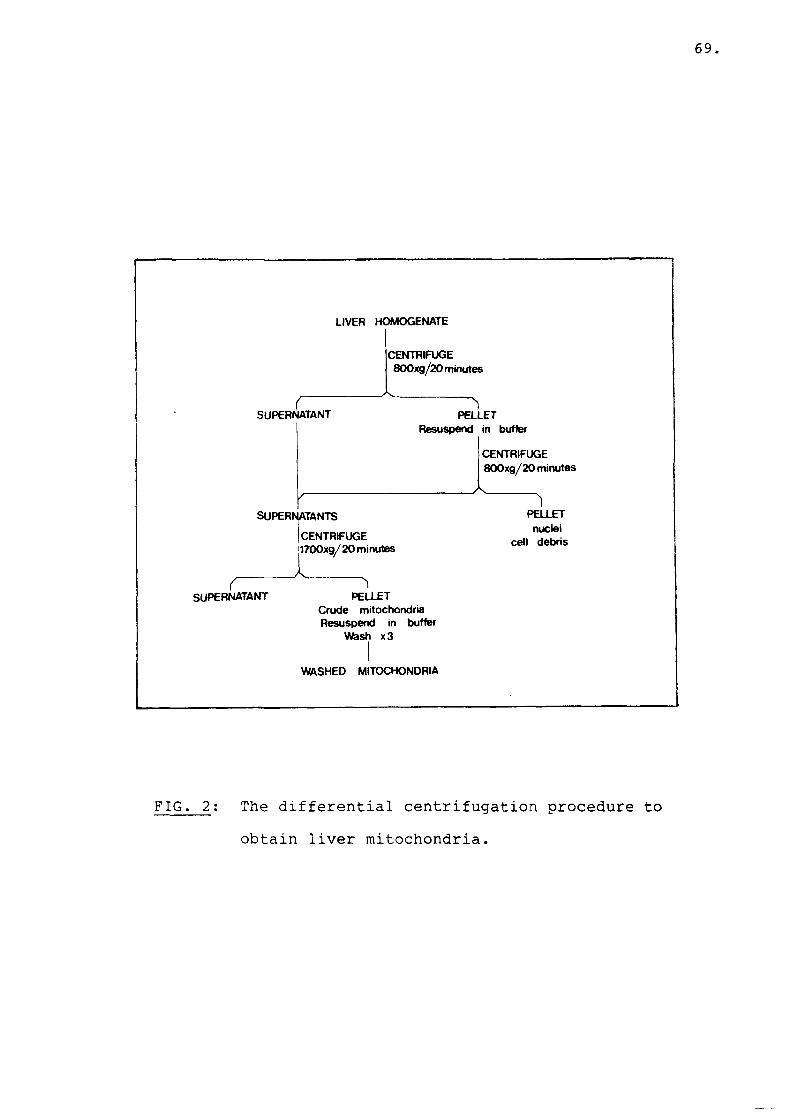
LIVER H O M O GEN ATE
CEN TR IFU G E 800xg/20 minutes
SUPERNATANT P E LLE TResuspend in buffer
CEN TR IFU G E 800xg/20 minutes
P ELLET nuclei
cell debris
/---------SUPERNATANTS
j C EN TR IFU G E 1700x9/20 minutes
< 'ISUPERN A TA N T P E LLE T
Crude mitochondria Resuspend in buffer
Wash x3
W ASH ED M ITOCHONDRIA
FIG. 2: The differential centrifugation procedure toobtain liver mitochondria
70.
concentration of + 40 mg/ml in buffer A. The mixture was stirred for 3 hours and then centrifuged at 100,000 Xg for 90 min to separate the solubilized enzyme from the membrane fragments. To the solubilized enzyme fraction, saturated ammonium sulfate solution (pH 8,0) was added to constitute 35% saturation. The following equation was used to calculate the volume of saturated salt solution to be added:
x X 538,46, where x represents the volume 1000
of enzyme suspension. The mixture was stirred for 15 min and then centrifuged at 10,000 Xg for 10 min.The pellet was discarded and the supernatant was further fractionated by the addition of saturated ammonium sulphate solution to yield a final concentration of 55% saturation. The following equation was used to calculate the volume of salt solution to be added. x X 444,44. The
1000solution was stirred for 15 min and then centrifuged at 10,000 Xg for 10 min. The pellet was dissolved ina minimal volume of buffer B (+ 50 ml). This enzyme solution was applied directly to a tandem set of columns composed of an initial Red Sepharose CL-6B (Pharmacia Fine Chemicals) column (1,5 x 20 cm) whose outlet was connected directly to a Blue Sepharose CL-6B (Pharmacia Fine Chemicals) column (2,5 x 30 cm). The red column served as a "pre-column" to bind
71 .
extraneous lipid material that contaminated the blue column when used alone. The red column matrix was discarded after six preparations. The flow rate during the application of sample was 20 ml/hr. The columns were first washed with 50 ml of buffer B, followed by 1 L of buffer C (flow rate 30 ml/min).The red column was then disconnected and elution from the blue column was continued with 1,5 L of buffer D (30 ml/min) or until no protein could be detected at 280 nm in the eluant. The enzyme was eluted from the column with 500 ml buffer E (20 ml/min). Fractions exhibiting ferrochelatase activity were combined (100 to 300 ml) and dialyzed for 24 hours (two changes of 5 L buffer), against 20 mM Tris-acetate buffer pH 8,1 containing 1 mM DTT and 20% glycerol. The dialyzed fraction was divided into aliquots and stored at -20 degrees C. To concentrate bovine ferrochelatase an aliquot (1 ml) was dialyzed for 24 hours against 2 L of 20 mM Tris-acetate buffer pH 8,1 and freeze dried.
2. Protein determination
Protein determinations on fractions that contained insolubilized membranes were done by the method of Lowry et al., (94).
72.
Reagents:
Solution A
2% Na2C030,05% sodium tartrate in 0,1M NaOH
Solution B
This solution was prepared just prior to use by mixing9 volumes of solution A with 1 volume 0,1% CuSO^ 51^0.
Folin Ciocalteu phenol reagent: (Merck) 1 ml Folin reagent was diluted with 2 ml H2 0 prior to use.
50 - 100 ul Protein sample was added to 5 ml solution B and allowed to stand at room temperature for 10 min. Folin reagent (0,5 ml) was added and the sample mixed immediately. After 30 min the absorbance was read at 500 nm on a Pye Unicam PU 8800 ultraviolet spectrophotometer. Bovine serum albumin (bsa) standards were included in each assay. The protein concentration of each sample was calculated from a standard curve obtained by plotting ug bsa (10 - 500 ug) against absorbance at 500 nm.
All other protein determinations were done with the Bio-Rad Protein Assay mixture (Bio-Rad Laboratories).10 ml Of the Bio-Rad Assay mixture was diluted with 40
73.
ml of water. 5 ml Of this solution was added to 50 - 100 ul protein sample, mixed and allowed to stand for 5 min. Absorbance was read at 595 nm and compared to a standard curve of bsa (10 - 500 ug) measured against absorbance at 595 nm.
3. Ferrochelatase assay
Ferrochelatase activity can be measured directly bythree different methods: (1) Formation of haem asdetermined by the pyridine haemochromogen assay(123). This method gives the most reliable resultsand greater sensitivity is obtained by usingmesoporphyrin IX instead of protoporphyrin IX assubstrate. The absorption peak of alkaline pyridinemesohaemochromogen is different from that ofprotohaemochromogen derived from pre-existing tissue
59 2 +haem (124). (2) Fe is used as substrate andradioactive haem is determined after the reaction (125). This is a tedious and expensive method. (3) Measurement of porphyrin disappearance by a dual wavelength spectrophotometer. A disadvantage of this method is that porphyrin disappearance might not always be synchronous with haem formation. For instance, it has been reported that in pig liver mitochondria, the disappearance of mesoporphyrin apparently preceeded the formation of haem by as much as 30 min (125) .
74.
Ferrochelatase activity was measured by the pyridine haemochromogen method (123) as modified by H. Dailey, (128,84). The final reaction volume was 1 ml and consisted of 50 mM Tris acetate, pH 8,1; 5 mM DTT; 0,2 mM ferrous ammonium citrate; 0,2% Triton X-100; 0,1 mM mesoporphyrin IX (Porphyrin Products, Logan, Utah) and the enzyme preparation. Mesoporphyrin IX was first dissolved in 0,1 M NH^ , adjusted to pH 8,1 with dilute HC1 and adjusted to the desired concentration with water.
The reaction was at 37 degrees C in the dark for 30min and was terminated by addition of 0,5 ml 50 mMiodo-acetamide. Then 360 ul of pyridine and 180 ulof NaOH (1M) was added. The mixture was dividedequally between two cuvettes and 0,7 mg Na 2S 2 0 wasadded to the one and 15 ul K.,Fe(CN) (3 mM) to thej 6other. Care was taken that the N ^ S 20 4 was fresh and kept dessicated. Heat inactivated enzyme preparation was used as control. The difference spectrum of the reduced and oxidized pyridine haemochromogen was recorded with a Pye Unicam PU 8800 UV/Vis spectrophotometer and haem was calculated as follows:
3Haem (nmoles) = 10 .V.A EA € mM
where V is the volume (ml) of alkaline pyridine solution and AE represents the difference in
75.
extintion between the maximum of the a band (547 nm for pyridine mesohaemochromogen) and the minimum occurring between the a and 3 bands (531 nm for
_ iemesohaemochromogen) . The value for AcmM forpyridine mesohaemochromogen is obtained as follows:547 ^.531tmM - mM = 21,7 (123). Ferrochelatase activityis expressed as nmoles haem formed per min per mg protein.
4. Gel electrophoresis
Polyacrylamide cylindrical gel electrophoresis in the presence of 0,1% sodium dodecyl sulphate (SDS) was carried out in 10% gels according to the method of Laemmli (129). Polyacrylamide gel electrophoresis (PAGE) in the presence of SDS, separates polypeptide chains according to their molecular weights (130) .
The following stock solutions were prepared:
1. 1,875 M Tris HC1 pH 8,82. 0,625 M Tris HC1 pH 6,83. 20% SDS (w/v)4. 30% acrylamide, 0,8% bis-acrylamide (w/v)
The following were mixed to prepare a 10% gel:
★ Extintion coefficient
76.
10 ml acrylamide stock solution 6 ml 1,875 M Tris HC1 pH 8,8 0,15 ml SDS stock solution 3 ml ammonium persulfate solution (1,5% w/v)1,5 ml N,N,N',N'-tetramethylenediamine (TEMED)(0,5% v/v)9,35 ml water
The mixture was degassed before addition of the crosslinking catalists ammonium persulfate and TEMED. The mixture was poured into glass tubes (12 x 0,5 cm) of which the bottom end was sealed with parafilm. The gels were overlayered with 50 ul water to produce a flat top. Gels were allowed to polymerize at room temperature and left to stand for 2 hours before use.
The following was mixed for the preparation of a 3% gel:
3 ml acrylamide stock solution 6 ml 0,625 M Tris HC1 pH 6,8 0,15 ml SDS stock solution3 ml ammonium persulfate solution (1,5% w/v)1,5 ml TEMED (0,5% v/v)16,35 ml water
77.
After removal of the overlayered water from the 10% gel, 3% gel was poured onto the 10% gel and overlayered with water. The final ratio of 10% gel to 3% gel was 3:1.
10 - 100 ug Of protein to be analyzed was incubated overnight at 37 degrees C, or boiled for 3 - 5 min in 100 - 200 ul of the following solution:
10 ml 0,625 M Tris buffer pH 6,8 10 ml SDS stock solution 10 ml glycerol 5 ml 2- mercaptoethanol
0,001 g bromophenol blue 65 ml water
Electrophoresis buffer was prepared as follows:
26,64 ml of 1,875 M Tris HC1 buffer, pH 8,8 10 ml stock SDS solution 28,827 g glycine
The volume was adjusted to two liters and the pH was adjusted to 8,3.
Electrophoresis buffer was poured into the cathode and anode tanks and 10 - 40 ug of solubilized protein was loaded onto each cylindrical gel by underlayering.An electrophoresis system manufactured by Shandon
78.
Scientific Company Limited, London, England was used. Proteins were electrophoresed at room temperature towards the anode using a constant voltage of 50 volts across the 3% gel for 1 hour and 110 volts across the 10% gel for 3 hours. The power supply was from Pharmacia Fine Chemicals, Uppsala, Sweden (electrophoresis constant power supply, ECPS 2000/300).
After electrophoresis the gels were removed from the tubes and the position of the tracking dye marked with Indian ink. The gels were stained and proteins fixed overnight with 0,25% Coomassie brilliant blue R250, dissolved in methanol/acetic acid/water (30:7:63 by volume). Destaining was achieved by several changes of methanol/acetic acid/water (30:10:60 by volume).
5. Determination of molecular weight (131)
The molecular weight of ferrochelatase was determined by comparing its electrophoretic mobility using polyacrylamide gel electrophoresis in 10% gels in the presence of SDS, with those of protein standards of known molecular weights. SDS-PAGE of ferrochelatase and protein standards was carried out as described in section 4. The molecular weight standards were: albumin, ovalbumin, carbonic anhydrase and trypsin inhibitor. The migration distances of the standards and ferrochelatase were measured respectively on the
gels and the relative migration (Rf) values were calculated, where Rf is defined as:
Rf = distance protein has migrated from origin distance from origin to reference point
The position of the tracking dye (bromophenol blue) was used as the reference point. A calibration curve was constructed by plotting the Rf values of the standards against the logarithms of their corresponding molecular weights. The point on the calibration curve which corresponded to the Rf value of ferrochelatase was located, and the value on the logarithmic scale corresponding to this point was the estimated molecular weight of ferrochelatase.
6. Preparation of antibody to bovine ferrochelatase
Antibodies against ferrochelatase were raised as follows (132): 0,5 mg/ml purified bovine ferrochelatase was emulsified with an equal volume of complete Freunds adjuvant (Difco Lab, Detroit, U.S.A.) and injected subcutaneously into two New Zealand rabbits (2-4 kg). Three further injections of 0,2 mg antigen emulsified with incomplete Freunds adjuvant were given at monthly intervals. 5 ml Blood was then collected from the ear vein at two weekly intervals and allowed to clot overnight. It was centrifuged at 400 Xg for 10 min and the serum was collected.
Antibody titer was determined with the enzyme linked immunosorbent assay (ELISA), using alkaline phosphatase labelled to goat antirabbit immunoglobulin G (Sigma St. Louis, U.S.A.) as conjugate (87). When the titre was satisfactory, 50 ml of blood was collected and the immunoglobulin G fraction was prepared.
7. Preparation of immunoglobulin G
The immunoglobulin fraction of ferrochelatase antiserum was prepared by the method of Harboe and Ingild, (133) , and modified as described by Anderson and Desnick, (49). Antibody was precipitated by the addition of 4 volumes saturated ammonium sulphate, pH7,0,to 6 volumes of rabbit serum. After stirring for 2 hours at 4 degrees C, the solution was centrifuged at 2,500 Xg for 20 min and washed twice with 1,5 M ammonium sulphate pH 7,0. Using this method, haemoglobin and albumin remain in the supernate and >90% of the IgG is recovered in the pellet (49). The pellet was resuspended in distilled water and extensively dialyzed against 5 mM potassium phosphate buffer, pH 7,4, containing 0,9% NaCl (5 changes of buffer in 5 days). The IgG fraction was divided into1,5 ml aliquots and stored at -20 degrees C.
81 .
8. Enzyme linked immunosorbent assay (ELISA) (134)
Because of the hydrophobic nature of ferrochelatase, it tends to form aggregates which makes it difficult to enter into gels under non-denaturing conditions or in the absence of detergents. Hence antibody detection by immunodiffusion or immunoelectrophoresis in agarose gels was unsuccessful. It was decided to use the enzyme-linked immunosorbent assay (ELISA) which is based on the same principles as a radioimmuno assay, except that an enzyme is used as a label for the antigen or antibodies instead of a radioisotope. The antigen (in this case ferrochelatase) is immobilized by passive absorption onto a solid phase (microtiter plate). Test rabbit sera are then incubated with the solid phase and antibody in the test sera becomes attached to the antigen on the solid phase. After washing to remove untreated serum components, a second antibody raised in goats against rabbit immunoglobulin G, linked to alkaline phosphatase is added and incubated. This will attach to rabbit immunoglobulin G already fixed to the antigen. Washing removes unreacted material and finally,substrate to alkaline phosphatase (para-nitrophenyl phosphate) is added which gives a stable yellow product. The substrate's colour change is a measure of the amount of conjugate fixed, and is proportional to the anti-ferrochelatase IgG level in the rabbit serum.
Methodology
0,25 ml Of ferrochelatase solution (10 ug/ml in 0,05 M NaHCO^ buffer pH 9,6), was added to some wells of a microtiter plate (Flow Laboratories, Irvine, Scotland) and left overnight at 4 degrees C. The plate was washed 3 times with phosphate buffered saline (pbs) containing 0,05% Tween 20 (M.A. Bioproducts, Walkersville, Maryland). Then 0,25 ml of ferrochelatase antiserum or IgG, diluted to desired concentrations with pbs containing 0,05% Tween 20 and 0,5% bovine serum albumin (bsa), was added to the wells and incubated in a moist chamber at room temperature for 2 hours. Non-specific reaction of IgG against the antigen or surface of the microtiter plate was minimized by the inclusion of 0,05% Tween 20 and 0,5% bovine serum albumin in the buffer (134,87). Antiserum and IgG of a non-immunized rabbit was used as negative controls. A well coated with 10 ug/ml bsa was used as blank against each well containing ferrochelatase. After washing 3 times with pbs containing 0,05% Tween 20; 0,25 ml of conjugate, diluted 1/1000 with pbs, 0,05% Tween 20, was added to each of the wells and incubated for 2 hours at room temperature.The wells were washed again and 0,25 ml of substrate to alkaline phosphatase was added. The following reagents were mixed to prepare the substrate solution: 12 ml distilled water, 3 ml diethanolamine
83.
buffer (5 x concentrate, M.A. Bioproducts) and 10 ml of a para-nitrophenyl phosphate solution (M.A. Bioproducts). The para-nitrophenyl phosphate (40 mg/vial) was dissolved in a solution of 2 ml diethanolamine buffer (5 x concentrate) and 8 ml E O. Optical density (0D 405 - 450 nm) of the reaction product was determined after 45 minutes on a Titertek Multiscan apparatus (Flow Laboratories).
RESULTS AND DISUSSION
A. Purification of bovine liver ferrochelatase
Table 1 summarizes the results of a typical purification of ferochelatase from 1 kg of bovine liver. The enzyme was purified 1006 fold with a 38% yield and appeared to be homogenous as displayed by a single band on a SDS-polyacrylamide gel (Fig.3).These results were similar to those of Taketani S. and Tokunaga R., (120) who obtained a yield of 31% over a434-fold purification of bovine ferrochelatase, whereas Dailey and Flemming (84) obtained a yield of 49% and 2000 fold purification. Loss of purificationi.e. the appearance of a second band on SDS polyacrylamide gels after continued reuse of the blue column was also found (84). The use of a red Sepharose CL-6B column (which was omitted by Taketani and Tokunaga, (120) was found to extend the life of the blue column (84). The purified enzyme was stable
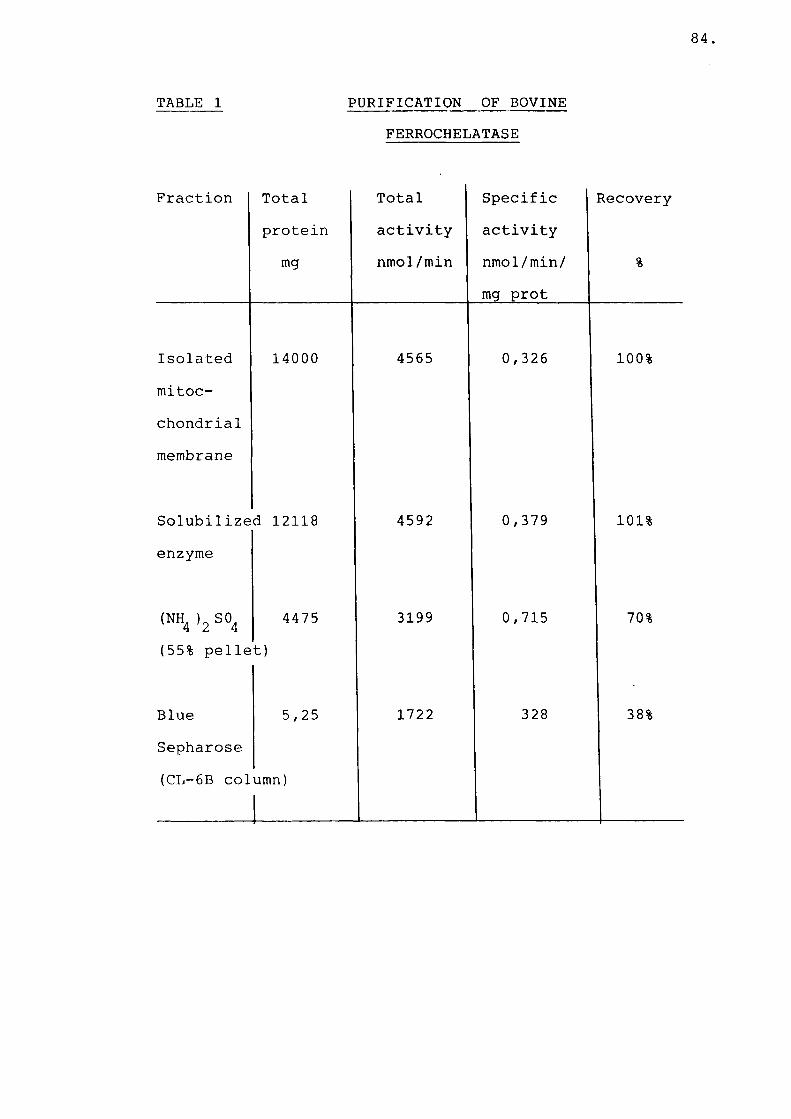
84
TABLE 1 PURIFICATION OF BOVINEFERROCHELATASE
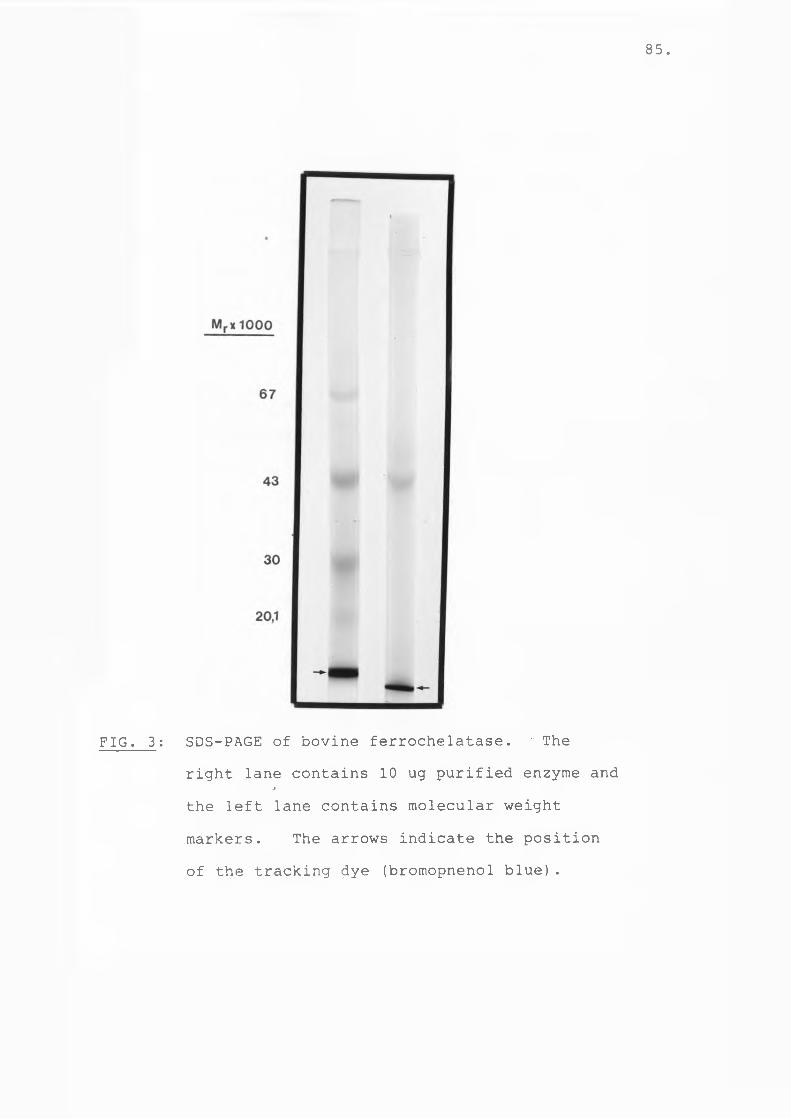
85.
FIG. 3: SDS-PAGE of bovine ferrochelatase. ' Theright lane contains 10 ug purified enzyme and
jthe left lane contains molecular weight markers. The arrows indicate the positionof the tracking dye (bromopnenol blue).
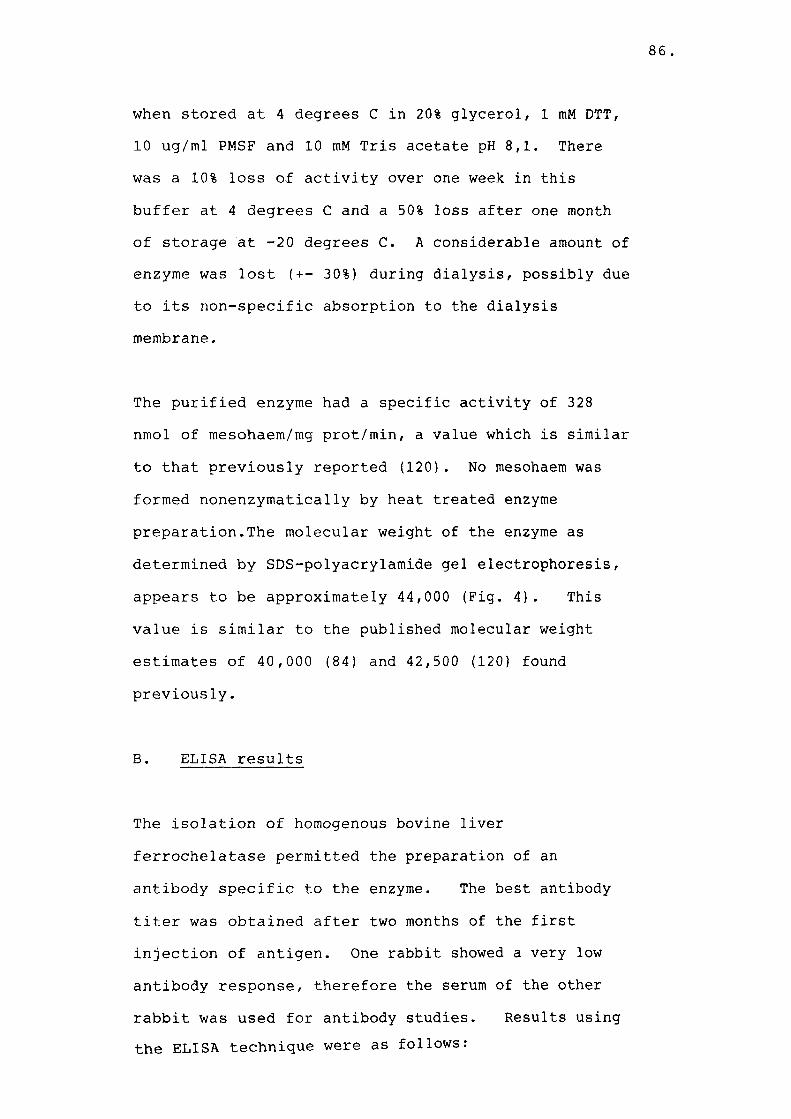
when stored at 4 degrees C in 20% glycerol, 1 mM DTT, 10 ug/ml PMSF and 10 mM Tris acetate pH 8,1. There was a 10% loss of activity over one week in this buffer at 4 degrees C and a 50% loss after one month of storage at -20 degrees C. A considerable amount of enzyme was lost (+- 30%) during dialysis, possibly due to its non-specific absorption to the dialysis membrane.
The purified enzyme had a specific activity of 328 nmol of mesohaem/mg prot/min, a value which is similar to that previously reported (120) . No mesohaem was formed nonenzymatically by heat treated enzyme preparation.The molecular weight of the enzyme as determined by SDS-polyacrylamide gel electrophoresis, appears to be approximately 44,000 (Fig. 4). This value is similar to the published molecular weight estimates of 40,000 (84) and 42,500 (120) found previously.
B. ELISA results
The isolation of homogenous bovine liver ferrochelatase permitted the preparation of an antibody specific to the enzyme. The best antibody titer was obtained after two months of the first injection of antigen. One rabbit showed a very low antibody response, therefore the serum of the other rabbit was used for antibody studies. Results using the ELISA technique were as follows:
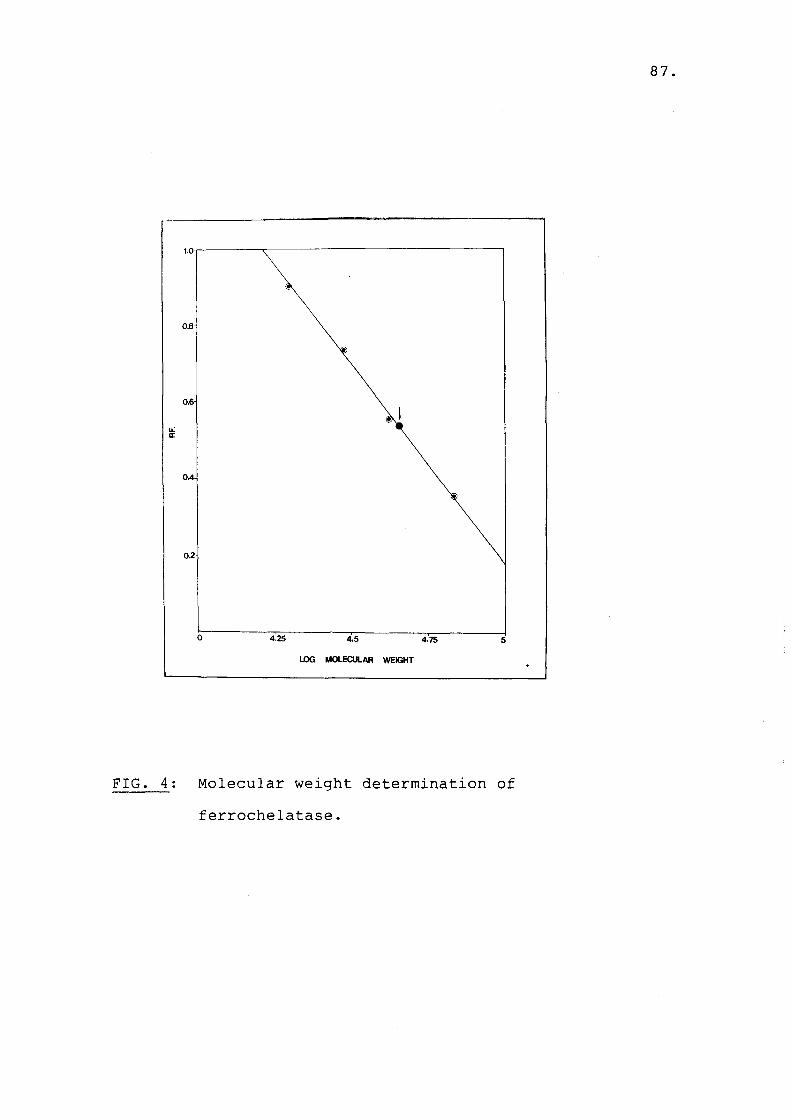
87.
FIG. 4: Molecular weight determination offerrochelatase.
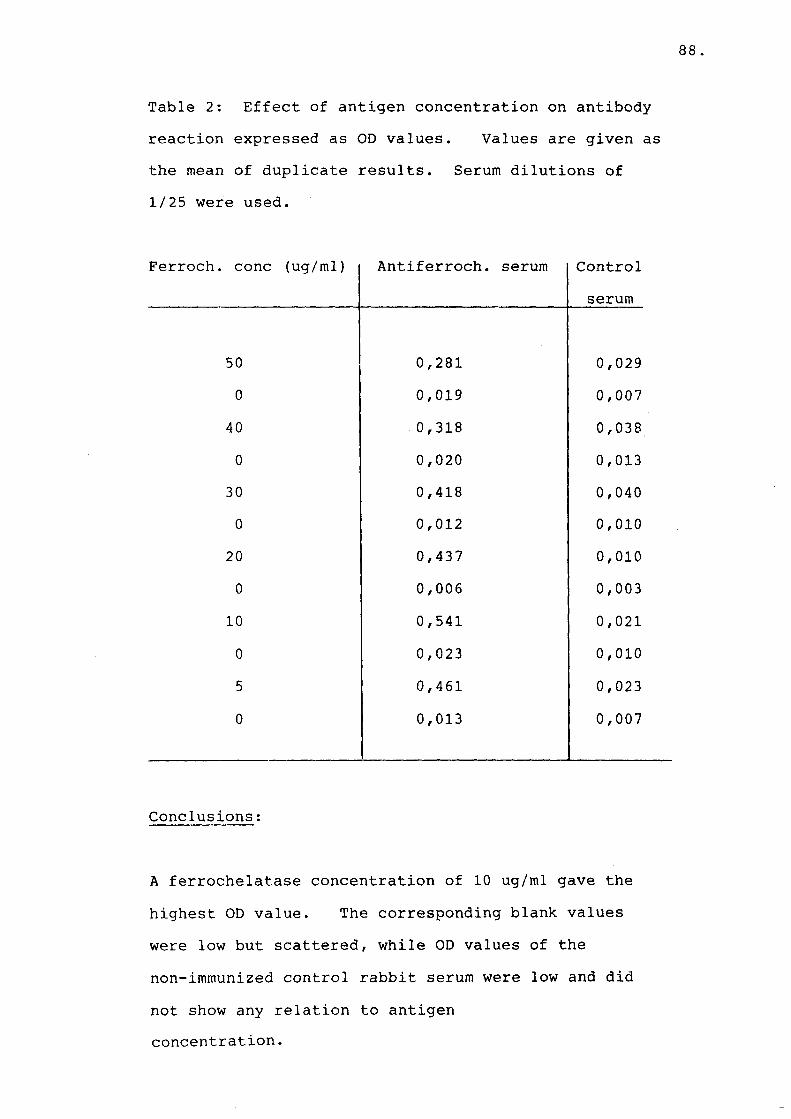
88.
Table 2: Effect of antigen concentration on antibody reaction expressed as OD values. Values are given as the mean of duplicate results. Serum dilutions of 1/25 were used.
Ferroch. cone (ug/ml) Antiferroch. serum Controlserum
50 0,281 0,0290 0,019 0,007
40 0,318 0,0380 0,020 0,01330 0,418 0,0400 0,012 0,01020 0,437 0,0100 0,006 0,00310 0,541 0,0210 0,023 0,0105 0,461 0,0230 0,013 0,007
Conclusions:
A ferrochelatase concentration of 10 ug/ml gave the highest OD value. The corresponding blank values were low but scattered, while OD values of the non-immunized control rabbit serum were low and did not show any relation to antigenconcentration.
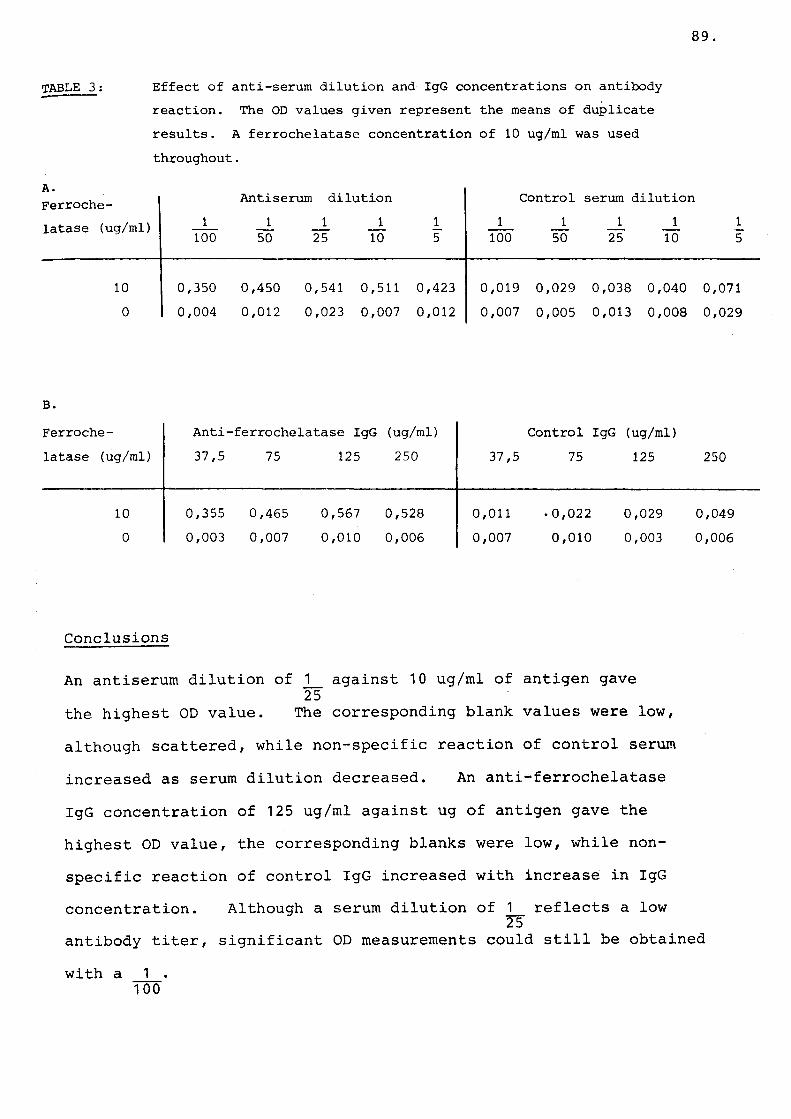
89.
TABLE 3: Effect of anti-serum dilution and IgG concentrations on antibodyreaction. The OD values given represent the means of duplicate results. A ferrochelatase concentration of 10 ug/ml was used throughout.
A.Ferrochelatase (ug/ml) 1
Antiserum dilution_L _1 JL 1_ 1
Control1
serum1dilution
1 1100 50 25 10 5 100 50 25 10 5
10 0,350 0,450 0,541 0,511 0,423 0,019 0,029 0,038 0,040 0,0710 0,004 0,012 0,023 0,007 0,012 0,007 0,005 0,013 0,008 0,029
Ferroche- Anti-ferrochelatase IgG (ug/ml) Control IgG (ug/ml)latase (ug/ml) 37,5 75 125 250 37,5 75 125 250
10 0,355 0,465 0,567 0,528 0,011 • 0,022 0,029 0,0490 0,003 0,007 0,010 0,006 0,007 0,010 0,003 0,006
Conclusions
An antiserum dilution of 1_ against 10 ug/ml of antigen gave25
the highest OD value. The corresponding blank values were low, although scattered, while non-specific reaction of control serum increased as serum dilution decreased. An anti-ferrochelatase IgG concentration of 125 ug/ml against ug of antigen gave the highest OD value, the corresponding blanks were low, while nonspecific reaction of control IgG increased with increase in IgGconcentration. Although a serum dilution of 1_ reflects a low25antibody titer, significant OD measurements could still be obtainedwith a 1 .
100
CHAPTER 4
PURIFICATION OF PROTOPORPHYRINOGEN OXIDASE
CHAPTER 4
Protoporphyrinogen oxidase (PPO) (EC 1.3.3.4)
The oxidation of protoporphyrinogen IX to protoporphyrin IX proceeds nonenzymatically under certain conditions. However evidence has accumulated that the reaction is enzyme dependent in all cells having aerobic metabolism (135-136). An enzyme that catalyses the oxidative removal of six hydrogens from protoporphyrinogen has been identified in yeast (135), E.coli (139,140), rat liver (86), human fibroblats, -erythrocytes,-leucocytes (70,71,72), beef liver (141) and barley mitochondria (136) . The enzyme responsbile for the oxidation of protoporphyrinogen was found to be anchored within the lipid bilayer of the inner mitochondrial membrane of rat liver mitochondria (142) with its catalytic site situated within the core of the inner membrane, being equally accessable to its substrate from both sides of the membrane. It has been shown that rat protoporphyrinogen oxidase is not translated on mitochondrial ribosomes, in contrast to that reported for yeast enzyme (143), but in the cytoplasma (144), inferring that the genes coding for rat and yeast enzyme have different locations.
PPO has been purified to 30 - 40% purity from rat liver (86) . It has been shown to be a monomer with molecular weight of 35,000, Km of 11 uM, pH optimum
92.
for the enzyme reaction at pH 8,7 and oxygen as the electron acceptor. The enzyme partially purified from yeast had a molecular weight of 180,000,Km of 4,8 uM and pH optimum of 7,45 (135). Partially purified human PPO had a pH optimum of 7,2, molecular weight of32,000, Km of 0,16 uM for protoporphyrinogen IX and showed substrate inhibition by excessprotoporphyrinogen. The human enzyme was also able to catalyse mesoporphyrinogen IX to mesoporphyrin IX (145). Rat PPO does not catalyse the oxidation of coproporphyrinogen I, coproporphyrinogen III or uroporphyrinogen I.
Unsaturated fatty acids especially oleic acid stimulate partially purified barley PPO, suggesting that chromatographic treatment removes a lipid factor for which oleic acid could substitute (136). Since the enzymic conversion of protoporphyrinogen IX to protoporphyrin IX is not inhibited by cyanide, 2,4 dinitrophenol or azide, disulfide bonds are not essential for activity (135). There is however, evidence that sulfhydryl groups might play a catalytic role in the enzymic reaction mechanism. The enzyme was protected against inhibition byp-hydroxymercuribenzoate (a sulfhydryl blocking agent) in the presence of reduced glutathione (a sulfhydryl reducing agent) or protoporphyrinogen IX, but not by coproporphyrinogen III. This suggests that one or both of the vinyl side chains of protoporphyrinogen
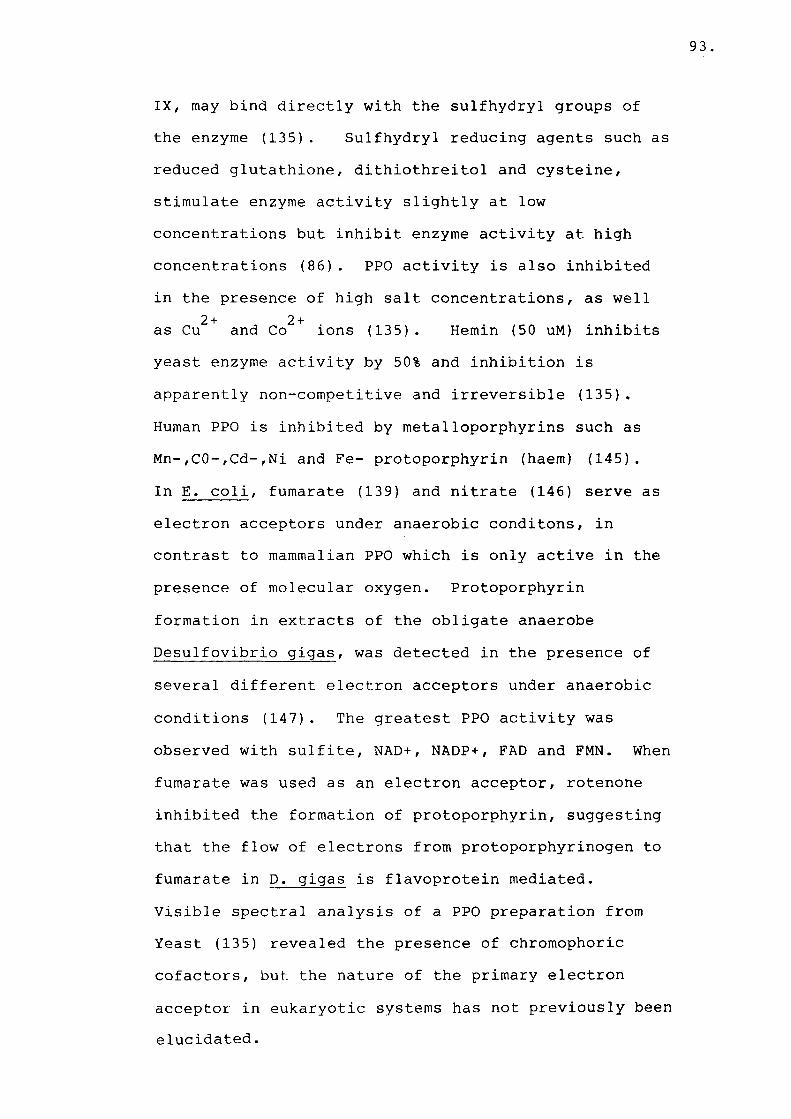
93.
IX, may bind directly with the sulfhydryl groups ofthe enzyme (135) . Sulfhydryl reducing agents such asreduced glutathione, dithiothreitol and cysteine,stimulate enzyme activity slightly at lowconcentrations but inhibit enzyme activity at highconcentrations (86). PPO activity is also inhibitedin the presence of high salt concentrations, as well
2 + 2 +as Cu and Co ions (135). Hemin (50 uM) inhibits yeast enzyme activity by 50% and inhibition is apparently non-competitive and irreversible (135). Human PPO is inhibited by metalloporphyrins such as Mn-,C0-,Cd-,Ni and Fe- protoporphyrin (haem) (145).In E. coli, fumarate (139) and nitrate (146) serve as electron acceptors under anaerobic conditons, in contrast to mammalian PPO which is only active in the presence of molecular oxygen. Protoporphyrin formation in extracts of the obligate anaerobe Desulfovibrio gigas, was detected in the presence of several different electron acceptors under anaerobic conditions (147). The greatest PPO activity was observed with sulfite, NAD+, NADP+, FAD and FMN. When fumarate was used as an electron acceptor, rotenone inhibited the formation of protoporphyrin, suggesting that the flow of electrons from protoporphyrinogen to fumarate in D. gigas is flavoprotein mediated.Visible spectral analysis of a PPO preparation from Yeast (135) revealed the presence of chromophoric cofactors, but the nature of the primary electron acceptor in eukaryotic systems has not previously been elucidated.
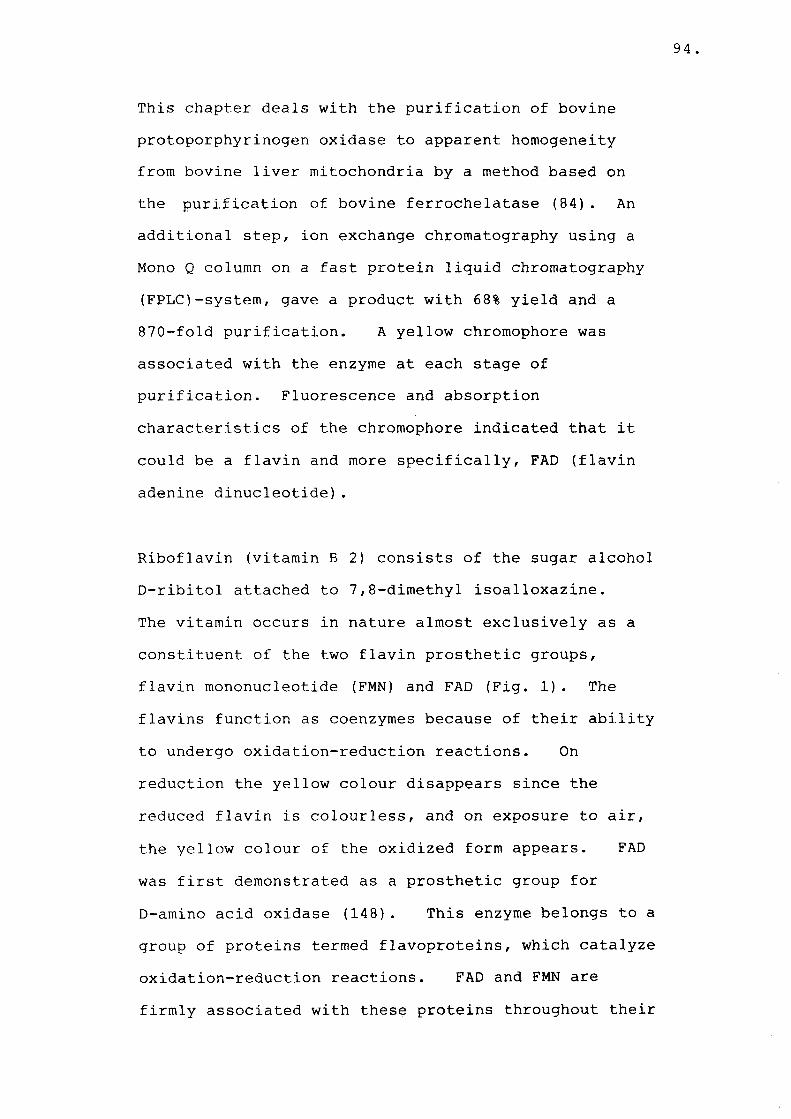
This chapter deals with the purification of bovine protoporphyrinogen oxidase to apparent homogeneity from bovine liver mitochondria by a method based on the purification of bovine ferrochelatase (84). An additional step, ion exchange chromatography using a Mono Q column on a fast protein liquid chromatography (FPLC)-system, gave a product with 68% yield and a 870-fold purification. A yellow chromophore was associated with the enzyme at each stage of purification. Fluorescence and absorption characteristics of the chromophore indicated that it could be a flavin and more specifically, FAD (flavin adenine dinucleotide).
Riboflavin (vitamin B 2) consists of the sugar alcohol D-ribitol attached to 7,8-dimethyl isoalloxazine.The vitamin occurs in nature almost exclusively as a constituent of the two flavin prosthetic groups, flavin mononucleotide (FMN) and FAD (Fig. 1). The flavins function as coenzymes because of their ability to undergo oxidation-reduction reactions. On reduction the yellow colour disappears since the reduced flavin is colourless, and on exposure to air, the yellow colour of the oxidized form appears. FAD was first demonstrated as a prosthetic group for D-amino acid oxidase (148). This enzyme belongs to a group of proteins termed flavoproteins, which catalyze oxidation-reduction reactions. FAD and FMN are firmly associated with these proteins throughout their
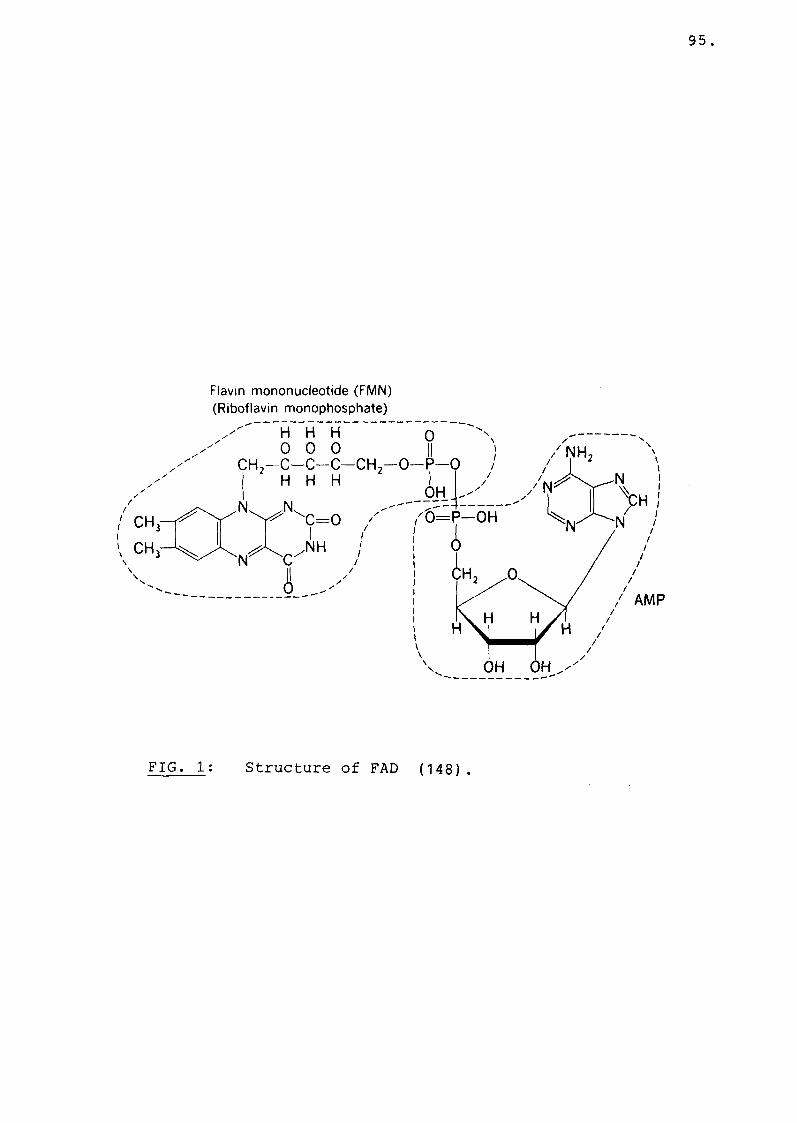
95.
Flavin mononucleotide (FMN) (Riboflavin monophosphate)
FIG. 1: Structure of FAD (148).
96.
purification. In fact, the flavin groups are usually only separated from the apo-enzyme by acid treatment or boiling (148). Many flavoproteins react directly with molecular oxygen to produce H 2 O . If the flavoprotein has a single flavin prosthetic group, the flavin moiety will be completely reduced by substrate and then reoxidized by C>2 .
SH2 + Enz - FAD _____ S + Enz - FADH2
Enz - FADH2 + 02_____ Enz - FAD + H2 02 (148)
Binding of a flavin to a protein often drastically changes its fluorescence and absorbance characteristics (152) and could also influence its reaction with molecular oxygen.
MATERIALS AND METHODS
1. Purification of protoporphyrinogen oxidase
All preparations were done at 0 - 4 degrees C. Purification of PPO was carried out based on the method of Dailey and Flemming, (84). The method was followed exactly as described in Chapter 3, section one, up to the 55% ammonium sulphate fractionation.
The 55% ammonium sulphate precipitate was dissolved in the following buffer to a concentration of
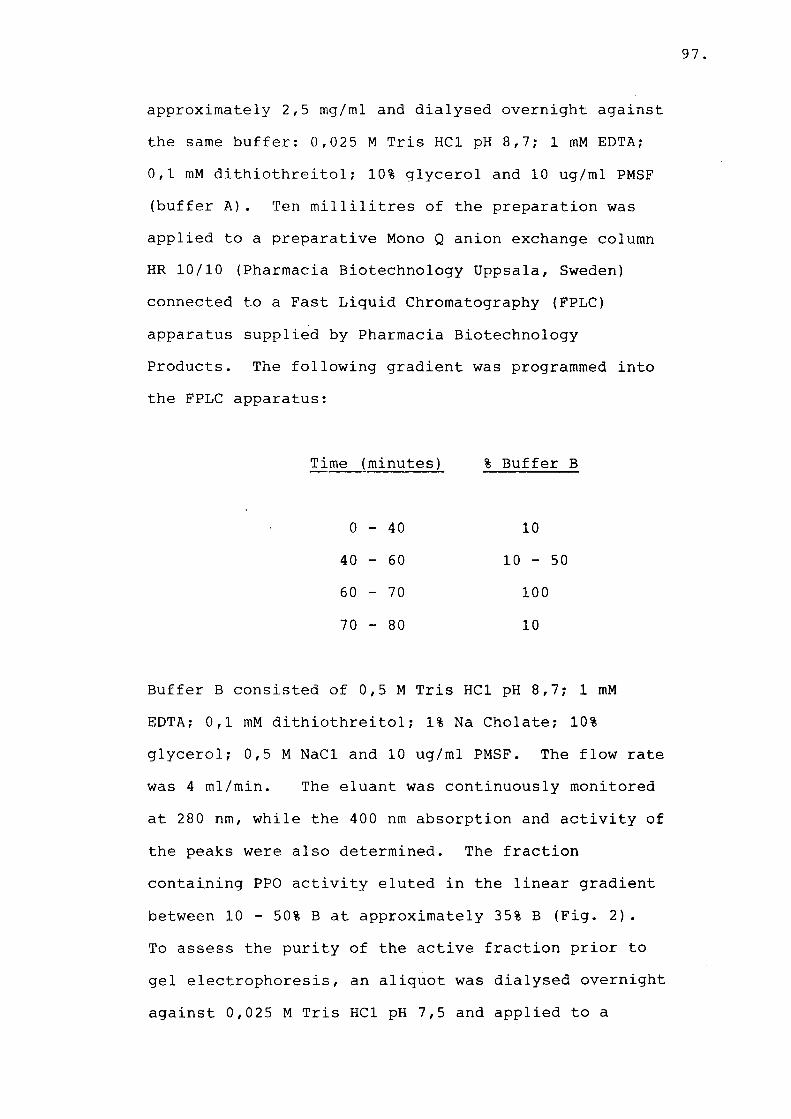
97.
approximately 2,5 mg/ml and dialysed overnight against the same buffer: 0,025 M Tris HC1 pH 8,7; 1 mM EDTA; 0,1 mM dithiothreitol; 10% glycerol and 10 ug/ml PMSF (buffer A). Ten millilitres of the preparation was applied to a preparative Mono Q anion exchange column HR 10/10 (Pharmacia Biotechnology Uppsala, Sweden) connected to a Fast Liquid Chromatography (FPLC) apparatus supplied by Pharmacia Biotechnology Products. The following gradient was programmed into the FPLC apparatus:
Time (minutes) % Buffer B
0 - 40 1040 - 60 10 -60 - 70 10070 - 80 10
Buffer B consisted of 0,5 M Tris HC1 pH 8,7; 1 mM EDTA; 0,1 mM dithiothreitol; 1% Na Cholate; 10% glycerol; 0,5 M NaCl and 10 ug/ml PMSF. The flow rate was 4 ml/min. The eluant was continuously monitored at 280 nm, while the 400 nm absorption and activity of the peaks were also determined. The fraction containing PPO activity eluted in the linear gradient between 10 - 50% B at approximately 35% B (Fig. 2).To assess the purity of the active fraction prior to gel electrophoresis, an aliquot was dialysed overnight against 0,025 M Tris HC1 pH 7,5 and applied to a
MOO
98
o o o
9 %o o o o o o
O)_ J ___
CO1
t"-___1___
co m ___i_______t______1___
CO___ 1___
CV■ ■■ i, - - - -L
TCNJ
(iuuo82) aoNvauosav
ProRPC HR 5/10 reverse phase column (Pharmacia Biotechnology) connected to a FPLC apparatus. It was eluted with a linear gradient of 50% acetonitrile, 0,025 M Tris HC1 pH 7,5 buffer. The flow rate was 1 ml/min.
2. Protein determinations
Protein determinations were done as described in Chapter 3, section 2 (Lowry and Biorad).
3. Protoporphyrinogen oxidase assay
PPO assays were done as described in Chapter 1, section 4, except that after one hour of incubation, 100 ul of the reaction mixture was added to 2,9 ml of buffer (section 4.2) to determine fluorescence in a 3 ml cuvette (pathlength 10 mm).
To test for the effects of various compounds on enzyme activity, the compounds were added to the reaction mixture 5 min. before the addition of substrate and enzyme activity was determined after one hour. Heat inactivated enzyme incubated with the same amount of compound served as control for each determination.
100.
4. Gel electrophoresis
SDS-polyacrylamide gel electrophoresis was done as described in Chapter 3, section 4.
5. Determination of molecular weight
5.1 Determination of molecular weight by SDS-gel-electrophoresis was done as described in Chapter 3, section 5. The molecular weight standards used were albumin, ovalbumin, trypsin inhibitor anda -lactalbumin.
5.2 Molecular weight determination by gel filtration
The use of gel filtration chromatography for the determination of molecular weight and size of proteins is based on the ability of gel filtration media, such as Sephadex to separate molecules according to size. This determination is carried out by comparing an elution volume parameter (e.g. Kav) of the substance of interest, with the values obtained for several known calibration standards. A calibration curve is prepared by measuring the elution volumes of several substances, calculating their corresponding Kav values and plotting it versus the logarithm of their molecular weight. The molecular weight of the unknown substance can then be determined from the calibration curve, once its Kav value is calculated from its measured elution volume (149).
101 .
A Sephadex G200 (Pharmacia Fine Chemicals) column (1,9 cm x 25 cm) was packed and equilibrated (flow rate = 9 ml/hour) with equal volumes of buffer A and B. The bed volume (Ve) was 74,6 ml. A solution of Blue Dextran 2000 (500 ul of a 1 mg/ml solution) was applied to the column to determine the void volume (Vo) and to check the column packing. Vo was 8,2 ml. Molecular weight standards (5 mg/ml each) were dissolved together in 1 ml equilibration buffer and 500 ul was applied to the column. The elution volume (Ve) in the same buffer of each of the standards was measured and the Kav was calculated:
Kav = Ve - V0 Vt - V0
The molecular weight standards used were ribonuclease, chymotrypsin, ovalbumin and albumin. 500 ul Of PPO (0,2 mg/ml) in equilibration buffer was then applied to the column and the Ve determined. (The elution positions of the respective proteins were determined by monitoring the eluant at 280 nm)
6. Preparation of antibodies to protoporphyrinogen oxidase
Antibodies were raised against 90 - 95% pure PPO, the IgG fraction of the antiserum prepared and antibody titre determined as described in sections 6, 7 and 8 of Chapter 3.
7. Affinity purification of anti-PPO IgG (150)
A homogenous preparation of PPO was covalently attached to CNBr-activated Sepharose 4B (Pharmacia Fine Chemicals). Proteins couple to CNBr-activated Sepharose-4B via their primary amino groups or similar nucleophylic groups (150). Anti-PPO IgG was then passed through the column, unbound material was washed away and the bound IgG was desorbed by a change in pH of the buffer.
A. Coupling of PPO
lg of freeze dried CNBr-activated Sepharose-4B was washed and reswollen on a scintered glass filter with 1 mM HC1 (1 g gives 3,5 ml swollen gel). PPO was dissolved in NaHCO^ buffer (0,1M, pH 8,3) containing 0,5M NaCl to a concentration of 1 mg/ml. The protein was mixed with the gel suspension and rotated end-over-end for two hours at room temperature. Residual active groups remaining on the gel after coupling were blocked with 0,2M glycine pH 8,0 (two hours at room temperature). To remove excess uncoupled ligand the gel was washed alternatively with high and low pH buffer solutions, four or five times (0,1M NaHCO^ buffer pH 8,3 and 0,1M Na-acetate buffer pH 4, both containing 0,5M NaCl). A column ( 1 x 5 cm) was packed and equilibrated in 5mM potassium phosphate buffer pH 7,4, containing 0,9% NaCl.
B . Purification of IgG
3 ml Of concentrated anti-PPO IgG (1 mg/1 ml) in 5mM potassium phosphate buffer pH 7,4 was applied to the column and left for two hours at room temperature. Unbound material was washed away with the same buffer until no protein was detected in the eluant at 280 nm. IgG bound to PPO was desorbed from the column with 0,2M glycine pH 2,7. The pH of the eluted IgG was immediately adjusted to pH 7,4 with 0,1M NaOH.This procedure was repeated four or five times and the IgG was concentrated by freeze drying.
8. Studies on the chromophore
A. Determination of fluorescence spectra
A1. Fluorescence of the chromophore during the enzyme reaction.
The enzyme was concentrated by passing the dilute purified sample in buffer A through an analytical Mono Q anion exchange column and eluting it with a gradient of buffer B. Purified, concentrated PPO (0,1 mg/ml) was dialysed overnight against lOOmM Tris HC1 pH 8,7. Protoporphyrinogen (5 uM) was incubated with three milliliters of PPO in the dark at 37 degrees C, EDTA, DTT, glutathion and Tween 20 were excluded in the reaction mixture. Protoporphyrin synthesis was
104.
measured against the inactivated enzyme as the control at different time intervals. Fluorescence excitation and emission spectra were also obtained from these aliquots and compared to that of FAD and FMN.
A2. Enzymatic digestion
The chromophore was released by trypsin digestion as previously described (151). The enzyme preparation was shielded from direct light during the treatment described below. Trypsin (0,07 mg) was added to 5 ml purified PPO (0,14 mg/ml) which had been dialyzed against 0,025M barbital sodium acetate buffer pH 8,0, freeze dried and reconstituted with the same buffer. After addition of a few drops of toluene, the mixture was placed in a thermostated waterbath at 45 degrees C for 4 hours, cooled and the pH adjusted to 4 with acetic acid. It was then heated to 80 degrees C for enzyme inactivation (5 min) and cooled to room temperature.
After oxygen was bubbled through the mixture for 30 min the fluorescence excitation and emission spectra were determined on a Perkin Elmer 203 fluorescence spectrophotometer. These spectra were compared tothe fluorescence excitation and emission spectra of
- 7 .oxidized FAD (10 M) in 0,025M barbital sodiumacetate pH 4. Concentrated HC1 (50 ul) was then added to the oxidized digested preparation to hydrolyse the
105.
phosphate bonds of any FAD that might be present, which is then converted to FMN (151) . It was boiled for 15 minutes, cooled and the pH adjusted to 4 with 5M sodium acetate solution. The fluorescence intensity at 520 nm (Aexc 465 nm) was measured and compared to that of the non-hydrolysed tryptic released chromophore.
A3. Acid hydrolysis
The chromophore was liberated from the enzyme by hydrolysing 0,14 mg of enzyme in 2 ml of 0,025M barbital sodium acetate pH 8,0 buffer, with 0,2 ml HC1 (cone) for 45 min at 95 degrees C. It was cooled to room temperature, the pH adjusted to 4, treated with oxygen for 30 min, and the fluorescence determined.All the fluorescence spectra were obtained at room temperature.
B. Purification of the chromophore and determination of absorption
The chromophore was released from the purified enzyme (0,5 mg/ml) with trypsin in 0,1M phosphate buffer pH8,0. After it was treated with oxygen for 30 min,200 ul of the preparation was applied to an analytical Mono Q anion exchange column HR 5/5 (Pharmacia) connected to a Pharmacia FPLC apparatus. The column
106.
was equilibrated with 0,1M phosphate buffer pH 8,0. Elution of the sample was isocratic at a flow rate of 1 ml/min. (the bed volume of the column was 1 ml).The eluant was monitored at 280 nm and absorption spectra were obtained of the peaks. The retention times of the peaks were compared to that of oxidized FAD and FMN (10 ug/ml) obtained from Sigma, St. Louis, U.S.A. Absorption spectra (at room temperature), of the peaks were compared to those of oxidized and reduced FAD and FMN, using a Pye Unicam PU 8800 UV/Vis spectrophotometer. Reduction was with lOug of solid KBH4 added to 1ml of the solution under anaerobic conditions.
RESULTS
A. Purification of PPO
The enzyme was purified to apparent homogeneity (Fig. 3) from bovine liver mitochondria. It also eluted as a single peak off the reverse phase column at + 20% acetonitrile. The final yield was 68% with a 870-fold purification (Table 1). PPO activity decreased by 50% after three months storage at -20 degrees C, or after two weeks at 4 degrees C in buffer A. This loss in activity might be due to proteolytic activity, which also occurs in the case of purified ferrochelatase (117) even in the presence of PMSF.When the enzyme was dialyzed to remove salt and
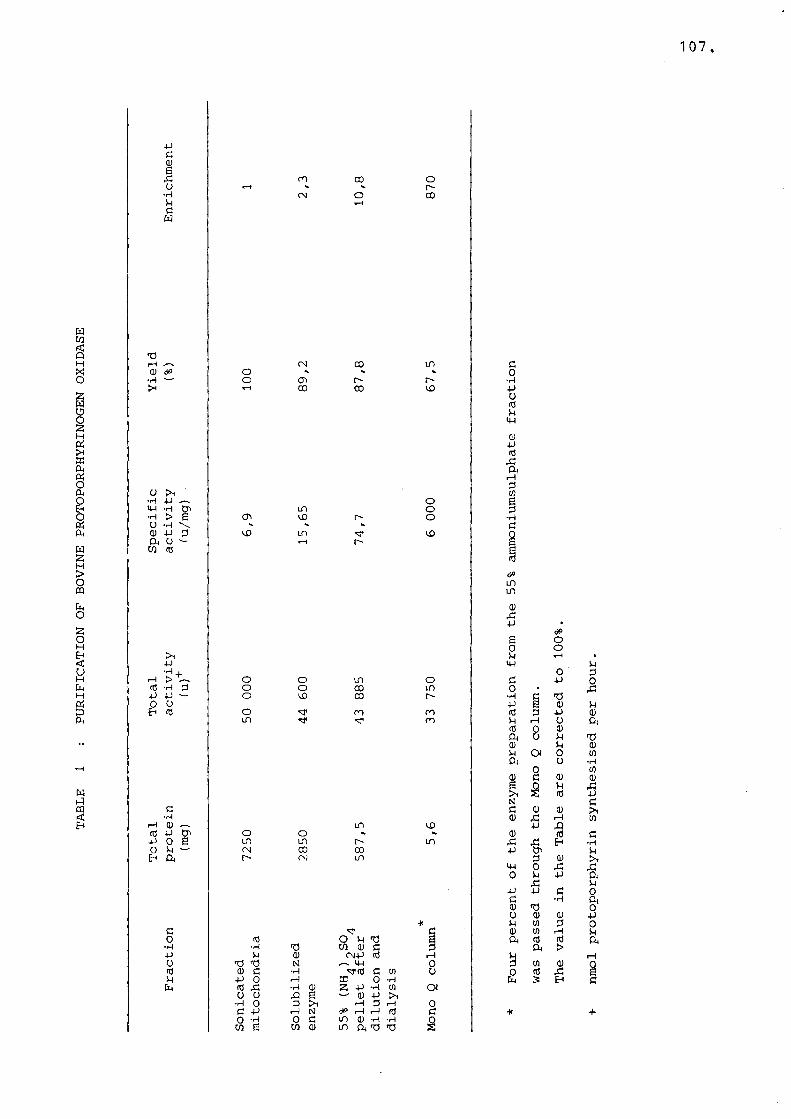
TABL
E 1
: PU
RIFI
CATI
ON O
F BO
VINE
PROTOPO
RPHY
RINO
GEN
OXIDASE
107
4-JG(Ue.c co CO oo rH «* •»•H CN o COU rHcw
TJrH CN CO in<U dP O •fc •k•rH o cr> r- r->H rH 00 CO ID
O >1 '•H •p ~ o<JH •H tJ' LO o•H > 6 CT\ KD r* oU •H \ •* •» ««.0) 4-) G lO LT) COOi O - rH r-cn rd
t>i•PrH >+~ O o in ord •H P O o 00 in-P -P — O lO CO0 Ord O CO COin CO
c•Hf—i 0) LO 10rd P Cn o o *»P 0 B in in r- LOo P CN CO COEh a r*' CN m
*c G0 td O m d §•H •H to CO Q) G p4J U d) CN-P fd rH0 to to N ^ MH 0fd Q) G •rH Tfd G w uu •P 0 rH EC 0 -HUa cd ,G •H Q) 2 H H (fl ao o .Q B 0) -P >i•H 0 P >i rH P pH 0C -p rH N rff H H (U G0 -H 0 G in 0) *H -H
cn 6 CO CD in 04 T3 TO S
c0
pordP4H
3Prd
43a.rH3mB3
•H
1<SPlnin
343P •
<*>S O0 Op rH •MH P
0 3d p 00 • 43•H c T!p j3 3 Prd 3 P 3p rH a a3 0 3a 0 P "O3 P 3p OI 0 05a o -H
0 053 c 3 3s o P 43
s 3 PN dC 3 3 >i3 43 rH 05
P 4Q3 rd d
43 43 Eh •Hp tn P
3 3 tPp 0 43 430 P P a
43 pp P C 0c •rH a3 *0 03 3 3 pP W 3 03 05 rH pa rd (d aa >p rH3 05 3 00 rd 43 Ba 5 Eh d
* +
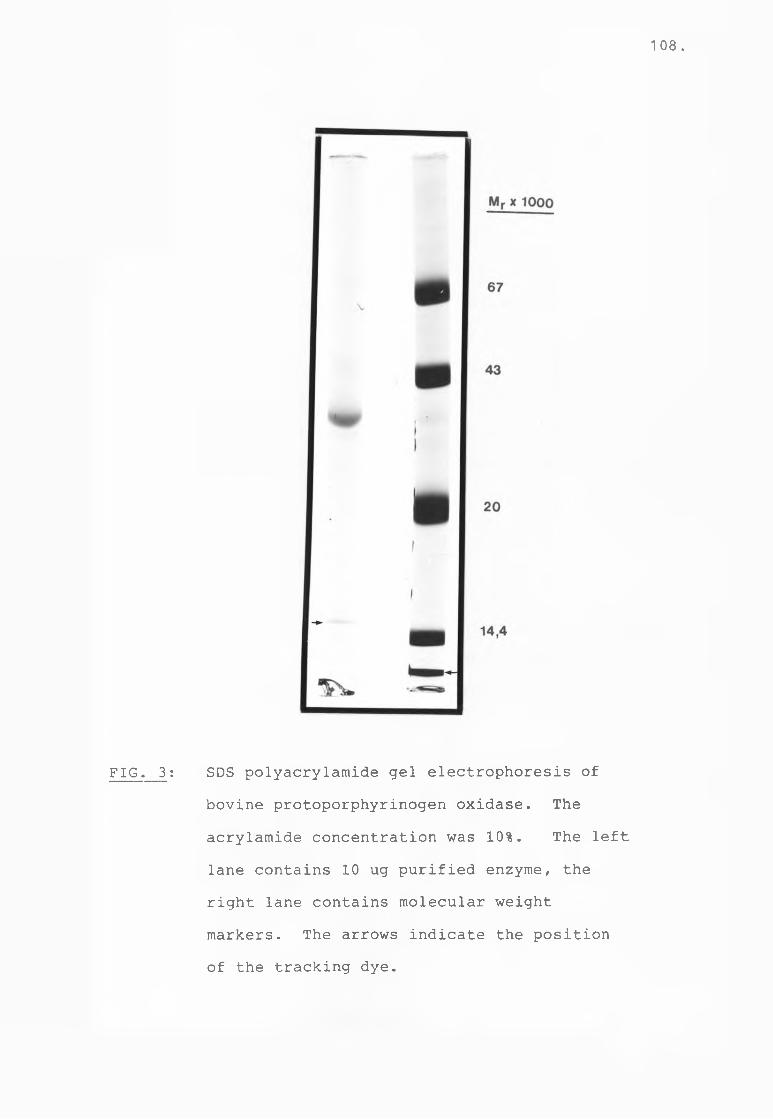
108.
FIG. 3: SDS polyacrylamide gel electrophoresis ofbovine protoporphyrinogen oxidase. The acrylamide concentration was 10%. The left lane contains 10 ug purified enzyme, the right lane contains molecular weight markers. The arrows indicate the position of the tracking dye.
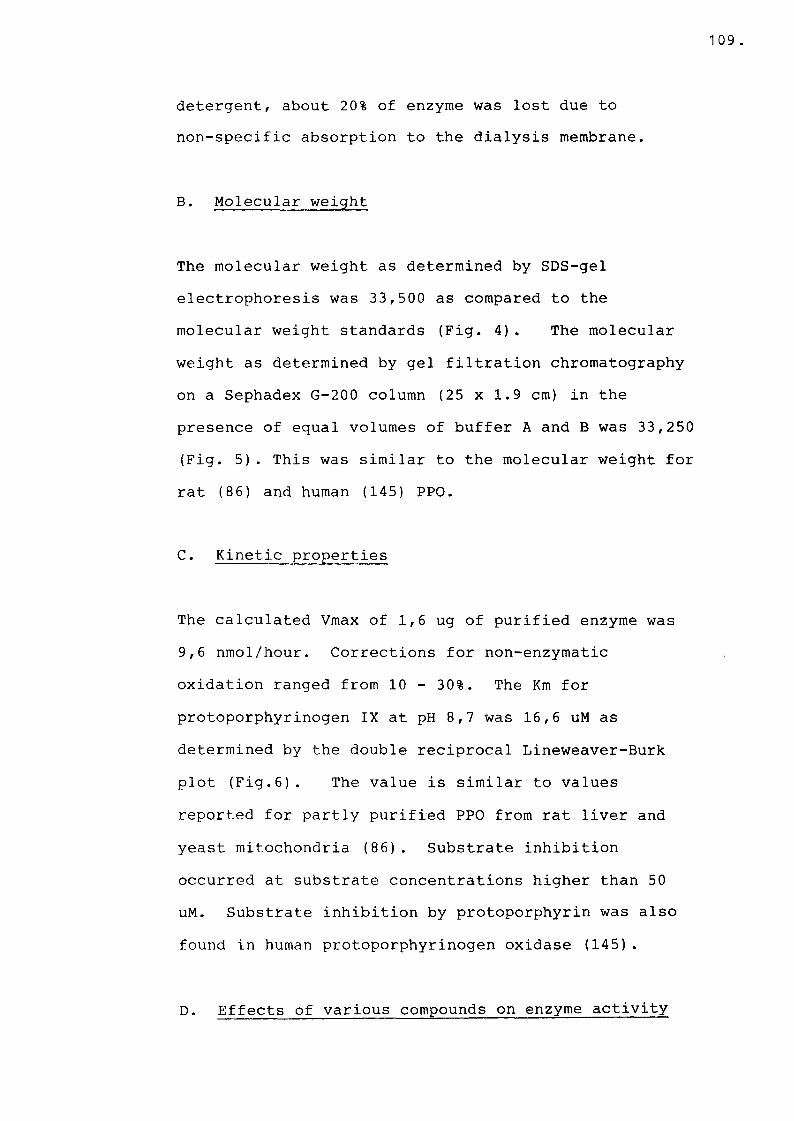
109 .
detergent, about 20% of enzyme was lost due to non-specific absorption to the dialysis membrane.
B. Molecular weight
The molecular weight as determined by SDS-gel electrophoresis was 33,500 as compared to the molecular weight standards (Fig. 4). The molecular weight as determined by gel filtration chromatography on a Sephadex G-200 column (25 x 1.9 cm) in the presence of equal volumes of buffer A and B was 33,250 (Fig. 5). This was similar to the molecular weight for rat (86) and human (145) PPO.
C. Kinetic properties
The calculated Vmax of 1,6 ug of purified enzyme was 9,6 nmol/hour. Corrections for non-enzymatic oxidation ranged from 10 - 30%. The Km for protoporphyrinogen IX at pH 8,7 was 16,6 uM as determined by the double reciprocal Lineweaver-Burk plot (Fig.6). The value is similar to values reported for partly purified PPO from rat liver and yeast mitochondria (86). Substrate inhibition occurred at substrate concentrations higher than 50 uM. Substrate inhibition by protoporphyrin was also found in human protoporphyrinogen oxidase (145) .
D. Effects of various compounds on enzyme activity
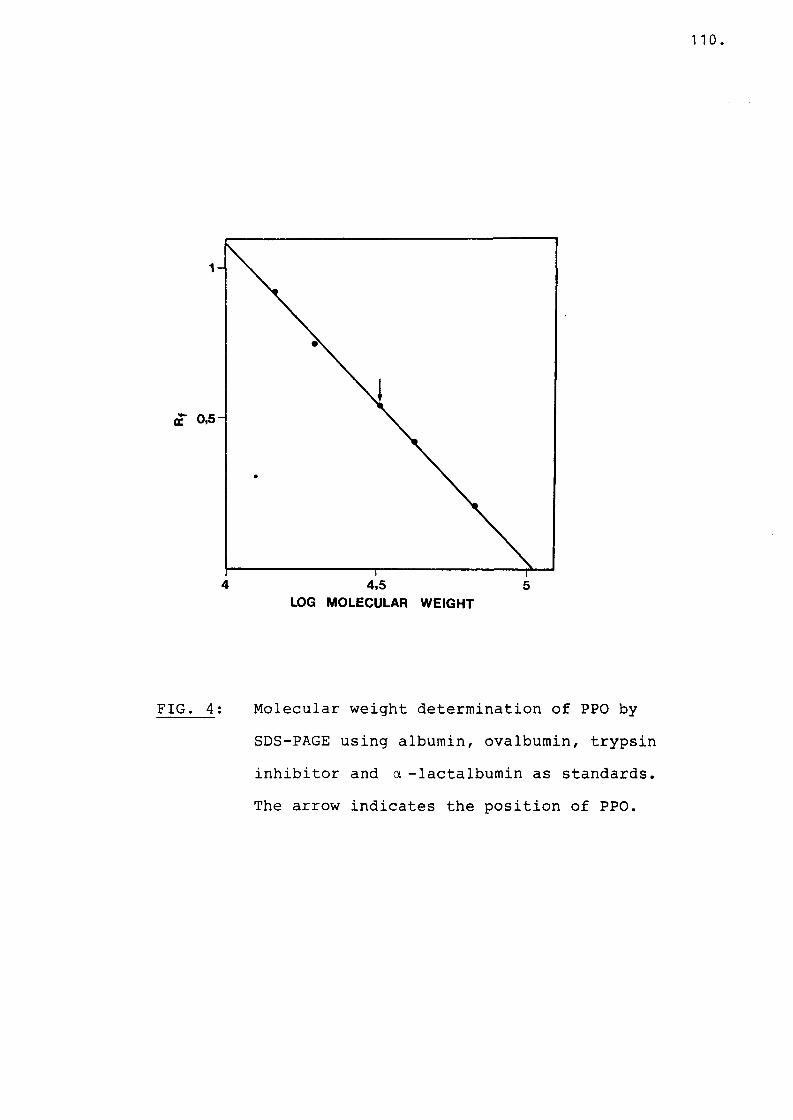
1 1 0.
FIG. 4: Molecular weight determination of PPO bySDS-PAGE using albumin, ovalbumin, trypsin inhibitor and a -lactalbumin as standards. The arrow indicates the position of PPO.
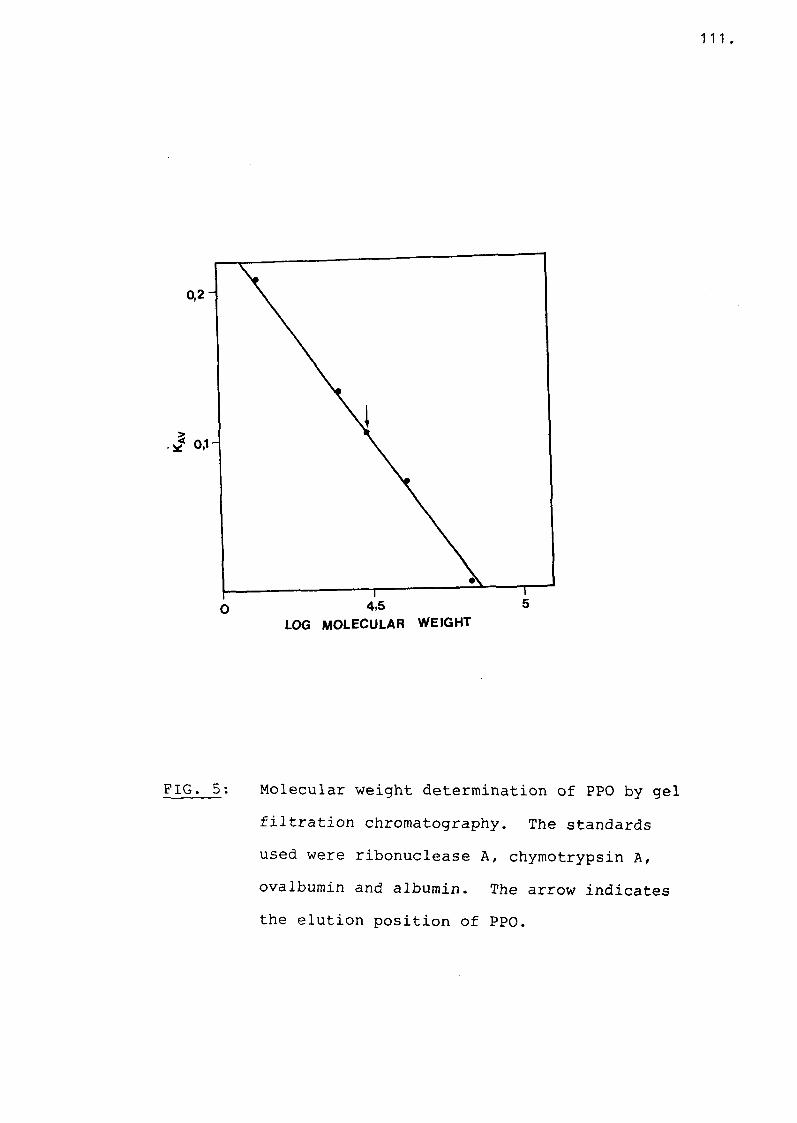
1 1 1.
FIG. 5: Molecular weight determination of PPO by gelfiltration chromatography. The standards used were ribonuclease A, chymotrypsin A, ovalbumin and albumin. The arrow indicates the elution position of PPO.
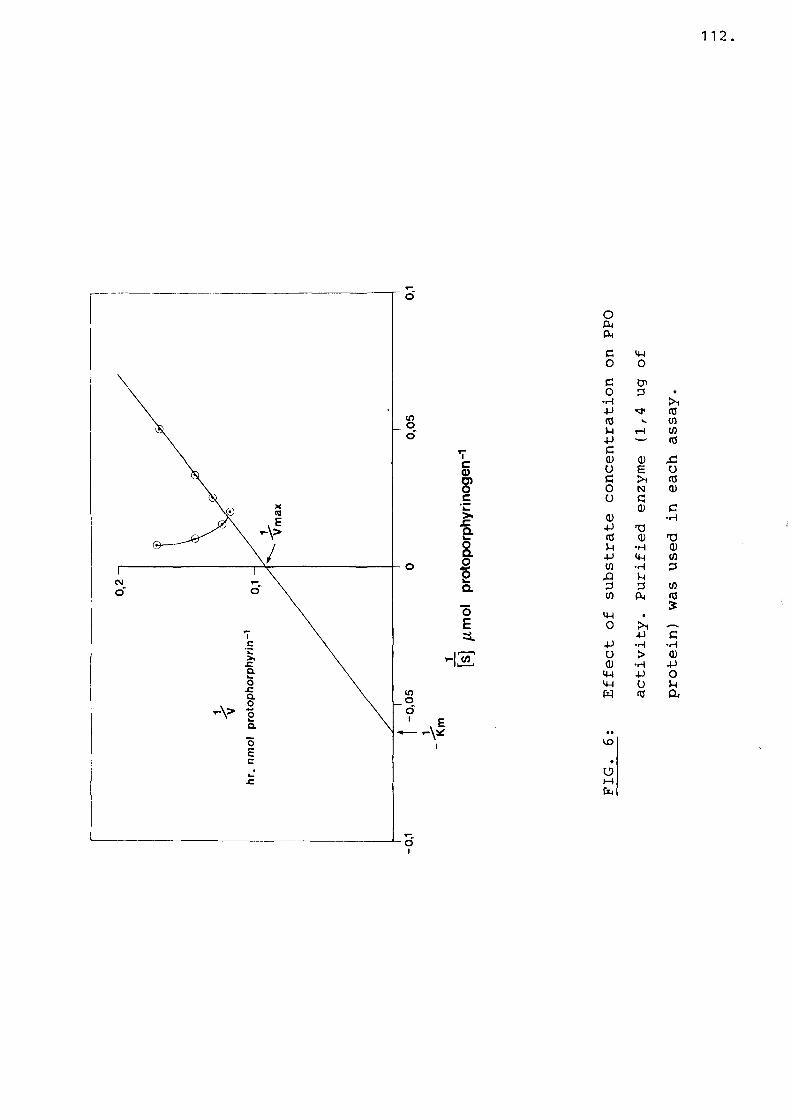
112
Ocu&(c 4-1o oc Coo d •
■p <DCD s. COp i-C (0-p •—' (Dc0) CD x:o £ Vc (Do N CDo ccd CCD ■rH■P *0(0 <u T3p ■H CD-p 4-( COco •H dXI Pd d COCO cu CD£4-I •o — ..■p C-p •H •Ho > CD<d •H -P4-1 ■P o4-1 0 pW <0 a
IDoMCP
113.
Equimolar amounts of FAD or FMN did not significantly activate the enzyme. Activity was inhibited 37% by iodo-acetamide (lOmM). Inhibition by iodo-acetamide was also found previously (86) . Glutathione (5mM) inhibited the enzyme by 63%, which is similar to the 55% inhibition found in rat PPO (86), whereas 7,5mM inhibited the enzyme completely. However,5mM glutathione does not inhibit PPO in human lymphocytes (72). As in the case of partly purified barley PPO (136), the isolated bovine enzyme was also markedly stimulated (by 66%) by oleic acid (1 mg/mg protein). It seems reasonable to postulate that the isolation procedures removed a lipid fraction normally associated with the membrane bound enzyme, and the oleic acid could substitute for this fraction.
E. ELISA results
When antibodies were raised against PPO, each of the two rabbits that were injected gave a good antibody titre after two months. However, when affinity purification of the respective IgG was attempted, only a small amount of purified PPO (20%) bound to CNBr-activated Sepharose 4B. This might have been due to PPO having a blocked amino-terminal end. In spite of this, enough PPO did bind to the gel to enable the purification of a sufficient amount of IgG.
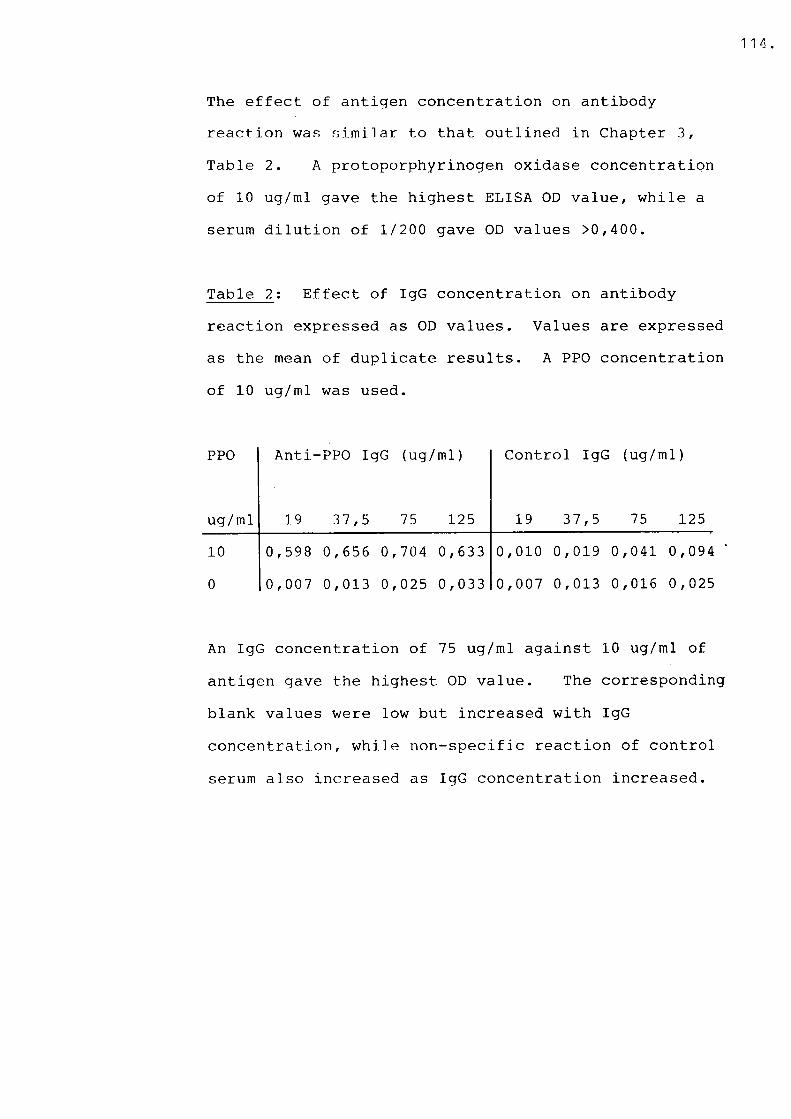
1 1 4 .
The effect of antigen concentration on antibody reaction was similar to that outlined in Chapter 3, Table 2. A protoporphyrinogen oxidase concentration of 10 ug/ml gave the highest ELISA OD value, while a serum dilution of 1/200 gave OD values >0,400*
Table 2: Effect of IgG concentration on antibody reaction expressed as OD values. Values are expressed as the mean of duplicate results. A PPO concentration of 10 ug/ml was used.
PPO Anti-PPO IgG (ug/ml) Control IgG (ug/ml)
ug/ml 19 37,5 75 125 19 37,5 75 12510 0,598 0,656 0,704 0,633 0,010 0,019 0,041 0,0940 0,007 0,013 0,025 0,033 0,007 0,013 0,016 0,025
An IgG concentration of 75 ug/ml against 10 ug/ml of antigen gave the highest OD value. The corresponding blank values were low but increased with IgG concentration, while non-specific reaction of control serum also increased as IgG concentration increased.
1 1 5 .
F. Characteristics of the chromophore
1. Fluorescence spectra of the bound and released chromophore
All active PPO fractions showed absorption in the 400 - 500 nm region, indicating the’ presence of a chromophore. This chromophore was tightly bound to the enzyme since only prolonged extraction in hot mineral acids or proteolytic digestion could release it from the protein. Only then was it possible to oxidise the preparation with oxygen and to obtain fluorescence excitation and emission spectra which resembled those of oxidized flavins (151) (Fig. 7).
No fluorescence was detected of the bound chromophore, showing that the cofactor was in the reduced state. This could be explained by the presence of EDTA in the purification buffer, which upon illumination, causes specific reduction of flavins (151). EDTA was included throughout the isolation procedure (which was not shielded from direct light) to chelate trace amounts of Zn2 + which could form Zn^+ protoporphyrin with protoporphyrinogen (135).
2. Fluorescence of the chromophore during the enzyme reaction
No fluorescence was detected of the chromophore bound
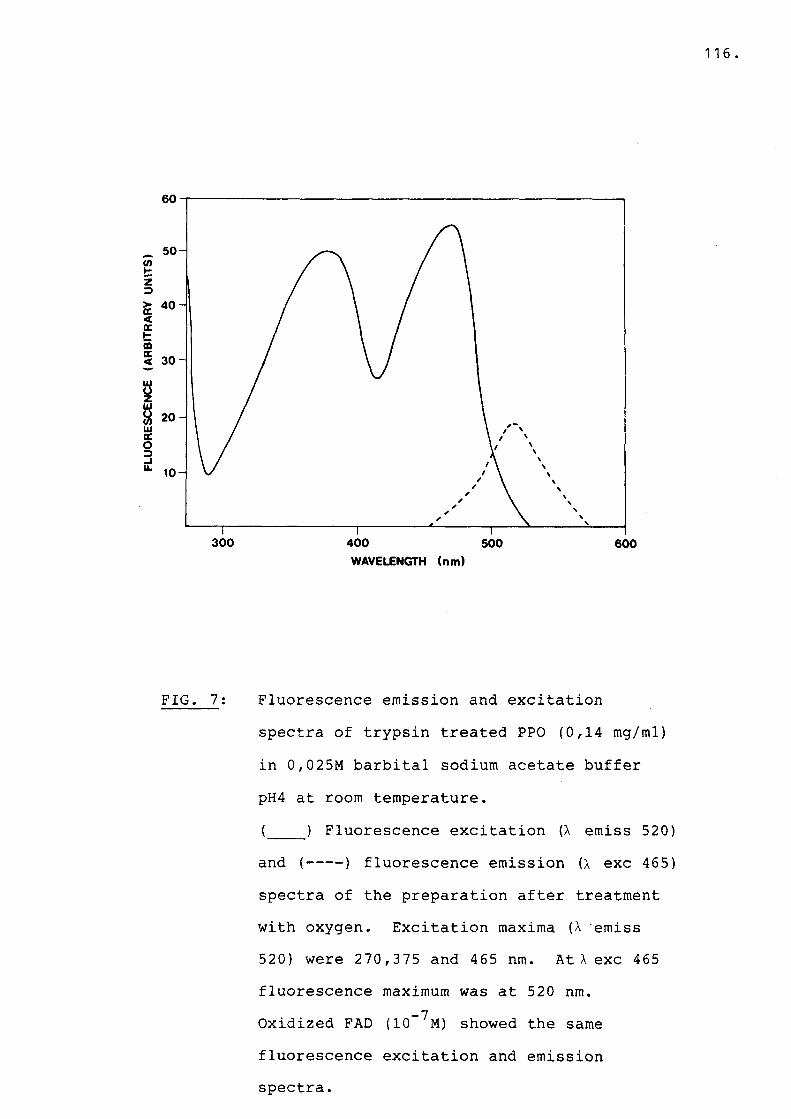
FIG. 7: Fluorescence emission and excitationspectra of trypsin treated PPO (0,14 mg/ml) in 0,025M barbital sodium acetate buffer pH4 at room temperature.(____) Fluorescence excitation (X emiss 520)and (--- ) fluorescence emission ( x exc 465)spectra of the preparation after treatment with oxygen. Excitation maxima (X emiss 520) were 270,375 and 465 nm. At X exc 465 fluorescence maximum was at 520 nm.
_7Oxidized FAD (10 M) showed the same fluorescence excitation and emissionspectra
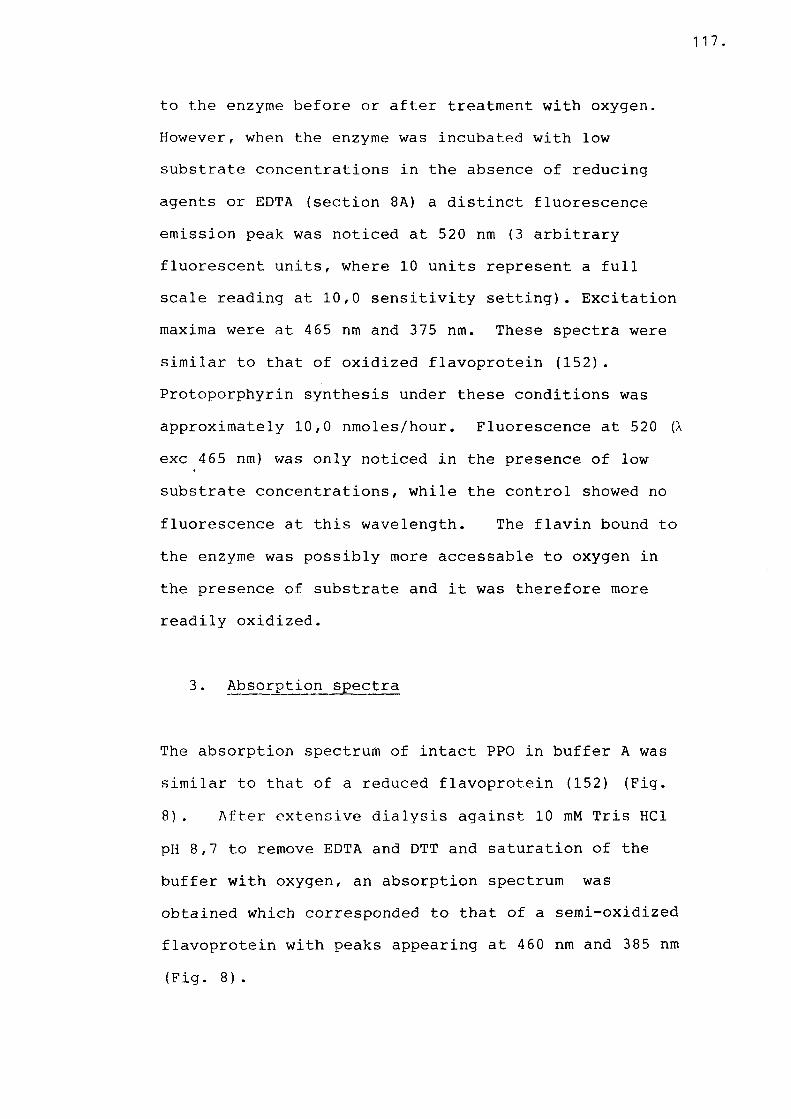
117.
to the enzyme before or after treatment with oxygen. However, when the enzyme was incubated with low substrate concentrations in the absence of reducing agents or EDTA (section 8 A) a distinct fluorescence emission peak was noticed at 520 nm (3 arbitrary fluorescent units, where 1 0 units represent a full scale reading at 10,0 sensitivity setting). Excitation maxima were at 465 nm and 375 nm. These spectra were similar to that of oxidized flavoprotein (152) . Protoporphyrin synthesis under these conditions was approximately 10,0 nmoles/hour. Fluorescence at 520 (X exc 465 nm) was only noticed in the presence of low substrate concentrations, while the control showed no fluorescence at this wavelength. The flavin bound to the enzyme was possibly more accessable to oxygen in the presence of substrate and it was therefore more readily oxidized.
3. Absorption spectra
The absorption spectrum of intact PPO in buffer A was similar to that of a reduced flavoprotein (152) (Fig.8 ). After extensive dialysis against 10 mM Tris HC1 pH 8,7 to remove EDTA and DTT and saturation of the buffer with oxygen, an absorption spectrum was obtained which corresponded to that of a semi-oxidized flavoprotein with peaks appearing at 460 nm and 385 nm (Fig. 8 ).
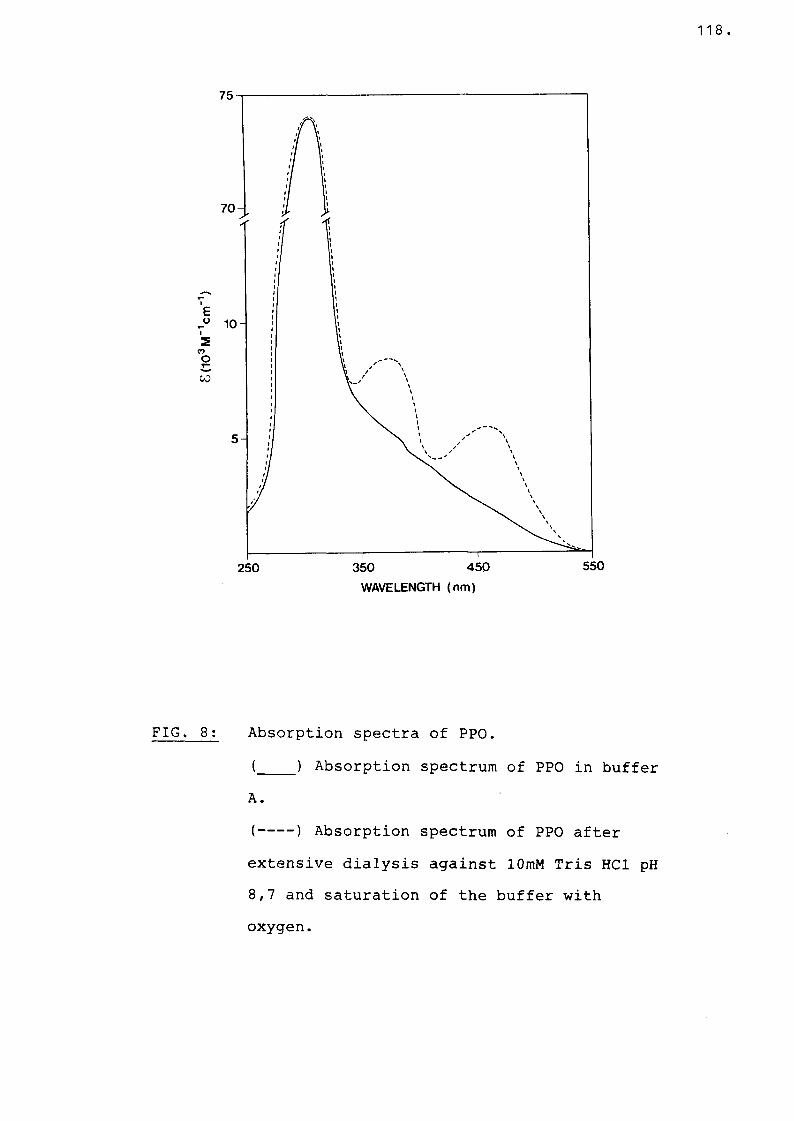
1 1 8 .
FIG. 8 : Absorption spectra of PPO.(____) Absorption spectrum of PPO in bufferA.(--- ) Absorption spectrum of PPO afterextensive dialysis against lOmM Tris HC1 pH 8,7 and saturation of the buffer withoxygen.
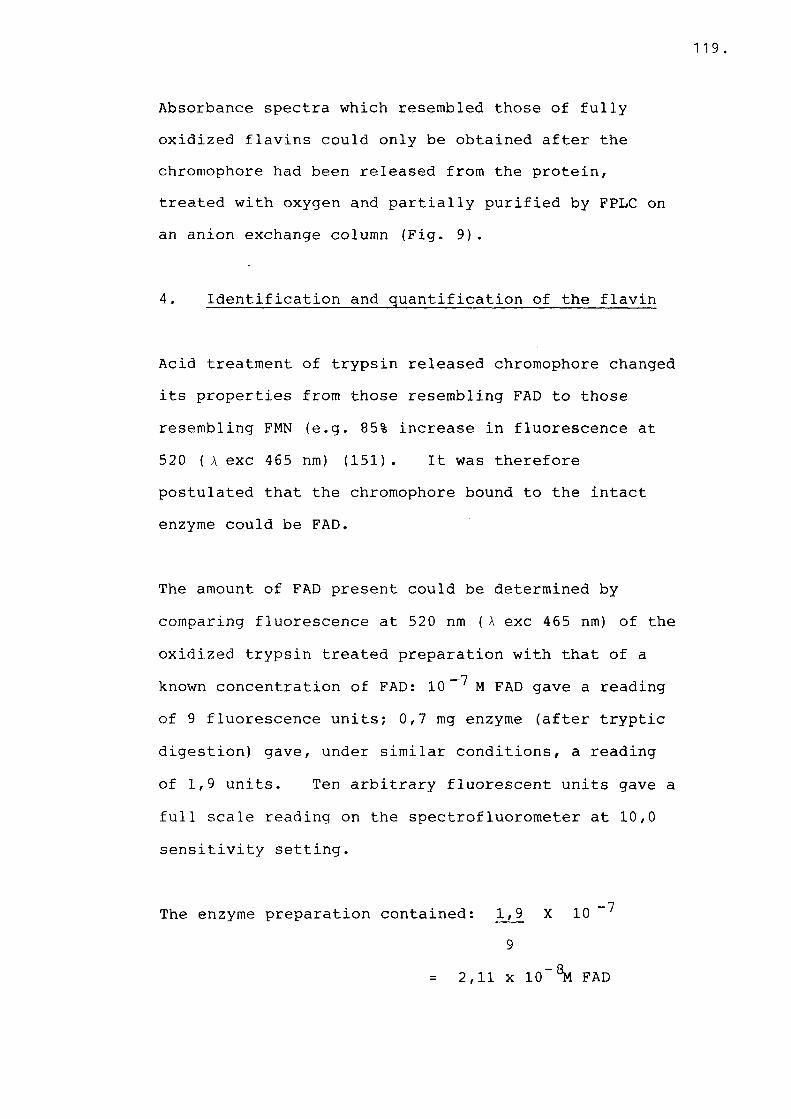
119.
Absorbance spectra which resembled those of fully oxidized flavins could only be obtained after the chromophore had been released from the protein, treated with oxygen and partially purified by FPLC on an anion exchange column (Fig. 9).
4. Identification and quantification of the flavin
Acid treatment of trypsin released chromophore changed its properties from those resembling FAD to those resembling FMN (e.g. 85% increase in fluorescence at 520 (A exc 465 nm) (151) . It was therefore postulated that the chromophore bound to the intact enzyme could be FAD.
The amount of FAD present could be determined by comparing fluorescence at 520 nm (A exc 465 nm) of the oxidized trypsin treated preparation with that of a
—7 .known concentration of FAD: 10 ' M FAD gave a readingof 9 fluorescence units; 0,7 mg enzyme (after tryptic digestion) gave, under similar conditions, a reading of 1,9 units. Ten arbitrary fluorescent units gave a full scale reading on the spectrofluorometer at 1 0 , 0
sensitivity setting.
— 7The enzyme preparation contained: 1,9 X 109
= 2,11 x 10⁻⁸M FAD
AB
SOR
BA
NC
E
120.
FIG. 9: Absorption spectra of the partially purifiedchromophore.(____) Absorption spectrum of the trypticreleased chromophore after oxygen treatment and partial purification by FPLC in 0,1M phosphate buffer pH 8,0.(--- ) Absorption spectrum of the samepreparation after treatment with KBH4 . Oxidized FAD (10 ug/ml) showed a similar spectrum as the oxidized chromophore and FAD reduced with KBH4 was similar to the chromophore reduced with KBH 4
121 .
At a molecular weight of 33 500 the 0,7 mg enzyme sample contained 2,08 x 10"% of enzyme. Therefore each enzyme molecule carries only one FAD molecule. This is not surprising since most FAD/FMN enzymes with more than one flavin per enzyme molecule have molecular weights >90 000.After partial purification of the oxygen treated chromophore by FPLC, the fraction which showed a typical oxidized flavin absorbance spectrum (Fig. 7), had the same retention time by the anion exchange column as a standard marker of oxidized FAD (3,77 minutes). Furthermore, marker FAD co-eluted with the oxidized cofactor in a single peak from the Mono Q column. Acid hydrolyzed cofactor (oxidized) showed the same retention time as oxidized FMN marker (2,40 minutes).
DISCUSSION
In this chapter the isolation to apparent electrophoretic homogeneity of the enzyme, protoporphyrinogen oxidase is reported. Whereas Poulson (8 6 ) obtained a specific activity of 0,5 nmol/protoporphyrin /hr/ug protein for 30 - 40% pure PPO from rat liver, a specific activity of 6
nmol/hr/ug protein was obtained for the bovine enzyme. The molecular weight of rat and bovine enzymes are similar. Recently the molecular weight of the human enzyme has also been determined at 32 000(1 4 5) .
122.
A recent report (154) suggests that PPO is one of the lesser active enzymes in the haem biosynthetic pathway and on inhibition could lead to accumulation of protoporphyrinogen. Two factors, however, should be noted: As the enzyme is normally membrane bound ithas certain hydrophobic areas, but when in aqueous medium it is stripped from its normal lipid environment. It is confirmed that there is marked activation by oleic acid ( + 70%) . Furthermore it has been shown that 5mM glutathione (the conditions used in that report) inhibits the bovine, as well as rat PPO activity by + 50% (135). Taking these two factors into consideration, PPO activity on a units per gram of liver basis may be at least twice the published value, which could provide an even metabolic flux through the haem biosynthetic pathway.
It was noted at each stage of the purification procedure of PPO up to and including the final step that all active fractions showed absorption in the 400 - 500 nm region. The absorption spectrum of the pure enzyme was similar to that of a reduced flavin and the extintion values at 360 nm and 450 nm shoulders were similar to a flavoprotein in the reduced state (152).
Although an absorption spectrum of the fully oxidized form could not be obtained, a spectrum similar to that of a semi-oxidized flavoprotein was obtained with peaks at 460 and 385 nm after removal of reducing
123 .
agents in the buffer and treatment of the enzyme with oxygen. A fluorescence spectrum similar to that of an oxidized flavoprotein was noticed during the enzyme reaction in the absence of reducing agents and in the presence of low substrate concentrations.
We did not show any significant enhancement on activity on the addition of flavin, probably because of the tight binding of cofactor by the enzyme which was at all times fully saturated with coenzyme. On the other hand the report by Klemm and Barton (147) , that rotenone inhibits proto-porphyrin synthesis in an obligate anaerobe, suggesting that the reaction is flavoprotein mediated, supports the evidence reported here for FAD as the primary electron acceptor for protoporphyrinogen oxidase.
1 14 .
HYPOTHESIS
It has been postulated that ferrochelatase and protoporphyrinogen oxidase might form a stable complex in the inner mitochondrial membrane. The substrates for these enzymes are relatively large, highly reactive nonpolar compounds and the existence of such a complex would provide an efficient means of processing these compounds by allowing the product of one enzyme to immediately become the substrate for the next without ever having to leave the membrane environment (1 2 1 ) .
A model has been constructed which combines the evidence of FAD as coenzyme for PPO with the model put forward by Dailey (121) for the formation of haem by ferrochelatase as outlined in Chapter 3, Fig. 1.
This combined model is illustrated in Fig. 10. The formation of haem from protoporphyrinogen proceeds as follows (Fig. 10).
(a) PPO and ferochelatase (fc) exist as a complex in the inner mitochondrial membrane. FAD bound to PPO is in the reduced state(FADH2 >- It has been shown in this chapter that the flavoprotein is in the reduced state during purification and that it is difficult to oxidize the enzyme by molecular oxygen in the absence ofsubstrate.
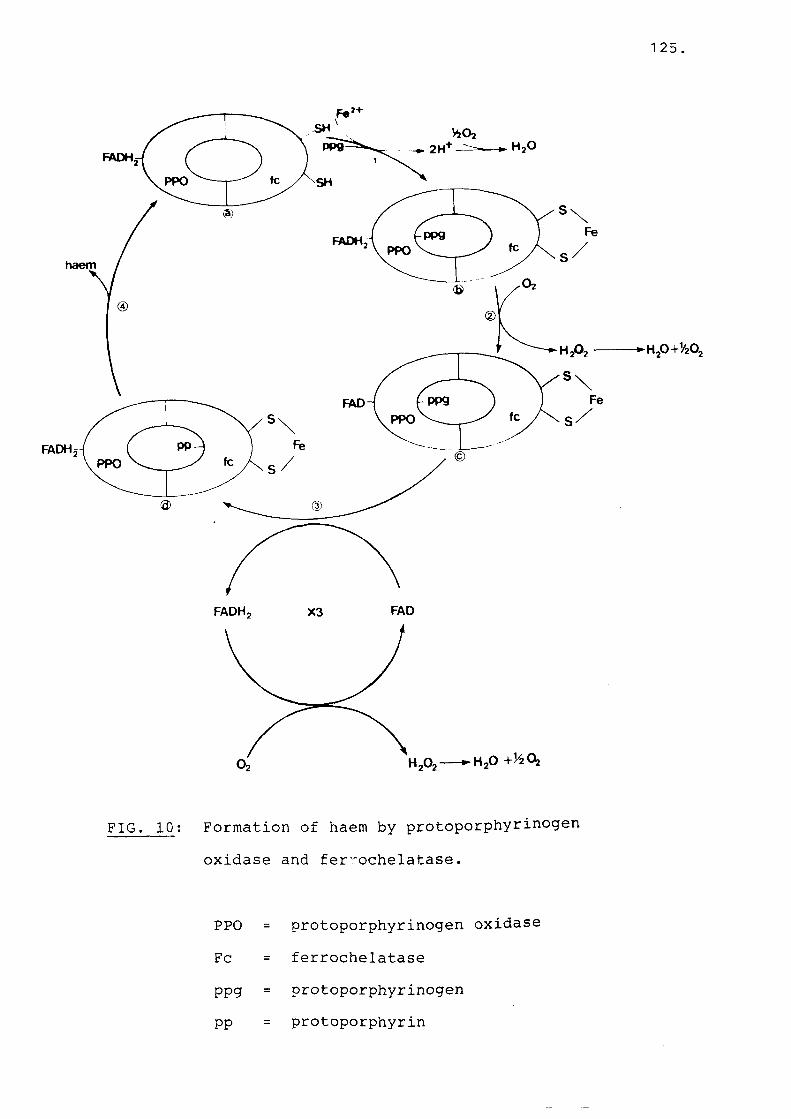
125.
FIG. 10: Formation of haem by protoporphyrinogen oxidase and ferrochelatase.
PPO = protoporphyrinogen oxidase Fc = ferrochelatase ppg = protoporphyrinogen pp = protoporphyrin
Reaction 1
For the formation of haem, iron binds to vicinyl sulfhydryl groups of ferrochelatase with the subsequent release of 2H+, prior to binding of protoporphyrin (PP) (121). It is suggested that the first reaction is binding of Fe2+ to Fc simultaneously or after binding of protoporphyrinogen (ppg) to PPO (b) .
Reaction 2:
FADH2 bound to PPO (b), is oxidized to FAD. This is based on the observation that a fluorescence spectrum similar to that of an oxidized flavoprotein was obtained during oxidation of ppg by PPO in the presence of low substrate concentrations, i.e. the flavin is more accessible to oxygen in the presence of substrate. (Illustration c shows the flavin bound to PPO in the oxidized form).
Reaction 3:
Oxidized FAD accepts 2H‘ from ppg and FADH is formed. FADH^ is reoxdized by 0^ with the formation of Ho0„. This cycle repeats itself three times in order to remove 6 H‘ from ppg for the formation of protoporphyrin (pp). When protoporphyrin (pp) is released from PPO or transferred to fc the flavin is
127 .
again in the reduced form in the absence of substrate (d) .
Reaction 4:
The two hydrogen protons (2H+) of pp are exchanged for. 2 +a molecule of ferrous iron (Fe ) and haem is
released. The two released protons associate with the two cysteines of fc which had previously bound the iron (a), (Chapter 3, Fig.l).
CHAPTER 5
COMPARISON OP PROTOPORPHYRINOGEN
OXIDASE AND FERROCHELATASE
129.
CHAPTER 5
Comparison of protoporphyrinogen oxidase and ferrochelatase
In order to compare enzymes with complete accuracy, studies of the primary amino acid sequence has to be undertaken. However this involves a great degree of difficulty, especially in the case of a blocked amino terminus and utilizes large amounts of material. An alternative to this is sequencing of the protein at the DNA level. However this is an intricate and complex procedure and is currently beyond the range of techniques available to the author. Therefore it was necessary to employ indirect measurements to assess structural similarities.
This Chapter deals with (A) cross reaction immunological studies and (B) peptide mapping, to test the hypothesis that there are structural similarities between protoporphyrinogen oxidase (PPO) and ferrochelatase.
MATERIALS AND METHODS
A. Immunological studies
Antibodies were raised against homogenous ferrochelatase (Chapter 3,6) and the IgG fraction of
130.
the antiserum was prepared (Chapter 3,7). However, PPO was not always completely homogenous when injected into rabbits, therefore monospecific IgG was prepared by affinity chromatography (Chapter 4,7). Antibody titre was determined with the ELISA technique (Chapter 4,8) and the IgG and antigen concentrations for optimum ELISA OD values were determined for each of the enzymes respectively (Chapter 3, table 2 and 3; chapter 4, table 2). Immunological cross reactivity was examined by incubating (a) 75 ug/ml of anti-PPO IgG against 10 ug/ml of ferrochelatase; (b) 125 ug/mlof anti-ferrochelatase IgG against 10 ug/ml of PPO using the ELISA technique. Non-immunized rabbit sera and IgG were used as controls in all experiments and non-specific reaction was minimized by the inclusion of 0,5% bovine serum albumin in all IgG solutions.
B. Two dimensional peptide analyses
Two dimensional chymotryptic peptide analysis followed by autoradiography was done according to the method of Elder et al. (8 8 ).
Ferrochelatase and PPO bands,(stained with Coomassie Blue) were sliced from 10% SDS-polyacrylamide gels with a razor blade. Gel containing no protein was used as control. The slices were placed into siliconized tubes and washed extensively with 25% isopropylalcohol, then with 10% methanol to remove SDS
131 .
and other contaminants. The slices were dessicatedunder vacuum, overnight. The proteins were then
• • • . 125radioiodmated with I (IMS-300, specific activityabout 557 mCi/ml; Amersham Ltd., Bucks, England) in the gel slice by a modification of the chloramine T method (155). The following components were added sequentially to the tubes containing the dried gel slices: 20 ul of sodium phosphate buffer (0,5 M, pH 7,5),500 uCi 125j j_n ui, ancj 5 ui 0f chloramine T (1 mg/ml). The gels were allowed to absorb the liquid for 45 minutes, at which time 1 ml of sodium bisulfate (1 mg/ml) was added to stop the reaction. After 15 minutes the bisulfite solution was removed and the gel slices were dialysed extensively against 1 0 % methanol in the cold. It was dialysed for 96 hours with 5 changes of 2 L of 10% methanol. The gel slices were put in siliconized tubes and dessicated under vacuum, overnight. One ml of 50 ug/ml chymotrypsin (Worthington; 67 units/mg) in 0.05M NH^HCO^ buffer (pH
8 ) was added to each tube. The samples were then incubated at 37 degrees C for 24 hours after which the supernatants were removed and lyophylized.
The samples were analyzed on cellulose-coated thin layer (TLC) plates without fluorescence indicator (20 x 20 cm, Merck Darmstadt, Germany) (155) . Thesamples were dissolved in 20 ul of Buffer I (acetic acid: formic acid: water, 15:5:80) . An aliquot of 1 ul was counted on a gamma counter apparatus and 1 to 5

132.
ul (0,5 to lx 10 counts per minute) was spotted onto each plate. Electrophoresis was carried out at 10 degrees C on a high voltage electrophoresis apparatus (Pharmacia Flat Bed Apparatus, FBE 3000) in Buffer I at lkV for about 1 hour. To ensure that the peptides of each sample migrated a constant distance, progress of electrophoresis was monitored by using 1 % fuchsin (w/v) solution in Buffer I. The dye was spotted at the opposite end from the sample and each plate was removed when the dye migrated 9,5 cm. The plates were dried and the peptides were chromatographed in a second dimension in Buffer II (butanol: pyridine: acetic acid: water; 32,5: 25: 5:20) containing 7%2 ,5-diphenyloxazole (w/v).
The second dimensional separation was done by ascending chromatography (TLC) (8 8 ). The plates were run for approximately 4 hours in Buffer II before they were removed from the chromatography tanks and allowed to dry. The peptide patterns were visualized by autoradiography using Kodak ultrasensitive XAR-5 X-ray plates. Exposure times at -70 degrees C using image intensifying screens (Kodak, USA) ranged from 24 to 36hours.
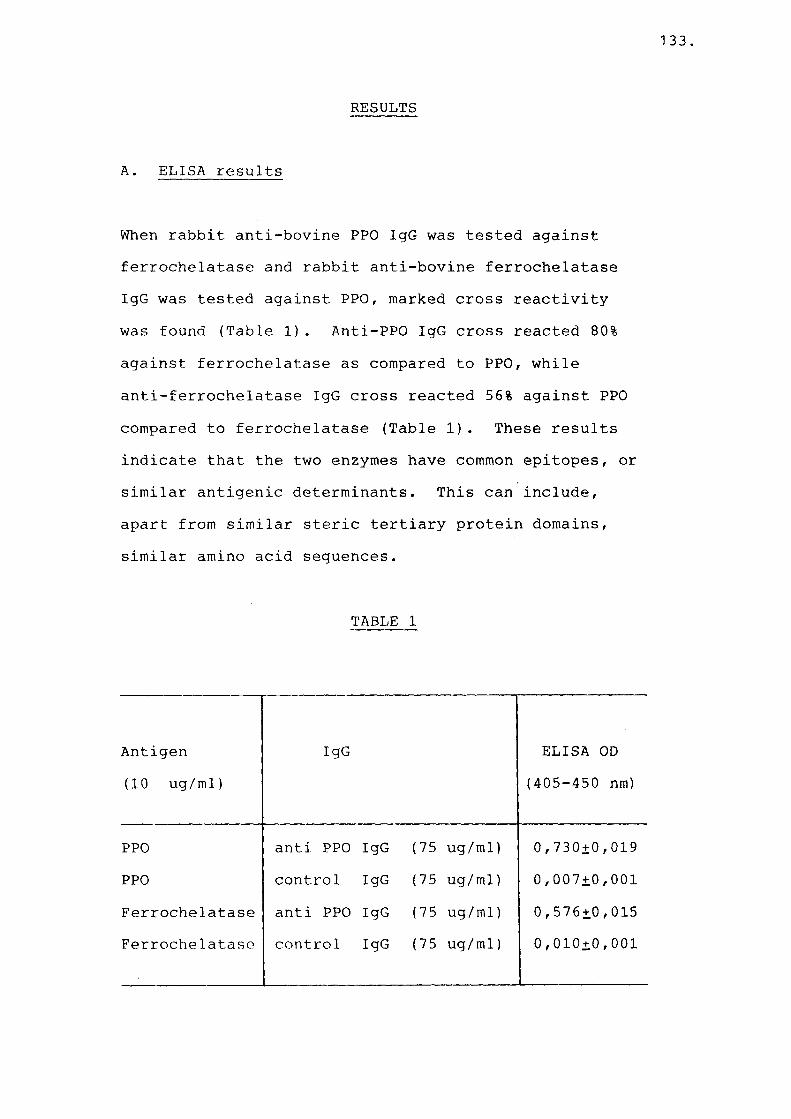
133.
RESULTS
A. ELISA results
When rabbit anti-bovine PPO IgG was tested against ferrochelatase and rabbit anti-bovine ferrochelatase IgG was tested against PPO, marked cross reactivity was found (Table 1). Anti-PPO IgG cross reacted 80% against ferrochelatase as compared to PPO, while anti-ferrochelatase IgG cross reacted 56% against PPO compared to ferrochelatase (Table 1). These results indicate that the two enzymes have common epitopes, or similar antigenic determinants. This can include, apart from similar steric tertiary protein domains, similar amino acid sequences.
TABLE 1
Antigen ( 1 0 ug/ml)
IgG ELISA OD (405-450 nm)
PPO anti PPO IgG (75 ug/ml) 0,730+0,019PPO control IgG (75 ug/ml) 0,007+0,001Ferrochelatase anti PPO IgG (75 ug/ml) 0,576+0,015Ferrochelatase control IgG (75 ug/ml) 0 ,0 1 0 +0 , 0 0 1
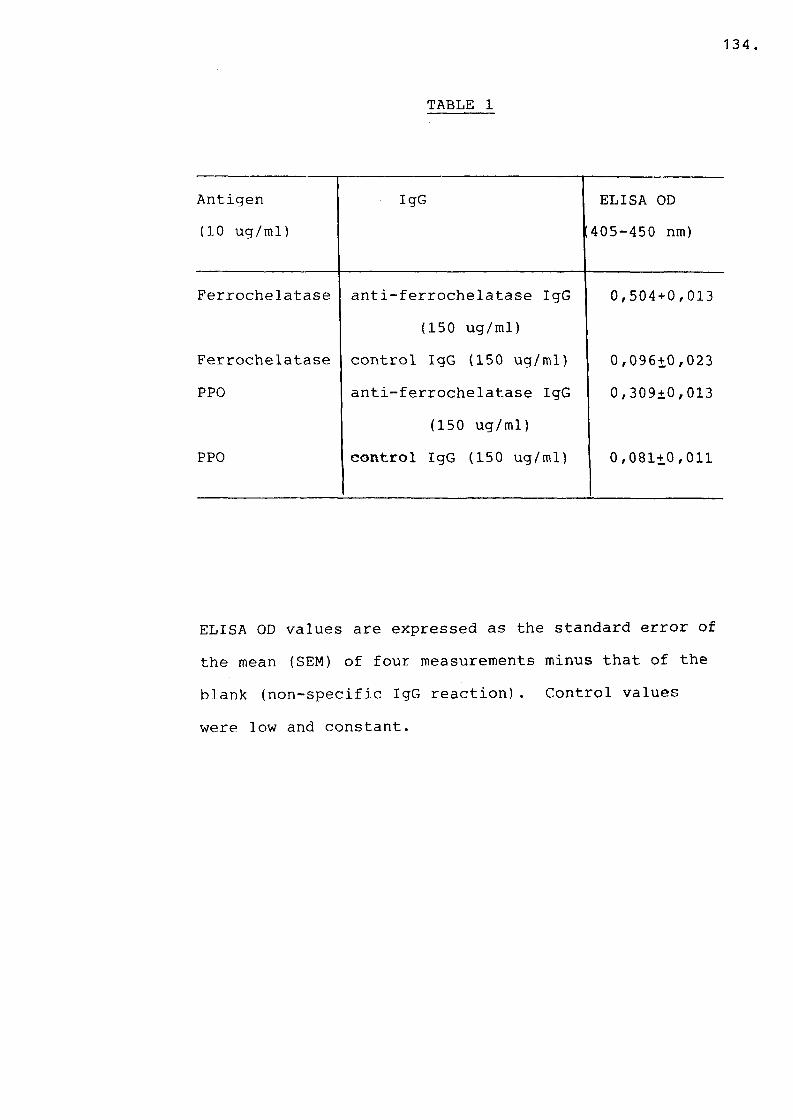
134
TABLE 1
Antigen ( 1 0 ug/ml)
IgG ELISA OD 405-450 nm)
Ferrochelatase anti-ferrochelatase IgG 0,504+0,013(150 ug/ml)
Ferrochelatase control IgG (150 ug/ml) 0,096+0,023PPO anti-ferrochelatase IgG 0,309±0,013
(150 ug/ml)PPO control IgG (150 ug/ml) 0,081+0,011
ELISA OD values are expressed as the standard error of the mean (SEM) of four measurements minus that of the blank (non-specific IgG reaction). Control valueswere low and constant.
135.
B . Two dimensional peptide analysis
Comparison of the enzyme peptide maps showed marked similarity (Fig. 1); which indicate that PPO and ferrochelatase have peptides that are common to both. Similar results were obtained when the Elder peptide mapping procedure was repeated twice. The control showed no spots. The ferrochelatase autoradiograph revealed a greater number of peptide spots than that of PPO. Considering the homology that was indicated by immunological studies, this could have been expected, since the molecular weight of ferrochelatase is 42,000 against 33,500 for PPO.
However, other methods may produce different results,since only approximately a third of the peptides
12 5generated by chymotrypsin are labelled by i. Radioactive iodine is mainly incorporated in the tryosine residues using the chloramine T procedure. Treatment with other proteolytic enzymes and or differing labelling procedures may produce maps . showing a greater degree of difference between the two enzymes (158) .
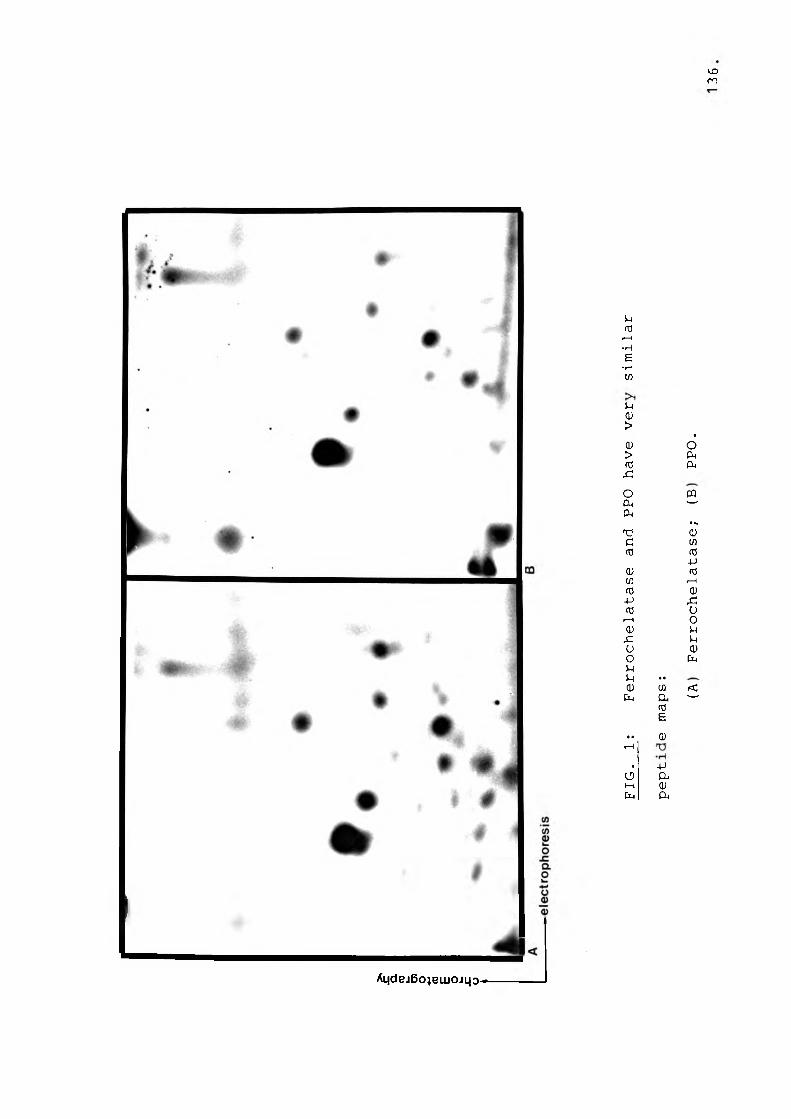
VvDm
_________________
Ai)dej6ojewojip----------------
u03r—(■He•rHUJ3-,<u> 1d) o> d,fXJ a.
x :
o m0, ■—-D-i • sn d)c w1X3 fXJ-Pa; <X5m f-1m d)4-1 x:fX3 ur—1 od) 3-1X 3-1U d)O Cl,3-13-1 *•a) U3 CEu a, —<X3E.. d)x—1• -pU Q,i—i d)Cu a,
DISCUSSION
These results indicate that ferrochelatase and PPO have epitopes and peptides common to both.
There may be several genetic explanations to account for these similarities. It is suggested that the most plausible explanation for the high degree of homology between them is that the genes coding for them share a common ancestry. Gene duplication and subsequent divergence due to mutation would have led to the differences which now exist between them (157). In a recent publication (163) , considerable amino acid sequence homology was found between two enzymes catalyzing consecutive steps in the methionine pathway in Escherichia coli. The authors suggested that these two enzymes might have evolved from a common ancestral gene. The original gene may have been duplicated with the copies ultimately residing at different sites on the E.coli chromosome. Subsequently mutations have occurred in the ancestral enzyme genes leading to specialization of the encoded proteins. According to a proposal put forward 40 years ago (164) the biosynthetic pathways as we know them today have been progressively built backwards from the final metabolite of the pathway. This theory was rejuvenated based on gene duplication followed by mutation (165) mainly taking into account the hypothesis of gene duplication as an important factor of evolution (166).

CONCLUSION
139.
CONCLUSION
This thesis was undertaken to determine if there was any interrelationship between protoporphyrinogen oxidase and ferrochelatase, with particular reference to PV and EPP. The background to porphyria and in particular PV and EPP and the evidence to date whether the two diseases may be interrelated, ate outlined in the introduction. In chapter 1, PPO was measured in both EPP and PV patients and in the offspring of PV patients. In the same subjects, protoporphyrin formation by mitogen stimulated lymphocytes with ALA as substrate and in the presence of an iron chelator or iron, provided an indirect measurement for ferrochelatase. The results provided strong evidence that PPO and ferrochelatase were both defective in both diseases. Furthermore, the studies in the offspring of PV subjects showed normal ferrochelatase activity even in those with reduced PPO activity, which would suggest that ferrochelatase deficiency is only manifested after puberty. In chapter 2, detailed studies in PV families suggested that reduced PPO activity may be a marker for carriers who evolve into PV patients in adulthood. The data support the basic genetic concept for this disease that it is autosomal dominantly inherited.
140.
Chapters 3 and 4 are concerned with the purification of ferrochelatase and PPO and the production of antibodies. The purification of ferrochelatase was based on a method previously described by Dailey (84) . To date PPO had not been purified. This was achieved by anion exchange chromatography using a Pharmacia FPLC apparatus. Throughout the purification procedure all active fractions showed absorbance in the 400-500 nm region and the chromophore was suspected to be a flavin. Preliminary studies suggested that this was FAD.
The precise biochemical basis for the deficiency of the two enzymes in PV and EPP has to await the purification and characterization of the enzymes from diseased subjects. Purification and characterization of the normal enzymes is a necessary and important step in that direction. Comparison of the two enzymes on some biochemical aspects shows some interesting points:
(a) Location
Protohaem is formed in the mitochondrial matrix (159), therefore the particular submitochondrial location of the final enzymes of the haem pathway may be important for the transport of substrates from the cytoplasm to the mitochondrial matrix. It has been established that coproporphyrinogen oxidase is associated with the
cytoplasmic side of the inner mitochondrial membrane (160), whilst protoporphyrinogen oxidase was found within the lipid bilayer with its catalytic site situated within the core of the inner membrane. The active site for ferrochelatase was found to be associated with the matrix side of the inner mitochondrial membrane, with the enzyme physically spanning the membrane. The location of these three enzymes in close vicinity to each other, provides an efficient means of transporting porphyrin substrate from the cytoplasm across the inner mitochondrial membrane to the active site of ferrochelatase.
It has been postulated that these three enzymes form a stable complex in the membrane, because the existence of such a complex would provide an efficient means for processing their nonpolar substrates, allowing the product of the one enzyme to immediately become the substrate for the next. A model was presented in chapter 4 based on this postulation together with the evidence for FAD as coenzyme for PPO, whereby a complex of ferrochelatase and PPO combines with the substrates protoporphyrinogen and iron to form haem.
(b) Activity
Both enzymes have sulfhydryl groups present in the active site, however evidence is that iron binds to sulfhydryl groups in ferrochelatase, whereas
142.
protoporphyrinogen binds to the sulfhydryl groups in PPO. However, the possibility that protoporphyrin might bind to sulfhydryl groups in ferrochelatase is not excluded (121). Furthermore, both enzymes are activated by lipids, probably due to their lipid environment in vivo. There are also distinct differences between the enzymes. For instance PPO is inhibited by high salt concentrations but not ferrochelatase; and metals play a much greater role in ferrochelatase activity. PPO needs a primary electron acceptor to remove six electrons and six protons (H+) from protoporphyrinogen. The primary electron-acceptor is not likely to be molecular oxygen. This statement is based on the finding that spectral analyses of PPO reaction mixtures indicated that semi-reduced forms of protoporphyrinogen IX accumulate only in the non-enzymic reaction mixture (161) . This suggest that during auto-oxidation semi-reduced porphyrins are formed due to the preferential loss of hydrogens from one side of the protoporphyrinogen nucleus (162) , whereas in the presence of PPO all six hydrogen atoms are apparently removed very rapidly from the protoporphyrinogen ring by the enzyme. These findings suggest that the enzyme uses a coenzyme that is able to undergo oxidation-reduction reactions, i.e. a flavin. Ferrochelatase in contrast removes only two protons (2H+) from protoporphyrin when iron is inserted, for which an electron acceptor is not needed.
143.
In the final chapter, antibodies raised against ferrochelatase and PPO showed marked cross reactivity against the other enzyme and peptide maps for each enzyme showed marked structural similarities between them. In addition to clinical and biochemical evidence interrelating PPO and ferrochelatase, these last two experiments provided immunological and structural evidence for homology between them. The conclusion that one can arrive at from all these studies is that there is strong evidence that these two enzymes are indeed interrelated, which could be clinically expressed in EPP and PV.
Production of homogenous enzyme and antibodies provides a good base for extending studies on EPP and PV to the DNA level. Obtaining the primary amino acid sequence for the enzymes would allow for construction of oligonucleotide probes which could be used to screen a human genomic library to locate the genes for these enzymes. An alternative method for locating the genes would be the construction of an expression vector library, which could be screened using the monospecific antibodies. Extending this study to the specific genes implicated in the porphyria disorders would lead to a greater understanding of the molecular pathology of these hereditary dysfunctions.
144.
1 .
2.
3 .
4.
5.
6 .
7.
8 .
9.
10
11
12
13
14
15
16
17
REFERENCESKappas, A., Sassa, S., Anderson, K.E. (1984).The Porphyrias. In "The metabolic basis of inherited disease". 5th Edition, Stanbury, J.B., Wyngaarden, J.B., Frederickson,D.S., Goldstein, J.L., Brown, S. (Eds.) p.1301.Deybach, J., Da Silva, V., Grandchamp, B.and Nordmann, Y. (1985). Eur J Biochem, 149, 431.Dailey, H.A. and Harbin, B.M. (1985) . Biochem, 24, 366.Granick, S. and Sassa, S. (1971). Metabolic Regulation. Vol. 5. Vogel HJ (Ed). New York,Academic, p.77.Sassa, S. and Kappas, A. (1981). Advances in Human Genetics, 11, 121.Granick, S. (1966). J Biol Chem, 241, 1359.Granick, S. and Urata,G. (1963). J Biol Chem, 238, 821.De Matteis, F. (1971). Biochem J, 124, 767.Granick, S. and Kappas, A. (1967). J Biol Chem, 242, 4587.Kappas, A. and Granick, S. (1968). J Biol Chem, 243, 346.Sassa, S. and Kappas, A. (1977). J Biol Chem, 252, 2428.Tomita, Y., Ohashi, A. and Kikuchi, G. (1974). J Biochem, 75, 1007.Tyrrell, D.L.G. and Marks, G.S. (1972). Biochem Pharmacol, 21, 2077.Sassa, S., Bradlow, H.L. and Kappas, A. (1979).J Biol Chem, 25±, 10011.Fuhrhop, J.H. and Smith, K.M. (1975). Laboratory methods. In "Porphyrin and Metalloporphyrin Research". Amsterdam, Elsevier, p.l.Falk, J.E. (1964). Porphyrins andMetalloporphyrins. New York, Elsevier, vol. 2.Spikes, J.D. (1975). Ann N Y Acad Sci, 244, 496.Lim, H.W., Perez, H.D. and Goldstein, I.M. and Gigli, I. (1981). J Clin Invest, 67, 1072.
18.
145.
19. Schmid, R., Schwartz, S. and Watson, C.J.(1954). Arch Intern Med, 9_3, 167.
20. Watson, C.J., Lowry, P.T., Schmid, R.,Hawkinson, V.E. and Schwartz, S. (1951). Trans Assoc Am Physicians, 6_4, 345.
21. Romes, G. and Levin,E.Y. (1969). Proc Nat Acad Sci USA, 6J3 , 856 .
22. Magnus, I.A., Jarrett, A., Prankerd, T.A.J. and Rimmington, C. (1961). Lancet ii, 448.
23. Sweeney, G.D.,Dowdle, E.B. Saunders, S.J. and Eales, L. (1963). S Afr J Lab Clin Med, 9, 247.
24. Leeming, J.A.L. and Kramer, S. (1968). SAMJ, 42, 586.
25. Haeger-Aronsen, B. (1963). Amer J Med 3j>, 450.26. Thompson, R.P.H., Molland, E.A., Nicholson, D.C.
and Gray, C.H. (1973), Gut, _14, 934.27. Bottomley, S.S., Tanaka, M. and Everett, M.A.
(1975). J Lab Clin Med, 86, 126.28. Romslo, I., Hovding, G., Hamre, E. and Laerum,
O.D. (1978). Scand J Clin Lab Invest, 3_8, 529.29. Bonkowsky, H.L., Bloomer, J.R.,Ebert, P.S. and
Mahoney, M.J. (1975). J Clin Invest, 5_6, 1139.30. Brodie, M.J., Moore, M.R., Thompson, G.G.,
Goldberg, A. and Holti, G. (1978). Clin Exp Dermatol, 2, 381.
31. De Goeij, A.F.P.M., Christianse, K. and Van Steveninck, J. (1975) . Eur J Clin Invest, 5_,397.
32. Clark, K.G.A. and Nicholson, D.C. (1971). Clin Sci, 4JL, 363 .33. Piomelli, S., Lamola, A.A., Poh-Fitzpatrick,
M.B., Seaman, C. and Harper, L.C. (1975). J Clin Invest, 56 , 1519.
34. Lamola, A.A., Piomelli, S., Poh-Fitzpatrick, M.B., Yamane, T. and Harber, L.C. (1975). J Clin Invest, 56 , 1528 .
35. Porter, S. (1963). Blood, 2_2, 532.36. Bloomer, J.R., Brenner, D.A., Mahoney, M.J.
(1977). J Clin Invest, 60, 1354.
146.
37. Sassa, S Anderson Invest,
., Zalar, G.L., Poh-Fitzpatrick, M.B., , K.E. and Kappas, A. (1982). J Clin 69, 809.
38. Sassa, S Kappas,A
. Zalar, G.L., Poh-Fitzpatrick, M.B. and
. (1979). Trans Assoc Am Phys, 92, 268.39. Becker,
Kramer,D.M., Viljoen, J.D., Katz, J. and S. (1977). Brit J Haematol, 36, 171.
40. Becker, Biochem
D., Viljoen, D. and Kramer, S. (1971). Biophys Acta, 225, 26.
41. Russell, (1983) .
V .A., Lamm, M.C.L. and Taljaard, J.J.F. Neurochem Res, 8, 1407.
42. Brennan, (1980) .
M.J.W., Cantrill, R.L. and Kramer,S. Int J Biochem, 12, 833.
43. Litman, D.A. and Correia, M.A. (1983). Science, 222, 1031.
44. Strand, Marver, 1315.
L.J., Felsher, B.F., Redeker, A.G. and H.S. (1970). Proc Acad Sci USA, 67,
45. Miyagi, Watson,
K., Cardinal, R., Bossenmaier, I. and C.J. (1971). JLab Clin Med, 78, 683.
46. Meyer, U.A., Strand, L.J., Doss, M., Rees,C.A.and Marver, L. (1972). N Engl J Med, 286, 1277.
47. Mustajoki, P. (1981). Ann Int Med, £5, 162.48. Mustajoki, P. and Desnick, R.J. (1985). Brit Med
J, 291, 505.49. Anderson, P.M., Reddy, R.M., Anderson,K.E. and
Desnick, R.J. (1981). J Clin Invest, 6j), 1.50. Elder, G.H., Evans, J.O., Thomas, N., Cox, R.,
Brodie, M.J., Moore, M.R., Goldberg, A. and Nicholson, D.C. (1976). Lancet,_2, 1217.
51. Grandchamp, B. and Nordmann, Y. (1977). Biochem Biophys Res Comm, 7_4, 1089.
52. Berger, H. and Goldberg, A. (1955). Brit Med J, 2, 85.
53. Dean, G., Kramer, S.and Lamb, P. (1969). S Afr Med J, 42, 138.
54. Brodie, M.J., Thompson, G.G., Moore, M.R., Beattie, A.D. and Goldberg, A. (1977), Quart J Med, £6, 229.
55. Barnes, H.D. (1955). S Afr Med J, £9, 781.
j i i jt
147.
57.
58.
59.
60 .
61.62.
63 .
64.
65.6 6 .67.
68. 69 .
70.
71.
72.
73 .
74.
75.
56 . Keeley, K. J. (1962) . S Afr Med J, 36, 602 .Kramer, s., Viljoen, D. , Kew, M.C,. and Seftel,H.C. (1<3 74) . S Afr J Med Sci, 39, 169.Taljaard, J.J.F., Shanley, B.C., Joubert, S.M. and Deppe, W.M. (1973). Clin Sci, £4, 571.Kushner, J.P., Barbuto, A.J. and Lee, G.R.(1976). J Clin Invest, 58 , 1089 .Doss, M., Sauer, H., von Tiepermann, R. and Colombi, A.M. (1984). Int J Biochem, 1_6, 369 .Schmid, R. (1960). N Eng J Med, 263, 397.Elder, G.H., Smith, S.G., Herrero, C., Paulos, V., De Salamanca, R.E., Mascaro, J.M., Lecha,M., Brenan, J., Muniesa, A.M. and Czarnecki, D.E. (1981). Lancet, 1, 917.Dean, G. (1963). The Porphryias. In "A Study of Inheritance and Environment" Great Britain, Pitman Medical.Dean, G. (1971). The Porphyrias. In "A Study of Inheritance and Environment". Great Britain, Pitman Medical. 2nd Ed.Kramer, S. (1980) . Clin Haem, 9, 303.Mustajoki, P.(1978) . Ann Intern Med, 89, 238 •Kramer,S., Becker, D• M. , Viljoen r J. D • (1978) . SAfr J Hosp Med, Dec, 344 •Barnes, H.D. (1958) . S Afr Med J , 32, 680 .Day, R.S., Eales, L. Meissner, D. (1982) . N EngJ Med, 307, 36Brenner, D.A. and Bloomer, J.R. (1980). New Eng J Med,302, 765.Viljoen, D.J., Cummins, R. Alexopoulos, J. and Kramer, S. (1983). Eur J Clin Invest, 13_, 283.Deybach, J.C., De Verneuil, H., Nordmann, Y. (1981). Hum Genet, 5_8, 425.Viljoen, D.J., Cayanis, E., Becker, D.M.,Kramer, S., Dawson, B. and Bernstein, R. (1979). Am J Haematol, _6, 185.Pimstone, N.R., Blekkenhorst, G. and Eales, L. (1973). Enzyme, .16 , 354.Brenner, D.A. and Bloomer, J.R. (1980). N Eng J Med, 302, 765.
1 48 .
76. Kramer, S., Becker, D.M. and Viljoen, D.J.(1977). Brit J Haem, 37, 439.
77. Bradlow, H.L., Anderson, K. and Kappas, A. (1976). Porphyrins in Human Diseases. M. Doss (ed) Basel, Karger p. 173.
78. Meissner, P. (1984). Personal Communication. Cape Town University, Cape Town, S.A.
79. Yamada, M., Kondo, M., Tanaka, M., Okeda, R., Hatakeyamana, S., Fukui, T. and Tsukagoshi, H. (1984). Acta Neuropathol, (Berl) 64_, 6.
80. McColl, K.E.L., Moore, M.R., Thomson, G.G., Goldberg, A., Church, S.E., Oadri, M.R. and Youngs, G.R. (1985). Lancet, 2, p.796.
81. Kramer, S. and Viljoen, J.D. (1980). Int. J. Biochem, 12, 925.
82. Brenner, D.A. and Bloomer, J.R. (1980). Clin Chim Acta, 100, 259.
83. Granick, S. and Beale, S.I. (1978). Adv Enzymol 4j), 33.
84. Dailey, H.A. and Fleming, J.E. (1983). J Biol Chem, 258, 11453.
85. Taketani, S. and Tokunaga, R. (1981). J Biol Chem, 256, 12748.
86. Poulson, R. (1976). J Biol Chem, 251, 3730.87. Yang, J. and Kennedy, M.T. (1979). J Clin
Microbiol, 10, 778.88. Elder, J.H. Pickett, R.A., Hampton, J. and
Lerner, R.A. (1977). J Biol Chem, 252, 6510.89. Cartwright, J.D., Becker, D.M., Viljoen, J.D.,
Kramer, S. and Jenkins, T. (1978). S Afr Med J, 53, 669.
90. Sassa, S., Zalar, L. and Kappas, A. (1978). J Clin Invest, 61 , 499 .
91. Sassa, S. (1984). Personal Communication. Rockefeller University, New York. U.S.A.
92. Sassa, S., Granick, S., Bickers, D.R., Bradlow, H.L. and Kappas, A. (1974). Proc Natl Acad Sci USA, 71, 732.
93. Adams, R. (1942). Organic Chemistry. John Wiley and sons, Inc, New York (ed). p. 286.
94.
95.
96. 97 .
98.99.
100.
101.
102 .
103.
104.
105.
106.
107.
108.109.
110 .
111 .
112 .
Lowry, O.H., Rosebrough, N.J., Farr, A.L. and Randall, R.J. (1951). J Biol Chem, 193, 265.Conn, E.E. and Stumpf, P.K. (1976). Outlines of Biochemistry. 4th Ed. John Wiley and Sons, Inc, New York (ed). p. 137.Kramer, S. (1980). Clin Haem, 9_, 303 ,Dean, G. (1971). The Porphyrias. In "A Study of Inheritance and Environment". 2nd Ed. London Pitman.Elder, G.H. (1980). Clin Haem, 9, 371.Day, R.S., Pimstone, N.R. and Eales, L. (1978). Int J Biochem, 9_, 897.Poh-Fitzpatrick, M.B. (1978). Int J Dermatol, 17, 359.Rimmington, C. (1961) . Quantitative determination of porphobilinogen and porphyrins in uirine and faeces. Broadsheet No. 36 (new series) of the Association of Clinical Pathologists.Kassner, R.J. and Walchak, H. (1973). Biochim Biophys Acta, 304, 294.Tokunaga, R. and Sano, S. (1972). Biochim Biophys Acta, 264, 263.Jones, M.S. and Jones, O.T.G. (1969). Biochem J 113, 507.McKay, R., Druyan, R., Getz, G.S. and Rabinowitz, M. (1969). Biochem J, 114, 455.Bugany, H., Flothe, L. and Weser, U. (1971). FEBS Lett. 13_, 92.Harbin, B.M. and Dailey, H.A. (1985) . Biochem, 2_4, 366 .Jones, O.T.G. (1968). Biochem J, 107, 113.Dailey, H.A. and Lascelles, J. (1974). Arch Biochem Biophys, 160, 523.Jones, M.S. and Jones, O.T.G. (1970). Biochem J 119, 453.Johnson, A. and Jones, O.T.G. (1964). Biochim Biophys Acta, 9_3, 171.Porra, R.J. and Jones, O.T.G. (1963). Biochem J 87, 186.
113.
114.
115.
116.
117.118.
119.
120.
121.122 .
123.
124.
125.126.127.
128.129.130.
131.
132.
133 .
Camadro, J. and Labbe, P. (1982). Biochim Biophys Acta, 707, 280.Yoneyama, Y., Ohyama, H., Sugita, Y. and Yoshikawa, H. (1962). Biochim Biophys Acta, 62, 261.Yoneyama, Y., Tamai, A., Yasuda, T. and Yoshikawa, H. (1965). Biochim Biophys Acta, 105 100.Camadro, J., Ibraham, N.G. and Levere, R.D. (1984). J Biol Chem, 259, 5678.Dailey, H.A. (1982). J Biol Chem, 257, 14714.Hanson, J 222, 695.
.W. and Dailey, H.A. (1984) . Biochem J
Taketani, S. and Tokunaga, R. (1981) . J BiolChem, 256 , 12748 •Taketani, S. and Tokunaga, R. (1982) . Europ JBiochem, 127, 443.Dailey, H.A. (1984). J Biol Chem, 259, 2711.Guarra, F.C. (1974). Methods Enzymol, £1, 299.Porra, R.J. and Jones, O.T.G. (1963). Biochem J 8_7, 181.Porra, R.J. (1976). In: Porphyrins in Human Diseases. Doss, M. (ed). Basel, Karger p.123Bottomley, S.S. (1968). Blood, _31, 314.Llambias, E.B.C. (1976). Int J Biochem, ]_, 33.Porra, R.J. and Jones, O.T.G. (1963). Biochem J £7, 186.Dailey, H.A. (1977). J. Bacteriol, 132, 302.Laemmli, U.K. (1970). Nature, 227, 680.Shapiro, A.L., Vinuela, E. and Maizel, J.V. (1967). Biochem Biophys Res Commun, £8, 815.Molecular weight determination using electrophoresis (1982) . Pharmacia Fine Chemicals.Hurn, B.A.L. and Chantler, S.M. (1980). Methods Enzymol, 70A, 104.Harboe, N. and Ingeld, A. (1973). Scand J Immunol, 2, Suppl.l, 161.

151 .
134. Voller, A., Bartlett, A. and Bidwell, D.E.(1978). J Clin Path, 3Jl, 507.
135. Poulson, R. and Polglase, W.J. (1975). J Biol Chem, 250, 1269.
136. Jacobs, N.J. and Jacobs, J.M. (1984). Biochem Biophys Res Commun, 123, 1157.
137. Mauzerall, D. and Granick, S. (1958). J Biol Chem, 232, 1141.
138. Jackson, A.H., Games, D.E., Couch, P., Jackson, J.R., Belcher, R.B. and Smith, S.G. (1974). Enzyme, 1/7, 81.
139. Polglase, W.J., Whitlow, K.J. and Poulson, R. (1975). Fed Proc, 34, 692.
140. Jacobs, N.J. and Jacobs, J.M. (1975). Biochem Biophys Res Commun, 6J5, 435.
141. Sano, S. and Granick, S. (1961). J Biol Chem, 236, 1173.
142. Deybach, J.C., Da Silva, V., Grandchamp, B. and Nordmann, Y. (1985). Eur J Biochem, 149, 431.
143. Poulson, R. and Polglase, W.J. (1974). FEBS Lett' 40, 258.
144. Kolarov, J., Dean Nelson, B. and Kuzela, S. (1983). Biochem Biophys Res Commun, 116, 383.
145. Camadro, J.M., Abraham, N.G. and Levere, R.D. (1985). Arch Biochem Biophys, 242, 206.
146. Jacobs, N.J. and Jacobs, J.M. (1976). Biochim Biophys Acta, 449, 1.
147. Klemm, D.J. and Barton, L.L. (1985). J Bacteriol, 164, 316.
148. Conn, E.E. and Stumpf, P.K. (1976). Outlines of Biochemistry. 4th Ed. John Wiley and Sons, Inc, New York (ed) p. 195.
149. Protein Molecular Weight Determinations by Gel Filtration (1982). Pharmacia Fine Chemicals.
150. Affinity Chromatography, principles and methods. (1983). Pharmacia Fine Chemicals.
151. Kozoil,J. (1971). Methods Enzymol, 18B, 253.152. Ghisla, S., Massey, V. , Lhoste, J. and Mayhew,
S.G. (1974). Biochem, 13, 589.
153. Ghisla, S. (1980). Methods Enzymol, 66 , 360.154. Bishop, D.F. and Desnick, R.J. (1982). Enzyme,
28_, 91.155. Greenwood, F.C., Hunter, W.M. and Glover, J.S.
(1963). Biochem, J, 8_9, 114.156. Gibson, W. (1974). Virology, 62, 319.157. Jenkins, T. (1986). Personal Communication.
Department of Human Genetics, SAIMR, S.A.158. Stephen Lambert (1986). Personal Communication.
Department of Haematology, SAIMR, S.A.159. Barnes, R., Connelly, J.L. and Jones, O.T.G.
(1972). Biochem, J. 128, 1043.160. Elder, G.H. and Evans, J.O. (1978). Biochem J,
172, 345.161. Poulson R. and Polglase, W.J. (1973). Biochim
Biophys Acta, 329, 256.162. Jackson, A.H., Games, D.E., Couch, P., Jackson,
J.R., Belcher, R.B. and Smith, S.G. (1974). Enzyme, 17_, 81.
163 Belfazia, J., Parsot, C., Martel, A., Bouthier de Tour, C., Margarita, D., Cohen, G.N. and Saint-Girons, I. (1986). Proc Natl Acad USA, 83 867.
164. Horowitz, N.H. (1945). Proc Natl Acad Sci USA, 31, 153.
165. Horowitz, N.H. (i965) . In "Evolving genes and proteins". Academic, New York, Byron, V. and Vogel H.J. (Eds.), p.15.
166. Lewis, E.B. (1951). Cold Spring Harbor Symp. Quant. Biol, 16, 159.