Management’s Responsibility for Internal Control and Enterprise Risk Management
Upload
nguyenkienCategory
view
213download
0
The Internal Responsibility System Audit Provincial Summary Report Delivered to Ontario Minister of Labour The Honourable Brad Clark, MPP October 2002
© Mines and Aggregates Safety and Health Association, 2002
Mines and Aggregates Safety and Health Association 690 McKeown Ave. North Bay, ON P1B 9P1 Phone: (705) 474-7233 Fax: (705) 472-5800 Email: [email protected]

IRS Provincial Summary Report - 1 - October 2002
The Internal Responsibility System Audit Provincial Summary Report
Table of Contents Introduction................................................................................................2 Executive Summary ...................................................................................3 History of the IRS Audit............................................................................4 About the Audit Tool .................................................................................5 Survey Response.........................................................................................7 Findings a) Overview of IRS ..................................................................................................................... 8 Graph 1:Perception of IRS in the workplace ...............................................................8 Graph 2: I believe that the IRS is working well in my workplace ...........................9 Graph 3: We believe that the IRS is working well in our workplace ....................10 Graph 4: The effectiveness of IRS in the workplace ................................................11 b) Leadership and Understanding .......................................................................................11 Graph 5: How committed we are to promote and apply the IRS............................12 Graph 6: How well we understand the term “IRS”...................................................13 c) Performance ..........................................................................................................................14 Graph 7: How well our systems are working.............................................................14 d) Correlation between IRS and Safety Performance ....................................................15 Graph 8: Safety performance (LTI) and IRS effectiveness ....................................15 Graph 9: Safety performance (TMI) and IRS effectiveness....................................16 e) Participant Comments........................................................................................................17
Conclusions ...............................................................................................18 Next Steps..................................................................................................20
IRS Provincial Summary Report - 2 - October 2002
Introduction The internal responsibility system has been a major focus for MASHA and the mining industry since a provincial study was commissioned three years ago. The study itself, and the development and administration of the IRS audit, have required commitment by mining companies, labour, government and the safety association. This has been a positive experience, giving all parties the opportunity to work together to improve conditions in our industry. One of the main tasks for the consultants studying the IRS in Ontario mines in 1999 and 2000 was to write a common description for the IRS that could be accepted across the industry. The consultants struggled with this duty, as others have. The internal responsibility system speaks to workplace relationships, organization of work, corporate culture, ethics and philosophy. It’s a difficult concept to pin down in a few words. It follows that a system so hard to define would also be difficult to measure. The IRS audit which the consultants developed and MASHA inherited, seeks to capture the participants’ own perceptions of the state of the IRS in their workplace. The survey results must be valued for what they are: a snapshot of work relationships and corporate culture at a given point in time. For an internal responsibility system, there is no “good enough”; no point of arrival. There must be constant effort to maintain and improve the system. While this provincial summary report may give companies an average to compare themselves against, even the highest-performing companies must continue to be vigilant in building up their internal responsibility systems. The report’s intention is to point out areas that can be strengthened, both for individual companies and industry-wide. Other tools and approaches can then be used to explore these areas further, identifying problems and solutions. With this process of continuous improvement underway, companies will find the best value in using the IRS audit to compare their internal responsibility system against itself, over time. It is MASHA’s hope that the results of this first round of audits will be just that: a starting point.
IRS Provincial Summary Report - 3 - October 2002
Executive Summary Though the Internal Responsibility System (IRS) is a difficult concept to understand and measure, developing and delivering the audit has been a positive experience. This first round of IRS audits provides a good starting point for progress. • The report “The Internal Responsibility System in Ontario Mines” was released in December 2000.
The mining industry promised to audit all underground operations within 18 months, and MASHA was asked to serve as custodian of the audit tool.
• The audit consists of surveys adapted for different organizational levels. • Surveys assess the participants’ perceptions of understanding and effectiveness of the IRS in the
workplace, leadership and IRS performance. • The surveys were administered at operations by site facilitators, with completed surveys returned to
MASHA for data entry, analysis and reporting. • The response rate overall from the industry was good, with more than three-quarters of the requested
surveys completed in most survey groups. The exception was the group of directors and senior executives, where only 43 per cent of requested surveys were returned.
Findings: • Graphs included:
—Perception of IRS in the workplace —I believe that the IRS is working well in my workplace —We believe that the IRS is working well in our workplace —The effectiveness of IRS in the workplace —How committed we are to promote and apply the IRS —How well we understand the term “IRS” —How well our systems are working —Safety performance (LTI) and IRS effectiveness (according to worker responses) —Safety performance (TMI) and IRS effectiveness (according to worker responses)
• Participant comments can’t be quantified, but indicate concerns with IRS performance and leadership. Conclusions: • Improvements to IRS can only happen at the workplace level. Operations must examine their own
survey results to identify areas for improvement. • There appears to be a perception among worker respondents that senior management has not
demonstrated a commitment to safety or the IRS. • The role of joint health and safety committees may not be clearly understood. • The roles of directors and senior executives in the IRS may not be clearly understood. • The model of the IRS is not always understood by all parties, both direct and indirect contributors to
the system. • In some cases wording of survey questions may have confused the participants’ understanding of IRS,
and their understanding of the survey. Next Steps: • Develop individual plans of action. • Continue to audit. • Strengthen the link between managers and workers. • Strengthen the joint health and safety committee’s role within the IRS. • Create stronger links between company executives and boards, and the operations. • Build a common understanding of IRS. • Improve the IRS survey tool.
IRS Provincial Summary Report - 4 - October 2002
History of the IRS Audit More than 25 years ago, Dr. James Ham wrote a landmark report for health and safety in Ontario. As part of a government inquiry into fatalities in the mining industry, he examined the structures and processes that lead to safety. His description of an “internal responsibility system” has shaped occupational health and safety legislation and thinking ever since. By the late 1990s, however, with fatalities considerably reduced but still persisting, the provincial minister of labour launched a study into the effectiveness of the internal responsibility system in Ontario’s underground mines, and hired a trio of consultants to conduct the study. The central objective of the project was to develop an “audit tool” to allow auditors to objectively measure the state of a company’s internal responsibility system. The project received guidance from a 13-member steering committee representing labour, government and the mining industry. When the study concluded in December 2000, the Ontario Mining Association pledged that its member companies would use the audit to measure the internal responsibility system in their own workplaces within 18 months. At the same time, the study steering committee asked the Mines and Aggregates Safety and Health Association to serve as custodian of the audit tool. The association’s role would include five parts. 1. Safeguard and maintain the audit tool. In the short term, MASHA was to take a series of survey
questions and transform them into standard audit documents with embedded scoring. Over time, the association will be responsible for updating the IRS audit and maintaining its integrity.
2. Train IRS site facilitators. 3. Capture IRS data and analyse audits. This included establishing a database and internal
processes for handling the completed surveys submitted by participating companies, analysing the data, and is suing individual reports to those companies.
4. Prepare a provincial summary report. This report was to identify IRS benchmarks and areas of
improvement, and examine the possible correlation between IRS and safety performance. 5. Promote awareness of IRS.

IRS Provincial Summary Report - 5 - October 2002
About the Audit Tool The IRS audit is a survey. The survey asks individuals in the workplace to assess how well they understand the internal responsibility system, and how well the system is working. The audit includes different questionnaires for different segments of the organization: • Directors • Senior Executives/Vice-Presidents • Mine Managers • Middle Managers • Front-line Supervisors • Workers • Joint Health and Safety Committee Members • Health and Safety Coordinator • Support staff At most of these levels, because the group is small, all representatives must be surveyed in order to provide a statistically-valid sample. However, at the worker level, operations may choose to survey all workers or a sample group. The questionnaires measure understanding and effectiveness of the IRS, safety leadership, and how well IRS systems are performing. Questionnaires also include space for the participants’ comments. While these comments cannot be quantified, they offer additional insights into how well the IRS is functioning and present some qualitative support for observations made. Administering the IRS Audit When MASHA agreed to serve as custodian for the IRS audit, the association needed to develop a process and infrastructure for administering the audit. The process started with site facilitators. Each operation participating in the audit designated site facilitators to deliver the audit in their workplace – these were frequently the co-chairs of the Joint Health and Safety Committee. The site facilitators were trained by MASHA in a two-day course that reviewed auditing principles and the IRS audit survey questions. In all, 72 facilitators were trained in 2001 and early-2002. This approach helped to ensure the audit was administered consistently from site to site. The facilitators’ role was to meet with company management to discuss and plan the audit process, determine the sample groups for each level of the organization to be surveyed, and order the appropriate questionnaires from MASHA. The facilitators established schedules for completing the audit, explained the process to the workforce, and assisted any participants who needed help. In some cases, facilitators took the time to sit with survey participants while they completed their questionnaires, answering ques tions as they arose. At other sites, surveys were simply handed out and participants asked to complete them on their own. When all the site’s surveys had been completed, the facilitators were to return the surveys to MASHA. At the association’s office, the surveys were scanned into a database, so that a standardized analysis could be completed and a report generated. In all, 9,200 surveys were mailed out to participating companies, and MASHA staff scanned roughly 37,000 pages. Standardized graphs and tables were established within the database. These reports were generated for each company, reviewed and analysed by MASHA staff, and used as the basis for developing a report. The company’s report was sent back to the site facilitators, and the facilitators were to present the audit results back to the workplace.
IRS Provincial Summary Report - 6 - October 2002
Confidentiality Completed questionnaires are confidential. Individuals completing the surveys are not identified, and the company’s overall results are confidential between MASHA and the company itself. Analysis of Audit Results Results of the audit are scored based on methods outlined in the final report of the study into the internal responsibility system in Ontario mines. The data collected was first used to develop an overview of an operation’s IRS. The data was also grouped to analyse three aspects of the IRS: leadership, understanding and performance. The first four graphs in this report (graphs 4 through 7 in individual company reports) provide the IRS overview. Analysis is drawn from questions 1a) and 1b) of the questionnaires. Graphs in this overview include:
• Perception of IRS in the workplace, • I believe the IRS is working well in my workplace, • We believe the IRS is working well in our workplace, and • The effectiveness of IRS in the workplace.
All questions on the questionnaires were grouped into one of two categories: leadership or understanding. The graphs representing this analysis are titled:
• How committed we are to promote and apply IRS (leadership), and • How well we understand the term “IRS”.
Finally, all questions were regrouped into one of nine clusters to examine indicators of IRS performance at the operation. These clusters were beliefs, accountability, health and safety initiatives and responses, demonstrating leadership, information flow, responsibility, health and safety concerns and responses, IRS issues and responses, and work planning. The results of this analysis are presented in the graph titled:
• How well our systems are working. Scope of the IRS Audit A perception survey like the IRS audit is limited to the understanding and opinions of its participants – unlike a physical audit, it does not use evidence to support its conclusions. Knowing the levels of understanding, and the beliefs and opinions of those in the workplace is an important part of building a stronger internal responsibility system. At the site level, the small number of individuals in some of the groups surveyed may mean the results are not statistically representative of the entire group, but they may be indicators of the group’s perceptions. The consultants who developed the IRS audit as part of the provincial study made a number of recommendations for improving the survey questions. However, when taking over as audit custodian, MASHA agreed with the steering committee’s request to use the audit without making major changes. The surveys are lengthy, and some questions may be difficult to understand. It may be possible in future to simplify the surveys, while still maintaining the integrity of the audit and ensuring that future results can be compared to the baseline now established.
IRS Provincial Summary Report - 7 - October 2002
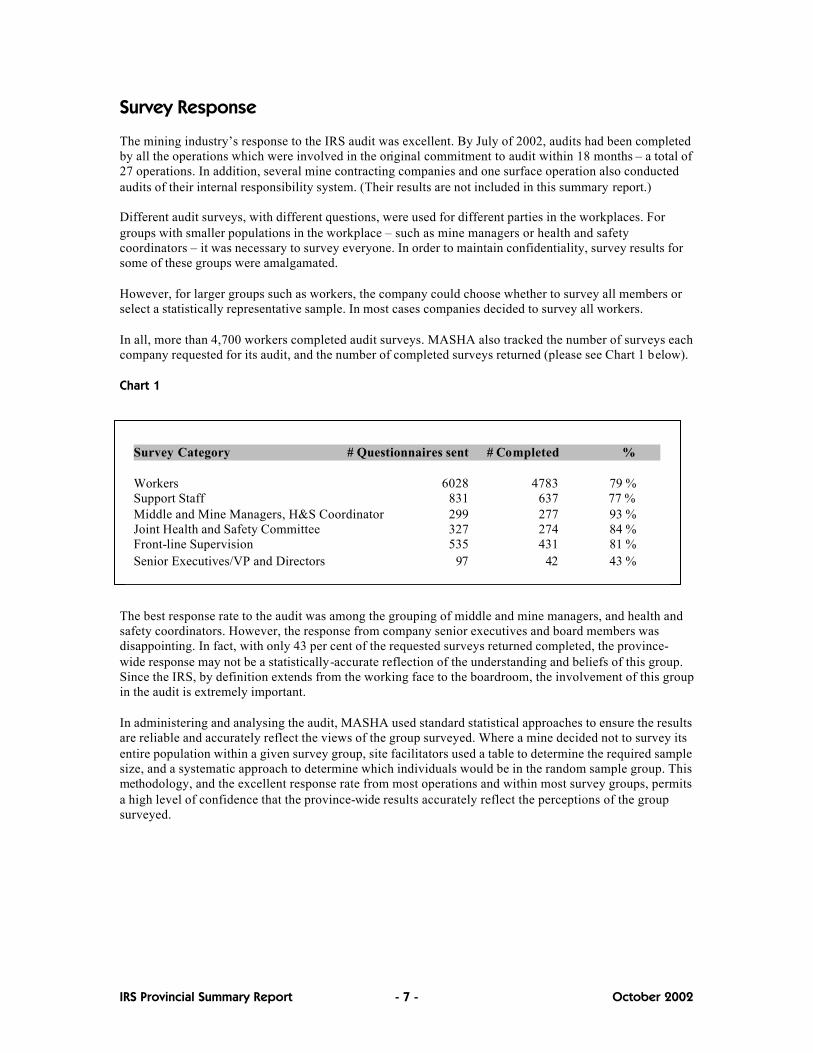
Survey Response The mining industry’s response to the IRS audit was excellent. By July of 2002, audits had been completed by all the operations which were involved in the original commitment to audit within 18 months – a total of 27 operations. In addition, several mine contracting companies and one surface operation also conducted audits of their internal responsibility system. (Their results are not included in this summary report.) Different audit surveys, with different questions, were used for different parties in the workplaces. For groups with smaller populations in the workplace – such as mine managers or health and safety coordinators – it was necessary to survey everyone. In order to maintain confidentiality, survey results for some of these groups were amalgamated. However, for larger groups such as workers, the company could choose whether to survey all members or select a statistically representative sample. In most cases companies decided to survey all workers. In all, more than 4,700 workers completed audit surveys. MASHA also tracked the number of surveys each company requested for its audit, and the number of completed surveys returned (please see Chart 1 below). Chart 1 The best response rate to the audit was among the grouping of middle and mine managers, and health and safety coordinators. However, the response from company senior executives and board members was disappointing. In fact, with only 43 per cent of the requested surveys returned completed, the province-wide response may not be a statistically-accurate reflection of the understanding and beliefs of this group. Since the IRS, by definition extends from the working face to the boardroom, the involvement of this group in the audit is extremely important. In administering and analysing the audit, MASHA used standard statistical approaches to ensure the results are reliable and accurately reflect the views of the group surveyed. Where a mine decided not to survey its entire population within a given survey group, site facilitators used a table to determine the required sample size, and a systematic approach to determine which individuals would be in the random sample group. This methodology, and the excellent response rate from most operations and within most survey groups, permits a high level of confidence that the province-wide results accurately reflect the perceptions of the group surveyed.
Survey Category # Questionnaires sent # Completed % Workers 6028 4783 79 % Support Staff 831 637 77 % Middle and Mine Managers, H&S Coordinator 299 277 93 % Joint Health and Safety Committee 327 274 84 % Front-line Supervision 535 431 81 % Senior Executives/VP and Directors 97 42 43 %
IRS Provincial Summary Report - 8 - October 2002
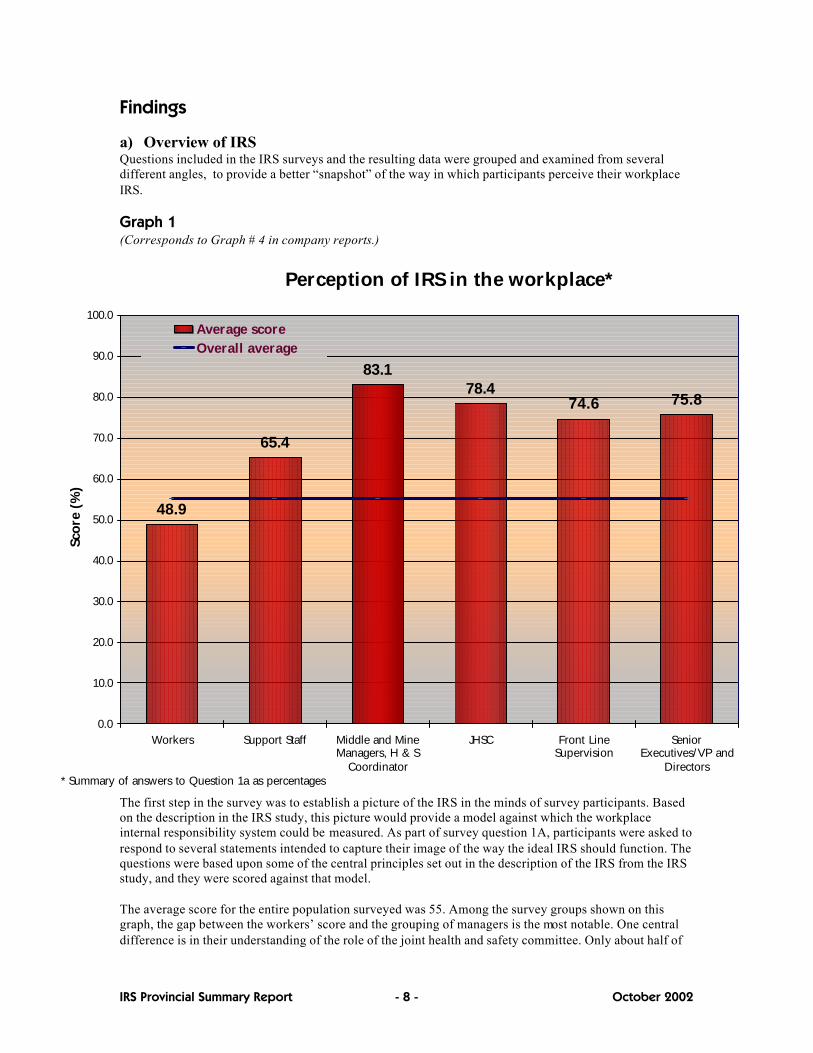
Findings a) Overview of IRS Questions included in the IRS surveys and the resulting data were grouped and examined from several different angles, to provide a better “snapshot” of the way in which participants perceive their workplace IRS. Graph 1 (Corresponds to Graph # 4 in company reports.)
The first step in the survey was to establish a picture of the IRS in the minds of survey participants. Based on the description in the IRS study, this picture would provide a model against which the workplace internal responsibility system could be measured. As part of survey question 1A, participants were asked to respond to several statements intended to capture their image of the way the ideal IRS should function. The questions were based upon some of the central principles set out in the description of the IRS from the IRS study, and they were scored against that model. The average score for the entire population surveyed was 55. Among the survey groups shown on this graph, the gap between the workers’ score and the grouping of managers is the most notable. One central difference is in their understanding of the role of the joint health and safety committee. Only about half of
Perception of IRS in the workplace*
48.9
65.4
83.178.4
74.6 75.8
0.0
10.0
20.0
30.0
40.0
50.0
60.0
70.0
80.0
90.0
100.0
Workers Support Staff Middle and MineManagers, H & S
Coordinator
JHSC Front LineSupervision
SeniorExecutives/VP and
Directors
Scor
e (%
)
Average scoreOverall average
* Summary of answers to Question 1a as percentages
IRS Provincial Summary Report - 9 - October 2002
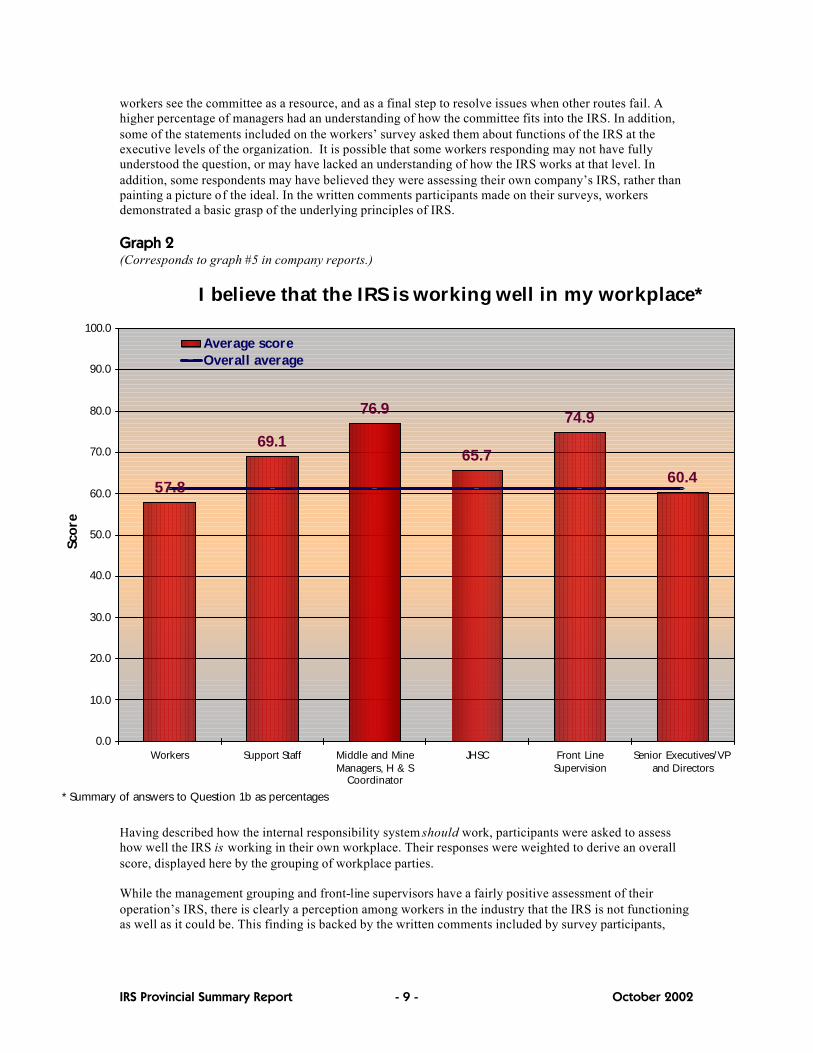
workers see the committee as a resource, and as a final step to resolve issues when other routes fail. A higher percentage of managers had an understanding of how the committee fits into the IRS. In addition, some of the statements included on the workers’ survey asked them about functions of the IRS at the executive levels of the organization. It is possible that some workers responding may not have fully understood the question, or may have lacked an understanding of how the IRS works at that level. In addition, some respondents may have believed they were assessing their own company’s IRS, rather than painting a picture of the ideal. In the written comments participants made on their surveys, workers demonstrated a basic grasp of the underlying principles of IRS. Graph 2 (Corresponds to graph #5 in company reports.)
Having described how the internal responsibility system should work, participants were asked to assess how well the IRS is working in their own workplace. Their responses were weighted to derive an overall score, displayed here by the grouping of workplace parties. While the management grouping and front-line supervisors have a fairly positive assessment of their operation’s IRS, there is clearly a perception among workers in the industry that the IRS is not functioning as well as it could be. This finding is backed by the written comments included by survey participants,
I believe that the IRS is working well in my workplace*
57.8
69.1
76.9
65.7
74.9
60.4
0.0
10.0
20.0
30.0
40.0
50.0
60.0
70.0
80.0
90.0
100.0
Workers Support Staff Middle and MineManagers, H & S
Coordinator
JHSC Front LineSupervision
Senior Executives/VPand Directors
Scor
e
Average scoreOverall average
* Summary of answers to Question 1b as percentages

IRS Provincial Summary Report - 10 - October 2002
many of which describe concerns about their company’s commitment to safety and response to reported hazards. In a number of cases, writers commented that safety at their site comes second to production. Also notable on this graph is the score for the senior executives and directors’ group. This is a very small group of respondents, and some did not answer this survey question, tending to lower the group’s score. Graph 3 (Corresponds to Graph #6 in company reports.)
Results from the same question, regarding how well participants believe their company’s IRS is working, were also grouped according to response to give a cross-section of the perception of the entire population surveyed. More than 75 per cent of all survey participants agreed – either somewhat or strongly – that the IRS is their workplace is working well. This assessment of the strength of the IRS is, of course, based upon the participants’ grasp of how the IRS should work.
We believe that the IRS is working well in our workplace
3.5 5.110.2
54.6
21.3
0.84.5
0.0
10.0
20.0
30.0
40.0
50.0
60.0
70.0
80.0
90.0
100.0
No Answer Strongly Disagree SomewhatDisagree
Somewhat Agree Strongly Agree Not Applicable Don't Know
Scor
e (%
)

IRS Provincial Summary Report - 11 - October 2002
Graph 4 (Corresponds to Graph #7 in company reports.)
Scores for effectiveness were arrived at by combining participants’ responses to the first set of questions regarding how the IRS should work, with their responses regarding how it is working. The overall average for the entire survey population was 36.1. b) Leadership and Understanding While individual surveys included anywhere from about 25 to more than 50 questions, in total roughly 400 survey questions were asked through the audit process. All questions were classified in one of two categories, measuring either leadership and commitment to the IRS, or understanding of the IRS.
The effectiveness of IRS in the workplace*
30.6
46.3
64.4
51.556.4
45.9
0.0
10.0
20.0
30.0
40.0
50.0
60.0
70.0
80.0
90.0
100.0
Workers Support Staff Middle and MineManagers, H & S
Coordinator
JHSC Front LineSupervision
Senior Executives/VPand Directors
Scor
e
Average scoreOverall average
* "Score" is derived by multiplying the responses given in question 1a with those given in question 1b (Q1a*Q1b).

IRS Provincial Summary Report - 12 - October 2002
Graph 5 (Corresponds to Graph #8 in company reports.)
All questions which related to leadership were scored, and their results are presented according to survey groupings. (This graph also displays the number of individuals who completed questionnaires in each group.) The graph assesses the commitment to the IRS that each respondent felt was reflected in different systems and levels of their workplace. Because the results are based on a number of more concrete questions about roles, relationships and practices, this may provide a more objective picture of the IRS than the responses based purely on subjective opinion reflected in the earlier overview graphs. For example, when compared to Graph 2, I Believe That The IRS Is Working Well In My Workplace, a substantial leveling of the gaps among survey groups is evident. The gap between workers and front-line supervisors is the most notable. This gap is due in part to workers’ responses on questions dealing with senior management. When asked about the corporate health and safety policy, or about leadership or commitment demonstrated by senior management, workers tended to score their companies lower.
How committed we are to promote and apply the IRS
57.960.4
66.5
58.9
67.3
56.7
637 277 274 431 42
4783
0.0
10.0
20.0
30.0
40.0
50.0
60.0
70.0
80.0
90.0
100.0
Workers Support Staff Middle and MineManagers, H & S
Coordinator
JHSC Front LineSupervision
SeniorExecutives/VP and
Directors
Scor
e (%
)
0
5 0 0 0
10000
15000
20000
25000
30000
35000
40000
45000
50000
% of Respondents# of Respondents

IRS Provincial Summary Report - 13 - October 2002
Graph 6 (Corresponds to Graph #9 in company reports.)
The assessment of understanding in Graph 6 differs from those in the earlier graphs in that it attempts to capture “real” understanding by examining responses to detailed questions about the way health and safety systems work. Again, results are presented by survey groupings, with the number of respondents shown on the bars. It is somewhat surprising to see joint health and safety committees rank the lowest on this scale. JHSC members, unlike workers or front-line supervisors for example, are asked questions about systems at all levels in the organization. Their low score may reflect a lack of familiarity with functions at the senior executive levels in their companies, and could demonstrate a lack of connection between the board and executives, and the health and safety systems at the operating level. For example, when asked about the CEO’s personal commitment to, and understanding of the IRS, about one third did not know. In addition, the group scored lower in assessing their own committee’s interactions with the JHSC for contractor companies in the workplace.
How well we understand the term "IRS"
64.6
73.2
80.3
60.7
71.070.3
4783
637 277 274 431 420.0
10.0
20.0
30.0
40.0
50.0
60.0
70.0
80.0
90.0
100.0
Workers Support Staff Middle and MineManagers, H & S
Coordinator
JHSC Front LineSupervision
SeniorExecutives/VP and
Directors
Scor
e (%
)
0
5000
10000
15000
20000
25000
30000
35000
40000
45000
50000
% of Respondents# of Respondents
IRS Provincial Summary Report - 14 - October 2002
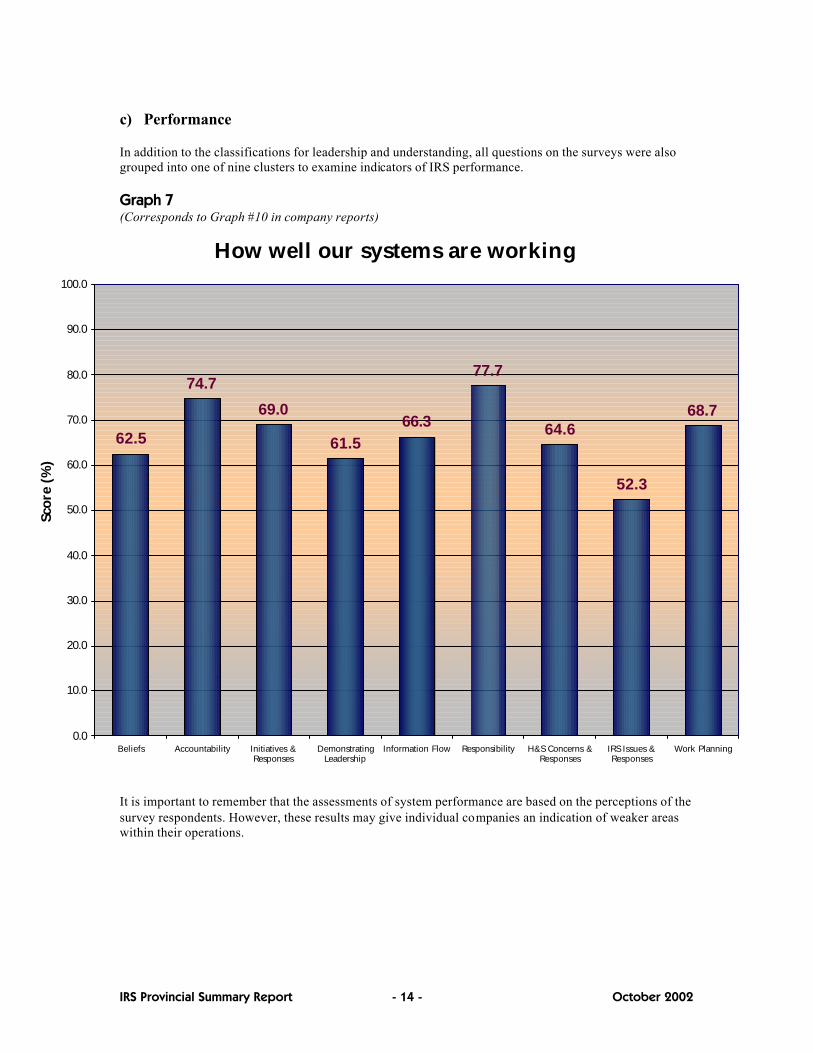
c) Performance In addition to the classifications for leadership and understanding, all questions on the surveys were also grouped into one of nine clusters to examine indicators of IRS performance. Graph 7 (Corresponds to Graph #10 in company reports)
It is important to remember that the assessments of system performance are based on the perceptions of the survey respondents. However, these results may give individual companies an indication of weaker areas within their operations.
How well our systems are working
62.5
74.7
69.0
61.566.3
77.7
64.6
52.3
68.7
0.0
10.0
20.0
30.0
40.0
50.0
60.0
70.0
80.0
90.0
100.0
Beliefs Accountability Initiatives &Responses
DemonstratingLeadership
Information Flow Responsibility H&S Concerns &Responses
IRS Issues &Responses
Work Planning
Scor
e (%
)
IRS Provincial Summary Report - 15 - October 2002
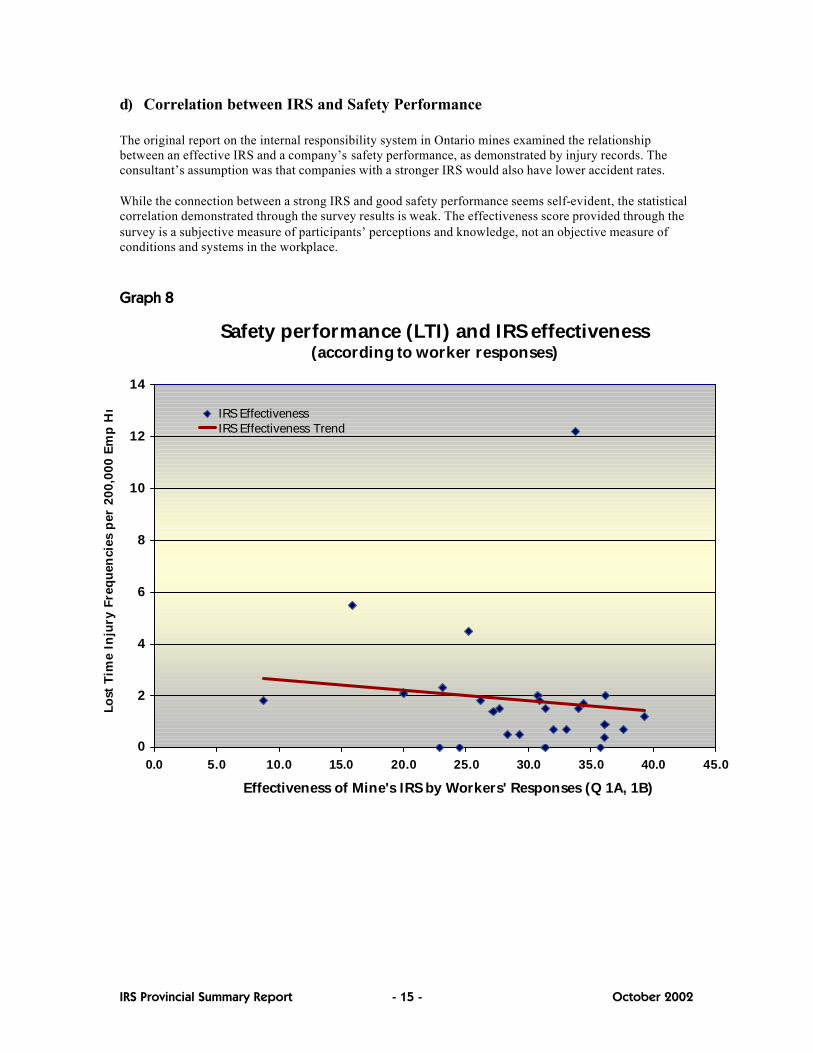
d) Correlation between IRS and Safety Performance The original report on the internal responsibility system in Ontario mines examined the relationship between an effective IRS and a company’s safety performance, as demonstrated by injury records. The consultant’s assumption was that companies with a stronger IRS would also have lower accident rates. While the connection between a strong IRS and good safety performance seems self-evident, the statistical correlation demonstrated through the survey results is weak. The effectiveness score provided through the survey is a subjective measure of participants’ perceptions and knowledge, not an objective measure of conditions and systems in the workplace. Graph 8
0
2
4
6
8
10
12
14
0.0 5.0 10.0 15.0 20.0 25.0 30.0 35.0 40.0 45.0
Effectiveness of Mine's IRS by Workers' Responses (Q 1A, 1B)
Lost
Tim
e In
jury
Fre
qu
enci
es p
er 2
00,0
00 E
mp
Hrs IRS Effectiveness
IRS Effectiveness Trend
Safety performance (LTI) and IRS effectiveness (according to worker responses)

IRS Provincial Summary Report - 16 - October 2002
Graph 9
Safety performance (TMI) and IRS effectiveness (according to worker responses)
0
5
10
15
20
25
0.0 5.0 10.0 15.0 20.0 25.0 30.0 35.0 40.0 45.0
Effectiveness of Mine's IRS by Workers' Responses (Q 1A, 1B)
Tota
l Med
ical
In
jury
Fre
quen
cies
per
200
,000
Em
p H
rs
IRS EffectivenessIRS Effectiveness Trend

IRS Provincial Summary Report - 17 - October 2002
e) Participant Comments Roughly one eighth of those who participated in the IRS survey also included written comments on their survey form. While it is impossible to accurately count and quantify these comments, they do serve to add more substance to the survey data. Particularly in the case of individual company reports, the comments can help to point out areas of weakness or concern in the internal responsibility system. In reviewing some 700 written comments compiled from all 27 audits, several common threads appear. There are many comments pertaining to IRS performance. For example, respondents complain about the lack of a timely response to problems or hazards they have reported to their immediate supervisor or raised at safety meetings, and that they are not taken seriously when they make a suggestion. The largest group of comments relate to leadership in the IRS. Respondents argue that despite stated commitments to safety, production is generally the top priority. Some complain that safety policies and procedures are not enforced, and a number criticize communication in their workplace. There were also a number of comments related to the survey itself. Some respondents found the wording of the questions confusing, or felt the questions were repetitive.
IRS Provincial Summary Report - 18 - October 2002
Conclusions The first round of IRS audits benefited from an excellent level of participation among underground mines in the province, and a high response rate among the survey groups, demonstrating the commitment to improvements that exists among all parties. The study on the internal responsibility system in Ontario mines has provided a standard description of the IRS, and outlines the roles and responsibilities of the workplace parties. However, the way in which that standard is put into practice differs from one company to another. Each company’s IRS is unique, and the biggest contribution the IRS audit can make is to provide companies with a baseline against which to measure changes in their own IRS. Companies must examine their own survey results to determine areas where improvements can be made. However, a few broad observations about the state of the internal responsibility system across the industry emerge from study of the data. 1. As a whole, respondents to the IRS survey appear to believe the IRS is working acceptably well.
However, on some questions and categories of results, workers who participated in the survey tended to be less positive. The data reflects a concern among some workers that the IRS is not as effective as it could be, and this observation is supported by the written comments included on some survey forms. While workers have a relatively positive perception of their relationship with front-line supervisors, the most pronounced concern identified is a lack of evident commitment to safety and to the IRS by management. For workers, this gap is manifested in part by slow response to hazards and issues that have been taken beyond the supervisory level.
It is also important to note that there is a substantial disparity between the perceptions of workers and the perceptions of supervisors across many of the graphs in the survey results. While workers perceive a strong relationship with their supervisors, the gap between the perceptions of the two groups may indicate that supervisors are not always passing along their knowledge about the IRS.
2. In the model of the internal responsibility system, joint health and safety committees are described
as having a contributive responsibility for health and safety, as compared to the direct responsibility held by directors, managers, supervisors and workers. In addition to their role set out in the Occupational Health and Safety Act, JHSCs (or health and safety representatives in smaller workplaces) are to act as a resource to other workplace parties, to promote IRS and serve as the system watchdog, and to step in to resolve issues only after other channels have been exhausted. However, this role may not be fully understood in the workplace. For example, though many survey respondents see the JHSC as a resource, fewer understand the committee’s position as a final resort in resolving issues and hazards. Only about one half of workers identified this role in the surveys.
In addition, the committee’s role as communication channel and internal auditor should acquaint it with functions at all levels of the organization, but survey responses indicate this is not always the case. JHSC members may not be familiar with functions at the senior levels of the company.
3. The rates of participation from the board room and executives, and the responses given at all
levels about the CEO’s and directors’ role in health and safety, seem to indicate that company directors and senior executives are somewhat disconnected from the operational aspects of health and safety. The description of the IRS includes some very clear responsibilities for these parties. For example, senior executive responsibilities include acting as a safety role model for the company, ensuring policies and programs are in place, establishing regular IRS audits, and holding staff accountable for health and safety performance.
Company directors are charged with setting a vision for health and safety performance for their companies, requiring reports on the health of the IRS, and holding executives accountable for that
IRS Provincial Summary Report - 19 - October 2002
performance. A number of logistical factors hindered full participation in the survey by board members in particular, but it would appear their role in the IRS is not well understood by other parties in the workplace, and perhaps not by the directors themselves.
4. The IRS is a difficult concept to grasp. The model for the IRS extends from boardroom to working
face, and reaches out from there to include health and safety committee and safety staff, unions, the safety association, the Workplace Safety and Insurance Board, and the Ministry of Labour. The full extent of the IRS as it was envisioned by James Ham and re -stated in the recent IRS report is not always clearly understood by all parties. The best indication of this is the response to a broad range of questions related to understanding of the IRS, where the results range widely for various survey groups.
5. Confusion among survey respondents about the concept of IRS may have been further complicated by a lack of clarity in some of the survey questions. However, most survey respondents, particularly those in the mine site itself, have a good practical knowledge of how an effective IRS should look at their level. Even if they’ve never heard the term before, they understand what the IRS means to daily communication, accountability and responsibility. This is demonstrated in the many written comments included on the survey forms.

IRS Provincial Summary Report - 20 - October 2002
Next Steps 1. Company approaches
Because an internal responsibility system is, by its nature, unique to the company, any substantive improvement in the mining industry’s IRS can only come through improvement to those individual systems. • Develop individual plans of action . Companies will need to examine their results, including comments made by survey participants, cross-reference them with other system audits and knowledge, identify areas for improvement, and work on practical plans for change. • Continue to audit. The IRS audits completed in 2002 are a first step. They provide a baseline against which companies can continue to measure their progress in building stronger internal responsibility systems. An impressive commitment to health and safety has been demonstrated, both by companies which undertook the audit, and by those who took the time to complete the surveys. However, continuous improvement requires measurement. It will be important for companies to evaluate their internal responsibility systems again and again.
2. Industry-wide approaches
While real improvements to internal responsibility systems must happen at the local level, Ontario’s mining industry also requires a commitment to tackle issues that the provincial IRS data showed are common across the sector. • Strengthen the link between managers and workers. Workers see the IRS in action mainly through their contact with their immediate supervisor. That relationship will always be challenging, but it is viewed positively by both workers and supervisors. However, a strong IRS also requires a demonstrated commitment, and active involvement by managers in the workplace. Both the survey data and the written comments submitted indicate a perception that company managers are not demonstrating a commit ment to safety and are not familiar enough with conditions at the working face. The relationship between manager and workers can be improved by working through the strong connection at the front line. Through that relationship, managers can demonstrate that supervisors have been given the support and authority to resolve hazards and issues. While the worker-manager relationship is necessarily more distant than the one between workers and their supervisors, showing a visible commitment to safety and a direct interest in workers’ concerns is an important aspect of leadership communication and of a healthy IRS. • Strengthen the joint health and safety committee’s role within the IRS . The parameters for most joint health and safety committees are determined mainly by the powers set out in the Occupational Health and Safety Act. However, the description of the IRS in the recent study envisions a broader role for these committees. A clearer understanding of these roles and responsibilities is needed, both by the committees themselves and by other parties in the system. This is particularly important for workers, who may not always understand where the committee fits in the chain of communication related to resolving hazards, or how to tap into the committee as an information resource. • Create stronger links between company executives and boards, and the operations. The model for the IRS describes specific roles for directors and senior executives. However, these are not well recognized at any level. Better approaches are needed to help boards and CEOs communicate safety priorities and strategies with their operations.
IRS Provincial Summary Report - 21 - October 2002
3. System-wide approaches
Parties within the company and workplace are the keys to the IRS. However, a number of external parties – unions, the safety association, Workplace Safety and Insurance Board, and the Ministry of Labour – also have important roles to play in supporting the systems in the workplace. • Build a common understanding of IRS. While a healthy IRS may look different in every organization, it will always share common characteristics. In order to improve internal responsibility systems across the industry, it is important that everyone – both those with direct responsibility like workers and managers, and those with contributive responsibility like the MOL, the WSIB and the safety association – share a picture of those common characteristics. To be effective in supporting workplaces, even these external parties must be aligned in their understanding and approach to IRS. This understanding must be made manifest in the contacts made through training, information, enforcement and incentives delivered to the workplaces. • Improve the IRS survey tool. One means of supporting the workplace IRS will be ensuring that workplaces continue to have an effective auditing tool to measure their progress. The survey tool needs to be simplified and sharpened, and the process aligned with other evaluation processes, both internal and external to the operations.