The interaction of photoexcited carbon nanodots with metal ... · tion of photo-generated...
11
Registered charity number: 207890 Showcasing the collaborative work of the Laboratory of Advanced Materials Physics, Department of Physics and Chemistry, ATeN Center, University of Palermo, Italy, and the Laboratory of Ultrafast Molecular Spectroscopy, Institute of Applied Physics, University of Bern, Switzerland. The interaction of photoexcited carbon nanodots with metal ions disclosed down to the femtosecond scale Carbon nanodots are a fascinating family of nanomaterials well known for their bright fluorescence. We addressed their ability to behave as efficient electron donors in a model system where carbon dots are coupled to copper ions. We clarified for the first time the complex interaction between photoexcited carbon dots and metal ions from femtosecond to steady state, highlighting the key role of the solvent in driving charge transfer from the surface of the dots to the coupled system. Nanoscale rsc.li/nanoscale ISSN 2040-3372 PAPER Hyomin Lee, Sung Jae Kim et al. A concentration-independent micro/nanofluidic active diode using an asymmetric ion concentration polarization layer Volume 9 Number 33 7 September 2017 Pages 11819–12198 As featured in: rsc.li/nanoscale See A. Cannizzo, F. Messina et al., Nanoscale, 2017, 9, 11902.
Transcript of The interaction of photoexcited carbon nanodots with metal ... · tion of photo-generated...
Registered charity number: 207890
Showcasing the collaborative work of the Laboratory of
Advanced Materials Physics, Department of Physics and
Chemistry, ATeN Center, University of Palermo, Italy, and the
Laboratory of Ultrafast Molecular Spectroscopy, Institute of
Applied Physics, University of Bern, Switzerland.
The interaction of photoexcited carbon nanodots with metal
ions disclosed down to the femtosecond scale
Carbon nanodots are a fascinating family of nanomaterials well
known for their bright fl uorescence. We addressed their ability
to behave as effi cient electron donors in a model system where
carbon dots are coupled to copper ions. We clarifi ed for the fi rst
time the complex interaction between photoexcited carbon dots
and metal ions from femtosecond to steady state, highlighting
the key role of the solvent in driving charge transfer from the
surface of the dots to the coupled system.
Nanoscalersc.li/nanoscale
ISSN 2040-3372
PAPER Hyomin Lee, Sung Jae Kim et al. A concentration-independent micro/nanofl uidic active diode using an asymmetric ion concentration polarization layer
Volume 9 Number 33 7 September 2017 Pages 11819–12198
As featured in:
rsc.li/nanoscale
See A. Cannizzo, F. Messina et al. , Nanoscale , 2017, 9 , 11902.

Nanoscale
PAPER
Cite this: Nanoscale, 2017, 9, 11902
Received 26th May 2017,Accepted 5th June 2017
DOI: 10.1039/c7nr03754f
rsc.li/nanoscale
The interaction of photoexcited carbon nanodotswith metal ions disclosed down to thefemtosecond scale†
A. Sciortino,a,b,c A. Madonia,a M. Gazzetto,c L. Sciortino,a E. J. Rohwer,c T. Feurer,c
F. M. Gelardi,a M. Cannas,a A. Cannizzo*c and F. Messina *a,d
Fluorescent carbon nanodots are a novel family of carbon-based nanoscale materials endowed with an
outstanding combination of properties that make them very appealing for applications in nanosensing,
photonics, solar energy harvesting and photocatalysis. One of the remarkable properties of carbon dots is
their strong sensitivity to the local environment, especially to metal ions in solution. These interactions
provide a testing ground for their marked photochemical properties, highlighted by many studies, and fre-
quently driven by charge transfer events. Here we combine several optical techniques, down to
femtosecond time resolution, to understand the interplay between carbon nanodots and aqueous metal
ions such as Cu2+ and Zn2+. We find that copper inhibits the fluorescence of carbon dots through static
and diffusional quenching mechanisms, and our measurements allow discriminating between the two.
Ultrafast optical methods are then used to address the dynamics of copper-dot complexes, wherein static
quenching takes place, and unveil the underlying complexity of their photocycle. We propose an initial
increase of electronic charge on the surface of the dot, upon photo-excitation, followed by a partial elec-
tron transfer to the nearby ion, with 0.2 ps and 1.9 ps time constants, and finally a very fast (≪1 ps) non-
radiative electron–hole recombination which brings the system back to the ground state. Notably, we find
that the electron transfer stage is governed by an ultrafast water rearrangement around photo-excited
dots, pointing out the key role of solvent interactions in the photo-physics of these systems.
Introduction
Carbon nanodots (CDs) are a recent class of nanomaterials,which have received great attention in the broad world ofnanoscience since their accidental discovery in 2004.1 The greatinterest in these systems may be mostly attributed to their fasci-nating photoluminescence,2 uncommon in C-based nanoscalematerials, usually tunable throughout the visible range, andhighly sensitive to the environment or to interactions with exter-nal agents. Moreover, CDs combine these remarkable fluo-rescent capabilities with an apparent lack of toxicity,3 highwater solubility,4 and easy synthesis procedures.5
The use of CDs in nano-sensing applications has beenintensively studied as one of their most interesting appli-cations. CDs are highly responsive to the presence of metalions in solution, and many studies have reported a variation(quenching or enhancement) of their luminescence in thepresence of different types of ions.6–13 Depending on thesurface structure of the CD, these interactions can be veryselective and reversible. For instance, Zhang et al. reportedan interaction between CDs and Fe3+ ions, and the conse-quent quenching of CD emission, already at nanomolar ironconcentrations,9 while Zong et al. showed how the fluo-rescence of CDs is turned off when they come in contact withCu2+ ions, and how it is turned back on by addition ofL-cysteine, which detaches the ions from the dot surface.8
The most popular explanation for these quenching phenom-ena invokes an efficient electron transfer from CDs to metalions or molecules, which hinders the radiative recombina-tion of photo-generated excitons.14 Interestingly, someresearch studies have suggested that these CD–metalquenching interactions are influenced by the solvent,14
suggesting a role of solvation in the underlying photochemi-cal interactions.
†Electronic supplementary information (ESI) available. See DOI: 10.1039/c7nr03754f
aDipartimento di Fisica e Chimica, Università degli Studi di Palermo,
Via Archirafi 36, 90123 Palermo, ItalybDipartimento di Fisica e Astronomia, Università degli Studi di Catania,
Via Santa Sofia 64, 95123 Catania, ItalycInstitute of Applied Physics, University of Bern, Sidlerstrasse 5, CH-3012 Bern,
Switzerland. E-mail: [email protected] – ATeN Center, Università degli Studi di Palermo, Viale delle Scienze,
Edificio 18, 90128 Palermo, Italy. E-mail: [email protected]
11902 | Nanoscale, 2017, 9, 11902–11911 This journal is © The Royal Society of Chemistry 2017
Publ
ishe
d on
07
June
201
7. D
ownl
oade
d by
ET
H-Z
uric
h on
14/
05/2
018
10:5
7:03
.
View Article OnlineView Journal | View Issue

As a matter of fact, the ability of CDs to act as efficientphoto-activated electron acceptors or donors is rather well-established and not limited to the interaction with transitionmetal ions. These photochemical properties of CDs areregarded as one of their most interesting hallmarks because oftheir impact in the design of several types of functional hybridnanoscale systems. For instance, similar charge transferdynamics are observed between CDs and metal complexes,15
or when CDs are adsorbed onto the semiconductor surface16
and may allow for their use as green substitutes of metal-com-plexes to harvest solar energy in dye-sensitized solar cells(DSSC),17 or to strongly enhance the photocatalytic activity ofsemiconductor nanoparticles such as TiO2, Cu2O, andFe2O3.
18–22 Understanding these photochemical interactions ofCDs is of crucial importance to optimize potentially far-reach-ing applications, and may provide precious information on thevery nature of CD electronic transitions. In fact, there are stillseveral open questions about the emission process of CDs,especially with regard to the interplay between core- andsurface-related electronic states. We recently proposed23 thatthe lowest-energy optical transitions of CDs involve an increaseof the electronic charge on surface functional groups at theexpense of nearby core atoms. This indicates a transition typi-fied by a certain charge separation character. Because of this,the surface electron should be especially prompted to partici-pate in charge transfer dynamics, possibly explaining thestrong interactions of CDs with metal ions. Actually, chargetransfer processes involving semiconductor quantum dots areoften mediated by their surface groups.24
We carried out a study aimed to thoroughly clarify the inter-actions between photo-excited CDs and metal ions in solution,using Cu2+ as a model system. If electron transfer dynamicsare implicated in these interactions, Cu2+ should be a verygood candidate to clarify them, considering its open-shell elec-tronic configuration ([Ar]3d9), the fairly positive redox poten-tial, and the fact that its absorption spectrum does not overlapwith either the absorption or the emission bands of CDs.Since fluorescence quenching often occurs over an extremelyshort time scale (picoseconds or less25), the use of femto-second-time-resolved spectroscopy is mandatory to observethese events in real time. To date, studies of CDs with sub-picosecond optical spectroscopy are still rare.26–28
In our study, we find that CD fluorescence is quenched byCu2+ ions through a combination of dynamic and staticquenching mechanisms. While the former are due to colli-sional encounters related to the high concentration of ions,the latter arise from the formation of CD/Cu2+ complexes,whereby our results suggest that a single Cu2+ ion binding tothe dot surface is enough to quench its emission.Interestingly, the static and dynamic quenching rates areaffected by significant dot-to-dot variations related to theheterogeneity of the system, leading to photoselection effects.Most importantly, by resolving in time the photocycle of CD/Cu2+ complexes, our experiments unveil the ultrafast, charac-teristic mechanism and ultrafast time scale of fluorescencequenching events. The emissive electron–hole pair generated
by photo-excitation is decoupled by a partial electron transfertowards the ion, followed by a remarkably fast (≪1 ps) non-radiative electron–hole recombination, which concludes thephotocycle. Furthermore, we demonstrate that the electrontransfer is controlled by picosecond and sub-picosecondsolvent rearrangements around the photo-excited site, pro-gressively lowering the reaction barrier. In this sense, solventmolecules are a vital component of the photochemical behav-ior of CDs, rather than spectators.
Experimental sectionSample preparation and characterization
The synthesis of CDs was carried out by the microwave-induced hydrothermal decomposition of an aqueous solutionof citric acid and urea, in a 1 : 1 weight ratio. Urea is added inthe synthesis as a source of nitrogen doping in order toenhance the optical properties of the nanomaterial. The syn-thesis procedure and the successive characterization of thesenanomaterials by high-resolution transmission electronmicroscopy, electron diffraction, atomic force microscopy,X-ray photoelectron spectroscopy, and Fourier-transform infra-red absorption have been described in detail in a previousstudy.29 Briefly, these CDs are 3 nm sized carbon nitride nano-crystals, surface-functionalized with amide and carboxylicgroups.29
Steady-state and nanosecond time-resolved opticalmeasurements
All the solutions measured here by steady-state optical tech-niques and time-resolved fluorescence were prepared by dissol-ving a 8 mg L−1 concentration of CDs in milliQ water, togetherwith different amounts of Cu(NO3)2, CuSO4 or ZnSO4 (Sigma-Aldrich). All measurements were carried out at room tempera-ture. The absorption spectra were recorded by using a doublebeam spectrophotometer (JASCO V-560) in the 220–750 nmrange in a 1 cm quartz cuvette. The emission spectra wererecorded with a JASCO FP-6500 spectrofluorometer in a 1 cmcuvette and infrared absorption spectra were recorded on aN2-purged, Bruker VERTEX-70 spectrophotometer, in trans-mission geometry. The measurements were performed at roomtemperature under nitrogen flux to eliminate the effect ofresidual water in the air. Samples were prepared by depositingdrops of a CD + Cu(NO3)2 solution on a sapphire window anddrying under vacuum. Time-resolved fluorescence measure-ments were performed by using a tunable laser system consist-ing of an optical parametric oscillator pumped by aQ-switched Nd:YAG laser (5 ns pulses at a 10 Hz repetitionrate). Fluorescence spectra were recorded on an intensifiedcharge coupled device (CCD) camera, integrating the signalwithin temporal windows of 0.5 ns duration after variabledelays from the laser pulse. The obtained decay kinetics of thephotoluminescence were least-squares fitted to exponentialfunctions convoluted with a Gaussian instrumental responsefunction (IRF) with a 5 ns full width at half maximum
Nanoscale Paper
This journal is © The Royal Society of Chemistry 2017 Nanoscale, 2017, 9, 11902–11911 | 11903
Publ
ishe
d on
07
June
201
7. D
ownl
oade
d by
ET
H-Z
uric
h on
14/
05/2
018
10:5
7:03
. View Article Online

(FWHM), determined by the laser temporal profile. The accu-racy on the time constant of the decays is about 0.2 ns.
Femtosecond-resolved transient absorption
The broadband femtosecond transient absorption (TA)measurements on the solution of pure CDs in water andethanol, and on CDs + 100 mM Cu2+ in water were based on a1 kHz Ti:sapphire regenerative amplifier system which gener-ates 90 fs pulses at 800 nm with 0.8 mJ pulse energy. Thebeam is split to generate pump and probe beam paths. Thepump passes through an ultrathin BBO (Beta Barium Borate)crystal where it is frequency doubled to produce the excitationat 400 nm, which is then chopped at a repetition rate of 500Hz, and synchronized with a regenerative amplifier output. Forprobing, a referenced broadband detection scheme is adopted.A white light pulse (350 to 700 nm) is generated by focusing afraction of the fundamental in a 5 mm thick CaF2 crystal.Then it is split into two identical beams: one (the probe) isoverlapped with the pump in the sample and the other (thereference) is sent through an unpumped volume of the sampleto correct for white-light fluctuations on a single shot basis.The pump–probe delay t is controlled by a motorized delaystage. Pump and probe are synchronously collected with amulti-camera detector system (Glaz Linescan-I) with single-shot capability. The spectrum of probe and reference pulses ismeasured on a single-shot basis, and successive pumped andunpumped probe shots (due to the chopper) are compared tocorrect for the drift of transmission baseline over time. This isused to calculate the TA signal, that is, the change ΔOD(λ,t ) inthe absorption of the sample induced by photo-excitation. Atypical signal is obtained by averaging 1000 pumped and 1000unpumped spectra for each delay, and scanning over thepump–probe delay 4–5 times.
The single-wavelength TA measurements and the broad-band measurement on the solution of CDs + 30 mM Zn2+ arebased on a 5 kHz Ti:sapphire femtosecond ultrafast amplifier(Solstice-Ace) which generates 50 fs pulses at 800 nm with0.7 mJ energy, split (80%/20%) to generate the pump and theprobe. Also in this setup, the pump beam is frequency-doubled by an ultrathin BBO crystal in order to create a400 nm beam which is then chopped at 500 Hz, whereas thewhite light beam is generated in a 2 mm quartz cuvette con-taining D2O, generating a broadband pulse extending from400 to 700 nm. After overlapping with the pump within thesample, the probe beam is dispersed on the detector througha Brewster-angle silica prism and the measurement wavelengthis selected by a variable slit, which guarantees a spectralresolution of 3 nm at 550 nm. The detector used for the single-wavelength measurements is a photomultiplier connected to alock-in amplifier. The latter, triggered by the chopper, allowsextracting the TA signal as a component of the probe signallocked to the chopper frequency. A typical signal is obtainedby scanning 10 times the pump/probe delay, and using an inte-gration time of 1.5 s per point. The obtained time traces wereleast-squares fitted to multi-exponential functions convolutedwith the Gaussian IRF of the setup, having a FWHM = 120 fs.
For the broadband measurement performed in this setup, thedetector is the multi-camera system (Glaz Linescan-I) as illus-trated above.
The broadband and the single-wavelength measurementsare collected at room temperature under the same conditions.The solutions were prepared by adding the same amount ofCDs (final concentration of about 1.2 g L−1), and were continu-ously circulated in a 0.2 mm thick flow cell, in order to havean absorbance value of 0.3 OD at 400 nm. The measurementswere performed in the linear regime with an energy of about100 nJ per pulse and we checked that the signal was not con-centration dependent. All measurements were carried outunder, so-called, magic angle detection conditions, such thatthey are not affected by rotational diffusion or depolarizationdynamics. The data presented in the paper were subjected tostandard correction procedures which eliminate the effects ofcross-phase modulation (XPM) and group velocity dispersion(GVD).
Results and discussionEffect of metal ions on CD fluorescence: static and dynamicquenching
CDs were synthesized by a single-step procedure based onmicrowave-induced decomposition of citric acid and urea. Asreported in greater detail in ref. 29, the core of these CDs has acarbon nitride crystalline structure and their surface shell isrich in carboxylic and amide groups. We show in Fig. 1a theirelectronic absorption spectrum, peaking around 400 nm(purple spectrum). We dispersed a given amount of dots inwater, together with different amounts of Cu2+ ions, andstudied how their optical properties change with the increaseof ion concentration. Fig. 1b displays the steady state emissionspectra excited at 440 nm of an aqueous solution of CDs(8 mg L−1) and variable concentrations of copper nitrate. It isevident that the photoluminescence is quenched by the ions,similar to previous reports in the literature.8 Since effects inFig. 1 are essentially independent of the counter ion (Fig. S1 inthe ESI†), quenching can be safely attributed to the interactionwith aqueous Cu2+. In the inset of Fig. 1b, we report how theluminescence intensity decreases with increasing [Cu2+]:appreciable variations of the emission intensity are observedat concentrations as low as 2 µM, where we detect a ΔI/I0 ≈10% reduction, and a very marked quenching is observedwhen the copper concentration reaches the millimolar range,with a ΔI/I0 ≈ 50% loss of the luminescence efficiency recordedat [Cu2+] = 2 mM. We also see a blue shift of the band from525 nm down to 512 nm, measured at [Cu2+] = 500 mM togetherwith an intensity reduction of ΔI/I0 ≈ 96%. We also investigatedthe effect of Cu2+ ions on the steady state absorption properties:as shown in Fig. 1a, the addition of metal ions causes an inten-sity reduction and a blue shift (>20 nm when [Cu2+] = 500 mM)of the absorption band at 400 nm.
We performed nanosecond time-resolved fluorescencemeasurements (Fig. 2 and Table 1), in order to disentangle
Paper Nanoscale
11904 | Nanoscale, 2017, 9, 11902–11911 This journal is © The Royal Society of Chemistry 2017
Publ
ishe
d on
07
June
201
7. D
ownl
oade
d by
ET
H-Z
uric
h on
14/
05/2
018
10:5
7:03
. View Article Online

static and dynamic quenching mechanisms. In Fig. 2a and b,we show the 2-dimensional (2D) time-wavelength plots of thefluorescence intensity of the bare CD solution and of bare CD +50 mM copper ions excited at 440 nm, respectively. Thephotoluminescence decay kinetics at a fixed emission wave-length, such as those in Fig. 2c, are obtained by a vertical cutof the 2D-plot and the emission spectra at a fixed time areobtained by a horizontal cut of the same plot and then nor-malized, as shown in Fig. 2d. The decay kinetics of bare CDsare single-exponential, with a lifetime of τ0 = 6.2 ns, and dis-plays no spectral evolution. We find that diffusion-controlled(i.e. dynamic) quenching comes into play only above a certainCu2+ concentration, as revealed by a decrease of the lifetime:we detect the first deviations of the fluorescence kinetics at[Cu2+] = 20 mM (green curve in Fig. 2c, τ0 = 5.0 ns), and thelifetimes continue to decrease at higher quencher concen-trations down to <2.0 ns. In the presence of copper, at fixedconcentrations, we also see that a blue shift of the band occursduring the decay, as shown in Fig. 2d. In fact, the lifetimebecomes slightly emission-dependent: as shown in Fig. S2,†the lifetimes of the emission band when [Cu2+] = 50 mM spanfrom 3 ns (emission wavelength 490 nm) to 4.6 ns (600 nm).
However, such a diffusion-controlled mechanism cannotexplain the quenching observed at millimolar concentrationsand lower, when the probability of collisions between diffusingCu2+ and CDs during the excited-state lifetime is negligible.This is evident if we consider the significant quenchingobserved at extremely low concentrations: considering thetypical bimolecular diffusion-limited reaction rates in water(K ≈ 1010 M−1 s−1),30 the expected quenching I/I0 due to collisionscan be roughly estimated as (1 + τ0K[Cu
2+])−1. For [Cu2+] =2 µM, this only gives ΔI/I0 = 5 × 10⁻⁵, several orders of magni-tude less than what we observed (ΔI/I0 ≈ 10%, as in Fig. 1). Infact, as previously reported for other CDs,12 we find that thelifetime is unchanged (τ = 5.9 ns, blue and light blue datasetsin Fig. 2c) up to [Cu2+] = 4 mM, although the emission inten-sity decreases twofold (as in Fig. 1b). Fundamentally, adecrease of the amplitude without shortening of the lifetimecan only be explained by the presence of non-radiative chan-nels affecting the excited state population on time scales muchshorter than the time resolution. On these time scales, themechanism cannot be diffusional and it points to a mecha-nism where copper ions are in interaction with the dots beforeand during photoexcitation.
Fig. 1 (a) Selected absorption spectra of CDs as measured in the pres-ence of different Cu2+ concentrations. The edge below 350 nm is due tothe electronic transitions of the counterion (NO3
−). (b) Steady-stateemission spectra excited at 440 nm of CDs dissolved in water togetherwith Cu2+ ions in concentrations ranging from zero to 500 mM (increas-ing along the arrow). Inset: Photoluminescence intensity, normalized tobare CDs, versus Cu2+ concentration. Selected values are reported inTable 1.
Fig. 2 Fluorescence 2-dimensional plots of bare CDs in water excitedat 440 nm (a), and with a Cu2+ concentration of 50 mM (b); the featureat 440 nm is the excitation laser pulse. (c) Normalized decay fluo-rescence of CDs excited at 440 nm in water with zero (blue markers),4 mM (light blue markers), 20 mM (green markers), 50 mM (yellowmarkers), 100 mM (orange markers), 200 mM (red markers), and500 mM (brown markers) concentration of copper ions, together withthe laser pulse (purple markers), with the respective least-squares fittingcurves. (d) Normalized emission spectra recorded for [Cu2+] = 50 mM atdifferent times: 2.5 ns (purple), 5 ns (green) and 7.5 ns (red).
Nanoscale Paper
This journal is © The Royal Society of Chemistry 2017 Nanoscale, 2017, 9, 11902–11911 | 11905
Publ
ishe
d on
07
June
201
7. D
ownl
oade
d by
ET
H-Z
uric
h on
14/
05/2
018
10:5
7:03
. View Article Online
Hence, the quenching is purely static, i.e. occurring withoutcollisions, up to millimolar Cu2+ concentrations: ground-stateinteractions between CDs and Cu2+ ions lead to the formationof weakly or non-luminescent CD–Cu2+ complexes. As observedin Fig. 1 and 2 for [Cu2+] = 4 mM, in this regime the emissionkeeps the same lifetime and spectral characteristics, asexpected for static quenching, because the observed steady-state fluorescence only arises from the remaining, uncom-plexed dots. In contrast, both bare CDs and CD–Cu2+ com-plexes contribute to the absorption spectrum, and changes areobserved (Fig. 1a). The observed intensity reduction of theabsorption band indicates a significant perturbation of theelectronic wavefunction, clearly demonstrating the close proxi-mity of Cu2+ ions on the surface of CDs. The absorption blueshift possibly arises from electrostatic screening of CD–Cu2+
complexes, hampering solvent-induced stabilization, whichusually red shifts CD transitions.31 Also a ground state stabiliz-ation effect is very likely: from the very fact that the formationof CD–Cu2+ complexes occurs spontaneously, Cu2+ atomsbinding to the surface of the dots are expected to stabilizetheir ground-state energy, leading to a blue shift in the OAspectra. Another interesting piece of information that can beinferred from the absorption spectra is that the latter continueto evolve even above the onset (≈10 mM) of dynamic quench-ing, suggesting a continuous increase of static effects up to thelargest quencher concentrations we explored. We use theequation I/I0 = (1 − f )(τ/τ0) to estimate the portions of CDpopulation which undergo static ( f ) and dynamic (1 − f )quenching. At the maximum copper concentration ([Cu2+] =500 mM) we explored, I/I0 = 0.05 and τ = 1.5 ns, correspondingto f = 80%, indicating that static quenching is alwaysdominant.
Finally, from the inset of Fig. 1b, another interesting effectis that the quenching effect is spread across the entire concen-tration range we explored. The response to copper of the emis-sion intensity is very broad both in the static and dynamicquenching concentration range. This behavior suggests abroad distribution of both the reaction rates, fluctuating fromdot to dot. The distribution of the static quenching rate mayarise from different surface structures of the dots corres-ponding to different association rate constants with Cu2+ ions,while the distribution of the dynamic rate is probably due todifferent capture radii, linked to different sizes of the dots.
Such a heterogeneous response of different CDs to Cu2+ ionsshould give rise to photoselection effects, explaining both theblue shift of the steady-state fluorescence at high Cu2+ concen-trations in Fig. 1b (red-emitting dots have larger associationconstants and are the first to undergo static quenching) andthe emission-dependence of the lifetime in Fig. S2† (red-emit-ting dots have larger capture radii for diffusing Cu2+ ions,hence shorter lifetimes).
Sub-nanosecond fluorescence quenching induced by Cu2+
The dependence of fluorescence quenching on the metal ioncontent and the mono-exponential ns decay at any concen-tration, definitively points to the involvement of picosecond oreven sub-picosecond deactivation mechanisms. Therefore, weperformed femtosecond transient absorption (TA) measure-ments on aqueous solutions of carbon nanodots with differentcontents of copper ions, excited by 90 fs pulses at 400 nm. Wecollected broadband TA measurements on an aqueous solu-tion of bare CDs, and on a solution of CDs with [Cu2+] =100 mM. The data are shown as time-wavelength 2D-plots inFig. 3a and b. The spectra at selected times, such as those inFig. 3c and d and Fig. S3,† are obtained by vertical cuts of the2D-plot.
In bare CDs, data at all delays show three contributions tothe TA signal: (i) a negative contribution around the pumpwavelength, mostly due to ground state bleaching (GSB) associ-ated with the depopulation of the ground state via photo-exci-tation, with the possible addition of a stimulated emissiondue to a fluorescence signal peaking at 420 nm; (ii) a strongstimulated emission (SE) at 520–550 nm, corresponding to anordinary fluorescence signal except for its negative sign; and(iii) several positive excited state absorption (ESA) signals, atλ < 400 nm, λ ∼ 470 nm, and λ > 600 nm, respectively, due toelectronic transitions from the excited state towards higherexcited states. We observe spectral evolution only in the firstpicoseconds, which mainly consists of a dynamical Stokesshift of the SE signal from 520 nm to 554 nm (Fig. S3†).Afterwards, no further dynamics are observed. As shown inFig. 3b and d, the shape of the signal in the presence of Cu2+
is almost the same as bare CDs. However, in the presence ofCu2+, all the components of the signal undergo a decay over atime scale of a few picoseconds, which is not observed for bareCDs.
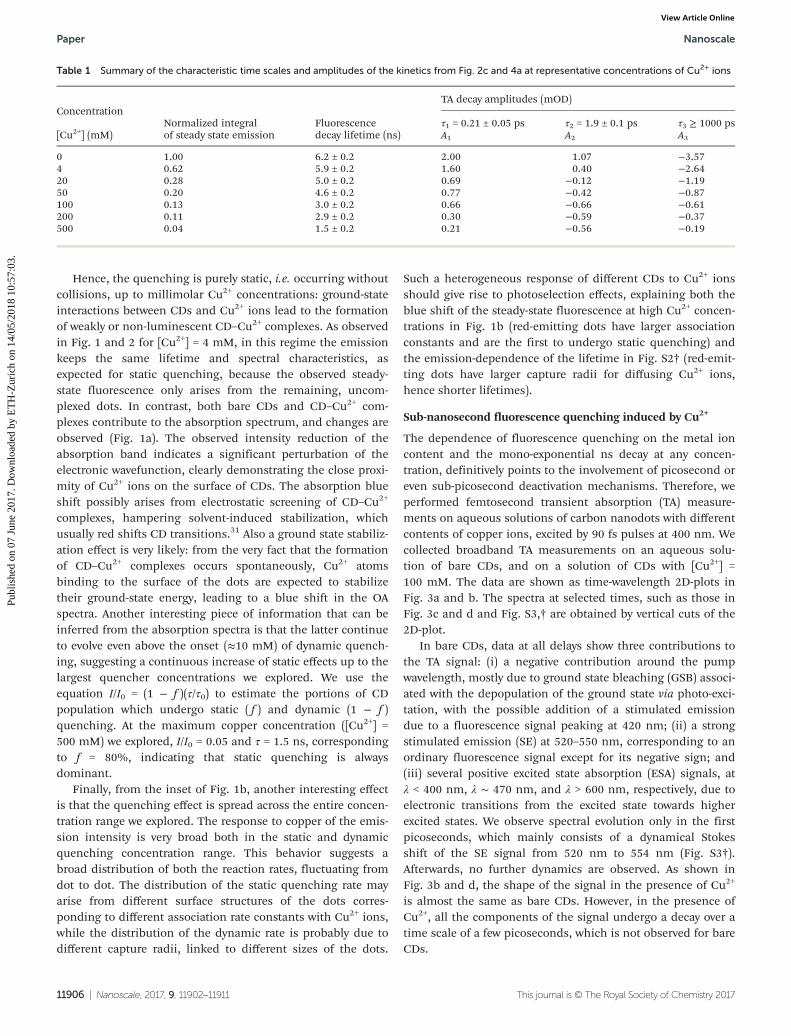
Table 1 Summary of the characteristic time scales and amplitudes of the kinetics from Fig. 2c and 4a at representative concentrations of Cu2+ ions
ConcentrationNormalized integralof steady state emission
Fluorescencedecay lifetime (ns)
TA decay amplitudes (mOD)
[Cu2+] (mM)τ1 = 0.21 ± 0.05 ps τ2 = 1.9 ± 0.1 ps τ3 ≥ 1000 psA1 A2 A3
0 1.00 6.2 ± 0.2 2.00 1.07 −3.574 0.62 5.9 ± 0.2 1.60 0.40 −2.6420 0.28 5.0 ± 0.2 0.69 −0.12 −1.1950 0.20 4.6 ± 0.2 0.77 −0.42 −0.87100 0.13 3.0 ± 0.2 0.66 −0.66 −0.61200 0.11 2.9 ± 0.2 0.30 −0.59 −0.37500 0.04 1.5 ± 0.2 0.21 −0.56 −0.19
Paper Nanoscale
11906 | Nanoscale, 2017, 9, 11902–11911 This journal is © The Royal Society of Chemistry 2017
Publ
ishe
d on
07
June
201
7. D
ownl
oade
d by
ET
H-Z
uric
h on
14/
05/2
018
10:5
7:03
. View Article Online

Evidently, the main effect of metal ions is to alter theoverall evolution, but with minimal effects on the spectral fea-tures of the TA bands, and single-wavelength kinetic traces canshow the effect of metal-ions on the different spectral com-ponents. In order to study the effects of copper ions on thefluorescence, we recorded the SE signal in the single-wave-length detection mode to achieve a higher signal-to-noiseratio.
Time traces in Fig. 4 were collected at a wavelength of550 nm close to the peak position of the SE after 10 ps (Fig. 3and Fig. S3†), to monitor specifically contributions to the SEand thus excited-state relaxation of CDs. As shown in Fig. 4,the signal of bare dots undergoes a rise (i.e. it grows in absol-ute value) within few ps after photo-excitation. This rise isdominated by the ultrafast dynamical Stokes shift of the entireSE band, which actually peaks at 550 nm after a few ps(Fig. S3†). In the presence of Cu2+ we see a strong reduction ofthe SE, similar to as shown in Fig. 3c. In particular, we observea decay component over a time scale of a few ps, becomingmore and more evident with increasing ion concentration(Fig. 4b). We analyzed the single-wavelength kinetics at550 nm by least-squares fitting all the traces in Fig. 4a withmulti-exponential functions. We found that every trace can bereproduced by three different time components, τ1 τ2 and τ3.Although the amplitudes associated with these three timescales depend on copper concentration, the time scalesobtained by the fitting procedure show indeed slight variationsacross the different traces in Fig. 4a, and we discovered that allthe traces can be simultaneously fitted by common time con-stants: their values, as obtained by the fit, are τ1 = 0.21 ±0.05 ps, τ2 = 1.9 ± 0.1 ps, τ3 ≥ 1000 ps, and their amplitudes Aiare reported in Table 1. As the SE signal is negative, a positive
(negative) pre-exponential amplitude respectively indicates arise (decay) of the absolute signal intensity over the corres-ponding time scale.
The τ3 component can be identified with the nanosecond-lived fluorescence analyzed in Fig. 1 and 2, that is, the fluo-rescence surviving after all the ultrafast dynamics are com-pleted: in fact, increasing [Cu2+] reduces its weight A3 (seeTable 1) similarly to the intensity decrease observed in theinset of Fig. 1b. Measurements on an extended delay range(Fig. S4†) confirm that there is no evolution on the tens andhundreds of picosecond range. This result underscores againthat the picosecond (Fig. 4) and nanosecond (Fig. 2) fluo-rescence decays induced by addition of Cu2+ are well separ-ated, and associated with different processes (static anddynamic quenching, respectively).
Fig. 3 Transient absorption 2D-plot of an aqueous solution of bareCDs (a) and with [Cu2+] = 100 mM (b) excited at 400 nm. Transientabsorption spectra of bare CDs (c) and with 100 mM of Cu2+
(d) recorded at 300 fs and 10 ps after photoexcitation, as obtained byvertical cuts of the 2D-plots in panels (a) and (b). Data between 388 nmand 405 nm were removed because of distortions by pump scatteringaround 400 nm.
Fig. 4 (a) Transient absorption time traces at 550 nm (excitation at400 nm) of CDs with no copper ions in solution (dark red), 4 mM (red),20 mM (orange), 50 mM (green), 100 mM (light blue), 200 mM (blue),and 500 mM (purple) copper concentrations, with the respective least-squares fitting curves (continuous lines). (b) Three time traces normal-ized at the first point after time zero, with the same color scale.
Nanoscale Paper
This journal is © The Royal Society of Chemistry 2017 Nanoscale, 2017, 9, 11902–11911 | 11907
Publ
ishe
d on
07
June
201
7. D
ownl
oade
d by
ET
H-Z
uric
h on
14/
05/2
018
10:5
7:03
. View Article Online
The most important information can be drawn, however, byexamining the fastest τ1 and τ2 dynamics. For bare CDs, the SEsignal probed at 550 nm undergoes a bi-exponential rise overtwo time scales of 0.21 ps and 1.9 ps (A1 and A2 positive). Inagreement with the previous discussion, the rise is due to theobserved dynamical Stokes shift of the SE band (Fig. S3†)caused by solvation dynamics, that is, the relaxation of wateraround a new electronic distribution impulsively produced byCD photo-excitation.32 In fact, we certainly expect a significantsolvent-induced relaxation of the emission for these CDs,because of their strong solvatochromism, we recently demon-strated.23 Because the only SE Stokes shift we observe occurson the 0.21 and 1.9 ps time scales, and no further spectralevolution is detected up to the nanosecond ranges, these psand sub-ps dynamics must undoubtedly be attributed to sol-vation. Furthermore, attributing these processes to solvation isfurther strengthened by TA data in Fig. S5† in which wecompare the aqueous spectra with those recorded in ethanolat the same delays: in ethanol, having a lower polarity, the SEsignal is blue shifted and the dynamical Stokes shift issmaller. Observing such a strong solvent-dependent effect alsoconfirms that the electronic transition involves the surface,directly exposed and strongly influenced by the solvent. Thesolvation time scales of CDs have not been systematicallyinvestigated before. A previous study proposed extremely slowsolvation at CD surfaces, extending up to the nanosecondscale.33 However, the present results show that CD solvation isactually more similar to that of small molecules or small in-organic nanoparticles,34 usually very fast and occurring on afew ps and sub-ps time scales.35 In this sense, the hydrationlayer around CDs is very different from other colloids such asproteins,36 whose hydration dynamics are significantly sloweddown with respect to bulk water.
We discuss now the effect of copper on the dynamics ofCDs. The addition of Cu2+ decreases the weight of the first rise(τ1 = 0.21 ps) and converts the τ2 = 1.9 ps rise into a decay, asseen from the change of sign of its amplitude A2. The ultrafastdecay τ2 directly represents a real-time observation ofdiffusion-free, static quenching events, which we previouslyinferred by indirect means. Although the CD–Cu2+ complexesinvolved in these decays are seen as “non-emissive” by steady-state and nanosecond methods, they actually yield a transientfluorescence: in fact, the SE observed in the presence of Cu2+
is very close to bare CDs, except for the ultrafast decay (Fig. 3).Therefore, CD–Cu2+ fluorescence must be observed by ultrafastmethods, since it gives essentially no contribution to steadystate emission (its quantum yield is ≈1 ps/tR ≤ 10−4, where tR≈ 30 ns is the radiative lifetime of CDs).23 Although the ampli-tude A1 of the fastest (0.21 ps) component never becomesnegative, its trend can also be understood on the samegrounds: A1 becomes smaller with increasing [Cu2+] becausethe contribution of bare CDs (positive A1, rise due to solvation)overlaps with the growing contribution of CD–Cu2+ complexes(negative A1, decay). Overall, these data demonstrate that close-range CD–Cu2+ interactions activate two ultrafast decay chan-nels of the fluorescence and, importantly, their time scales
(0.21 ps and 1.9 ps) match those of CD surface solvation, orotherwise more than two time constants would be needed toreproduce data shown in Fig. 4. This coincidence is indeedunexpected and leads to presume a key role of solvation in thequenching process, discussed in detail in the last paragraph.
Finally, our data lead to some further, interesting consider-ations on the nature of CD/ion complexes involved in staticquenching. In fact, the amplitude of the ultrafast fluorescencedecay components increase with copper concentration, whilethe time constants of these decays are independent of it andare always 0.2 and 1.9 ps, as extracted from fitting the single-wavelength traces at 550 nm. This strongly suggests that thequenching dynamics are due to simple, one dot-one ion com-plexes. In fact, the coexistence of multiple species of the formCD–(Cu2+)n, with variable n, would lead to multiple timescales, dependent on the number of attached ions, and pro-gressively showing up with increasing copper concentration.This important conclusion is also endorsed by the simpletrend of the intensity quenching shown in the inset of Fig. 1b,where a significant intensity decrease is already observed fromthe lowest copper concentrations we explored. If the succes-sive, multi-step, binding of several copper ions were needed toquench the luminescence, the observed trend would certainlybe more complex, and would show an initial lag phase.
The quenching mechanism: solvent-driven electron transferfrom CDs to metal ions
Based on the results reported so far, we conclude that stableCD–Cu2+ complexes are formed by the chemical interaction ofground-state CDs and Cu2+ ions, and their emission quench-ing likely involves a very efficient electron transfer (ET) towardsCu2+ ions. Other common mechanisms of fluorescencequenching appear very unlikely: in particular, both resonance-and Dexter-type energy transfer to the d–d absorption tran-sition of aqueous Cu2+ ions around 800 nm should be extre-mely inefficient because the latter is forbidden and has nospectral overlap with CD emission at 520 nm (Fig. S6†).Besides, an exciton transfer from the CD to the binding ionwould give rise to a characteristic ESA signal in the TA spectradue to the ion in the (d,d) excited state,37 which does not existin the pump/probe spectra recorded here, conclusively rulingout this mechanism as a cause of fluorescence quenching. Inorder to confirm the role of ET, we studied the optical pro-perties of a solution of CDs with two different amounts of zincions (Zn2+).
Because the electronic configuration of Zn2+ is [Ar]3d10,that is, a completely full 3d-shell, no ET is expected with theseions. As shown in Fig. 5, the presence of Zn2+ in a solution ofCDs does not quench the photoluminescence; in contrast, itcauses an increase of the quantum yield, a blue shift of theemission band (Fig. 5a) and an extension of the lifetime(Fig. 5b), in striking contrast to the effect induced by copperions. On one hand, this result strongly supports the idea thatquenching involves ET from the surface of photo-excited CDsto Cu2+ ions; on the other hand, the enhancement of the emis-sion by Zn2+ is probably the effect of electrostatic screening
Paper Nanoscale
11908 | Nanoscale, 2017, 9, 11902–11911 This journal is © The Royal Society of Chemistry 2017
Publ
ishe
d on
07
June
201
7. D
ownl
oade
d by
ET
H-Z
uric
h on
14/
05/2
018
10:5
7:03
. View Article Online

provided by Zn2+ ions on the negatively-charged surface of CDs(rich of COO– groups). This is expected to reduce the strongsolvation effects on the CD surfaces, due to dielectric andH-bonding interactions with water that red shift CD emissionand reduce their QYs.23 Through this mechanism, Zn-inducedscreening increases the HOMO/LUMO gap and provokes a blueshift of the band, accompanied by an increase of the lifetimeand quantum yield of the transition. Additionally, the attachedZn2+ may increase QY by limiting the geometrical rearrange-ment of the surface groups that provide non-radiative dissipa-tion channels. In order to better understand the effect of Znions, we performed TA measurements on the solution of CDswith 30 mM Zn2+. As shown in Fig. S7,† the pump/probe signal(Fig. S7a†) is very similar to the one observed in the solutionof bare CDs and, in particular, the kinetics of the SE signal ispractically the same (Fig. S7b†) in both solutions, underliningthe absence of any SE decay in the presence of zinc ions. Onthe other hand, we noted, in the presence of Zn2+, a smallersolvatochromic shift of the SE than in pure water (at t > 10 ps,the SE peaks at 556 nm for CDs in pure water and at 550 nm inthe presence of Zn2+) which confirms the screening effect dis-cussed above and the following enhancement of the emission.Even in the case of Cu2+, when an ET mechanism is viable,ultrafast fluorescence quenching may coexist with a screeningmechanism similar to that induced by Zn2+. Such an effectmay contribute to the blue shift of the steady-state emissionobserved in Fig. 1b.
We recently developed a model for the lowest electronictransitions of these CDs,23 in which optical absorption has acertain core-to-surface charge transfer character: in particular,the transition causes an increase of electronic charge onsurface carboxylic and amide groups, occupying their π* emptyorbitals, and leaves a hole which mostly resides on C3N4 coreatoms in proximity of the surface. Both carboxylic and amidegroups, common on the surface of many CDs, are potentialanchoring sites of Cu2+ ions, as reported in previousstudies,8,11 and in particular N-containing groups, such as
amide, seem to have a special binding affinity to Cu2+.11,13
Considering this, and bearing in mind the possible role of thesurface groups in the photocycle, we performed infrared (IR)absorption measurements on bare CDs and on a sample ofCDs after addition of copper nitrate. We observe small, butappreciable variations in the region between 1550–1800 cm−1,associated with the vibrations of amide and carboxylic surfacegroups,29 such as a blue shift of the amide II vibration(Fig. S8†). Although the observed changes are too complex toinfer a simple binding pattern, IR data seem to confirm thatthese surface groups are involved in the formation of the com-plexes between Cu2+ and CDs.
On these grounds, we expect a very close proximity of thephoto-excited surface electron to the acceptor Cu2+ ion, and avery strong coupling between the Franck–Condon (FC) stateand the ET state, consistent with the ultrafast electron transferwe observe. However, the mixing between the FC and the ETstates must be initially rather small, since the initial excitedstate is very close to the FC state of the bare CDs, as revealedby: (i) the fact that the shape of the SE at time zero is essen-tially unchanged in the presence of Cu2+ (Fig. 3c and d); (ii) bythe independence of the extrapolated SE signal amplitude attime zero from copper concentration (Fig. S9†), indicating thatthe nature of the initially excited state is independent of thepresence of copper. The preservation of the FC state requiresthe existence of a defined barrier separating it from the ETstate, as represented by the double-well potential energysurface in Fig. 6. On the other hand, our finding that EToccurs bi-exponentially on the same time scales (0.21 and1.9 ps) that characterize aqueous solvation on bare CDs, rulesout a direct through barrier transition from the FC to the ETstates, since it would imply new decay components in thefitting procedure. Conversely, it speaks for an adiabatic ETprocess driven by a solvent rearrangement. Thus we propose
Fig. 5 (a) Emission spectra of a solution of bare CDs dissolved in water(purple) and with different concentrations of zinc and copper ions.(b) Normalized decay kinetics of the emission band of the solution ofbare CDs (purple), of the solution with 30 mM Zn2+ (red) and 20 mMCu2+ (orange).
Fig. 6 Model which represents the photo-cycle of CD–Cu2+ com-plexes. After photoexcitation, an exciton is formed and the system is inan electronic state (FC) which relaxes due to solvent motions in 0.21 +1.9 ps (red arrow) and causing a partial electron transfer from the CD toCu2+. The cycle is closed by an ultrafast non-radiative electron–holerecombination (≪1 ps, green arrow).
Nanoscale Paper
This journal is © The Royal Society of Chemistry 2017 Nanoscale, 2017, 9, 11902–11911 | 11909
Publ
ishe
d on
07
June
201
7. D
ownl
oade
d by
ET
H-Z
uric
h on
14/
05/2
018
10:5
7:03
. View Article Online

that solvation progressively decreases the barrier between theFC state and the ET state (see Fig. 6) until the charge transferis allowed and decouples the surface electron from the corehole, depopulating the emissive state. An adiabatic processimplies a continuously-changing degree of mixing of the FCand ET states during the reaction, rather than an abruptchange of the electronic wavefunction. The idea of an adia-batic ET from CDs to Cu2+ is consistent with the small vari-ation of the optical absorption spectra displayed in Fig. 1a: asmall mixing between the FC state and the ET state, alreadyexisting at the time of photo-excitation, will increase the core-to-surface charge transfer character of the transition, andlower its oscillator strength, explaining the reduction of theabsorption intensity.
After the initial photo-excitation, the solvent rearrangementdrives the ET reaction towards Cu2+ to its completion. A deepinvolvement of solvent relaxation in this reaction is actuallyexpected: in fact, the photo-induced change of the surfacecharge distribution, directly exposed to the solvent, is expectedto trigger a dramatic solvent rearrangement, as observed insimilar cases.38 The solvent reaction goes always in the direc-tion to stabilize solvated charges. This implies that in itscharacteristic time scales, a solvent rearrangement will lowerthe barrier that keeps the charge on the photo-excited CD.This will also facilitate the first step of the ET process andtrigger the progressive population of Cu2+ empty d-shell. In acooperative way, this is expected to promote a further, strongsolvent rearrangement as the reaction proceeds, because Cu2+
and Cu+ ions are characterized by completely differentaqueous solvation shells (octahedral vs. tetrahedral).39 As aconsequence of such a solvent-controlled mechanism, thetime required for water rearrangement limits the efficiency ofET notwithstanding a strong coupling. In fact, in other casesET can be much faster than observed here: Williams et al.reported a time scale well below 100 fs for the electron injec-tion from photo-excited graphene quantum dots to TiO2 nano-particles, in one of the few available studies on thesesystems.16
The last step of the photocycle involves the transition of theCD–Cu2+ system back to the ground state. In this respect,Fig. 3 shows that the ultrafast SE decay is accompanied by thedisappearance of all the other components of the TA signal.The decay of the GSB on the same time scale, in particular,implies an extremely fast repopulation of the ground stateimmediately after ET. To be consistent with the data, theground-state recovery must be much faster than 1 ps (or other-wise the GSB would disappear later than the SE), and cannotbe directly observed here because the time scale τ2 is a bottle-neck of the overall dynamics. The nature of this final step isultimately a back electron transfer inducing a non-radiativeelectron–hole recombination. A sub-ps timescale suggests thatthe recombination is likely mediated by a sequence of inelasticelectron–phonon scattering processes, usually allowing dissi-pation of large excess energies within 100s of femtoseconds.40
This process completes the photo-cycle and hinders steady-state emission from CD–Cu2+ complexes. The e−h+ pair recom-
bination time here observed is definitively faster than what isreported in other CD complexes with different oxidizingagents.41 An important effect of the chosen oxidizing agent isvery probable but no specific study on this issue has been pub-lished yet. We can guess that the crucial step is the reinjectionof the electron into the CD, while the dissipation of theCoulomb energy should be similar to what is here observed.
Finally, the fast reverse process suggests that the ET reactionis only partial, or otherwise the complete loss of the electron–hole overlap would render non-radiative recombination rela-tively inefficient. Indeed, within the model in Fig. 6, the finalstate produced by the ET reaction can be more realistically pic-tured as one where the electron has become completely delocal-ized between the surface group and the metal ion, rather than astate where the electron has been fully transferred from thesurface carboxylic/amide group to the nearby Cu2+.
Conclusions
The combined use of steady-state, nanosecond-time-resolvedand femtosecond optical spectroscopy provided a detailedpicture of the dynamics responsible for CD fluorescencequenching by transition metal ions, from the femtosecond tothe nanosecond time range. Most CDs are efficiently quenchedby Cu2+ ions through the formation of stable CD–Cu2+ com-plexes, wherein an ion directly binds to the surface amide and/or carboxylic groups closely involved in the photoexcitationmechanism of the dot, and a minority of CDs are quenched bya collisional mechanism, reflecting variations of their nano-second decay kinetics. In both cases, quenching involves anelectron transfer mechanism, which is unviable for closedd-shell ions such as Zn2+. We additionally find that both staticand dynamic quenching are affected by heterogeneity in thereaction rates, giving rise to photoselection effects. The studyof CD–Cu2+ complexes by ultrafast spectroscopy reveals thecharacteristic time scales and mechanism of the ET dynamics,which turn out to be 0.21 ps and 1.9 ps. Our data stronglysuggest that the ET process is only partial, and mostly con-trolled by a strong, and very fast, solvent rearrangementaround the dot, initiated by photo-excitation, and driving aprogressive reduction of the barrier for the ET reaction. Thephotocycle of CDs is completed by a fast, non-radiative recom-bination of the electron–hole pair, likely mediated by acascade of inelastic electron–phonon scattering processes.Such a comprehensive view of electron transfer dynamicsinvolving photoexcited carbon nanodots may help tailoringtheir properties to advance the design of photoactive, CD-based nanoscale materials.
Acknowledgements
We thank the LAMP group (http://www.unipa.it/lamp) at theUniversity of Palermo for support and stimulating discussions.We thank Prof. Valeria Vetri for our use of optical spectroscopy
Paper Nanoscale
11910 | Nanoscale, 2017, 9, 11902–11911 This journal is © The Royal Society of Chemistry 2017
Publ
ishe
d on
07
June
201
7. D
ownl
oade
d by
ET
H-Z
uric
h on
14/
05/2
018
10:5
7:03
. View Article Online

facilities in her laboratory. We acknowledge financial supportreceived under project “MedNETNA-Mediterranean Networkfor emerging nanomaterials” (P.O. F.E.S.R. 2007/2013 – line4.1.2.A). Steady State photoluminescence and infraredmeasurements were carried out at the optical spectroscopy lab-oratory of ATeN center – CHAB, and single-wavelength TAmeasurements and some of the broadband TA measurementswere carried out at the UFL laboratory of ATeN center – CHAB(http://www.atencenter.com). AC gratefully acknowledgesthe European Union (ERC Starting Grant 279599 -FunctionalDyna) and Swiss NSF through the NCCR MUST“Molecular Ultrafast Science and Technology” for the financialsupport.
References
1 X. Xu, R. Ray, Y. Guy, H. J. Ploehn, L. Gearheart, K. Rakerand W. A. Scrivens, J. Am. Chem. Soc., 2004, 126, 12736–12737.
2 Y.-P. Sun, B. Zhou, Y. Lin, W. Wang, K. A. Fernando,P. Pathak, M. J. Meziani, B. A. Harruff, X. Wang, H. Wang,P. G. Luo, H. Yang, M. Kose, B. Chen, L. M. Veca, et al.,J. Am. Chem. Soc., 2006, 128, 7756–7757.
3 S.-T. Yan, X. Wan, H. Wang, F. Lu, P. G. Luo, L. Cao,M. J. Meziani, J.-H. Liu, Y. Liu, M. Chen, Y. Huang andY.-P. Sun, J. Phys. Chem. C, 2009, 113, 18110–18114.
4 H. Peng and J. Travas-Sejdic, Chem. Mater., 2009, 21, 5563–5565.
5 P. Miao, K. Han, Y. Tang, B. Wang, T. Lin and W. Cheng,Nanoscale, 2015, 7, 1586.
6 A. Zhu, Q. Qu, X. Shao, B. Kong and Y. Tian, Angew. Chem.,Int. Ed., 2012, 51, 7185–7189.
7 L. Zhou, Y. Lin, Z. Huang, J. Ren and X. Qu, Chem.Commun., 2012, 48, 1147–1149.
8 J. Zong, X. Yang, A. Trinchi, S. Hardin, I. Cole, Y. Zhu,C. Li, T. Muster and G. Wei, Biosens. Bioelectron., 2014, 51,330–335.
9 Y.-L. Zhang, L. Wang, H.-C. Zhang, Y. Liu, H.-Y. Wang,Z.-H. Kang and S.-T. Lee, RSC Adv., 2013, 3, 3733–3738.
10 M. Vedamalai, A. P. Periasamy, C.-W. Wang, Y.-T. Tsen,L.-C. Ho, C.-C. Shih and H.-T. Chang, Nanoscale, 2014, 6,13119–13125.
11 S. Zhang, J. Li, M. Zeng, J. Xu, X. Wang and W. Hu,Nanoscale, 2014, 6, 4157–4162.
12 F. Wang, Z. Gu, W. Lei, W. Wang, X. Xia and Q. Hao, Sens.Actuators, B, 2014, 190, 516–522.
13 Y. Dong, R. Wang, G. Li, C. Chen, Y. Chi and G. Chen, Anal.Chem., 2012, 84, 6220–6224.
14 X. Wang, L. Ca, F. Lu, M. Meziani, H. Li, G. Qi, B. Zhou,B. A. Harruff, F. Kermarrec and Y.-P. Sun, Chem. Commun.,2009, 3774–3776.
15 S. Mondal, S. K. Seth, P. Gupta and P. Purkayashta, J. Phys.Chem. C, 2015, 119, 25122–25128.
16 K. J. Williams, C. A. Nelson, X. Yan, L.-S. Li and X. Zhu,ACS Nano, 2013, 7, 1388–1394.
17 X. Yan, X. Cui, B. Li and L.-S. Li, Nano Lett., 2010, 10, 1869–1873.
18 H. Ming, Z. Ma, Y. Liu, K. Pan, H. Yu, F. Wang and Z. Kan,Dalton Trans., 2012, 41, 9526–9531.
19 X. Yu, J. Liu, Y. Yu, S. Zuo and B. Li, Carbon, 2014, 68, 718–724.
20 H. Li, R. Liu, Y. Liu, H. Huang, H. Yu, H. Ming, S. Lian,S.-T. Lee and Z. Kang, J. Mater. Chem., 2012, 22, 17470–17475.
21 B. Y. Yua and S.-Y. Kwak, J. Mater. Chem., 2012, 22, 8345–8353.
22 H. Zhang, H. Ming, S. Lian, H. Huang, H. Li, L. Zhang,Y. Li, Z. Kang and S.-T. Lee, Dalton Trans., 2011, 40, 10822–10825.
23 A. Sciortino, E. Marino, B. van Dam, P. Schall, M. Cannasand F. Messina, J. Phys. Chem. Lett., 2016, 7, 3419–3423.
24 D. A. Hines and P. V. Kamat, ACS Appl. Mater. Interfaces,2014, 6, 3041–3057.
25 H. Kang, K. Lee, B. Jung, Y. J. Ko and S. K. Kim, J. Am.Chem. Soc., 2002, 124, 12958–12959.
26 P. Yu, X. Wen, Y.-R. Toh, Y.-C. Lee, K.-Y. Huang, S. Huang,S. Shrestha, G. Conibeer and J. Tang, J. Mater. Chem. C,2014, 2, 2894–2901.
27 X. Wen, P. Yu, Y.-R. Toh, X. Hao and J. Tang, Adv. Opt.Mater., 2013, 1, 173–178.
28 L. Wang, S.-J. Zhu, H.-Y. Wang, S.-N. Qu, Y.-L. Zhang,J.-H. Zhang, Q.-D. Chen, H.-L. Xu, W. Han, B. Yang andH.-B. Sun, ACS Nano, 2014, 8, 2541–2547.
29 F. Messina, L. Sciortino, R. Popescu, A. M. Venezia,A. Sciortino, G. Buscarino, S. Agnello, R. Schneider,D. Gerthsen, M. Cannas and F. M. Gelardi, J. Mater. Chem.C, 2016, 4, 2598–2605.
30 R. Lakowicz, Principles of Fluorescence Spectroscopy,Springer Science, 2006..
31 C. Reichardt, Chem. Rev., 1994, 94, 2319–2358.32 G. R. Fleming, Annu. Rev. Phys. Chem., 1996, 47, 109–134.33 S. Khan, A. Gupta, N. C. Verma and C. K. Nandi, Nano Lett.,
2015, 15, 8300–8305.34 D. Pant and N. E. Levinger, Chem. Phys. Lett., 1998, 292,
200–206.35 O. Braem, A. Ajdarzadeh Oskouei, A. Tortschanoff, F. van
Mourik, M. Madrid, J. Echave, A. Cannizzo and M. Chergui,J. Phys. Chem. A, 2010, 114, 9034–9042.
36 J. Peon, S. K. Pal and A. H. Zewail, Proc. Natl. Acad.Sci. U. S. A., 2002, 17, 10964–10969.
37 J. Rodriguez and D. Holten, J. Chem. Phys., 1989, 91, 3525–3531.
38 F. Messina, O. Braem, A. Cannizzo and M. Chergui, Nat.Commun., 2013, 4, 2119.
39 I. Persson, Pure Appl. Chem., 2010, 82, 1901–1917.40 F. Carbone, G. Aubock, A. Cannizzo, F. Van Mourik,
R. R. Nair, A. K. Geim, K. S. Novoselov and M. Chergui,Chem. Phys. Lett., 2011, 504, 37–40.
41 V. Strauss, J. T. Margraf, C. Dolle, B. Butz, T. J. Nacken,J. Walter, W. Bauer, W. Peukert, E. Spiecker, T. Clark andD. M. Guldi, J. Am. Chem. Soc., 2014, 136, 17308–17316.
Nanoscale Paper
This journal is © The Royal Society of Chemistry 2017 Nanoscale, 2017, 9, 11902–11911 | 11911
Publ
ishe
d on
07
June
201
7. D
ownl
oade
d by
ET
H-Z
uric
h on
14/
05/2
018
10:5
7:03
. View Article Online