Cross Scale Interaction Mechanisms: Suppression of the ETG ...
The interaction of large scale and mesoscale environmentleading to formation of intense thunderstorms over Kolkata
Part I: Doppler radar and satellite observations
P Mukhopadhyay1,∗, M Mahakur1 and H A K Singh2
1Forecasting Research Division, Indian Institute of Tropical Meteorology, Dr. Homi Bhabha Road,Pune 411 008, India.
2India Meteorological Department, Mausam Bhawan, Lodi Road, New Delhi 110 003, India.∗e-mail: [email protected]
The weather systems that predominantly affect the eastern and northeastern parts of India duringthe pre-monsoon summer months (March, April and May) are severe thunderstorms, known asNor’westers. The storms derive their names from the fact that they frequently strike cities and townsin the southern part of West Bengal in the afternoon from the north-west direction while travelingfar from its place of genesis over the Bihar plateau. The storms are devastating in nature particularlydue to strong (gusty) winds, heavy rains and hails associated with it. Although these storms arewell known for its power of causing damages, studies on them are relatively few due to their smallsize and sparse network of observations. To address this important issue, the evolution of twoNor’westers of 12 March and 22 May 2003 over Kolkata is studied in detail in this paper usinghourly Doppler weather radar (DWR) observations and high resolution Meteosat-5 imageries. Inaddition, supporting meteorological reports are used to find the large scale conditions that influencethe moisture convergence and vertical wind shear. The genesis of both the storms is found to be overBihar–Jharkhand region and beyond the range of the DWR. The satellite observations are found tobe useful in identifying the location and initiation of the storms. The movements of the storms arecaptured by the DWR estimated vertical cross-section of reflectivities. The Doppler estimate showsthat the 12 March storm had a vertical extent of about 10–12 km at the time of maturity and that of22 May reaching up to 18 km signifying deep convection associated with these events. The genesis,maturity and dissipation are well brought out by the hourly DWR and satellite imageries. TheDWR observations suggest that the systems move at a speed of 20–25 m/s. The DWR estimatedprecipitation shows a detailed spatial distribution around Kolkata with several localized zones ofheavy rain and this is found to be well supported by the nearby station observations. This studyestablishes that DWR observations along with hourly satellite imageries are able to capture theevolution of Nor’westers. The study also shows that the composite DWR-satellite information isa reliable tool for nowcasting the location, time and path of movement of Nor’westers. Based onthese observations, a conceptual model of the Nor’wester is proposed.
1. Introduction
Thunderstorms over eastern and northeasternIndia are unique in nature particularly due totheir severity in terms of strong wind (30–40 kt),
heavy rain associated with hail and rapid move-ment. Most preferred time of appearance are pre-monsoon months (March, April and May) (Sohoni1928). These storms cause devastations every yearby damaging public life and properties. The loss
Keywords. Thunderstorms; Kolkata; DWR.
J. Earth Syst. Sci. 118, No. 5, October 2009, pp. 441–466© Printed in India. 441
442 P Mukhopadhyay et al
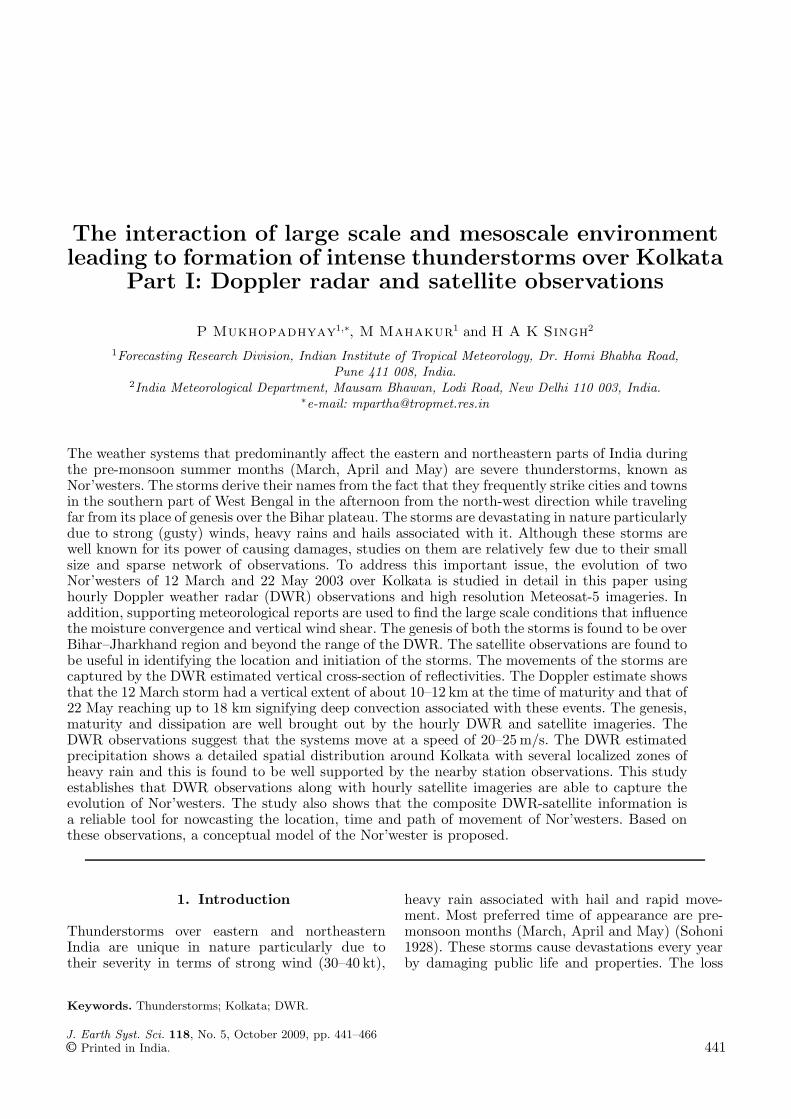
Figure 1. (a) Indian meteorological subdivisions along with islands of Andaman and Nicobar, and Lakshwadeep; and(b) Map of West Bengal along with the districts.
is particularly caused to the agricultural proper-ties such as mangroves, crops, etc., due to strongwinds and hails. Damages are also incurred by theaviation sector, power supply, rail, road and com-mon man. Historically speaking, possibly the firstdocumentation of such a storm was made by Floyd(1838) that struck east of Kolkata on 8 April 1838.He gave a brief explanation about the movementof the storm along with an account of damage byvisiting the site after the passage of the storm.The thunderstorms over Gangetic West Bengal arecalled Nor’westers as these systems having gene-sis over Bihar, Jharkhand (figure 1a) region travelsouth-eastward to strike Kolkata (figure 1b) andits surrounding. With respect to Kolkata, thesestorms appear from the north-west direction hencethe name ‘Nor’wester’.
A number of studies were carried out in the paston the thunderstorm development and their fore-casting utilizing the synoptic observations availableover Kolkata and its surrounding regions (Desai1950; Mull and Rao 1950; Bose 1957; De et al1957; Rao and Boothalingam 1957; Rai Sircar1957). Early attempt was made by Das et al(1957) to analyze the movement of Nor’westers of1955 using a 3 cm meteorological radar at DumDum Airport of Kolkata (22.65◦N, 88.45◦E). Thesestudies are based on synoptic data (sparse in
spatial and temporal resolution) at different sta-tions and did not elaborate on the mesoscalestructure of the systems and particularly theirevolution. Thus objective studies addressing themesoscale structure and evolution of these stormsare not attempted. Nor’westers remained one of theleast documented severe weather systems of thisregion.
It is well established by several studies over US(in particular) that Doppler radar has the capabi-lity of capturing fast developing convective systemssuch as thunderstorms and tornadoes. Dostaleket al (2004) analyzed the Weather SurveillanceRadar-1988 Doppler (WSR-88D) data and satel-lite imageries to establish that tornadic thun-derstorm developed near the intersection of leftmoving and south moving boundary. Short et al(2004) documented the life cycle of thunderstormsover Kennedy Space Center and Cape CanaveralAir Force Station using Geostationary Opera-tional Environmental Satellite (GOES)-8 visibleimageries and showed the utility of such studyin nowcasting thunderstorms. Weaver and Lindsay(2004) utilized the GOES imageries to show thecloud features associated with the different stagesof severe/tornadic thunderstorms. They empha-sized that high resolution numerical modelingneeds to be carried out to simulate the life cycles
Formation of intense thunderstorms 443
of the clouds associated with severe/tornadic thun-derstorms. Kennedy and Detwiler (2003) studiedthe origin of hail formation from the graupel stagewithin a multicellular thunderstorm using WSR-88D data and aircraft measurement of hydro-meteors. Weckwerth (2000) utilized NCAR CP-3and CP-4 Doppler radar data to find out thestrength and depth of horizontal role that triggersthunderstorms on some days and fail to trigger insome other occasions. MacKeen et al (1999) ana-lyzed WSR-88D radar estimated storm height, sizeand intensity in regard to storm longevity forecast-ing. Hane et al (1997) have given a detailed expla-nation of how severe thunderstorms develop along adry line utilizing data from various platforms suchas C-Band and X-band radar, mesonetwork, GOESsatellite imageries, etc. He mentioned that the syn-optic scale observation hardly gave any insightabout the convective initiation which could only bebrought out by the observation that can resolve themesoscale processes. Besides these, thunderstormsevolution and dynamical features are studiedusing satellite and Doppler radar observations byWakimoto (1982); Weaver et al (2002); Klimowskiand Bunkers (2002) and many others. Studiesmentioned above convincingly demonstrate thatDoppler radar and satellite observations can bringout mesoscale dynamical feature of the clouds asso-ciated with the systems and also the size, intensityand location which otherwise remain unresolveddue to inadequate spatio-temporal observation net-work. Studies on supercell thunderstorms over USmainly address that modest instability and strongbaroclinic system are the major large scale fac-tors behind these systems (Gonski et al 1989). Itis also proposed that potential vorticity anomaly,jet stream in the upper troposphere and surfacefrontal wave lead to tornadic thunderstorm out-break. In a recent article Ricketts et al (2007) men-tioned about convective storm initiation project(CSIP) in Hampshire, UK. The primary mech-anism of convective initiation as obtained fromCSIP was inversion (lid) penetration, lifting of thelid through orography and frontal upglide. Suchconclusive relations are yet to be established forNor’westers.
An objective study towards understanding therole of the large scale near storm environment andthe spatio-temporal evolution of the clouds associ-ated with the Nor’westers have not been done overGangetic Bengal region. A recent paper by Ghoshet al (2008) have addressed some of the lower andmiddle tropospheric feature in the initiation ofNor’wester. The objective of this paper is there-fore to establish the role of large scale environmentin the formation and intensification of Nor’westersand the mesoscale structural and dynamical fea-tures of the deep convective clouds associated with
the systems that occurred on 12 March and 22May 2003 over Kolkata and surrounding, usinghourly Doppler radar observation and Meteosat-5imageries. Based on the analysis of observationsa conceptual model of Nor’wester is proposed forthe first time. This study will also be helpful forunderstanding the underlying processes within thesystems and subsequently it may add to the fore-casting/nowcasting capability for such mesoscalesystems.
The DWR was installed over Kolkata in April2002. The detailed description and principle ofworking of the radar was given by Bhatnagaret al (2003). However, some description of theradar features are given in section 2. The 12March Nor’wester which happened to be thefirst event of 2003 pre-monsoon season overKolkata was reported (website of The Telegraph;http://www.telegraphindia.com; website of TheStatesman; http://www.thestatesman.net) to havekilled 15 people in-and-around Kolkata (adjoin-ing districts) and injured 373 people. In addi-tion, the storm caused widespread damages topower supply, rail, aviation and communicationlink over this region due to heavy rain associatedwith hail and strong wind. Kolkata and surround-ing was reported (India Meteorological Depart-ment (IMD)) to have struck twice by the 12 MarchNor’westers with the first one crossing at 09 Z(1430 LT) and the other at 12 Z (1730 LT). TheNor’wester of 22 May, was the last in the pre-monsoon season of 2003. This storm also causedwidespread damage to rail, road, power supply,water logging in the streets of Kolkata and injuredhundreds of people. Rainfall of 73 mm was reportedover Kolkata in just 90 minutes by this and thestorm was reported to strike Kolkata at 1230 Z(1800 LT).
This paper will be followed by another wherethe dynamical features of the storms will besimulated using high resolution mesoscale modeland verified by the Doppler and Meteosat-5imageries.
2. Brief description of the Dopplerradar
The classifications of radars are done mainly basedon the frequency of operation. The Kolkata DWRoperates at frequency of 2.875 GHz, hence it is an‘S’ band radar. The radar antenna dish diameteris 8.5 m and beam width 1◦. The peak transmitterpower is 750 KW. The long and short pulse dura-tion are respectively 2μs and 1μs. Pulse repetitionfrequency is 250 to 1200 Hz. Minimum detectabledigital signal is −110 dBm at low noise ampli-fier input. To estimate the rainfall rate from the
444 P Mukhopadhyay et al
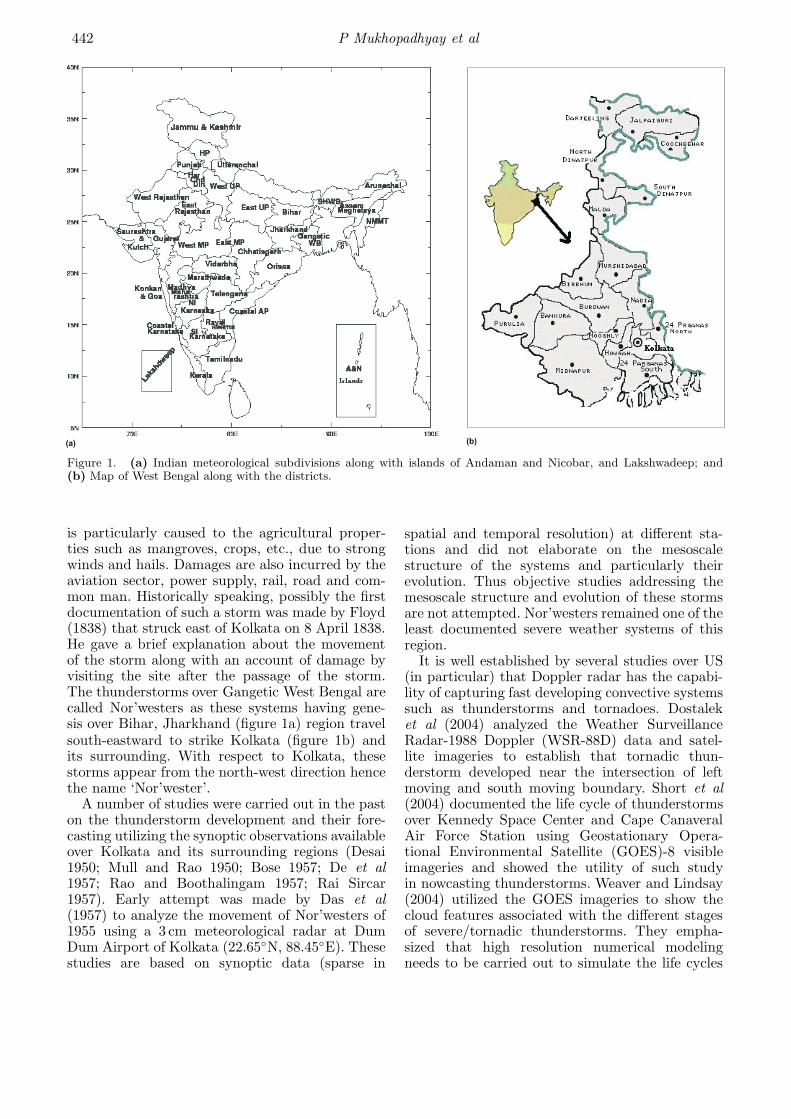
Figure 2. (a) Surface weather map at 03:00 Z of 12 March 2003; and (b) surface weather map at 03:00 Z of 22 May 2003.
radar reflectivity Marshall–Palmer relation is usedas follows:
Z = aRb, (1)
where Z = radar reflectivity in dBZ, R = rainfallintensity in mm/hour, a = 200 and b = 1.6.
Vertical integrated liquid (VIL) water content isderived using the following formula:
Z = CMD,
where C = 24,000 and D = 1.82 are constant forrain derived by Douglas (1964), M is gm m−3.
3. Data
The Doppler radar of Kolkata collected valu-able data for the Nor’westers of Gangetic WestBengal during the pre-monsoon months of 2003at high spatial (1 km) and temporal resolution(1 hourly). In this paper Doppler radar estimatedhourly vertical cross sections of reflectivity, liquidwater content, wind velocity, vertical velocityand 12-h accumulated precipitation are analysed.The hourly high resolution satellite imageries in theVisible (VIS), Infra Red (IR) and Water Vapour(WV) bands from the Meteosat-5 satellite (takenfrom http://www.sat.dundee.ac.uk), are also ana-lyzed. The radiosonde data of 35 stations overIndian region are analysed to show the large scalewind field at lower (850 hPa), middle (500 hPa) and
upper (200 hPa) troposphere. 24-h accumulatedrainfall reports of IMD and by Climate PredictionCenter, NOAA, rain estimate by TRMM and 12-haccumulated rain, estimated by the Doppler radar,are compared to assess the location and spatialdistribution of precipitation caused by these twostorms in-and-around Kolkata.
4. Synoptic condition
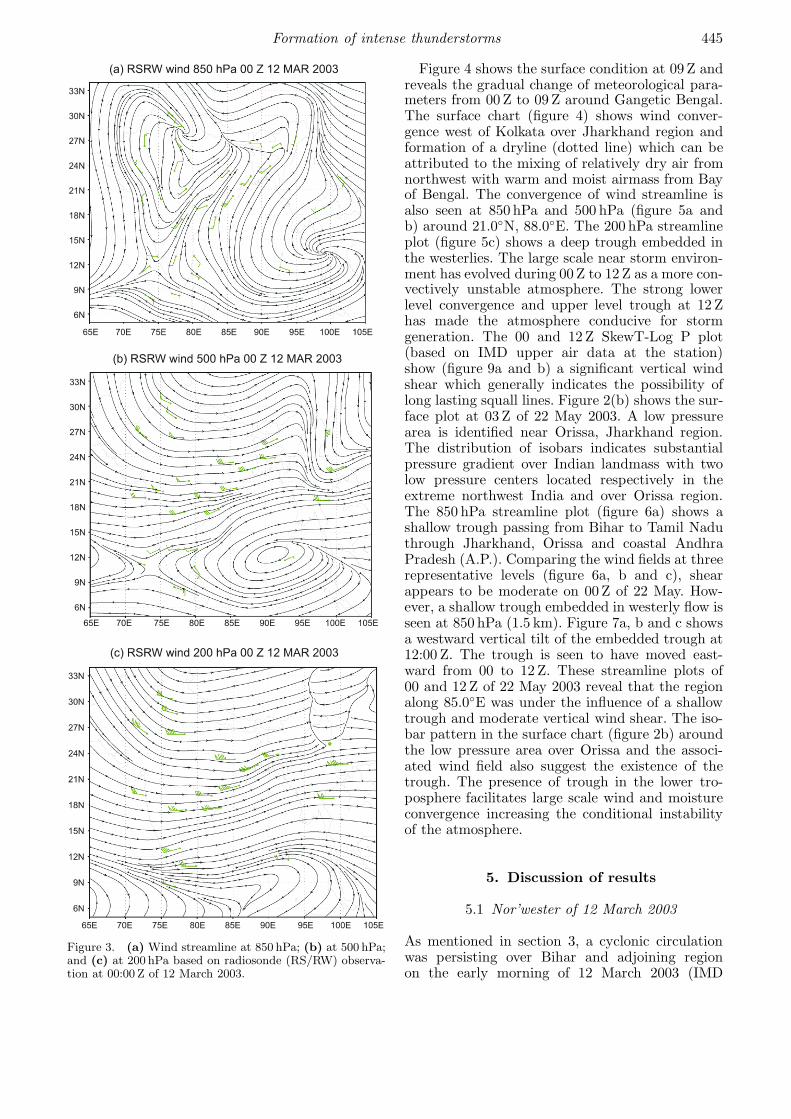
Figure 2(a) shows the surface chart plot at 03 Z(0830 LT) of 12 March 2003. A lower level con-vergence is identified over Bihar and adjoiningregions. The surface isobar distributions indicatehorizontal pressure gradient towards the Biharregion. Figure 3(a), (b) and (c) shows respectivelythe streamline at 850, 500 and 200 hPa based onradiosonde observations of 00 Z at different IMDobservatories over India. A strong convergence isseen (figure 3a) at 1.5 km (a.s.l.) over Bihar andadjacent region and a troughing is seen at the cen-tral Indian region running from East UP (24.0◦N,80.0◦E) to Karnataka coast (12.0◦N, 75.0◦E). Thestreamline plots show (figure 3a and c) the windspeed at 850 hPa and 200 hPa in and aroundKolkata are 20 kt and 115 kt respectively, suggest-ing a significant vertical wind shear. It is also evi-dent from the 00 Z weather charts that the centraland eastern India was under the influence of windconvergence on 12 March 2003. The large scale con-vergence over land facilitates the moisture conver-gence which in turn could make the environmentmore convectively unstable due to enhanced mois-ture incursions in the lower troposphere from theBay of Bengal.
Formation of intense thunderstorms 445
Figure 3. (a) Wind streamline at 850 hPa; (b) at 500 hPa;and (c) at 200 hPa based on radiosonde (RS/RW) observa-tion at 00:00 Z of 12 March 2003.
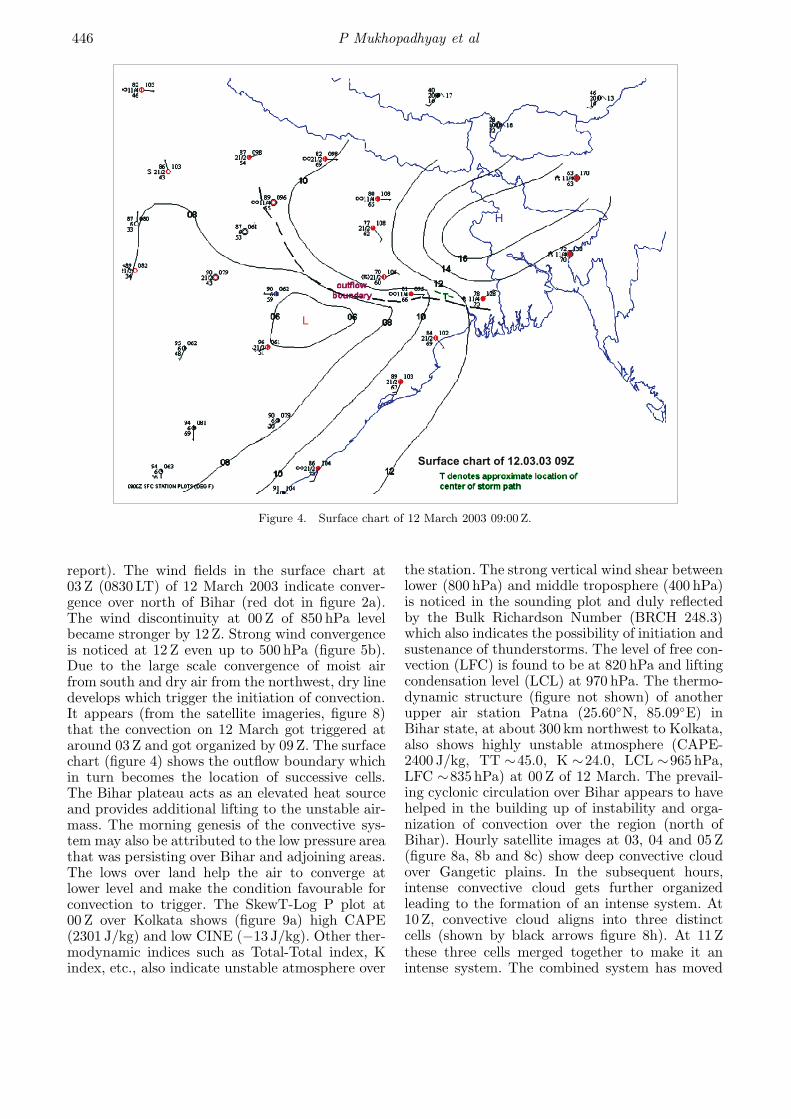
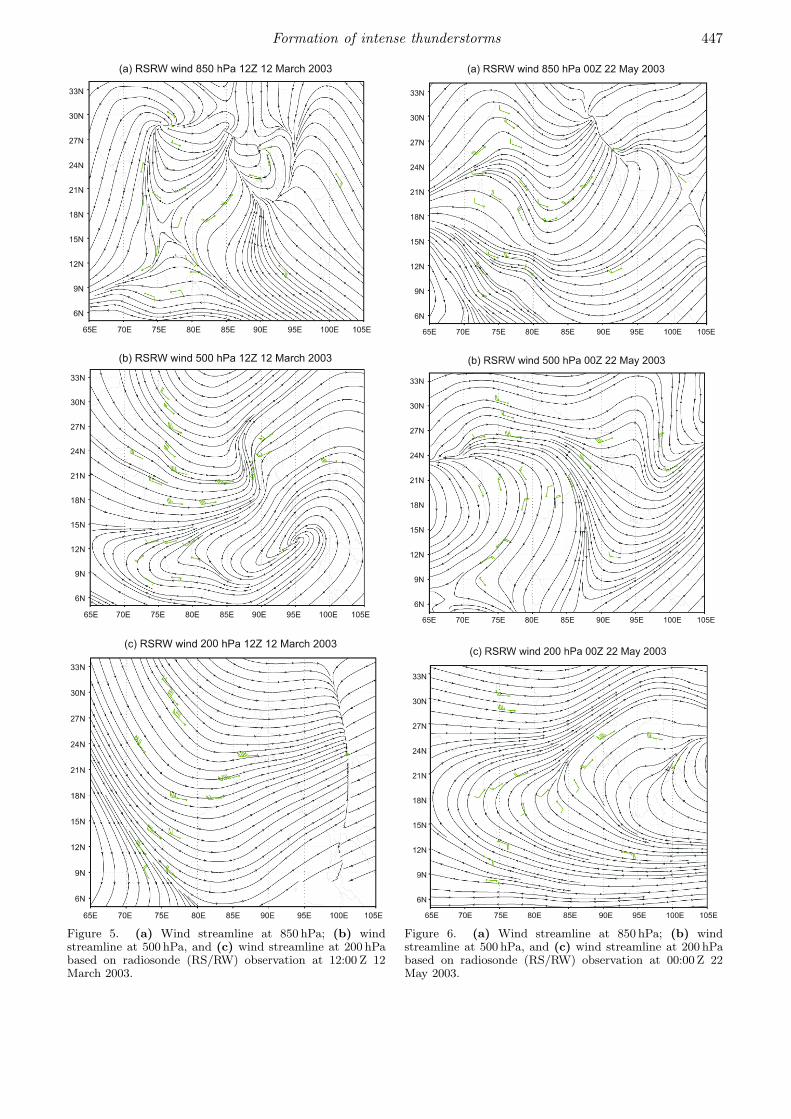
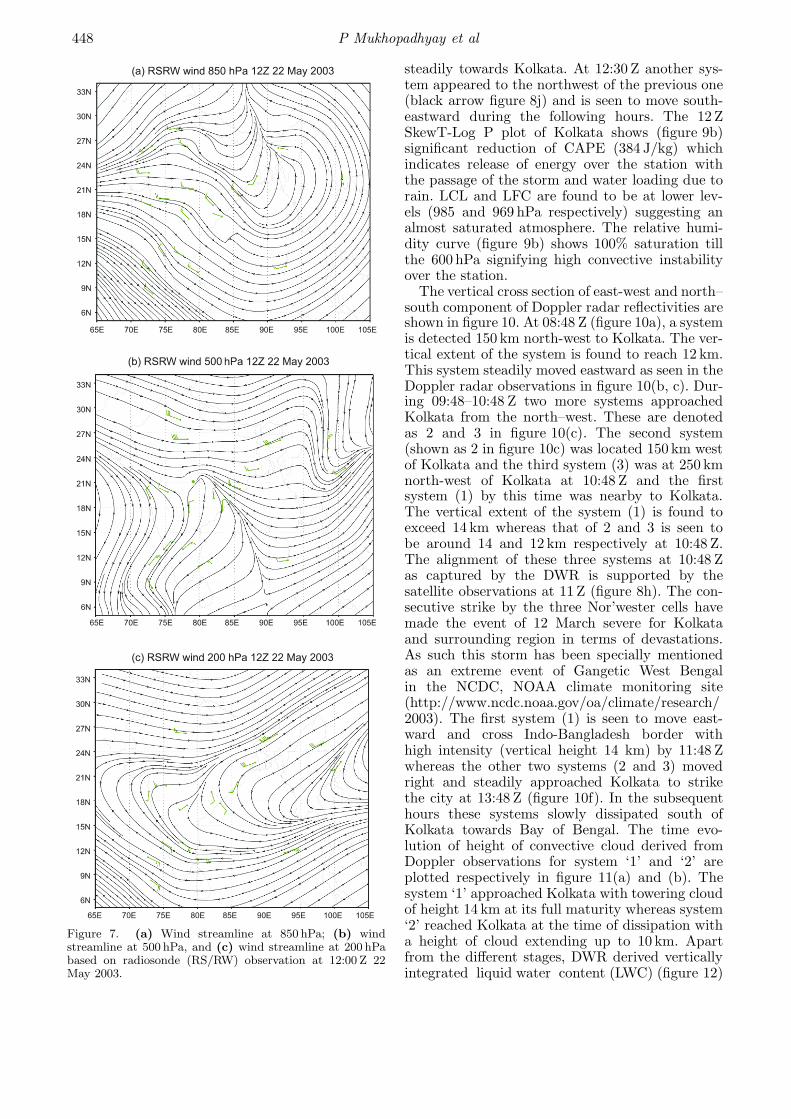
Figure 4 shows the surface condition at 09 Z andreveals the gradual change of meteorological para-meters from 00 Z to 09 Z around Gangetic Bengal.The surface chart (figure 4) shows wind conver-gence west of Kolkata over Jharkhand region andformation of a dryline (dotted line) which can beattributed to the mixing of relatively dry air fromnorthwest with warm and moist airmass from Bayof Bengal. The convergence of wind streamline isalso seen at 850 hPa and 500 hPa (figure 5a andb) around 21.0◦N, 88.0◦E. The 200 hPa streamlineplot (figure 5c) shows a deep trough embedded inthe westerlies. The large scale near storm environ-ment has evolved during 00 Z to 12 Z as a more con-vectively unstable atmosphere. The strong lowerlevel convergence and upper level trough at 12 Zhas made the atmosphere conducive for stormgeneration. The 00 and 12 Z SkewT-Log P plot(based on IMD upper air data at the station)show (figure 9a and b) a significant vertical windshear which generally indicates the possibility oflong lasting squall lines. Figure 2(b) shows the sur-face plot at 03 Z of 22 May 2003. A low pressurearea is identified near Orissa, Jharkhand region.The distribution of isobars indicates substantialpressure gradient over Indian landmass with twolow pressure centers located respectively in theextreme northwest India and over Orissa region.The 850 hPa streamline plot (figure 6a) shows ashallow trough passing from Bihar to Tamil Naduthrough Jharkhand, Orissa and coastal AndhraPradesh (A.P.). Comparing the wind fields at threerepresentative levels (figure 6a, b and c), shearappears to be moderate on 00 Z of 22 May. How-ever, a shallow trough embedded in westerly flow isseen at 850 hPa (1.5 km). Figure 7a, b and c showsa westward vertical tilt of the embedded trough at12:00 Z. The trough is seen to have moved east-ward from 00 to 12 Z. These streamline plots of00 and 12 Z of 22 May 2003 reveal that the regionalong 85.0◦E was under the influence of a shallowtrough and moderate vertical wind shear. The iso-bar pattern in the surface chart (figure 2b) aroundthe low pressure area over Orissa and the associ-ated wind field also suggest the existence of thetrough. The presence of trough in the lower tro-posphere facilitates large scale wind and moistureconvergence increasing the conditional instabilityof the atmosphere.
5. Discussion of results
5.1 Nor’wester of 12 March 2003
As mentioned in section 3, a cyclonic circulationwas persisting over Bihar and adjoining regionon the early morning of 12 March 2003 (IMD
446 P Mukhopadhyay et al
Figure 4. Surface chart of 12 March 2003 09:00 Z.
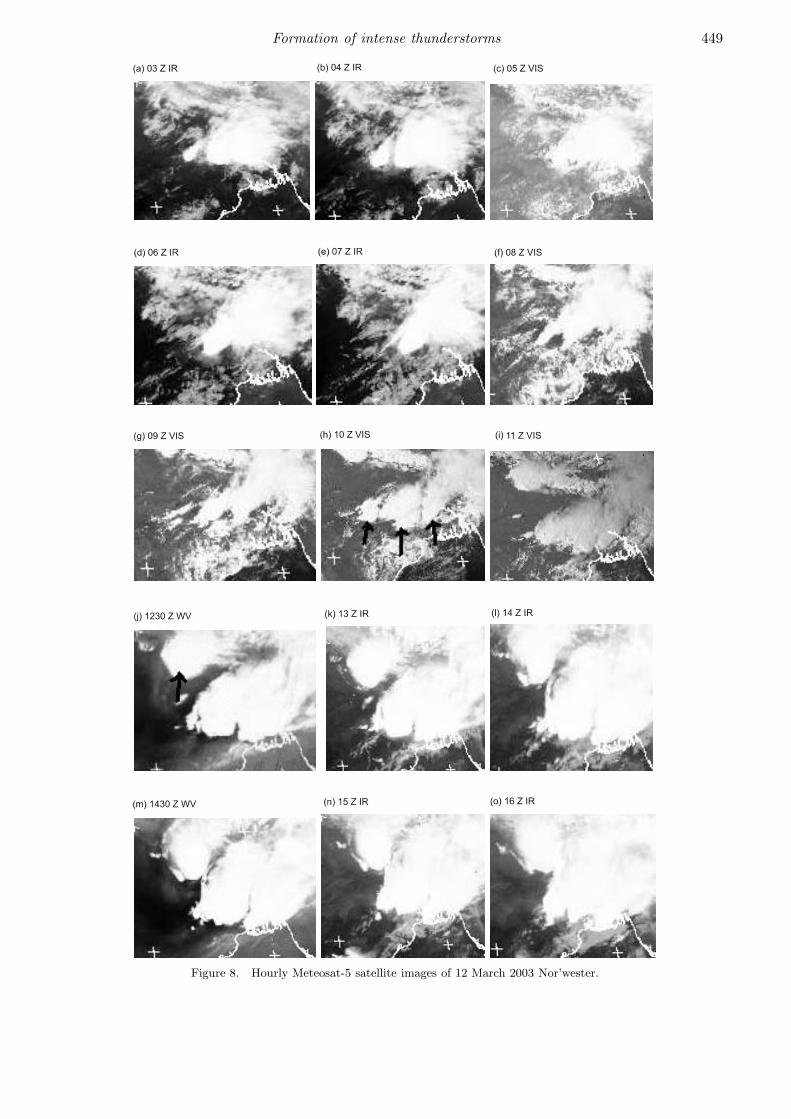
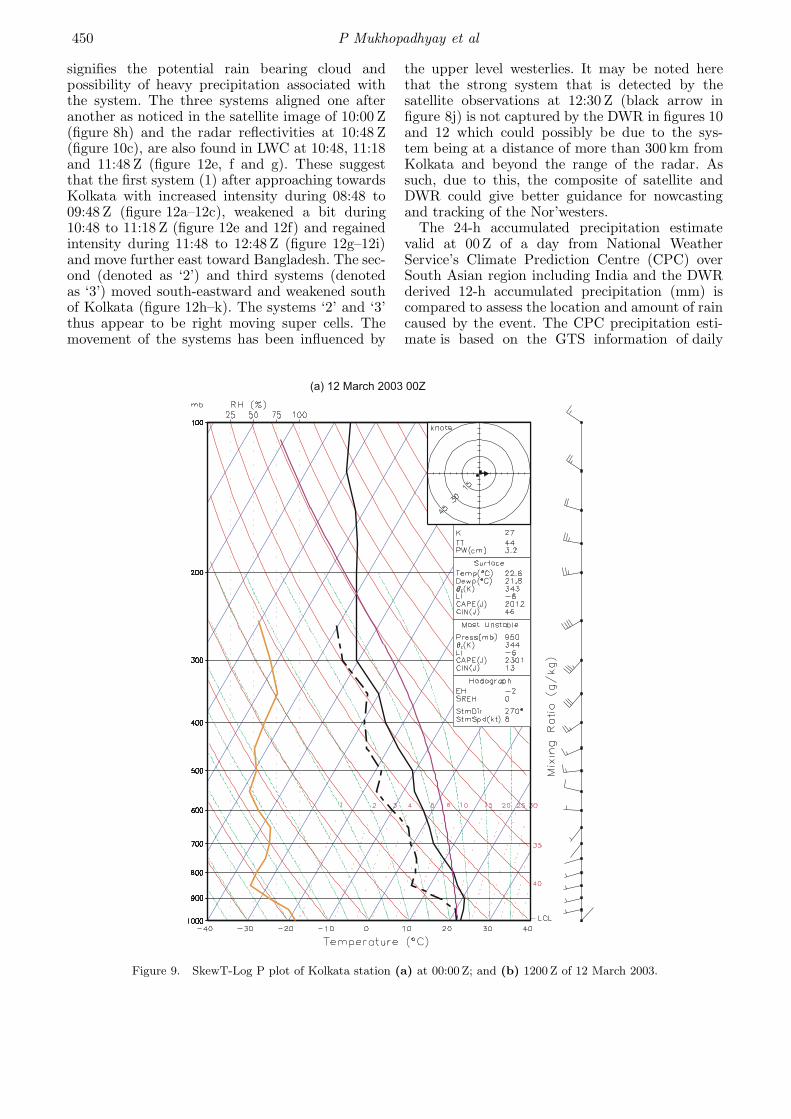
report). The wind fields in the surface chart at03 Z (0830 LT) of 12 March 2003 indicate conver-gence over north of Bihar (red dot in figure 2a).The wind discontinuity at 00 Z of 850 hPa levelbecame stronger by 12 Z. Strong wind convergenceis noticed at 12 Z even up to 500 hPa (figure 5b).Due to the large scale convergence of moist airfrom south and dry air from the northwest, dry linedevelops which trigger the initiation of convection.It appears (from the satellite imageries, figure 8)that the convection on 12 March got triggered ataround 03 Z and got organized by 09 Z. The surfacechart (figure 4) shows the outflow boundary whichin turn becomes the location of successive cells.The Bihar plateau acts as an elevated heat sourceand provides additional lifting to the unstable air-mass. The morning genesis of the convective sys-tem may also be attributed to the low pressure areathat was persisting over Bihar and adjoining areas.The lows over land help the air to converge atlower level and make the condition favourable forconvection to trigger. The SkewT-Log P plot at00 Z over Kolkata shows (figure 9a) high CAPE(2301 J/kg) and low CINE (−13 J/kg). Other ther-modynamic indices such as Total-Total index, Kindex, etc., also indicate unstable atmosphere over
the station. The strong vertical wind shear betweenlower (800 hPa) and middle troposphere (400 hPa)is noticed in the sounding plot and duly reflectedby the Bulk Richardson Number (BRCH 248.3)which also indicates the possibility of initiation andsustenance of thunderstorms. The level of free con-vection (LFC) is found to be at 820 hPa and liftingcondensation level (LCL) at 970 hPa. The thermo-dynamic structure (figure not shown) of anotherupper air station Patna (25.60◦N, 85.09◦E) inBihar state, at about 300 km northwest to Kolkata,also shows highly unstable atmosphere (CAPE-2400 J/kg, TT ∼45.0, K ∼24.0, LCL ∼965 hPa,LFC ∼835 hPa) at 00 Z of 12 March. The prevail-ing cyclonic circulation over Bihar appears to havehelped in the building up of instability and orga-nization of convection over the region (north ofBihar). Hourly satellite images at 03, 04 and 05 Z(figure 8a, 8b and 8c) show deep convective cloudover Gangetic plains. In the subsequent hours,intense convective cloud gets further organizedleading to the formation of an intense system. At10 Z, convective cloud aligns into three distinctcells (shown by black arrows figure 8h). At 11 Zthese three cells merged together to make it anintense system. The combined system has moved
Formation of intense thunderstorms 447
Figure 5. (a) Wind streamline at 850 hPa; (b) windstreamline at 500 hPa, and (c) wind streamline at 200 hPabased on radiosonde (RS/RW) observation at 12:00 Z 12March 2003.
Figure 6. (a) Wind streamline at 850 hPa; (b) windstreamline at 500 hPa, and (c) wind streamline at 200 hPabased on radiosonde (RS/RW) observation at 00:00 Z 22May 2003.
448 P Mukhopadhyay et al
Figure 7. (a) Wind streamline at 850 hPa; (b) windstreamline at 500 hPa, and (c) wind streamline at 200 hPabased on radiosonde (RS/RW) observation at 12:00 Z 22May 2003.
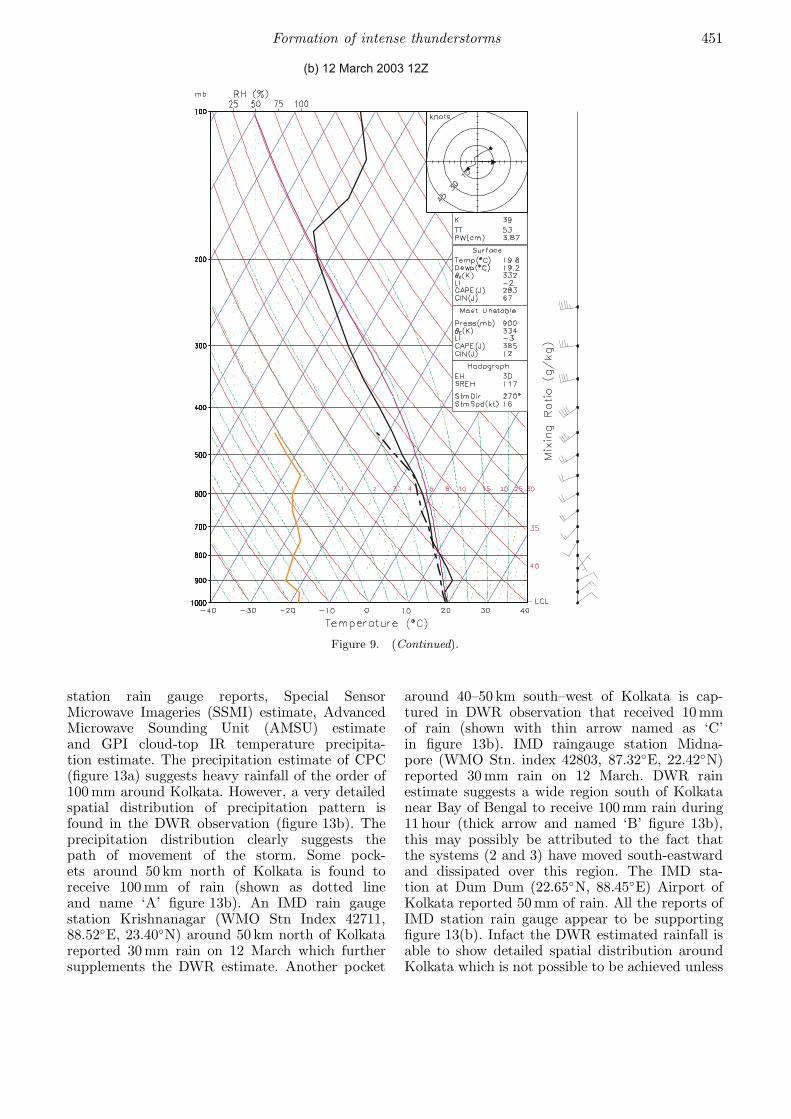
steadily towards Kolkata. At 12:30 Z another sys-tem appeared to the northwest of the previous one(black arrow figure 8j) and is seen to move south-eastward during the following hours. The 12 ZSkewT-Log P plot of Kolkata shows (figure 9b)significant reduction of CAPE (384 J/kg) whichindicates release of energy over the station withthe passage of the storm and water loading due torain. LCL and LFC are found to be at lower lev-els (985 and 969 hPa respectively) suggesting analmost saturated atmosphere. The relative humi-dity curve (figure 9b) shows 100% saturation tillthe 600 hPa signifying high convective instabilityover the station.
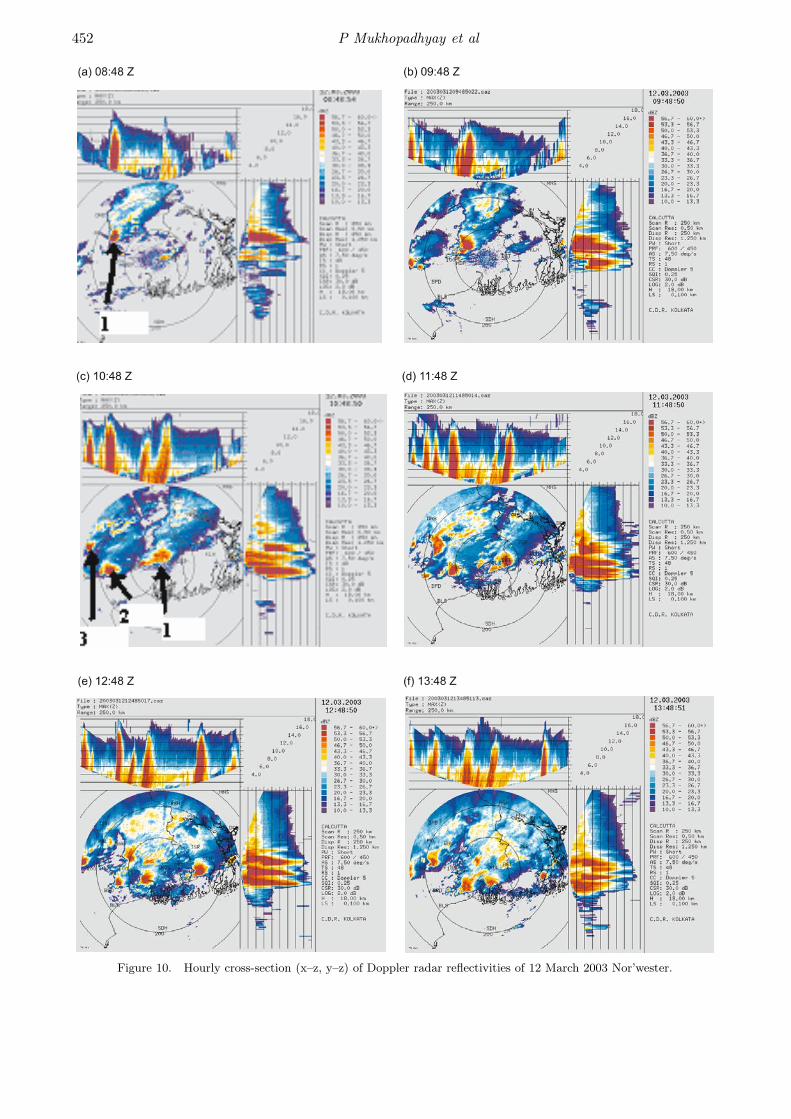
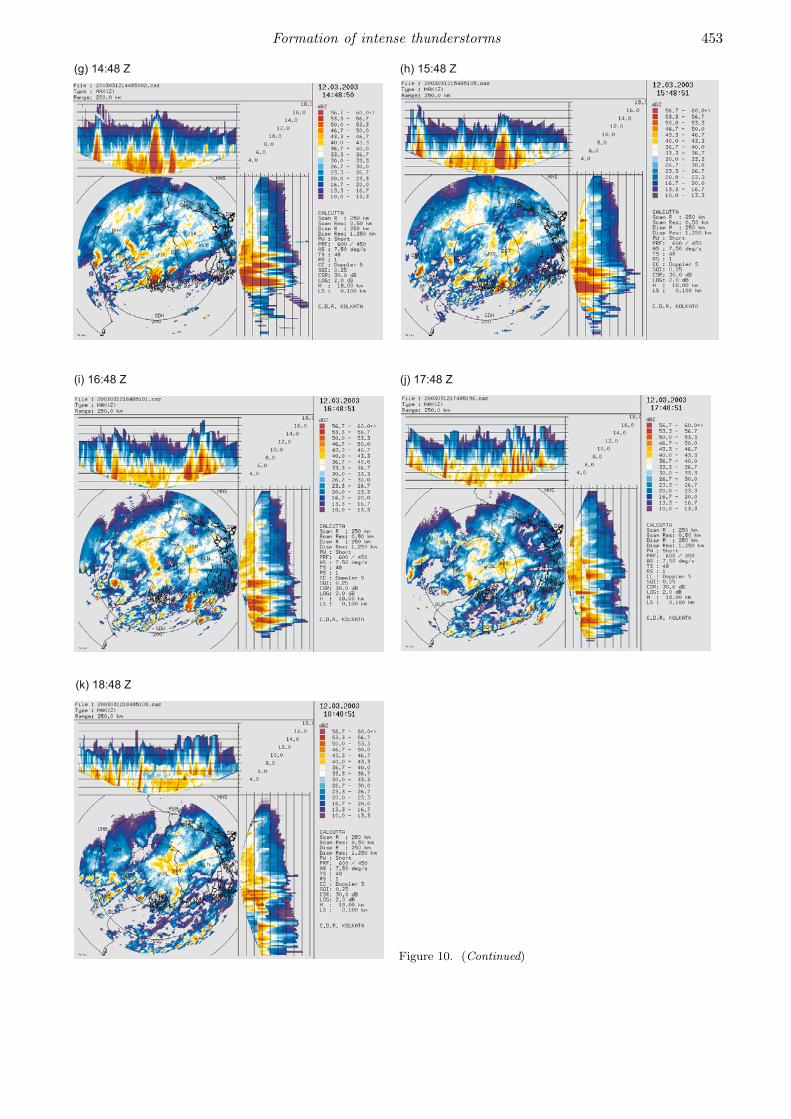
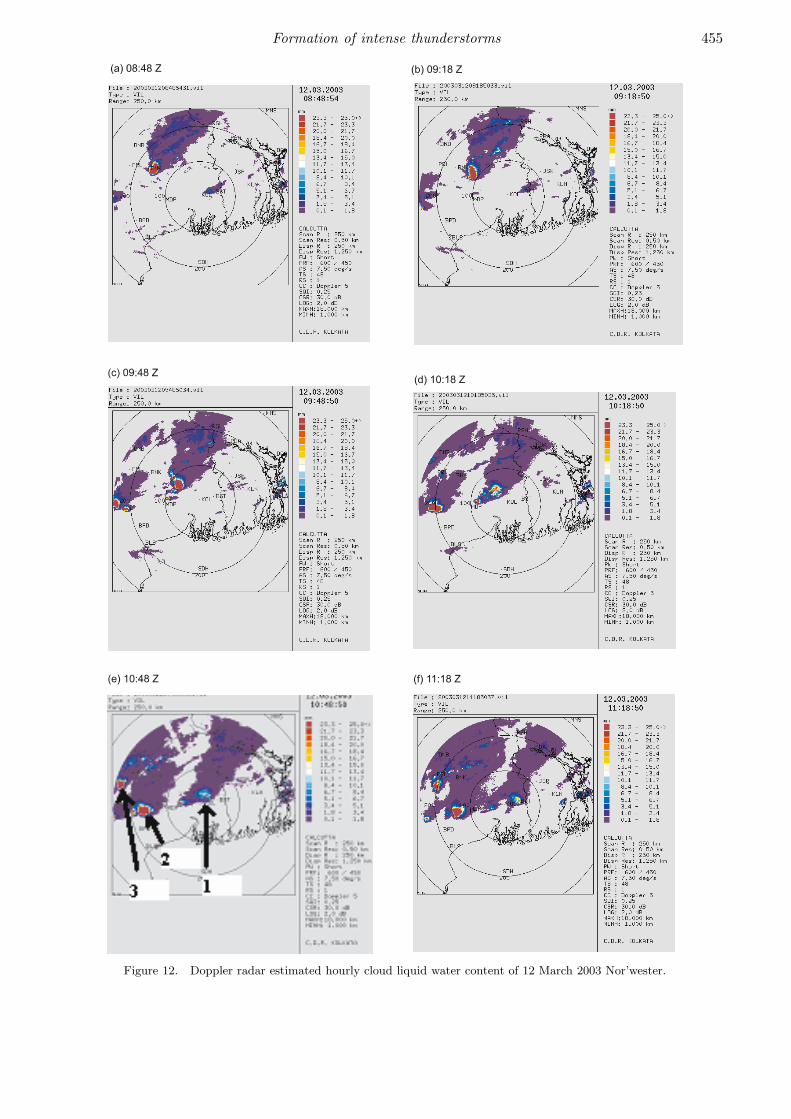
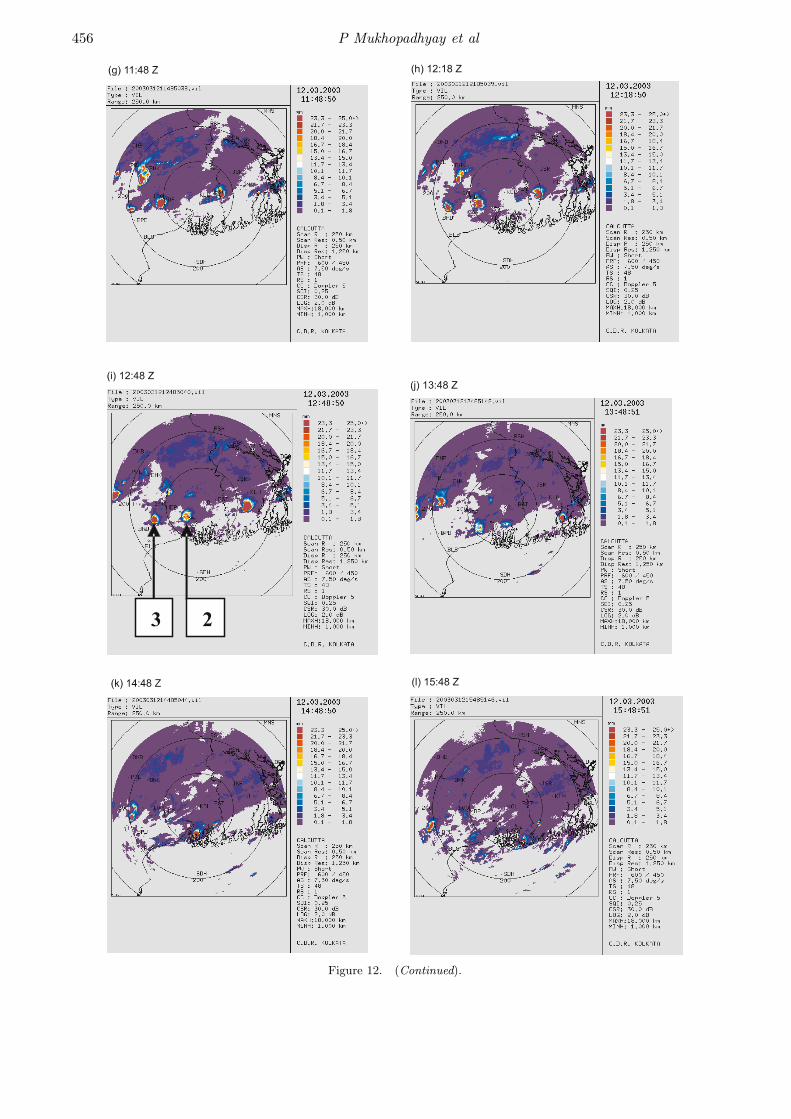
The vertical cross section of east-west and north–south component of Doppler radar reflectivities areshown in figure 10. At 08:48 Z (figure 10a), a systemis detected 150 km north-west to Kolkata. The ver-tical extent of the system is found to reach 12 km.This system steadily moved eastward as seen in theDoppler radar observations in figure 10(b, c). Dur-ing 09:48–10:48 Z two more systems approachedKolkata from the north–west. These are denotedas 2 and 3 in figure 10(c). The second system(shown as 2 in figure 10c) was located 150 km westof Kolkata and the third system (3) was at 250 kmnorth-west of Kolkata at 10:48 Z and the firstsystem (1) by this time was nearby to Kolkata.The vertical extent of the system (1) is found toexceed 14 km whereas that of 2 and 3 is seen tobe around 14 and 12 km respectively at 10:48 Z.The alignment of these three systems at 10:48 Zas captured by the DWR is supported by thesatellite observations at 11 Z (figure 8h). The con-secutive strike by the three Nor’wester cells havemade the event of 12 March severe for Kolkataand surrounding region in terms of devastations.As such this storm has been specially mentionedas an extreme event of Gangetic West Bengalin the NCDC, NOAA climate monitoring site(http://www.ncdc.noaa.gov/oa/climate/research/2003). The first system (1) is seen to move east-ward and cross Indo-Bangladesh border withhigh intensity (vertical height 14 km) by 11:48 Zwhereas the other two systems (2 and 3) movedright and steadily approached Kolkata to strikethe city at 13:48 Z (figure 10f). In the subsequenthours these systems slowly dissipated south ofKolkata towards Bay of Bengal. The time evo-lution of height of convective cloud derived fromDoppler observations for system ‘1’ and ‘2’ areplotted respectively in figure 11(a) and (b). Thesystem ‘1’ approached Kolkata with towering cloudof height 14 km at its full maturity whereas system‘2’ reached Kolkata at the time of dissipation witha height of cloud extending up to 10 km. Apartfrom the different stages, DWR derived verticallyintegrated liquid water content (LWC) (figure 12)
Formation of intense thunderstorms 449
Figure 8. Hourly Meteosat-5 satellite images of 12 March 2003 Nor’wester.
450 P Mukhopadhyay et al
signifies the potential rain bearing cloud andpossibility of heavy precipitation associated withthe system. The three systems aligned one afteranother as noticed in the satellite image of 10:00 Z(figure 8h) and the radar reflectivities at 10:48 Z(figure 10c), are also found in LWC at 10:48, 11:18and 11:48 Z (figure 12e, f and g). These suggestthat the first system (1) after approaching towardsKolkata with increased intensity during 08:48 to09:48 Z (figure 12a–12c), weakened a bit during10:48 to 11:18 Z (figure 12e and 12f) and regainedintensity during 11:48 to 12:48 Z (figure 12g–12i)and move further east toward Bangladesh. The sec-ond (denoted as ‘2’) and third systems (denotedas ‘3’) moved south-eastward and weakened southof Kolkata (figure 12h–k). The systems ‘2’ and ‘3’thus appear to be right moving super cells. Themovement of the systems has been influenced by
Figure 9. SkewT-Log P plot of Kolkata station (a) at 00:00 Z; and (b) 1200 Z of 12 March 2003.
the upper level westerlies. It may be noted herethat the strong system that is detected by thesatellite observations at 12:30 Z (black arrow infigure 8j) is not captured by the DWR in figures 10and 12 which could possibly be due to the sys-tem being at a distance of more than 300 km fromKolkata and beyond the range of the radar. Assuch, due to this, the composite of satellite andDWR could give better guidance for nowcastingand tracking of the Nor’westers.
The 24-h accumulated precipitation estimatevalid at 00 Z of a day from National WeatherService’s Climate Prediction Centre (CPC) overSouth Asian region including India and the DWRderived 12-h accumulated precipitation (mm) iscompared to assess the location and amount of raincaused by the event. The CPC precipitation esti-mate is based on the GTS information of daily
Formation of intense thunderstorms 451
Figure 9. (Continued).
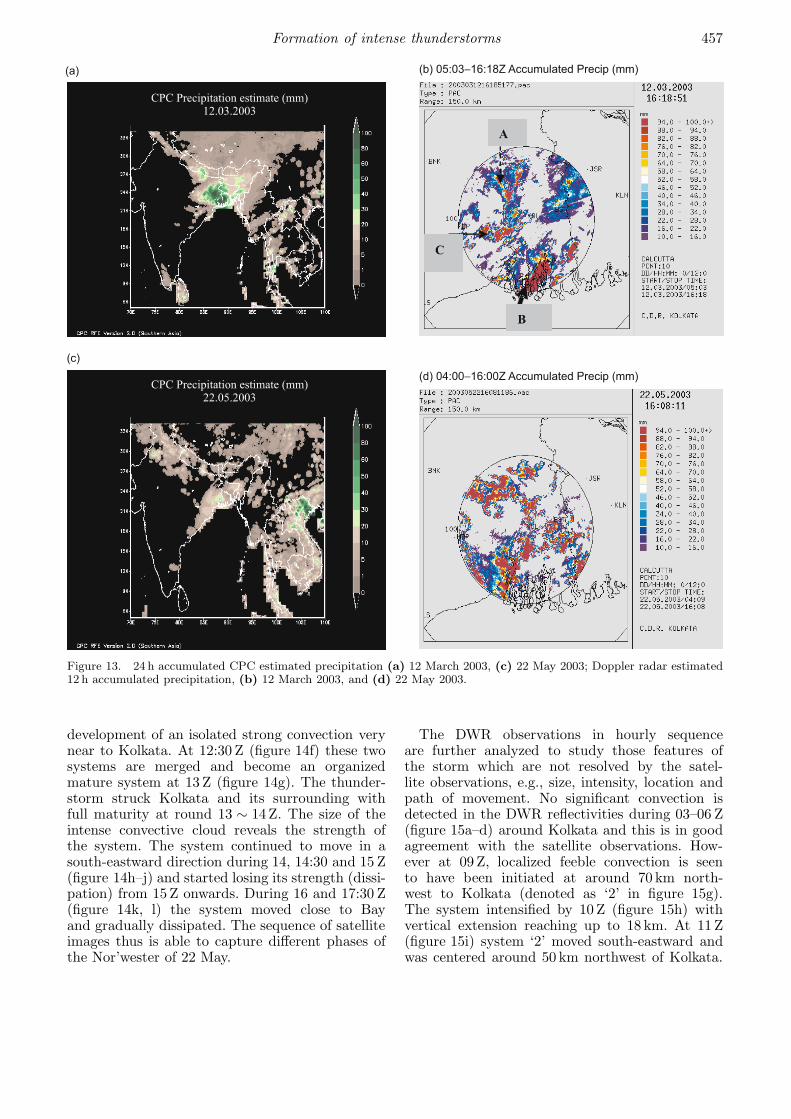
station rain gauge reports, Special SensorMicrowave Imageries (SSMI) estimate, AdvancedMicrowave Sounding Unit (AMSU) estimateand GPI cloud-top IR temperature precipita-tion estimate. The precipitation estimate of CPC(figure 13a) suggests heavy rainfall of the order of100 mm around Kolkata. However, a very detailedspatial distribution of precipitation pattern isfound in the DWR observation (figure 13b). Theprecipitation distribution clearly suggests thepath of movement of the storm. Some pock-ets around 50 km north of Kolkata is found toreceive 100 mm of rain (shown as dotted lineand name ‘A’ figure 13b). An IMD rain gaugestation Krishnanagar (WMO Stn Index 42711,88.52◦E, 23.40◦N) around 50 km north of Kolkatareported 30 mm rain on 12 March which furthersupplements the DWR estimate. Another pocket
around 40–50 km south–west of Kolkata is cap-tured in DWR observation that received 10 mmof rain (shown with thin arrow named as ‘C’in figure 13b). IMD raingauge station Midna-pore (WMO Stn. index 42803, 87.32◦E, 22.42◦N)reported 30 mm rain on 12 March. DWR rainestimate suggests a wide region south of Kolkatanear Bay of Bengal to receive 100 mm rain during11 hour (thick arrow and named ‘B’ figure 13b),this may possibly be attributed to the fact thatthe systems (2 and 3) have moved south-eastwardand dissipated over this region. The IMD sta-tion at Dum Dum (22.65◦N, 88.45◦E) Airport ofKolkata reported 50 mm of rain. All the reports ofIMD station rain gauge appear to be supportingfigure 13(b). Infact the DWR estimated rainfall isable to show detailed spatial distribution aroundKolkata which is not possible to be achieved unless
452 P Mukhopadhyay et al
Figure 10. Hourly cross-section (x–z, y–z) of Doppler radar reflectivities of 12 March 2003 Nor’wester.
Formation of intense thunderstorms 453
Figure 10. (Continued)

454 P Mukhopadhyay et al
Figure 11. (a) Height of convective cloud associated with system ‘1’ and (b) that of system ‘2’ and distance from Kolkatastation at different hour.
rain gauges are physically installed at high spatialdensity.
5.2 Nor’wester of 22 May 2003
The Nor’wester of 22 May was the last of the pre-monsoon season to strike Kolkata city. Figure 6shows the large scale lower and upper troposphericwind field and streamlines over Indian region at00 Z. Figure 7 shows the same at 12 Z. Both thesefigures establish that a lower level shallow troughwas persisting over the Gangetic plains through 00to 12 Z. Figure 14 shows one/half hourly satelliteimages of 22 May. The 08 Z VIS image (figure 14a)hardly shows any presence of convective cloudbut 08:30 Z WV image (figure 14b) shows a small
bright dot (denoted by white arrow) in A north-west direction from Kolkata. This appears to bethe genesis of the storm. The position of thegenesis of the storm is close to the location ofthe low pressure area shown in figure 2(b). Asmentioned in section 3, the genesis of the stormhas been influenced by the presence of low pres-sure area over the Orissa region and the per-sisting trough in the lower troposphere. In thenext 3 h, i.e., at 09, 10 and 11 Z (figure 14c–e),the storm is seen to have intensified and movedin a south-eastward direction towards Kolkata.The VIS image of 11 Z (thick arrow named ‘1’in figure 14e) is even able to show the shadowof towering cumulonimbus cloud. 11 Z image alsoshows (thin arrow of figure 14e named ‘2’) the
Formation of intense thunderstorms 455
Figure 12. Doppler radar estimated hourly cloud liquid water content of 12 March 2003 Nor’wester.
456 P Mukhopadhyay et al
Figure 12. (Continued).
Formation of intense thunderstorms 457
Figure 13. 24 h accumulated CPC estimated precipitation (a) 12 March 2003, (c) 22 May 2003; Doppler radar estimated12 h accumulated precipitation, (b) 12 March 2003, and (d) 22 May 2003.
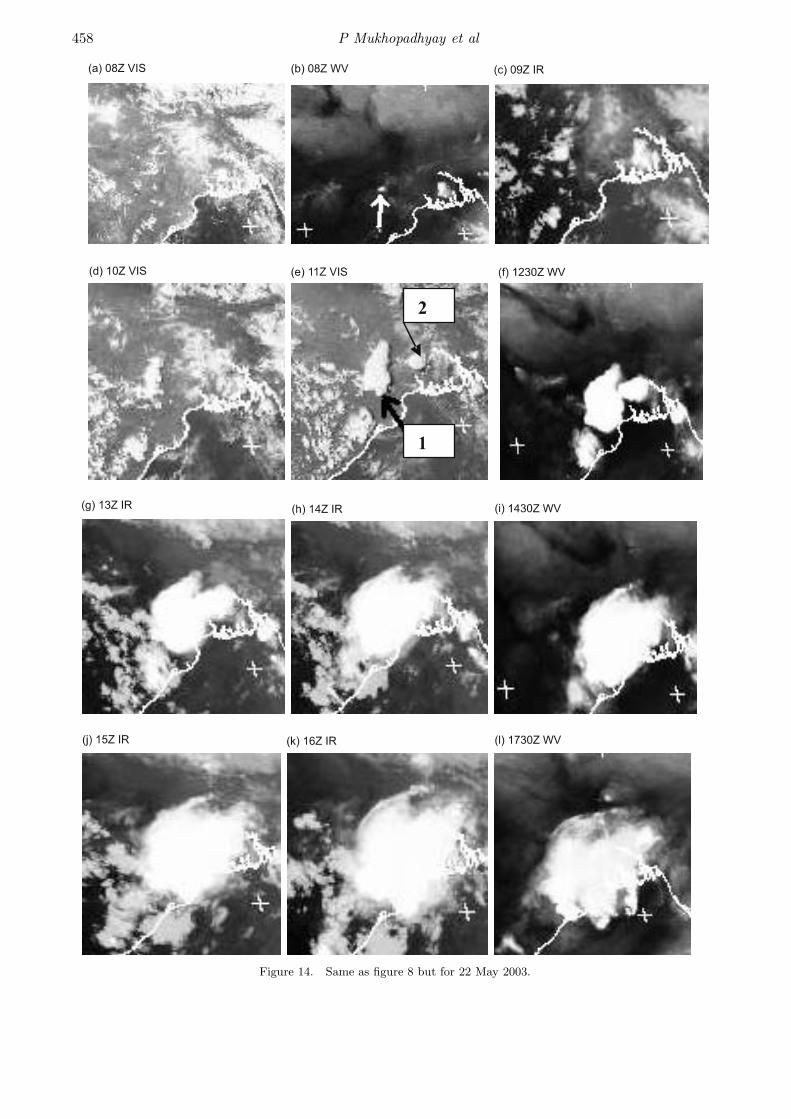
development of an isolated strong convection verynear to Kolkata. At 12:30 Z (figure 14f) these twosystems are merged and become an organizedmature system at 13 Z (figure 14g). The thunder-storm struck Kolkata and its surrounding withfull maturity at round 13 ∼ 14Z. The size of theintense convective cloud reveals the strength ofthe system. The system continued to move in asouth-eastward direction during 14, 14:30 and 15 Z(figure 14h–j) and started losing its strength (dissi-pation) from 15 Z onwards. During 16 and 17:30 Z(figure 14k, l) the system moved close to Bayand gradually dissipated. The sequence of satelliteimages thus is able to capture different phases ofthe Nor’wester of 22 May.
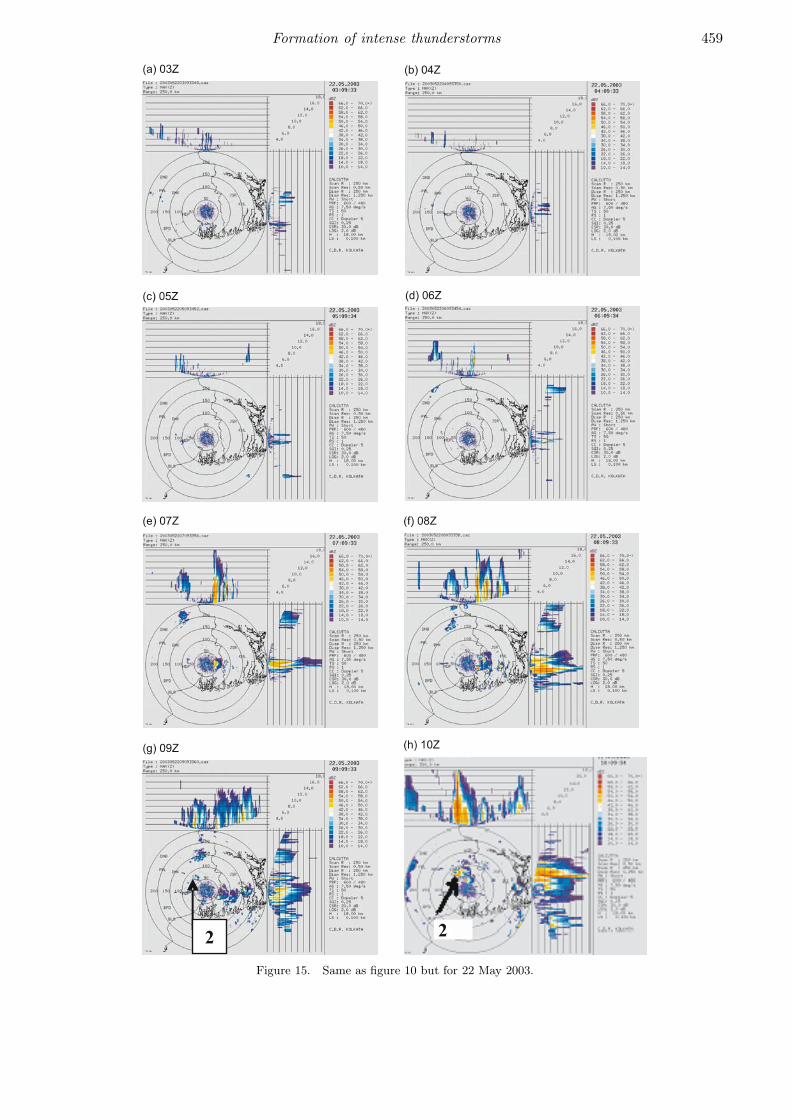
The DWR observations in hourly sequenceare further analyzed to study those features ofthe storm which are not resolved by the satel-lite observations, e.g., size, intensity, location andpath of movement. No significant convection isdetected in the DWR reflectivities during 03–06 Z(figure 15a–d) around Kolkata and this is in goodagreement with the satellite observations. How-ever at 09 Z, localized feeble convection is seento have been initiated at around 70 km north-west to Kolkata (denoted as ‘2’ in figure 15g).The system intensified by 10 Z (figure 15h) withvertical extension reaching up to 18 km. At 11 Z(figure 15i) system ‘2’ moved south-eastward andwas centered around 50 km northwest of Kolkata.
458 P Mukhopadhyay et al
Figure 14. Same as figure 8 but for 22 May 2003.
Formation of intense thunderstorms 459
Figure 15. Same as figure 10 but for 22 May 2003.
460 P Mukhopadhyay et al
Figure 15. (Continued).
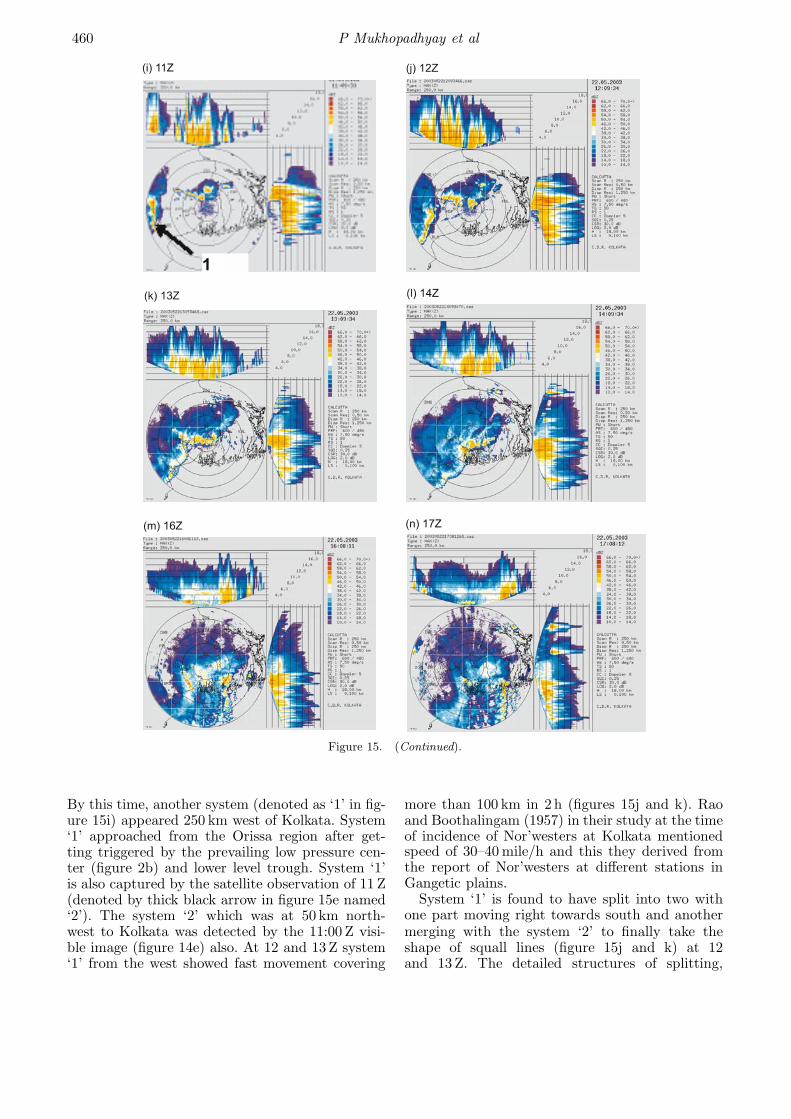
By this time, another system (denoted as ‘1’ in fig-ure 15i) appeared 250 km west of Kolkata. System‘1’ approached from the Orissa region after get-ting triggered by the prevailing low pressure cen-ter (figure 2b) and lower level trough. System ‘1’is also captured by the satellite observation of 11 Z(denoted by thick black arrow in figure 15e named‘2’). The system ‘2’ which was at 50 km north-west to Kolkata was detected by the 11:00 Z visi-ble image (figure 14e) also. At 12 and 13 Z system‘1’ from the west showed fast movement covering
more than 100 km in 2 h (figures 15j and k). Raoand Boothalingam (1957) in their study at the timeof incidence of Nor’westers at Kolkata mentionedspeed of 30–40 mile/h and this they derived fromthe report of Nor’westers at different stations inGangetic plains.
System ‘1’ is found to have split into two withone part moving right towards south and anothermerging with the system ‘2’ to finally take theshape of squall lines (figure 15j and k) at 12and 13 Z. The detailed structures of splitting,
Formation of intense thunderstorms 461
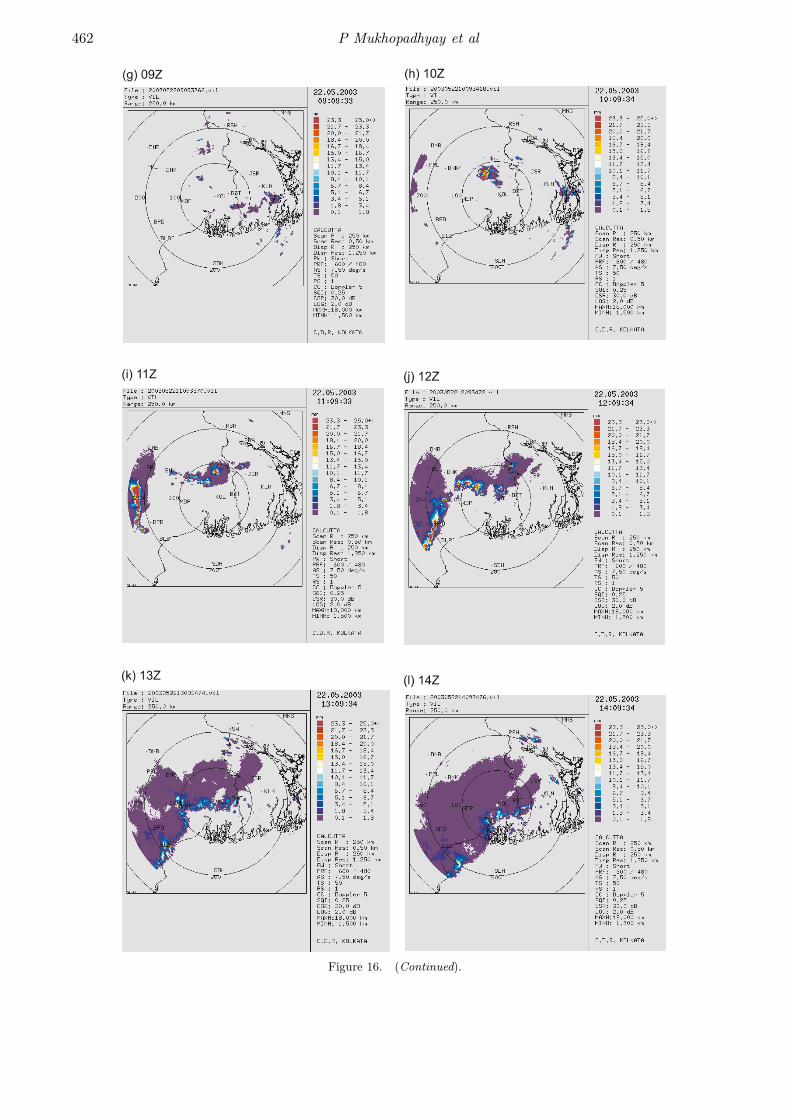
Figure 16. Same as figure 12 but for 22 May 2003.
462 P Mukhopadhyay et al
Figure 16. (Continued).

Formation of intense thunderstorms 463
Figure 17. Doppler derived horizontal wind vectors superimposed on vertical velocity (shaded) for 22 May 2003 event.
merging of the cells and formation of squall linesare well resolved by the DWR observations andthese details are not available by the hourly satel-lite images. The squall line crossed Kolkata at 13 Zand showed weakening by 16 Z (figure 15m) anddissipated completely by 17 Z (figure 15n). Theupper air data (figure not shown) of Kolkata at 00and 12 Z suggests that the atmosphere was unsta-ble throughout the day as reflected by the CAPEvalue from 1004 J/kg at 00:00 to 2063 J/kg at 12 Z.
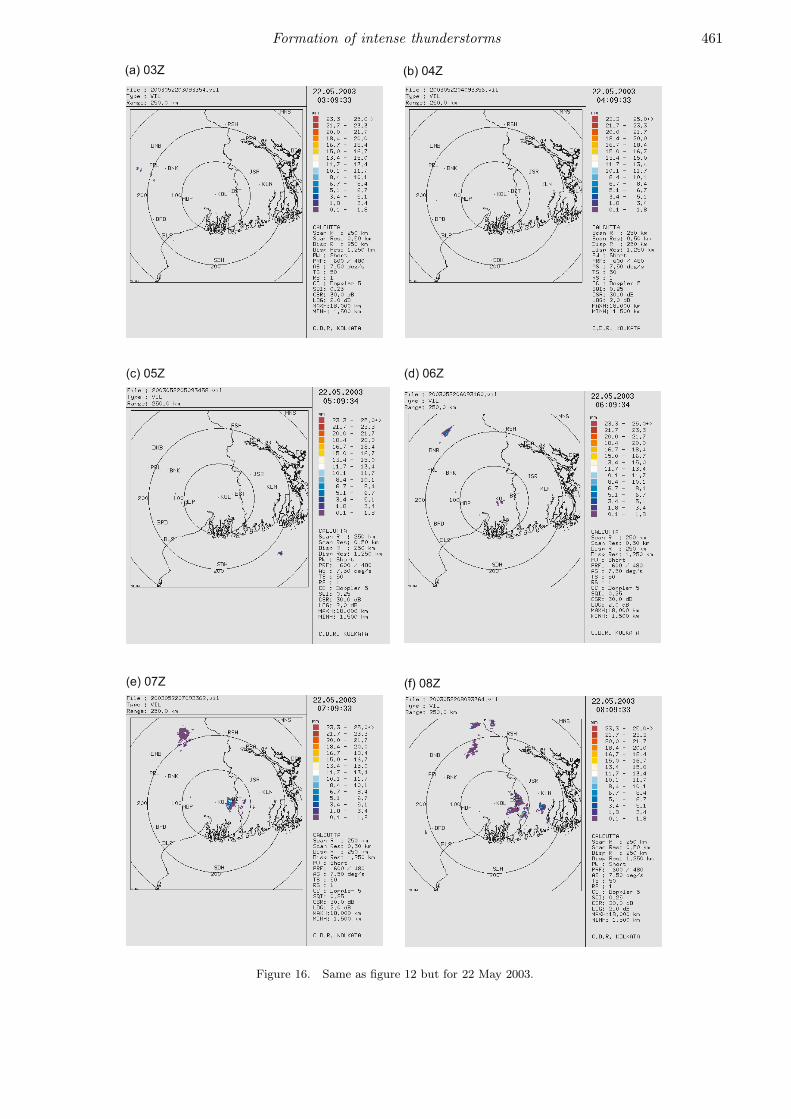
The location of initiation, movement, merging,splitting, maturity and dissipation are captured bythe hourly LWC (figure 16a–i) also. Formation of
system ‘2’ (figure 16g) at 09 Z, intensification insubsequent hours at 10 and 11 Z (figure 16h, i) andmerging with the system ‘1’ at 12 Z (figure 16j) arecaptured in detail and in tune with the figure 15 ofDWR reflectivities. At 10 Z the system was locatedaround 50 km northwest to Kolkata with high LWCvalue of 20 mm. During the next hour the sys-tem splits into multi-cell (8 in numbers) each hav-ing high LWC value. The multi-cell system alignsalong east-west direction. The east-west orientedmulti-cell system merged with another approach-ing system from the west and the combined squalllines crossed Kolkata at 13 Z.
464 P Mukhopadhyay et al
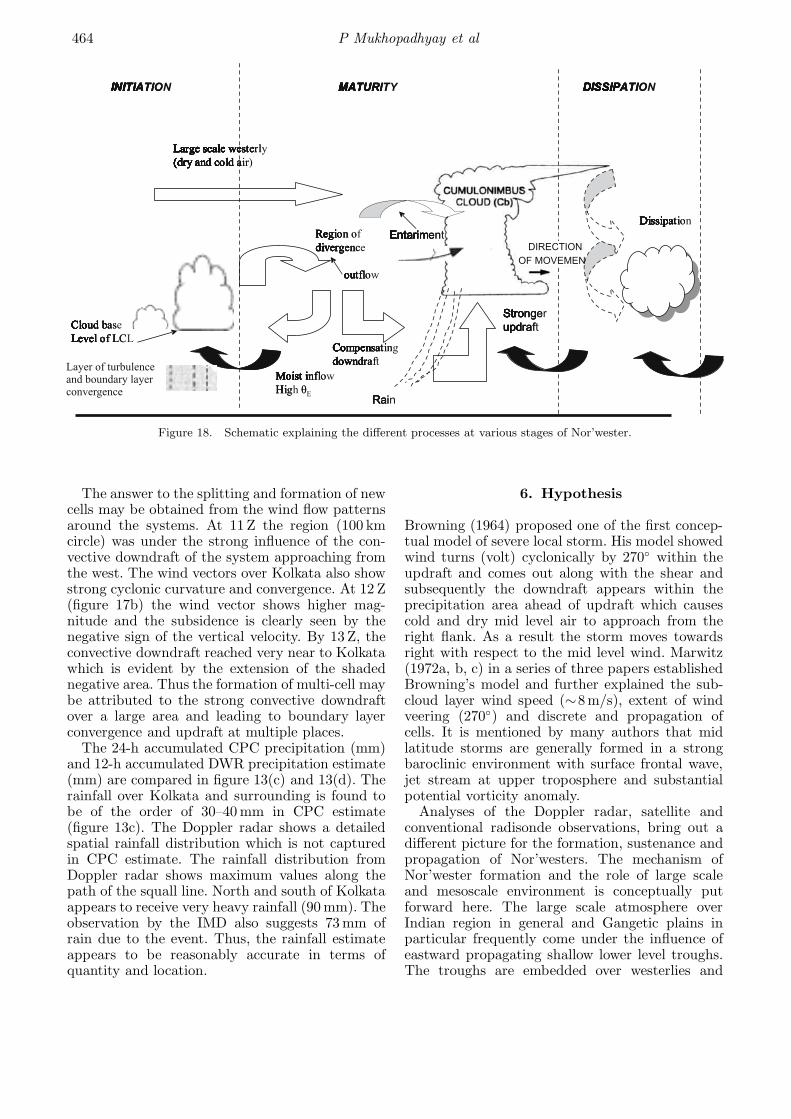
Figure 18. Schematic explaining the different processes at various stages of Nor’wester.
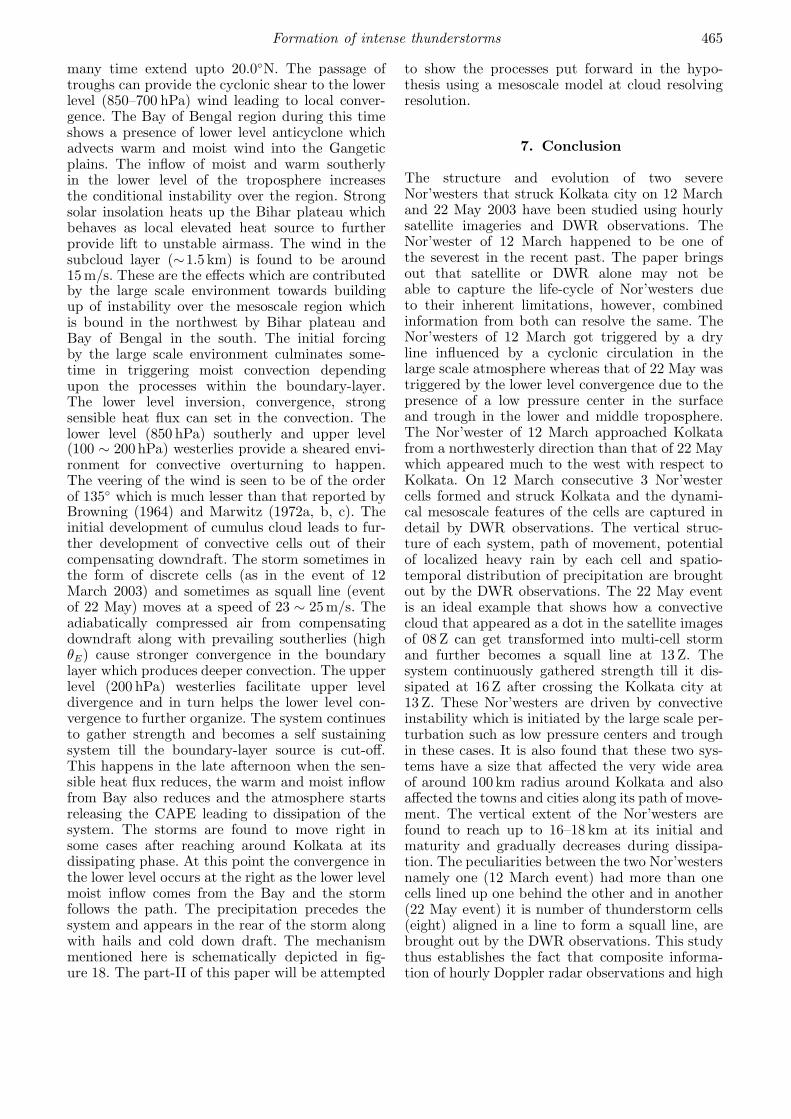
The answer to the splitting and formation of newcells may be obtained from the wind flow patternsaround the systems. At 11 Z the region (100 kmcircle) was under the strong influence of the con-vective downdraft of the system approaching fromthe west. The wind vectors over Kolkata also showstrong cyclonic curvature and convergence. At 12 Z(figure 17b) the wind vector shows higher mag-nitude and the subsidence is clearly seen by thenegative sign of the vertical velocity. By 13 Z, theconvective downdraft reached very near to Kolkatawhich is evident by the extension of the shadednegative area. Thus the formation of multi-cell maybe attributed to the strong convective downdraftover a large area and leading to boundary layerconvergence and updraft at multiple places.
The 24-h accumulated CPC precipitation (mm)and 12-h accumulated DWR precipitation estimate(mm) are compared in figure 13(c) and 13(d). Therainfall over Kolkata and surrounding is found tobe of the order of 30–40 mm in CPC estimate(figure 13c). The Doppler radar shows a detailedspatial rainfall distribution which is not capturedin CPC estimate. The rainfall distribution fromDoppler radar shows maximum values along thepath of the squall line. North and south of Kolkataappears to receive very heavy rainfall (90 mm). Theobservation by the IMD also suggests 73 mm ofrain due to the event. Thus, the rainfall estimateappears to be reasonably accurate in terms ofquantity and location.
6. Hypothesis
Browning (1964) proposed one of the first concep-tual model of severe local storm. His model showedwind turns (volt) cyclonically by 270◦ within theupdraft and comes out along with the shear andsubsequently the downdraft appears within theprecipitation area ahead of updraft which causescold and dry mid level air to approach from theright flank. As a result the storm moves towardsright with respect to the mid level wind. Marwitz(1972a, b, c) in a series of three papers establishedBrowning’s model and further explained the sub-cloud layer wind speed (∼8m/s), extent of windveering (270◦) and discrete and propagation ofcells. It is mentioned by many authors that midlatitude storms are generally formed in a strongbaroclinic environment with surface frontal wave,jet stream at upper troposphere and substantialpotential vorticity anomaly.
Analyses of the Doppler radar, satellite andconventional radisonde observations, bring out adifferent picture for the formation, sustenance andpropagation of Nor’westers. The mechanism ofNor’wester formation and the role of large scaleand mesoscale environment is conceptually putforward here. The large scale atmosphere overIndian region in general and Gangetic plains inparticular frequently come under the influence ofeastward propagating shallow lower level troughs.The troughs are embedded over westerlies and
Formation of intense thunderstorms 465
many time extend upto 20.0◦N. The passage oftroughs can provide the cyclonic shear to the lowerlevel (850–700 hPa) wind leading to local conver-gence. The Bay of Bengal region during this timeshows a presence of lower level anticyclone whichadvects warm and moist wind into the Gangeticplains. The inflow of moist and warm southerlyin the lower level of the troposphere increasesthe conditional instability over the region. Strongsolar insolation heats up the Bihar plateau whichbehaves as local elevated heat source to furtherprovide lift to unstable airmass. The wind in thesubcloud layer (∼1.5 km) is found to be around15 m/s. These are the effects which are contributedby the large scale environment towards buildingup of instability over the mesoscale region whichis bound in the northwest by Bihar plateau andBay of Bengal in the south. The initial forcingby the large scale environment culminates some-time in triggering moist convection dependingupon the processes within the boundary-layer.The lower level inversion, convergence, strongsensible heat flux can set in the convection. Thelower level (850 hPa) southerly and upper level(100 ∼ 200 hPa) westerlies provide a sheared envi-ronment for convective overturning to happen.The veering of the wind is seen to be of the orderof 135◦ which is much lesser than that reported byBrowning (1964) and Marwitz (1972a, b, c). Theinitial development of cumulus cloud leads to fur-ther development of convective cells out of theircompensating downdraft. The storm sometimes inthe form of discrete cells (as in the event of 12March 2003) and sometimes as squall line (eventof 22 May) moves at a speed of 23 ∼ 25m/s. Theadiabatically compressed air from compensatingdowndraft along with prevailing southerlies (highθE) cause stronger convergence in the boundarylayer which produces deeper convection. The upperlevel (200 hPa) westerlies facilitate upper leveldivergence and in turn helps the lower level con-vergence to further organize. The system continuesto gather strength and becomes a self sustainingsystem till the boundary-layer source is cut-off.This happens in the late afternoon when the sen-sible heat flux reduces, the warm and moist inflowfrom Bay also reduces and the atmosphere startsreleasing the CAPE leading to dissipation of thesystem. The storms are found to move right insome cases after reaching around Kolkata at itsdissipating phase. At this point the convergence inthe lower level occurs at the right as the lower levelmoist inflow comes from the Bay and the stormfollows the path. The precipitation precedes thesystem and appears in the rear of the storm alongwith hails and cold down draft. The mechanismmentioned here is schematically depicted in fig-ure 18. The part-II of this paper will be attempted
to show the processes put forward in the hypo-thesis using a mesoscale model at cloud resolvingresolution.
7. Conclusion
The structure and evolution of two severeNor’westers that struck Kolkata city on 12 Marchand 22 May 2003 have been studied using hourlysatellite imageries and DWR observations. TheNor’wester of 12 March happened to be one ofthe severest in the recent past. The paper bringsout that satellite or DWR alone may not beable to capture the life-cycle of Nor’westers dueto their inherent limitations, however, combinedinformation from both can resolve the same. TheNor’westers of 12 March got triggered by a dryline influenced by a cyclonic circulation in thelarge scale atmosphere whereas that of 22 May wastriggered by the lower level convergence due to thepresence of a low pressure center in the surfaceand trough in the lower and middle troposphere.The Nor’wester of 12 March approached Kolkatafrom a northwesterly direction than that of 22 Maywhich appeared much to the west with respect toKolkata. On 12 March consecutive 3 Nor’westercells formed and struck Kolkata and the dynami-cal mesoscale features of the cells are captured indetail by DWR observations. The vertical struc-ture of each system, path of movement, potentialof localized heavy rain by each cell and spatio-temporal distribution of precipitation are broughtout by the DWR observations. The 22 May eventis an ideal example that shows how a convectivecloud that appeared as a dot in the satellite imagesof 08 Z can get transformed into multi-cell stormand further becomes a squall line at 13 Z. Thesystem continuously gathered strength till it dis-sipated at 16 Z after crossing the Kolkata city at13 Z. These Nor’westers are driven by convectiveinstability which is initiated by the large scale per-turbation such as low pressure centers and troughin these cases. It is also found that these two sys-tems have a size that affected the very wide areaof around 100 km radius around Kolkata and alsoaffected the towns and cities along its path of move-ment. The vertical extent of the Nor’westers arefound to reach up to 16–18 km at its initial andmaturity and gradually decreases during dissipa-tion. The peculiarities between the two Nor’westersnamely one (12 March event) had more than onecells lined up one behind the other and in another(22 May event) it is number of thunderstorm cells(eight) aligned in a line to form a squall line, arebrought out by the DWR observations. This studythus establishes the fact that composite informa-tion of hourly Doppler radar observations and high
466 P Mukhopadhyay et al
resolution satellite imageries can be used togetherto explore many features of the Nor’westers whichotherwise remain unnoticed due to the lack of highdensity observational network. For the first timea conceptual model is proposed explaining differ-ent physical processes that dominates at differentstages of the storms and this will help in under-standing these fury of natures.
Acknowledgements
The authors are thankful to the Director, IndianInstitute of Tropical Meteorology (IITM), Pune,India, for his interest, encouragement and sug-gestions in this study. Authors are thankful tothe Head, Forecasting Research Division for hiskeen interest. Authors are thankful to the Direc-tor General, India Meteorological Departmentfor giving access to Doppler radar observations.First author acknowledges Dr S K Kundu, IMDfor his help in utilizing Doppler radar obser-vations. Figure 4 is downloaded from the web-site http://www.bangladeshtornadoes.org/. Thereports of damages are taken from the website ofThe Telegraph (http://www.telegraphindia.com)and The Statesman daily newspaper. The map ofWest Bengal and its districts is taken from thewebsite www.mapsofindia.com.
References
Bhatnagar A K, Rajesh Rao P, Kalyanasundaram S,Thampi S B and Gupta J P 2003 Doppler radar –A detecting tool and measuring instrument in meteoro-logy; Curr. Sci. 85 256–264.
Bose B L 1957 The Nor’wester and the lower level conver-gence; Ind. J. Meteor. Geophys. 8 391–398.
Browning K A 1964 Airflow and precipitation trajectorieswithin severe local storms which travel to the right of thewinds; J. Atmos. Sci. 21 634–639.
Das P M, De A C and Gangopadhyaya M 1957 Movementsof two Nor’westers of West Bengal: A radar study; Ind.J. Meteor. Geophys. 8 399–406.
De A C, Das P M and Gangopadhyaya M 1957 Regenerativedrift of a thunderstorm squall of the southwest monsoonseason; Ind. J. Meteor. Geophys. 8 71–80.
Desai B N 1950 Mechanism of Nor’westers of Bengal; Ind.J. Meteor. Geophys. 1 74–76.
Dostalek J F, Weaver J F and Phillips G L 2004 Aspectsof a tornadic left-moving thunderstorm of 25 May 1999;Wea. Forecasting 19 614–626.
Floyd J 1838 Account of the hurricane or whirlwind of the8 April 1838; J. Asiatic Soc. Bengal 7 422–429.
Ghosh A, Lohar D and Das J 2008 Initiation of Nor’westerin relation to mid-upper and low-level water vaporpatterns on METEOSAT-5 images; Atmos. Res. 87116–135.
Gonski R F, Woods B P and Korotky W D 1989 The Raleightornado – 28 November 1988. An operational perspec-tive; Preprints, 12th Conf. Wea. Analysis and Forecasting(Monterey, CA), Amer. Meteor. Soc. 173–178.
Hane C E, Bluestein H B, Crawford T M, Baldwin M E andRabin R M 1997 Severe thunderstorm development inrelation to along-dryline variability: A case study; Mon.Wea. Rev. 125 231–251.
Kennedy P C and Detwiler A G 2003 A case study of theorigin of hail in a multicell thunderstorm using in situaircraft and polarimetric radar data; J. Appl. Meteor. 421679–1690.
Klimowski B A and Bunkers M J 2002 Comments on satel-lite observations of a supercell thunderstorm on 24 July2000 made during the GOES-11 Science Test; Wea. Fore-casting 17 1111–1117.
MacKeen P L, Brooks H E and Elmore K L 1999 Radarreflectivity-derived thunderstorm parameters appliedto storm longevity forecasting; Wea. Forecasting 14289–295.
Marwitz J D 1972a The structure and motion of severehailstorms. Part I: Supercell storms; J. Appl. Meteor. 11166–179.
Marwitz J D 1972b The structure and motion of severe hail-storms. Part II: Multicell storms; J. Appl. Meteor. 11180–188.
Marwitz J D 1972c The structure and motion of severehailstorms. Part III: Severely sheared storms; J. Appl.Meteor. 11 189–201.
Mukhopadhyay P, Singh H A K and Singh S S 2005 Twosevere Nor’westers in April 2003 over Kolkata, Indiausing Doppler radar observations and satellite imageries;Weather 60 343–353.
Mull S and Rao Y P 1950 Dynamics of thunderstorms:Part I; Ind. J. Meteor. Geophys. 1 116–136.
Mull S and Rao Y P 1950 Dynamics of thunderstorms:Part II; Ind. J. Meteor. Geophys. 1 291–297.
Rai Sircar N C 1957 On the forecasting of Nor’westersin Gangetic West Bengal; Ind. J. Meteor. Geophys. 821–32.
Rao D V and Boothalingam P N 1957 On forecastingthe time of incidence of Nor’westers at Calcutta; Ind.J. Meteor. Geophys. 8 61–66.
Ricketts H, Russell A and Norton E 2007 Meeting reportthunderstorms; Weather 62 107–108.
Sohoni V V 1928 Thunderstorms of Calcutta, 1900–1926.Ind. Met. Dept. Sci. Notes I(3) 25–36.
Short D A, Sardonia J E, Lambert W C and Wheeler M M2004 Nowcasting thunderstorm Anvil Clouds overKennedy Space Center and Cape Canaveral Air ForceStation; Wea. Forecasting 19 706–713.
Wakimoto R M 1982 The life cycle of thunderstorm gustfronts as viewed with Doppler radar and rawinsonde data;Mon. Wea. Rev. 110 1060–1082.
Weaver J F, Knaff J A, Bikos D, Wade G S and Daniels J M2002 Satellite observations of a supercell thunderstormon 24 July 2000 made during the GOES-11 science test;Wea. Forecasting 17 124–138.
Weaver J F and Lindsey D 2004 Some frequently overlookedsevere thunderstorm characteristics observed on GOESimagery: A topic for future research; Mon. Wea. Rev. 1321529–1533.
Weckwerth T M 2000 The effect of small-scale moisturevariability on thunderstorm initiation; Mon. Wea. Rev.128 4017–4030.
MS received 6 January 2009; revised 9 April 2009; accepted 9 June 2009