THE INTENDED NATIONALLY DETERMINED CONTRIBUTIONS ...
92
62 ENVIRONMENT [ CLIMATE CHANGE ] ENVIRONMENT AND NATURAL RESOURCES MANAGEMENT WORKING PAPER THE AGRICULTURE SECTORS IN THE INTENDED NATIONALLY DETERMINED CONTRIBUTIONS: Analysis
Transcript of THE INTENDED NATIONALLY DETERMINED CONTRIBUTIONS ...

61
62
EN
VI
RO
NM
EN
T [
CL
IM
AT
E
CH
AN
GE
]
EN
VI
RO
NM
EN
T A
ND
NA
TU
RA
L R
ES
OU
RC
ES
MA
NA
GE
ME
NT
WO
RK
IN
G P
AP
ER
Th
e a
gricu
lture
secto
rs in th
e In
ten
de
d N
atio
na
lly D
ete
rmin
ed
Co
ntrib
utio
ns: A
na
lysis
FAO
THE AGRICULTURE SECTORS IN THE INTENDED NATIONALLY DETERMINED CONTRIBUTIONS: Analysis
Climate and Environment Division (NRC) Publications
Food and Agriculture Organization of the United Nations (FAO)
www.fao.org/climate-change

Background image in this page
Cover images:
elaborated from “L’Encyclopédie Diderot et D’Alembert”
©FAO/Antonello Proto©FAO/Joan Manuel Baliellas©FAO/Daniel Hayduk
Food and Agriculture Organization of the United NationsRome, 2016
62
EN
VI
RO
NM
EN
T
CL
IM
AT
E
CH
AN
GE
EN
VI
RO
NM
EN
T A
ND
NA
TU
RA
L R
ES
OU
RC
ES
MA
NA
GE
ME
NT
WO
RK
IN
G P
AP
ER
[]
THE AGRICULTURE SECTORS IN THE INTENDED NATIONALLY DETERMINED CONTRIBUTIONS: Analysis
Authors
Rita Strohmaier, Janie Rioux, Anika Seggel, Alexandre Meybeck,
Martial Bernoux, Mirella Salvatore, Javier Miranda, Astrid Agostini

Any mistakes or misinterpretations are the sole responsibility of the authors of this analysis. The reference shall be the INDCs as published on the UNFCCC website.
The designations employed and the presentation of material in this information product do not imply the expression of any opinion whatsoever on the part of the Food and Agriculture Organization of the United Nations (FAO) concerning the legal or development status of any country, territory, city or area or of its authorities, or concerning the delimitation of its frontiers or boundaries. The mention of specific companies or products of manufacturers, whether or not these have been patented, does not imply that these have been endorsed or recommended by FAO in preference to others of a similar nature that are not mentioned.
The views expressed in this information product are those of the author(s) and do not necessarily reflect the views or policies of FAO.
ISBN 978-92-5-109244-6
© FAO, 2016
FAO encourages the use, reproduction and dissemination of material in this information product. Except where otherwise indicated, material may be copied, downloaded and printed for private study, research and teaching purposes, or for use in non-commercial products or services, provided that appropriate acknowledgement of FAO as the source and copyright holder is given and that FAO’s endorsement of users’ views, products or services is not implied in any way.
All requests for translation and adaptation rights, and for resale and other commercial use rights should be made via www.fao.org/contact-us/licence-request or addressed to [email protected].
FAO information products are available on the FAO website (www.fao.org/publications) and can be purchased through [email protected].
Reommended citation: FAO, 2016. The agriculture sectors in the Intended Nationally Determined Contributions: Analysis, by Strohmaier, R., Rioux, J., Seggel, A., Meybeck, A., Bernoux, M., Salvatore, M., Miranda, J. and Agostini, A. Environment and Natural Resources Management Working Paper No. 62. Rome.

iii
FOREWORD
ACKNOWLEDGEMENTS
ACRONYMS
EXECUTIVE SUMMARY
1.1. Overview: agriculture sectors in the INDCs1.1.1. Mitigation1.1.2. Vulnerabilities1.1.3. Adaptation1.1.4. Synergies and co-benefits1.1.5. Planning and Implementation
1. INTRODUCTION AND METHODOLOGY
1.1. Purpose and structure1.2. Methodology2. OVERVIEW OF THE INTENDED NATIONALLY DETERMINED CONTRIBUTIONS
2.1. Coverage of Mitigation2.1.1. Sectors2.1.2. Types of contribution
2.2. Coverage of Adaptation2.2.1. Disaster Risk Management
3. MITIGATION IN AGRICULTURE AND LULUCF
3.1. Agriculture and mitigation3.1.1. An Overview3.1.2. Agriculture: types of mitigation contributions3.1.3. Policies and measures for mitigating in agriculture
3.2. LULUCF and mitigation3.2.1. An Overview3.2.2. LULUCF: types of mitigation contributions3.2.3. Policies and measures for mitigation in LULUCF
3.3. Bioenergy: mitigation potential in agriculture and LULUCF4. VULNERABILITIES
4.1. Vulnerabilities and national circumstances4.2. Biophysical impacts of climate change4.3. Importance of the agriculture sectors4.4. Social and economic vulnerabilities4.5. Food security and nutrition vulnerabilities5. ADAPTATION AREAS AND ACTIONS IN THE AGRICULTURE SECTORS
5.1. An overview5.2. The agriculture sectors
5.2.1. Crops & livestock5.2.2. Forestry5.2.3. Fisheries and aquaculture
vii
ix
xi
xiii
xivxiv
xv
xv
xvixvi
11
2
5
55
6
910
11
12
12
13
14
15
15
16
1718
1919
1920
20
2225
2527
27
3032
CCONTENTS

iv
]T
HE
AG
RIC
ULT
UR
E S
EC
TO
RS
IN T
HE
IN
TE
ND
ED
NA
TIO
NA
LLY
DE
TE
RM
INE
D C
ON
TR
IBU
TIO
NS
- A
NA
LYSI
S[
Figure 1. Percentage of countries covering specific sectors in their mitigation contributions
Figure 2. Percentage of countries covering different GHGs in their mitigation contributions
Figure 3. Percentage of countries by type of mitigation targetsFigure 4. Percentage of countries that include specific adaptation areas
and/or actions, by economic grouping and regionFigure 5. Percentage of countries that mention mitigation targets and/ or
actions in agriculture and/or LULUCF by economic grouping and region
Figure 6. Percentage of countries that cover mitigation in agriculture, by economic grouping and region
Figure 7. Percentage of countries covering agriculture in their mitigation contributions
Figure 8. Percentage of countries that refer to concrete policies and measures in agriculture, by type of activity
Figure 9. Percentage of countries that mention mitigation in LULUCF, by economic grouping and region
Figure 10. Modalities of presentation of LULUCF contributionsFigure 11. Percentage of countries that refer to mitigation policies and
measures in LULUCF: by type of activity
FIGURES
5.3. Cross-cutting areas relevant for the agriculture sectors 5.3.1. Water services5.3.2. Disaster risk management in the agriculture sectors5.3.3. Loss and damage5.3.4. Livelihood strategies, knowledge transfer and capacity building, gender
6. SYNERGIES AND CO-BENEFITS
6.1. Synergies between adaptation and mitigation6.2. Co-benefits with other environmental, economic and social goals7. DEVELOPING THE INDCS AND PLANNING THE IMPLEMENTATION OF THE NDCS
7.1. Stakeholder engagement in planning the INDCs 7.2. Policies and institutions7.3. Climate finance7.4. Capacity building, knowledge and technology transfer needsCONCLUDING REMARKS
REFERENCES
ANNEX
A. MethodologyA.1 ApproachData collection and organizationA.2 Country ClassificationB. Climate-Smart Agriculture (CSA) in the INDCsC. Related INDC assessments
3434
35
3738
41
41
43
47
4748
50
52
5557
59
59
5959
62
63
67
5
6
7
9
11
12
13
14
16
16
18

v
BOXES
23
26
26
28
29
31
33
36
49
8
21
2932
34
36
3839
4236
44
Figure 12. Percentage of countries that mention food security and nutrition by economic grouping and region
Figure 13. Percentage of countries that include priority areas for adaptation and/or adaptation actions in general and including the agriculture sectors
Figure 14. Adaptation coverage of the agriculture sectors in the INDCs by economic grouping and region
Figure 15. Percentage of countries that mention adaptation areas and/or actions in agriculture by economic grouping and region
Figure 16. Percentage of countries that mention adaptation actions in crop systems and livestock and pastoral systems by economic grouping and region
Figure 17. Percentage of countries that mention adaptation areas and/or actions in forests/ forestry by economic grouping and region
Figure 18. Percentage of countries that mention adaptation areas and/or actions in fisheries and/or aquaculture by economic grouping and region
Figure 19. Percentage of DRM measures in the agriculture sectors by categorical breakdown
Figure 20. Percentage of countries that mention a NAP by economic grouping and region
Box 1. Types of GHG-targetsBox 2. Selected examples of the economic impacts of climate change and
climate-related hazards on the agriculture sectorsBox 3. Selected adaptation actions in crops and livestockBox 4. Selected adaptation actions in forestryBox 5. Selected adaptation actions in the fisheries and aquaculture sectorBox 6. Selected DRM measures in general and in the agriculture sectorsBox 7. Selected examples for loss and damageBox 8. Selected measures on livelihood strategies, knowledge transfer,
capacity building, genderBox 9. Selected synergies between mitigation and adaptationBox 10. Selected example for social, economic and environmental
co-benefits of adaptation and mitigation actionsBox 11. Gender in the INDCs

vi
]T
HE
AG
RIC
ULT
UR
E S
EC
TO
RS
IN T
HE
IN
TE
ND
ED
NA
TIO
NA
LLY
DE
TE
RM
INE
D C
ON
TR
IBU
TIO
NS
- A
NA
LYSI
S[
Table 1. Countries indicating need for financial support for the implementation of their INDCs
Table 2. Financial needs per year of selected countries in Sub-Saharan Africa (in current Mio. USD)
Map 1. Countries that include agriculture, LULUCF, or both in their mitigation contributions
Map 2. Countries that refer to adaptation in the agriculture sectorsMap 3. Country classificationMap 4. Countries that refer to CSA in their INDCs
TABLES
MAPS
50
52
xvii
xvii3
42

vii
FOREWORD
The international community reached three landmark agreements in 2015. The 2030 Agenda for Sustainable Development outlines the ambitions of the international community to build an equitable, hunger-free and sustainable world. At the Third International Conference on Financing for Development, countries agreed on how to support the 2030 Agenda and invest in sustainable development. Finally, the Paris Agreement that was finalized in December 2015 provides the framework we need to mount a comprehensive global response to climate change.
The Paris Agreement is a major achievement in multilateral diplomacy, and a significant step forward in the international discourse on climate change. For the first time, we have a universal climate change agreement through which developed and developing countries commit to pursuing a resilient and low-emissions future. Furthermore, the preamble of the Agreement recognizes the fundamental priority of safeguarding food security and ending hunger, and the particular vulnerabilities of food production systems to the adverse impacts of climate change. This is indicative of growing international recognition that climate action and the 2030 Agenda are inextricably linked.
The Paris Agreement was built on the intended nationally determined contributions (INDCs) submitted by UNFCCC Parties. This bottom-up approach, grounded in country leadership, was vital to producing a successful outcome at COP21.
In their INDCs countries offer a clear indication of how they intend to respond to climate change, and where they require international support. FAO’s global assessment of the INDCs clearly shows that countries expect the agricultural sectors (crops, livestock, forestry, fisheries and aquaculture) to play a significant role in responding to climate change. This is particularly true in developing countries, where the agricultural sectors are vital sources of livelihoods, income and food security.
Countries will take the lead in taking transformative climate action in the agricultural sectors, but the international community must support developing countries in doing so. This is not only an imperative, but also a tremendous opportunity for sustainable development. Well-targeted interventions in the agricultural sectors are uniquely able to deliver adaptation and mitigation benefits, as well as economic, environmental and social co-benefits – often simultaneously. The transformative potential of these sectors is unrivalled.
This report provides a granular picture of priority adaptation and mitigation areas, actions and support needs. As the international community shifts its attention to the implementation of the Paris Agreement, all climate action will be guided by countries’ nationally determined contributions (NDCs) and relevant national policy frameworks.
viii
]T
HE
AG
RIC
ULT
UR
E S
EC
TO
RS
IN T
HE
IN
TE
ND
ED
NA
TIO
NA
LLY
DE
TE
RM
INE
D C
ON
TR
IBU
TIO
NS
- A
NA
LYSI
S[
FAO stands ready to support Member States to build on the findings of this assessment to scale up climate action in their agricultural sectors; effectively implement relevant components of their NDCs; and fulfill their commitments under the Paris Agreement. FAO is eager to work with the international community to accomplish this.
It is our collective responsibility to ensure that the countries that have contributed the least to causing climate change are able to thrive despite its effects.
Martin FrickDirector, Climate and Environment DivisionFood and Agriculture Organization of the United Nations

ix
ACKNOWLEDGEMENTS
The INDCs Analysis Report 2016 was prepared under the overall leadership of Martin Frick, Director of NRC, and Astrid Agostini (Natural Resource Officer, NRC).
The analysis and writing team was led by Rita Strohmaier (NRC), Janie Rioux (NRC), Anika Seggel (NRC), Alexandre Meybeck (AGDD), Martial Bernoux (NRC), Mirella Salvatore (NRC), Javier Miranda (NRC), and Astrid Agostini (NRC).
The analysis and writing team is especially thankful for valuable guidance and inputs provided by Stephan Baas (SP5) and Julia Wolf (NRC).
Several other colleagues from throughout FAO have reviewed the report and/ or provided valuable additions to its content: Malcom Beveridge (FIAA), Nicholas Ross (NRC), Susan Braatz (FOA), RosaLaura Romeo (FOA), Selvaraju Ramasamy (NRC), Szilvia Lehel (ESP), Sara Manuelli (FOA), Paolo Prosperi (NRC), Emily Olsson (NRC), Rocio Condor (NRC), Alessandro Flammini (TCIC), Cassandra DeYoung (RAP), Rebeca Koloffon (NRC), Simmone Rose (FOA) and Erick Velazquez (NRC).
The draft INDCs Analysis Report was also submitted to public consultation and many valuable contributions were received. In this context, gratitude is especially owed to Karin Simonson (Canadian Forest Service), Stephanie Heiland and Julian Schlubach (GIZ, Germany) and Tonya Rawe and Aurélie Ceinos (CARE International).
The graphic designer Juan Luis Salazar is acknowledged for his good work.


xi
ACRONYMS
AI Annex I BAU Business as usual
CCAFSCGIAR Research Program on Climate Change, Agriculture and Food Security
CDKN Climate and Development Knowledge Network CDM Clean Development MechanismCGIAR Consultative Group on International Agricultural Research COP Conference of the Parties of UNFCCCCSA Climate-smart agricultureDRM Disaster risk managementDRR Disaster risk reductionEWS Early warning systemFAO Food and Agriculture Organization of the United NationsGCF Green Climate FundGDP Gross domestic productGHG Greenhouse gasGPS Global Positioning SystemHWP Harvested wood productsINDC Intended nationally determined contributionIPCC Intergovernmental Panel on Climate ChangeIPPU Industrial processes and product uses
JRCJoint Research Center (the European Commission’s science and knowledge service)
KP Kyoto ProtocolLAC Latin America & CaribbeanLDC Least-developed countryLEDS Low Emission Development Strategies Global PartnershipLLDC Landlocked developing countryLULUCF Land use, land-use change and forestryMRV Measurement, reporting and verificationNAI Non-Annex I NAMA National Appropriate Mitigation ActionsNAP National Adaptation PlanNAPA National Adaptation Programmes of ActionPA Paris Agreement

xii
]T
HE
AG
RIC
ULT
UR
E S
EC
TO
RS
IN T
HE
IN
TE
ND
ED
NA
TIO
NA
LLY
DE
TE
RM
INE
D C
ON
TR
IBU
TIO
NS
- A
NA
LYSI
S[
REDD
Reducing Emissions from Deforestation and Forest Degradation; "REDD+" goes beyond deforestation and forest degradation, and includes the role of conservation, sustainable management of forests and enhancement of forest carbon stocks.
R&D Research and DevelopmentSFM Sustainable forest managementSLCP Short-lived climate pollutantsSIDS Small-island developing statesSSA Sub-Saharan AfricaUN/DESA United Nations Department of Economic and Social AffairsUNDP United Nations Development ProgrammeUNFCCC United Nations Framework Convention on Climate ChangeUNISDR United Nations International Strategy for Disaster ReductionVCS Verified Carbon StandardWRI World Resource InstituteWRI

xiii
EXECUTIVE SUMMARY
The Intended Nationally Determined Contributions (INDCs)1 served as a basis for negotiations at COP21 and provided the foundation for the Paris Agreement on climate change. Unless a Party specifies otherwise, its INDC will become its first Nationally Determined Contribution (NDC) upon submitting its instrument of ratification for the Paris Agreement. INDCs/NDCs outline countries’ climate change priorities for the post-2020 period and include not only targets, but also concrete strategies for addressing the causes of climate change and responding to its effects.
As at 29 July 2016, 189 countries (190 Parties) had submitted a total of 161 INDCs and 22 NDCs to the UNFCCC, 21 of which were originally submitted as INDCs.2 This analysis considers the 22 NDCs and 140 remaining INDCs. In the remainder of this document, these are collectively referred to as “the INDCs”.
The INDCs were not prepared according to a standard format. While many Parties followed non-binding guidance, the INDCs are heterogeneous in length, coverage and level of detail. All 189 countries refer to mitigation commitments in their INDCs, while 134 countries include concrete information on adaptation areas and/or actions. Some INDCs (in particular from developing countries) specify detailed measures in specific sectors, while others only point to existing plans for further reference. This heterogeneity calls for caution in comparing country priorities and actions beyond broad patterns.
FAO has analyzed the INDCs and found that the agriculture sectors (crops, livestock, forestry, fisheries and aquaculture) feature prominently in meeting national mitigation and adaptation goals. This is a clear signal: the agriculture sectors are central to the response to climate change and in contributing to sustainable development.
Developing countries – particularly the least-developed countries (LDCs) – put a strong emphasis on the agriculture sectors. Many of these countries highlight the role of agriculture, forestry, fisheries and aquaculture in economic development, particularly for employment, exports and rural development. Many countries also point to the vulnerabilities of these sectors to climate change.
This analysis report provides a comprehensive overview on the coverage of the agriculture sectors in the INDCs.
1 The INDCs are available at: www4.unfccc.int/submissions/indc/Submission%20Pages/submissions.aspx2 Latvia submitted the INDC on behalf of the European Union, which counts for 29 Parties (28 member states and the European
Union). The following seven Parties had not provided (I)NDCs at the date of 29 July 2016: Libya, Nicaragua, The People’s Republic of Korea, Palestine, the Syrian Arab Republic, Timor-Leste, Uzbekistan.

xiv
]T
HE
AG
RIC
ULT
UR
E S
EC
TO
RS
IN T
HE
IN
TE
ND
ED
NA
TIO
NA
LLY
DE
TE
RM
INE
D C
ON
TR
IBU
TIO
NS
- A
NA
LYSI
S[
OVERVIEW: AGRICULTURE SECTORS IN THE INDCs
MitigationAgriculture3 and land use, land-use change and forestry (LULUCF) are among the most frequently included sectors in countries’ mitigation contributions (targets and/or actions). When considered together, 89 percent of countries cover agriculture and/or LULUCF. Including the countries that mention bioenergy as a mitigation strategy, this percentage increases to 92 percent.
The mitigation potential of agriculture and/ or LULUCF is prominently acknowledged at all levels of socio-economic development and among developing countries in all regions. 86 percent of the developing countries, 88 percent of the countries in transition and 98 percent of developed countries include agriculture and/or LULUCF in their mitigation contributions. Among developing countries, both sectors together are featured most prominently in Eastern and South-Eastern Asia (100 percent), SSA (96 percent), LAC (91 percent) and Southern Asia (89 percent). In Northern Africa and Western Asia and Oceania, 69 percent and 50 percent of the developing countries include both sectors in their mitigation contributions.
In total, 148 countries include agriculture4 (crops, livestock) in their mitigation contributions. 71 percent of the developing countries, 88 percent of the economies in transition and 98 percent of the developed countries include agriculture in their mitigation contributions. Countries that include agriculture collectively account for 92 percent of global agricultural GHG emissions.5 Among all developing countries, agriculture is featured most prominently in SSA (84 percent), Southern Asia (78 percent), Eastern and South-Eastern Asia (77 percent), LAC (72 percent) and Northern Africa and Western Asia (69 percent). In Oceania, 21 percent of the developing countries include agriculture in the mitigation contributions.
In total, 157 countries include LULUCF in their mitigation contributions. 80 percent of the developing, 75 percent of the economies in transition and 98 percent of the developed countries consider LULUCF within their mitigation contributions. Among all developing countries, LULUCF is featured most prominently in Sub-Saharan Africa (94 percent). LULUCF is also included in the mitigation contributions of many developing countries in South Asia (89 percent), Latin America and the Caribbean (88 percent), Eastern and South-Eastern Asia (85 percent). The corresponding figures are more modest in Northern Africa and Western Asia (44 percent) and Oceania (43 percent).
Countries rarely include quantified sector-specific targets for agriculture and/or LULUCF. Nevertheless, forestry is the second most referenced sector for Non-GHG
3 In the context of mitigation, ‘Agriculture’ – in accordance with IPCC terminology – includes emissions from enteric fermentation, manure management, rice cultivation, prescribed burning of savannas and grassland, and from soils (i.e. agricultural emissions). Emissions related to forest and other land use are covered under LULUCF.
4 In line with IPCC guidelines (IPCC, 1997), agriculture subsumes emissions – predominantly CH4, N2O – related to livestock (i.e. enteric fermentation, manure management) and the cultivation of crops (agricultural soils, rice cultivation, burning of agricultural residues and savannas).
5 Data used: FAOSTAT Emissions database, publicly available from: http://faostat3.fao.org/download/E; total agricultural emissions refer to the year 2014.

xv
EXECUTIVE SUMMARY
targets. Many countries consider mitigation in agriculture and/or LULUCF as part of an economy-wide GHG target.
Several countries include specific policies and measures when outlining how to achieve their intended mitigation contributions. Policies and measures put forward by countries in agriculture and LULUCF focus, in particular, on cropland management, livestock management, grazing land management forest management and restoration, afforestation/reforestation and reducing deforestation.
Vulnerabilities126 countries highlight their vulnerability to climate-related hazards including extreme events, long-term impacts and variability phenomena. Among these 126 countries, extreme events such as droughts and floods are referred to as foremost threat to the environment and socio-economic development. More than 80 percent of the LDCs mention extreme events such as droughts and floods among their immediate threats, whereas developed countries identify long-term impacts such as the rise in temperature as a major hazard. In total, 144 countries refer to climate-related hazards and/or non-climatic hazards such as conflicts. 67 percent of these countries contextualize the vulnerability of their agriculture sectors to climate change.
In total, 54 countries explicitly refer to food insecurity and malnutrition among the major risks they face under climate change. 39 percent of the developing countries and 13 percent of the economies in transition refer to food and nutrition security. 53 percent of developing countries in SSA and 56 percent of developing countries in Southern Asia refer to food security and nutrition.
AdaptationThe agriculture sectors are the foremost priority for adaptation. Among the 131 countries that include priority areas for adaptation and/or adaptation actions related to the agriculture sectors, 97 percent refer to crops and livestock, 88 percent refer to forests and 64 percent refer to fisheries and aquaculture. 93 percent of the developing countries and 44 percent of the economies in transition mention adaptation areas and/ or actions in the context of the agriculture sectors. All developing countries in SSA and 92 percent of the developing countries in Eastern and South-Eastern Asia mention adaptation areas and/ or actions in the context of the agriculture sectors.
Outlining their adaptation priorities and/ or actions for the agriculture sectors, many countries refer to cross-cutting technical areas relevant for the agriculture sectors. In total, 132 countries mention water services in the context of adaptation and 74 countries explicitly refer to water resources in the context of adaptation in the agriculture sectors.
47 countries mention the importance of disaster risk management (DRM) in the agriculture sectors. 43 countries explicitly refer to loss and damage associated with climate change, all of which include the agriculture sectors in their adaptation areas and/or actions. The importance of integrating sustainable livelihood strategies, knowledge

xvi
]T
HE
AG
RIC
ULT
UR
E S
EC
TO
RS
IN T
HE
IN
TE
ND
ED
NA
TIO
NA
LLY
DE
TE
RM
INE
D C
ON
TR
IBU
TIO
NS
- A
NA
LYSI
S[
transfer and capacity building and addressing gender when planning and implementing adaptation plans and programmes is widely acknowledged.
Synergies and co-benefitsThe agriculture sectors are most often referred to in the INDCs as providing adaptation-mitigation synergies, as well as socio-economic and environmental co-benefits. 57 countries endorse or even prioritize actions based on the potential synergies between mitigation and adaptation. Climate-smart agriculture (CSA) is highlighted as contributing to both adaptation and mitigation. 32 countries (including 40 percent of the LDCs) refer to CSA in their INDCs. One fourth of the countries mention social, economic and environmental co-benefits, particularly rural development and health, poverty reduction and job creation, and conservation of ecosystems and biodiversity. With regard to gender equality, the agriculture sectors are highlighted – more so than any other sector – as providing opportunities for empowering women and reducing their vulnerability to climate change.
Planning and ImplementationMany countries provide general insights into national consultation processes including involved stakeholders. Stakeholders mentioned include national ministries, provincial and regional governments, academic and research institutions, civil society organizations, non-governmental agencies, the private sector and international development partners.
Many countries highlight specific policies that relate to the preparation of their INDC and/or the implementation of their NDC. 53 countries that either have, are designing or intend to develop a NAP mention at least one of the agriculture sectors as priority area for adaptation or within their adaptation actions. A few countries refer to NAMAs in agriculture either as an important element for the formulation of their INDCs or when outlining the implementation of their NDC.
All of the LDCs and more than 90 percent of the other developing countries indicate their need for financial support. Regarding possible funding sources across various sectors, about 24 percent of all countries mention explicitly the Green Climate Fund.
Many countries indicate their technical and capacity building needs in relation to the agriculture sectors. Countries frequently refer to the need for technical support to develop forest inventories and national planning systems. For capacity building, countries refer to the need for good practices on sustainable forest management and climate-smart agriculture, and highlight the need for support in implementing afforestation and reforestation activities.

xvii
EXECUTIVE SUMMARY
M A P 1 .
Countries that include agriculture, LULUCF, or both in their mitigation contributions
M A P 2 .
Countries that refer to adaptation in the agriculture sectors


1
C H A P T E R 1
The Paris Agreement,6 endorsed by all Parties to the United Nations Framework Convention on Climate Change (UNFCCC) during COP21 in 2015, includes important language on food security under climate change. The preamble of the Agreement refers to “safeguarding food security and ending hunger, and the particular vulnerabilities of food production systems to the adverse impacts of climate change”. The importance of “increasing the ability to adapt to the adverse impacts of climate change and foster climate resilience and low greenhouse gas emissions development, in a manner that does not threaten food production” is mentioned in Article 2.1 of the Agreement.
The Intended Nationally Determined Contributions (INDCs)7 served as a basis for negotiations at COP21 and provided the foundation for the Paris Agreement. Unless a Party specifies otherwise, its INDC will become its first Nationally Determined Contribution (NDC) upon submitting its instrument of ratification for the Paris Agreement. INDCs/NDCs outline countries’ climate change priorities for the post-2020 period. Although they are heterogeneous, most INDCs/NDCs include objectives and measures to address the causes of climate change (mitigation) and respond to its effects (adaptation). As at 29 July 2016, 189 countries (190 Parties) had submitted a total of 161 INDCs and 22 NDCs to the UNFCCC, 21 of which were originally submitted as INDCs.8 This analysis considers the 22 NDCs and 140 remaining INDCs. In the remainder of this document, these are collectively referred to as “the INDCs”.
The agriculture sectors (crops, livestock, forestry, fisheries and aquaculture) are significant contributors to global greenhouse gas (GHG) emissions. At the same time, their productive capacity is and will be affected by climate change. Concerted mitigation and adaptation actions are vital to protect and enhance global food security and nutrition and to underpin other elements of sustainable development. The agriculture sectors will play an important role in accomplishing the targets and commitments expressed in the INDCs.
1.1. PURPOSE AND STRUCTUREThis report provides an overview of how the agriculture sectors have been considered in the INDCs, taking into account the interdependencies characterizing these sectors. It aims
6 Paris Agreement, FCCC/CP/2015/L.9/Rev.1. UNFCCC Secretariat. Available at: http://unfccc.int/resource/docs/2015/cop21/eng/l09r01.pdf
7 The INDCs are available at: www4.unfccc.int/submissions/indc/Submission%20Pages/submissions.aspx8 Latvia submitted the INDC on behalf of the European Union, which counts for 29 Parties (28 member states and the European
Union). The following seven Parties had not provided (I)NDCs at the date of 29 July 2016: Libya, Nicaragua, The People’s Republic of Korea, Palestine, the Syrian Arab Republic, Timor-Leste, Uzbekistan.
INTRODUCTION AND METHODOLOGY

2
]T
HE
AG
RIC
ULT
UR
E S
EC
TO
RS
IN T
HE
IN
TE
ND
ED
NA
TIO
NA
LLY
DE
TE
RM
INE
D C
ON
TR
IBU
TIO
NS
- A
NA
LYSI
S[
to identify the priorities and related needs of countries to inform international cooperation and support.
The FAO analysis report aims to complement existing reports (see Annex C) including the UNFCCC synthesis report (2016) by providing a closer look at the agriculture sectors. Building on the results of this analysis, FAO has developed the paper The agricultural sectors in nationally determined contributions (NDCs): Priority areas for international support. This paper outlines key types of support developing countries will require to effectively implement and report on their commitments in the agriculture sectors, and ultimately enhance ambition in the coming years.
1.2. METHODOLOGYEach INDC was studied in full text to ensure a comprehensive assessment of the
coverage of the agriculture sectors in this report. Original text was extracted into a database, which facilitates the replication and re-examination of the screening process. The data was cross-checked using a keyword search in English, French and Spanish. It is important to keep in mind that INDCs are of different length, with some of them very short particularly for developed countries. This has a strong influence on the coverage and level of detail on certain topics.
Instead of denoting the percentage of INDCs that mention the issue, percentages, unless stated otherwise, refer to the number of countries that submitted an INDC (189 countries). Where needed to describe the percentage range a respective indicator falls into, UNFCCC INDCs Synthesis Report (2016) qualifiers (few, some, several, many, most) are employed in this report.9 To note, due to uncertainties associated with methodological aspects, gaps in information and the measured data, figures might vary by ± 3 percentage points when related to the total number of countries that submitted INDCs (189).
Countries were aggregated according to their status of development10 (developed countries, economies in transition, developing countries and least-developed countries (LDCs). As the focus of the analysis is on developing countries, they were also considered by region (see map 3). Country examples (in-text and boxes) have been selected by the authors to support a balanced regional representation of states which have submitted their INDC and provide a large variety of relevant information in the context of sustainable development under climate change. To note, some of the INDC examples provided in the boxes are based on non-official translations.
9 The qualifiers refer to the following percentage ranges: “a few” for less than 10 percent; “some” for 10–40 percent; “several” for 40–70 percent; “many” for 70–90 percent; and “most” for 90 percent and above.
10 The classification according to economic conditions follows the grouping by UN/DESA (United Nations, 2016).

3
INTRODUCTION AND METHODOLOGY
M A P 3 .
Country classification
Further details on the methodology are presented in Annex A.


5
C H A P T E R
OVERVIEW OF THE INTENDED NATIONALLY DETERMINED CONTRIBUTIONS
2
INDCs vary considerably in length and degree of detail. All Parties’ INDCs include contributions related to climate change mitigation. These contributions differ in type and coverage of sectors and greenhouse gases. 134 countries, mainly developing countries, provide additional information on existing and intended adaptation areas and/or actions in their INDC.
2.1. COVERAGE OF MITIGATION
2.1.1. SectorsAlmost all countries include energy under their climate change mitigation contributions11 (targets and/or actions). Mitigation in relation to Land Use, Land-Use Change and Forestry (LULUCF) is covered in 83 percent (157 out of 189 countries) and agriculture (crops and livestock) is included in 78 percent (148 out of 189) of all countries’ INDCs. When considered together, 89 percent (168 out of 189 countries) cover agriculture and/or LULUCF. Including the countries that only mention bioenergy as a mitigation strategy or mitigation co-benefits from their adaptation actions, this percentage increases to 92 percent (174 out of 189 countries) and 93 percent (176 out of 189), respectively. As illustrated in Figure 1, these sectors are second only to the energy sector.
F I G U R E 1 .
Percentage of countries covering specific sectors in their mitigation contributions
89%(Agriculture and/or
LULUCF)
0% 20% 40% 60% 80% 100%
99%
83%
80%
78%
63%
Energy
LULUCF
Waste
Agriculture
IPPU
11 When not explicitly stated otherwise, in the discussion of contributions to climate change mitigation, numbers refer to countries (189 including countries of the EU-28) or 190 Parties (all countries including EU-28 and the EU, which counts as one Party to the convention).
6
]T
HE
AG
RIC
ULT
UR
E S
EC
TO
RS
IN T
HE
IN
TE
ND
ED
NA
TIO
NA
LLY
DE
TE
RM
INE
D C
ON
TR
IBU
TIO
NS
- A
NA
LYSI
S[
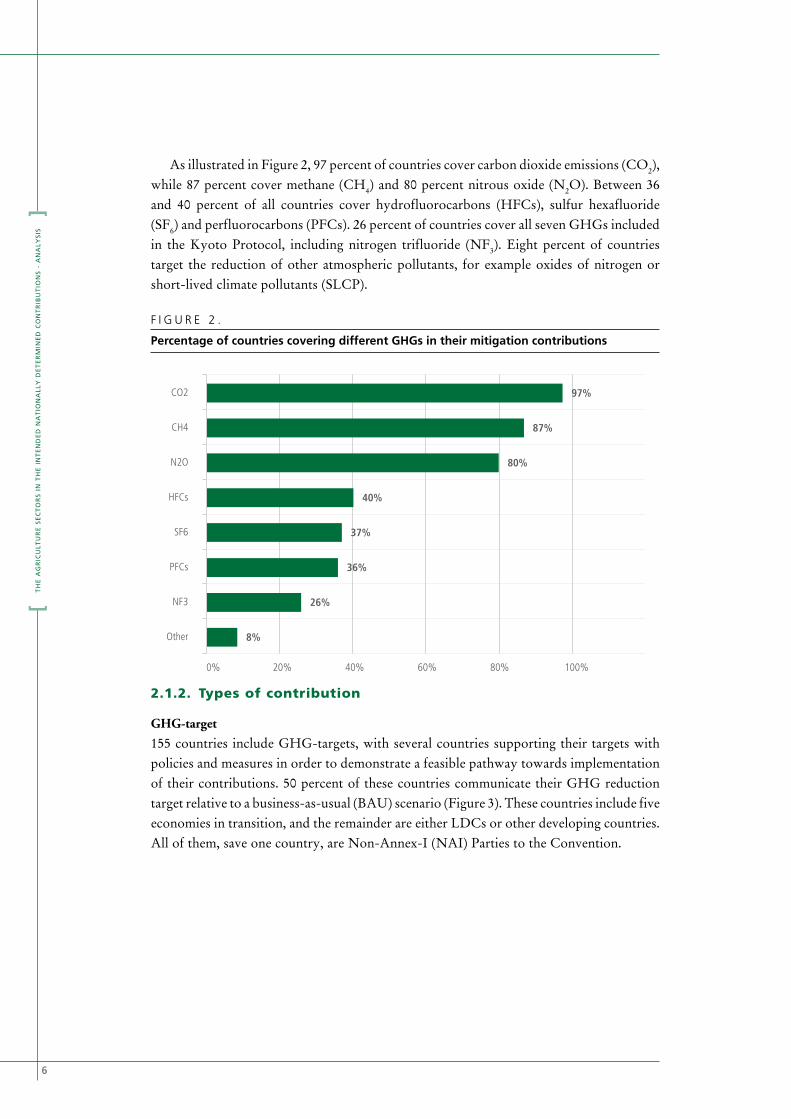
As illustrated in Figure 2, 97 percent of countries cover carbon dioxide emissions (CO2), while 87 percent cover methane (CH4) and 80 percent nitrous oxide (N2O). Between 36 and 40 percent of all countries cover hydrofluorocarbons (HFCs), sulfur hexafluoride (SF6) and perfluorocarbons (PFCs). 26 percent of countries cover all seven GHGs included in the Kyoto Protocol, including nitrogen trifluoride (NF3). Eight percent of countries target the reduction of other atmospheric pollutants, for example oxides of nitrogen or short-lived climate pollutants (SLCP).
F I G U R E 2 .
Percentage of countries covering different GHGs in their mitigation contributions
2.1.2.
0% 20% 40% 60% 80% 100%
97%
87%
80%
40%
37%
36%
26%
8%
CO2
CH4
N2O
HFCs
SF6
PFCs
NF3
Other
Types of contribution
GHG-target155 countries include GHG-targets, with several countries supporting their targets with policies and measures in order to demonstrate a feasible pathway towards implementation of their contributions. 50 percent of these countries communicate their GHG reduction target relative to a business-as-usual (BAU) scenario (Figure 3). These countries include five economies in transition, and the remainder are either LDCs or other developing countries. All of them, save one country, are Non-Annex-I (NAI) Parties to the Convention.

7
OVERVIEW OF THE INTENDED NATIONALLY DETERMINED CONTRIBUTIONS
F I G U R E 3 .
Percentage of countries by type of mitigation targets12
0% 10% 20% 30% 40% 50% 60%
4%
5%
6%
39%
50%
Trajectory/peak
Fixed-level target
Intensity target
Base year emissions
target
Reduction relative to BAU
Absolute emission targets are used by 44 percent of the 155 countries that include a GHG-target: 39 percent include a base year emissions target, 5 percent a fixed-level target. Absolute emission targets are most often used by industrialized economies, and by almost all Annex-I (AI) Parties. 98 percent of all developed countries and 56 percent of the economies in transition include such a target. Countries that include a base year target commonly refer to the years 1990, 2005 and 2010.
Eight countries include economy-wide fixed-level targets. By sequestering and storing carbon, LULUCF plays a key role in achieving zero net carbon emissions in these cases.
Nine countries state intensity targets, i.e. the reduction of GHG emissions per unit of GDP. Four of these countries are emerging economies in Asia.
12 Note that six countries refer to multiple types of GHG targets

8
]T
HE
AG
RIC
ULT
UR
E S
EC
TO
RS
IN T
HE
IN
TE
ND
ED
NA
TIO
NA
LLY
DE
TE
RM
INE
D C
ON
TR
IBU
TIO
NS
- A
NA
LYSI
S[
B o x 1 .
TYPES OF GHG-TARGETS
Types of mitigation outcome (UNFCCC, 2015 and Levin et al., 2015)
Reduction relative to business as usual: This relative target is used for reducing
emissions below the ‘business as usual’ (BAU) level or compared to a scenario for the
economy-wide mitigation targets. It is also called a Baseline scenario target.
Base year emissions target: absolute emission reduction targets expressed as an
emission reduction below the level in a specified base year.
Fixed level target: Fixed level targets are not linked to a base year but establish an
overall maximum absolute limit on emissions (as for example carbon neutrality).
Intensity target: Intensity target refers to reductions in GHG emissions per unit of gross
domestic product (GDP) or per capita relative to a base year or absolute level of per
capita emissions by 2025 or 2030.
Trajectory/Peak target: This target specifies the year or time frame in which the
respective country’s emissions are expected to peak.
Non-GHG targets34 countries include separate or additional non-GHG targets. Of these countries, 80 percent aim to increase the share of renewable energy in electricity generation. Twelve of these 34 countries set non-GHG targets in the forest sector. Non-GHG targets are often accompanied with policies and measures that support their implementation.
Action-based23 countries include only action-based contributions in terms of specific policies, programmes or projects and 14 further countries mention a combination of target- and action-based contributions. Actions are frequently related to economic diversification and cleaner energy.
Mitigation Policies and MeasuresMany countries outline policies and measures that are relevant to setting and/or
achieving their targets. The most detailed information across all sectors is provided by developing countries, including LDCs. Many countries highlight policies and measures that are already in place. These existing measures are usually not integrated into the baseline scenario, but are rather included as ways to achieve mitigation targets or as additional mitigation efforts.13
43 countries refer to Nationally Appropriate Mitigation Actions (NAMAs) as a means for developing or supporting the implementation of the INDC (20 and 80 percent, respectively).
13 The extent to which INDCs explicitly refer to existing policies and programmes/projects also influences the length of the documents. While some countries only cite the respective frameworks, others incorporate parts of them in their INDCs.
9
OVERVIEW OF THE INTENDED NATIONALLY DETERMINED CONTRIBUTIONS
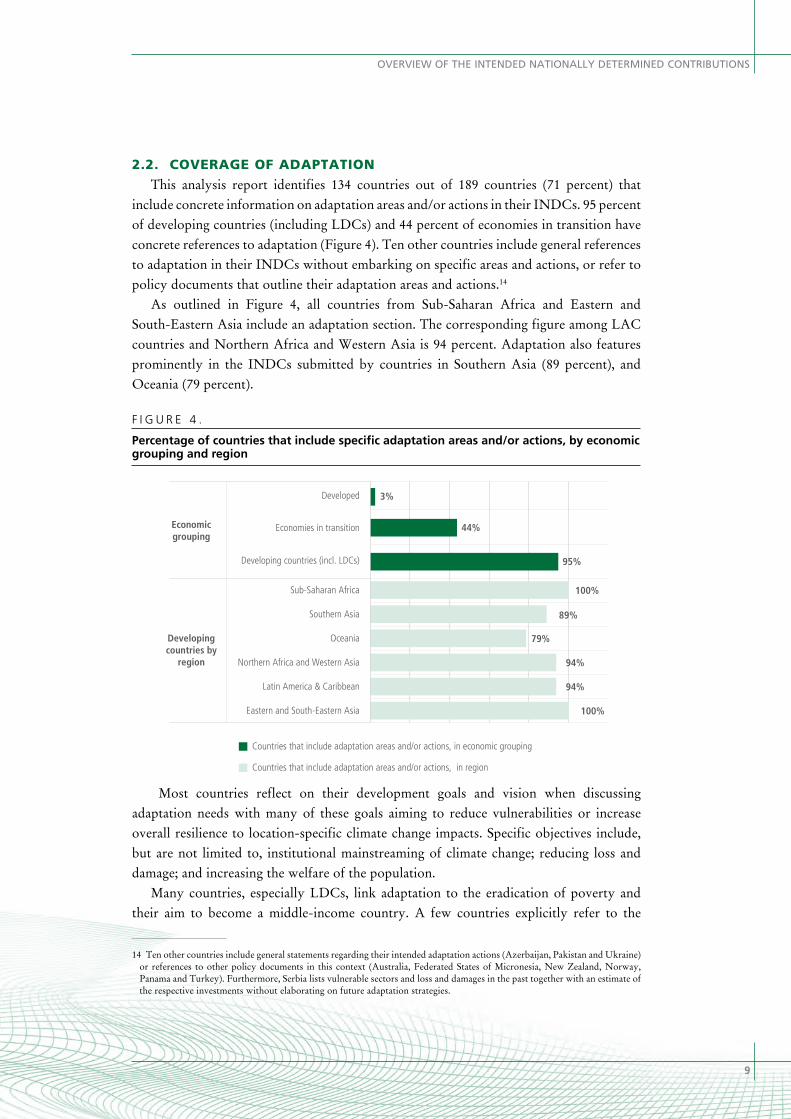
2.2. COVERAGE OF ADAPTATIONThis analysis report identifies 134 countries out of 189 countries (71 percent) that
include concrete information on adaptation areas and/or actions in their INDCs. 95 percent of developing countries (including LDCs) and 44 percent of economies in transition have concrete references to adaptation (Figure 4). Ten other countries include general references to adaptation in their INDCs without embarking on specific areas and actions, or refer to policy documents that outline their adaptation areas and actions.14
As outlined in Figure 4, all countries from Sub-Saharan Africa and Eastern and South-Eastern Asia include an adaptation section. The corresponding figure among LAC countries and Northern Africa and Western Asia is 94 percent. Adaptation also features prominently in the INDCs submitted by countries in Southern Asia (89 percent), and Oceania (79 percent).
F I G U R E 4 .
Percentage of countries that include specific adaptation areas and/or actions, by economic grouping and region
3%
44%
95%
100%
89%
79%
94%
94%
100%
Developed
Economies in transition
Developing countries (incl. LDCs)
Sub-Saharan Africa
Southern Asia
Oceania
Northern Africa and Western Asia
Latin America & Caribbean
Eastern and South-Eastern Asia
Economic grouping
Developing countries by
region
Countries that include adaptation areas and/or actions, in economic grouping
Countries that include adaptation areas and/or actions, in region
Most countries reflect on their development goals and vision when discussing adaptation needs with many of these goals aiming to reduce vulnerabilities or increase overall resilience to location-specific climate change impacts. Specific objectives include, but are not limited to, institutional mainstreaming of climate change; reducing loss and damage; and increasing the welfare of the population.
Many countries, especially LDCs, link adaptation to the eradication of poverty and their aim to become a middle-income country. A few countries explicitly refer to the
14 Ten other countries include general statements regarding their intended adaptation actions (Azerbaijan, Pakistan and Ukraine) or references to other policy documents in this context (Australia, Federated States of Micronesia, New Zealand, Norway, Panama and Turkey). Furthermore, Serbia lists vulnerable sectors and loss and damages in the past together with an estimate of the respective investments without elaborating on future adaptation strategies.
10
]T
HE
AG
RIC
ULT
UR
E S
EC
TO
RS
IN T
HE
IN
TE
ND
ED
NA
TIO
NA
LLY
DE
TE
RM
INE
D C
ON
TR
IBU
TIO
NS
- A
NA
LYSI
S[
Millennium Development Goals (17 countries) and/or Sustainable Development Goals (26 countries).
2.2.1. Disaster Risk Management84 percent of the 134 countries refer to Disaster Risk Management (DRM). DRM is an adaptation priority in all regions, particularly in Eastern and Southern-Eastern Asia and Oceania (100 percent), Sub-Saharan Africa (90 percent), and Southern Asia (88 percent). Countries in these regions place a particular emphasis on Disaster Risk Reduction (DRR). Some countries refer to national plans and strategies on DRM or DRR.

11
C H A P T E R
Agriculture and land use, land-use change and forestry (LULUCF) are among the most referenced sectors in countries’ mitigation contributions (targets and/or actions).15 When considered together, 89 percent (168 out of 189 countries) include agriculture and/or LULUCF. Including the countries that only mention bioenergy as a mitigation strategy this percentage increases to 92 percent (174 out of 189 countries). The following two sections present main points about agriculture and LULUCF in the mitigation contributions. Bioenergy is considered separately in section 3.3.
Figure 5 illustrates the total percentage of countries that cover agriculture and/or LULUCF by development status and region.
F I G U R E 5 .
Percentage of countries that mention mitigation targets and/ or actions in agriculture and/or LULUCF by economic grouping and region
88%
98%
86%
96%
89%
50%
69%
91%
100%
Developed countries
Economies in transition
Developing countries (incl. LDCs)
Sub-Saharan Africa
Southern Asia
Oceania
Northern Africa and Western Asia
Latin America & Caribbean
Eastern and South-Eastern Asia
Economic grouping
Developing countries by
region
Countries that mention agriculture and/or LULUCF, in economic grouping
Countries that mention agriculture and/or LULUCF, in region
86 percent of the developing countries (115 out of 133), 88 percent of the countries in transition (14 out of 16) and 98 percent of the most developed countries (39 out of
15 To note, the eight countries that exclusively refer to bioenergy or mitigation co-benefits as their mitigation contributions when outlining their adaptation contributions are not accounted for in Section 3.1. and 3.2. of this report.
MITIGATION IN AGRICULTURE AND LULUCF
3

12
]T
HE
AG
RIC
ULT
UR
E S
EC
TO
RS
IN T
HE
IN
TE
ND
ED
NA
TIO
NA
LLY
DE
TE
RM
INE
D C
ON
TR
IBU
TIO
NS
- A
NA
LYSI
S[
40) include agriculture and/or LULUCF in their mitigation contributions (coverage of agriculture and/or LULUCF can be either explicit or implicit [economy wide]).
Reasons cited by countries for excluding agriculture and/or LULUCF from their mitigation strategy contribution include data uncertainty and availability, particularly for LULUCF. A few countries mentioned that they do not yet have the financial, human and/or technical resources to implement policies in these sectors or that emissions from agriculture and/or LULUCF play a rather marginal role in total national emissions.
3.1. AGRICULTURE AND MITIGATION
3.1.1. An Overview148 countries include agriculture16 (crops, livestock) in their mitigation contributions. All Annex I countries and 72 percent of Non-Annex I countries that submitted an INDC (106 out of 147 countries) include agriculture in their mitigation targets and/or actions. Countries that include agriculture collectively account for 92 percent of global agricultural GHG emissions.17
Figure 6 provides an overview of countries including agriculture by region. For example, 16 percent of countries (23 out of 148 countries) that refer to agriculture are from LAC. Within LAC, 72 percent refer to agriculture under mitigation in their INDCs (23 out of 32 countries).
F I G U R E 6 .
Percentage of countries that cover mitigation in agriculture, by economic grouping and region
88%
98%26%
9%
71%64%
84%28%
5%78%
21%2%
69%7%
7%
72%16%
77%
Developed countries
Economies in transition
Developing countries (incl. LDCs)
Sub-Saharan Africa
Southern Asia
Oceania
Northern Africa and Western Asia
Latin America & Caribbean
Eastern and South-Eastern Asia
Economic grouping
Developing countries by
region
Countries in total
Countries in economic grouping or region
16 In line with IPCC guidelines (IPCC,1997), agriculture subsumes emissions – predominantly CH4, N2O – related to livestock (i.e. enteric fermentation, manure management) and the cultivation of crops (agricultural soils, rice cultivation, burning of agricultural residues and savannas).
17 Data used: FAOSTAT Emissions database, publicly available from: http://faostat3.fao.org/download/E; total agricultural emissions refer to the year 2014.

13
MITIGATION IN AGRICULTURE AND LULUCF
3.1.2. Agriculture: types of mitigation contributions86 percent of the countries that include agriculture include agriculture in their economy-wide or broader targets. Seven countries mention sectoral targets that are either part of the overall target or represent additional outcomes. Most target-based contributions specify the desired outcomes in terms of GHG emission reductions (GHG target) while some refer to other quantifiable outcomes (Non-GHG target). Several countries either base their INDCs entirely on actions (action-based contributions) or include actions for complementing their target-based contributions. Most countries do not elaborate their contributions beyond a short description, which often leaves room for interpretation regarding the inclusion of agriculture in targets/ actions. To note, the range of contributions and the extent of their implementation outlined in the INDCs can be conditional on financial and technical support (see chapter 7).
Figure 7 illustrates the modalities of presentation of mitigation contributions in agriculture.
F I G U R E 7 .
Percentage of countries covering agriculture in their mitigation contributions
Separate Non-GHGtarget, 1%
Actions only, 13%
54%
3%
30%
GHG target only(not further specified)
GHG target supportedby Non-GHG-target
GHG target supportedby actions
GHG target, 86%
GHG targets and non GHG targets86 percent of countries (128 out of 148) include agriculture within their overall GHG target, several of those countries do so only implicitly. The majority of countries (54 percent) do not further elaborate on concrete actions in agriculture for achieving their GHG-target.18 Some countries include sectoral targets. Uruguay sets a sectoral target for reducing GHG emissions from livestock production.
30 percent of the countries that include agriculture in their GHG-target outline actions (i.e. policies and measures) that support the implementation of their contributions. Four countries support their GHG targets with Non-GHG targets in order to demonstrate a feasible pathway towards implementation. Burundi, for example, targets a gradual replacement of 100 percent of mineral fertilizers with organic fertilizer by 2030.
18 To note, references to other policy documents were not taken into account.

14
]T
HE
AG
RIC
ULT
UR
E S
EC
TO
RS
IN T
HE
IN
TE
ND
ED
NA
TIO
NA
LLY
DE
TE
RM
INE
D C
ON
TR
IBU
TIO
NS
- A
NA
LYSI
S[
Actions only20 countries present entirely action-based contributions or refer to separate actions in agriculture in addition to their GHG-target. Nepal, for example, intends to implement its Agriculture Development strategy. Some countries complement their actions with an estimate of emission reduction potential. For instance, The Gambia quantifies the emission reduction potential from its actions in rice production.
3.1.3. Policies and measures for mitigating in agriculture40 percent of countries (59 countries out of 148) outline mitigation policies and measures either under a target and/ or action. The level of detail varies, ranging from countries that only note the sector or respective inventory subcategories (e.g. managed soil, enteric fermentation) to comprehensive descriptions of implemented, planned or intended policies and programmes/projects in this sector.
Among the specific policies and measures mentioned, land-based agriculture (cropland and grazing land management) features prominently. 43 countries refer to cropland management. Under cropland management, countries mentioned “nutrient management” (23 countries); “tillage/residues management” (19 countries) and “rice management” (17 countries); while specific contributions also highlight “plant management” (12 countries) and “water management” (9 countries). Some countries specify grazing land management (18 countries). Of the 69 countries that mention livestock, 19 countries highlight concrete measures referring to “feed management” (10 countries); “breeding management” (5 countries); 15 countries refer to “manure management” (see Figure 8 for categorical and regional breakdown).
F I G U R E 8 .
Percentage of countries that refer to concrete policies and measures in agriculture, by type of activity
5%3%
6%
14%
31%
49%
Developed countries
Economies in transition
Developing countries (incl. LDCs)
Sub-Saharan Africa
Southern Asia
Oceania
Northern Africa and Western Asia
Latin America & Caribbean
Eastern and South-Eastern Asia
Economic grouping
Developing countries by
region
Cropland management
Grazing land management
Livestock
12%
12%
22%
7%
25%13%
6%9%
19%
23%15%
33%

15
MITIGATION IN AGRICULTURE AND LULUCF
To note, individual countries sometimes mention a variety of activities under cropland management, grazing land management and livestock. Some actions related to cropland or grassland management also figure under LULUCF.
30 countries mentioned activities related to integrated systems such as “agroforestry”. 16 countries refer to “climate-smart agriculture” when mentioning their mitigation activities in agriculture.
Some countries refer to NAMAs in agriculture either as an important element for the formulation of their INDCs or when outlining the implementation of their NDCs (e.g. Chile, Costa Rica, Equatorial Guinea, the Gambia, Malawi, Sierra Leone).
Some countries specifically address mitigation actions in fisheries and aquaculture. They generally focus on feed management, reducing energy use and improving technology equipment. These measures are often part of broader strategies to develop the fisheries and aquaculture sector. For example, the Congo targets self-sufficiency as current domestic capture fisheries and aquaculture cover only 60 percent of its current consumption needs. The country intends to increase capture fisheries output and aquaculture production by a factor of six by 2035, with a proportional impact on fuel consumption. Cameroon seeks to develop the production of feed supplements for livestock and fish. Chad aims to develop its fishery sectors as part of its mitigation strategy. To note, the mitigation actions proposed for the fisheries and aquaculture sector are related to energy efficiency and thus most often accounted for in the energy sector.
3.2. LULUCF AND MITIGATION
3.2.1. An Overview157 Countries (of 189 countries) include LULUCF in their mitigation targets and/or actions.
Among all developing countries (including LDCs), LULUCF is featured most prominently in Sub-Saharan Africa (94 percent). LULUCF is also included in the mitigation contributions of many countries in Southern Asia (89 percent), Latin America and the Caribbean (88 percent), Eastern and South-Eastern Asia (85 percent). The corresponding figures are more modest in Northern Africa and Western Asia (44 percent) and Oceania (43 percent). Furthermore, almost all countries in developed regions (98 percent) reference the LULUCF sector under mitigation, while 75 percent of the economies in transition in South-Eastern Europe and Central Asia refer to this sector (see Figure 9).

16
]T
HE
AG
RIC
ULT
UR
E S
EC
TO
RS
IN T
HE
IN
TE
ND
ED
NA
TIO
NA
LLY
DE
TE
RM
INE
D C
ON
TR
IBU
TIO
NS
- A
NA
LYSI
S[
F I G U R E 9 .
Percentage of countries that mention mitigation in LULUCF, by economic grouping and region
3.2.2.
98%25%Developed countries
Economies in transition
Developing countries (incl. LDCs)
Sub-Saharan Africa
Southern Asia
Oceania
Northern Africa and Western Asia
Latin America & Caribbean
Eastern and South-Eastern Asia
Economic grouping
Developing countries by
region
Countries in total
Countries in economic grouping or region
8%
68%
29%
5%
4%
4%
18%
7%
75%
80%
94%
89%
43%
44%
88%
85%
LULUCF: types of mitigation contributionsAmong the 157 countries that include the LULUCF sector in their mitigation contributions, 120 countries (76 percent) do so under an economy-wide GHG-target. 27 countries refer to sectoral (GHG- and Non-GHG) targets that either support the overall target or represent additional outcomes. 22 countries only mention actions in the LULUCF sector. To note, countries often make the range of contributions and the extent of their implementation dependent on financial and technical support (see chapter 7).
F I G U R E 1 0 .
Modalities of presentation of LULUCF contributions
8%
9%
2%
Separate Non-GHGtarget
Non-GHG-targetsupporting GHG-target
Non-GHG targetsupporting actions
GHG target, 67%
Actions only, 14%
Non-GHG target, 19%

17
MITIGATION IN AGRICULTURE AND LULUCF
GHG and non GHG-targets83 percent of the countries include LULUCF as part of their national mitigation target and/or actions. However, given the specificities of accounting for sinks the contribution from LULUCF is often separate. Not all countries present concrete information on their assumed approaches and methods for estimating and accounting emissions and removals from land-use activities and/or categories.References to accounting assumptions for emissions and removals from LULUCF are stated by about 95 percent of developed countries (often mentioning the need for further work) and some of the developing countries and LDCs. Some of the economies in transition include a comprehensive accounting method for LULUCF. Most of the INDCs from LAC, SSA and Eastern/South-Eastern Asia refer to land accounting. Eight percent of the countries (12 out of 157) include an individual Non-GHG target (Figure 10).China, for example, intends to increase the forest stock volume by around 4.5 billion cubic meters on the 2005 level. 11 further percent (17 out of 157 countries) include a Non-GHG target supporting a GHG-target or actions. Strategies include the protection and conservation of existing forest areas or afforestation and reforestation projects. The Lao People's Democratic Republic, for example, intends to increase forest cover to 70% of land area (i.e. to 16.58 million hectares) by 2020.
Actions only14 percent (23 out of 157 countries) do not include LULUCF in their (economy-wide or sectoral) targets, but do propose policies and other measures to increase their mitigation potential. All of these countries refer to forests in this context, with a few of these 23 countries referring specifically to REDD+ as an important policy instrument.
3.2.3. Policies and measures for mitigation in LULUCF60 percent of countries (94 out of 157) mention policies and measures either under a target and/or specific action. The level of detail varies, ranging from countries that only note the sector or respective inventory subcategories (e.g. forest, grasslands) or activities (e.g. afforestation, deforestation) to descriptions of implemented, planned or intended policies and programmes/projects in this sector. All of these countries mention forests, while some mention croplands, grasslands and rangelands (<25 percent), and wetlands and/or peatlands (<15 percent).
Countries frequently mention afforestation and reforestation measures (68 countries) as well as forest management (62 countries). Developing countries embark on policies and measures for reducing deforestation (52 countries). Concrete measures in forest restoration are mentioned by 29 countries.

18
]T
HE
AG
RIC
ULT
UR
E S
EC
TO
RS
IN T
HE
IN
TE
ND
ED
NA
TIO
NA
LLY
DE
TE
RM
INE
D C
ON
TR
IBU
TIO
NS
- A
NA
LYSI
S[
F I G U R E 1 1 .
Percentage of countries that refer to mitigation policies and measures in LULUCF: by type of activity
Economic grouping
Developing countries by
region
Reducing deforestation
Forest management
Afforestation/Reforestation
Forest restoration
39%
47%
22%
14%
6%
56%
46%
3%
38%
46%
67%
44%
31%
47%
31%
25%
44%
53%
67%
21%
13%
44%
54%
13%
20%
27%
33%
6%
28%
8%
Developed countries
Economies in transition
Developing countries (incl. LDCs)
Sub-Saharan Africa
Southern Asia
Oceania
Northern Africa and Western Asia
Latin America & Caribbean
Eastern and South-Eastern Asia
Several countries highlight existing or planned policies to reduce emissions in the LULUCF sector. REDD+ is mentioned 45 times including as a market mechanism. A few countries including Burkina Faso, Honduras and Tunisia refer to the development and implementation of NAMAs for this sector.
3.3. BIOENERGY: MITIGATION POTENTIAL IN AGRICULTURE AND LULUCF46 percent of countries (87 out of 189) that submitted an INDC explicitly mention bioenergy. One third of all countries refer to wood and/or crop biomass as a source of renewable energy when discussing mitigation measures. Six countries, four of which are SIDS, mention bioenergy production as a mitigation activity without referring to any other mitigation measures related to agriculture or LULUCF. Different biomass resources are mentioned, ranging from agricultural/forestry residues (e.g. rice husk, forest thinning) to dedicated bioenergy plantations (e.g. sugar cane, coconut, fuelwood).

19
C H A P T E R 4
4.1. VULNERABILITIES AND NATIONAL CIRCUMSTANCES144 countries mention biophysical impacts of climate change and/ or non-climatic drivers (such as conflicts) that can increase their vulnerability to climate change. The reference made to climatic and non-climatic vulnerabilities varies with the level of socio-economic development. All of the LDCs and 95 percent of developing countries mention climatic and/or non-climatic factors of vulnerability, 75 percent of economies in transition and 8 percent of developed countries do so. Five further countries refer to vulnerabilities in general without specifying impacts, risks or drivers.
Some countries built upon existing vulnerability assessments to prepare their INDCs, point to on-going actions in this regard or highlight their intention to undertake vulnerability assessments. Most of these are developing countries.
4.2. BIOPHYSICAL IMPACTS OF CLIMATE CHANGE126 countries mention climate-related hazards including extreme events, long-term impacts and increased variability.
103 countries point to extreme events as a significant threat to their environment and economic development. 39 of these are located in Sub-Saharan Africa, equivalent to 83 percent of the countries in this region. 36 of these countries refer to droughts and 33 to floods. In Oceania, several countries point to droughts whilst many countries in Southern Asia mention floods as one of the most significant climate-related hazards they face. 43 percent of the 126 countries refer to storms (e.g. hurricanes and tornados). Some countries refer to climate variability phenomena such as the El Niño-Southern Oscillation when outlining causes of extreme events. (Please see section 5.3.2 of this report for more information on DRM in the agriculture sectors).
Changes in precipitation patterns (i.e. the timing, duration and intensity of rainfall) are perceived as a major threat in several regions: 77 percent of Eastern and South-Eastern Asia and 73 percent of SSA countries mention it, as do two third of the countries in LAC and the majority of the countries in Southern Asia. Changes in temperature patterns are a concern for 85 percent of countries in Eastern and South-Eastern Asia and about two third of the countries in LAC and SSA, and are highlighted by the three developed countries that consider vulnerabilities. Two-thirds of the countries in Oceania highlight their vulnerability to sea-level rise, as do more than half of the countries in Northern Africa and
VULNERABILITIES

20
]T
HE
AG
RIC
ULT
UR
E S
EC
TO
RS
IN T
HE
IN
TE
ND
ED
NA
TIO
NA
LLY
DE
TE
RM
INE
D C
ON
TR
IBU
TIO
NS
- A
NA
LYSI
S[
Western Asia. Rising temperatures are associated with consequences such as desertification (e.g. in Northern Africa).
Other long-term impacts mentioned include ice melting and corresponding hydrological risks (10 countries from Latin America, Asia, and Europe); and coral bleaching (9 countries, 7 of which are SIDS). Countries refer to rising temperatures and acidification of the marine environment as underlying climate related factors driving the bleaching of corals.
Countries also outline how abiotic and biotic hazards affect ecosystems, especially: soil and coastal erosion (34 countries, mainly from LAC, Oceania and SSA), biodiversity (41 countries, nine of which are located in SSA) and pests and diseases (24 countries, half of which are in SSA).
4.3. IMPORTANCE OF THE AGRICULTURE SECTORSEconomic dependence on the agriculture sectors and natural resources is at the core of many countries’ vulnerability concerns. Two-thirds of countries point to these sectors when discussing climate-related risks and non-climatic vulnerabilities – more than to any other sector.
36 countries specifically highlight the importance of the agriculture sectors19 for their economy, employment and exports and for rural and indigenous populations. For example, Burkina Faso, Malawi, Mali, and the Niger place a particular emphasis on the role of the agriculture sectors employment, given that they employ up to 85 percent of the people in these countries. Argentina, Rwanda, Uruguay and New Zealand20 mention the importance of agricultural exports for the economy. Nine countries (mainly LDCs) highlight the essential role of energy from biomass for the rural population.
4.4. SOCIAL AND ECONOMIC VULNERABILITIESMost countries outline factors that increase their vulnerability to climate change, or limit their capacity to respond to it. These factors are mostly discussed in the description of national circumstances and adaptation needs. A few countries mention them when justifying the scope of their mitigation commitments (e.g. under ‘Fairness and Ambition’).
Demographic aspects are highlighted throughout many INDCs. Population growth is mentioned in about 28 percent of all countries either as a potential obstacle to the reduction of national GHG-emissions or as a potential threat to food security.
For many countries, vulnerability to climate change impacts is linked to the geographic distribution and concentration of their population. Two factors are mentioned particularly often in this context: (1) high population density along coastlines that are vulnerable to climate-related hazards and (2) the migration of people from rural to urban areas, fueling (a.) social tensions over scarce resources and (b.) the degradation of natural resources.
To note, several countries refer to migration issues and the displacement of people from other regions as a result of climate change. In particular, some countries from Oceania and Northern Africa highlight that these factors contribute to land degradation,
19 Regarding the discussion of adaptation strategies, the categorization is consistent with the FAO definition of agriculture sectors (i.e. crops, livestock, fisheries and aquaculture, forestry).
20 New Zealand mentioned its role in global food security under mitigation.
21
VULNERABILITIES
deforestation and water scarcity. Some countries explicitly state that climate change causes or exacerbates conflicts over natural resources. In addition, 29 countries, mostly located in SSA and Northern Africa, outline social and political conflicts and crises as factors enhancing their vulnerability to climate change impacts.
Many countries identify rural communities to be particularly vulnerable to climate change impacts. The elderly, youth, women and smallholder food producers are identified to be especially vulnerable on an individual level, intensifying the constraints that already exist for those who depend on agriculture for their livelihoods. Furthermore, 49 countries highlight poverty as a factor that increases their vulnerability to climate change impacts. This corresponds to 44 percent of the countries in Southern Asia and LAC, and 43 percent of countries in SSA. Social inequalities are highlighted as an obstacle to sustainable development by several countries.
Limited human capital (e.g. a low level of education) is mentioned by 34 countries as a challenge for their long-term vision of national development. Some of these countries mention that the lack of education is influencing their capacity to implement their contributions.
Out of 68 countries that outline health issues, 28 countries refer to infectious, vector-borne diseases such as HIV/Aids, Malaria and Ebola. Some countries draw a direct link between climate change and the increasing presence of vector diseases.
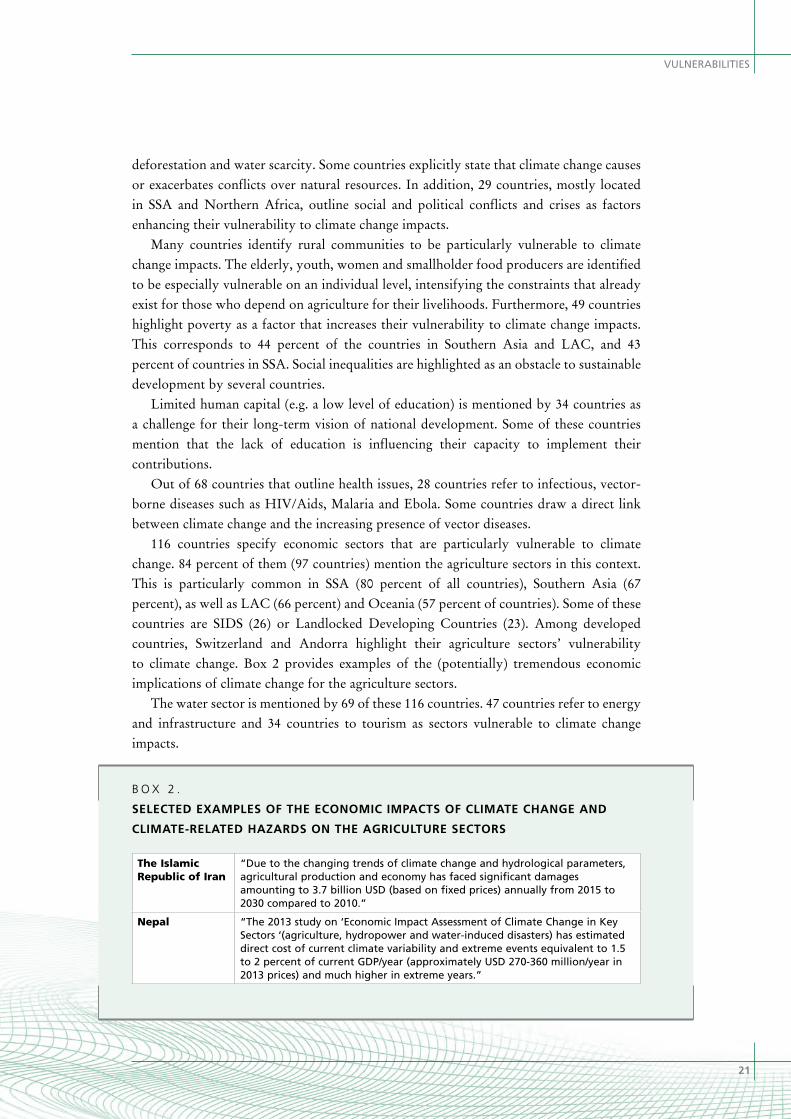
116 countries specify economic sectors that are particularly vulnerable to climate change. 84 percent of them (97 countries) mention the agriculture sectors in this context. This is particularly common in SSA (80 percent of all countries), Southern Asia (67 percent), as well as LAC (66 percent) and Oceania (57 percent of countries). Some of these countries are SIDS (26) or Landlocked Developing Countries (23). Among developed countries, Switzerland and Andorra highlight their agriculture sectors’ vulnerability to climate change. Box 2 provides examples of the (potentially) tremendous economic implications of climate change for the agriculture sectors.
The water sector is mentioned by 69 of these 116 countries. 47 countries refer to energy and infrastructure and 34 countries to tourism as sectors vulnerable to climate change impacts.
B o x 2 .
SELECTED EXAMPLES OF THE ECONOMIC IMPACTS OF CLIMATE CHANGE AND
CLIMATE-RELATED HAZARDS ON THE AGRICULTURE SECTORS
The Islamic Republic of Iran
“Due to the changing trends of climate change and hydrological parameters, agricultural production and economy has faced significant damages amounting to 3.7 billion USD (based on fixed prices) annually from 2015 to 2030 compared to 2010.”
Nepal “The 2013 study on ‘Economic Impact Assessment of Climate Change in Key Sectors ‘(agriculture, hydropower and water-induced disasters) has estimated direct cost of current climate variability and extreme events equivalent to 1.5 to 2 percent of current GDP/year (approximately USD 270-360 million/year in 2013 prices) and much higher in extreme years.”
22
]T
HE
AG
RIC
ULT
UR
E S
EC
TO
RS
IN T
HE
IN
TE
ND
ED
NA
TIO
NA
LLY
DE
TE
RM
INE
D C
ON
TR
IBU
TIO
NS
- A
NA
LYSI
S[
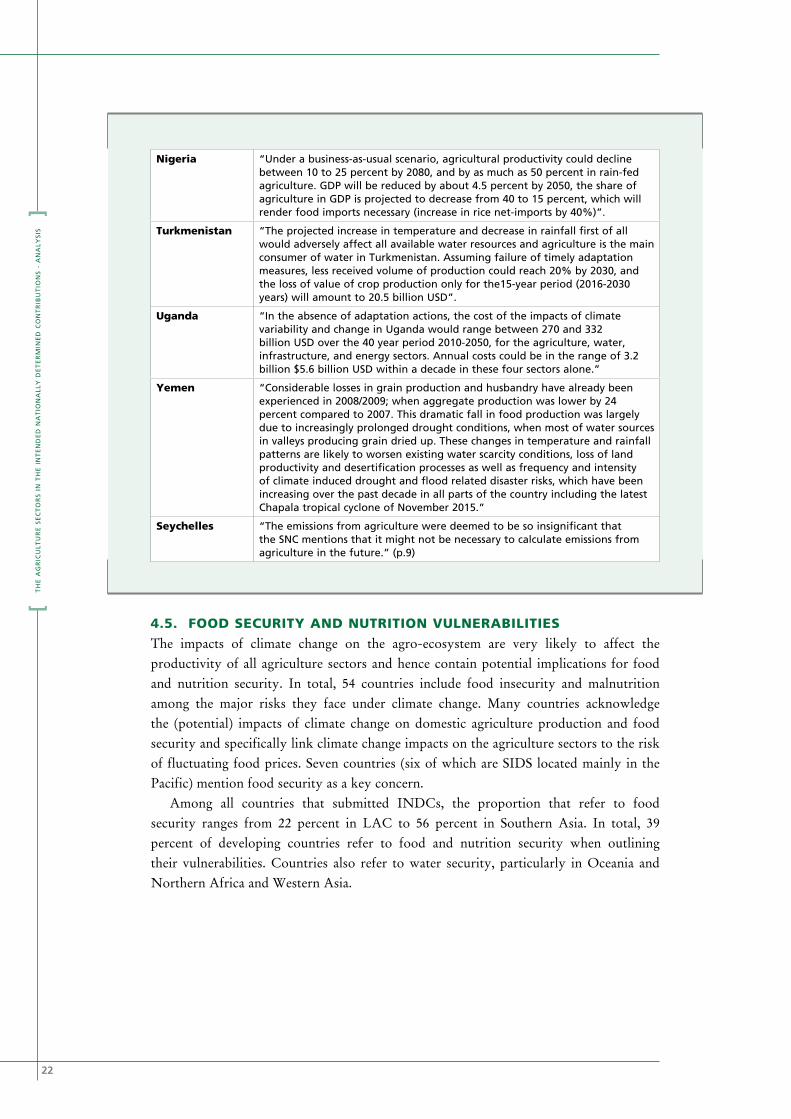
Nigeria “Under a business-as-usual scenario, agricultural productivity could decline between 10 to 25 percent by 2080, and by as much as 50 percent in rain-fed agriculture. GDP will be reduced by about 4.5 percent by 2050, the share of agriculture in GDP is projected to decrease from 40 to 15 percent, which will render food imports necessary (increase in rice net-imports by 40%)”.
Turkmenistan “The projected increase in temperature and decrease in rainfall first of all would adversely affect all available water resources and agriculture is the main consumer of water in Turkmenistan. Assuming failure of timely adaptation measures, less received volume of production could reach 20% by 2030, and the loss of value of crop production only for the15-year period (2016-2030 years) will amount to 20.5 billion USD”.
Uganda “In the absence of adaptation actions, the cost of the impacts of climate variability and change in Uganda would range between 270 and 332 billion USD over the 40 year period 2010-2050, for the agriculture, water, infrastructure, and energy sectors. Annual costs could be in the range of 3.2 billion $5.6 billion USD within a decade in these four sectors alone.”
Yemen “Considerable losses in grain production and husbandry have already been experienced in 2008/2009; when aggregate production was lower by 24 percent compared to 2007. This dramatic fall in food production was largely due to increasingly prolonged drought conditions, when most of water sources in valleys producing grain dried up. These changes in temperature and rainfall patterns are likely to worsen existing water scarcity conditions, loss of land productivity and desertification processes as well as frequency and intensity of climate induced drought and flood related disaster risks, which have been increasing over the past decade in all parts of the country including the latest Chapala tropical cyclone of November 2015.”
Seychelles “The emissions from agriculture were deemed to be so insignificant that the SNC mentions that it might not be necessary to calculate emissions from agriculture in the future.” (p.9)
4.5. FOOD SECURITY AND NUTRITION VULNERABILITIESThe impacts of climate change on the agro-ecosystem are very likely to affect the productivity of all agriculture sectors and hence contain potential implications for food and nutrition security. In total, 54 countries include food insecurity and malnutrition among the major risks they face under climate change. Many countries acknowledge the (potential) impacts of climate change on domestic agriculture production and food security and specifically link climate change impacts on the agriculture sectors to the risk of fluctuating food prices. Seven countries (six of which are SIDS located mainly in the Pacific) mention food security as a key concern.
Among all countries that submitted INDCs, the proportion that refer to food security ranges from 22 percent in LAC to 56 percent in Southern Asia. In total, 39 percent of developing countries refer to food and nutrition security when outlining their vulnerabilities. Countries also refer to water security, particularly in Oceania and Northern Africa and Western Asia.

23
VULNERABILITIES
F I G U R E 1 2 .
Percentage of countries that mention food security and nutrition by economic grouping and region
13%
Developed countries
Economies in transition
Developing countries (incl. LDCs)
Sub-Saharan Africa
Southern Asia
Oceania
Northern Africa and Western Asia
Latin America & Caribbean
Eastern and South-Eastern Asia
Economic grouping
Developing countries by
region
39%
53%
56%
43%
31%
22%
23%
Food security and nutrion mentioned, in economic grouping
Food security and nutrition mentioned, in region
.


25
C H A P T E R
5.1. AN OVERVIEW98 percent of the countries (131 out of 134) that include priority areas for adaptation and/or adaptation actions mention the agriculture sectors.21 In total 69 percent of all countries that submitted an INDC refer to the agriculture sectors and related adaptation themes and actions. The agriculture sectors are therefore one of the key priorities when planning and implementing climate change adaptation strategies.
As illustrated in Figure 13, adaptation priority areas and/ or adaptation actions in the agriculture sectors are mentioned by 93 percent of all developing countries. All developing countries in SSA refer to adaptation areas and/ or actions and all of them refer to the agriculture sectors in this context.
Several countries that refer to adaptation in their INDCs outline their long-term goals and objectives for developing their agriculture sectors under climate change. About 25 percent of the countries mention food security as one of the key objectives of their adaptation actions.
As repeatedly highlighted in the INDCs, the agriculture sectors are particularly vital for least-developed and developing countries as they constitute the primary source of income for a high share of their population; ensure and strengthen food security; and can have important ancillary benefits for the environment, such as the prevention of soil erosion and the protection of water sources.
21 Regarding adaptation areas and actions, the analysis follows FAO’s framework programme for climate change adaptation (FAO-Adapt). Thus, the agriculture sectors are understood to include agriculture (i.e. crops and livestock), trees, forest products, fisheries and aquaculture, rangelands, soils, land, water, biodiversity, genetic resources, and the specific agro-, aquatic and forest ecosystems and human systems involved in the production systems (see also FAO 2011, 13). Food security as a relevant area for climate change adaptation was also subsumed under agriculture sectors.
ADAPTATION AREAS AND ACTIONS IN THE AGRICULTURE SECTORS
5

26
]T
HE
AG
RIC
ULT
UR
E S
EC
TO
RS
IN T
HE
IN
TE
ND
ED
NA
TIO
NA
LLY
DE
TE
RM
INE
D C
ON
TR
IBU
TIO
NS
- A
NA
LYSI
S[
F I G U R E 1 3 .
Percentage of countries that include priority areas for adaptation and/or adaptation ac-tions in general and including the agriculture sectors
3%
44%
Developed countries
Economies in transition
Developing countries (incl. LDCs)
Sub-Saharan Africa
Southern Asia
Oceania
Northern Africa and Western Asia
Latin America & Caribbean
Eastern and South-Eastern Asia
Economic grouping
Developing countries by
region
95%93%
100%
89%
79%
94%88%
94%
100%92%
Adaptation areas/actions mentioned
Agriculture sectors included
On the sectoral level, 127 countries refer to agriculture (crops and livestock, including water management and irrigation), 116 countries to forestry (including coastal forests), and 84 countries to fisheries and aquaculture (including coastal zones and marine ecosystems) . As Figure 14 illustrates, the share of stated adaptation areas and/or activities within agriculture, forestry and fisheries/aquaculture can vary within a region.
F I G U R E 1 4 .
Adaptation coverage of the agriculture sectors in the INDCs by economic grouping and region
44%13%
Developed countries
Economies in transition
Developing countries (incl. LDCs)
Sub-Saharan Africa
Southern Asia
Oceania
Northern Africa and Western Asia
Latin America & Caribbean
Eastern and South-Eastern Asia
Economic grouping
Developing countries by
region
90%82%
62%
98%
89%
79%
94%
78%
64%
75%
91%
92%85%
46%
84%69%
56%44%
44%
43%
76%
Agriculture Forestry Fisheries and Aquaculture

27
ADAPTATION AREAS AND ACTIONS IN THE AGRICULTURE SECTORS
The INDCs serve as an opportunity to outline relevant adaptation policies and programmes such as NAPAs and NAPs. For example, 53 countries mention that they either have, are designing or intend to develop a NAP with at least one of the agriculture sectors as priority area for adaptation or within their adaptation actions. Some of these countries including Colombia, the Gambia, Guatemala, Kenya, Thailand, Uganda, Uruguay, Vietnam and Zambia refer to the agriculture sectors as a priority for their NAPs. Further information on policies and plans can be found in chapter 7 of this report.
Most countries that include information on adaptation actions in the agriculture sectors refer also to cross-cutting areas relevant for most if not all agriculture sectors. Cross-cutting areas most often referred to in the INDCs are water services, disaster risk management (DRM) and loss and damage. Furthermore, countries refer to the ecosystem approach for managing the natural systems that support the agriculture sectors, the need for continuous research and capacity development, improving livelihood opportunities, genetic resources and gender.
Section 5.2 provides an overview on adaptation actions (including policies and measures) referred to by countries in their INDCs. The categories used in box 3, 4 and 5 are inspired by the categories in FAO adapt.22 Section 5.3 synthesizes information provided in the INDCs on cross-cutting areas, with particular emphasis on water services, DRM and loss and damage. To note, the following discussion considers the 134 countries with concrete information on adaptation areas and/or actions: one developed country, seven economies in transition and 126 developing countries.
5.2. THE AGRICULTURE SECTORS
5.2.1. Crops & livestock97 percent of countries that include the agriculture sectors in the context of climate change adaptation (127 out of 131) refer either to agriculture in general and/or specifically to crops and livestock.
Figure 15 illustrates the adaptation coverage of agriculture by development status and region. 95 percent of developing countries mention agriculture (crops and livestock). Furthermore, 98 percent of countries in SSA refer to agriculture adaptation areas and/or actions regarding crops and/or livestock.
22 FAO Adapt (2011): www.fao.org/climatechange/27594-03ecd7bd225b93086e7dca3944de64307.pdf

28
]T
HE
AG
RIC
ULT
UR
E S
EC
TO
RS
IN T
HE
IN
TE
ND
ED
NA
TIO
NA
LLY
DE
TE
RM
INE
D C
ON
TR
IBU
TIO
NS
- A
NA
LYSI
S[
F I G U R E 1 5 .
Percentage of countries that mention adaptation areas and/or actions in agriculture by economic grouping and region
100%
95%
Developed countries
Economies in transition
Developing countries (incl. LDCs)
Sub-Saharan Africa
Southern Asia
Oceania
Northern Africa and Western Asia
Latin America & Caribbean
Eastern and South-Eastern Asia
Economic grouping
Developing countries by
region
100%
100%
92%
98%
97%
80%
Agriculture mentioned, in economic grouping Agriculture mentioned, in region
Of the 127 countries, 114 countries outline specific policies and/or measures for agriculture. Furthermore, 100 countries include specific adaptation actions with regard to crop systems, with more than 25 percent drawing a clear reference to food security. Most of the 100 countries refer to agriculture methods directed at water, plant and soil management (see Box 4). Addressing observed or predicted water scarcity and potential impacts on crop production, countries refer to adaptation actions related to improving irrigation and the use of heat- and drought-tolerant crops. Enhancing the variety of crops (including research on genetic plant resources), pest management and soil conservation practices are referred to by many countries when outlining their adaptation actions. 34 countries refer to the use of plant genetic resources. Most of these countries mention stress-tolerant crops, in particular to drought, flood, salt, pest and diseases as well as short cycle crops. Measures refer not only to the sustainable use of varieties, but also to the development, conservation and creation of germplasm banks. The importance to preserve traditional knowledge of breeding, R&D in crop varieties and the adoption of climate-resilient crops from other regions are often referred to by countries. References to plant genetic resources are most common in Southern Asia and Eastern and South-Eastern Asia. A few countries state quantified measures, as for example, Burkina Faso specifies the amount of land on which organic fertilizer will be applied. The Niger sets specific targets for the amount of land on which multiuse species will be cultivated. 71 countries mention livestock and pastoral systems, 66 countries of which mention specific actions, ranging from rehabilitation of degraded rangeland to improved management of transhumance and agro-pastoralism, and fire control. Livestock management is addressed with respect to animal health (e.g. pests and disease monitoring), breeding (e.g. biological

29
ADAPTATION AREAS AND ACTIONS IN THE AGRICULTURE SECTORS
diversity of livestock and improved species) and feed management (e.g. supplements, improved fodder crops). Especially countries in Sub-Saharan Africa point to livestock and pasture management as an important component of their adaptation strategies (Figure 16). In order to strengthen livelihoods of those directly and indirectly dependent on crop and livestock production, several countries refer to the importance of suitable insurance schemes, early warning systems and the necessity to include the post-harvest sector in adaptation strategies.
F I G U R E 1 6 .
Percentage of countries that mention adaptation actions in crop systems and livestock and pastoral systems by economic grouping and region
43%14%
77%52%
Developed countries
Economies in transition
Developing countries (incl. LDCs)
Sub-Saharan Africa
Southern Asia
Oceania
Northern Africa and Western Asia
Latin America & Caribbean
Eastern and South-Eastern Asia
Economic grouping
Developing countries by
region
100%
96%80%
50%
9%27%
98%
31%62%
37%73%
40%60%
Crop systems Livestock and pastoral systems
B o x 3 .
SELECTED ADAPTATION ACTIONS IN CROPS AND LIVESTOCK23
Data and knowledge for impact and vulnerability assessment and adaptation
• Animal health and disease outbreak monitoring and control and long term feed storage improvement (the Lao People’s Democratic Republic).
Institutions, policies and financing to strengthen capacities for adaptation
• Reinforcing existing social safety nets through support systems that reduce vulnerability and improve livelihood conditions for the vulnerable, especially women and children (Nigeria);
• National Adaptation Plan for Crops and Cropping Systems planned for 2015-2020 (Lesotho);
• Micro-finance (Uganda).
23 The discussion of adaptation measures for agriculture largely follows FAO (2011), p. 35 ff.
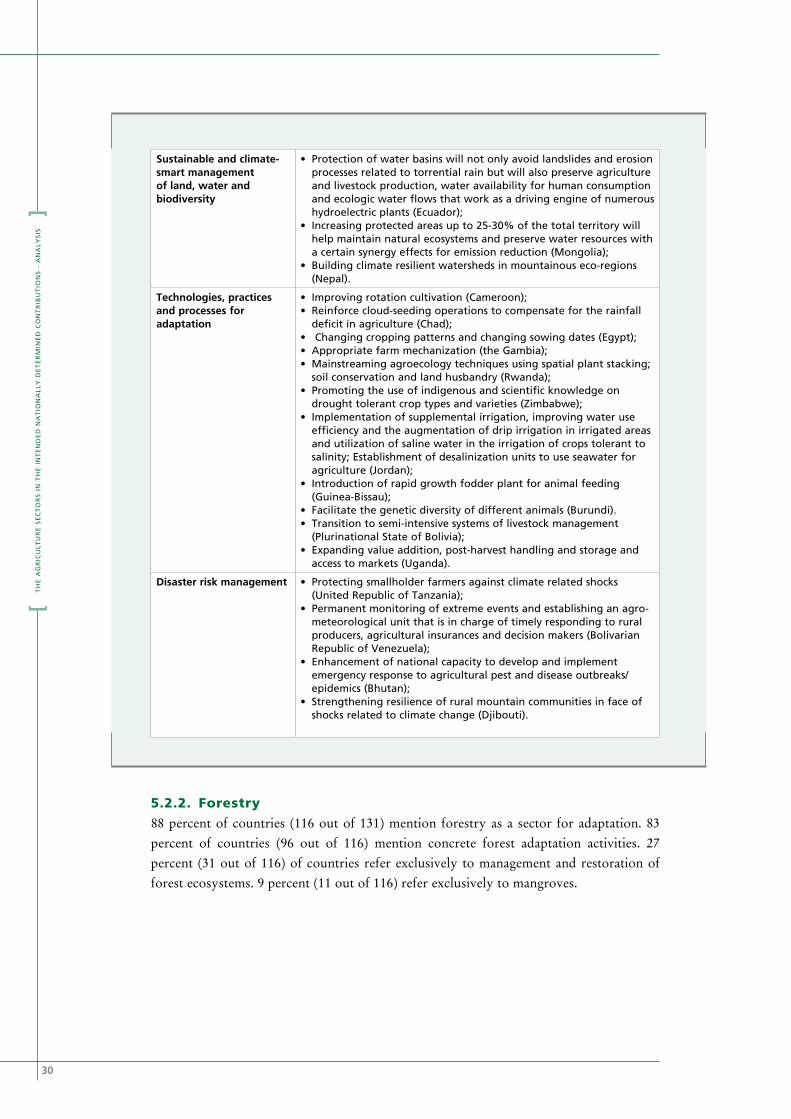
30
]T
HE
AG
RIC
ULT
UR
E S
EC
TO
RS
IN T
HE
IN
TE
ND
ED
NA
TIO
NA
LLY
DE
TE
RM
INE
D C
ON
TR
IBU
TIO
NS
- A
NA
LYSI
S[
Sustainable and climate-smart management of land, water and biodiversity
• Protection of water basins will not only avoid landslides and erosion processes related to torrential rain but will also preserve agriculture and livestock production, water availability for human consumption and ecologic water flows that work as a driving engine of numerous hydroelectric plants (Ecuador);
• Increasing protected areas up to 25-30% of the total territory will help maintain natural ecosystems and preserve water resources with a certain synergy effects for emission reduction (Mongolia);
• Building climate resilient watersheds in mountainous eco-regions (Nepal).
Technologies, practices and processes for adaptation
• Improving rotation cultivation (Cameroon);• Reinforce cloud-seeding operations to compensate for the rainfall
deficit in agriculture (Chad);• Changing cropping patterns and changing sowing dates (Egypt);• Appropriate farm mechanization (the Gambia); • Mainstreaming agroecology techniques using spatial plant stacking;
soil conservation and land husbandry (Rwanda); • Promoting the use of indigenous and scientific knowledge on
drought tolerant crop types and varieties (Zimbabwe);• Implementation of supplemental irrigation, improving water use
efficiency and the augmentation of drip irrigation in irrigated areas and utilization of saline water in the irrigation of crops tolerant to salinity; Establishment of desalinization units to use seawater for agriculture (Jordan);
• Introduction of rapid growth fodder plant for animal feeding (Guinea-Bissau);
• Facilitate the genetic diversity of different animals (Burundi).• Transition to semi-intensive systems of livestock management
(Plurinational State of Bolivia);• Expanding value addition, post-harvest handling and storage and
access to markets (Uganda).
Disaster risk management • Protecting smallholder farmers against climate related shocks (United Republic of Tanzania);
• Permanent monitoring of extreme events and establishing an agro-meteorological unit that is in charge of timely responding to rural producers, agricultural insurances and decision makers (Bolivarian Republic of Venezuela);
• Enhancement of national capacity to develop and implement emergency response to agricultural pest and disease outbreaks/epidemics (Bhutan);
• Strengthening resilience of rural mountain communities in face of shocks related to climate change (Djibouti).
5.2.2. Forestry88 percent of countries (116 out of 131) mention forestry as a sector for adaptation. 83 percent of countries (96 out of 116) mention concrete forest adaptation activities. 27 percent (31 out of 116) of countries refer exclusively to management and restoration of forest ecosystems. 9 percent (11 out of 116) refer exclusively to mangroves.

31
ADAPTATION AREAS AND ACTIONS IN THE AGRICULTURE SECTORS
F I G U R E 1 7 .
Percentage of countries that mention adaptation areas and/or actions in forests/ forestry by economic grouping and region
100%
87%
Developed countries
Economies in transition
Developing countries (incl. LDCs)
Sub-Saharan Africa
Southern Asia
Oceania
Northern Africa and Western Asia
Latin America & Caribbean
Eastern and South-Eastern Asia
Economic grouping
Developing countries by
region
88%
94%
82%
85%
90%
60%
Forestry mentioned, in economic grouping Forestry mentioned, in region
All economies in transition and 87 percent of the developing countries mention adaptation areas and/or actions in forestry by economic grouping and region. 94 percent of the developing countries in SSA refer to adaptation areas and/or actions in forestry (Fig. 17).
Countries often refer to sustainable forest management practices that combine multiple targets: e.g. the ecosystem health of forests, the preservation of forests in their role as carbon sinks and the sustainable access to non-wood forest products. Many countries advocate an ecosystem approach focusing on restoring degraded ecosystems and/or often including specific measures like landscape/watershed and fire management. Some countries developed or intend to establish protected areas. The importance of protecting forests for water management and coastal zone protection is highlighted in some INDCs. Plans and projects regarding afforestation, reforestation and avoiding deforestation are mentioned by 34 percent as strategies for adapting to climate change. A few countries mention the sustainable supply and utilization of wood fuel, including cook stoves. One fifth of the countries in each region refer to these measures, with several of them highlighting synergies with mitigation (for more information see chapter 6).
Several countries plan to use regulatory instruments to support adaptation in the forestry sector. This includes designing and/or implementing laws for sustainable timber-harvesting, forest governance and land use planning. This approach is particularly common among countries in LAC, as well as in Northern Africa and Western Asia. Supporting community-based climate change adaptation and the possibility of combining social, economic and environmental development through, for example, Payment for Environmental Service (PES) schemes is mentioned by few countries.

32
]T
HE
AG
RIC
ULT
UR
E S
EC
TO
RS
IN T
HE
IN
TE
ND
ED
NA
TIO
NA
LLY
DE
TE
RM
INE
D C
ON
TR
IBU
TIO
NS
- A
NA
LYSI
S[
B o x 4 .
SELECTED ADAPTATION ACTIONS IN FORESTRY
Data and knowledge for impact and vulnerability assessment and adaptation
• Implementation of control, monitoring and tracking systems for the appropriate use of areas of forest life; inspections and controls for the proper management of forests (Plurinational State of Bolivia).
Institutions, policies and financing to strengthen capacities for adaptation
• Generating legal instruments for the conservation and sustainable use of forests (Bolivarian Republic of Venezuela);
• Forest Code (Brazil); • Environmental Services Payments program and the Forest
Certification program as a mechanism to promote the sustainable development of forest resources and effective protection of water sources (Costa Rica);
• Systematic land registration and implementation of land tenure regularization reform (Rwanda).
Sustainable and climate-smart management of land, water and biodiversity
• Making community-based forest management climate change adaptation friendly and managing forests and protected areas collaboratively following a landscape approach to resource conservation (Nepal);
• Reduction of slash and burn practices to increase the resilience of forests and research and select forest species, which are resilient to pests, diseases, drought, and soil erosion (the Lao People’s Democratic Republic);
• Apply ecosystem-based approach: Reach a rate of 0% deforestation by the year 2030 (Mexico).
Technologies, practices and processes for adaptation
• Promoting afforestation/reforestation of designated areas through enhanced germplasm and technical practices in planting and post-planting processes (Rwanda);
• Promoting reforestation and rehabilitation of cleared and degraded forests with climate change resilient, ecologically and socially appropriate tree species (Tonga);
• Planting of trees to contribute to increasing the resilience to climate change and for supporting livelihoods in rural areas and the tourism sector (Lebanon);
• Promote alternative sources of energy to reduce deforestation and the consequent loss of livelihood options (South Sudan);
• Establishment of plantation forests to meet the needs of population in fuel wood for heating, cooking etc (Republic of Moldova).
Disaster risk management • Forest fire risk assessment and management (Bhutan).
5.2.3. Fisheries and aquaculture55 percent of countries (72 out of 131) mention fisheries and/or aquaculture when outlining their adaptation areas and/or actions with 19 countries explicitly mentioning aquaculture. An additional 12 countries refer exclusively to the protection and restoration of marine resources.
Of the 84 countries (72 + 12) mentioned above, 63 countries mention specific adaptation actions: 43 countries mention fisheries and aquaculture management through the development of sectoral plans, 32 countries refer to resilience building and disaster risk management, including infrastructure measures,24 20 countries refer to the development of the fisheries sector by improving the legal and institutional framework (e.g. through
24 The discussion of adaptation measures for fisheries and aquaculture follows Vadacchino et al. (2011), p. 19 ff.

33
ADAPTATION AREAS AND ACTIONS IN THE AGRICULTURE SECTORS
facilitating access to funding), diversifying livelihoods and creating new opportunities for fishery products.
Furthermore, a number of countries including Ghana, Kenya, Liberia, Madagascar and Mauritius reflect on climate-smart techniques in the fisheries sector for, as for example, enhancing the resilience of value chains and dependent communities.
Figure 18 illustrates the adaptation coverage of fisheries and/ or aquaculture by development status and region.
F I G U R E 1 8 .
Percentage of countries that mention adaptation areas and/or actions in fisheries and/or aquaculture by economic grouping and region
29%
65%
Developed countries
Economies in transition
Developing countries (incl. LDCs)
Sub-Saharan Africa
Southern Asia
Oceania
Northern Africa and Western Asia
Latin America & Caribbean
Eastern and South-Eastern Asia
Economic grouping
Developing countries by
region
50%
76%
55%
46%
73%
47%
Fisheries and aquaculture mentioned, in economic grouping Fisheries and aquaculture mentioned, in region
To note, an additional 15 percent of countries that mention adaptation actions explicitly cover coastal zone and marine ecosystems without direct or indirect reference to fisheries and aquaculture.25
25 A country indirectly refers to fisheries and aquaculture when it acknowledges the vulnerability of this sector without stating explicit adaptation actions for this sector under coastal zone management.

34
]T
HE
AG
RIC
ULT
UR
E S
EC
TO
RS
IN T
HE
IN
TE
ND
ED
NA
TIO
NA
LLY
DE
TE
RM
INE
D C
ON
TR
IBU
TIO
NS
- A
NA
LYSI
S[
B o x 5 .
SELECTED ADAPTATION ACTIONS IN THE FISHERIES AND AQUACULTURE SECTOR
Data and knowledge for impact and vulnerability assessment and adaptation
• Identification and conservation of endangered fish species (Liberia);• Capacity building in coastal areas (Seychelles).
Institutions, policies and financing to strengthen capacities for adaptation
• Strengthen institutional and local capacity and monitoring systems for fishery management and develop climate smart systems to enhance resilience of fisher communities (Liberia);
• Blue Economy and Seychelles Strategic Plan 2015 (Seychelles);• Facilitation and increased access to financing to develop mariculture
(Maldives);• Strengthen regulatory framework for protection of beaches, dunes
and vegetation (Mauritius).
Sustainable and climate-smart management of land, water and biodiversity
• Community-based conservation of wetlands and coastal zones (Bangladesh)
• Improvement of the management of marine protected areas and expansion of protected area network including rehabilitation of wetlands, sea-grass, mangrove plantation and coral reef rehabilitation (Mauritius)’;
• Promote sustainable coastal and maritime tourism; improve quality of fishery products through eco-labelling (Cabo Verde).
Technologies, practices and processes for adaptation
• Development of agro-ecological fish-farming techniques; development of techniques to conserve and process fish-farming products (Guinea);
• Management of coastal and fisheries resources through promotion of non-destructive fishing techniques to maintain resilience of marine ecosystems (Sierra Leone).
Disaster risk management • Improve port infrastructure for artisanal and industrial fisheries and support the insurance scheme for farmers and fishers (Seychelles);
• Construction of piers and boat storm shelters and 100 percent of offshore fishing boats and ships have sufficient communication equipment (Viet Nam);
• Early warning systems of both sea level rise impacts and extreme weather events for building adaptive capacity (the United Republic of Tanzania).
• Coastal Risk Assessment Programme (Barbados).
5.3. CROSS-CUTTING AREAS RELEVANT FOR THE AGRICULTURE SECTORS
5.3.1. Water services132 countries mention water services in the context of adaptation.26 All countries in Eastern, South-Eastern and Southern Asia, the LAC region and SSA refer to water services. Water is also a key adaptation concern among countries in Oceania (91 percent) as well as countries in South-Eastern Europe and Central Asia refer (86 percent).
93 countries specify measures for managing water scarcity and preserving good water
26 This figure also includes indirect references, i.e. measures stated under a different area, as for example under DRM or agriculture sectors.

35
ADAPTATION AREAS AND ACTIONS IN THE AGRICULTURE SECTORS
quality. In this context, most countries refer to infrastructure related measures (e.g. pipelines, new storage and distribution technologies), water demand management and groundwater monitoring. Regarding the preservation of water quality, structural and non-structural measures for preventing salinization or improving desalinization are included.
74 countries explicitly refer to water resources in the context of adaptation in the agriculture sectors. Examples of how the agriculture sectors can contribute to sustainable water management include resource efficient irrigation and drainage systems, watershed management, rainwater harvesting, wastewater recycling and reuse and integrated water resource management. With regard to policy measures several countries aim to develop new or improve existing frameworks and mainstream climate change into sectoral plans.
5.3.2. Disaster risk management in the agriculture sectors47 countries mention DRM in the agriculture sectors:27 48 percent of the LDCs, 29 percent of developing countries and 29 percent of the economies in transition. Within the different regions, countries in Asia particularly often refer to the agriculture sectors in the context of DRM (62 percent of the countries in Eastern and South-Eastern Asia, 38 percent in Southern Asia). The corresponding figures in SSA and the LAC region is 39 percent and 30 percent, respectively. 29 percent of the countries in South-Eastern Europe and Central Asia and 27 percent of the countries in Northern Africa and Western Asia refer to DRM when discussing adaptation measures in the agriculture sectors, while 18 percent of the countries in Oceania mention specific measures in this context.
Figure 19 provides an overview of selected measures for DRM in the agriculture sectors, as communicated by the countries in their INDCs. As for example, 50 percent of all countries that mention DRM are located in SSA. Within this region, countries refer particularly often to investing in DRR for resilience, enhancing disaster preparedness and early warning systems. In addition, Figure 19 shows that the most common DRM measures referred to by countries in their INDCs are monitoring crisis and disaster risk and reducing community vulnerability to crisis and disaster risk. By contrast, disaster risk governance is rarely addressed at the sectoral level.
27 This number refers to measures associated with managing disaster risks and strengthening resilience to climate-related hazards (in particular floods, droughts, storms) with explicit reference to the agriculture sectors. It represents a lower boundary as many parties use DRM as a cross-sectoral category whereas sector-specific actions are often not included. Several countries also mention their vulnerability to extreme events without reflecting specifically on DRM but the enhancement of overall resilience to climate change. See Chapter 2 for the inclusion of DRM in general.

36
]T
HE
AG
RIC
ULT
UR
E S
EC
TO
RS
IN T
HE
IN
TE
ND
ED
NA
TIO
NA
LLY
DE
TE
RM
INE
D C
ON
TR
IBU
TIO
NS
- A
NA
LYSI
S[
F I G U R E 1 9 .
Percentage of DRM measures in the agriculture sectors by categorical breakdown
0%
10%
20%
30%
40%
50%
60%
Eastern andSouth-Eastern
Asia
Latin America& Caribbean
NorthernAfrica and
Western Asia
Oceania Southern Asia Sub-SaharanAfrica
Economies intransition
Developing countries (incl. LDCs) by region
Prepare for and respond to crises and disasters
Reduce community vulnerability to crises and disaster risk
Strenghtening disaster risk governance
Monitor crisis and disaster risk
Box 6 provides an overview of selected measures for DRM in general and in the agriculture sectors, as communicated by the countries in their INDCs.
B o x 6 .
SELECTED DRM MEASURES IN GENERAL AND IN THE AGRICULTURE SECTORS
Govern crisis and disaster risk
• Costa Rica is finalizing its National Disaster Risk Management Policy 2016-2030 with the following pillars: Risk Reduction, Disaster Response and Readiness, and Disaster Recovery, with climate change adaptation as a cross-cutting issue (Costa Rica);
• Brunei Darussalam’s National Disaster Management Centre (NDMC) has developed a Strategic National Action Plan for Disaster Risk Reduction, along with the private sector, non-governmental organizations, local bodies and other national agencies, to ensure a safer and disaster resilient country and community (Brunei Darussalam).
Monitor crisis and disaster risk with early warnings
• Assessment and management of risk and damage from windstorms on agricultural crops and human settlements (Bhutan);
• Development of new early warning systems and new hydro-meteorological insurances, within the disaster risk reduction framework for the agricultural, coastal and health sectors, and for flood sensitive urban areas, infrastructure and other vulnerable regions (Uruguay).
Reduce community vulnerability to crisis and disaster risk
• Strengthen forest disaster prevention and forest resource protection and to reduce deforestation-related emissions (China);
• Enhance adaptive capacity of ecosystems, communities and infrastructure though an ecosystem rehabilitation approach in highlands (Ethiopia);
28 Box 6 categories represent the FAO resilience framework (2016).
2 9

37
ADAPTATION AREAS AND ACTIONS IN THE AGRICULTURE SECTORS
• Developing and rehabilitating the flood protection dykes for agricultural development (Cambodia);
• Pilot Program for Climate Resilience (PPCR) builds climate resilient watersheds in mountainous eco-regions, builds resilience to climate related hazards, mainstreams climate change risk management in development, and builds climate resilient communities through private sector participation (Nepal).
Prepare for and respond to crisis and disaster
• Developing an early warning system for agricultural pests and climatic conditions (Lebanon).
• Establishing of weather stations in high-altitude mountain locations (Ecuador).
5.3.3. Loss and damage
43 countries explicitly refer to loss and damage associated with climate change. Many of these countries address the reduction of loss and damage within their adaptation targets and strategies.
32 countries refer to insurance mechanisms for increasing resilience to climate-change related hazards, in particular hydro-meteorological events; 21 of these countries (mostly from Sub-Saharan Africa) have in place or highlight the need for insurance systems that specifically address the agriculture sectors.
Countries either refer to past or projected loss and damage together with actions related to: DRM/DRR or overall resilience building; reduction of loss and damage as a co-benefit of mitigation and adaptation actions; articulated efforts to assess and quantify loss and damage; calling the international community for joint actions in this field.
In this regard, 14 countries either state the need for (1) international support (financial, capacity building and technology transfers), (2) treatment of loss and damage as a separate element in the Paris agreement; (3) establishment or strengthening of an international loss and damage mechanism (in particular the Warsaw International Mechanism on Loss and Damage ).29
29 http://unfccc.int/adaptation/workstreams/loss_and_damage/items/8134.php
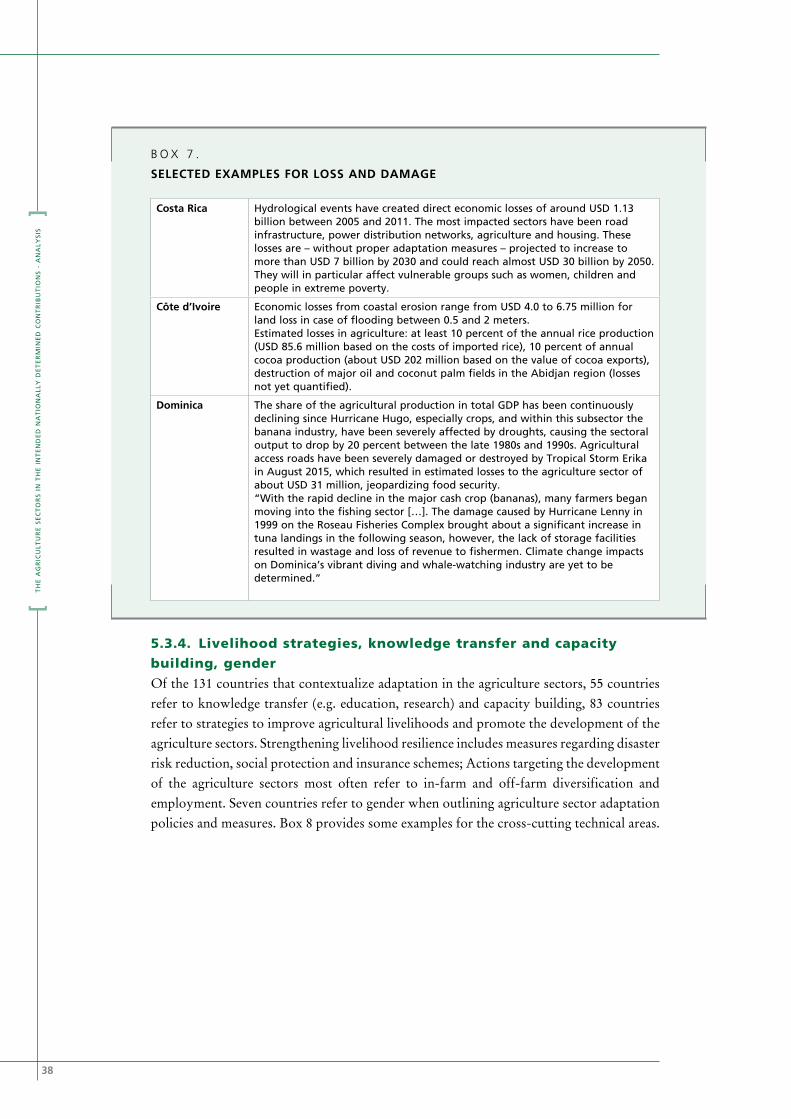
38
]T
HE
AG
RIC
ULT
UR
E S
EC
TO
RS
IN T
HE
IN
TE
ND
ED
NA
TIO
NA
LLY
DE
TE
RM
INE
D C
ON
TR
IBU
TIO
NS
- A
NA
LYSI
S[
B o x 7 .
SELECTED EXAMPLES FOR LOSS AND DAMAGE
Costa Rica Hydrological events have created direct economic losses of around USD 1.13 billion between 2005 and 2011. The most impacted sectors have been road infrastructure, power distribution networks, agriculture and housing. These losses are – without proper adaptation measures – projected to increase to more than USD 7 billion by 2030 and could reach almost USD 30 billion by 2050. They will in particular affect vulnerable groups such as women, children and people in extreme poverty.
Côte d’Ivoire Economic losses from coastal erosion range from USD 4.0 to 6.75 million for land loss in case of flooding between 0.5 and 2 meters.Estimated losses in agriculture: at least 10 percent of the annual rice production (USD 85.6 million based on the costs of imported rice), 10 percent of annual cocoa production (about USD 202 million based on the value of cocoa exports), destruction of major oil and coconut palm fields in the Abidjan region (losses not yet quantified).
Dominica The share of the agricultural production in total GDP has been continuously declining since Hurricane Hugo, especially crops, and within this subsector the banana industry, have been severely affected by droughts, causing the sectoral output to drop by 20 percent between the late 1980s and 1990s. Agricultural access roads have been severely damaged or destroyed by Tropical Storm Erika in August 2015, which resulted in estimated losses to the agriculture sector of about USD 31 million, jeopardizing food security. “With the rapid decline in the major cash crop (bananas), many farmers began moving into the fishing sector […]. The damage caused by Hurricane Lenny in 1999 on the Roseau Fisheries Complex brought about a significant increase in tuna landings in the following season, however, the lack of storage facilities resulted in wastage and loss of revenue to fishermen. Climate change impacts on Dominica’s vibrant diving and whale-watching industry are yet to be determined.”
5.3.4. Livelihood strategies, knowledge transfer and capacity building, genderOf the 131 countries that contextualize adaptation in the agriculture sectors, 55 countries refer to knowledge transfer (e.g. education, research) and capacity building, 83 countries refer to strategies to improve agricultural livelihoods and promote the development of the agriculture sectors. Strengthening livelihood resilience includes measures regarding disaster risk reduction, social protection and insurance schemes; Actions targeting the development of the agriculture sectors most often refer to in-farm and off-farm diversification and employment. Seven countries refer to gender when outlining agriculture sector adaptation policies and measures. Box 8 provides some examples for the cross-cutting technical areas.
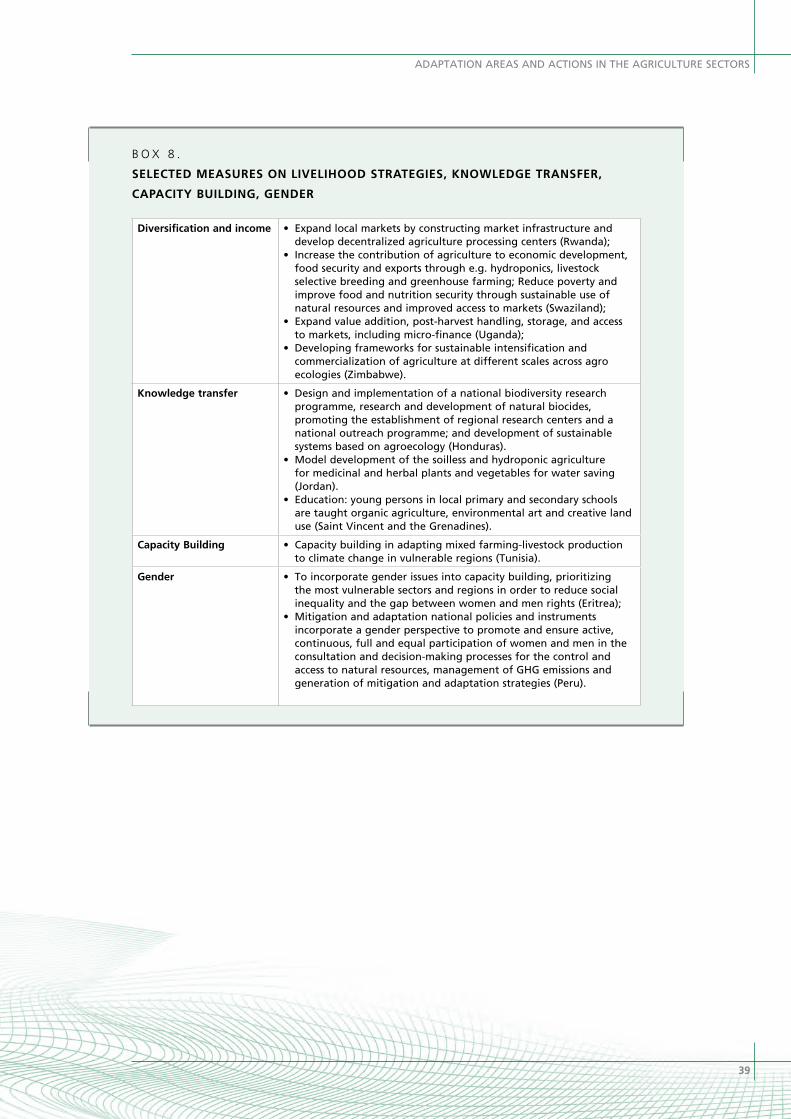
39
ADAPTATION AREAS AND ACTIONS IN THE AGRICULTURE SECTORS
B o x 8 .
SELECTED MEASURES ON LIVELIHOOD STRATEGIES, KNOWLEDGE TRANSFER,
CAPACITY BUILDING, GENDER
Diversification and income • Expand local markets by constructing market infrastructure and develop decentralized agriculture processing centers (Rwanda);
• Increase the contribution of agriculture to economic development, food security and exports through e.g. hydroponics, livestock selective breeding and greenhouse farming; Reduce poverty and improve food and nutrition security through sustainable use of natural resources and improved access to markets (Swaziland);
• Expand value addition, post-harvest handling, storage, and access to markets, including micro-finance (Uganda);
• Developing frameworks for sustainable intensification and commercialization of agriculture at different scales across agro ecologies (Zimbabwe).
Knowledge transfer • Design and implementation of a national biodiversity research programme, research and development of natural biocides, promoting the establishment of regional research centers and a national outreach programme; and development of sustainable systems based on agroecology (Honduras).
• Model development of the soilless and hydroponic agriculture for medicinal and herbal plants and vegetables for water saving (Jordan).
• Education: young persons in local primary and secondary schools are taught organic agriculture, environmental art and creative land use (Saint Vincent and the Grenadines).
Capacity Building • Capacity building in adapting mixed farming-livestock production to climate change in vulnerable regions (Tunisia).
Gender • To incorporate gender issues into capacity building, prioritizing the most vulnerable sectors and regions in order to reduce social inequality and the gap between women and men rights (Eritrea);
• Mitigation and adaptation national policies and instruments incorporate a gender perspective to promote and ensure active, continuous, full and equal participation of women and men in the consultation and decision-making processes for the control and access to natural resources, management of GHG emissions and generation of mitigation and adaptation strategies (Peru).


41
C H A P T E R
6.1. SYNERGIES BETWEEN ADAPTATION AND MITIGATION116 countries refer to the agriculture sectors both with regard to mitigation and adaptation. This is indicative of the potential to leverage mitigation-adaptation synergies in these sectors. Opportunities for realizing these synergies are explicitly acknowledged by some countries. 57 countries endorse or even prioritize actions based on the potential synergies between mitigation and adaptation.
Several countries refer to concepts that capitalize on mitigation-adaptation synergies, such as climate-smart agriculture (CSA). 32 countries specifically refer to the concept of CSA,30 75 percent (equivalent to 24 countries) of which are in Sub-Saharan Africa (see map 4). The remaining countries are located in Eastern, South-Eastern and Southern Asia (5 countries), LAC (2 countries) and Western Asia (one country). 40 percent of all LDCs refer to CSA. (See Annex B for detailed information on these 32 countries’ coverage of CSA).
30 Only countries that explicitly refer to climate-smart agriculture (or a variation thereof, as for example “climate-intelligent agriculture (Jordan)”, “l'agriculture climato-intelligente” (Haiti) or “agricultura climáticamente inteligente” (Equatorial Guinea)) under mitigation/adaptation were subsumed under this category. Also included is “Sri Lanka which refers to climate smart villages for different farming situation”. Countries that mention systems that may be climate-smart, but not explicitly state the term CSA (e.g. Honduras: Quesungual system), as well as countries that refer to policy frameworks that may but do not explicity include CSA (e.g. Côte d’Ivoire) are not included.
SYNERGIES AND CO-BENEFITS
6

42
]T
HE
AG
RIC
ULT
UR
E S
EC
TO
RS
IN T
HE
IN
TE
ND
ED
NA
TIO
NA
LLY
DE
TE
RM
INE
D C
ON
TR
IBU
TIO
NS
- A
NA
LYSI
S[
M A P 4 .
Countries that refer to CSA in their INDCs
Potential synergies are not always explicitly described in the INDCs. For example, countries often refer to activities such as cropland and nutrient management, land restoration, forest management (including mangroves), and protection and preservation of ecosystems that offer opportunities to achieve simultaneous climate change mitigation and adaptation benefits without explicitly acknowledging these synergies in their INDCs (see box 9).
As evidenced by several INDCs, countries perceive adaptation and mitigation synergies and associated benefits as important element of their long-term development strategies.
B o x 9 .
SELECTED SYNERGIES BETWEEN MITIGATION AND ADAPTATION
Agriculture (crops, livestock)
• Improving pasture management would increase the carbon sink of CO2eq to 29 million t/pa which is equal to one-third of emission reduction in the energy sector; Reducing bare fallow to 30 percent in rain-fed crop land, increasing variety of crops, zero-tillage and crop rotation would consequently increase a carbon sink; Increasing protected areas up to 25-30 percent of the total territory will help maintain natural ecosystems and preserve water resources with a certain synergy effects for emission reduction; Increasing forest area up to 9 percent by 2030 and reducing forest fire affected areas by 30 percent would conserve ecosystems and increase carbon sink (Mongolia).
Fisheries • Restoration of mangrove forests help sequestrating carbon, can prevent coastal erosion (Myanmar);
• Restoration of mangrove attracts and provides habitat for fish and other marine resources (Senegal).

43
SYNERGIES AND CO-BENEFITS
Forestry • Protection of wetlands and watersheds as carbon sinks also reduces risks of flooding and storm surge by enhancing water retention (Antigua and Barbuda);
• Actions to preserve the forest provide flood management benefits (adaptation) and where this is coupled with reforestation or afforestation to expand the forests reserves area, there could be enhanced mitigation benefits too (Brunei Darussalam);
• Strengthening practices in integrated and sustainable forest management, e.g., through the management of timber and non-timber products in an integrated and sustainable manner (Plurinational State of Bolivia);
• Integrated landscape restoration focusing on forest zones, establish biological corridors by adopting agro-forestry systems and low-carbon agricultural practices (El Salvador).
6.2. CO-BENEFITS WITH OTHER ENVIRONMENTAL, ECONOMIC AND SOCIAL GOALSSeveral countries mention social, economic and environmental co-benefits in the context of their mitigation contributions (agriculture and LULUCF) and adaptation actions (agriculture, forestry, fisheries and aquaculture). Almost half of all LDCs acknowledge co-benefits from actions related to the agriculture sectors. Co-benefits most often refer to rural development and health, poverty reduction and job creation, conservation of ecosystems and biodiversity and improving gender equality. Box 10 provides examples of co-benefits of mitigation and adaptation actions mentioned in the INDCs.
B o x 1 0 .
SELECTED EXAMPLE FOR SOCIAL, ECONOMIC AND ENVIRONMENTAL CO-BENEFITS
OF ADAPTATION AND MITIGATION ACTIONS
Co-benefits Agriculture Mitigation
• Reduced GHG emissions due to reduced fertilizer use and less turning of soil -
Biodiversity preservation due to reduced tillage - Improved soil productivity leading
to improved crop productivity (Zambia);
• Proposed actions make it possible to sequester carbon in the soil (more than 5,150
Gg eq CO2 sequestered at the 2030 horizon), contributing to the restoration of
degraded land and mitigation of the effects of climate warming, with the end result
of preserving ecosystems and water resources (Burkina Faso);
• Long-term food security (India).
Co-benefits LULUCF Mitigation
• Sustainable forest management will increase carbon sinks. This low-carbon growth
[together with the mitigation measures in agriculture] will bring major economic and
social development, job creation, environmental and health co-benefits (Cameroon);
• Russian boreal forests have global significance for mitigating climate change,
protecting water resources, preventing soil erosion and conserving biodiversity on

44
]T
HE
AG
RIC
ULT
UR
E S
EC
TO
RS
IN T
HE
IN
TE
ND
ED
NA
TIO
NA
LLY
DE
TE
RM
INE
D C
ON
TR
IBU
TIO
NS
- A
NA
LYSI
S[
the planet (the Russian Federation);
• Prevention of flooding, soil erosion and landslides, protection of biodiversity and
ecosystem services (the Lao People’s Democratic Republic).
Co-benefits Adaptation in the Agriculture Sectors
• Agriculture: reduction of poverty, food and nutrition security, resilience building; job
creation, increase in yield productivity; Capture Fisheries: value-added creation of 9.2
Mio USD in 2035, improved economic and social contribution through sustainable
forest management; Coastal areas: fight against yield reduction of fishing (Senegal);
• Climate resilience in vulnerable communities (Domenica);
• Enhanced resilience of women farmers (Mali);
• Food security, rural development, job creation (Côte d’Ivoire).
Particularly with regard to gender equality, the potential of the agriculture sectors for providing diverse opportunities for empowering women and reducing their vulnerability to climate change is highlighted in various INDCs (Box 11).
B o x 1 1 .
GENDER IN THE INDCS
More than 40 percent of the submissions mention gender-related issues, though to
a varying extent: Seven countries inform about the status of women in the national
context (e.g. literacy rate, gender equality, inclusion in development) without further
including the topic in their contributions. As many as 75% of Sub-Saharan African
Parties reference “gender” or “women” in their INDCs, making the region a global
leader in integrating gender equality into sustainable development priorities.
12 countries point out the vulnerability of women and the same number mention
gender in relation to agriculture under climate change. 36 countries mention gender
in the adaptation section, most often associated with adaptation goals, capacity
building, or mainstreaming in policies and plans. In some instances, women’s specific
vulnerabilities are highlighted (e.g. from Uganda, “Women are especially vulnerable in
terms of food insecurity, water shortage and fuel wood scarcity.”) In others, actions to
address women’s vulnerability are mentioned, such as Kenya’s priority for the Gender,
Vulnerable Groups and Youth sector: to “Strengthen the adaptive capacity of the most
vulnerable groups and communities through social safety nets and insurance schemes.”
Four countries intend to strengthen the resilience of women to disasters, through
safety nets and other support systems, or by implementing gender sensitive DRM
initiatives. With respect to agriculture, seven countries mention gender concerns,
either in stating explicit objectives and measures in adaptation (e.g. Côte d’Ivoire
and Chad: strengthening capacities especially of women farmers in the context of
intensified and sustainable modes of production); or in pointing to the co-benefits for
45
SYNERGIES AND CO-BENEFITS
women that arise from mitigation and adaptation actions (e.g. Zambia: rural poverty
reduction particularly among women).
Four countries mention gender in connection with the benefits of renewable energy
and increased efficiency (better cook stoves, etc.), such as Zambia which mentions as a
co-benefit of its renewable energy program “improved food security due to increased
agriculture production resulting from use of irrigation especially for women”. More
than half of the countries that refer to gender-related issues promote an active role
for women during the implementation process of their INDC and in future policy
design, while others make note of the inclusion of gender equality and related
principles in their existing climate change policies (e.g. the Philippines and Viet Nam).
Three countries —Liberia, Peru and Jordan—reference their comprehensive national
Climate Change Gender Action Plans in their INDC communications. However, only a
few countries explicitly mention the engagement of women or their representatives
(such as ministries for gender promotion/equality and women’s organizations) in the
stakeholder process (e.g. Burkina Faso, Liberia, Mauritius).


47
C H A P T E R 7
7.1. STAKEHOLDER ENGAGEMENT IN PLANNING THE INDCS Many countries highlight the importance of incorporating the views, observations and approval of all relevant stakeholders in order to identify and plan realistic and effective mitigation and adaptation policies and measures that comply with and support long-term development goals.
Countries have engaged stakeholders in the process of formulating and planning their INDCs in various ways including but not limited to parliamentary hearings, workshops and public consultations. As for example, as part of its INDC preparation process, Afghanistan has organized a series of consultation and awareness raising workshops to bring together decision-makers from government institutions and stakeholders from non-governmental organizations to develop the current INDC and establish a sustainable development vision. Antigua and Barbuda’s adaptation and mitigation targets have been drafted and reviewed by, inter alia, the Technical Advisory Committee (TAC), which is an inter-agency, multi-stakeholder advisory committee that includes fifteen government agencies, three NGOs and community interest groups, and one private sector coalition representative.
In total, 96 countries (90 percent of which are from developing countries, including LDCs) provide general insights into national consultation processes including involved stakeholders. Stakeholders mentioned include national ministries, provincial and regional governments, academic and research institutions, civil society organizations, non-governmental agencies, the private sector and international development partners. In many cases the evaluation and formulation of mitigation and adaptation measures has been supported by national and/or international research groups and discussed in a broader stakeholder process.
To note, only a few countries explicitly name concrete stakeholders they (intend to) cooperate with in their INDCs. Some countries do not specify the stakeholder process in their INDCs but provide a link to other documents for elucidating their stakeholder involvement strategy. As for example, New Zealand does not describe in its INDC stakeholder engagement, but provides a link to a Cabinet paper that outlines its consultation process. In this document, agriculture stakeholders (e.g. relevant ministries, indigenous population) were featured prominently.
DEVELOPING THE INDCS AND PLANNING THE IMPLEMENTATION OF THE NDCS

48
]T
HE
AG
RIC
ULT
UR
E S
EC
TO
RS
IN T
HE
IN
TE
ND
ED
NA
TIO
NA
LLY
DE
TE
RM
INE
D C
ON
TR
IBU
TIO
NS
- A
NA
LYSI
S[
7.2. POLICIES AND INSTITUTIONSMany countries refer to policies and frameworks that were used in the preparation of their INDCs. All Parties mention that their INDCs are based on their experiences with implementing the Convention and its Kyoto Protocol. Existing or planned policies to support the implementation of their contributions are presented by several countries. Many LDCs mention at least one policy or plan as a basis for formulating their INDCs and several LDCs point to at least one policy or plan for supporting the implementation of their NDCs.
Policy frameworks mentioned in the INDCs include existing and/or planned national policies and development plans, and UNFCCC-related documents, such as National Communications, Biennial Update Reports, Nationally Appropriate Mitigation Actions (NAMAs), National Adaptation Programmes of Action (NAPAs) and National Adaptation Plans (NAPs).
43 countries refer to NAMAs as a basis and/or means of supporting implementation of the mitigation component of their INDCs. Some countries refer to NAMAs in agriculture (crops and livestock) either as an element for the formulation of their INDCs or when outlining the implementation of their INDCs. A few countries including refer to the development and implementation of NAMAs for LULUCF. A few countries that outline their mitigation efforts in the forest sector refer to existing or planned REDD-plus activities.
44 countries, almost 89 percent of the LDCs,31 mention NAPAs when describing past or present adaptation efforts, or as a measure for implementing their NDCs. Several countries refer to specific NAPA projects as being part of their intended contributions.
55 countries highlight that they have been designing, are finalizing a NAP or intend to start the NAP process soon.32 53 of these countries mention at least one of the agriculture sectors as priority area for adaptation or within their adaptation actions. As illustrated by Figure 20, 40 percent of all developing countries have mentioned a NAP. In addition to the 55 countries that explicitly refer to a NAP, 32 countries refer to national climate change adaptation planning without clarifying whether these plans are following the UNFCCC NAP framework.
31 Excluding two island states (Cabo Verde, Samoa) that have since graduated from the LDC group.32 Including Palau, which refers to its NAP without referring to specific adaptation areas and/or actions in its INDC.

49
DEVELOPING THE INDCS AND PLANNING THE IMPLEMENTATION OF THE NDCS
F I G U R E 2 0 .
Percentage of countries that mention a NAP by economic grouping and region
13%
40%
Developed countries
Economies in transition
Developing countries (incl. LDCs)
Sub-Saharan Africa
Southern Asia
Oceania
Northern Africa and Western Asia
Latin America & Caribbean
Eastern and South-Eastern Asia
Economic grouping
Developing countries by
region
67%
61%
14%
23%
31%
13%
NAP mentioned, in economic grouping NAP mentioned, in region
Countries also recognize the importance of mainstreaming adaptation measures and actions into their national and local planning processes. In that context, countries, inter alia, refer to Local Adaptation Plans of Actions (LAPAs) and Community Adaptation Plans of Action (CAPAs). Several countries are referring to one and/or both of these plans in their INDCs. Nepal, as for example, is implementing LAPAs in 90 Village Development Committees and seven Municipalities. In addition, about 375 local adaptation plans and nearly 2200 CAPAs for community forests have been developed. The LAPAs and CAPAs are designed to ensure full and effective participation of communities in climate change adaptation planning.
Countries also mention a variety of non-climate specific policies in their INDCs. Examples include national development strategies, as well as sectoral and/or regional strategies, policies and plans. Many countries intend to develop or update existing sectoral plans or ensure institutional mainstreaming of climate change in the agriculture sectors.
Many countries emphasize the importance of strengthening national institutional arrangements, particularly through multi-sectoral cooperation and inter-ministerial coordination. Several countries emphasize the inclusion of all levels of government. Additionally, countries express the relevance of national, subnational and regional cooperation among governments and non-state actors, including south-south cooperation.
Several countries identify the need to further strengthen their policy frameworks and institutional arrangements for supporting the finalization of their INDCs and the implementation of their NDCs.
Most countries emphasize the importance of monitoring and evaluating the impact of their proposed strategies. Some countries elaborate on their intentions to establish adaptation and vulnerability indicators to measure the progress they are making in

50
]T
HE
AG
RIC
ULT
UR
E S
EC
TO
RS
IN T
HE
IN
TE
ND
ED
NA
TIO
NA
LLY
DE
TE
RM
INE
D C
ON
TR
IBU
TIO
NS
- A
NA
LYSI
S[
achieving their contributions. A few INDCs include detailed measures for monitoring, reporting and reacting to the performance of their adaptation and mitigation strategies. Where countries plan to introduce monitoring and evaluating measures for specific regions or sectors, they often express the intention to scale these measures up to the national level in the long run.
Many countries emphasize that the INDCs represent a shared global effort that can only be successful when all Parties participate in a fair manner. Responsibilities for addressing climate change through implementing the NDCs are common yet differentiated and have to take into account aspects such as historical emission records and national circumstances.
Even though the level of ambition and the degree of advancement in national climate policies and planning varies, many countries have developed or have taken measures to develop a strong domestic basis for achieving their contributions.
7.3. CLIMATE FINANCEThroughout the INDCs, most NAI Parties highlight, in different levels of detail, their need for climate finance to cover the costs associated with implementing their adaptation and mitigation contributions. Even though some of these costs may be met domestically, most countries that refer to their need for climate finance indicate their need for international finance.
When describing the generation of domestic funds, countries refer to, inter alia, the use of public-private partnerships, the expansion of budgetary support for climate action, environmentally responsible procurement, the reform of fiscal regimes, Payment for Environmental Services schemes and enhancement of green credit mechanisms.
Countries refer to international financial assistance either to fulfil their basic commitments or to take more ambitious action compared to the action that could be supported with domestic finance only. Fulfilling conditional contributions in addition to unconditional contributions can make a decisive difference. In the context of mitigation, the conditional component can make a difference of up to 50 percent of total mitigation contributions. Almost all developing countries (including the LDC) refer to their need for international finance to meet their adaptation contributions (Table 1).
Table 1 exhibits the share of countries that specify or intend to seek international financial support for their adaptation and/or mitigation contributions.
TA B L E 1 .
Countries indicating need for financial support for the implementation of their INDCs
TOTAL PARTIES
% OF PARTIES HIGHLIGHTING NEED FOR FINANCIAL SUPPORT
Least developed countries 47 100%
Developing countries 86 93%
Countries in transition 16 69%

51
DEVELOPING THE INDCS AND PLANNING THE IMPLEMENTATION OF THE NDCS
Cost estimates provided in the INDCs can vary widely. Concrete cost estimates range from USD 50 million (Nauru)33 to USD 2.5 trillion (India). Distinguishing between mitigation and adaptation, the financial resources needed for the reduction of emissions vary between USD 50 million (Nauru, for Solar PV and demand side energy efficiency measures) and USD 834 billion (India, for low carbon development). Projected adaptation costs range from USD 25 million (Dominica, for measures such as capacity building and the promotion of food security through climate resilient fisheries/ agriculture development) to USD 213.7 billion (India, for the agriculture sectors and energy).
When outlining their international finance needs, some countries describe specific projects at the local level, or for a particular economic sector. Half of the countries outlined in Table 1 include concrete estimates of their financial needs. However, most countries provide general figures without a breakdown of the items they would be covering. Overall, figures and the level of detail provided in the INDCs vary. For the most part, information related to exchange rates and projected inflation is not included.
Countries rarely explain how they arrived at their overall cost estimates for achieving their contributions. Furthermore, in many cases it remains unclear how countries have quantified their exact need for international financial support. The often limited information on cost calculations could be related to the methodological challenges of economically assessing adaptation and/ or mitigation policies and measures.
Most countries base their calculations on previous policy documents, in particular NAPAs and National Communications, so that in many cases the time period of commitments for mitigation and adaptation does not coincide. It is often unclear which of the projects included in the cost estimates are already ongoing and have secured funding, and which ones are conditional upon future support.
Table 2 provides an overview of the financial needs of selected countries in Sub-Saharan Africa.34 On average, annual financial needs for adaptation amount to 70 percent of the needs for mitigation among the countries listed in Table 2. Four countries (Burkina Faso, Eritrea, Senegal and Togo) delineate higher needs per year for adaptation than for mitigation, by as much as 400 percent in the case of Eritrea. In comparison to other regions, SSA shows the highest average cost share of agriculture and LULUCF in mitigation (total sector expenditure), as well as the highest share of the agriculture sectors in total financial needs for adaptation.
33 To note, Nauru is describing its need for immediate and adequate financial, technical and capacity building support for loss and damage but does not quantify its needs in this regard.
34 It is important to note that quantitative comparisons need to be treated with caution due to data inconsistencies. For the sake of comparison, the numbers stated in the INDCs were reconciled so as to present annual financial needs of the countries. Even for this small sample, figures vary to a great extent.

52
]T
HE
AG
RIC
ULT
UR
E S
EC
TO
RS
IN T
HE
IN
TE
ND
ED
NA
TIO
NA
LLY
DE
TE
RM
INE
D C
ON
TR
IBU
TIO
NS
- A
NA
LYSI
S[
TA B L E 2 .
Financial needs per year of selected countries in Sub-Saharan Africa (in current Mio. USD)
TOTAL NEEDS MITIGATION AGRICULTURE
MITIGATION LULUCF
ADAPTATION AGR
Party/Region
Mitigation Adaptation Allocated Needed Allocated Needed Allocated Needed
Sub-Saharan
Africa
5,030 3,573 51 1,332 24 1,092 720 1,883
Angola 1,470 100 770* 250 10
Burkina Faso 188 581 65 22 65 142
CAR 220 144 25 2 4 31
Congo 1,254 908 353 630 81
Eritrea 46 203 107 138
Mauritania 820 627 126
Senegal 333 650 26 120 <0.01 5 32 10
Seychelles 28 27 3
Somalia <0.01 2 1
Togo 100 140 45* 21
Uganda 570 193 24 12
Zimbabwe 91* 582 1,309
*: number represents the needs for both conditional and unconditional measures
Some countries refer to specific international funds that are already financing parts of their respective INDCs and/or those that they will target in the future. Regarding possible funding sources across various sectors, about 24 percent of all countries mention the Green Climate Fund (GCF). Other funds mentioned include the Global Environment Facility and the Adaptation Fund; the Least Developed Countries Fund and the Special Climate Change Fund, as well as other bilateral and multilateral sources of funding, including United Nations programmes and organizations, foreign direct investments and soft loans.
7.4. CAPACITY BUILDING, KNOWLEDGE AND TECHNOLOGY TRANSFER NEEDSApproximately 60 percent of the countries express the need for general support related to technology transfer and capacity building. Technology transfer most often relates to renewable energy, energy optimization, mitigation and adaptation technologies, data collection and implementation of national R&D initiatives. With regard to capacity building, countries prioritize technical capacities, followed by capacity development for engaging stakeholders, and formulating mitigation and adaptation strategies and policies. More specific needs revolve around monitoring and evaluation, stakeholder involvement, policymaking, and awareness raising. However, less than 20 percent of countries provide information on the specific areas where they would like to receive international assistance. Most countries include only general references to their technology transfer and capacity building needs.
Regarding the agriculture sectors, technical needs frequently relate to the development of forest inventories and national planning systems, or approaches to reduce dependence on inefficient bioenergy technologies. Some countries also mention the current lack

53
DEVELOPING THE INDCS AND PLANNING THE IMPLEMENTATION OF THE NDCS
of technologies associated with MRV like geographic information systems and remote sensing.
Needs associated with capacity building were also identified, especially with regard to good practices for implementing sustainable forest management, including the use of technologies like GPS and cartography, and climate-smart agriculture. Countries also highlight the need for support in implementing afforestation and reforestation activities. Furthermore, countries request training on how to assess (or improve established methods for) GHG emissions and removals. Additionally, some countries mention the need to develop policies and/or establish institutions (e.g. through the implementation of initiatives such as REDD+).


55
In their INDCs countries have assigned a prominent role to the agriculture sectors for climate action. 89 percent of all countries refer to agriculture and/or LULUCF when outlining their mitigation contributions. Furthermore, nearly all the countries that include adaptation in their INDCs include priority areas for adaptation and/or adaptation actions in the context of the agriculture sectors. 74 countries explicitly refer to water resources in the context of adaptation in the agriculture sectors and 54 countries include food insecurity and malnutrition among the key risks they face under climate change. The agriculture sectors’s potential to deliver adaptation-mitigation synergies is also highlighted by several countries.Developing countries cannot deliver this climate action without international support. Throughout the INDCs, most developing countries highlight, in different levels of detail, their need for international financial support to support them with the costs of implementing their adaptation and mitigation contributions. In addition, international support is needed to enhance knowledge, foster appropriate technologies and strengthen national capacities. FAO is strongly committed to continuously support its member states in achieving their development goals and contributions to the convention. In addition to the analysis presented here, FAO has developed a complementary paper The agricultural sectors in nationally determined contributions (NDCs): Priority areas for international support. With these two papers FAO aims to contribute to enhancing the focus and coordination of development partner support towards assisting countries in implementing their INDCs.
CONCLUDING REMARKS


57
FAO. 2011: FAO-ADAPT. FAO’s framework programme on climate change adaptation. Rome (available at www.fao.org/docrep/014/i2316e/i2316e00.pdf).
FAO. 2016: Climate change and food security: risks and responses. Rome, (available at www.fao.org/3/a-i5188e.pdf).
Grassi, G., & Dentener, F. (2015). Quantifying the contribution of the Land Use sector to the Paris Climate Agreement. The LULUCF sector within the Intended Nationally Determined Contributions. JRC. doi:http://dx.doi.org/10.2788/096422
Höhne, N., Ellermann, C., & Fekete, H. 2014. Process guidance for Intended Nationally Determined Contributions (INDCs). International Partnership on Mitigation and MRV. http://mitigationpartnership.net/international-partnership-mitigation-and-mrv-2014-process-guidance-intended-nationally-determined--0
Holdaway, E., Dodwell, C., Sura, K., & Picot, H. 2015. A Guide to INDCs. Ricardo-AEA/CDKN. http://mitigationpartnership.net/sites/default/files/u2055/cdkn-ricardo-aea-guide-to-indcs_final_web.pdf
Holmes, K., & Ramage, A. 2015. The Land Sector and Country Commitments to global Climate Action: A Rainforest Alliance Assessment of Intended Nationally Determined Contributions (INDCs). New York, N.Y.: Rainforest Alliance. Retrieved from www.rainforest-alliance.org/sites/default/files/publication/pdf/INDC-Assessment_12-4-5_Final.pdf
Levin, K., Rich, D., Bonduki, Y., Comstock, M., Tirpak, D., McGray, H., Waskow, D. (2015). Designing and Preparing Intended Nationally Determined Contributions (INDCs). WRI/UNDP. Retrieved from http://mitigationpartnership.net/sites/default/files/indcs_may27_v2.pdf
Petersen, K., & Braña Varela, J. 2015. INDC Analysis: An Overview of the Forest Sector. Retrieved from http://d2ouvy59p0dg6k.cloudfront.net/downloads/r2_wwf_indc_brief.pdf
Richards, M., Bruun, T., Campbell, B., Gregersen, L., Huyer, S., Kuntze, V., Vasileiou, I. 2015. How countries plan to address agricultural adaptation and mitigation. An analysis of Intended Nationally Determined Contributions. CCAFS: CGIAR. Retrieved from https://cgspace.cgiar.org/rest/bitstreams/63683/retrieve
South Centre. May 2015. Policy Brief on Intended Nationally Determined Contributions (INDCs). Climate Policy Brief (17). Retrieved from www.southcentre.int/wp-content/uploads/2015/05/CPB17_Intended-Nationally-Determined-Contributions_EN.pdf
UNFCCC. 2015. Synthesis report on the aggregate effect of the intended nationally determined contributions. Retrieved from http://unfccc.int/resource/docs/2015/cop21/eng/07.pdf
UNFCCC (2016) Aggregate effect of the intended nationally determined contributions: an update. Retrieved from http://unfccc.int/documentation/documents/advanced_search/items/6911.php?priref=600008946
REFERENCES

58
]T
HE
AG
RIC
ULT
UR
E S
EC
TO
RS
IN T
HE
IN
TE
ND
ED
NA
TIO
NA
LLY
DE
TE
RM
INE
D C
ON
TR
IBU
TIO
NS
- A
NA
LYSI
S[
Wienges, S., Zachow, I., von Lüpke, H., Neubert, A., Harthan, R., & Siemons, A. 2015. How to advance Intended Nationally Determined Contributions. International Partnership on Mitigation and MRV. Retrieved from http://mitigationpartnership.net/sites/default/files/2015-how_to_advance_indcs.pdf
Convention on Biological Diversity CBD. 2008 . The potential impacts of biofuels on biodiversity - matters arising from SBSTTA recommendation XII/7; Note by the Executive Secretary; UNEP/CBD/COP/9/26
WRI. 2016, CAIT Climate Data Explorer. 2016. CAIT Paris Contributions Map. Washington, DC: World Resources Institute. Available at: http://cait.wri.org/indcs/
Zeleke, A., Phung, T., Tulyasuwan, N., & O’Sullivan. 2016. Role of Agriculture, Forestry, and Other Land Use Mitigation in INDCs and National Policy in Asia. LEDS Global Partnership - Agriculture, Forestry and Land Use (AFOLU) working Group. Retrieved from http://ledsgp.org/wp-content/uploads/2016/01/Role-of-AFOLU-mitigation-in-INDCs-and-nat-policy-in-Asia-review-draft-Nov-24-2015.pdf

59
A. METHODOLOGY
A.1 ApproachThis chapter provides a brief overview of the challenges, approaches and assumptions underlying the screening and analysis of the INDCs.
While the interim report included the 161 INDCs that had been submitted to the UNFCCC until 31 March 2016, corresponding to 188 countries and 189 Parties, this updated report covers the 162 (I)NDCs that were communicated by 29 July 2016. The report thus considers resubmissions of INDCs (one country) as well as changes in those INDCs that had already been ratified by national governments (and were thus submitted to the NDC portal, 22 countries).
Data collection and organizationThe systematic investigation of the INDCs entails a set of methodological challenges owing to the aggregate volume of the documents (totaling more than 2 000 pages) and the heterogeneity and depth of content.
The underlying methodology of the findings in this report aimed to consider these aspects as much as possible prior to the data gathering. In order to ensure a systematic screening, a data structure was developed, containing the information blocks outlined by UNFCCC (2016) and refined/extended by categories of special interest to the agriculture sectors. Subsequently, each INDC was screened for the respective criteria. Due to the heterogeneity of the documents, each document was studied in full detail in order to ensure the complete coverage of the agriculture sectors. In order to evaluate the significance of these sectors relative to others in a coherent framework and take into account cross-cutting areas (e.g. bioenergy, water, DRM), the data collection also included other information elements not specific to the agriculture sectors. The coverage of the full INDCs also gives a benchmark for comparison with other INDC analyses at a more aggregated level (such as UNFCCC 2016).
All INDCs were read throughout to extract all relevant original text fragments. These text fragments were added to a raw (text) database. This process helped to facilitate the replication and re-examination of the screening process. On the basis of this raw database, a binary database was constructed. The binary database contains 200 categories of which 190 categories have been used for this report.
In order to test for the robustness of the database, categories were cross-checked by keyword search reflecting the range of terms used in the INDCs and compared with other
ANNEX

60
]T
HE
AG
RIC
ULT
UR
E S
EC
TO
RS
IN T
HE
IN
TE
ND
ED
NA
TIO
NA
LLY
DE
TE
RM
INE
D C
ON
TR
IBU
TIO
NS
- A
NA
LYSI
S[
more general publications and databases on INDCs, most notably with UNFCCC (2016) and the CAIT Explorer from the WRI (2016). Regarding the agriculture sectors, data were compared at country level to the CCAFS database (2016) where applicable.
The following rules underlie this report:General Remarks(a). The analysis is entirely based on information communicated by Parties in their
INDCs until 29 July 2016. Revised submissions of INDCs as well as NDCs were considered until that date
(b). Until 29 July 2016, 162 INDCs were submitted to the UNFCCC, corresponding to 189 countries and 190 Parties, respectively.35 Countries mostly provided the documents in English, Spanish, French; INDCs formulated in other languages such as Russian, Arabic and Chinese were accompanied by official translations. When possible, official translations from the Parties are used in the screening analysis. The INDCs of two countries (Iraq and Kuwait) are covered only in broad categories (sectors for mitigation and/or adaptation) based on the WRI compilation (WRI 2016), as no official translation into English is available up to date.
(c). The report does not include in its analysis any other policy or target not communicated by Parties as part of their INDCs, nor does it consider any information provided in other documents (such as sectoral plans or other documents related to the convention) mentioned in the INDCs regarding planning, formulation and/or implementation of the contributions.
Mitigation(a). Mitigation contributions in agriculture and LULUCF are assessed along IPCC
guidelines on GHG inventories. Mitigation activities thus follow the categorization outlined in AR4, WG III. Agriculture and LULUCF are assessed based on the overall information provided by the INDCs irrespective of the conditionality of the contributions.
(a). Countries’ contributions by sectors are assigned either by: (1) explicit statement under sector coverage; (2) implicit statement under sector coverage (e.g. all sectors under IPCC; according to the guidelines of IPCC); or implicitly through actions (i.e policies, plans, strategies and measures) stated under mitigation;
(a). Note that bioenergy is discussed separately from mitigation contributions in agriculture and/or LULUCF, as the overall impact on GHG emissions depends on various factors. This means that countries that refer to bioenergy only are not accounted for in the individual sector coverage (agriculture and LULUCF). Instead, bioenergy is briefly discussed in Section 3.3.
(a). Mitigation co-benefits of adaptation actions are separately discussed in Chapter 6 and are not factored in the overall coverage of agriculture and/or LULUCF in the
35 Latvia submitted the INDC on behalf of the European Union which counts for 29 Parties (28 member states and the European Union). The following Parties had not provided (I)NDCs at the 29 July 2016: Libya, Nicaragua, The People’s Republic of Korea, Palestine, the Syrian Arab Republic, Timor-Leste, Uzbekistan.

61
ANNEX
mitigation contributions. Unless stated otherwise, percentages refer to all countries submitted (189 countries).
Adaptation(a). Only countries that refer to concrete information on priority areas for adaptation
and/or adaptation actions were considered in Chapter 5. In addition to these 134 countries, five other Parties also include an adaptation component in their INDC: Azerbaijan, Pakistan and Ukraine consider or support adaptation actions in this regard in the future. Serbia lists vulnerable sectors and loss and damages in the past together with an estimate of the related investment costs without elaborating on future adaptation strategies or costs, and is thus represented in Chapter 4. The Federated States of Micronesia (FSM) acknowledge their adaptation needs and the relevance of this topic, but do not see the INDC as the right vehicle to address them. Instead, FSM, among further countries (e.g. Australia, New Zealand, Norway, Palau and Turkey), point to other policy frameworks and documents that discuss their adaptation strategies.
(b). Regarding adaptation areas and actions, the analysis follows FAO’s framework programme for climate change adaptation (FAO-Adapt). Thus, the agriculture sectors are understood to include agriculture (i.e. crops and livestock), trees, forest products, fisheries and aquaculture, rangelands, soils, land, water, biodiversity, genetic resources, and the specific agro-, aquatic and forest ecosystems and human systems involved in the production systems (see also FAO 2011, 13). Food security as a relevant area for climate change adaptation was also subsumed under agriculture sectors.
(c). All actions - implemented or ongoing, planned or envisaged - were considered. Actions thereby refer to both policies (such as national or sectoral plans, programmes related to the Convention and other policy frameworks) and legislative measures, as well as measures on the ground. Policies were only counted if they were explicitly covering the agriculture sectors.
(d). Actions pointing to the protection, conservation or restoration of the agro, forest or aquatic ecosystem were taken into account and counted for the respective sector, following the integrated approach by FAO, if a direct reference was included in the text.
(e). Actions that are outlined in the scope of technology transfer or capacity building needs were also taken into account for both sector coverage and actions.
(f). In order to capture the agriculture sectors as comprehensively as possible, indirect references were also considered, in particular related to sector vulnerabilities and livelihood options. Sectors that are stated as vulnerable without explicitly being mentioned as areas of adaptation were also accounted for in the overall sector coverage, if the country states concrete adaptation actions that aim at reducing these vulnerabilities. Countries that refer to actions related to the improvement of livelihood were considered under the respective agriculture sectors in the case that the context allows a clear assignment in this regard. Countries that only

62
]T
HE
AG
RIC
ULT
UR
E S
EC
TO
RS
IN T
HE
IN
TE
ND
ED
NA
TIO
NA
LLY
DE
TE
RM
INE
D C
ON
TR
IBU
TIO
NS
- A
NA
LYSI
S[
indirectly refer to agriculture sectors were accounted for in the total coverage of the respective sector, but not in the actions. This approach facilitates the comparison with other databases with more stringent assignment rules.
(g). Unless stated otherwise, percentages refer to countries that include concrete information on adaptation areas and/or actions (134 countries).
A.2 Country ClassificationUnder UNFCCC, the 197 Parties have different commitments based on their status of
economic development. For this reason, a hybrid version was chosen for the presentation of the findings in this report reflecting both economic conditions and regions. It is aligned with the classification by UN/DESA (WESP 2016) which subsumes countries in the following three mutually exclusive groups (the number of countries that submitted INDCs in the respective regional grouping is shown in round brackets):
Developing countries (including LDCs)36, which can be grouped in the following six regions (139 countries in total, 133 of which submitted INDCs):
1. Eastern and South Eastern Asia (13)2. Latin America and Caribbean [Central America, South America, Caribbean] (32)3. Northern Africa and Western Asia (16)4. Southern Asia (9)5. Sub-Saharan Africa [Middle, Western, Southern, Eastern Africa, including Sudan]
(49)6. Oceania (14)Within this group, all countries represent Non-Annex-I (NAI) Parties to the
Convention. The 47 LDCs are given special consideration under the Convention due to their vulnerability and low adaptive capacity to climate change.
Countries with economies in transition from South-Eastern Europe and the Commonwealth of Independent States, including Georgia, Albania, Bosnia and Herzegovina, Montenegro, Serbia, Macedonia, Armenia†, Azerbaijan†, Belarus, Georgia†, Kazakhstan, Kyrgyzstan, Republic of Moldova, the Russian Federation, Tajikistan, Turkmenistan, Ukraine, Uzbekistan (17 countries in total, 16 of which submitted INDCs).
All but three countries are in Southern Europe and Central Asia according to the UN standard country classification M49. † Except for Belarus, the Russian Federation, and Ukraine all economies in transition are NAI Parties.
Developed countries from Europe (EU-28 plus Andorra, Iceland, Liechtenstein, Norway, Monaco, San Marino, Switzerland)), Northern America (Canada, US), Australia, Japan, New Zealand (40 countries and 41 Parties in total, all of which submitted INDCs). All but two countries are AI Parties.
36 Square brackets refer to respective FAO subregions.†These countries are subsumed under Western Asia according to the UN standard country classification M49 from 2013.

63
ANNEX
B. CLIMATE-SMART AGRICULTURE (CSA) IN THE INDCs
COUNTRIES THAT REFER TO CSA IN THE INDCs
Country Original text from the INDC
1 Bhutan • Promote climate smart livestock farming practices to contribute towards poverty alleviation and self-sufficiency through:
• Organic livestock farming and eco‐friendly farm designs;
• Improvement of livestock breeds, including conservation of native genetic gene pool/diversity;
• Expansion of biogas production with stall feeding;
• Agro‐forestry or agro‐silvo pastoral systems for fodder production.
Promote climate smart agriculture to contribute towards achieving food and nutrition security through:
• Organic farming and conservation agriculture;
• Development and promotion of sustainable agricultural practices;
• Integration of sustainable soil and land management technologies and approaches.
2 Botswana Climate Smart Agriculture which include techniques such as low to zero tillage, multi-cropping to increase mulching which reduce evapotranspiration and soil erosion.
3 Burundi Promotion of climate-smart agriculture (agrometeorology); Integration of smart agriculture into the National Agricultural Investment Programme (NAIP).
4 Cambodia Promoting climate resilient agriculture in coastal areas through building sea dykes and scaling-up of climate-smart farming systems.
5 Central African Republic
The inclusion of climate-sensitive agroecological approaches (smart agriculture) in the PNIASAN with a view to increasing productivity and yield may make it possible to keep each farmer on the same original parcel of land for five years, which will make it possible to minimise or complete avoid increases in area and thus capitalise the deforestation (28%) avoided over the four years following the start-up of the project.
6 Equatorial Guinea* Convertir a Guinea Ecuatorial en un país de referencia en concepto de agricultura climáticamente inteligente para las zonas tropicales con los objetivos de garantizar la seguridad alimentaria, diversificar la economía nacional, limitar las emisiones de metano y óxido nitroso, así como favorecer la captación de carbono.
7 Eritrea Eritrea has been undertaking vigorous efforts to enhance Climate Smart Agriculture.
8 Ghana** Agriculture resilience building in climate vulnerable landscapes: [...] Scale up penetration of climate smart technologies to increase livestock and fisheries productivity by 10%.
9 Haiti* Développer la bio-économie, l'agriculture climato-intelligente et biologique.
10 Islamic Republic of Iran**
Modern and eco-friendly and climate smart agricultural technology and practices for scattered local communities in 2/3 of the country’s area.
* = Countries with similar terms in original language
** = Countries that state “climate-smart” in combination with other terms (techniques, fishery systems, etc.)

64
]T
HE
AG
RIC
ULT
UR
E S
EC
TO
RS
IN T
HE
IN
TE
ND
ED
NA
TIO
NA
LLY
DE
TE
RM
INE
D C
ON
TR
IBU
TIO
NS
- A
NA
LYSI
S[
COUNTRIES THAT REFER TO CSA IN THE INDCs
Country Original text from the INDC
11 Jordan* Raising awareness and declarations on Climate Intelligent Agriculture and promoting utilization of renewable energy and uses in agricultural and food production sector for cooling and heating purposes, for example in poultry production, nurseries, green houses, olive mill, etc.
12 Kenya Climate smart agriculture (CSA) in line with the National CSA Framework.
13 Liberia** Develop and implement climate smart fishery systems to enhance the adaptive capacity and resilience of fisher communities.
14 Madagascar Large scale implementation of conservation agriculture and climate-smart agriculture; smart use of marine resources.
National Food Security assured through a large scale implementation of Resilient Agriculture Integrated Models (climate-smart agriculture) in major agricultural centres.
Development and implementation of sustainable fishing management plans, strengthening of institutional capacity and adaptation of infrastructure (quay) to climate change (sea level rise).
15 Malawi The mitigation measures suggested in the agricultural sector will unconditionally contribute 100 Gg CO2 equivalent mainly from reduced synthetic fertilizer application, and around 400 Gg CO2 equivalent per annum from implementing climate smart agriculture extensively by 2040, conditional upon support.
16 Mali Le Programme pilote de développement d’une agriculture intelligente et résiliente aux changements climatiques.
Développement d’une agriculture intelligente et résiliente aux changements climatiques, pour l’aménagement hydro-¬‐agricole de 92 000 ha dans le contexte d’une gestion durable des terres avec l’engagement de l’Etat à consacrer 15% du Budget national à l’agriculture.
17 Mauritius Climate smart agriculture including bio-farming.
Irrigation Techniques: Promote climate smart agriculture practices.
18 Myanmar The agriculture sector is implementing climate smart agriculture approaches through implementation actions such as legume crops diversification, measures in the agro-forestry sector and systematic control of soil quality and irrigation water.
19 Namibia Reducing chemical fertilizers by 20 percent through conservation and climate smart agricultural practices, use of organic manure and composts.
Promotion of climate smart agriculture and conservation agriculture.
* = Countries with similar terms in original language
** = Countries that state “climate-smart” in combination with other terms (techniques, fishery systems, etc.)

65
ANNEX
COUNTRIES THAT REFER TO CSA IN THE INDCs
Country Original text from the INDC
20 The Niger Niger’s strategy is based on the vision of climate-smart agriculture; The climate-smart agriculture support project of HC-13N, financed by the World Bank in the amount of US $111 million beginning in 2016 and lasting five years in 20 departments.
The co-benefits in the AFOLU sector consist of the results of implementing and upscaling the climate-smart agriculture activities; the techniques of climate-smart agriculture are consistent with the objectives of the INDC (adaptation, mitigation and food security) by strengthening grassroots development.
21 Nigeria Climate smart agriculture and reforestation.
22 Seychelles The Ministry anticipates additional resources being committed to enhance human capacity development at the Seychelles Agricultural Agency, revitalising the extension services and also providing opportunities for young Seychellois to study climate-smart and ecosystem-based approaches to agriculture, put in place programmes for sustainable industrial and artisanal fisheries, sustainable mariculture, promote home gardening, improve port infrastructure for artisanal and industrial fisheries, reduce illegal, unreported and unregulated activities; and continue to support the insurance scheme for farmers and fishers.
23 Sierra Leone Adoption and application of climate-smart and conservation agriculture through best agricultural practices that enhance soil fertility and improve crop yield.
24 South Sudan South Sudan will thus embark on promoting sustainable, climate smart agriculture and livestock production and management.
25 Sri Lanka Climate smart villages for farming.
26 Swaziland Reduce vulnerability to the impacts of climate change by building adaptive capacity and resilience through water security, climate-smart agriculture.
27 Togo Commitment to the Climate-Smart Agriculture process in the framework of the implementation of the agricultural policy laid out by ECOWAS and NEPAD.
28 Uganda Sustainable Land Management (SLM) and Climate Smart Agriculture (CSA) will be scaled up to increase resilience at the grassroots level; Climate Smart Agriculture techniques for cropping (Agricultural soils: 36 percent of national GHG emissions (13.5 Million tons of carbon dioxide equivalent per year (MtCO2eq/yr)) in 2000).
29 United Republic of Tanzania
Increasing yields through inter alia climate smart agriculture.
30 Uruguay In particular, as a result of the 2010 Climate-Smart Agriculture Policy, Uruguay has made, and will continue to make, efforts to build a more efficient, resilient and low-carbon cattle farming sector, by introducing new technologies and incorporating successful experiences undertaken by other countries with similar characteristics.
* = Countries with similar terms in original language
** = Countries that state “climate-smart” in combination with other terms (techniques, fishery systems, etc.)

66
]T
HE
AG
RIC
ULT
UR
E S
EC
TO
RS
IN T
HE
IN
TE
ND
ED
NA
TIO
NA
LLY
DE
TE
RM
INE
D C
ON
TR
IBU
TIO
NS
- A
NA
LYSI
S[
COUNTRIES THAT REFER TO CSA IN THE INDCs
Country Original text from the INDC
31 Zambia Conservation/ Smart agriculture.
To promote conservation/ smart agriculture activities leading to adaptation benefits and enhancing climate resilience, especially in rural areas, and generation of electricity from agriculture waste.
32 Zimbabwe The agricultural sector also provides opportunities for climate change mitigation through initiatives such as Climate Smart Agriculture (CSA) and sustainable agro-forest-based adaptation and management practices.
Zimbabwe commits to promoting adapted crop and livestock development and climate smart agricultural practices through the following interventions:
• Strengthening capacities to generate new forms of empirical knowledge, technologies (including conservation agriculture) and agricultural support services that meet climate challenges;
• Promoting the use of indigenous and scientific knowledge on drought tolerant crop types and varieties and indigenous livestock that are resilient to changes in temperatures and rainfall;
• Developing frameworks for sustainable intensification and commercialization of agriculture at different scales across agro ecologies.
* = Countries with similar terms in original language
** = Countries that state “climate-smart” in combination with other terms (techniques, fishery systems, etc.)

67
ANNEX
C. RELATED INDC ASSESSMENTS37
Several analyses have been conducted on INDCs ahead and in the aftermath of COP 21, differing in scope (global or regional), content (focusing on specific sectors or elements in the INDCs) and level of detail.38
The UNFCCC Synthesis Report (2015) is the most comprehensive assessment to date. It assesses the extent to which the INDCs contribute to the goal of keeping global warming to 2°C relative to pre-industrial levels and which role the sectors most responsible for anthropogenic GHG emissions – energy, agriculture, forest and land use, industries and waste – play in this regard. The report acknowledges that the INDCs account for land use, land use change and forestry (LULUCF) in different ways, which renders assessments of this sector quite difficult. The aggregate impact of adaptation commitments was not calculated due to methodological uncertainties. Instead, information on adaptation was synthetized by highlighting certain areas and trends.
Apart from the UNFCCC Synthesis Report, the land use sector was not analyzed in a comprehensive manner, as studies either centered on agriculture (CGIAR, LEDS) or LULUCF (JRC, WWF).
The CGIAR Research Program on Climate Change, Agriculture and Food Security (CCAFS) developed a series of documents to analyze the role of the agriculture sectors in the INDCs that had been submitted by mid-November 2015. As such, their assessments focused on 133 INDCs representing 160 countries. The CCAFS assessments were conducted using a keyword search to quantify mitigation and adaptation aspects.
Other assessments focus on certain regions or selected countries: The Rainforest Alliance carried out an in-depth review of agriculture and LULUCF
for 22 submissions, focusing in particular on forested countries in the tropics. The study includes countries in which the agriculture sectors are particularly important, as well as some developed and emerging economies that will likely influence trends in the land use sector. The review aims to provide relevant information on forestry, deforestation, climate smart agriculture and adaptation of vulnerable communities to climate change.
The Joint Research Centre (JRC) analyzed different mitigation perspectives in the LULUCF sector. The study compares expected net emissions in 2030 (from conditional and unconditional pledges) against countries’ business-as-usual (BAU) and pre-INDC scenarios, as well as the share of LULUCF in these contributions. Due to a lack of historical data, the analysis is based on 46 INDCs representing 74 countries.
For example, the Low Emissions Development Strategies Global Partnership (LEDS) assessed the role of agriculture and LULUCF in the INDCs of seven Asian countries (Bangladesh, Cambodia, India, Indonesia, Lao People’s Democratic Republic, Thailand, and Vietnam). The analysis compares the projected emissions reduction potential to the respective national emission profile for each INDC. The analysis focuses on existing (and potential) mitigation commitments, and has a strong focus on the corresponding financial needs.
37 Non-exclusive list38 Note that the list of studies presented here does not constitute a complete or exhaustive presentation of existing analyses on
INDCs.

NOTES

NOTES

NOTES

Background image in this page
Cover images:
elaborated from “L’Encyclopédie Diderot et D’Alembert”
©FAO/Antonello Proto©FAO/Joan Manuel Baliellas©FAO/Daniel Hayduk

61
61
EN
VI
RO
NM
EN
T [
CL
IM
AT
E
CH
AN
GE
]
EN
VI
RO
NM
EN
T A
ND
NA
TU
RA
L R
ES
OU
RC
ES
MA
NA
GE
ME
NT
WO
RK
IN
G P
AP
ER
Th
e a
gricu
lture
secto
rs in th
e In
ten
de
d N
atio
na
lly D
ete
rmin
ed
Co
ntrib
utio
ns: A
na
lysis
FAO
THE AGRICULTURE SECTORS IN THE INTENDED NATIONALLY DETERMINED CONTRIBUTIONS: Analysis
Climate and Environment Division (NRC) Publications
Food and Agriculture Organization of the United Nations (FAO)
www.fao.org/climate-change


![THE INTENDED NATIONALLY DETERMINED CONTRIBUTIONS ... · PDF fileiv THE AGRICULTURE SECTORS IN THE INTENDED NATIONALLY DETERMINED CONTRIBUTIONS - ANALYSIS] [Figure 1. Percentage of](https://static.fdocuments.net/doc/165x107/5a7de13a7f8b9a66798dfe6b/the-intended-nationally-determined-contributions-the-agriculture-sectors-in.jpg)