The Intelligent Campus - for 21st Century...
35
The Intelligent Campus - for 21 st Century Education Robert Smith Education Solutions Specialist – APAC [email protected]
-
Upload
nguyenmien -
Category
Documents
-
view
215 -
download
1
Transcript of The Intelligent Campus - for 21st Century...

The Intelligent Campus -for 21st Century Education
Robert Smith
Education Solutions Specialist – APAC

Indonesian Education has Changed

THE WORLD HAS CHANGED

T H E W O R L D S L A RG E S T TA X I CO M PA N Y. . . O W N S N O TA X I ’ S – U B E R
T H E W O R L D S L A RG E S T H OT E L CO M PA N Y O W N S N O H OT E L S - A I R B N B
W h a t i f… I N D O N E S I A’s L A RG E S T U N I V E R S I T Y I S N ’ T I N I N D O N E S I A …
W h a t i f… JA K A RTA’s L A RG E S T U N I V E R S I T Y H A S N O S T U D E N T S I N JA K A RTA …

THE WORLD IS NOW A
GIANT NETWORK
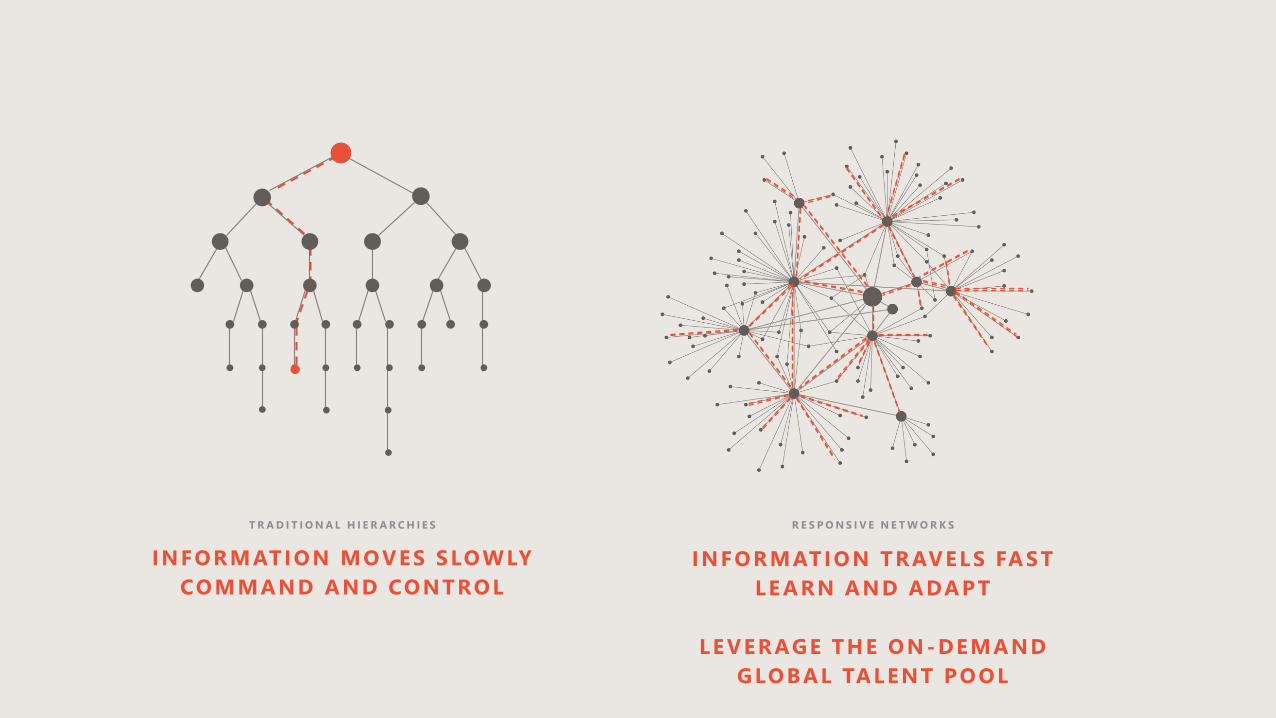
INFORMATION MOVES SLOWLY
COMMAND AND CONTROL
T R A D I T I O N A L H I E R A R C H I E S
INFORMATION TRAVELS FAST
LE ARN AND ADAPT
LEVERAGE THE ON -DEMAND
GLOBAL TALENT POOL
R E S P O N S I V E N E T W O R K S

Always mobile, always moving
Collaborate early, often, and always
Grown up on social networks
THE MODERN STUDENT
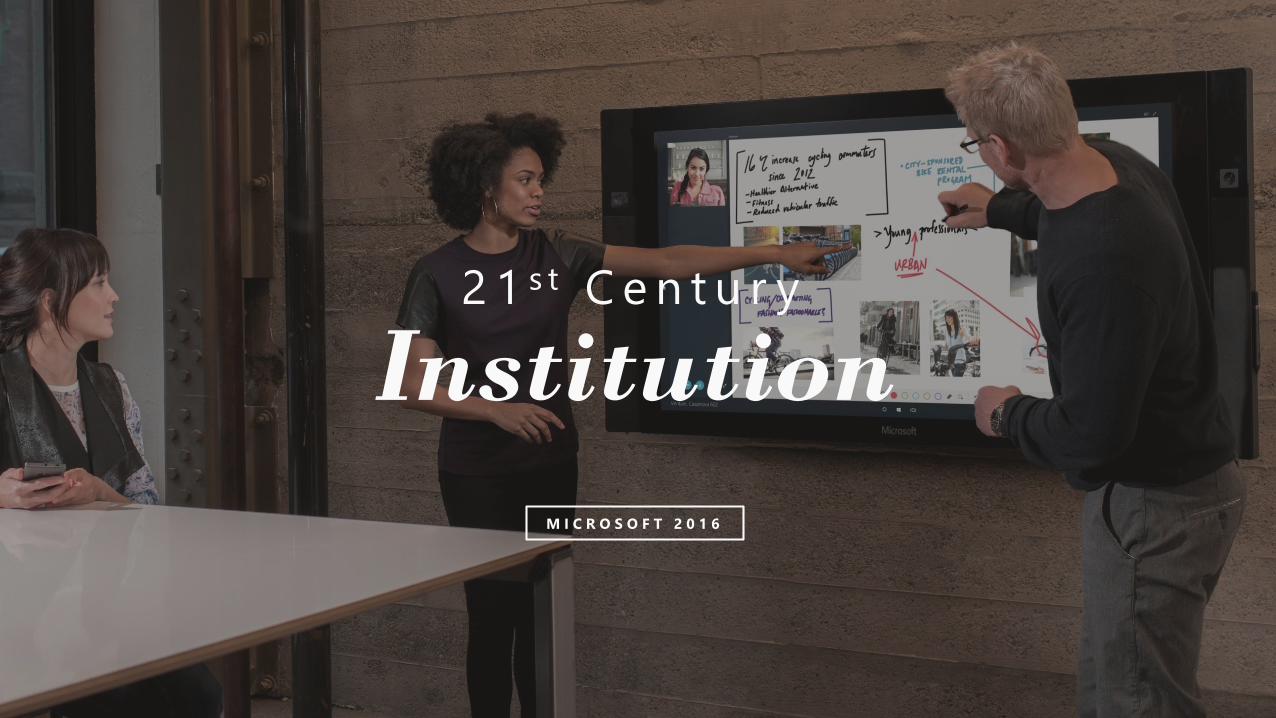
Institution2 1 s t C e n t u r y
M I C R O S O F T 2 0 1 6
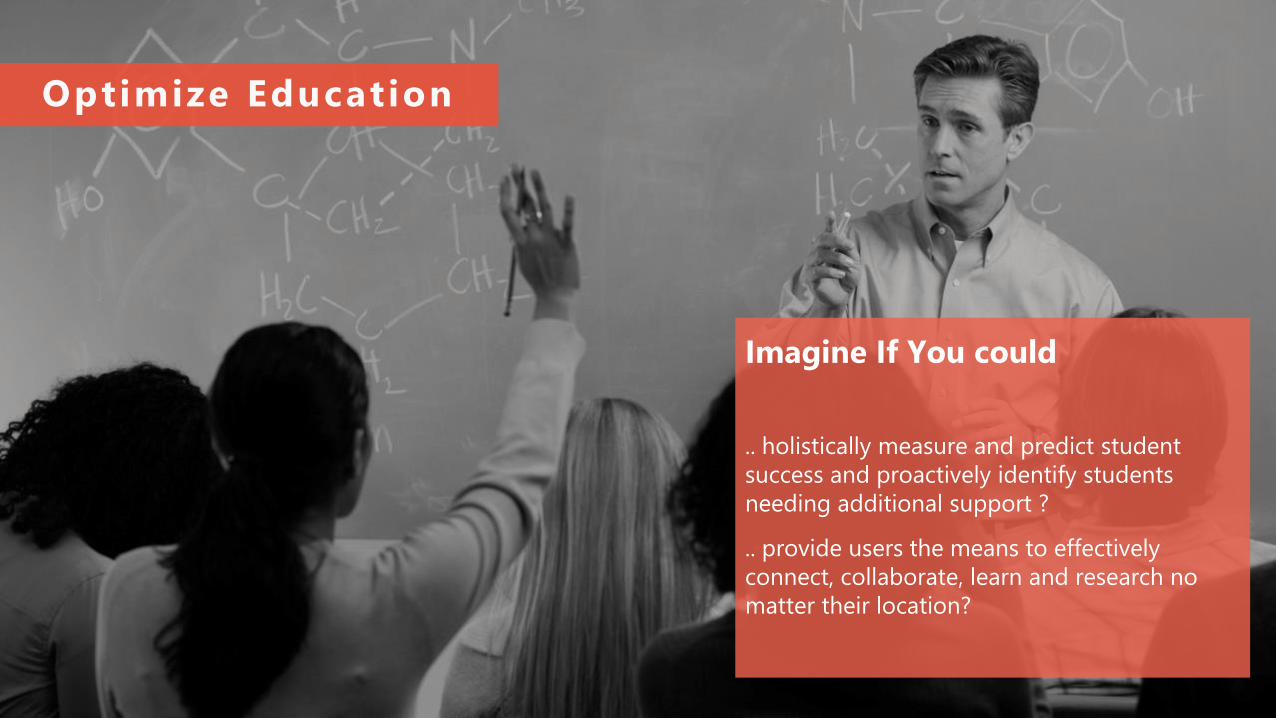
Student Use BenefitBuy Office for your Faculty and Staff, students included at no extra costOptimize Education
Imagine If You could
.. holistically measure and predict student
success and proactively identify students
needing additional support ?
.. provide users the means to effectively
connect, collaborate, learn and research no
matter their location?
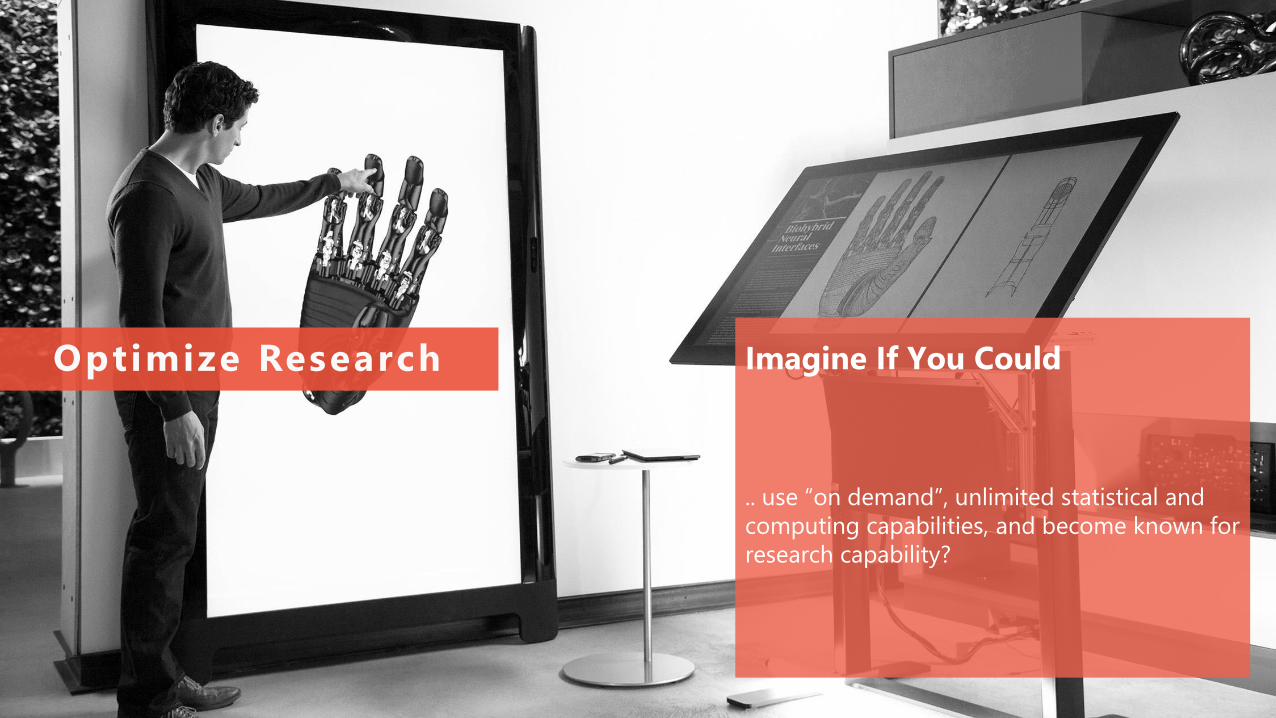
Optimize Research Imagine If You Could
.. use “on demand”, unlimited statistical and
computing capabilities, and become known for
research capability?
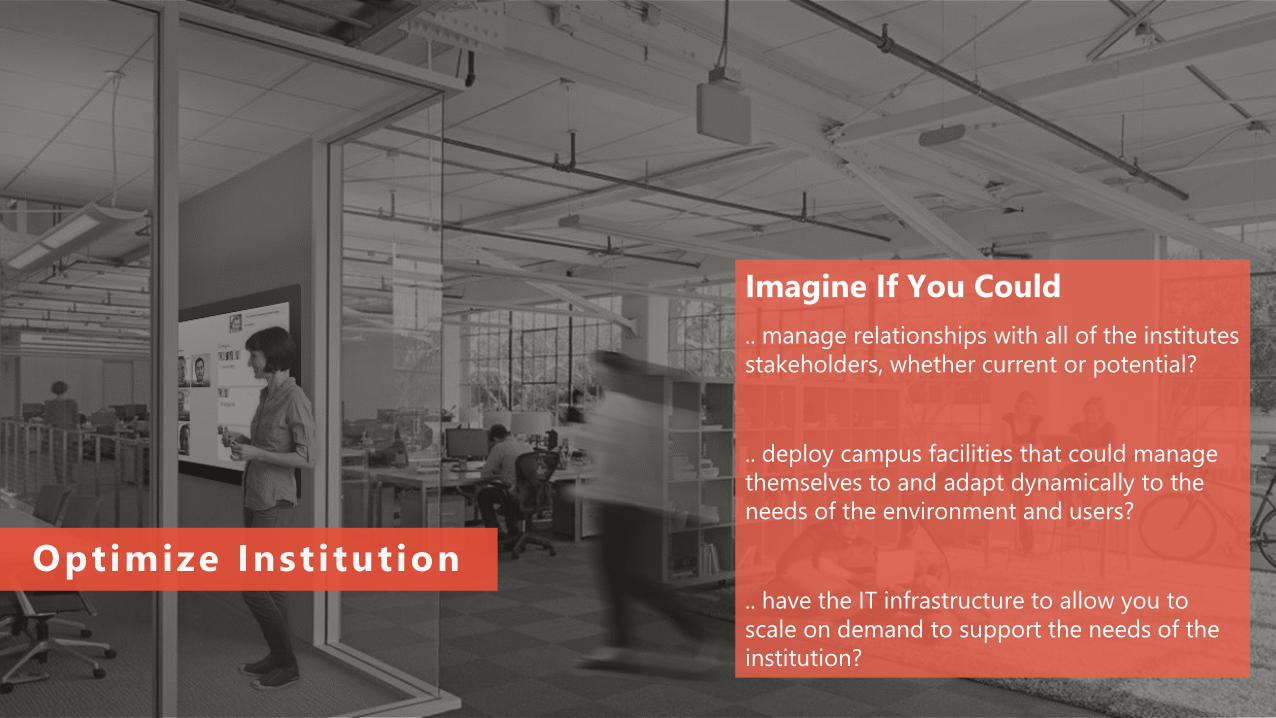
Optimize Inst itution
Imagine If You Could
.. manage relationships with all of the institutes
stakeholders, whether current or potential?
.. deploy campus facilities that could manage
themselves to and adapt dynamically to the
needs of the environment and users?
.. have the IT infrastructure to allow you to
scale on demand to support the needs of the
institution?

Empower Every Educator,
Student, Researcher,
Administrator and Parent to
Achieve More
Intelligent Platform to
Empower Stakeholders & the
Institution

How our solutions transform your institution
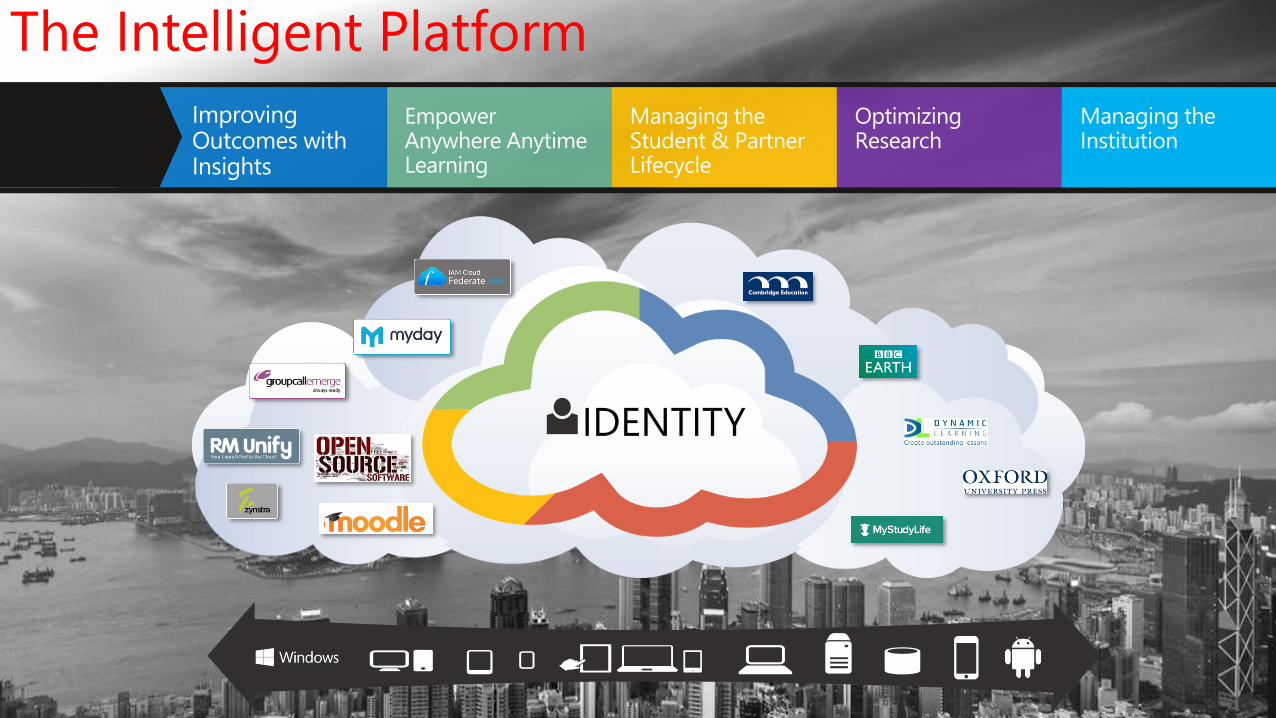
The Intelligent Platform

The Intelligent Platform
Microsoft
Azure
IDENTITY
The Intelligent Platform


Improving Outcomes with Insights
Robert Smith
Education Solutions Specialist – APAC
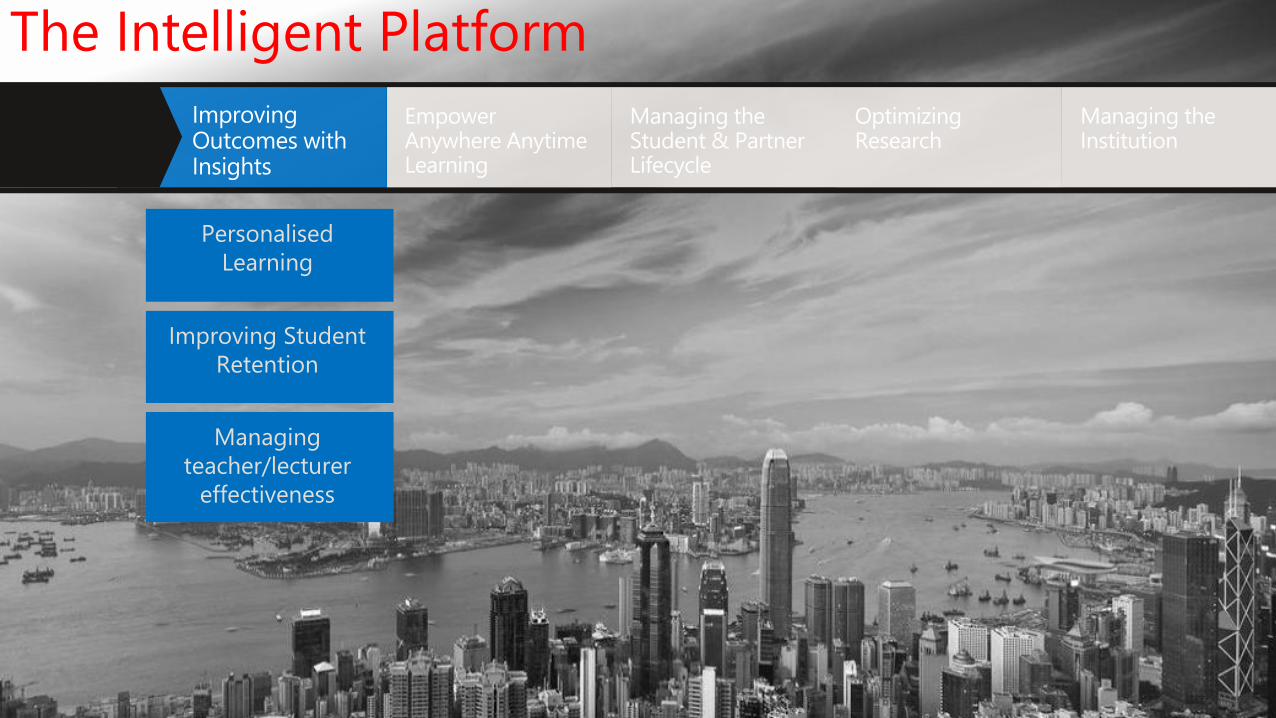
Personalised
Learning
Improving Student
Retention
Managing
teacher/lecturer
effectiveness
The Intelligent Platform

Imagine if you could resolve critical
education challenges by arming
stakeholders with the data and analytics
they needed to generate insights, take
proactive action, and improve outcomes.

Equipment reliability
Graduation rates
School and region rankings
Personalized
learning
Heating and A/C optimization
Enabling at-risk and
disabled students
Book store sales Student achievement
Bullying prevention
Teacher
effectiveness
Student enrollment and
retention
Parking
optimization Cafeteria
improvements
Marketing
effectiveness
Real-World Improvements Through
Data

Improving Outcomes with Insights
Find, combine, manageForm theories, analyze,
predict, visualize Take action,
operationalize

Beyond Business Intelligence
Source: Gartner
VA
LU
E
DIFFICULTY
Descriptive Analytics
DiagnosticAnalytics
Predictive Analytics
Prescriptive Analytics

Personalized Learning Powered by The Intelligent Platform
Show me???
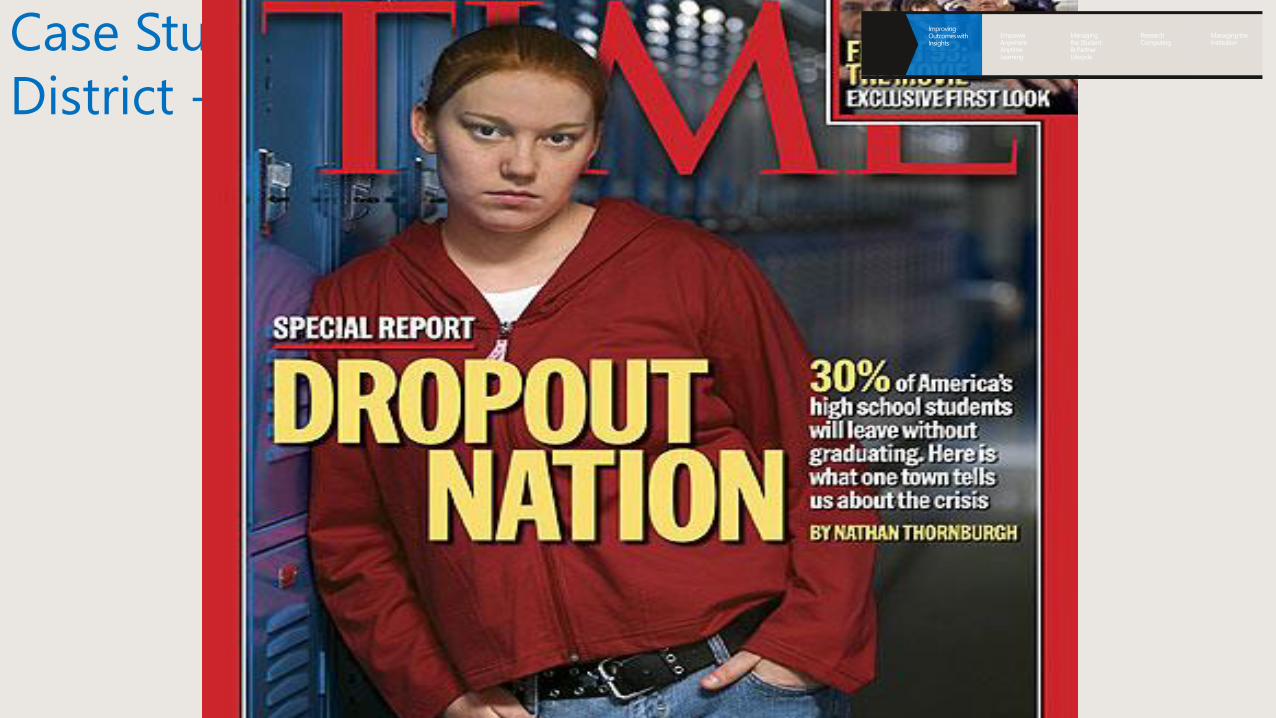
Case Study – Tacoma Schools
District - Seattle

Case Study – Tacoma Schools
District - Seattle
http://www.dropoutprevention.org/ At Clemson University
1. After School Opportunities
2. Alternative Schooling
3. Mentoring/Tutoring
4. Service-Learning
Four Core Dropout
Prevention Strategies
Show me???

Source Data
• Historical performance
• Student demographic
and Census
• Diagnostic
• Disciplinary
• Extra-Curricular
• Health
Excel
Existing Worksheets
Power BI
Visualization
Step1: Start with tool you know
well, and data you already have
Step2: Leverage the most
powerful cloud on the planet
Massive Data: No Problem
Complexity: No Problem
Step3:
Leverage Self
Service BI
How it works?

Architecture
• HDFS
• RDBMS
• NoSQL stores
• Blobs and tables
ML
Studio
API
Marketplace
• Data factory• Stream analytics
• Machine learning• HDInsight
• Marketplace• Azure portal
• Power BI• Apps
33
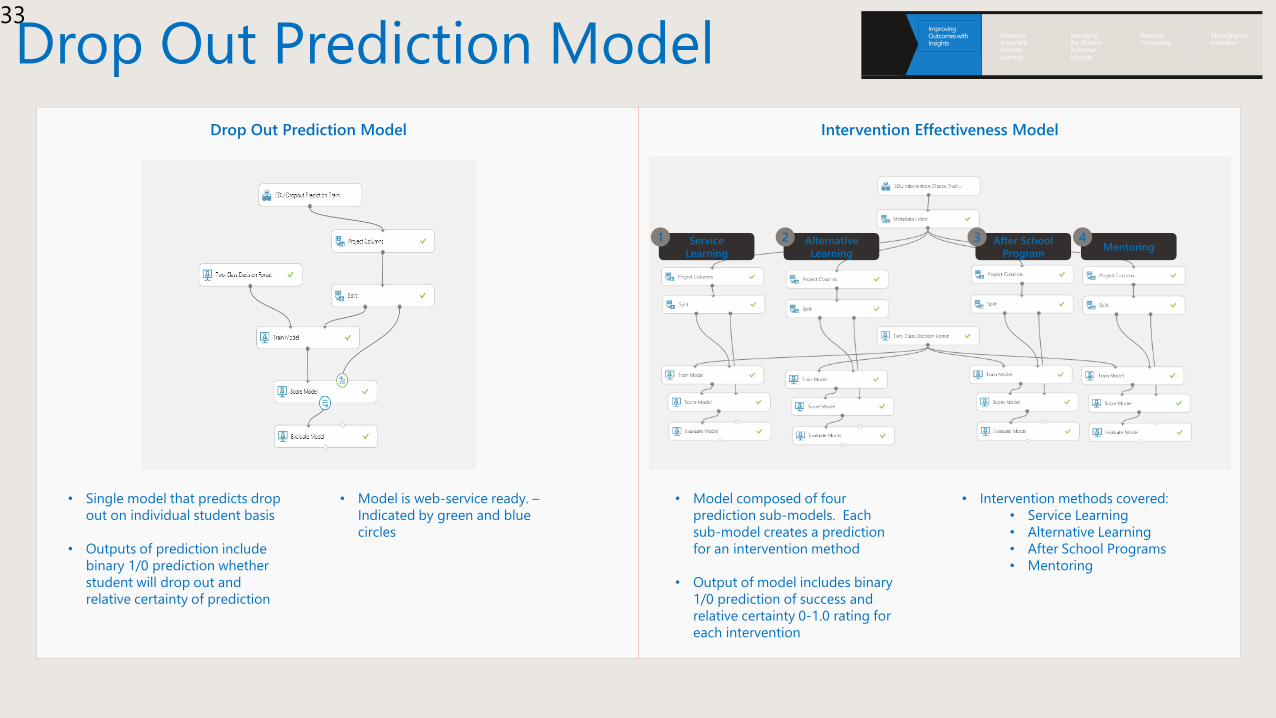
Drop Out Prediction Model
Drop Out Prediction Model Intervention Effectiveness Model
• Single model that predicts drop
out on individual student basis
• Outputs of prediction include
binary 1/0 prediction whether
student will drop out and
relative certainty of prediction
• Model is web-service ready. –
Indicated by green and blue
circles
• Model composed of four
prediction sub-models. Each
sub-model creates a prediction
for an intervention method
• Output of model includes binary
1/0 prediction of success and
relative certainty 0-1.0 rating for
each intervention
Service
Learning
1 Alternative
Learning
2 After School
Program
3Mentoring
4
• Intervention methods covered:
• Service Learning
• Alternative Learning
• After School Programs
• Mentoring
34
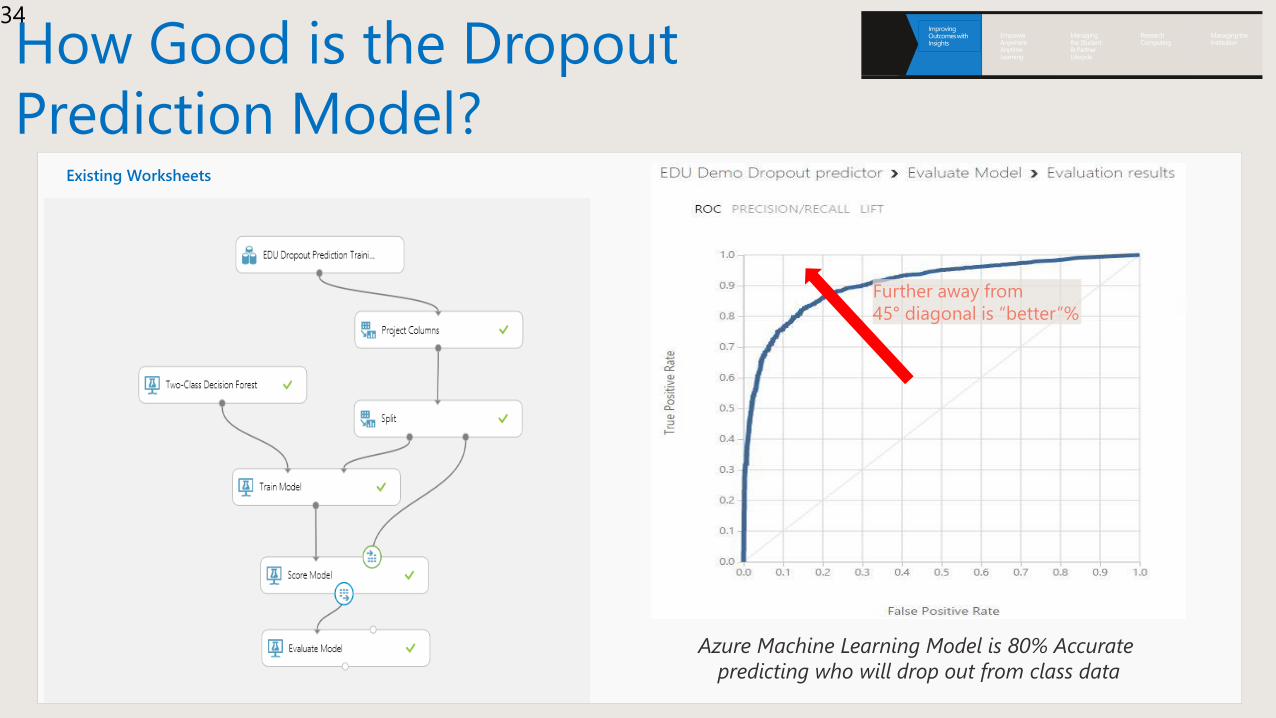
Azure Machine Learning Model is 80% Accurate
predicting who will drop out from class data
Existing Worksheets
Further away from
45° diagonal is “better”%
How Good is the Dropout
Prediction Model?

Enable student achievement
Stuck?
Potential tutor?
Bored?-05k
05k
15k
25k
35k
0
50
100
150
20
11
/02
/01
20
11
/02
/02
20
11
/02
/03
20
11
/02
/04
20
11
/02
/05
20
11
/02
/06
20
11
/02
/07 E
nerg
y P
oin
ts E
arn
ed
Tim
e S
pen
t (M
inu
tes) Student Detailed View
Exercise Minutes Video Minutes Energy Points
Assessment of Student’s Content Knowledge and
Clear Presentation Skills
Measures the student’s understanding of lessons through
homework and test scores as well as the student’s ability
to express herself or himself during class participation.
Computation of Student Assessment Data
Inputs assessments into a prediction model to identify
which students possess adequate knowledge of teaching
materials and ability to explain those concepts. The
model also identifies struggling students who need more
help.
Detailed Status Report of Each Student in Each
Lesson over Time
Reports knowledge level and activity completion of
students over time. System also enables instructors to
receive feedback on lesson effectiveness.
Student Lesson 1 Lesson 2 Lesson 3 Lesson 4 Lesson 5 Lesson 6
Cindy
Ravi
David
Zach
Bill
Dylan
Student Status
Azure MLStudent
classification
Student data Prediction
0
2
4
6
Category 1 Category 2 Category 3 Category 4
Student All Students
Identify
best tutors
and
struggling
students
Assess knowledge and ability Predict future achievement Track progress

Identify At-Risk Students
At-Risk Student Statistics
Classroom and Online Interaction Data for Individual
Students
Collects and tracks how often each student attends class
in person, how each performs based on grades, and how
much each participates in the class’ online discussions.
Any student can be individually selected for further
details.
Dropout Threat Predictor
Predicts which students are at high risk of dropping out
of school based on either sudden changes in
performance or consistent signs of struggle. A machine
learning algorithm is used to classify students by risk
level: Low, Medium, and High.
Aggregation of Risk Throughout Education System
Sums up and generalizes the number of at-risk students
at the classroom, school, and Region level. System
enables administrators to measure effectiveness of policy
changes in school system.
Student “Dylan” Summary
Track current performance Predict dropout probability Aggregate and act
StudentHours in
class
Comments
onlineLogons
Dylan 0 15 3
David 6
Bill 10 70 5
Cindy 12 4 6
Zach 6 3 8
Online
Classroom
Social media
Databases
User interface
0
20
40
60
80
100
1 1.5 2 2.5 3 3.5 4
Performance
At-Risk Score
(5)
Risk
Level
Intervention
Recommended
4.2 High Risk Yes
0%
2%
4%
6%
8%
10%
Class School Region
Low Risk Medium Risk
High Risk Average
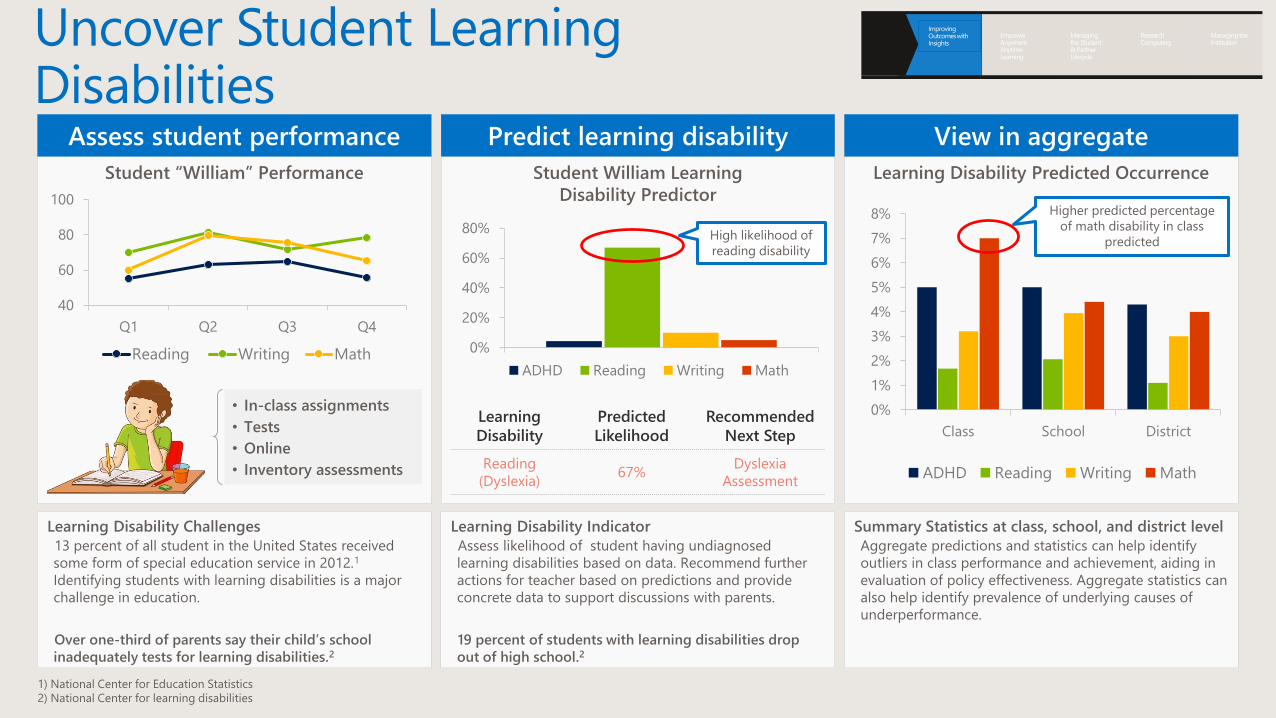
Uncover Student Learning Disabilities
Student “William” Performance Learning Disability Predicted Occurrence
Learning Disability Challenges
13 percent of all student in the United States received
some form of special education service in 2012.1
Identifying students with learning disabilities is a major
challenge in education.
Over one-third of parents say their child’s school
inadequately tests for learning disabilities.2
Learning Disability Indicator
Assess likelihood of student having undiagnosed
learning disabilities based on data. Recommend further
actions for teacher based on predictions and provide
concrete data to support discussions with parents.
19 percent of students with learning disabilities drop
out of high school.2
Summary Statistics at class, school, and district level
Aggregate predictions and statistics can help identify
outliers in class performance and achievement, aiding in
evaluation of policy effectiveness. Aggregate statistics can
also help identify prevalence of underlying causes of
underperformance.
Student William Learning
Disability Predictor
Assess student performance Predict learning disability View in aggregate
40
60
80
100
Q1 Q2 Q3 Q4
Reading Writing Math
• In-class assignments
• Tests
• Online
• Inventory assessments
0%
20%
40%
60%
80%
ADHD Reading Writing Math
Learning
Disability
Predicted
Likelihood
Recommended
Next Step
Reading
(Dyslexia)67%
Dyslexia
Assessment
0%
1%
2%
3%
4%
5%
6%
7%
8%
Class School District
ADHD Reading Writing Math
High likelihood of
reading disability
Higher predicted percentage
of math disability in class
predicted
1) National Center for Education Statistics
2) National Center for learning disabilities
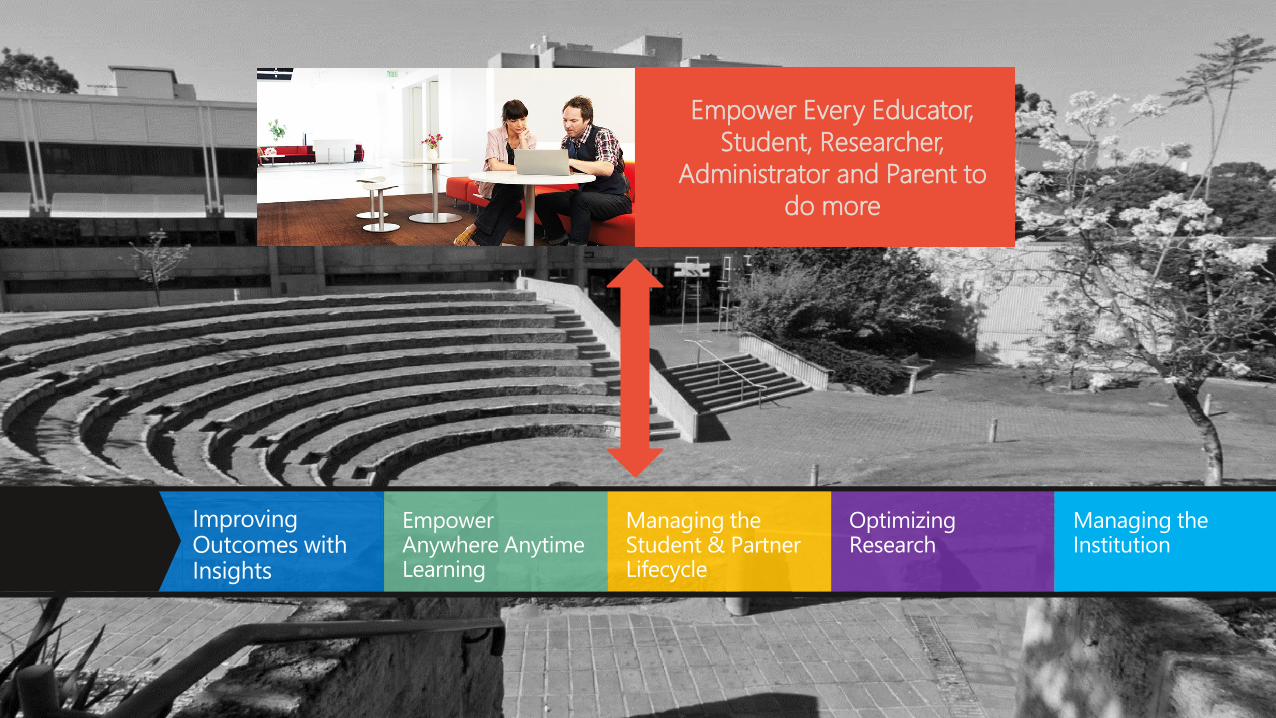
Empower Every Educator,
Student, Researcher,
Administrator and Parent to
do more