THE INTANGIBLE BENEFITS OF SPORTS TEAMS - University of North Texas
26
Public Finance and Management Volume Six, Number 3, pp. 321-345 2006 THE INTANGIBLE BENEFITS OF SPORTS TEAMS Jeffrey G. Owen Assistant Professor Dept. of Economics Indiana State University Abstract This paper conducts a contingent valuation survey of professional sports teams in Michigan and Minnesota. Two findings indicate that the consumption value of teams is quite important in explaining why some citizens continue to support public stadium funding. First, interest in the team is important in determining the value of willingness-to-pay. Second, while aggregate willingness-to- pay values are somewhat less than typical stadium subsidies, they are large enough to be considered an important factor in public funding for stadiums. The findings do not imply that cities should spend tax money on stadiums, but they suggest that the focus on economic impact misses the true source of value teams have for cities as public goods. Introduction The subsidization of stadiums for professional sports teams has generated increasing controversy as the public’s price tag for more lavish and more expensive stadiums grows. Bolstered by economic impact studies that forecast hundreds of millions of dollars in benefits to the local economy, stadium advocates justify public funding for stadiums as a civic investment, increasing economic activity and creating jobs. There is, however, overwhelming evidence that the benefits projected in economic impact studies do not materialize. Coates and Humphreys (2003)
Transcript of THE INTANGIBLE BENEFITS OF SPORTS TEAMS - University of North Texas

Public Finance and Management Volume Six, Number 3, pp. 321-345 2006
THE INTANGIBLE BENEFITS OF SPORTS TEAMS
Jeffrey G. Owen Assistant Professor Dept. of Economics
Indiana State University Abstract
This paper conducts a contingent valuation survey of professional sports teams in Michigan and Minnesota. Two findings indicate that the consumption value of teams is quite important in explaining why some citizens continue to support public stadium funding. First, interest in the team is important in determining the value of willingness-to-pay. Second, while aggregate willingness-to-pay values are somewhat less than typical stadium subsidies, they are large enough to be considered an important factor in public funding for stadiums. The findings do not imply that cities should spend tax money on stadiums, but they suggest that the focus on economic impact misses the true source of value teams have for cities as public goods. Introduction
The subsidization of stadiums for professional sports teams has generated increasing controversy as the public’s price tag for more lavish and more expensive stadiums grows. Bolstered by economic impact studies that forecast hundreds of millions of dollars in benefits to the local economy, stadium advocates justify public funding for stadiums as a civic investment, increasing economic activity and creating jobs. There is, however, overwhelming evidence that the benefits projected in economic impact studies do not materialize. Coates and Humphreys (2003)

322
found “no retrospective study found any evidence of positive economic impact from professional sports facilities or franchises on urban economies.” Despite the criticisms, economic impact studies continue to espouse the benefits of stadiums, and stadiums continue to be built with substantial sums of public money.
It may be that for some residents, public funding for
stadiums is supported for reasons other than projections of income growth or job creation. Recently many economists who are critics of sports subsidies have also recognized that sports teams generate benefit beyond that typically measured. Baade and Dye (1988, p. 37) acknowledge that “measurable economic benefits to area residents are not large enough to justify stadium subsidies and the debate must turn to immeasurable intangible benefits like fan identification and civic pride.” Noll and Zimbalist (1997, p. 58) agree that these “immeasurable” benefits may be important: “whether the value of the external benefits of a major league team to consumers really does exceed stadium subsidies is uncertain, but by no means implausible.”
Despite acknowledging the existence and potential
importance of such benefits, economists have been reluctant to actually calculate them, and for good reason. Baade and Sanderson (1997, p. 104) illustrate the current state of the debate:
The estimation of consumer surplus—and its
complementary benefit or cost, what is termed (positive or negative) “externalities”—is (or should be) an integral part of any benefit-cost calculation where public policy decisions are concerned, constructing a parking garage, a dam, or any other project. It is also one of the most difficult to handle. Doing such a calculation for a sports franchise is

323
well beyond the scope of this paper, but we want to acknowledge the potential existence of this benefit to citizens and the role it could play in what may otherwise appear to be ill-informed or unwise investments in sports franchises.
Two studies using the contingent valuation method, Johnson and Whitehead (2000) and Johnson, Groothuis, and Whitehead (2001), found intangible benefits did not cover stadium costs. In both studies, metropolitan areas were assumed to be the relevant area of aggregation. In what follows, a contingent valuation survey of professional sports teams in Michigan and Minnesota is conducted. Using states as the aggregation area allows fans beyond the immediate metropolitan area to be considered. All major professional sports teams located in Minneapolis/St. Paul use the name “Minnesota” to identify with a larger fan base. Also state governments are frequently involved in public subsidies for stadiums, so it is appropriate to consider taxpayers over a larger region.
Two findings indicate that the consumption value of teams is quite important in explaining why some citizens continue to support public stadium funding. First, interest in the team is important in determining the value of willingness-to-pay, which should not be the case if support was based solely on economic impact grounds. Second, while aggregate willingness-to-pay values are somewhat less than typical stadium subsidies, they are large enough to be considered an important factor in public funding for stadiums. The findings do not imply that cities should spend tax money on stadiums, but they suggest that the focus on economic impact, both by its advocates and critics, misses the true source of public support of subsidies to sports stadiums.

324
Why Contingent Valuation?
If sports teams have a significant public good element to them, then it makes sense to try to measure their value in the way other public goods are evaluated. The term “total economic value” has been used to encompass all types of value, market and non-market, associated with a good or service. Total economic value can then be used in a cost-benefit framework to determine the worth of a project.
An important tool for measuring indirect benefits is the contingent valuation method (CVM). CVM has been used frequently in environmental economics to measure social value in areas such as national parks, habitat conservation, and endangered species protection. In their study of Norfolk Broads National Park wetland in England, Bateman and Langford (1996) have illustrated the different elements that make up total economic value and the ways these elements can be evaluated, as shown in Figure 1 (with examples added that show where sports teams fit into the total economic value methodology).
Sports teams can capture direct use values through attendance, and indirect use values partially through broadcast rights. It is the non-use values, specifically existence value, that are of particular interest for sports teams because it is not captured by the team and has the potential to be quite large. Existence value can include free-riding by fans who follow a team but rarely, if ever, attend games and civic pride from having a winning team or being a “major league” city. CVM is the only method that attempts to measure these non-use values.

325
Figure 1: Sources of Social Value and Measurement Methods Total Economic Value Value Use Value Non-use Value Category Value Direct Use Indirect Use Option Use Bequest Existence Type Value Value Value Value Value Wetland Fishing Recreation Future Future Preserving Example personal generations wildlife recreation recreation habitat Sports Attendance Broadcast N/A? N/A Identity Example Television Valuation Market Prices Travel Cost CV CV CV Method Shadow Prices Method Hedonic Pricing
CV
Alternative methods of measuring total economic
value, such as the travel cost method and hedonic pricing are appealing because they look at actual, rather than hypothetical, decisions by users. On the other hand, both methods must infer valuations based on other markets. The travel cost method measures consumer surplus by using travel expense as a proxy for willingness-to-pay. Hedonic pricing measures the value of an amenity by finding its affect on property values. This requires finding a small price change in noisy and highly correlated data.
More importantly, neither method accounts for the
non-use values of teams, because they are not necessarily dependent on proximity to the team. People can continue to follow and identify with a team even if they have moved

326
away, and this will not be accounted for in either travel cost or hedonic pricing studies. Fans that have moved away can still care about their old local team, but if your local team moves away, the relationship is severed. You won’t find many Dodger fans in Brooklyn or Ravens fans in Cleveland. What is important is that your team stays at home, not that you do.
CVM has been adopted very slowly and almost
exclusively within environmental economics because many economists are skeptical, arguing that only through markets are consumers both willing and able to reveal their true valuation of a good.1 Generally, markets that most resemble “true” markets are considered to be the best candidates for reliable CVM studies. Cummings, Brookshire, and Schulze (1986) give three criteria for reliable estimates: “(1) CV respondents must be fully familiar with the commodity being valued; (2) respondents must have adequate prior valuation experience with respect to the consumption levels being valued; and (3) there must be little uncertainty.”
Unfortunately the goods that fit these criteria perfectly have little need for a CVM study. It is the unfamiliarity of the good in a market setting that makes such a study a useful way of measuring the value of something that cannot be discovered through a market. Environmental studies where CVM is used most extensively typically lack familiarity and experience with the amenity as a consumption good, but it is precisely this lack of a market that makes CVM the best tool available for measuring social value.
The partially non-market nature of sports “consumption,” however, is perhaps better suited to measurement by CVM. Unlike environmental issues, the

327
good being valued is familiar, matching the criteria set by Cummings et al. A question concerning the value of protecting an endangered species from extinction forces a survey participant to put oneself in the position of having the life or death of the species in one’s hands. A dollar value then can be thought of as a measure of compassion. Giving a low valuation is in some ways an admission of lack of compassion. The economic value of sports teams can be much more easily internalized than the value of species. Asking someone to put a value on a sports team does not force someone to consider issues of their own concept of morality the way environmental protection does. This being the case, results of CVM for sports teams should be able to be viewed with as least as much, and probably a great deal more, confidence than a CVM for and endangered species or clearer air. The Survey The survey, conducted in the spring of 1999, was designed to measure residents’ willingness-to-pay for professional sports in Minnesota and Michigan. The relevant market was assumed to be the state where the team resides so that any potential policy implications can at least be relevant at the state level.
Both states were separated by county into three geographic regions to account for decreased fan interest further from a team’s home city.2 Region 1 is the metropolitan area, where fans could attend games regularly. Region 2 goes out to approximately 100 miles from the city, a distance where fans could reasonably attend a night game without staying overnight. Region 3 covers the area more than 100 miles from the stadium, designed to represent the region where attending a game would be at

328
least a day-long event, if not more. In each region two counties were selected for mailings, with 250 surveys being sent to each county, for a total of 3000 surveys. A few days ahead of the survey, a postcard was sent to alert the recipients of the survey, an inexpensive way to improve the response rate.
In addition to demographic information on income, gender, and age, the survey asked respondents questions concerning their interest in each of the major professional sports teams in their state. For Minnesota those teams are (in order of the questionnaire) the Minnesota Twins (MLB), Minnesota Vikings (NFL), and Minnesota Timberwolves (NBA). In Michigan they are the Detroit Tigers (MLB), Detroit Lions (NFL), Detroit Pistons (NBA), and Detroit Red Wings (NHL). Descriptive statistics are in Table 1. The first question simply asked the respondent to describe his or her interest in the team given choices of “not at all interested,” “slightly interested,” “interested (a casual fan),” and extremely interested (a dedicated fan).” The second question asked about the number of games attended in the past season, with response ranges varying by sport. Respondents were also asked about the ways they followed the team either by attending, through the media, or talking to acquaintances.
Finally, the willingness-to-pay question asked how much the respondent would pay to keep the team in town for the foreseeable future. An open-ended format for the willingness-to-pay question was used to allow respondents to choose any dollar value, as opposed to a dichotomous choice or voting format in which respondents simply answer yes or no to whether they would pay a specific dollar amount to keep the team. Since the survey is on a

329
familiar subject and is fairly straightforward, I believe that concerns about the hypothetical nature of the question are not important enough to switch to a dichotomous choice scenario (starting point bias would be a major concern). A voting format, further, may be too reminiscent of an actual referendum, increasing the potential for protest zeros. Table 1: Descriptive Statistics
Mich. Minn. Mean Std.
Dev. Mean Std.
Dev. Income 3.28 1.17 3.11 1.18 Gender .67 ----- .66 ------ Age 48 17 50 17 Baseball Interest 1.11 0.85 1.27 0.87 Attendance 0.24 0.55 0.33 0.58 WTP 15.72 54.60 27.29 83.9
2 Football Interest 1.33 0.93 1.84 1.00 Attendance 0.23 0.59 0.37 0.71 WTP 19.84 66.96 83.95 310.
56 Basketball Interest 0.95 0.87 0.93 0.93 Attendance 0.17 0.48 0.16 0.46 WTP 13.79 56.40 25.40 104.
27 Hockey Interest 1.55 1.07 ----- ----- Attendance 0.25 0.60 ----- ----- WTP 56.05 229.04 ----- -----
Table 2 shows the results of a Tobit regression relating willingness-to-pay (WTP) for each of the seven teams in the survey to interest, attendance, income, gender, and region. Following Johnson and Whitehead (2000), Tobit is used because the WTP response is left censored with a large number of zero responses. INTEREST and

330
ATTEND are both statistically significant for every team at least at the 95% level. INCOME had a statistically significant positive relationship for the Minnesota teams, and while still positive, was not statistically significant in the Michigan data. GENDER tended toward higher WTP for men, but there is not a strong statistical relationship. REGION had the expected negative relationship in Michigan, but not Minnesota. The effect of distance may have been partially captured in the attendance response. Table 2: Tobit Regressions of Willingness-to-pay by team (standard errors in parentheses)
Interest Attend Income Gender Region Obs. Twins 78.76**
(15.30) 72.10** (18.46)
35.76** (9.84)
-31.56 (24.92)
4.10 (14.11)
360
Tigers 77.18** (15.61)
54.57** (21.65)
11.49 (10.45)
-16.67 (27.17)
-29.35** (14.87)
301
Vikings 273.36** (47.75)
252.01** (45.13)
83.09** (31.45)
-59.36 (78.69)
-61.12 (43.42)
369
Lions 109.16** (18.47)
49.99** (17.96)
0.47 (10.69)
-6.53 (29.37)
-25.87* (14.70)
298
Wolves 135.72** (22.02)
83.27** (31.54)
43.29** (14.50)
-19.76 (39.28)
9.31 (22.22)
372
Pistons 93.71** (20.21)
66.17** (25.95)
7.91 (13.03)
8.47 (32.51)
-38.30** (18.65)
291
Red Wings
202.08** (40.85)
237.55** (52.81)
20.69 (31.67)
-75.15 (78.13)
-29.63 (42.98)
281
** indicates statistical significance at � =5%. * indicates statistical significance at � = 10%. Definitions of variables: Interest: 0=not at all; 1=slightly; 2=casual fan; 3=dedicated fan.
Attend: Number of times attended last year, ranked 0(never) up to 4 with frequency varying by sport. Income(household): 1=less than $20,000; 2= up to $30,000; 3= up to $50,000; 4= up to $100,000; 5= over $100,000. Region: 1= metropolitan area; 2= within 100 miles; 3= beyond 100 miles.
Table 3 shows average willingness-to-pay values broken down by region. With the exception of the Pistons,

331
where WTP is highest in Region 2, WTP consistently declines as distance from the team increases. For the other six teams, WTP in Region 3 is less than half and as low as one-fifth the WTP in the home city. T-tests of differences in means across regions produce mixed results. Differences in WTP between Regions 1 and 3 are statistically significant (t-values greater than 2) for all teams except the Pistons and Red Wings. Only two of fourteen differences between adjacent regions were statistically significant, but as noted, only once did the difference in means not have the expected sign. Carlino and Coulson (2004) find an even stronger regional effect, estimating a rent premium of 8% in NFL central cities that does not hold for broader metropolitan areas. This illustrates the importance and the difficulty in choosing the proper geographic area to evaluate WTP. Fans living even beyond one hundred miles from the team have WTP values large enough to be worth consideration, but cannot be considered identical to local residents in terms of connection to the team. Table 3: Average Willingness-to-pay by Region Twins Vikings Wolve
s Tigers Lions Piston
s Red Wings
Overall 27.36 84.10 25.41 15.72 19.84 13.79 56.05
Region 1
39.59 141.00 50.91 26.59 28.66 11.78 96.40
Region 2
24.76 61.67 17.81 17.83 22.38 21.55 44.41
Region 3
17.15 48.81 9.05 5.22 10.54 8.50 35.11
Region: 1= metropolitan area; 2= within 100 miles; 3= beyond 100 miles.
The strong relationship of WTP to INTEREST and ATTEND is especially noteworthy because it shows that those who have the highest WTP tend to have the most

332
interest in the teams. This will come as a surprise to no one, but despite being obvious, it is ignored by proponents of stadium subsidies. Instead the economic benefits of jobs and tourist dollars are emphasized. The results of the survey suggest that supporters of subsidies may be more interested in their own consumption benefit than providing a projected economic boost.
The relationship between interest and willingness-to-pay is broken down further in Table 4. The regressions only include survey responses that were complete and had numerical values for WTP. Table 4 allows other WTP responses to be examined as well: uncertain (an ambiguous response, usually a question mark), protest zero (more on this later), and blank. Table 4: Response to Willingness-to-pay Question by Category Based on Interest Level (# of responses) Detroit Tigers Response to Willingness-to-pay Question
Interest in Team Zero $ > 0 ? Protest blank Total Not interested 90 5 0 0 1 96 Slightly interested 114 23 5 12 7 161 Interested 49 25 3 8 9 94 Extremely interested 8 8 2 1 2 21 Total 261 61 10 21 19 372
Minnesota Twins Response to Willingness-to-pay Question
Interest in Team Zero $ > 0 ? Protest blank Total Not interested 105 3 0 7 4 119 Slightly interested 138 53 10 12 8 221 Interested 87 73 14 14 10 198 Extremely interested 10 16 6 4 4 40 Total 340 145 30 37 26 578

333
Detroit Lions Response to Willingness-to-pay Question
Interest in Team Zero $ > 0 ? Protest blank Total Not interested 71 1 0 3 3 78 Slightly interested 102 14 5 5 5 131 Interested 62 44 3 8 6 123 Extremely interested 11 14 4 5 6 40 Total 246 73 12 21 20 372
Minnesota Vikings
Response to Willingness-to-pay Question Interest in Team Zero $ > 0 ? Protest blank Total Not interested 75 1 0 1 2 79 Slightly interested 71 16 6 11 5 109 Interested 122 65 14 11 8 220 Extremely interested 43 95 12 14 8 172 Total 311 177 32 37 23 580
Detroit Pistons Response to Willingness-to-pay Question
Interest in Team Zero $ > 0 ? Protest blank Total Not interested 121 3 0 3 3 130 Slightly interested 85 23 3 5 9 125 Interested 49 22 4 8 7 90 Extremely interested 4 5 2 1 0 12 Total 259 53 9 17 19 357
Minnesota Timberwolves Response to Willingness-to-pay Question
Interest in Team Zero $ > 0 ? Protest blank Total Not interested 175 4 1 7 4 191 Slightly interested 92 24 7 13 8 144 Interested 39 49 6 7 6 107 Extremely interested 7 13 3 3 1 27 Total 313 90 17 30 19 469
Detroit Red Wings Response to Willingness-to-pay Question
Interest in Team Zero $ > 0 ? Protest blank Total Not interested 72 3 0 1 2 78 Slightly interested 60 14 1 7 5 87 Interested 63 28 6 5 8 110 Extremely interested 25 37 9 7 4 82 Total 220 82 16 20 19 357

334
Breaking down willingness-to-pay according to interest shows that zero respondents are much less interested in sports than those who gave a positive dollar value for willingness-to-pay. For every team, the ratio of zero responses to positive dollar responses declines as interest level increases. Using the Twins as an example, 59% of respondents (340 out of 578) had willingness-to-pay of zero dollars. The percentage was 88% (105 out of 119) for those who expressed no interest in the Twins and fell to 62% for “slightly interested,” 44% for “interested,” and only 25% of the “extremely interested” gave zero as a response to the willingness-to-pay question. If voters base their willingness-to-pay solely on how much they expect the stadium to benefit the local economy then their interest in the team would not be a factor in their willingness-to-pay, but this is clearly not the case.
The three other categories of willingness-to-pay responses in Table 4: “question mark,” “blank,” and “protest zeros” create a potential source of miscalculation. In all three cases breakdown by interest shows that the respondents are very much like those with a positive willingness-to-pay as opposed to zero willingness-to-pay. This is especially true for question marks and blanks. Since zero is an obvious option the lack of a zero response in these cases likely indicates the respondent had a positive valuation but did not feel comfortable or confident in giving a specific answer. To adjust for the bias the responses were replaced with the average willingness-to-pay by non-zero responders to see how much it affected overall willingness-to-pay. If “question mark” and “blank” are assigned the average positive willingness-to-pay value, aggregate willingness-to-pay increases anywhere from 13% to 40% for each team. The willingness-to-pay values in

335
Table 5 include this alternative, along with values calculated without using such responses.
Protest zeros are more problematic. In environmental economics protest zeros are zeros given because the respondent opposes the payment vehicle (real or imagined), not because the respondent has literally no value for the amenity. This distorts the value people put on the amenity. Protest zeros show the respondent is not revealing his true valuation. For my data I recorded a protest zero whenever someone indicated opposition to using public money to fund “greedy owners” or “overpaid cry-baby players.” As was the case with “question mark” and “blank,” protest zeros were similar to non-zero responses with respect to interest. They were simply eliminated from all willingness-to-pay calculations. Dropping protest zeros add about 7% to all willingness-to-pay values.
Dealing with non-response is a critical problem for most contingent valuation surveys. For this study the response rate was 962/3000 = 32% overall. Minnesotans responded at a 40% rate compared to 25% for Michiganders. This is a fairly good response rate for mail surveys of this type, but still two out of three people did not return the survey. It is probably not the case that those who responded share the same interest in sports as those who did not respond.
Pinpointing the nature of the difference between respondents and non-respondents is difficult at best, so instead a range of willingness-to-pay values has been calculated based on two extreme assumptions, as recommended by Mitchell and Carson (1989). The high estimate for willingness-to-pay assumes that non-

336
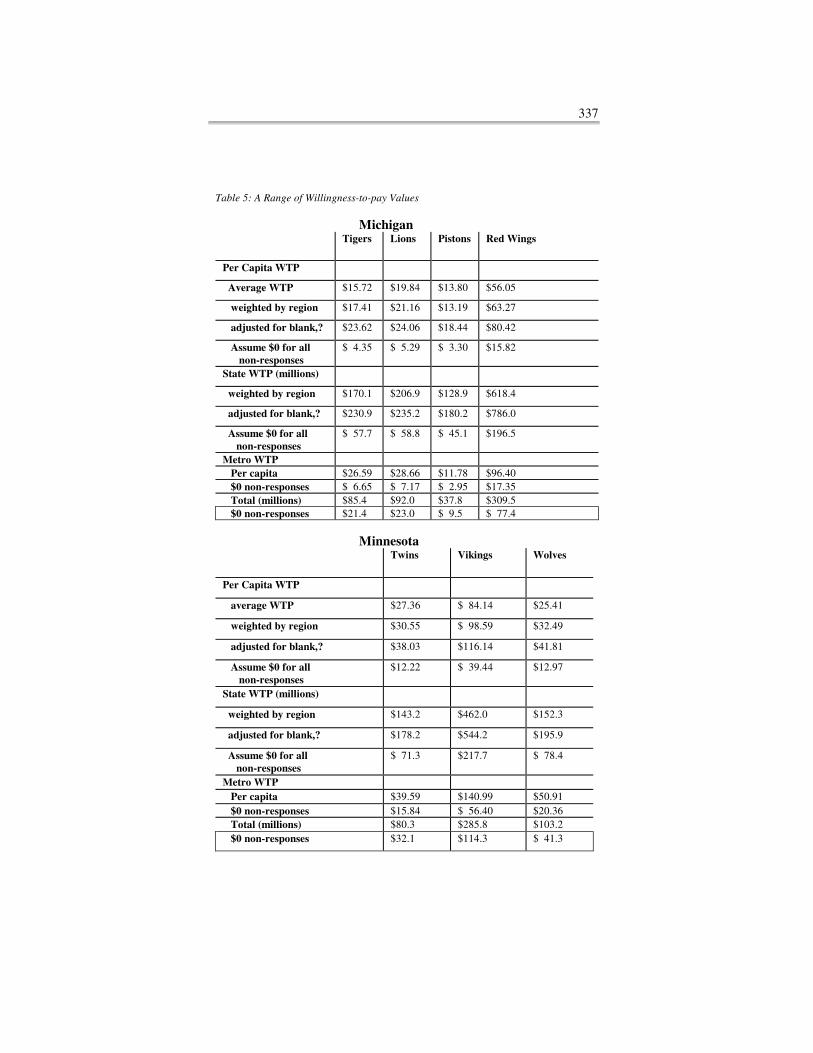
respondents are not different from those who responded; no adjustment from the willingness-to-pay in the data is necessary. The low value assumes that all non-responders have zero valuation for sports teams; willingness-to-pay values are multiplied by the response rate to incorporate zero responses. Non-responders certainly have less interest in sports but just as certainly at least some of them do have positive willingness-to-pay. The true willingness-to-pay value should lie somewhere between the two extremes. A range of aggregated willingness-to-pay values based on various assumptions is provided in Table 5. The first row is simply the average willingness-to-pay. The weighted average is based on the region willingness-to-pay values in Table 2. The metropolitan regions generally had higher willingness-to-pay and a larger percentage of the state’s population making the weighted average higher. Row three incorporates the adjustment for “question mark” and “blank” responses for comparison purposes but is not used in the aggregate calculations. Row four is the low-end estimate, which assumes all non-responders have zero willingness-to-pay based on average willingness-to-pay from row 2. The low-end estimate reaches further down for Michigan because of the lower response rate.
All total WTP values are aggregated using only
population over 18 years of age. This is done for two reasons: it covers only those of voting age, and adult respondents may incorporate the value their children place on a team when giving their own willingness-to-pay response. Values for state and metropolitan areas are provided, but the discussion that follows will be based on the state level.
337
Table 5: A Range of Willingness-to-pay Values Michigan
Tigers Lions Pistons Red Wings
Per Capita WTP
Average WTP $15.72 $19.84 $13.80 $56.05
weighted by region $17.41 $21.16 $13.19 $63.27
adjusted for blank,? $23.62 $24.06 $18.44 $80.42
Assume $0 for all non-responses
$ 4.35 $ 5.29 $ 3.30 $15.82
State WTP (millions)
weighted by region $170.1 $206.9 $128.9 $618.4
adjusted for blank,? $230.9 $235.2 $180.2 $786.0
Assume $0 for all non-responses
$ 57.7 $ 58.8 $ 45.1 $196.5
Metro WTP Per capita $26.59 $28.66 $11.78 $96.40 $0 non-responses $ 6.65 $ 7.17 $ 2.95 $17.35 Total (millions) $85.4 $92.0 $37.8 $309.5 $0 non-responses $21.4 $23.0 $ 9.5 $ 77.4
Minnesota
Twins Vikings Wolves
Per Capita WTP
average WTP $27.36 $ 84.14 $25.41
weighted by region $30.55 $ 98.59 $32.49
adjusted for blank,? $38.03 $116.14 $41.81
Assume $0 for all non-responses
$12.22 $ 39.44 $12.97
State WTP (millions)
weighted by region $143.2 $462.0 $152.3
adjusted for blank,? $178.2 $544.2 $195.9
Assume $0 for all non-responses
$ 71.3 $217.7 $ 78.4
Metro WTP Per capita $39.59 $140.99 $50.91 $0 non-responses $15.84 $ 56.40 $20.36 Total (millions) $80.3 $285.8 $103.2 $0 non-responses $32.1 $114.3 $ 41.3

338
Per capita willingness-to-pay is two times higher in
Minnesota for baseball and basketball, and over four times higher for football. Hockey is the most valued sport in Michigan, however, with willingness-to-pay for the Red Wings three to four times higher than the other Detroit teams. The gap in willingness-to-pay illustrates the common complaint of small market teams about their ability to compete. The population of Minnesota is less than half that of Michigan (4.7 vs. 9.7 million), causing total willingness-to-pay for the Detroit Tigers to be higher than for the Minnesota Twins despite the higher per capita willingness-to-pay for the Twins.
The survey form asks for willingness-to-pay per year, but it is possible that some respondents answered on a one time basis, so a conservative approach of assuming all responses are “one time only” will be taken here. The aggregated willingness-to-pay values in Table 5 vary greatly by team. Especially important is how one assumes non-responders compare to responders. At the state level a willingness-to-pay of around $100 million per team seems to be a reasonable estimate, with the Vikings and Red Wings being quite a bit higher.
Judith Grant Long (2005) finds the average reported public subsidy for sports facilities built since 1990 is $124 million, with adjustments for land acquisition, foregone taxes, and other effects raising the average subsidy to $195 million. Public funding for the Detroit Tigers’ ballpark, which opened in 2000 was $116 million. Typical public subsidies are in the high end of the range estimated by this survey. Intangible benefits may not be enough on their own to explain public funding for stadiums, but they are large enough to be an important factor in the stadium debate.

339
As discussed earlier, there is a strong relationship
between interest and willingness-to-pay. But what effect does winning have on interest? Referring back to Table 2, the Minnesota Vikings and Detroit Red Wings had the highest average values for interest and, by a wide margin, willingness-to-pay. Both franchises had also been the most successful teams in their cities in the years immediately preceding the survey. The gap in football between the Detroit Lions and Vikings is especially striking. Both teams play in the same division in similar domed facilities, yet the Vikings, with one highly successful (15-1) season, garnered much more support than a team that had been about average and had an entertaining superstar player in Barry Sanders. That winning is such a large factor in determining willingness-to-pay shows the risk of limiting surveys to one team or taking the values for one team too literally since values can be sensitive to recent team performance.
Teams have attempted to boost the on-field fortunes of their team when trying to obtain public support for a new stadium with some success. The most striking example is the San Diego Padres. Prior to the 1998 season the Padres spent heavily on free agents, went to the World Series that October, won a stadium vote in November, and got rid of most of their expensive players over the winter. On the other hand, the Florida Marlins won the 1997 World Series, their first winning season in franchise history, but were unable to secure a stadium. They jettisoned most of their expensive players the following year and lost 108 games. Mondello and Anderson (2004) found losing teams actually had more success with stadium referenda, based on ten-year winning percentages. This may be more reflective of the bargaining position of cities. Small market teams

340
must view the possibility of a team relocating as a credible threat, whereas larger cities realize the value of their market to a team. It is therefore necessary for smaller cities to offer larger subsidies to keep their team. If small market teams have smaller payrolls, and thus lower winning percentages, then losing teams will seem to be more successful at getting the public funding for stadiums (see Owen [2003]). For all seven teams the majority (from 54% up to 70%) of respondents answered zero dollars for willingness-to-pay. This is consistent with Johnson and Whitehead (2000) and is typical of media conducted surveys as well. A poll conducted by the Minneapolis Star-Tribune in 2004 found 64% of Minnesotans opposed to using tax dollars for stadium construction.3
Although it appears public funding for stadiums would not be approved in a referendum for any of the surveyed teams, this may not actually be the case. Teams do not need the majority of residents to support a stadium referendum, just a majority of those who vote. If turnout is low, a core group of fans voting in favor of a stadium could carry the vote, which is why teams prefer votes to be held when turnout is likely to be low.4
Voters may also approve a level of subsidy in
excess of their own willingness-to-pay. According to the setter model, as described in Fort (1997), teams can use the all-or-nothing nature of a referendum to force voters to choose between a state-of-the-art stadium or nothing at all. If such a stadium is closer to the voter’s preference than nothing (with the implication that the team will then move), then the voter will choose the stadium.

341
In addition, experience with actual referenda has shown that support usually shifts more in favor of stadiums as the voting day approaches.5 This could be due to more vigorous and better funded campaigning by stadium supporters, the composition of those who turn out to vote, or voters protesting or attempting to hide their true valuation prior to the voting day. It is possible that the some of the zero responses could also be explained by “unwritten protests.” Some people may be philosophically opposed to subsidizing sports teams. But if they are convinced they will lose their team without a new stadium, when push comes to shove at the voting booth they vote for the stadium despite their distaste for subsidizing rich owners and players. Conclusion
This CVM study finds interest in the team is a critical element of willingness-to-pay for sports stadiums and teams. Still most of the public debate centers on the economic impact of sports on local economies. Why does the “economic impact fantasy” have such staying power? It may be that the economic impact argument is a convenient out if you want the team to stay but hate the idea of giving millions of tax dollars to rich people. By accepting the projections of economic impact subsidies, a public subsidy for the wealthy becomes a noble public works project. Everyone is a hero. Team owners are providing the centerpiece for economic growth. City officials are creating a monument to their active pursuit of a great economic future for their community. Each fan is making his contribution to the city’s future as well. You are not voting for the stadium because you want the team to stay and the owner has backed you into a corner; you are voting for it because it will benefit the entire community. No one is

342
being selfish. It is easy to see why voters, owners, and civic leaders would all be willing to believe in the fallacy. The protective veil of economic impact, however, is a thin one. When support for a stadium is in doubt, owners and city officials remind local citizens of the implications of a failed vote – their local team playing somewhere else.
Like previous CVM studies of sports teams, this
study finds that aggregate willingness-to-pay values are not large enough to cover the costs of sports facilities. The range of values is large enough, however, that intangible benefits have to be considered an important factor in public support for stadium subsidies. A plausible argument could be made that the values are large enough to explain stadium subsidies depending how non-response and other factors are handled.
If this were the case, would it justify public
subsidies for stadiums? Certainly not. Assume for a moment that we actually know with certainty residents’ true valuations of teams exceed the construction costs of stadiums. This would still not necessarily lead to the conclusion that such subsidies are correct public policy. Just because consumers are willing to pay a certain amount for a good does not mean that they have to or should have to. If professional sports at the same level of quality can be provided without a subsidy to the team, this is obviously better for the city. Public policy should be to attempt to provide sports teams at the least possible cost, which could mean contributing nothing to the construction of stadiums if a team can operate profitably when paying the full cost of the playing facility. Even the most accurate contingent value survey would only give a reservation price for the cities. How much a city may actually need to contribute to attract or keep a team also depends on the bargaining power

343
of cities and teams. What the study does show is that individual interest in the team is an important determinant of whether someone favors public subsidies, and acceptance of the criticisms of economic impact studies by the voting public may not change the level of public support. Notes 1 Kerry V. Smith [1993] p. 18.
2 See Bateman and Langford [1996].
3 DeFiebre [2004]. 4 There are several examinations of the role of politics in Sports, Jobs, & Taxes [1997]; also see Brown and Paul [1999]. 5 See Brown and Paul [1999].
References Baade, R. A. (1988). An Analysis of the economic rationale for public subsidization of sports stadiums. Annals of Regional Science, 22(2), 37.
Baade, R.A., & Sanderson, A.R (1997). Cities Under Siege. In Advances in the of Sport, Vol. 2, edited by Wallace Hendricks. JAI Press, Inc

344
Bateman, I. J., & Langford, I. H. (1997). Non-users' willingness to pay for a national park: An application and critique of the contingent valuation method. Regional Studies, 31(6), 571. Brown, C., & Paul, D. M. (1999). Local organized interests and the 1996 Cincinnati sports stadia tax referendum. Journal of Sport and Social Issues, 23(2), 237. Carlino, G., & Coulson, N. E. (2004). Compensating differentials and the social benefits of the NFL. Journal of Urban Economics, 56(1), 25. Coates, D., & Humphreys, B. R. (2003). Professional sports facilities, franchises and urban economic development. Public Finance & Management, 3(3), 335. Cummings, R.G., D.S. Brookshire, & W.D. Schulze. (1986). Valuing Environmental Goods. Rowman & Allanheld.
DeFiebre, C. (2004). Most Still Oppose New Stadiums for Twins, Vikings. Retrieved on January 1, 2004, from http://www.startribune.com/viewers/story.php?template=print_a&story=4337106. Fort, R. (1997). Direct Democracy and the Stadium Mess. In Sports, Jobs, and Taxes, edited by Noll and Zimbalist. The Brookings Institute. Johnson, B. K., & Whitehead, J. C. (2000). Value of public goods from sports stadiums: The CVM approach. Contemporary Economic Policy, 18(1), 48.

345
Johnson, B. K., Groothuis, P., & Whitehead. J.C. (2001). Value of Public Goods Generated by a Major League Sports Team: The CVM Approach. Journal of Sports Economics, 2(1), 6. Long, J.G. (2005). Full Count: The Real Cost of Public Funding for Major League Sports Facilities. Journal of Sports Economics, 6(2), 119. Mitchell, R. & Carson, R.T. (1989). Using Surveys to Value Public Goods: The Contingent Valuation Method. Resources for the Future. Mondello, M. J., & Anderson, P. (2004). Stadiums, Arenas, and Sports Referendums: A Comparative Analysis of Cities Involved in the Stadium Game. International Journal of Sport Management, (5) 43. Noll, R.G., & Zimbalist, A. (1997). The Economic Impact of Sports Teams and Facilities. In Sports, Jobs, and Taxes, edited by Noll & Zimbalist. The Brookings Institute. Owen, J.G. (2003). The Stadium Game: Cities Versus Teams. Journal of Sports Economics, 4(3), 183. Smith, V. K. (1993). Nonmarket Valuation of Environmental Resources: An Interpretive Appraisal. Land Economics, 69(1), 1.