The Insurance of Flood Risks
38
The Insurance of Flood Risks Prepared by the Flood Working Group Tim Andrews Grant Billen Hun Kim Ada Lui Charles Pollack Lucy Simpson Daniel Smith Stephen Underhill David Whittle Presented to the Institute of Actuaries of Australia 16 th General Insurance Seminar 9-12 November 2008 Coolum, Australia This paper has been prepared for the Institute of Actuaries of Australia’s (Institute) 16 th General Insurance Seminar 2008. The Institute Council wishes it to be understood that opinions put forward herein are not necessarily those of the Institute and the Council is not responsible for those opinions. Institute of Actuaries of Australia The Institute will ensure that all reproductions of the paper acknowledge the Author/s as the author/s, and include the above copyright statement: The Institute of Actuaries of Australia Level 7 Challis House 4 Martin Place Sydney NSW Australia 2000 Telephone: +61 2 9233 3466 Facsimile: +61 2 9233 3446 Email: [email protected] Website: www.actuaries.asn.au
Transcript of The Insurance of Flood Risks
The Insurance of Flood Risks
Prepared by the Flood Working Group
Tim Andrews
Grant Billen
Hun Kim
Ada Lui
Charles Pollack
Lucy Simpson
Daniel Smith
Stephen Underhill
David Whittle
Presented to the Institute of Actuaries of Australia
16th General Insurance Seminar 9-12 November 2008
Coolum, Australia
This paper has been prepared for the Institute of Actuaries of Australia’s (Institute) 16th General Insurance Seminar 2008.
The Institute Council wishes it to be understood that opinions put forward herein are not necessarily those of the Institute and the Council is
not responsible for those opinions.
Institute of Actuaries of Australia
The Institute will ensure that all reproductions of the paper acknowledge the Author/s as the author/s,
and include the above copyright statement:
The Institute of Actuaries of Australia
Level 7 Challis House 4 Martin Place
Sydney NSW Australia 2000
Telephone: +61 2 9233 3466 Facsimile: +61 2 9233 3446
Email: [email protected] Website: www.actuaries.asn.au
The Insurance of Flood Risks
Contents
Part 1 Summary i
1 Background i
2 Estimating the Cost of Riverine Flood i
3 Customer Prices for Flood Insurance iii
Part 2 Estimating the Cost of Riverine Flood 1
1 Introduction 1
2 Indicative Claims Levels 3
3 Data 9
4 Methodology 12
5 Key Challenges 16
Part 3 Customer Prices for Flood Insurance 18
1 Introduction 18
2 Pricing Approach and Objectives 19
3 Data, Systems and Competitors 24
4 Key Challenges 30
Part 4 Appendices/References 32
A Methodology for determining risk data 32
The Insurance of Flood Risks
i
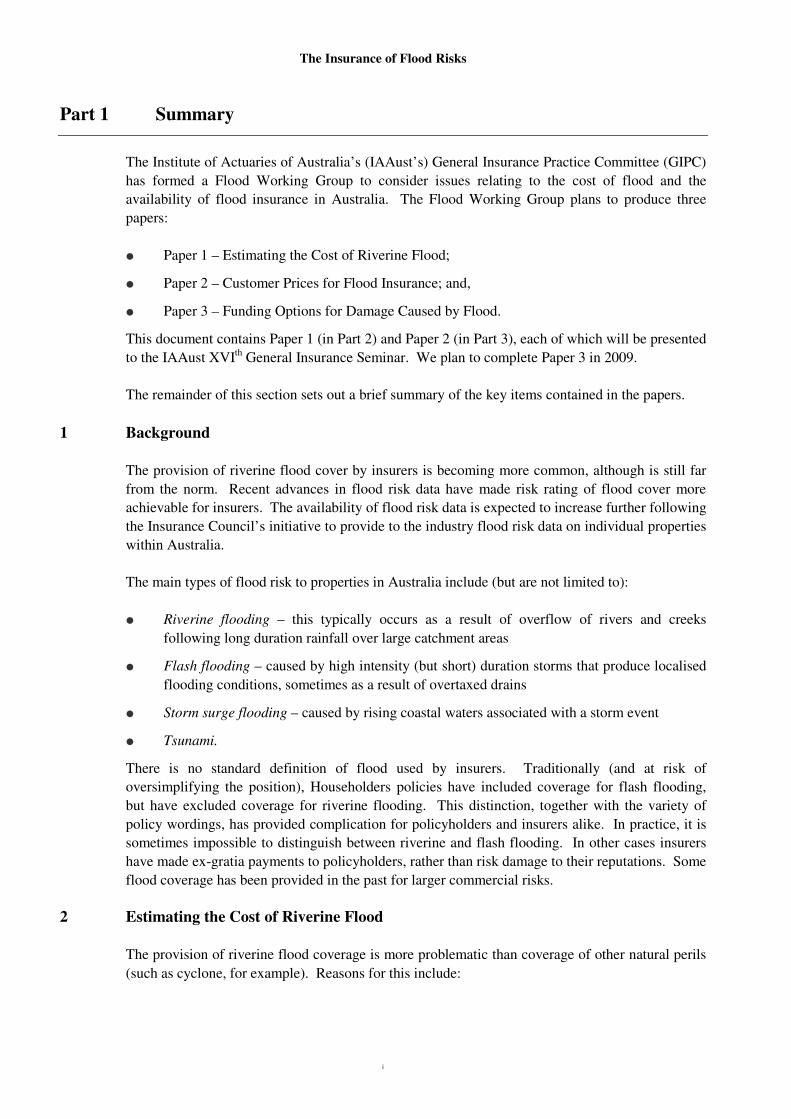
Part 1 Summary
The Institute of Actuaries of Australia’s (IAAust’s) General Insurance Practice Committee (GIPC)
has formed a Flood Working Group to consider issues relating to the cost of flood and the
availability of flood insurance in Australia. The Flood Working Group plans to produce three
papers:
� Paper 1 – Estimating the Cost of Riverine Flood;
� Paper 2 – Customer Prices for Flood Insurance; and,
� Paper 3 – Funding Options for Damage Caused by Flood.
This document contains Paper 1 (in Part 2) and Paper 2 (in Part 3), each of which will be presented
to the IAAust XVIth General Insurance Seminar. We plan to complete Paper 3 in 2009.
The remainder of this section sets out a brief summary of the key items contained in the papers.
1 Background
The provision of riverine flood cover by insurers is becoming more common, although is still far
from the norm. Recent advances in flood risk data have made risk rating of flood cover more
achievable for insurers. The availability of flood risk data is expected to increase further following
the Insurance Council’s initiative to provide to the industry flood risk data on individual properties
within Australia.
The main types of flood risk to properties in Australia include (but are not limited to):
� Riverine flooding – this typically occurs as a result of overflow of rivers and creeks
following long duration rainfall over large catchment areas
� Flash flooding – caused by high intensity (but short) duration storms that produce localised
flooding conditions, sometimes as a result of overtaxed drains
� Storm surge flooding – caused by rising coastal waters associated with a storm event
� Tsunami.
There is no standard definition of flood used by insurers. Traditionally (and at risk of
oversimplifying the position), Householders policies have included coverage for flash flooding,
but have excluded coverage for riverine flooding. This distinction, together with the variety of
policy wordings, has provided complication for policyholders and insurers alike. In practice, it is
sometimes impossible to distinguish between riverine and flash flooding. In other cases insurers
have made ex-gratia payments to policyholders, rather than risk damage to their reputations. Some
flood coverage has been provided in the past for larger commercial risks.
2 Estimating the Cost of Riverine Flood
The provision of riverine flood coverage is more problematic than coverage of other natural perils
(such as cyclone, for example). Reasons for this include:
The Insurance of Flood Risks
ii
� the difficulties in identifying properties at risk; whereas cyclones and other natural perils
impact, to some extent, over a large area, the riverine flood risk can vary materially from
house to house
� if risk rated, the cost to individual insureds can become very large and unaffordable. This
reflects that the exposure is significant and is shared across a small proportion of risks, with
more than 90% of properties having no riverine flood risk at all.
Our indicative estimates of the quantification of Australia-wide riverine flood revealed:
� The average annual cost of riverine flood may be as much as $600 million, but is probably
less
� Of this amount, perhaps $100 million is already paid by insurers, leaving $500 million of
potential extra annual average cost. The potential extra cost for home risks is around $50
per dwelling
� Most of this cost relates to less than 1% of risks
� The market flood PML may be of the order of $10 billion or more, if comprehensive
coverage of flood is provided. A 1 in 100 year event might cost $2 billion.
The information needed to estimate the cost of riverine flood includes –
� Flood risk data – providing for each location its susceptibility to flooding (typically in terms
of the depth of water likely from floods of certain frequencies)
� Damage curves – providing the relationship between flood depth and the extent of damage
to the property. In theory, the damage curve will differ according to the location of the
property (and the type of flooding it experiences) and the characteristics of the dwelling.
Conceptually it is a straightforward matter to convert the information on the flood risk for a
specific property and damage curve, into an estimate of average flood cost. Some of the key
challenges include the:
� Determination of relevant damage curves
� Avoidance of double counting of costs, noting that some costs are already paid for
� Costing of reinsurance, and allocating this by property
� Costing of commercial risks, noting that business interruption costs can be significant
� Allowance for the impact of global warming – this requires consideration of the relevance
of flood risk data derived from historical events.
The Insurance of Flood Risks
iii
3 Customer Prices for Flood Insurance
Before simply adding the cover to the policy wording, the insurer must decide how it wishes to
price for it. This is not limited to a simple numbers and systems exercise, but also includes a
number of philosophical issues, as well as business related concerns.
Whilst the positions taken by competitors will influence the approach, each individual company
will weigh the considerations differently. The actual cover being offered, impact of pricing on
existing and potential new customers (and overall growth), methods of distribution, portfolio goals
(reduce exposure to catastrophes vs price for risk vs some other goal), and the nature and
sophistication of pricing and administration systems all contribute to the appropriate outcome for
the class of business in question for a company.
On top of these considerations, the approach to pricing depends on the insurer’s view of the data
available and its fitness for the purpose. The fact that a ‘perfect’ pricing model is difficult, if not
impossible, to achieve means that actuaries approaching this problem need to be prepared to apply
a degree of pragmatism. Designing an approach that allows a limited amount of manual
intervention will also improve the chances of a successful implementation. However, a
preparedness to adjust the pricing soon after it first goes live, in response to any unforeseen issues,
is still required.
So, whilst pricing flood cover is not straightforward, the limitations of the available information
are now sufficiently few that this can be done in such a way that a company can confidently
provide this sought-after cover, confident that it won’t ‘break the bank’.
Key challenges that exist in determining and maintaining the customer prices include:
� Enabling and enhancing systems to allow this change to the rating approach
� Gaining acceptance in the company of the cost of setting up and maintaining this properly,
and that some of the skills required may not already exist in the organisation
� Preparing for public resistance to moves to rate flood, particularly in areas where flood is a
problem (such as Brisbane, Gold Coast and Northern NSW) and taking care not to ‘over-do
it’
� Ensuring that, beyond the initial pricing work, efforts are made to encourage mitigation or
avoidance of flood risk in the first place
� Educating the market about the extent of cover and what they are paying for
� Establishing the appropriate monitoring processes to assess the impacts of the pricing
approach on the mix of business.
The Insurance of Flood Risks
ta|K:\R&D\FLOOD\GI_SEMINAR_NOV08\REPORT\THE INSURANCE OF FLOOD RISKS - FLOOD WORKING PARTY - FINAL.DOC 1
Part 2 Estimating the Cost of Riverine Flood
1 Introduction
1.1 Background
The provision of riverine flood cover by insurers is becoming more common, although is still far
from the norm. Recent advances in flood risk data have made risk rating of flood cover more
achievable for insurers. The availability of flood risk data is expected to increase further,
following the Insurance Council’s initiative to provide to the industry flood risk data on individual
properties within Australia.
The purpose of this paper is to assist actuaries to quantify the cost of riverine flood at the risk
level. We will discuss the data that may be required, and what constraints and limitations there
may be in using the data available. We will address possible methodologies in pricing flood and
some of the key challenges associated with this, and also address inherent differences that exist
between Personal and Commercial risks, and the impact of these differences on flood costs.
This paper has been put together by the Flood Working Group, and is only intended to address the
technical issues around flood pricing. A separate paper (Part 3) considers the implementation
issues for insurers once the technical pricing aspects have been determined.
1.2 Definition of flood
The main types of flood risk to properties in Australia include (but are not limited to):
� Riverine flooding – this typically occurs as a result of overflow of rivers and creeks
following long duration rainfall over large catchment areas
� Flash flooding – caused by high intensity (but short) duration storms that produce localised
flooding conditions, sometimes as a result of overtaxed drains
� Storm surge flooding – caused by rising coastal waters associated with a storm event
� Tsunami.
There is no standard definition of flood used by insurers – in fact, there are probably more than
100 definitions currently being utilised in the Australian market.
Traditionally (and at risk of overgeneralising and oversimplifying the position), Householders
policies have included coverage for flash flooding, but have excluded coverage for riverine
flooding. This distinction, together with the variety of policy wordings, has provided complication
for policyholders and insurers alike. In practice, it is sometimes impossible to distinguish between
riverine and flash flooding such that costs are covered by insurers. In other cases insurers have
made ex-gratia payments to policyholders rather than risk reputation damage. Some flood
coverage has been provided in the past for larger commercial risks.
In this paper, we address the issue of pricing riverine flood costs only.
The Insurance of Flood Risks
ta|K:\R&D\FLOOD\GI_SEMINAR_NOV08\REPORT\THE INSURANCE OF FLOOD RISKS - FLOOD WORKING PARTY - FINAL.DOC 2
1.3 A little bit of history
The provision of riverine flood coverage is more problematic than other natural perils insured
(such as cyclone, for example). Reasons for this include:
� the difficulties in identifying properties at risk; whereas cyclones and other natural perils
impact, to some extent, over a large area, the riverine flood risk can vary materially from
house to house
� if risk rated, the cost to individual insureds can become very large and unaffordable. This
reflects that the exposures are significant and shared across a small proportion of risks, with
more than 90% of properties having no riverine flood risk at all.
To date, a key source of flood risk information for the insurance industry has been the Risk
Frontiers FloodAUS product. This provides a property-based estimate of flood risk for some key
catchments across Australia.
A current initiative by the Insurance Council is to combine FloodAUS with a similar database
constructed by flood engineers, Worley Parsons, and over a three year period to extend it to
provide complete national coverage. This new database is to be known as the National Flood Risk
Information Database (NFID).
1.4 Structure of paper
The remainder of this paper (Part 2) is structured as follows –
� Section 2 - Indicative Claims Levels: places riverine flood costs in context by providing an
indication of current costs borne by insurers, and how much extra cost there might be if
riverine flood coverage were added
� Section 3 – Data: Describes the data needed to rate flood, including:
� risk data
� the susceptibility of a property in flood, and
� damage data, the cost to the property resulting from the flood
� Section 4 – Costing Methodology: Describes how the data might be converted into claims
costs estimates
� Section 5 – Key Challenges: Discusses some of the key theoretical challenges faced in
measuring the cost. A separate paper will consider practical challenges.
The Insurance of Flood Risks
ta|K:\R&D\FLOOD\GI_SEMINAR_NOV08\REPORT\THE INSURANCE OF FLOOD RISKS - FLOOD WORKING PARTY - FINAL.DOC 3
2 Indicative Claims Levels
2.1 Introduction
The quantification of Australia-wide riverine flood claims costs is presented here to put the rest of
the paper into context – i.e. is riverine flood an issue that we should be worried about? The
estimated costs should be seen as indicative, rather than the final word – but are sufficient for the
purposes of this paper.
Our key findings from this section are as follows:
� The average annual cost of riverine flood may be as much as $600 million, but is probably
less
� Of this amount, perhaps $100 million is already paid by insurers, leaving $500 million of
potential extra cost. The potential extra cost for home risks is around $50 per dwelling
� Most of this cost relates to less than 1% of risks
� The market flood PML for Home Insurance may be of the order of $10 billion, if
comprehensive coverage of flood is provided. A 1 in 100 year event might cost $2 billion.
2.2 Insurance Council Catastrophe Disaster List
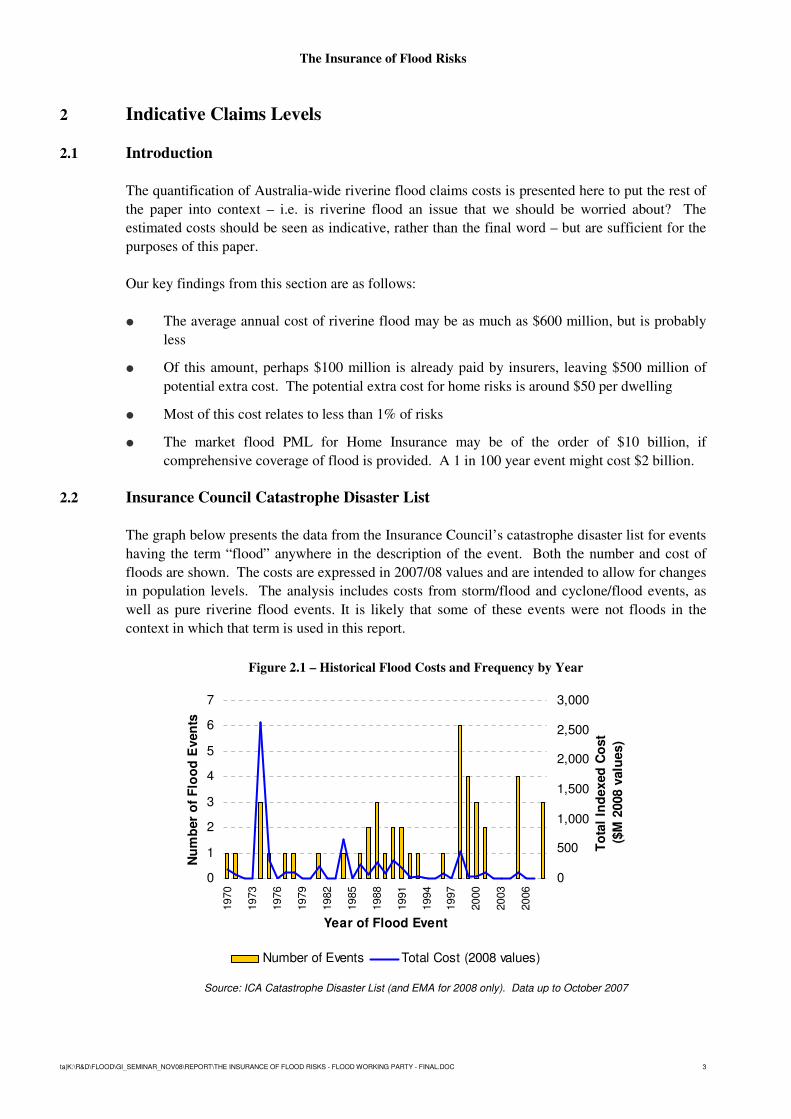
The graph below presents the data from the Insurance Council’s catastrophe disaster list for events
having the term “flood” anywhere in the description of the event. Both the number and cost of
floods are shown. The costs are expressed in 2007/08 values and are intended to allow for changes
in population levels. The analysis includes costs from storm/flood and cyclone/flood events, as
well as pure riverine flood events. It is likely that some of these events were not floods in the
context in which that term is used in this report.
Figure 2.1 – Historical Flood Costs and Frequency by Year
0
1
2
3
4
5
6
7
1970
1973
1976
1979
1982
1985
1988
1991
1994
1997
2000
2003
2006
Year of Flood Event
Nu
mb
er
of
Flo
od
Even
ts
0
500
1,000
1,500
2,000
2,500
3,000
To
tal
Ind
exed
Co
st
($M
2008 v
alu
es)
Number of Events Total Cost (2008 values)
Source: ICA Catastrophe Disaster List (and EMA for 2008 only). Data up to October 2007
The Insurance of Flood Risks
ta|K:\R&D\FLOOD\GI_SEMINAR_NOV08\REPORT\THE INSURANCE OF FLOOD RISKS - FLOOD WORKING PARTY - FINAL.DOC 4
The Insurance Council data suggests that over the past 40 years, given current population levels
and in current values, a total of $5.5 billion would have been paid out by insurers for events over
$100 million, where flood was involved. The average annual costs would have been $140 million,
with an average cost of around $340 million per flood event. Excluding the 1974 Brisbane flood
which is valued at more than $2.5 billion, the average annual cost drops to $90 million.
The table below shows the list of flood events on the Insurance Council’s catastrophe disaster list
with a cost over $100 million in the last 10 years.
Table 2.1 – Recent Flood Events and Costs Date State Location Total cost*
Feb-08 QLD Mackay, North QLD $342m
Jan-08 QLD Emerald, Rockhampton, Central QLD $104m
Jan-98 QLD Townsville $154m
Jan-98 NT Katherine $163m
* Indexed to allow for estimated population increases and inflation
Source: Insurance Council Disaster List
This list (and what is missing from the list) serves to illustrate some of the challenges in estimating
damages caused by flooding:
� Non-riverine flood:
� A significant recent event was the June 2007 Hunter Event. Heavy rains caused
widespread water damage, which led to a high number of claims being made as well
as thousands of residents needing to be evacuated due to rising flood waters.
However, almost all of these damages were treated as storm damage rather than flood
damage and insurance companies provided coverage. This event does not appear on
the Insurance Council’s register with “flood” in the title.
� In the case of the February 2008 Mackay flood, insurers agreed to pay out claims as
the floods were caused by torrential rain which could not be redirected through the
city’s drainage system into the ocean due to high tides. Unlike the Hunter event, this
event was classified on the register as flood.
Despite these different classifications, it would be reasonable to view both the above events
as involving flood damage.
� Riverine flood: On the other hand insurers refused to pay out many claims for the January
2008 Emerald/Central Queensland disaster where rain caused the Nogoa River and other
rivers to overflow. Insurers claimed that damages were caused by riverine flood rather than
by downpour of rain, and this resulted in some media backlash.
2.3 Estimate of Costs Not Paid by Insurers
Overall costs
Work was undertaken for the Insurance Council in 2006 to estimate riverine flood losses for Home
Insurance. The work was based on the exposed dwellings in flood prone areas and damage curves
showing the expected costs associated with certain levels of flooding. The results of this work,
which have been presented at public forums previously, are summarised below. It is known that
there are some limitations of this work, including that flood maps did not exist for all regions and
The Insurance of Flood Risks
ta|K:\R&D\FLOOD\GI_SEMINAR_NOV08\REPORT\THE INSURANCE OF FLOOD RISKS - FLOOD WORKING PARTY - FINAL.DOC 5
some recent housing developments in flood plains were not recognised. Nevertheless, the results
from this work provide an indication of the broad scale of the cost.
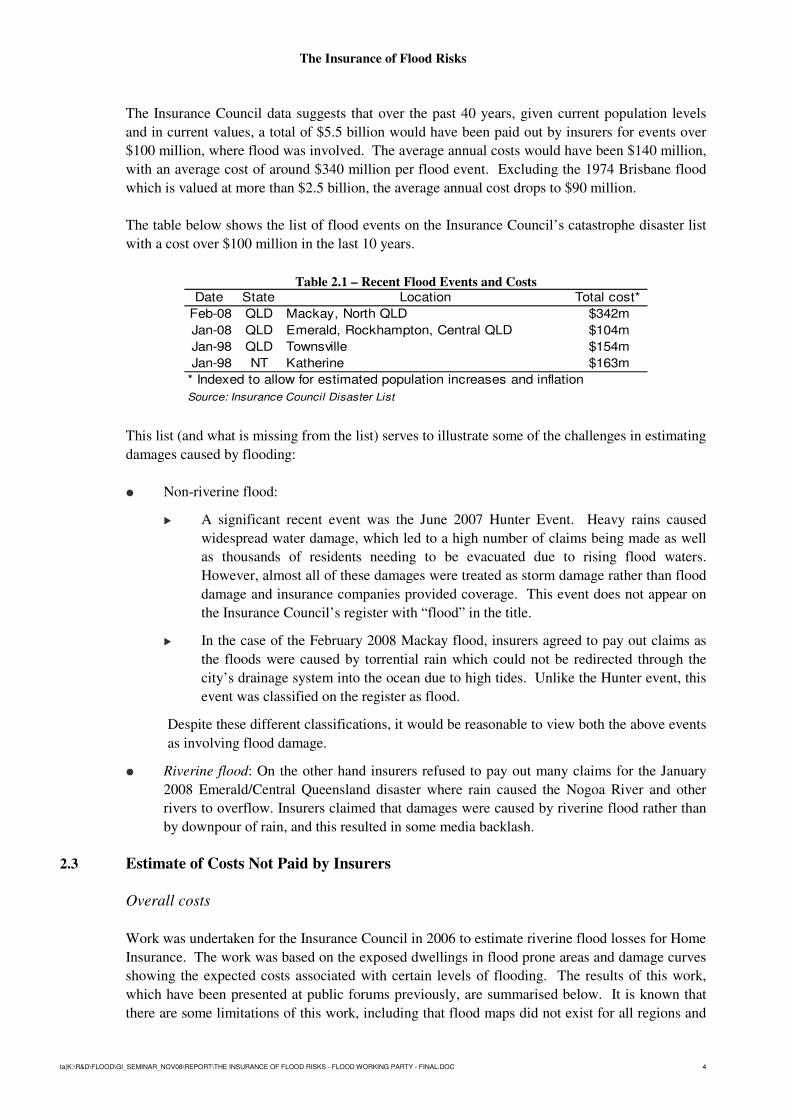
Figure 2.2 – Annual Average Damage for Riverine Flood – Home Insurance
151127
84
243
$0 m
$50 m
$100 m
$150 m
$200 m
$250 m
$300 m
1000 to
PMF
250 to 1000100 to 25050 to 10020 to 50<20
NilNegligibleRemoteLowMediumHigh
ARI / Perceived Risk
Source: 2006 Insurance Council Flood Analysis
The work provided the annual average home insurance damage for riverine flood across different
risk groups classed by ARI (Average Recurrence Interval – i.e. how often the area is flooded).
The total annual average damage across all dwellings is around $370 million. Most of the cost
($243 million) related to houses with an ARI of < 20 years.
The Insurance Council review included allowance for additional costs that may be incurred after
the initial claim for a flood event is made. For example external damage (items such as fences,
pools, landscaping, sheds, lawnmowers, tools etc), alternative accommodation and clean up costs.
These extra costs may add around 10-15% to the cost.
In considering the total costs that insurers could be liable for relating to riverine flood, it is
necessary to also include:
� extra costs that may emerge under commercial property coverage: from analysis of the
level of commercial versus private claims costs for other catastrophe perils, but also having
regard to the fact the flood coverage is already more widespread for commercial, we
estimate this may be a further $200 million p.a. – i.e. less than the costs under Home
Insurance. This figure is even more “indicative” than the $370m for Home.
� costs already met by insurers: based on the figures shown in Figure 1 these may be around
$100 million p.a.
Hence the total extra riverine flood costs may be around $470 million (roughly $370 million +
$200 million - $100 million) – say $500 million in round figures.
The Insurance of Flood Risks
ta|K:\R&D\FLOOD\GI_SEMINAR_NOV08\REPORT\THE INSURANCE OF FLOOD RISKS - FLOOD WORKING PARTY - FINAL.DOC 6
Is $500 million plausible?
Does this figure of $500 million p.a. pass the reality test?
For the estimate to be correct it would mean that in the last 10 years, given average experience,
there would have been $5 billion (in current values) of losses sustained in the market that insurers
did not pay for, but would have if riverine flood was an insured peril. On the face of it this seems
high. Actual losses in the last ten years would have been significantly lower. We note, however,
that the last ten years has been dominated by El Nino and were therefore significantly drier than
average. This reinforces that assessment of weather claims costs is challenging, even given as
much as 10 years’ data.
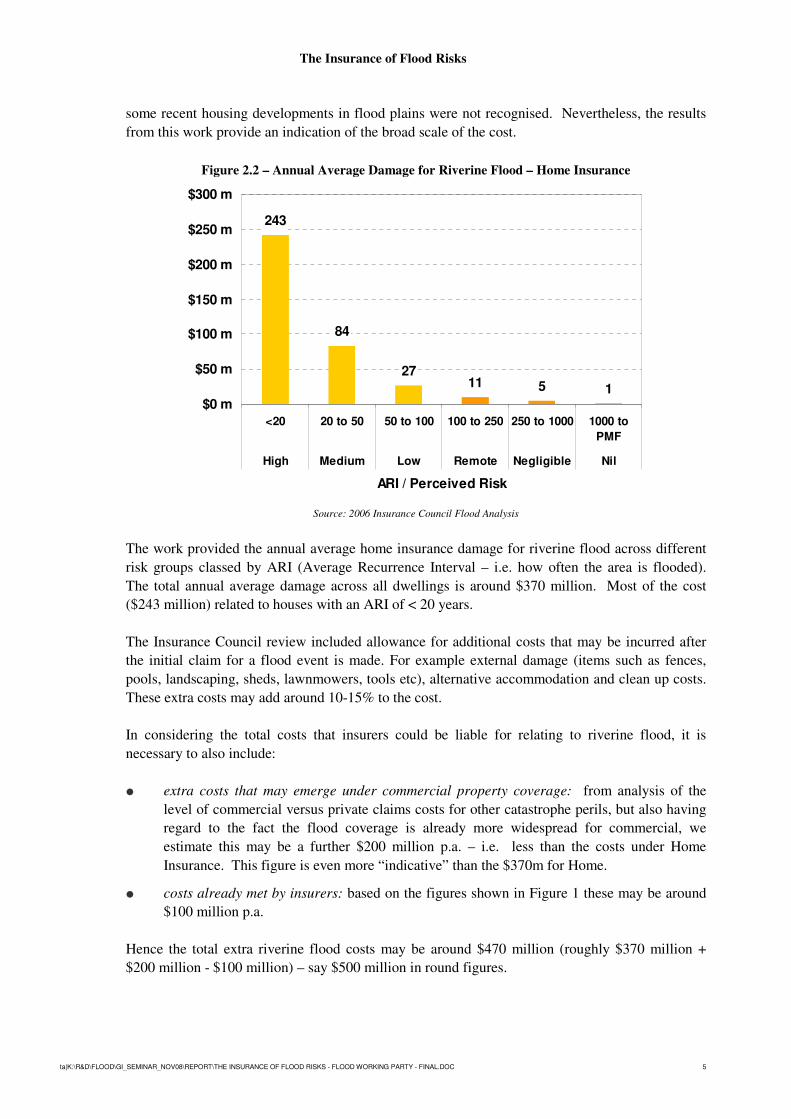
In order to better understand how much of the cost is in the more extreme events, it is useful to
review the following probability distribution implied by the work undertaken for the Insurance
Council. This work shows the following probabilities of aggregate claims costs in the years
exceeding certain levels.
Table 2.1 – Aggregate Annual Losses due to Flood
0
1,000
2,000
3,000
4,000
5,000
6,000
0.00 0.01 0.02 0.03 0.04 0.05
Annual Exceedance Probability
Co
st
($m
)
Source: 2006 Insurance Council Flood Analysis
Table 2.2 shows the distribution of flood cost implied by Figure 2.1.
Table 2.2 – Modelled Distribution of Flood Cost – Home Insurance Event Cost % Total
AEP ARI (years) at this ARI ($b) Cost*
0.001 1000 5.1 1.7%
0.004 250 2.3 3.7%
0.01 100 1.7 6.8%
0.05 20 0.9 19.3%
0.1 10 0.7 29.2%
0.25 4 0.4 49.3%
* Includes cost of events at this size or greater Source: 2006 Insurance Council Flood Analysis
The Insurance of Flood Risks
ta|K:\R&D\FLOOD\GI_SEMINAR_NOV08\REPORT\THE INSURANCE OF FLOOD RISKS - FLOOD WORKING PARTY - FINAL.DOC 7
Despite the cost of events with ARI of 100 years or more being at least $1.7 billion, these events
contribute less than 10% of the overall estimated cost.
The results shown in the table imply that we would expect to experience around 50% of the total
$500 million p.a. flood cost on average every 4 years. It is difficult to reconcile this with recent
experience. Hence we believe that it is possible that the $500 million of extra annual cost of flood
is excessive, even allowing for the largely benign environment over the last 10 years.
Cost per risk
The work undertaken for the Insurance Council included an assessment of the estimated cost of
flood per annum for properties within various ARI bands. The results of this work are shown in
the table below.
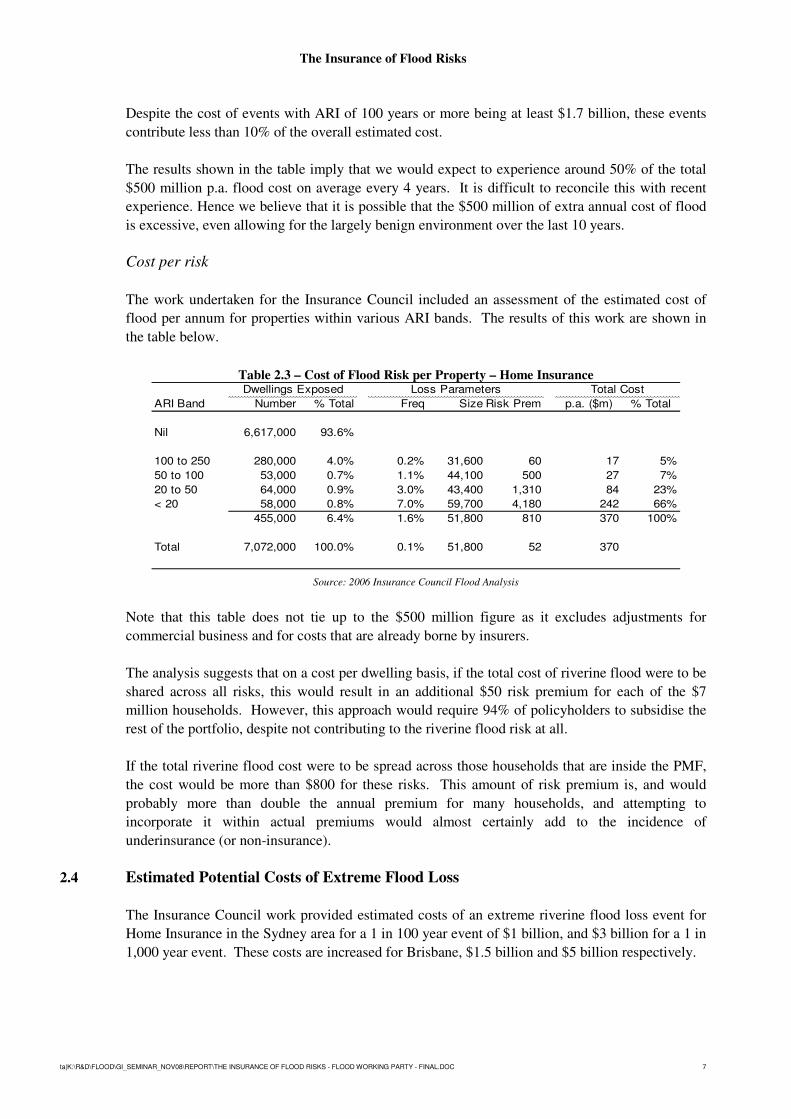
Table 2.3 – Cost of Flood Risk per Property – Home Insurance Dwellings Exposed Loss Parameters Total Cost
ARI Band Number % Total Freq Size Risk Prem p.a. ($m) % Total
Nil 6,617,000 93.6%
100 to 250 280,000 4.0% 0.2% 31,600 60 17 5%
50 to 100 53,000 0.7% 1.1% 44,100 500 27 7%
20 to 50 64,000 0.9% 3.0% 43,400 1,310 84 23%
< 20 58,000 0.8% 7.0% 59,700 4,180 242 66%
455,000 6.4% 1.6% 51,800 810 370 100%
Total 7,072,000 100.0% 0.1% 51,800 52 370
Source: 2006 Insurance Council Flood Analysis
Note that this table does not tie up to the $500 million figure as it excludes adjustments for
commercial business and for costs that are already borne by insurers.
The analysis suggests that on a cost per dwelling basis, if the total cost of riverine flood were to be
shared across all risks, this would result in an additional $50 risk premium for each of the $7
million households. However, this approach would require 94% of policyholders to subsidise the
rest of the portfolio, despite not contributing to the riverine flood risk at all.
If the total riverine flood cost were to be spread across those households that are inside the PMF,
the cost would be more than $800 for these risks. This amount of risk premium is, and would
probably more than double the annual premium for many households, and attempting to
incorporate it within actual premiums would almost certainly add to the incidence of
underinsurance (or non-insurance).
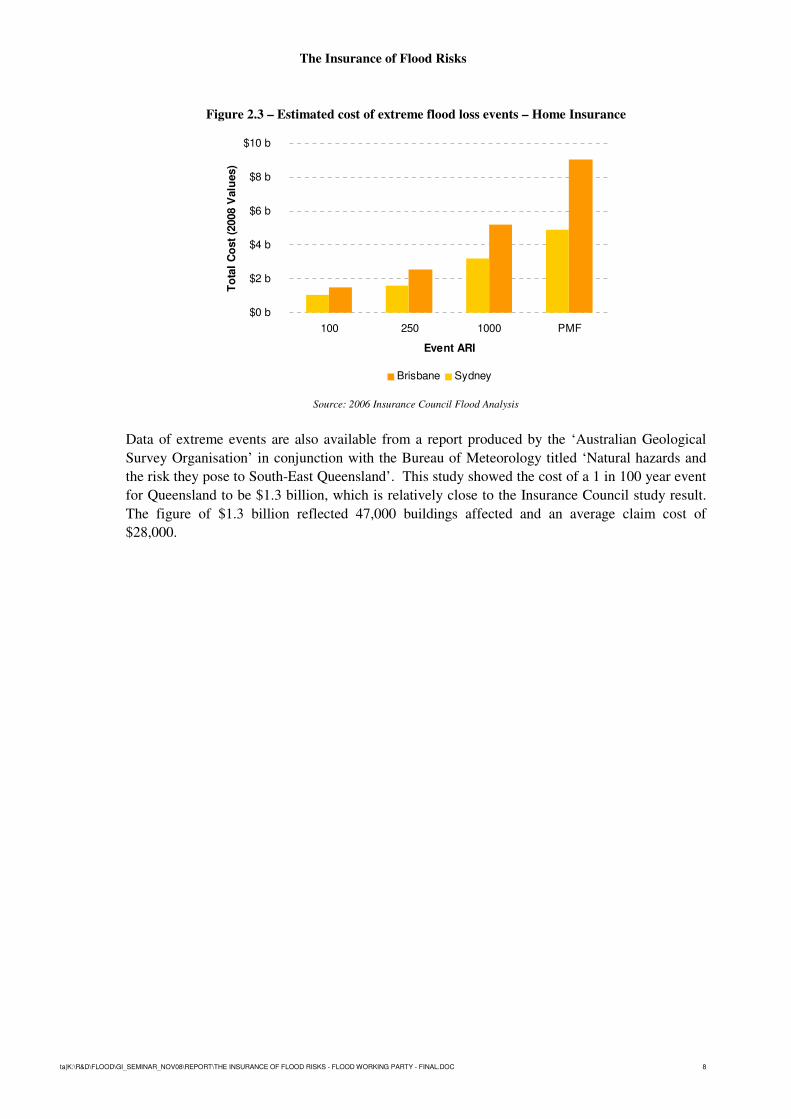
2.4 Estimated Potential Costs of Extreme Flood Loss
The Insurance Council work provided estimated costs of an extreme riverine flood loss event for
Home Insurance in the Sydney area for a 1 in 100 year event of $1 billion, and $3 billion for a 1 in
1,000 year event. These costs are increased for Brisbane, $1.5 billion and $5 billion respectively.
The Insurance of Flood Risks
ta|K:\R&D\FLOOD\GI_SEMINAR_NOV08\REPORT\THE INSURANCE OF FLOOD RISKS - FLOOD WORKING PARTY - FINAL.DOC 8
Figure 2.3 – Estimated cost of extreme flood loss events – Home Insurance
$0 b
$2 b
$4 b
$6 b
$8 b
$10 b
PMF1000250100
Event ARI
To
tal
Co
st
(2008 V
alu
es)
Brisbane Sydney
Source: 2006 Insurance Council Flood Analysis
Data of extreme events are also available from a report produced by the ‘Australian Geological
Survey Organisation’ in conjunction with the Bureau of Meteorology titled ‘Natural hazards and
the risk they pose to South-East Queensland’. This study showed the cost of a 1 in 100 year event
for Queensland to be $1.3 billion, which is relatively close to the Insurance Council study result.
The figure of $1.3 billion reflected 47,000 buildings affected and an average claim cost of
$28,000.
The Insurance of Flood Risks
ta|K:\R&D\FLOOD\GI_SEMINAR_NOV08\REPORT\THE INSURANCE OF FLOOD RISKS - FLOOD WORKING PARTY - FINAL.DOC 9
3 Data
3.1 Risk Data
We set out below the nature of risk level data needed for riverine flood pricing, and some of the
limitations regarding its use. To provide further context, in the appendix we have described how
information of this type might be prepared.
Nature of data
For each G-NAF1
- depth above ground level of flood at various ARIs
- ideally this would be available for at least ARIs of 20 years, 100 years and PMF.
Note 1: G-NAF® (Geocoded National Address File) is Australia’s first authoritative geocoded address index for
the whole country, listing all valid physical addresses in Australia. It contains approximately 12.6 million
physical addresses, each linked to its unique geocode (that is, the specific latitude and longitude of the address).
Data used to build G-NAF® comes from contributors that include the Australian Electoral Commission, Australia
Post, state, territory and Australian Government mapping agencies and land registries.
Accuracy and Limitations
Property Location
In relation to the G-NAF, the geocode itself comes from the local jurisdiction - in the main State
government mapping agencies. Different States have different standards for where they place the
point - e.g. it may be Xm inside centre of 'front' boundary or the centroid of the property. This
will not necessarily accurately reflect where the dwelling is situated in all cases.
There may also be challenges with data quality and properties missing the latitude / longitude for
various reasons.
Missing Flood Surfaces
Water surface stream profiles discussed in A.3 may not be available for a sufficient range of
forecast floods. For many older flood studies only 100 year ARI data is available. This makes it
difficult to model a risk premium that takes into account the full range of floods a property can be
subjected to, or to identify all properties that may be at risk in a given catchment.
Currency of Source Data
Of particular importance is the extent to which the key input datasets of flood surfaces, Digital
Terrain Models (DTMs) and property locations are up to date. Specifically;
� more up to date data will better reflect current conditions, including new mitigation
structures such as levees and retention basins
� developments in data collection and modelling processes generally result in more recent
data having a higher degree of accuracy
� disparity between dataset dates can cause inconsistencies in modelled output.

The Insurance of Flood Risks
ta|K:\R&D\FLOOD\GI_SEMINAR_NOV08\REPORT\THE INSURANCE OF FLOOD RISKS - FLOOD WORKING PARTY - FINAL.DOC 10
Variation to ‘Public’ Flood Risk Information
Some councils and catchment authorities freely communicate flood risk information to the public.
Others will only provide it to the actual resident at risk.
The methodology described in Appendix A leads to an approximation of flood risk. Variations in
the assumptions used for each step can lead to different results to those communicated by flood
management authorities. In addition, councils may hold back flood risk information which is more
up to date than that which could be sourced for the model described in Appendix A.
Public perceptions of flood risk can therefore be different from those represented by this model.
DTM Limitations
Currency and resolution are key drivers of the accuracy of a DTM. Some older DTMs were
created from digitised 2m contours. Coastlines and points below 2m are of particular concern.
3.2 Damage Curves
Damage curves describe the relationship between the level of above ground inundation and the
damage to an individual property. The depth of flooding is sometimes expressed in terms of the
extent of above floor flooding (as distinct from above ground). The water level used to assess the
damage is the highest water level recorded during the flood event.
The average loss may be expressed as either a dollar amount, or a % of sum insured (which is
preferable).
Figure 3.1 shows an illustrative curve.
Figure 3.1 – Illustrative Damage Curve
0
10
20
30
40
50
60
70
80
90
100
0 0.5 1 1.5 2
Depth of Overfloor Inundation (m)
Avera
ge %
Dam
ag
e
Buildings Contents
Source: ‘Economic Benefits of Land Use Planning in Flood Management’, URS Australia, 2002
The Insurance of Flood Risks
ta|K:\R&D\FLOOD\GI_SEMINAR_NOV08\REPORT\THE INSURANCE OF FLOOD RISKS - FLOOD WORKING PARTY - FINAL.DOC 11
Typically, the increase in cost is less than the proportionate increase in flood depth (e.g. the cost of
a 2m flood is less than double that of a 1m flood).
It is important to understand how the damage curve was compiled. For example, some curves do
not allow for the total collapse of the structure and the loss of all its contents (whereas others do
increase up to damage of 100% of sum insured). In the case of the former, some separate
allowance for total losses associated with the most severe floods may be needed.
In theory, different damage curves should be used by:
� region; and the type of flood likely in that area. This reflects that the severity of a flood is
defined by more than just its depth, with factors such as the velocity of the floodwaters and
the duration of flooding also relevant to the cost likely to emerge. In this regard it is
necessary to consider the topographical characteristics of each catchment area
� type of buildings (eg. construction type, number of storeys, floor height)
� product (eg. commercial versus home)
� coverage (eg. buildings versus contents, indemnity versus replacement value)
� rating factors (eg. for commercial, the nature of business would be an important driver)
� socio-economic profile of region (which is linked to the nature of the properties insured).
Flood damage curves may be developed based on empirical analysis. However this is not always
possible, and some curves may be developed synthetically by examining properties and estimating
the types of damage that will be sustained at various water depths.
3.3 Other Data Sources
Besides the information available on flood risk, there are a number of other data sources that may
be required by an insurer to comprehensively rate flood. These include specific policyholder
information, including:
� building construction type
� whether it is a Buildings or Contents policy
� whether coverage is Residential or Commercial
� number of storeys
� whether there are any rooms below ground level
� height of building from ground level, including if the building is built on stilts
� what external buildings are covered, e.g. sheds, swimming pools, fences.
The Insurance of Flood Risks
ta|K:\R&D\FLOOD\GI_SEMINAR_NOV08\REPORT\THE INSURANCE OF FLOOD RISKS - FLOOD WORKING PARTY - FINAL.DOC 12
4 Methodology
This section discusses the basics of determining the risk premium. Some of the complexities and
theoretical challenges will be dealt with in Section 5 of this paper.
Conceptually it is a straightforward matter to combine the information available at the risk level
about the depth of flood at various return intervals with the damage curve, to derive the costs that
will emerge from those floods.
We will demonstrate how to evaluate the cost of flood for a single property in this section, using
two examples – one property with “high” flood risk and one with “medium” flood risk. We will
also separately calculate a premium for Buildings and Contents.
Note that the examples given in this section are purely illustrative and are not necessarily
indicative of the true cost of flood risks.
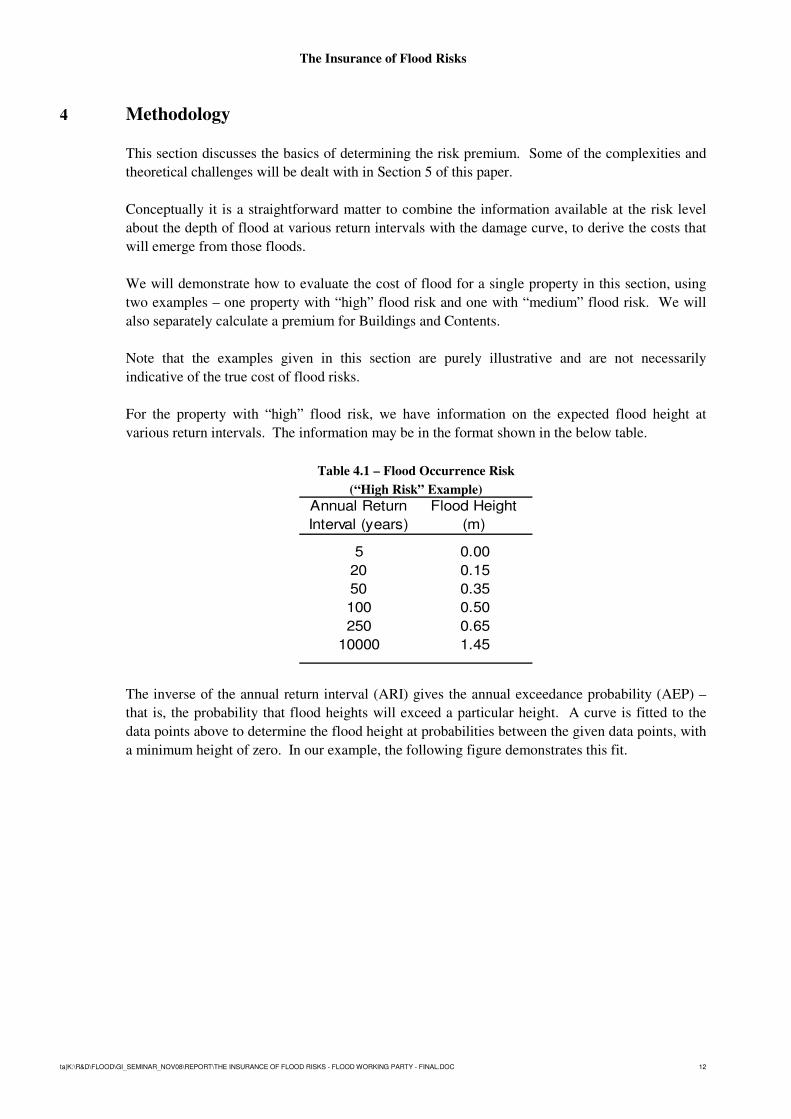
For the property with “high” flood risk, we have information on the expected flood height at
various return intervals. The information may be in the format shown in the below table.
Table 4.1 – Flood Occurrence Risk
(“High Risk” Example)
Annual Return
Interval (years)
Flood Height
(m)
5 0.00
20 0.15
50 0.35
100 0.50
250 0.65
10000 1.45
The inverse of the annual return interval (ARI) gives the annual exceedance probability (AEP) –
that is, the probability that flood heights will exceed a particular height. A curve is fitted to the
data points above to determine the flood height at probabilities between the given data points, with
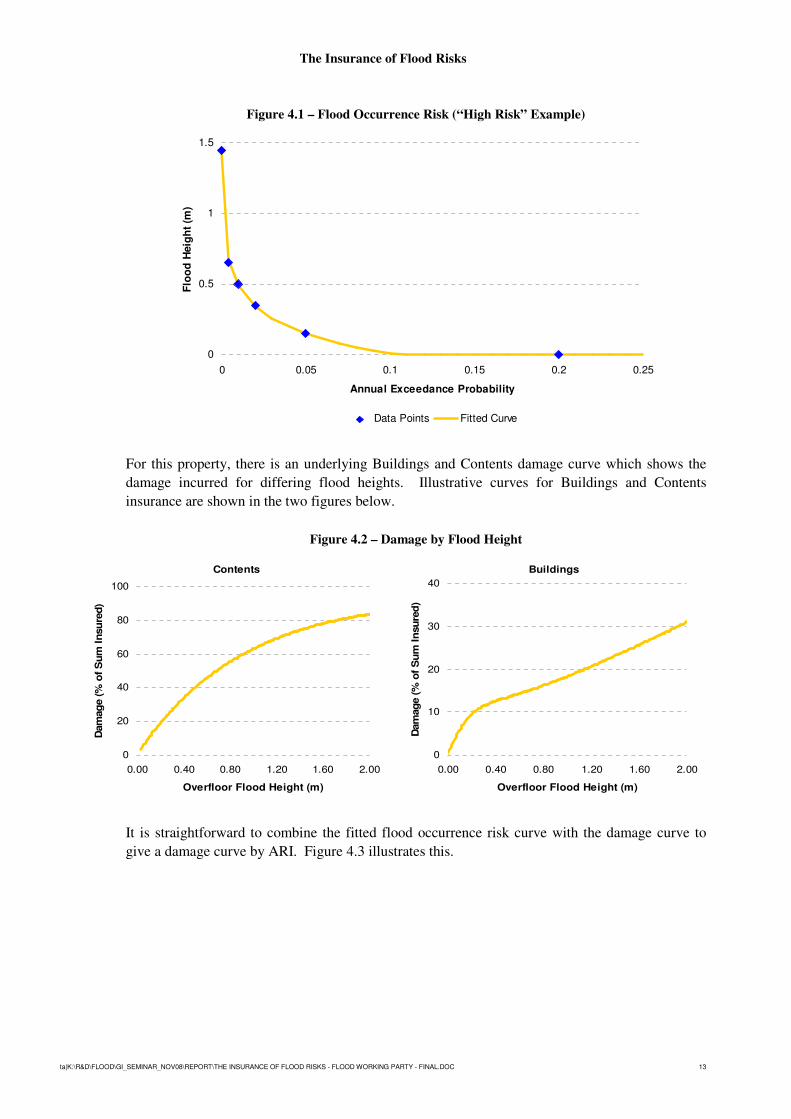
a minimum height of zero. In our example, the following figure demonstrates this fit.
The Insurance of Flood Risks
ta|K:\R&D\FLOOD\GI_SEMINAR_NOV08\REPORT\THE INSURANCE OF FLOOD RISKS - FLOOD WORKING PARTY - FINAL.DOC 13
Figure 4.1 – Flood Occurrence Risk (“High Risk” Example)
0
0.5
1
1.5
0 0.05 0.1 0.15 0.2 0.25
Annual Exceedance Probability
Flo
od
Heig
ht
(m)
Data Points Fitted Curve
For this property, there is an underlying Buildings and Contents damage curve which shows the
damage incurred for differing flood heights. Illustrative curves for Buildings and Contents
insurance are shown in the two figures below.
Figure 4.2 – Damage by Flood Height
Contents
0
20
40
60
80
100
0.00 0.40 0.80 1.20 1.60 2.00
Overfloor Flood Height (m)
Dam
ag
e (
% o
f S
um
In
su
red
)
Buildings
0
10
20
30
40
0.00 0.40 0.80 1.20 1.60 2.00
Overfloor Flood Height (m)
Dam
ag
e (
% o
f S
um
In
su
red
)
It is straightforward to combine the fitted flood occurrence risk curve with the damage curve to
give a damage curve by ARI. Figure 4.3 illustrates this.

The Insurance of Flood Risks
ta|K:\R&D\FLOOD\GI_SEMINAR_NOV08\REPORT\THE INSURANCE OF FLOOD RISKS - FLOOD WORKING PARTY - FINAL.DOC 14
Figure 4.3 – Damage by ARI
Contents
0%
10%
20%
30%
40%
50%
60%
70%
80%
1 10 100 1,000 10,000
Annual Return Interval (years)
Dam
ag
e (
% o
f S
um
In
su
red
)
Buildings
0%
5%
10%
15%
20%
25%
1 10 100 1,000 10,000
Annual Return Interval (years)
Dam
ag
e (
% o
f S
um
In
su
red
)
The expected cost of flood can then be estimated by determining the area under each of these
curves. In this example, the annual flood risk is equivalent to 1.8% of the sum insured for Contents
and 0.8% of the sum insured for Buildings. Therefore, this implies risk premiums (for a policy
with $80,000 sum insured on Contents and $300,000 sum insured on Buildings) of $1,440 and
$2,400 per annum respectively.
For a “low” flood risk (as distinct from the majority of risks with no flood risk), which has flood
occurrence risk as shown in Table 4.2, if we adopt the same damage curves as above, the annual
flood risk is equivalent to 0.10% of the sum insured for Contents and 0.05% of the sum insured for
Buildings. For the same sum insured coverage as above, this is equivalent to a risk premium of
$80 and $150 per annum for Contents and Buildings respectively.
Table 4.2 – Flood Occurrence Risk
for “Low Risk” Example Annual Return
Interval (years)
Flood Height
(m)
5 0.00
20 0.00
50 0.00
100 0.00
250 0.08
10000 0.40
Adjustments for major floods
Where the velocity of the floodwater is considered high enough to demolish a structure, there may
be an argument for using the replacement value of the structure and contents rather than the
damage curve (unless this has been allowed for in the damage curve). Such magnitudes of
velocity are usually, but not always, experienced only in extreme flood events—that is, floods of a
magnitude greater than a 100 year ARI. Hence this is probably more of an issue for PML type
considerations.
The Insurance of Flood Risks
ta|K:\R&D\FLOOD\GI_SEMINAR_NOV08\REPORT\THE INSURANCE OF FLOOD RISKS - FLOOD WORKING PARTY - FINAL.DOC 15
Adjustments for other costs
As discussed in Section 2 it is also necessary to make allowance for costs such as external damage,
accommodation and clean-up costs (assuming these are not allowed for implicitly via the damage
curve).

The Insurance of Flood Risks
ta|K:\R&D\FLOOD\GI_SEMINAR_NOV08\REPORT\THE INSURANCE OF FLOOD RISKS - FLOOD WORKING PARTY - FINAL.DOC 16
5 Key Challenges
5.1 Double Counting of Costs
Determining the exact cost of riverine flood is complicated by the interplay with other perils such
as storm.
For example, assume that a flood 200km upstream takes one week to travel down to a town and
that around the time the flood peak hits, it also rains on the town. Separating the loss into that
pertaining to the top ‘millimetre’ of water, and the rest below creates claims problems and legal
issues. Some insurers have attempted to do this in the past, and have received public backlash. It is
now not uncommon for insurers to simply pay these claims ex-gratia. As a result, it is important to
understand how much of the riverine flood cost is already paid by the insurer and built into
premiums, and to deduct this cost from the estimated riverine flood cost so that it is not double
counted.
5.2 Cost of Reinsurance
Some reinsurers have indicated that they will support riverine flood coverage as long as the insurer
can demonstrate a sound pricing structure and as a result, are charging sufficient premium for the
risk – indeed reinsurers are already providing this coverage.
Much of the cost of flood lies in the extreme events, and as such a large proportion of the cost
borne by insurers would ultimately be paid for by reinsurers and reflected in the premiums they
charge.
One challenge that flows from the significant costs being borne by reinsurers is the allocation of
reinsurance premiums for pricing, or at least the net cost of the coverage. To put this challenge in
context, we would ask how successful insurers have been in allocating the costs of reinsurance to
properties more exposed to cyclone risk (for example, those closest to the coast), or to properties
most exposed to bushfire. This has led to an element of community rating. Will flood be treated
similarly?
5.3 Commercial Lines Flood Costing
Besides the use of differing damage curves that reflect the damageability of commercial risks, it is
necessary to consider potential consequential loss costs that could emerge. These could be
significant.
5.4 Impact of Climate
Global warming
Global warming projections for Australia are for less rain in most populated areas, but the intensity
of rainfall is expected to increase. Drier conditions can elevate risks of flooding. Lack of rainfall
leads to serious soil absorption problems in many outback and even urban areas. Consequently,
even the smallest amount of rain is not able to be absorbed into the soil and can cause run-off and
possible flooding. On balance the drier soils and increased intensity probably mean that riverine

The Insurance of Flood Risks
ta|K:\R&D\FLOOD\GI_SEMINAR_NOV08\REPORT\THE INSURANCE OF FLOOD RISKS - FLOOD WORKING PARTY - FINAL.DOC 17
flood costs will increase (for flash flooding this is more certain), although the effects will emerge
over long periods and will be outweighed by natural climate cycles (see below).
Another factor that will impact, although again over a long period of time, is increased storm surge
occurring on higher mean sea levels. This will enable inundation and damaging waves to
penetrate further inland.
Natural variability
Unlike drought, flooding is often localised and therefore not as closely tied to broad-scale effects
like the El Niño-Southern Oscillation phenomenon.
However, the La Niña years of 1916, 1917, 1950, 1954 through 1956, and 1973 through 1975
were accompanied by some of the worst and most widespread flooding this century. The 1974
Brisbane floods and record rainfalls in vast areas of inland Australia during 1989 are recent
examples of this. The Bureau of Meteorology website indicates that flooding is more likely than
usual during La Niña years and less likely in El Niño years, through heavy rain and flooding often
accompany the breakdown of El Niño in late summer or autumn.
For this reason, as for other weather related perils, care is needed in drawing conclusions about
costs using short time frames (and even 20 years would be considered short in this context).
The Insurance of Flood Risks
ta|K:\R&D\FLOOD\GI_SEMINAR_NOV08\REPORT\THE INSURANCE OF FLOOD RISKS - FLOOD WORKING PARTY - FINAL.DOC 18
Part 3 Customer Prices for Flood Insurance
1 Introduction
1.1 Background
Until recently, offering flood insurance has been considered ‘too hard’ for most insurers. However
in recent times many of factors causing flood to be in the ‘too hard basket’ have been addressed:
� data is becoming easier to get;
� systems capabilities are improving; and, most importantly,
� more competitors are providing cover.
Whilst the positions taken by competitors will influence the approach, each individual company
will weigh the considerations differently. The actual cover being offered, impact of pricing on
existing and potential new customers (and overall growth), methods of distribution, portfolio goals
(reduce exposure to catastrophes vs price for risk vs some other) and the nature and sophistication
of pricing and administration systems all contribute to the appropriate outcome for the class of
business in question for a company.
On top of these considerations, the approach to pricing depends on the insurer’s view of the data
available, and of its fitness for the purpose. The fact that a ‘perfect’ pricing model is difficult, if
not impossible, to achieve means that actuaries approaching this problem need to be prepared to
apply a degree of pragmatism. Designing an approach that allows a limited amount of manual
intervention will also improve the chances of a successful implementation. However, a
preparedness to adjust the pricing soon after it first goes live, in response to any unforeseen issues,
is still required.
This paper has been put together by the Flood Working Group, and addresses the issues that must
be considered when setting customer prices for flood insurance. A separate paper considers the
technical issues surrounding flood pricing.
1.2 Structure of paper
The remainder of this paper is structured as follows:
� Section 2 - Pricing Approach and Objectives: describes the issues to consider in relation to
the insurer’s approach to pricing, differences between classes of business, the impact of
company objectives and definitions of cover;
� Section 3 - Data, Systems and Competitors: outlines the issues confronted with the
availability and quality of data, the limitations of administration systems and the potential
impact of competitors;
� Section 4 - Key Challenges: Summarises the key challenges faced in the practical
implementation of flood insurance cover.
Note that the contents of Sections 2 and 3 are inter-related and should not be considered to be
independent of each other.
The Insurance of Flood Risks
ta|K:\R&D\FLOOD\GI_SEMINAR_NOV08\REPORT\THE INSURANCE OF FLOOD RISKS - FLOOD WORKING PARTY - FINAL.DOC 19
2 Pricing Approach and Objectives
2.1 Pricing Approach
As with most pricing tasks, the technical price for flood risk involves understanding the expected
frequency of claims and expected size. As with many natural hazards, events of different
magnitude have different expected frequencies – or return periods. If it were possible to estimate,
the technical rate would be described as the sum of various event sizes with their expected
likelihood.
The earlier paper in this document discusses the basics of the modelling required to determine this
cost. Importantly however, the complexities of the problem mean that a ‘perfect’ set of rates will
be very difficult to achieve. Furthermore, numerous models may exist that lead to very different
outcomes. This is a particular problem for flood, compared to other perils, as there is a limited
number of observed (and insured!) historical events that can be drawn on in calibrating models,
and therefore a larger than usual number of assumptions are required in the modelling.
Therefore, it should be expected that ‘phases’ of rates would be developed and released, as the
understanding of flood evolves over time. Indeed, with every set of rates prepared there will be
some limitations. It is quite common to have examples of a small number of risks (also known as
‘corner cases’) which do not fit the norm and as such have unusual or anomalous results.
Examples of this exist in Rocklea and Northgate in Brisbane, where relatively high frequency (1 in
10 year) minor flooding occurs. Whilst the normal flood models identify this, a number of houses
are erroneously identified as being at risk of flood due to the models not being sufficiently refined,
and also because no consideration is made of local mitigation efforts.
Hence the task of setting actual premium rates needs to heavily consider so-called “type I” and
“type II” errors, and their impact on the business. That is, customers who have been identified
(and charged) as being at risk of flood when they are not at risk (type I), and customers who are at
significant risk of flood but have not been identified (type II).
Furthermore, this focus on error needs to be in the context of competitors, and the overall company
pricing objectives. For example, a customer identified incorrectly as being at flood risk may be a
‘lost opportunity’ unless the appropriate systems are in place for dealing with the error, once
identified. Without a mechanism for ‘fixing’ the price, the customer could simply go to another
insurer with a cheaper rate. Whilst this example uses price as the trigger for moving, it also
applies to situations where customers are not accepted because of flood risk. Manual mechanisms
for dealing with incorrect system premiums need careful thought to ensure they are not abused.
Of course, customers who are incorrectly identified as not being at risk of flood will still be
accepted at a price below their true risk price. Whilst not desirable, it is arguable that this type of
error is a preferable type of error for most companies – although if widespread it will expose the
insurer to large losses from one catastrophic event. So it is important to retain a degree of
pragmatism in determining premiums, and not be too focussed on having a ‘perfect’ answer.
It should be remembered that these type I and II errors exist elsewhere in the pricing structure. The
main differences with flood, however, are the magnitude of the potential premium swing as a
result, and the potential for large volumes of losses simultaneously from one event.
The Insurance of Flood Risks
ta|K:\R&D\FLOOD\GI_SEMINAR_NOV08\REPORT\THE INSURANCE OF FLOOD RISKS - FLOOD WORKING PARTY - FINAL.DOC 20
The main argument against this approach to setting prices applies in situations where the cover is
provided as an option. It is generally accepted that in this situation an information asymmetry is
likely to exist. The customer would select the option if they think they need the cover or if they
perceive it as underpriced. Further, it is a reasonable expectation that a customer, when selecting
an option, should pay for it – even if it is viewed to not present any additional risk.
Either way, most customers do not fully understand their flood risk. Observed events will weigh
heavily in their expectations – either the presence or absence of them in recent times – and this
will impact the extent to which they accept the premium presented.
2.2 Class of Business
Commercial insurance differs from personal insurance, insofar as it is not such a high-volume
product. SME business is commonly priced and underwritten in a more high-volume or automated
fashion, similar to personal insurance. Larger risks still have a fair degree of manual intervention
in the underwriting and pricing process. For these larger risks more time can be taken to
individually underwrite properties. There is therefore, for the larger commercial risks, more scope
to include individual risk features in the pricing formula, thus reflecting the characteristics and
circumstances of particular premises.
It is also more reasonable to expect (or require) a council flood survey to be sourced for each
individual large commercial risk that requires the cover. Whereas for high volume products it is
usual to pre-prepare the estimate of flood risk to minimise the effort for each individual sale, for
these larger risks the estimate can be prepared on demand using this extra information.
The other aspect of commercial risks, compared to personal, is that much of the catalogued
research has focussed on determining levels of exposure on residential risk. So whilst it is
possible, using the current techniques of geo-spatial querying, to place a commercial risk within
the modelled flood area and determine a price, there is generally less information about
commercial locations. The generally larger land parcels involved also raise questions around just
what point (or points) on the land to use for the spatial query.
There are frequently much more lenient planning guidelines for commercial properties on the basis
that they are more sophisticated consumers, ‘realise the risk’ and ‘can deal with the consequences’.
Combined with the fact that commercial properties often need large areas of flat land (frequently
found at the bottom of the hydrologic profile), it is therefore natural that greater relative risk exists,
overall, for commercial than personal.
Whilst home insurance will often have a ‘temporary accommodation’ component in the policy
offering, commercial insurance will often have a Business Interruption (BI) cover on the policy.
Potential impacts of flood on BI risks are substantial, particularly if the policy provides coverage
under ‘restricted access’ (i.e. a policyholder can claim for loss of business if access to the business
is reduced due to effects of flood, even if flood has not hit the actual property).
The Insurance of Flood Risks
ta|K:\R&D\FLOOD\GI_SEMINAR_NOV08\REPORT\THE INSURANCE OF FLOOD RISKS - FLOOD WORKING PARTY - FINAL.DOC 21
2.3 Company Objectives
Before embarking on a price setting exercise, it is important to determine the company’s goals.
Many aspects of this will be new to the insurer, because of the previous industry approach to flood
insurance. Indeed, getting consensus may prove difficult, particularly where a mindset of ‘avoid’
persists.
That said, avoidance is a valid strategy, and pricing outcomes that achieve it are fairly
straightforward to develop. As per the discussion of the type I and type II risks earlier, in this case
the company would have less concern about the type I risks and be more willing to accept higher
prices that deter customers. In practice though, it is likely that such a strategy would be wound
back somewhat once the true impact on sales and even reputation hits the portfolio.
Nonetheless, it is important to note that an avoidance strategy changes the focus within the
modelling phase. Of course, it is still important to ensure that the premiums are not too heavy
handed in areas of marginal risk. It is these areas that require the time and effort in this case.
Avoidance can also be achieved via underwriting – in other words, the non-acceptance of risk in
affected areas. This ‘red zoning’ is common in other countries. Implementation, and in particular
dealing with moral hazard is an important consideration for this non-acceptance approach. The
failure to deny a customer means that the cover cannot be declined at claim time (depending on the
wording – more on that later).
Discouraging the business is an outcome somewhere between outright avoidance and community
rating. This is discussed in more detail in the section below on competitors. It should be noted
that even ‘true risk pricing’ can have the outcome of discouraging business in higher risk areas –
either they move to competitors that don’t have the same view of risk, simply leave the insurance
market altogether, or underinsure.
The company’s pricing philosophy may be more one of community rating or cross-subsidisation.
A company that chooses to rate this way, however, needs to monitor the mix of business to ensure
that the subsidy is funded. As is discussed below, a more community-rated approach may be
desirable for existing customers in order to limit the loss of business. Where a company
previously had an element of flash flood cover, there might already be an implicit level of
community rating in the existing rates.
The market share objectives of the company are therefore important to understand in this process,
as the decision on pricing approach can materially impact market share, especially if the approach
deviates from market treatment. Further related to market share is the market image of the
company. A company that deviates from market practice, or is seen to ‘turn its back’ on some
areas or customers, may see brand deterioration which ultimately manifests itself in market share
reductions. This is a reason to fear or avoid type I errors.
With intermediaries involved, the expectations of, and relationship with, each intermediary must
be considered. This is especially true where the company only represents a small proportion of the
intermediary’s business, or conversely where a single intermediary is a very large proportion of
the company’s business. Cross subsidies may be required to avoid losing whole accounts.

The Insurance of Flood Risks
ta|K:\R&D\FLOOD\GI_SEMINAR_NOV08\REPORT\THE INSURANCE OF FLOOD RISKS - FLOOD WORKING PARTY - FINAL.DOC 22
2.4 Definition of Cover
As with any pricing exercise, once the objective is established it is critical to determine exactly
what is being priced. In the case of flood cover, this is particularly tricky due to interplay with
other perils such as storm.
Where ‘full’ flood cover is an option, it is still common to have ‘flash flood’ (perhaps with a %
sum insured limit) included in the standard cover. In these situations, separating the pricing into
the two components can be challenging, as most modelling does not distinguish these types of
events.
Whilst modelling enhancements could be envisaged to tackle the two problems separately, there is
a very high correlation between them, and arguably the distinction is only a matter of semantics.
Indeed, even if flash flood is defined broadly as ‘connected’ flood if the rain falls within some
time period of the inundation (commonly 24 hours), there are situations where the distinction is
meaningless. These arise when a river system is of sufficiently short length – as are many of the
rivers on the east coast of Australia.
Imagine, for example, a flood 200km upstream that takes one week to travel down to a town.
Around the time the flood peak hits it also rains on the town. Separating the loss into that
pertaining to the top ‘millimetre’ of the water and the rest (below?) creates all sorts of claims
problems and legal issues. Hence it is not uncommon to simply pay these claims.
This sort of ‘scope creep’ can lead to flash flood being so closely related to full flood that it is
simpler to just split the total estimated cost arbitrarily between the two. For example, depending
on the length of the catchment, it may be appropriate to allocate as much as 90% of the ‘full’ flood
cost to flash flood, and the remaining 10% to the option for ‘full flood’.
Of course, as described earlier, where the cover is optional, it may be necessary to place an
additional loading on the cover due to the information asymmetry that exists. This is particularly
relevant in locations where it is believed by the insurer that little or no risk of flood inundation
exists. This also needs to be considered in the context of compliance where an insurer should
provide the highest cover that is available for a given price – so a ‘free’ option would imply the
cover must be provided (or at least the customer informed they can have it free).
The distinction above between ‘connected’ and ‘disconnected’ flash flood stems from the latter
being generally associated with thunderstorms and other severe rain activity. The ‘connected’
term refers to the water path being one that is a regular water course. ‘Disconnected’ flooding is
through deviations in the land that do not regularly contain water.
The separate identification of disconnected flooding highlights the other main issue with most
current modelling approaches (see below) that focus on flooding of rivers and creeks. This focus
is, in part, related to the lack of sufficiently high resolution digital elevation models. The lack of
such models precludes the necessarily detailed modelling that would reveal the water pathing that
results from the very sharp rain events that trigger these claims.
As many policy wordings consider disconnected flooding to be part of the standard ‘storm’ cover
(water off the ground), it is important to understand what would be embedded in observed claims
data, to ensure that there is not a double count with the pricing of the main storm costs.
The Insurance of Flood Risks
ta|K:\R&D\FLOOD\GI_SEMINAR_NOV08\REPORT\THE INSURANCE OF FLOOD RISKS - FLOOD WORKING PARTY - FINAL.DOC 23
Some flooding cost will also be buried in normal storm claim data due to the difficulty
distinguishing ‘water coming down’ from ‘water coming up’. For example, when storms cause
roofing damage, thereby leading to rain penetration from above, it is common for inundation to
also occur. It is seldom the concern of the claim officers to distinguish this whilst they are
processing large volumes of claims. So again, care must be taken in determining exactly what the
scope of the pricing exercise is, and to ensure that this does not lead to an inadvertent double
count.
In the last ten years, policy wording development has seen ancillary benefits added on top of the
normal repair or replacement type of cover. The most common such benefits are temporary
accommodation and removal of debris. Both of these are particularly relevant to flood cover. It is
therefore important to determine any limits that may exist on these benefits, and then how they
will relate to the underlying events behind the models that have been built.
The Insurance of Flood Risks
ta|K:\R&D\FLOOD\GI_SEMINAR_NOV08\REPORT\THE INSURANCE OF FLOOD RISKS - FLOOD WORKING PARTY - FINAL.DOC 24
3 Data, Systems and Competitors
3.1 Data Sources
Much has been made of data (or lack thereof) being a primary reason for the limited availability of
flood cover in Australia. It is not the purpose of this paper to discuss the validity of this argument,
nor to talk about the flood models themselves. However it is important to understand the data
sources that are available so that the approach to setting premiums is appropriate to the data.
The paper relating to the estimation of the cost of riverine flood describes the objective in pricing
flood broadly. However it is not common to have the information required (e.g. distribution of
claim frequency and average claim size) for all return intervals in every catchment. The main
sources of flood modelling results in Australia commonly identify the 1-in-100 year flood level.
Occasionally other return periods are also modelled, or the return period for water a certain
distance above the ground is provided. In any case, it is rare to have a full distribution, or even
more than a small number of points, to estimate the average flood cost.
The focus of many of these studies is on the river system itself and hence connected flood (and, in
some cases, flash flood). Disconnected flood is generally not studied.
So in determining a premium to charge, this raises the question of accuracy over consistency – is it
more important to have each catchment in itself as accurate as possible, or alternatively, to have all
catchments priced to a common basis?
Two results are normally available – a set of maps showing inundation areas for a particular return
period, or a dataset which shows the results at an address level. Of course, with some work the
maps can be turned into a dataset using spatial queries, however determining the depth of the flood
at each address in that case requires additional data.
From late 2008, the Insurance Council will be the source of a consistent database of flood risk for
individual addresses where much of the ‘hard work’ has been done. This database will not
initially cover every address in Australia, nor would it have results for many return periods.
It is then necessary to consider what to do in areas that the Insurance Council database does not
cover, areas that have not been surveyed, and areas where the available studies are not able to
yield useful information.
The last consideration that most people have when developing flood prices is how to maintain the
rates into the future. The risk at an individual address can change due to mitigation activities, as
well as further development of low-lying land. Of course, new buildings may also be built in
flood prone areas. Existing buildings can be knocked down and replaced with numerous, smaller
buildings. It is therefore important to ensure that the rates can be maintained to deal with these
changes.
As the understanding changes through model enhancements or simply database updates, the
impact on individual customers of the implicit ‘change in view’ needs to be managed. The
decision to gradually change prices, or simply move 100% to the new rates, is then another
portfolio decision. Many of the discussion points earlier are again relevant in this case.

The Insurance of Flood Risks
ta|K:\R&D\FLOOD\GI_SEMINAR_NOV08\REPORT\THE INSURANCE OF FLOOD RISKS - FLOOD WORKING PARTY - FINAL.DOC 25
3.2 Administration Systems
Whilst data may be considered to be the main limiting aspect in pricing for flood, it is little use
without a systematic way of implementing it. Most insurers have a mix of green-screen
‘mainframe’ type systems, windows ‘front end’ systems, web systems and other bespoke pricing
tools.
Understanding these systems, their limitations and their use by the end-users is vital to ensure
successful implementation. Pricing for flood can range from fully manual processes (triggered by
postcode of risk) through to fully automatic approaches. Sadly, the selection of solution is often
driven by the limitations of the administration system(s) being used. The adage that ‘money fixes
anything’ does hold true in this case, but where budgets are finite and time scales often limited, the
curtailing of ambition is often necessary.
The key driver in this boundary setting is the method of distribution and degree of automation
required. The burden of maintaining multiple (often slightly different) pricing systems for the
different distribution channels is a major consideration in the choice of degree of automation.
Automation requires a degree of structure and validation and that entails databases. Where
mainframes are involved, the task of loading data, in some cases in considerable volume, and
adjusting rating formulae to use this data can be quite challenging. Repeating this, and ensuring
consistency is maintained, across multiple systems is a considerable burden.
The more pricing systems there are, the more maintenance is required. Hence manual solutions
often prevail, even for high volume products, as the overhead at sale time (particularly where the
cover is for a seldom-selected option) is bearable compared to the alternative.
Nonetheless, even manual processes can be assisted by useful databases and process flows. For
example, if the risk postcode is one of the known flood risk postcodes, the system might trigger an
additional step where the user then navigates manually through suburb lists, and then through
street lists, to determine the appropriate level of risk for the address.
It may be desirable to have a further (invariably manual) process to deal with corner cases where
the underlying flood level that was retrieved is ‘too high’. By too high, it is meant that for some
reason it has come to light that the customer’s risk is much lower. This may be through a separate
flood survey that the customer has obtained (e.g. from their local council), mitigation actions that
have been implemented (such as building on a high mound, tall ‘poles’ and so on) or through an
obvious data error (such as the risk being on top of a high hill). In these situations, it is still
desirable to be able to adjust the level and hence the final premium.
Regardless of how it is determined, once a flood level is retrieved, the impact on the premium is
determined by the underlying rating formula in the pricing engine(s) in the system(s) in question.
Normally this formula is a function (usually just the product) of a number of rating factors.
Ignoring other risk perils, we can present this form as follows for flood risk in the context of home
insurance buildings cover:
The Insurance of Flood Risks
ta|K:\R&D\FLOOD\GI_SEMINAR_NOV08\REPORT\THE INSURANCE OF FLOOD RISKS - FLOOD WORKING PARTY - FINAL.DOC 26
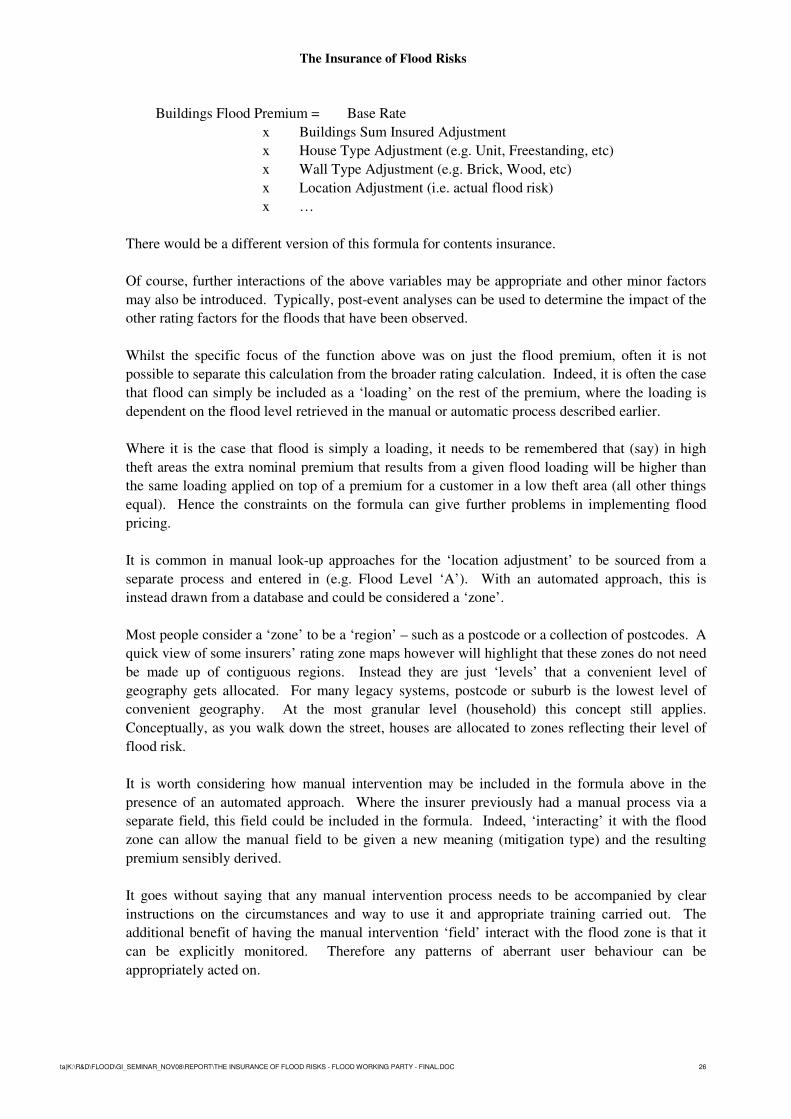
Buildings Flood Premium = Base Rate
x Buildings Sum Insured Adjustment
x House Type Adjustment (e.g. Unit, Freestanding, etc)
x Wall Type Adjustment (e.g. Brick, Wood, etc)
x Location Adjustment (i.e. actual flood risk)
x …
There would be a different version of this formula for contents insurance.
Of course, further interactions of the above variables may be appropriate and other minor factors
may also be introduced. Typically, post-event analyses can be used to determine the impact of the
other rating factors for the floods that have been observed.
Whilst the specific focus of the function above was on just the flood premium, often it is not
possible to separate this calculation from the broader rating calculation. Indeed, it is often the case
that flood can simply be included as a ‘loading’ on the rest of the premium, where the loading is
dependent on the flood level retrieved in the manual or automatic process described earlier.
Where it is the case that flood is simply a loading, it needs to be remembered that (say) in high
theft areas the extra nominal premium that results from a given flood loading will be higher than
the same loading applied on top of a premium for a customer in a low theft area (all other things
equal). Hence the constraints on the formula can give further problems in implementing flood
pricing.
It is common in manual look-up approaches for the ‘location adjustment’ to be sourced from a
separate process and entered in (e.g. Flood Level ‘A’). With an automated approach, this is
instead drawn from a database and could be considered a ‘zone’.
Most people consider a ‘zone’ to be a ‘region’ – such as a postcode or a collection of postcodes. A
quick view of some insurers’ rating zone maps however will highlight that these zones do not need
be made up of contiguous regions. Instead they are just ‘levels’ that a convenient level of
geography gets allocated. For many legacy systems, postcode or suburb is the lowest level of
convenient geography. At the most granular level (household) this concept still applies.
Conceptually, as you walk down the street, houses are allocated to zones reflecting their level of
flood risk.
It is worth considering how manual intervention may be included in the formula above in the
presence of an automated approach. Where the insurer previously had a manual process via a
separate field, this field could be included in the formula. Indeed, ‘interacting’ it with the flood
zone can allow the manual field to be given a new meaning (mitigation type) and the resulting
premium sensibly derived.
It goes without saying that any manual intervention process needs to be accompanied by clear
instructions on the circumstances and way to use it and appropriate training carried out. The
additional benefit of having the manual intervention ‘field’ interact with the flood zone is that it
can be explicitly monitored. Therefore any patterns of aberrant user behaviour can be
appropriately acted on.
The Insurance of Flood Risks
ta|K:\R&D\FLOOD\GI_SEMINAR_NOV08\REPORT\THE INSURANCE OF FLOOD RISKS - FLOOD WORKING PARTY - FINAL.DOC 27
Moving forward it will become important for an insurer to have the ability to efficiently geo-code
risks whenever a quote is required in order for flood risk rating to occur. Without this ability, an
insurer would have to aggregate risks up to a higher level, which would reduce the degree of
differentiation for flood risk between individual properties. Acquiring the ability to geo-code risks
at point of sale could be a significant hurdle for smaller insurers who may not be able to afford the
infrastructure required or large insurers that may need to implement such changes over a number
of legacy systems.
3.3 Data Quality
Administration systems bring with them their fair share of data issues. Data quality (or lack
thereof) is a primary consideration due to the need to locate individual addresses and match them
to other data sources. Data quality is relevant in relation to both the customer’s risk details and the
databases that contain the flood information. Address data is notoriously ‘dirty’, with typos
common, as well as inconsistencies in the way customers present their address.
‘Vanity Addresses’, which are unofficial addresses that are known to locals (or at least the
postman) are a further manifestation of data quality problems. As some customers get quite
particular about these (New Farm vs Fortitude Valley for example), insistence on ‘exact’ addresses
can cause either customer aggravation or failure to identify the location (and hence the incorrect
outcome).
Moral hazard or ‘devious behaviour’ (of the customer, intermediary or call centre consultant),
whereby risk location details are twisted to trick the system and cause a risk to be accepted or
offered a premium lower than would otherwise be the case, is also essentially a data quality
problem. Depending on the company objectives and pricing approach as described earlier, there
may be greater benefit to be obtained through this activity. The desire to discourage or prevent this
behaviour needs to be understood. Then approaches can be devised as required.
Something as simple as ‘if address is not found, assume the worst’ might be effective in stopping
devious behaviour but will have flow on effects in areas where the external data is not exhaustive.
High growth areas are a particular example of this that are worth considering. Growth could be
occurring in newly released flood prone land. More realistically though, not all growth in housing
would be in such areas and hence the ‘assume the worst’ approach would cut off the company’s
access to true new business.
This raises a more general issue about data quality in the external data sources. Flood databases
will age over time. Any system solution needs to consider processes for sourcing and then
updating these data feeds. In any event, even the most recent data set will be missing addresses.
The company might consider such ‘missings’ to present higher than normal risk through the
inability to locate the customer. Often however there is structure to these ‘missings’. Regional
areas are a particular example, especially where addresses are not well (or consistently) formed
such as for rural properties.
There will be reasons why the flood information is simply not available for a particular customer
(new address and so on). For high volume products, the need to be able to calculate a premium
without too much manual intervention will be paramount.

The Insurance of Flood Risks
ta|K:\R&D\FLOOD\GI_SEMINAR_NOV08\REPORT\THE INSURANCE OF FLOOD RISKS - FLOOD WORKING PARTY - FINAL.DOC 28
3.4 Competitors
The success in meeting the company objectives described earlier is in large part determined by the
competitors in the market. The extent of their coverage, their own objectives and their success in
execution will form the market place that customers are reviewing.
In situations where few other players are risk pricing, the company doesn’t need to push rates too
high before customer attrition is witnessed. This is particularly relevant when considering how to
deal with limitations in the input flood models and the approach to type I/II errors. To price ‘on
the safe side’ will still see a price that will over time on average see customer attrition in such a
market.
Where competitors are pursuing a ‘full risk based’ pricing approach, there will invariably be
different premiums charged, even where the same data sources are used. There will be situations
where a competitor thinks a risk is much higher or lower than the insurer. As a result, it can be
expected that anomalies will arise that need to be dealt with. In any event, the uncertainty
associated with flood models (and their system implementation) means that none will ever be
perfect and such situations will always exist.
Where competitors are risk pricing but the insurer decides that its objectives are not to risk price
(or at least, not price fully), there is potential for the insurer to see a growth in the number of flood
risks. Of course ‘seeing’ the growth requires appropriate monitoring systems to be in place.
Those systems need to be able to identify the risks as being at risk of flood (or not as the case may
be), hence allowing the mix to be monitored. It is the change of mix of business (and hence
erosion of cross subsidy) that is most problematic here.
Beyond just mix of business, the aggregate exposure to catchment(s) from the point of view of
event-level losses also needs to be monitored. Whilst flood events on their own may not hit
reinsurance catastrophe limits, they will contribute to the expected losses in lower layers.
3.5 Data Manipulation
No discussion about pricing at a household level would be complete without a discussion about
data volumes and, more importantly, manipulation of the data. With 7 million houses in Australia,
plus a further 4 to 5 million ‘other’ addresses, an exhaustive database could extend to over 12
million rows (yet still miss some addresses due to data sourcing issues!).
Clearly it is necessary to use reasonably advanced data manipulation techniques to be able to
handle this data. Further, loads into destination systems, as well as into ad hoc lookup systems,
need to be able to cope with these volumes. This volume of data is beyond manual data entry.
Even if a street-level manual approach is used, there are over 200,000 street/suburb/postcode
combinations in Australia. The data volumes are still a challenge, in particular with respect to
validation of the rates.
It is useful to be able to visualise the data. The most common method for this is to geo-code the
addresses, and view the points in a mapping tool. This geo-coding process may also be
challenging. There will also be points that, for various reasons, may not have a geo-code available
The Insurance of Flood Risks
ta|K:\R&D\FLOOD\GI_SEMINAR_NOV08\REPORT\THE INSURANCE OF FLOOD RISKS - FLOOD WORKING PARTY - FINAL.DOC 29
and hence can’t be mapped directly. It may be necessary to ‘approximately’ map them using a
higher-level geography such as suburb or postcode.
Attaching geo-codes to in-force addresses, as well as other data sources, will often involve an ETL
(Extraction Transformation and Load) process. That is, extracting from the source system,
transforming in to a format to feed the geo-coder, feeding the geo-coder and then re-merging the
results back to the main database.
The skills required here combine business understanding of the problem, data processing and
manipulation and a considerable amount of problem solving.
The Insurance of Flood Risks
ta|K:\R&D\FLOOD\GI_SEMINAR_NOV08\REPORT\THE INSURANCE OF FLOOD RISKS - FLOOD WORKING PARTY - FINAL.DOC 30
4 Key Challenges
4.1 Enhancing Systems
Whilst points were made above regarding the interplay of system functionality in the ensuing
pricing strategy, invariably the task of pricing for flood involves some degree of system
enhancement. These enhancements are often costly.
The actuary needs to be intimately involved in the design of the system modifications so that the
resulting solution will allow the rates to be properly implemented! For many actuaries getting
“down and dirty” with the details of the insurance system is not attractive work, and most likely
outside their area of expertise or familiarity. Failure to be involved however can lead to further
cost being incurred to rectify design problems or major trade-offs being required in the ultimate
rates.
Staff training in the use of the enhanced systems, and monitoring the actual use to ensure
appropriate behaviour, is vital. The success or otherwise of the pricing approach depends on the
way the system is used.
4.2 The Cost of Risk Rating
For many insurers, in the course of enhancing the systems to allow flood rating to be performed,
they will move from suburb or postcode rating to individual risk-address rating. The resulting
increase in scale of rating tables and the complexity of the data manipulation will require skills and
an attention to detail not commonly found in actuarial departments.
The ensuing increase in effort required to prepare and support this rating data and maintain its
currency will also put strain on expense budgets. The obvious counter to this is that it is necessary
to prevent an even more costly outcome – a flood where the insurer has an overweight amount of
exposure.
Nonetheless, getting management buy-in to the idea that a commitment to covering flood is also a
commitment to a lot of effort and cost is vital to the ongoing maintenance and success of the
pricing.
4.3 Customer Resistance
As more insurers start covering and risk pricing flood, customers in certain areas will find
insurance too expensive or simply unavailable. Even in a competitive market, there is a chance
that a common ‘avoid’ view may exist for houses in some extreme areas. In many cases these
areas are correlated with lower income areas.
The regional nature of the risk means that in some areas many residents will be in this situation. It
is possible that the whole insurance industry would be targeted by lobby groups or even
government ministers seeking to represent their constituents. In the worst case, legislation may be
introduced to protect people in these areas.
The insurance industry as a whole therefore has an interest in ensuring that the pricing approach
used by all players is sensible and not too extreme. A central data source in itself does not
The Insurance of Flood Risks
ta|K:\R&D\FLOOD\GI_SEMINAR_NOV08\REPORT\THE INSURANCE OF FLOOD RISKS - FLOOD WORKING PARTY - FINAL.DOC 31
guarantee this. The best place for each individual insurer to start is to make sure that they are not
‘over doing it’.
4.4 Mitigation Activities
It is also important for the insurance industry to participate in the discussion about flood
mitigation. This includes actively monitoring new housing developments and discouraging
developments in flood prone land. Much of this is at local government level, and hence across the
whole country it is difficult to monitor fully.
Encouraging mitigation works by quickly responding and reducing premiums once works are
completed will also provide an incentive for the local residents to lobby government (both local
and state) to provide funding for mitigation works in areas where a problem already exists.
4.5 Education
Significant confusion still exists amongst customers around the existence (or not) of flood cover
on their policies. Even insurers that don’t cover the risk could improve this situation by more
prominently displaying this in their policy wording and notices. Ideally, it would be particularly
prominent on the notices of customers that live in impacted areas.
As more insurers start to cover flood, this will become even more confusing for customers (for this
price, am I covered or not?). Again, all insurers can do more to explain what is covered in this
regard.
Ultimately, the challenge is to reduce the negative press that occurs each time there is a flood. The
main way to achieve this is via heightened awareness.
4.6 The Actuarial Control Cycle
Beyond the task of pricing for flood, it is vital that appropriate monitoring systems be set up to
understand the mix of business, and the degree of increase or decrease in flood exposure.
This monitoring would not stop a few months after initial implementation. Indeed, over the longer
term it is even more important as competitors adjust their strategy, or weaknesses in the control
framework manifest themselves.
The portfolio outcomes from the pricing implemented should approximately match the original
objectives that were set. Deviation from this would of course result in re-work, in the traditional
control cycle framework.
The Insurance of Flood Risks
ta|K:\R&D\FLOOD\GI_SEMINAR_NOV08\REPORT\THE INSURANCE OF FLOOD RISKS - FLOOD WORKING PARTY - FINAL.DOC
Part 4 Appendices/References
A Methodology for determining risk data
This appendix describes one possible approach to developing flood risk data.
A.1 Identify Flood Risk Areas
Flood risk areas to be modelled can be determined by considering both property density and the
Geoscience Australia online Flood Studies Database:
http://webmap.ga.gov.au/imf-natural_hazards/imf.jsp?site=natural_hazards_flood
This catalogues riverine flood studies completed in Australia between 1980 and mid 2004.
Further consideration can also be given to Leigh and Gissing (2006) on estimating the number of
flood prone properties in Australia.
A.2 Create a Digital Terrain Model (DTM)
A DTM is a digital representation of the surface of the earth excluding buildings, trees, bridges,
etc. These can be built from spot height data or digital contours.
Sources of digital terrain data include:
� Government Mapping Bodies - For example,
� NSW Department of Lands holds a state-wide 25m DTM as well as a 5m DTM and
2m contours for populated areas. The data is quoted as extending over a period of
time. However most is expected to date from the mid 80s or prior.
� LandVic holds 1m-5m contours over metropolitan Melbourne and 10m Contours for
regional areas. These are based on surveys conducted in the 1970s and 1980s.
� Local Councils & Catchment Authorities - Tend to hold more up to date and higher
resolution (<1m) terrain data.
� Commercial DTM data collection companies - Can provide access to both existing DTMs
collected for previous clients as well as collect data for client-specific locations.
Interpolation algorithms are used to convert terrain point data and contours into a terrain surface.
The final surface is reviewed and checked via ground truthing and/or comparisons to other GIS
sources such as topographic datasets and aerial imagery.
A.3 Create Flood Surfaces
1. Obtain water surface stream profile
These give the depth of forecast floods (eg. 20yr, 100yr, PMF) at selected stream centreline
points. They are normally found in local council or catchment authority flood studies.

The Insurance of Flood Risks
ta|K:\R&D\FLOOD\GI_SEMINAR_NOV08\REPORT\THE INSURANCE OF FLOOD RISKS - FLOOD WORKING PARTY - FINAL.DOC
2. Extend centreline points left and right across the anticipated flood plain
This is done with respect to the terrain and using engineering judgement of expected flow
patterns.
3. Form a Triangular Irregular Network (TIN)
This a triangle-based surface made up of the stream centreline and left-right extended points.
4. Interpolate TIN to create a flood surface
Parameters that specify the smoothness required as well as the degree to which surrounding
triangles influence a given location need to be specified.
5. Create depth surface
Differencing the flood surface for each forecast flood with the DTM creates the depth
surfaces.
6. Review flood and depth surface shapes
Irregularities such as unusual changes in depths, unexpected ponding and water flowing uphill
are identified. These can be caused by things like the impact of bridges and levee banks,
stream sinuosity, over or understated anticipated flood extents, disparity in the currency of
flood modelling and DTM.
7. Adjust and Recreate Surfaces
Utilising engineering judgement adjust left and right points created in 2 and repeat steps 3 to 6
until satisfactory surfaces are created.
For more recent flood studies GIS-based flood surfaces may already be created as output. In this
case steps 1 to 7 may not be required apart from conducting a review.
A.4 Assign Depths to Property Locations
Property locations can be obtained from:
Geocoded National Address File (G-NAF) - Sourced from the Public Sector Mapping Agencies
(PSMA) via third-party vendors, this dataset provides an estimated latitude/longitude of most
Australian address. Addresses are located to either the property parcel centroid, the street centroid
or the locality centroid.
Interpolated Street Segment Addresses - Some GIS vendors market national address data sets
which locates properties by interpolating the start and end addresses along a street segment.
Locations are more approximate than G-NAF due to not allowing for things like parks and battle-
axe shaped blocks.
Merging property locations against depth surfaces created in A.3 results in an estimate of the flood
depth at each property for each forecast flood.