
The Injury Experience of Pedestrians and Bicyclists in Minnesota SNTC, September 18-19, 2009 St....
26
The Injury Experience The Injury Experience of Pedestrians and of Pedestrians and Bicyclists in Bicyclists in Minnesota Minnesota SNTC, September 18-19, 2009 SNTC, September 18-19, 2009 St. Cloud, MN St. Cloud, MN
-
Upload
dana-mckinney -
Category
Documents
-
view
214 -
download
0
Transcript of The Injury Experience of Pedestrians and Bicyclists in Minnesota SNTC, September 18-19, 2009 St....

The Injury Experience The Injury Experience of Pedestrians and of Pedestrians and
Bicyclists in MinnesotaBicyclists in Minnesota
SNTC, September 18-19, 2009SNTC, September 18-19, 2009St. Cloud, MNSt. Cloud, MN
Bicyclists & Pedestrians: Bicyclists & Pedestrians: The “Other” Users of the RoadThe “Other” Users of the Road
Injury & Violence Prevention Unit, Minnesota Department of HealthInjury & Violence Prevention Unit, Minnesota Department of Health
Leslie Seymour, MD MPH, Anna Gaichas, MS, Dorothy Gondwe, Leslie Seymour, MD MPH, Anna Gaichas, MS, Dorothy Gondwe, Jon Roesler, MS, Mark Kinde, MPHJon Roesler, MS, Mark Kinde, MPH

National ContextNational Context
MV–related injuries are the leading MV–related injuries are the leading cause of death for people ages 1–34cause of death for people ages 1–34
11% of all traffic deaths are 11% of all traffic deaths are pedestrianspedestrians
A pedestrian is killed every 2 hours & A pedestrian is killed every 2 hours & injured every 8 minutesinjured every 8 minutes
In 2000 alone:In 2000 alone:– Costs of pedestrian and pedal cycle Costs of pedestrian and pedal cycle
injuries cost around 40 billioninjuries cost around 40 billion
Sources: CDC; PIRE

State ContextState Context
Between 2000-2008:Between 2000-2008:– 420 pedestrians killed 420 pedestrians killed – 9,586 pedestrians injured9,586 pedestrians injured
Mortality and morbidity rates of pedestrian Mortality and morbidity rates of pedestrian crashes lower than national ratescrashes lower than national rates
Economic impact is significant and Economic impact is significant and increasingincreasing– Between 2000-2007:Between 2000-2007:
Total hospital charges $86 millionTotal hospital charges $86 million Median charge $1,029Median charge $1,029
Sources: DPS; MDH

‘Bike-related injuries increase in Twin Cities’
By TIM HARLOW, Star Tribune October 3, 2008

MV/Bicycle Crashes by Gender, MV/Bicycle Crashes by Gender, MN, 2000-2007 (n=3,930)MN, 2000-2007 (n=3,930)
26%
74%
FM

Pedestrian Injuries by Gender, Pedestrian Injuries by Gender, MN, 2000-2007 (N=9,586)MN, 2000-2007 (N=9,586)
Female46%
Male54%
Source: DPS

MV/Bicycle Crashes by MV/Bicycle Crashes by Age-group, MN, 2000-2007Age-group, MN, 2000-2007
020406080
100120140160180200
0-10
11-1
516
-20
21-2
526
-30
31-3
536
-40
41-4
546
-50
51-5
556
-60
61-6
566
-70
71+
20002001200220032004200520062007

Pedestrian Injuries by Age-group Pedestrian Injuries by Age-group MN, 2000-2007 (N=9,586)MN, 2000-2007 (N=9,586)
0
200
400
600
800
1000
1200
0-4 5-9 10-14
15-19
20-24
25-29
30-34
35-39
40-44
45-49
50-54
55-59
60-64
65-69
70-74
75-79
80-84
85+
N
Source: DPS

Bicycle vs. MV Crashes:Bicycle vs. MV Crashes:7 – County Metro & Greater MN7 – County Metro & Greater MN
050
100150200250300350400450500
2000
2001
2002
2003
2004
2005
2006
2007
MetroGreater MN
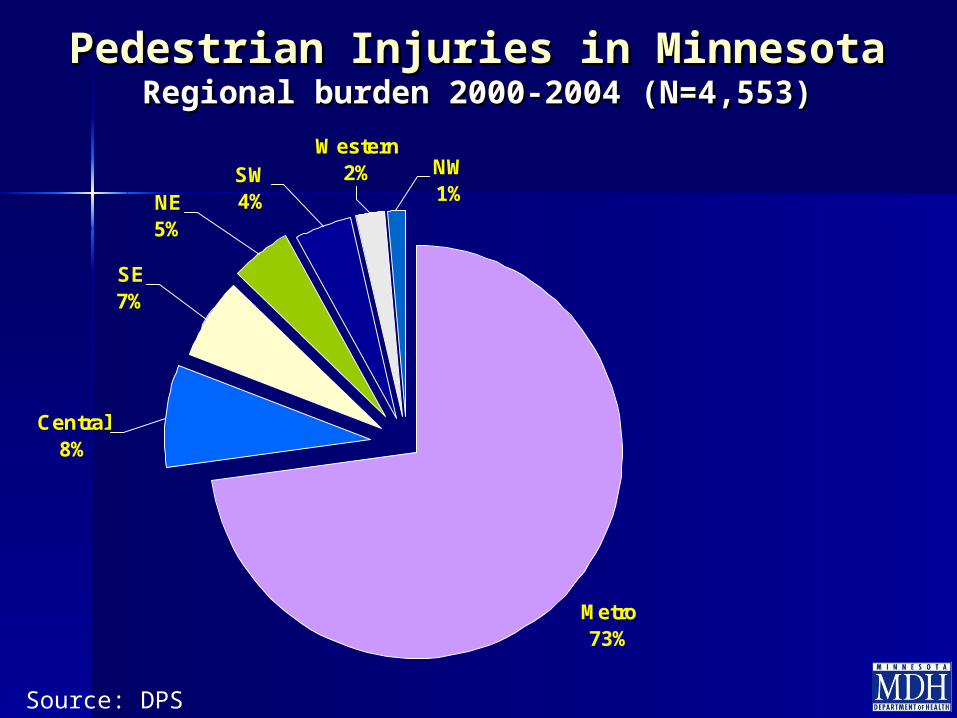
Metro73%
NW1%
Western2%SW
4%NE5%
SE7%
Central8%
Pedestrian Injuries in MinnesotaPedestrian Injuries in MinnesotaRegional burden 2000-2004 (N=4,553)Regional burden 2000-2004 (N=4,553)
Source: DPS

Bicycle Deaths: Bicycle Deaths: MV Traffic vs. Other CauseMV Traffic vs. Other Cause
0
24
6
810
12
1416
18
2000
2001
2002
2003
2004
2005
2006
2007
2008
Other
TrafficRelated

Injuries from Injuries from Car/Bike Interactions, 2000 - 2007Car/Bike Interactions, 2000 - 2007
0
100
200
300
400
500
600
700
2000
2001
2002
2003
2004
2005
2006
2007

Bicycle Injuries: Bicycle Injuries: MVC VS Other CauseMVC VS Other Cause
0
1000
2000
3000
4000
5000
6000
7000
2000
2001
2002
2003
2004
2005
2006
2007
OtherMVC

Average Hospital Charges for Average Hospital Charges for Bicycle-crash InjuriesBicycle-crash Injuries
$0
$1,000
$2,000
$3,000
$4,000
$5,000
$6,000
$7,000
$8,000
$9,000
2000
2001
2002
2003
2004
2005
2006
2007
TrafficRelatedOther

MVT Pedestrian Mortality Rates, 2000-MVT Pedestrian Mortality Rates, 2000-2006 2006
Age-adjusted rate per 100,000Age-adjusted rate per 100,000
0
0.2
0.4
0.6
0.8
1
1.2
1.4
1.6
1.8
2
2000 2001 2002 2003 2004 2005 2006
U.S.WIMN
Source: WISQARS
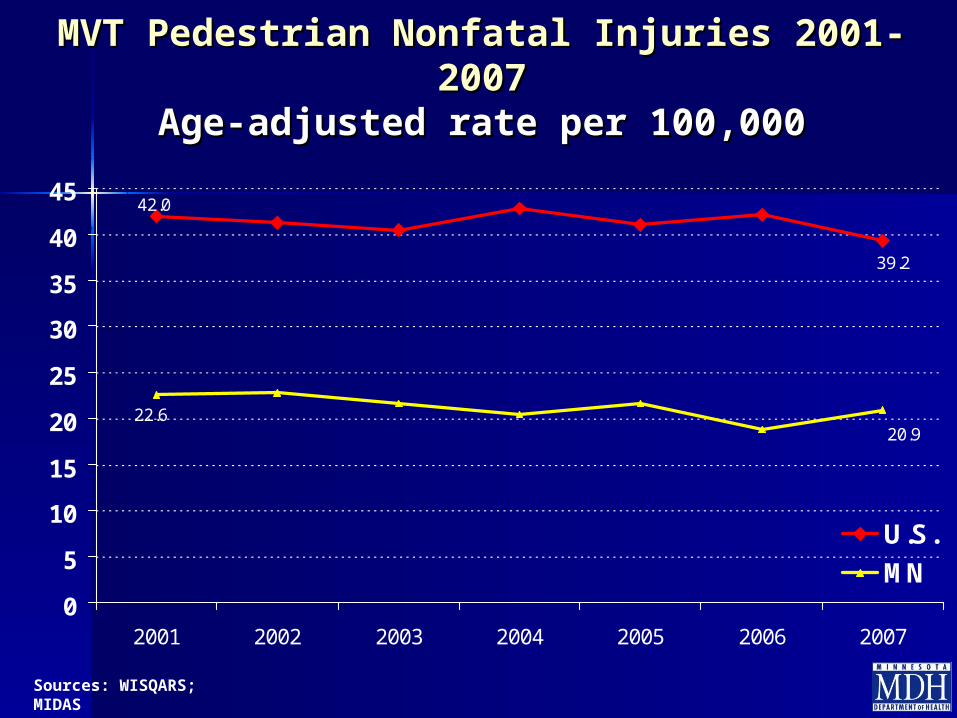
MVT Pedestrian Nonfatal Injuries 2001-MVT Pedestrian Nonfatal Injuries 2001-20072007
Age-adjusted rate per 100,000Age-adjusted rate per 100,000
39.2
42.0
20.922.6
0
5
10
15
20
25
30
35
40
45
2001 2002 2003 2004 2005 2006 2007
U.S.
MN
Sources: WISQARS; MIDAS

Fatal Pedestrian Injury in MN Fatal Pedestrian Injury in MN 2004 – 2008, by Time of Day2004 – 2008, by Time of Day
12 - 2:59 a.m.
6 - 8:59 p.m.
0
5
10
15
20
25
30
35
6 - 8:59 a.m. 9 - 11:59a.m.
12 - 2:59p.m.
3 - 5:59 p.m. 6 - 8:59 p.m. 9 - 11:59p.m.
12 - 2:59a.m.
3 - 5:59 a.m.
Time of Day
N
DPS

Non-fatal Pedestrian Injury in MN Non-fatal Pedestrian Injury in MN 2004 – 2008, by Time of Day2004 – 2008, by Time of Day
5-6P.M
0
200
400
600
800
1000
1200
1400
1600
1800
2000
6-8A.M 9-11A.M 12-2P.M 3-8P.M 9-11P.M 12-2A.M 3-5A.M
Time of Day
N
DPS

Non-fatal Pedestrian Injury in Non-fatal Pedestrian Injury in MN,MN, Hour-by-hour Profile, 2007-2008Hour-by-hour Profile, 2007-2008
5:00-6:00
2:00
7:00
0
10
20
30
40
50
60
70
80
90
100
Midnight 2:00 4:00 6:00 8:00 10:00 Noon 2:00 4:00 6:00 8:00 10:00
Time of Day
N
2008
2007

Where do the events Where do the events occur?occur?
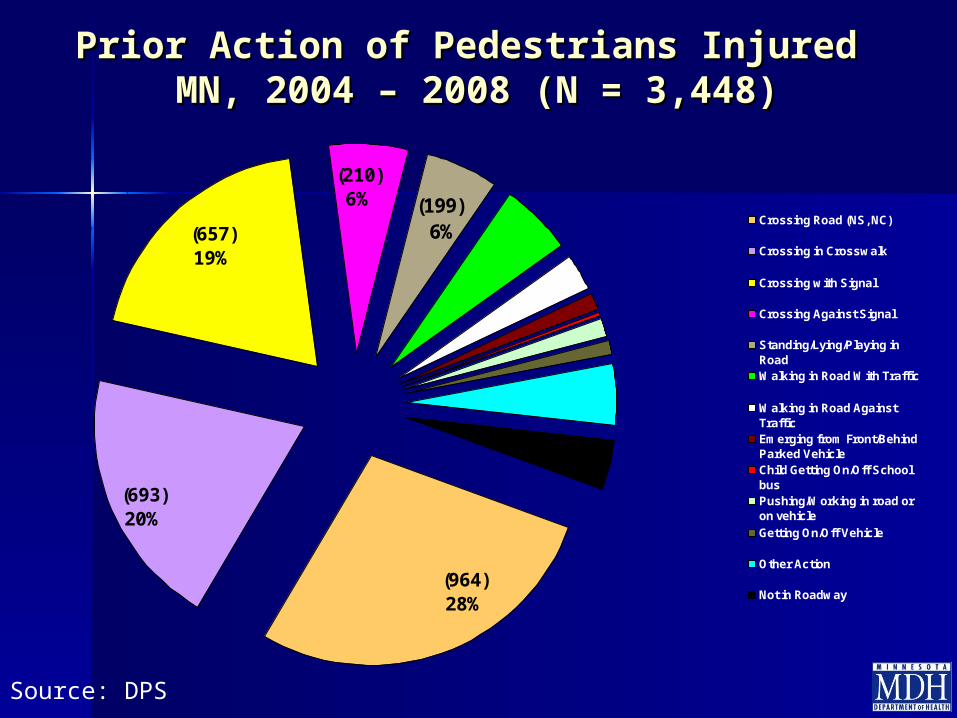
Prior Action of Pedestrians Injured Prior Action of Pedestrians Injured MN, 2004 – 2008 (N = 3,448)MN, 2004 – 2008 (N = 3,448)
(199) 6%
(210)6%
(657)19%
(693)20%
(964)28%
Crossing Road (NS, NC)
Crossing in Crosswalk
Crossing with Signal
Crossing Against Signal
Standing/Lying/Playing inRoadWalking in Road With Traffic
Walking in Road AgainstTrafficEmerging from Front/BehindParked VehicleChild Getting On/Off SchoolbusPushing/Working in road oron vehicle
Getting On/Off Vehicle
Other Action
Not in Roadway
Source: DPS

Elderly Rates Are Highest! Elderly Rates Are Highest! Ped vs. MV Ped vs. MV in MN by age group (1999-2005)in MN by age group (1999-2005)
0
1
2
3
4
5
6
<20 20-39 40-59 60-79 80+
Rat
e/10
0K
Source: CDC WISQARS

Hospitalized Pedestrian Injuries Hospitalized Pedestrian Injuries by Age-group, MN (1998-2007)by Age-group, MN (1998-2007)
0
100
200
300
400
500
600
700
800
<20 20-39 40-59 60-79 80+
N
Source: MDH MIDAS

ConclusionsConclusions
2000-2005: mv/bike crashes 2000-2005: mv/bike crashes increasedincreased 2005-2007: mv/bike crashes 2005-2007: mv/bike crashes decreaseddecreased MV vs. pedestrian injuries are MV vs. pedestrian injuries are decreasingdecreasing MV vs. pedestrian injury severity is MV vs. pedestrian injury severity is decreasingdecreasing Teen males (15-19) are the key age groupTeen males (15-19) are the key age group Medical costs are Medical costs are increasingincreasing ½ of events are in crossing the road with no signal (NS) ½ of events are in crossing the road with no signal (NS)
or no crosswalk (NC)!or no crosswalk (NC)! ¾ of events are in the metro¾ of events are in the metro

What Next?What Next?
Denominator and evaluation data Denominator and evaluation data – How many of us bike and walk? How many of us bike and walk? – How much (and when) are we bicycling and How much (and when) are we bicycling and
walking? walking? – Where are we walking and riding?Where are we walking and riding?– What combinations of programs, awareness, What combinations of programs, awareness,
enforcement, engineering and incentives will enforcement, engineering and incentives will it take to help us it take to help us share the roadshare the road??


![Whose Roads? Defining Bicyclists' And Pedestrians' Right To Use Public Roads [VTPI, 2013]](https://static.fdocuments.net/doc/165x107/577cd5b11a28ab9e789b6650/whose-roads-defining-bicyclists-and-pedestrians-right-to-use-public.jpg)


