
The Initiativ e Strengthening the Global Trade...
24
E The 15 Initiative Strengthening the Global Trade System May 2015 E15 Expert Group on Oceans, Fisheries and the Trade System Think Piece Aquaculture: Opportunities and Challenges Frank Asche
-
Upload
hoangkhuong -
Category
Documents
-
view
219 -
download
1
Transcript of The Initiativ e Strengthening the Global Trade...
EThe 15Initiative
Strengthening the Global Trade System
May 2015
E15 Expert Group onOceans, Fisheries and the Trade System
Think Piece
Aquaculture: Opportunities and Challenges
Frank Asche

ACKNOWLEDGMENTS
Published by
International Centre for Trade and Sustainable Development (ICTSD)7 Chemin de Balexert, 1219 Geneva, SwitzerlandTel: +41 22 917 8492 – E-mail: [email protected] – Website: www.ictsd.orgPublisher and Chief Executive: Ricardo Meléndez-Ortiz
World Economic Forum91-93 route de la Capite, 1223 Cologny/Geneva, SwitzerlandTel: +41 22 869 1212 – E-mail: [email protected] – Website: www.weforum.orgCo-Publisher and Managing Director: Richard Samans
Acknowledgments
This paper has been produced under the E15Initiative (E15). Implemented jointly by the International Centre for Trade and Sustainable Development (ICTSD) and the World Economic Forum, the E15 convenes world-class experts and institutions to generate strategic analysis and recommendations for government, business and civil society geared towards strengthening the global trade system.
For more information on the E15, please visit www.e15initiative.org
With the support of
Citation: Asche, Frank. Aquaculture: Opportunities and Challenges. E15Initiative. Geneva: International Centre for Trade and Sustainable Development (ICTSD) and World Economic Forum, 2015. www.e15initiative.org/
The views expressed in this publication are those of the authors and do not necessarily reflect the views of ICTSD, World Economic Forum, or the funding institutions.
Copyright ©ICTSD and World Economic Forum, 2015. Readers are encouraged to quote this material for educational and non-profit purposes, provided the source is acknowledged. This work is licensed under the Creative Commons Attribution-Non-commercial-No-Derivative Works 3.0 License. To view a copy of this license, visit: http://creativecommons.org/licenses/by-nc-nd/3.0/ or send a letter to Creative Commons, 171 Second Street, Suite 300, San Francisco, California, 94105, USA.ISSN 2313-3805
And ICTSD’s Core and Thematic Donors:

i
During the last 30 years, the world’s seafood markets have changed profoundly. Improved logistics and distribution as well as lower transportation costs have created global markets for a number of species that earlier only had regional or local markets. As seafood is regarded as an industrial product, trade barriers have not been a major obstacle, particularly for product forms with a limited degree of processing. This has made seafood one of the most traded groups of food products. In 2010, 39 percent of seafood production was traded, and 77 percent of production was estimated to be exposed to trade competition. In addition to the increased trade in seafood, the “blue revolution” is rapidly changing the main mode of seafood production. Aquaculture has become a larger source of fish for food than wild capture, although production from wild harvest is still larger overall due to non-food uses such as reduction to fish meal. The increased importance of aquaculture is partly due to the fact that landings of wild fish reached a plateau in the late 1980s, and partly due to a massive increase in productivity, as knowledge and techniques from agriculture were employed to gain control over the production process. There are a number of forecasts of future aquaculture production, and most indicate a substantial increase. At the same time, while we have access to quite accurate data on wild and aquaculture seafood production, in general we cannot separate them in trade statistics. Aquaculture is also a new way of interacting with the environment, with the potential to cause substantial environmental damage and social conflicts as it displaces other activities directly or indirectly. It also constitutes a global environmental problem through its demand for feed. Despite its contribution to the global food system, trade in seafood in general, and thereby also aquaculture, has been linked to food security concerns, as it is perceived to move large volumes of fish of high nutritional value from poor to rich countries.
There are two distinct sets of environmental concerns related to aquaculture—global and local. The main global concern is that increased demand for feed for aquaculture production will increase fishing pressure on wild stocks and threaten the sustainability of associated capture fisheries, since marine proteins are important ingredients in the diet for cultured fish. More local concerns include discharges from farming sites, destruction of local habitat, and escapees and spreading of pathogens, which are more or less similar to what is experienced in agriculture. There are also food safety issues related to aquaculture production. Although the literature mostly deals with seafood in general and species independently of production mode, overall, seafood consumption in general should be advocated rather than constrained.
While there are specific cases where food safety issues lead to import bans, these are mostly due to specific production practices and are handled within existing rules. Since fish products are currently treated as industrial products under the World Trade Organization, the paper discusses tariffs, subsidies, non-tariff barriers such as sanitary and phytosanitary measures, anti-dumping and countervailing measures, technical barriers to trade, and rules of origin. It then provides an overview of efforts by non-governmental organizations to promote marine conservation through private measures, which could eventually involve governments and hence WTO rules.
Aquaculture has many similarities to agriculture when it comes to environmental impacts. As a rapidly growing industry, there are unfortunately too many examples where the environmental carrying capacity is exceeded, making the industry economically and environmentally unsustainable. While the causes differ from case to case, lack of or too lax regulations and poor or non-existent management are the root causes. The dominance of developing countries in aquaculture production is most likely caused by this factor, as it seems most developed countries are willing to accept so little environmental risk or impacts that it is close to impossible for a new biology-based industry to develop in them. Successful aquaculture, however, requires infrastructure and knowledge in addition to water, explaining why its presence is limited in the poorest countries.
ABSTRACT

ii
Introduction
Production of Seafood
Seafood Trade
Environmental Issues
The Fish Meal Trap
Local Environmental Issues
Food Safety and Health Issues
The Trade System
Tariffs
Subsidies
Non-tariff Barriers
Non-governmental Efforts to Promote Marine Conservation
Conclusions and Recommendations
References
Appendix
CONTENTS
1
2
4
8
8
9
10
11
11
11
12
12
13
15
17

iii
EU European Union
FAO Food and Agriculture Organization
FDI foreign direct investment
GATT General Agreement on Tariffs and Trade
HS Harmonized System
IFPRI International Food Policy Research Institute
ISO International Organization for Standardization
ITQs individual transferable quotas
NGOs non-governmental organizations
PCBs polychlorinated biphenyls
R&D research and development
SPS sanitary and phytosanitary
US United States
WTO World Trade Organization
LIST OF ABBREVIATIONS
Table 1: Aquaculture Production by Continent, 2012
Table 2: Aquaculture Production by Main Countries, 2012
Figure 1: Global Aquaculture Production
Figure 2: Global Production of Seafood by Production Technology, 1970–2011
Figure 3: Global Seafood Exports in Real Terms, 2009 = 1
Figure 4: Global Seafood Imports in Real Terms, 2009 = 1
Figure 5: Global Seafood Exports
Figure 6: Global Seafood Imports
Figure 7: Norwegian Salmon Production and Antibiotics Use
LIST OF TABLES
AND FIGURES
1
INTRODUCTION
During the last 30 years, the world’s seafood markets have changed profoundly. Improved logistics and distribution, as well as lower transportation costs, have created global markets for a number of species that earlier only had regional or local markets. As seafood is regarded as an industrial product, it is not included among agricultural products. Hence, trade barriers have not been a major obstacle to trade, particularly for product forms with a limited degree of processing. This has made seafood one of the most traded groups of food products. In 2010, 39 percent of seafood production was traded, and 77 percent of production was estimated to be exposed to trade competition (Tveteras et al. 2012).
In addition to the increased trade, the “blue revolution” is rapidly changing the main mode of seafood production. In 1970, most seafood was harvested from wild stocks, and aquaculture made up just about 3 percent of total production. By 2014, the Food and Agriculture Organization (FAO) estimated that aquaculture had become a larger source for food than wild capture, although wild harvest is still larger overall due to non-food uses such as reduction to fish meal (FAO, 2014). The increased importance of aquaculture is partly because landings of wild fish reached a plateau in the late 1980s, and most experts do not believe that it will be possible to increase wild capture much, and partly because of a massive increase in productivity, as knowledge and techniques from agriculture were employed to gain control over the production process (Anderson 2002; Asche 2008). Hence, the stagnation of production of the closest competitor to farmed seafood, wild seafood, together with increased demand, created an
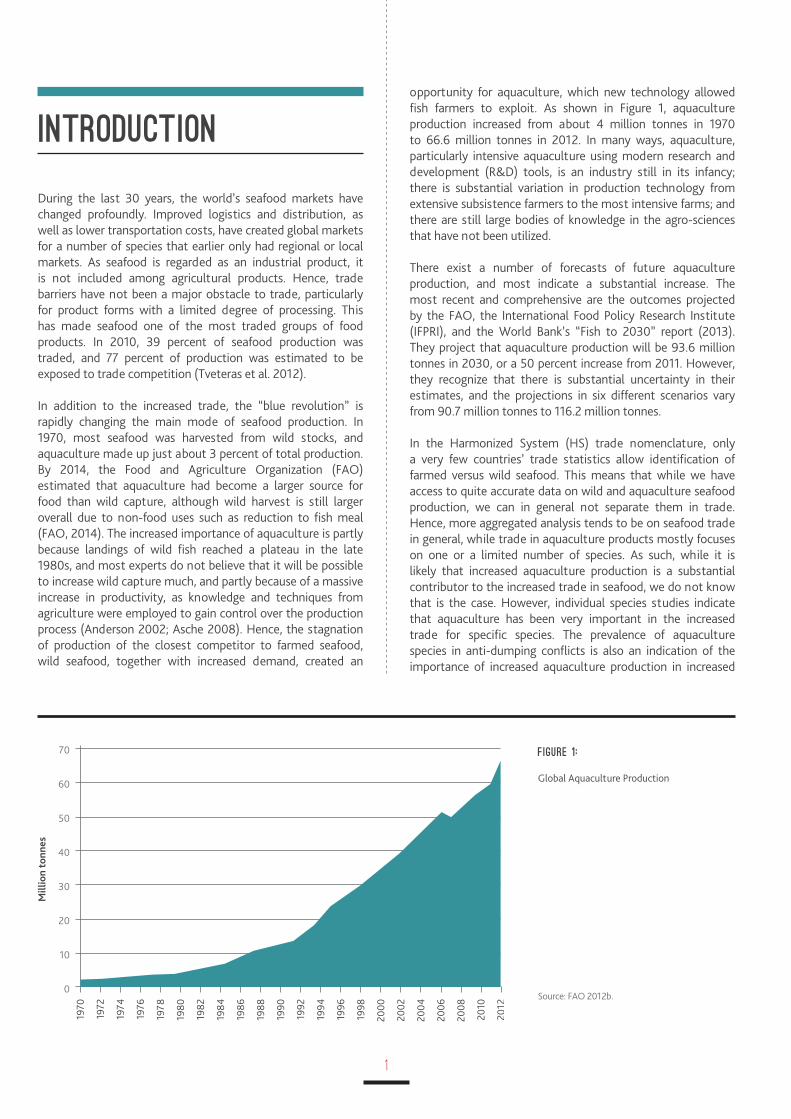
opportunity for aquaculture, which new technology allowed fish farmers to exploit. As shown in Figure 1, aquaculture production increased from about 4 million tonnes in 1970 to 66.6 million tonnes in 2012. In many ways, aquaculture, particularly intensive aquaculture using modern research and development (R&D) tools, is an industry still in its infancy; there is substantial variation in production technology from extensive subsistence farmers to the most intensive farms; and there are still large bodies of knowledge in the agro-sciences that have not been utilized.
There exist a number of forecasts of future aquaculture production, and most indicate a substantial increase. The most recent and comprehensive are the outcomes projected by the FAO, the International Food Policy Research Institute (IFPRI), and the World Bank’s “Fish to 2030” report (2013). They project that aquaculture production will be 93.6 million tonnes in 2030, or a 50 percent increase from 2011. However, they recognize that there is substantial uncertainty in their estimates, and the projections in six different scenarios vary from 90.7 million tonnes to 116.2 million tonnes.
In the Harmonized System (HS) trade nomenclature, only a very few countries’ trade statistics allow identification of farmed versus wild seafood. This means that while we have access to quite accurate data on wild and aquaculture seafood production, we can in general not separate them in trade. Hence, more aggregated analysis tends to be on seafood trade in general, while trade in aquaculture products mostly focuses on one or a limited number of species. As such, while it is likely that increased aquaculture production is a substantial contributor to the increased trade in seafood, we do not know that is the case. However, individual species studies indicate that aquaculture has been very important in the increased trade for specific species. The prevalence of aquaculture species in anti-dumping conflicts is also an indication of the importance of increased aquaculture production in increased
FIGURE 1:
Global Aquaculture Production
Source: FAO 2012b.
Mil
lio
n t
on
ne
s
70
60
50
40
30
20
10
0
19
70
19
72
19
74
19
76
19
78
19
80
19
82
19
84
19
86
19
88
19
90
19
92
19
94
19
96
19
98
20
00
20
02
20
04
20
06
20
08
20
10
20
12

2
Kinnucan and Myrland (2002) and Keithly and Poudel (2008) provide case studies for, respectively, salmon and shrimp.
There are few studies documenting employment specifically in aquaculture. However, crises such as the Chilean disease crises for salmon in 2007–2012 in which many lost their jobs show that a large number of people are employed in the industry (Asche et al. 2009).
There is also very limited data available on foreign direct investment (FDI) in aquaculture. However, it is definitely important in some industries such as Chilean salmon aquaculture.
1
2
3
seafood trade. That the two most valuable farmed species, salmon and shrimp, show up most often reinforce this argument, although a number of other species have also been involved in anti-dumping cases.1
Increased aquaculture production is in itself an indication that, in aggregate, it is profitable for fish-farming companies—profitability is the market’s signal that a producer is competitive. As such, aquaculture is obviously an economic opportunity that provides income and improves lives for a number of people directly as producers, or indirectly at other stages in the supply chain (Smith et al. 2010).2 Aquaculture production is also vastly heterogeneous, from subsistence farmers to multinational companies (Bjørndal and Gordon 2009; Asche et al. 2013), and the social, economic, and environmental impact varies between production methods, with scale, and so on.3
Aquaculture is also a new way of interacting with the environment, which has a potential to cause substantial environmental damage and social conflicts as it displaces other activities, directly or indirectly. A number of studies, such as Naylor et al. (1998), investigate its potential harmful environmental effects. These include (1) land or water column converted to aquaculture use, of which destruction of mangrove forests is the most well-known; (2) local environmental damage due to pollution and increased nutrient loading; (3) damage to surrounding ecosystems due to diseases and escapes; and (4) in species with production cycles that are not closed, damage due to fishing for wild fingerlings which are used to stock farms. In addition, it is held that aquaculture constitutes a global environmental problem through its demand for feed, as increased aquaculture production leads to increased demand for fish meal, and thereby increased fishing effort in such fisheries. As a substantial part of the aquaculture production is exported, this means that there are potential trade issues related to aquaculture, both in its demand for inputs and its supply of outputs.
The trade in seafood in general, and thereby also aquaculture, creates food security concerns as it is seen to move large volumes of fish of high nutritional value from poor (that is, developing) to rich (that is, developed) countries. In 2010, developing countries accounted for only 23 percent of the value of global imports of seafood, while they accounted for 50 percent of the value of global exports of seafood, creating a substantial seafood trade deficit. From a food security perspective, this could be interpreted as a substantial problem, as it might mean that poor countries are deprived of sorely needed proteins (Swartz et al. 2010). On the other hand, this could be interpreted as contributing to poverty alleviation because export growth results in increased earnings and purchasing power. Béné et al. (2009) provide an overview of the literature on these different perspectives on seafood trade. Thus, while the increase in trade flows and aggregate economic growth is indisputable, their effect on poverty reduction via economic growth is contentious (Roheim 2004; Edward 2006; Asche et al. 2015).
Globally, fish and seafood currently represents about 16.6 percent of animal protein supply and 6.5 percent of all protein for human consumption (FAO 2012a). Fish is usually low in saturated fats, carbohydrates, and cholesterol and provides not only high-value protein but also a wide range of essential micronutrients, including various vitamins, minerals, and polyunsaturated omega-3 fatty acids, and some fish consumption is perceived to be important for public health (FAO 2012a). However, it also contains contaminants and toxins, as most other food sources. Hence, a balanced intake is important.
PRODUCTION OF SEAFOOD
The international trade of seafood has grown rapidly over the last few decades, enabled by a corresponding increase in the global supply of seafood. The availability of seafood has more than doubled in the last 40 years, as the total supply of seafood increased from 65.3 million tonnes in 1970 to 148.9 million tonnes in 2011 (FAO 2012b). Seafood supply originates from two main production technologies—capture fisheries and aquaculture. Until the 1970s, aquaculture was relatively unimportant as a source of seafood supply. Since then, however, there has been a virtual explosion in the use of aquaculture as a seafood production technology. Figure 2 shows the relative shift in production from wild fisheries to aquaculture, as well as total seafood production. In 1970, fish farming was limited, with a harvested quantity of about 3.5 million tonnes, representing 5.1 percent of the total seafood supply. In 2011, with a production of 60.4 million tonnes, farmed fish made up 40.6 percent of the total seafood supply. Capture fisheries production, however, has fluctuated between 90 and 100 million tonnes in annual landings, with no obvious trend since the 1980s. The only reason why global seafood supply has continued to increase since 1990 is increased aquaculture production. Aquaculture growth has been sufficient not only to maintain the global per capita consumption of seafood, but also to slightly increase it, and per capita consumption is just passing 20 kilograms (FAO 2014).

3
TABLE 1:
Aquaculture Production by Continent, 2012
Million tonnes Billion USD Quantity share Value share
Africa 1.5 3.37 2.2% 2.4%
Americas 3.2 12.72 4.8% 9.2%
Asia 58.9 109.32 88.4% 79.4%
Europe 2.9 11.15 4.3% 8.1%
Oceania 0.2 1.16 0.3% 0.8%
Source: FAO’s FishStat Plus software (described in FAO 2012b).
Aquaculture has its origins in ancient Egypt and China, and is mentioned by Pliny the Elder as having been practiced in Rome in the first century BCE (Parker 2011). In the early 1970s, a significant change took place as better control over the production process enabled a number of new technologies and production practices to develop. The salmon industry, in particular, was a pioneer in developing modern industrialized fish farming, but these techniques were quickly adapted and modified for other marine and freshwater species worldwide (Asche 2008). These changes dramatically improved the competitiveness of aquacultural products, both for subsistence and as sources of income. Product development and marketing made possible by more stable supply further enhanced aquaculture’s competitiveness. The combined effect of productivity and demand growth has made it the world’s fastest growing animal-based food sector in the last decades (FAO 2006). Fisheries supply, on the other hand, is not expected to increase very much as the majority of fish stocks are either fully exploited or over-exploited (FAO 2014).
Aquaculture is a production technique primarily used in developing countries, and particularly in Southeast Asia. Tables 1 and 2 show aquaculture production quantity and value by region and for the main producer countries. Asia dominates with a quantity share of 88.4 percent and a value share of 79.4 percent. China alone has a production share of 61.7 percent by quantity. However, its value share is more than 10 percent lower at 48.2%, primarily because its output includes a large quantity of low-valued carps. Although Southeast Asian countries dominate, all the continents but Oceania have countries in the top ten list in Table 2. Combined, the top ten producers make up 88.1 percent of the produced quantity and 80 percent of the production value. Hence, smaller producing countries seem to produce higher value product.
As noted, a substantial increase in aquaculture production is expected. The “Fish to 2030” report (World Bank 2013) projects it will be 93.6 million tonnes in 2030, or a 50
FIGURE 2:
Global Production of Seafood by Production Technology, 1970–2011
Source: FAO 2012b.
LEGEND:
Aquaculture
Catch
19
70
19
72
19
74
19
76
19
78
19
80
19
82
19
84
19
86
19
88
19
90
19
92
19
94
19
96
19
98
20
00
20
02
20
04
20
06
20
08
20
10
160
140
120
100
80
60
40
20
0
Mil
lio
n t
on
ne
s

4
SEAFOOD TRADE
The increasing importance of aquaculture in global seafood supply helps explain the export-orientation of the seafood industry. As in other food-related value chains (Barrett et al. 2012; Bellemare 2012), a combination of (i) the significant investments needed to start up aquaculture production, and (ii) limited domestic markets for aquaculture products (for example, because of purchasing power constraints in developing countries, the size of the domestic population, and other factors) provide incentives for the industry to adopt a global outlook on marketing seafood products. Technological innovations have facilitated the international orientation of the seafood industry (Anderson et al. 2010). Transportation and logistics have improved significantly. Substantial reductions in transportation costs by surface and air have promoted the international trade of fresh seafood. Lower transportation costs have given new producers access to the global market. Improved logistics have also created economies of scale and scope on all levels of the supply chain, particularly in the retail sector where supermarkets have replaced fishmongers and markets in a number of places. Progress in storage and preservation has continued, allowing a wider range of seafood products to be traded. Freezing technology has improved to such an extent in recent years that many product forms can be frozen twice, allowing products to be processed in locations with competitive advantages in processing fish rather than in locations close
TABLE 2:
Aquaculture Production by Main Countries, 2012
Million tonnes Billion USD Quantity share Value share
China 41.1 66.2 61.7 % 48.2 %
India 4.2 9.2 6.3 % 6.7 %
Vietnam 3.1 5.8 4.6 % 4.2 %
Indonesia 3.1 6.7 4.6 % 4.9 %
Bangladesh 1.7 3.9 2.6 % 2.8 %
Norway 1.3 5.2 2.0 % 3.8 %
Thailand 1.2 3.3 1.9 % 2.4 %
Chile 1.1 6.0 1.6 % 4.4 %
Egypt 1.0 2.0 1.5 % 1.5 %
Myanmar 0.9 1.5 1.3 % 1.1 %
Total 66.6 137.3
Source: FAO’s FishStat Plus.
percent increase from 2011, which means an average annual growth rate of 2.5 percent. This is lower than the growth rate in previous decades, but is likely to maintain aquaculture’s position as the fastest growing food production technology on the planet. However, there is substantial uncertainty in their estimates, and the “Fish to 2030” report provides projections for six different scenarios to highlight this. The projections vary from 90.7 million tonnes to 116.2 million tonnes. The first notable feature of these outcomes is that the most likely estimate at 93.6 million tonnes is closer to the most negative scenario than the most positive scenario. Hence, the distribution of estimates is highly skewed, indicating a much larger upside potential than downside potential.
There are, of course, a number of factors that will influence how large the production growth will be. Some are natural endowments, and South America has an advantage with respect to access to water. Population growth influences potential demand. Management systems, and particularly the extent to which diseases and other consequences of unsustainable practices can be prevented on a large scale, will also be important. Trade barriers and management systems can also influence where production takes place, and it is relatively clear that the management systems in most developed countries are so adverse to allowing any environmental risk that aquaculture production will not expand in them. Still, the most important factor is economic growth. Aquaculture is to a large extent a cash crop (Smith et al. 2010), and income development that influences the ability to pay for the product is the most important driver for production growth. A confluence of these factors indicates that aquaculture production in East Asia will continue to grow, and this will remain the most important production region. There is a huge potential in South America, where production is likely to increase substantially and maybe even faster than in East Asia. There is uncertainty with respect to
Africa, and as many commentators are somewhat pessimistic about the speed of development there in general, the growth in aquaculture production is also likely to be moderate.

5
to where the fish is caught. Lastly, improved control in the harvesting process in fisheries and of the production process in aquaculture has enabled producers to better target the needs of modern consumers and further innovate in supply chains.
These various factors tend to reinforce each other, even though the strength of each differs by market and species. Increased trade has profoundly affected seafood markets; an increasing number of markets have gone from regional to global as more species from widely different places have become substitutes (Asche et al. 2001). Moreover, a growing share of producers have access to the global market as transportation systems improve. They can take advantage of new market opportunities, increasing trade competition in export as well as import markets. For consumers who have the ability to pay, these trends increase the available supply of seafood in the short run. Hence, the share of imports of developed countries—the European Union (EU), Japan, and the United States (US) in particular—remains high. Economic growth in many developing countries also increases demand (Delgado et al. 2003). As a result, there is a declining import share for developed countries despite growth in total values of seafood exports from developing to developed countries.
FAO’s data on global seafood trade can be used to separate exports from, and imports to, both developing and developed countries for the period 1976–2009. The product categories “aquatic plants,” “inedible,” and “sponges, corals, shells” from FAO seafood trade statistics are excluded to focus on the trade in seafood products. The export and import values are denoted in US dollars, and the quantities are measured in tonnes. The value data are converted to real terms (that is, adjusted for inflation) using the US consumer price index.
Figure 3 shows the real value of global seafood exports for developing and developed countries. The international trade in seafood, as measured in total real value exported, has grown substantially over the past four decades. In 1976, the total traded value was $23.7 billion. This increased to $82.7 billion in 2009—more than a three-fold increase. The share of developing countries in seafood exports rose steadily from 36.5 percent in 1976 to 49.8 percent in 1994, after which it has remained stable at around 50 percent. Exports from developing countries thus grew faster than the total increase in exports until the mid-1990s, and they have had similar growth rates as those of developed countries after the mid-1990s.
Figure 4 shows global seafood imports for developing and developed countries. Here, the story is different. The growth in the total real value of seafood imports is very similar to that of the total value of seafood exports since seafood exports from somewhere necessarily end up as imports elsewhere.4 However, there is a striking difference in the import value shares of developing and developed countries. In 1976, developing countries imported only 12.2 percent of the total value of seafood imports. While that share steadily
increased throughout the period 1976–2009, it was no more than 22.1 percent of the total value of seafood imports in 2009. This asymmetry in export and import shares between developing and developed countries is at the core of the perception that exporting seafood is detrimental to the food security of developing countries. In what follows, we show that focusing solely on values can be misleading and lead to the wrong conclusions.
Figure 5 shows the quantities of seafood exported by developing and developed countries. Except for the fact that the growth in exported quantities is sharper than the growth in exported values, Figure 5 paints a picture similar to Figure 3. For developing countries, the exported quantity of seafood increased until the mid-1990s, at which point it tapered off around 50 percent. The growth in trade measured by quantity was four-fold, starting at 7.9 million tonnes in 1976 and increasing to 32.1 million tonnes in 2009. But recall that the corresponding value only increased three-fold, which suggests that the unit value of traded seafood—in other words, the real price—has been declining over time.
Figure 6 shows the quantities of seafood imported by developing and developed countries. An important difference here is that the asymmetry we observe between the seafood exports and imports of developed and developing countries is much less pronounced than in value terms. First, the import share for developing countries rose steadily from 20.6 percent in 1976 to 41.5 percent in 2009. While developing countries made up only 22.1 percent of the imports in 2009 when measured in value, they made up 41.5 percent of the imports measured in quantity. In other words, the seafood trade deficit for developing countries is much smaller when measured in quantity than in dollar value. However, this simple comparison does not account for the possibility that some seafood net export values may be spent on importing other foods. Moreover, Asche et al. (2014) show that the much larger value share of exports than imports means that developing countries are in aggregate very well compensated for the quantities they give up.
There are some deviations in all the actual data, as the registration date for export data is not the same as for imports because the export and import data are reported by different countries.
4

6
FIGURE 3:
Global Seafood Exports in Real Terms, 2009 = 1
FIGURE 4:
Global Seafood Imports in Real Terms, 2009 = 1
Source: FAO 2012b.
Billi
on U
SD
Source: FAO 2012b.
LEGEND:
LEGEND:
Developing
Developed
Developing
Developed
120
100
80
60
40
20
0
19
76
19
79
19
82
19
85
19
88
19
91
19
94
19
97
20
00
20
03
20
06
20
09
Bil
l. U
SD
120
100
80
60
40
20
0
Bil
l. U
SD
19
76
19
78
19
80
19
82
19
84
19
86
19
88
19
90
19
92
19
94
19
96
19
98
20
00
20
02
20
04
20
06
20
08
Billi
on U
SD

7
FIGURE 5:
Global Seafood Exports
FIGURE 6:
Global Seafood Imports
Source: FAO 2012b.
Source: FAO 2012b.
LEGEND:
Developing
Developed
LEGEND:
Developing
Developed
35
30
25
20
15
5
0
Mil
l. m
etric
to
ns
19
76
19
78
19
80
19
82
19
84
19
86
19
88
19
90
19
92
19
94
19
96
19
98
20
00
20
02
20
04
20
06
20
08
35
30
25
20
15
5
0
Mil
l. m
etric
to
ns
19
76
19
78
19
80
19
82
19
84
19
86
19
88
19
90
19
92
19
94
19
96
19
98
20
00
20
02
20
04
20
06
20
08
Mill
ion
met
ric
tonn
esM
illio
n m
etri
c to
nnes

8
Seafood is classified as an industrial product and not an agricultural product in trade. As a consequence, tariffs are in general much lower than for many other food products. There is tariff escalation to promote processing of seafood in importing countries. However, even this protection is relatively moderate, and when freezing technology became good enough to allow it, it did not prevent the development of specialized processing for re-export in third countries. As such, there are few general barriers to trade in seafood products. With the expected increase in aquaculture production, one can expect trade in seafood to also increase rapidly. The growth in third-country processing for re-export also suggests that the growth in trade will be faster than production growth. The main barriers occur on a case-by-case basis, as aquaculture products seem more exposed to anti-dumping complaints and non-tariff barriers. However, while they may influence the development of the aquaculture industry in specific countries, they are not likely to affect the general trends. Keithly and Poudel (2008) illustrate this in the case of US anti-dumping actions against shrimp.
ENVIRONMENTAL ISSUES
As noted, aquaculture is a production technique that has been used for thousands of years. As such, it is obviously not an activity that is inherently environmentally unsustainable. However, as shown in Figure 1, production exploded in the 1990s with the adaption of a number of new production technologies. As virtually all aquaculture production interacts with the surrounding ecosystem, it will create environmental externalities that are mostly negative. Their effect will, to a large extent, be a function of the management system they operate under, and partly the production technology used.
There are two distinct set of environmental concerns related to aquaculture—global and local. The main global concern is that increased demand for feed from growing aquaculture production will increase fishing pressure on wild stocks and threaten the sustainability of associated capture fisheries because marine proteins are important ingredients in the diet for cultured fish. This is also known as the “fish meal trap,” and is interesting since it is largely regarded as a trade issue, and although trade in feed ingredients is abundant, there are few other supply chains where this receives similar attention. More local concerns include discharges from farming sites, destruction of local habitats, and escapees and spreading of pathogens, which are more or less similar to what is experienced in agriculture.
THE FISH MEAL TRAP
The main global concern is that increased demand for fish meal in feed from growing aquaculture production will increase fishing pressure on wild stocks and threaten their sustainability because marine proteins are important to the diet of cultured fish.5 Moreover, the production potential in aquaculture is perceived to be limited due to its dependence on limited wild fish stocks for a key feed ingredient. This hypothesis is known as the fish meal trap (Naylor et al. 1998). For this to happen (and it is, of course, relevant only to species fed with marine ingredients), the management system for the species in question must be weak, and second, there must be no close substitutes for fish meal, neither for aquafeed producers nor other buyers of fish meal (Asche and Tveterås 2004).
The most important fish stocks that are used in fish meal production are managed with quota systems, but one can question if these are sufficiently comprehensive to prevent the fish meal trap. Fish meal is a part of the much larger protein meal market, and, in particular, is a close substitute to soya meal. With this market structure, it is total supply of and demand for protein meals, of which fish meal makes up only 4 percent, that determines prices for it. However, in recent years, it seems like the link between fish meal and the larger protein meal market has become weaker, and fish meal, to a larger extent, is being demanded because of its unique attributes (Asche et al. 2013). On the other hand, the growth in aquaculture production has not been much influenced by fish meal prices, and one seems to be able to (at least partly) substitute fish meal in the feed when prices are high. One is then led to the conclusion that increased demand for fish meal from aquaculture cannot have any significant impact on fish meal prices in the long run (allowing for a potential sticky adjustment in consumption), and does not lead to increased fishing pressure. It is worthwhile to note that global production of fish meal has actually declined since the turn of the century.
The demand for fish meal from aquaculture has grown from virtually nothing to more than half of total production in only 20 years (Kristofersson and Anderson 2007). However, the demand for fish meal from the aquaculture sector does not appear to be due mainly to its unique characteristics. Moreover, productivity growth leading to lower cost of production has been a major factor in the growth of salmon aquaculture. If the market structure changes so that fish meal is demanded because of its unique characteristics, the production cost will also increase and limit the demand for feed from aquaculture. Hence, even with a structural change in the fish meal market, an increase in the demand from aquaculture and in feed prices are likely to be limited. However, the change in production cost may well influence
Fish oil is also produced and used, but receives less attention as it is used by much fewer species (Tacon and Metian 2008).
5

9
which fish are to be large volume species in aquaculture, as species that use feed with limited marine content will be more competitive from a production cost perspective. Tacon and Metianen (2008) show how species with high marine content in the feed respond to higher fish meal prices by shifting towards lower shares of marine ingredients, with salmon as one of the leading species in this respect. Hence, it is highly unlikely that feed availability will in any way hinder production growth in aquaculture.
LOCAL ENVIRONMENTAL ISSUES
When the environment interacts with a production process, the latter has the potential to damage the surrounding ecosystem. The potential damage includes destruction of natural habitat and pollution from the production process, which influences habitat and wildlife around the site. As the two most successful aquaculture species, salmon and shrimp are the ones that have received the most attention with respect to their environmental impact (Naylor et al. 1998). It is also for these species most data is available, but the issues are pertinent to all aquaculture species with a partial exception for mussels, scallops, and other invertebrates. For salmon farming, the main issues have been pollution from organic waste and the interaction between wild and farmed salmon. Farmed salmon may transmit diseases and parasites to wild salmon. An increased number of the sea lice parasite on wild salmon has been associated with escaped farmed salmon. Farmed salmon may also attempt to spawn in rivers and may impact the genetic pool. Shrimp farming has received even more negative publicity than salmon farming in relation to detrimental environmental effects, such as destruction of mangroves, salination of agricultural areas, eutrophication, and disruptive socio-economic impacts.
The environmental issues associated with intensive salmon and shrimp farming must be seen in relation to the introduction of a new technology that uses the environment as an input. The larger the production at any site and the more intensive the process, the larger the potential for environmental damage. However, the greater degree of control over the production process in intensive aquaculture also makes it easier to address these issues. With all new technologies, there will be unexpected side effects, and there will be a time lag from when an issue arises until it can be addressed. First, the impact and the causes must be properly identified. Second, the solution to the problems will require modifications of existing technology or maybe entirely new technology. In both cases, pollution reduction implies some form of induced innovation. In this relation, Tveterås (2002) argues that industry growth has a positive effect on pollution, in line with the Environmental Kuznets Curve (EKC). The EKC hypothesis refers to an empirical observation that pollution tends to increase with economic growth up to a certain point, after which growth reduces pollution. This gives the pollution profile over time the shape of an inverted U. The use of antibiotics in Norwegian aquaculture is a good example, as can be seen in Figure 7.
There are two main causes for the industry to address environmental effects—(1) the effects reduce productivity and therefore profits; and/or (2) government regulations force the industry to do so. Industry size contributes in the sense that a large industry allows larger investments and thereby more efficient innovation of abatement technologies. Detrimental environmental effects of aquaculture not accounted for in market prices are negative externalities. Internalization of the externalities can explain why some of the major environmental issues have been resolved in aquaculture. The arguments go as follows. Production cost and productivity in aquaculture depend on
FIGURE 7:
Norwegian Salmon Production and Antibiotics Use
Source: Norwegian Directorate of Fisheries.
LEGEND:
Antibiotics
Production
50000
45000
40000
35000
30000
25000
20000
15000
10000
5000
0
19
80
19
82
19
84
19
86
19
88
19
90
19
92
19
94
19
96
19
98
20
00
20
02
20
04
20
06
20
08
20
10
1200
1000
800
600
400
200
0
Kilo
gram
100
tonn
es

10
an environment where farmed fish is raised. Fish farms with environmental practices that harm the local environment will experience negative feedback effects from poorer growing conditions for the fish that reduce on-farm productivity. The result is reduced biomass growth due to poor fish health and, in the worst case, disease outbreaks that wipe out entire on-farm fish stocks. Hence, farmers are concerned with cultivating management practices that avoid such negative repercussions on productivity.
If there is no negative feedback on expected profitability, however, it is unlikely that the industry will internalize detrimental environmental effects. In this case, the government has to regulate the industry if the unwanted effects are to be avoided. The rapid growth of global aquaculture has represented an environmental challenge to authorities. First, knowledge about the environmental effects of aquaculture has been limited, or at worst lacking. This has called for extensive research to identify causes and effects. Second, in many places, local governments do not have the resources to implement and enforce regulations.6 There are a number of examples of poor environmental practices in relation to aquaculture (as in agriculture). However, that does not make the production method inherently unsustainable. There are also a number of examples of sustainable aquaculture. Still, large-scale intensive aquaculture has a larger potential to result in detrimental environmental effects than other technologies. The higher degree of control over the production process does, on the other hand, also give these farmers a better opportunity to control the negative effects of their production.7 For instance, shrimp aquaculture provides a number of very good as well as very poor practices. As such, there is no doubt that aquaculture can be carried out in a sustainable manner, independent of the level of intensity. The real issue when it comes to aquaculture and sustainability is whether farmers choose to use sustainable practices. This will primarily be an issue of local regulations and governance, but may also be influenced by consumer initiatives and ecolabels. In principle, trade measures can be used to influence production practices in a similar fashion as ecolabels. There are challenges with such approaches since different countries have different perspectives on what are good practices, and the line between influencing management in a positive way and using such arguments to enable protectionism is a fine one. In addition, although there is no hard evidence, there is an increasing number of anecdotes suggesting that the world market for many species is already divided into two. One set of “good practice” producers, with different forms of certifications such as those developed by the International Organization for Standardization (ISO) to ensure quality and possibly also environmental standards to ensure market access to wealthy countries whose consumers care, and a set of “other producers,” with lower costs that do not try to meet standards that are often regarded as excessive. As seafood trade between developing countries is increasing, the latter group of producers increases in importance.
This includes the interaction between shrimp farms and mangroves. Mangroves do not provide land particularly suitable for shrimp farming. Rather, it is often the only unused land in an area and as such the cheapest available as it most often lacks formal owners.
The most intensive operations, closed cycle systems where all emissions are cleaned, may be the most environment-friendly systems of all. Proponents of such systems claim that clean water is the only emission.
6
7
An industry cannot be economically sustainable without being environmentally sustainable. The “Fish to 2030” report’s projections of a substantial increase in production clearly reflect an expectation that environmental issues will not be a substantial barrier to overall growth. As management quality varies, one is still likely to observe highly problematic local environmental consequences. However, these challenges are not likely to influence the overall development of the aquaculture industry to a large extent.
FOOD SAFETY AND
HEALTH ISSUES
Aquaculture has received substantial attention for containing different additives, contaminants, and toxins. One such example is a study published by Hites et al. (2004), which began a controversy over the level of organic contaminants such as polychlorinated biphenyls (PCBs) found in farmed salmon relative to wild salmon. This study claimed that farmed salmon contains significantly higher levels of PCBs than wild salmon, and that European-raised salmon were found to have significantly greater contaminant levels than those raised in North America, which were, in turn, higher than those raised in South America. Hites et al. (2004) concluded that consumption of farmed Atlantic salmon may pose significant health risks from cancer, and this led to a recommendation to consumers to limit their consumption of farmed salmon to no more than 8 ounces per month. More generally, health risks from seafood consumption are varied and include the potential for a wide range of bacterial and parasitic illnesses, histamine poisoning, and the adverse consequences of consuming high levels of mercury and PCBs. Some health issues stem from local water quality problems where seafood is grown, particularly shellfish, whether wild caught or aquacultured. Though mercury contamination can be acute and local, many health concerns about it stem from regional or even global water quality. Mercury bioaccumulates in a way that higher trophic fish (ones higher on the food chain) tend to have higher concentrations of it in their flesh, ultimately transcending local boundaries. Many other seafood-borne illnesses result from processing, handling, inadequate refrigeration, and spoilage.

11
While there is no doubt that aquaculture products contain toxins, this is something they have in common with most other foods. In most developed countries, one has threshold values to limit the damage and a recommended level of consumption, as the negative components of any food have to be balanced with its positive contributions. The Hites et al. (2004) study led to a substantial increase in studies looking into the effects of eating seafood, and the conclusions are quite clear. For instance, Teutsch and Cohen (2005) and Cohen et al. (2005) show that a reduction in fish consumption in the population would have adverse effects on human health. The American Heart Association reports that sudden cardiac arrest kills 330,000 people each year in the US (AHA 2007). It has been estimated that if Americans increase their consumption of fish that contain long-chain omega-3 fatty acids, deaths from sudden cardiac arrest could decrease by 36 percent. To that end, the Dietary Guidelines Advisory Committee (2004) recommended that healthy adults eat 8 ounces (227 grams) of fish per week to receive a sufficient quantity of omega-3 fatty acids. However, of the top 10 species consumed in the US, only salmon provides the suggested amount of desired fats per 8 ounce serving (Santarre 2010; NFI 2013). An 8-ounce portion of farmed salmon provides almost five times the average daily amount recommended by the National Academy of Sciences (NAS 2004). Willet (2005) indicates that the Hites et al. (2004) study, and consequent media coverage, failed to consider that the lifetime benefits from farmed salmon consumption are likely to be at least 100-fold greater than the estimates of harm. Hence, while it is clear that there are food safety issues related to aquaculture production, and although the literature mostly deals with seafood in general and species independently of production mode, seafood consumption in general should be advocated rather than constrained.
While there are specific cases where food safety issues lead to import bans, these are mostly due to specific production practices and can be handled within existing rules.
TARIFFS
As noted, seafood is the most traded food commodity with 39 percent of its production being traded in 2011 and 77 percent of it being exposed to trade competition (Tveteras et al. 2012). This suggests that tariffs in general are not a big issue, and this is a benefit of seafood being treated as an industrial product. As an industrial product, tariffs on seafood are not expected to increase. Most unprocessed and lightly processed seafood has no or very low tariffs. There is a tariff escalation for more processed products, and while this to some extent limits trade, the total effect is most likely rather limited (Anderson et al. 2010). The growth of third-country processing and re-exporting is further evidence that tariffs are not a substantial barrier. This also implies that trade liberalization does not have a large impact on seafood markets.
There is, to my knowledge, no tariff differentiation between wild and farmed products, and although there are rules in some countries that require consumers to be informed about the production mode, most supply chains do not differentiate by production technique after the fish is out of the water. The revisions of the HS nomenclature were supposed to allow identification of aquaculture products for at least some countries and species, but this has been postponed to the 2017 revision. As most negative issues relate to production techniques and management issues, it is not obvious that trade barriers are the best solution, with one possible exception. Brander and Taylor (1998) show that increased trade is welfare reducing for countries that do not manage common pool resources such as wild fish. As the production systems are different in fisheries and aquaculture, the management systems and the environmental consequences of the two can differ. This suggests that it is important to distinguish between farmed and wild fish in the HS nomenclature if one is to use trade measures to address environmental concerns. However, given that most fish is in a similar size range, it is hard for people who are not experts to distinguish between farmed and wild fish. Hence, it is not obvious that a separation between wild and farmed seafood in the HS nomenclature would be beneficial in total. It is even possible that such a distinction could lead to increased use of protectionist measures.
SUBSIDIES
We know quite a lot about fisheries subsidies around the world. Following a World Bank study (Milazzo 1998) that estimated that fisheries subsidies made up 30 to 35 percent of total cost, there has been significant attention to this issue (OECD 2005, 2006). Other researchers have estimated the magnitude of subsidies for particular regions such as the North Atlantic (Munro and Sumaila 2002) and globally (Sumaila et al. 2010). Examples of fishery subsidies include
THE TRADE SYSTEM
Fish products are currently treated as industrial products under the World Trade Organization (WTO). Actions of individual countries or groups of countries have the potential to fall under the jurisdiction of, and possibly conflict with, a wide range of WTO rules. We discuss briefly tariffs, subsidies, non-tariff barriers such as sanitary and phytosanitary (SPS) measures, anti-dumping and countervailing measures, technical barriers to trade, and rules of origin. We then provide an overview of efforts by non-governmental organizations (NGOs) to promote marine conservation through private means, which could eventually involve governments and hence WTO rules.

12
funds for boat construction and/or modernization; fuel and other transport subsidises; foregone government revenue on income taxes; and foregone government revenue on fuel taxes. The literature also discusses fisheries buybacks, port construction, and fisheries research as subsidies to fisheries, although there is no general agreement on whether these measures indeed qualify as subsidies.
I am not aware of similar studies related to aquaculture. However, aquaculture products figure prominently in anti-dumping cases involving seafood, and there is a subsidy element in many of the complaints. For instance, when Norway was found guilty of dumping salmon in the US in 1992 (Anderson 1992), a part of the complaint was subsidies. These came in two forms—a regional preference scheme where all companies in the northernmost part of Norway paid a lower payroll tax, and a public rural community bank that provided capital at subsidized prices. There are similar schemes in a number of developed countries, and subsidies for investment and regional development are prevalent, particularly in the EU. However, most of these are large net importers of seafood and this is not a trade issue. Moreover, given the importance of developing countries (see Section 2) that cannot afford substantial subsidies in aquaculture production, subsidies are not likely to be a substantial issue.
An interesting case that highlights some of the complexities of the global seafood trade is the US anti-dumping action against shrimp from China, Vietnam, India, Thailand, Ecuador, and Brazil filed in 2003 (Keithly and Poudel 2008). The vast majority of US imports from these countries came from farmed shrimp. As such, an important basis for the case was that international organizations such as the World Bank subsidized the development of shrimp aquaculture in these countries and conferred an unfair competitive advantage on this growing export industry. Quantitatively assessing this claim is difficult. The production methods of shrimp farming and wild capture shrimp fishing differ dramatically, but to consumers the products are quite similar, especially once processed or frozen. The different production methods make it difficult to compare their production costs. The similarity of the product, however, means that farmed shrimp imports compete directly with domestic wild capture shrimp.
This case also presents some interesting equity issues. Suppose an international development organization encourages a country to develop a particular industry. Being successful in developing an export industry, the country could subsequently be punished with an anti-dumping duty, which could be legitimated by another international organization, namely the WTO. Given the potential environmental impacts of fish farming, environmental NGOs and possibly some development organizations in the future may provide technical support and financial incentives for developing countries to farm fish more sustainably. Will these actions be seen as subsidies and contribute to countervailing or anti-dumping duties that could be upheld under the WTO? One could stretch the logic further and
suggest that lack of international coordination in such cases could lead to inefficient investment in infrastructure.
In this context, it is worthwhile to note that dumping of seafood has been a WTO concern primarily in relation to aquaculture, as shown in the Appendix. The rapid increase in aquaculture production of certain species led to increased imports in some countries where domestic producers of similar products have filed anti-dumping complaints against what they perceive as unfair competition. Among the most important examples are shrimp (Keithly and Poudel 2008), salmon (Asche 2001), and catfish (Norman-Lopez and Asche 2008). As aquaculture production of new species and entry to new markets are likely to repeat these patterns, more trade conflicts are likely.
NON-TARIFF BARRIERS
Non-tariff barriers are a difficult case as they are often perceived differently by the parties involved. In importing countries, they are perceived as a necessary means to protect public health. There are several cases that seems to conform to this perspective. For example, some aquacultured fish from China were found to contain chemicals, including malachite green, that had been introduced in the feeding process. However, there are also a number of exporters who think these requirements are a new form of trade barrier. The experiences of Kenyan exporters of Nile perch and Bangladeshi shrimp exporters are examples. For a period of time, imports to the EU were terminated due to food safety concerns. The EU Commission, of course, claims that the import bans were entirely justified. The same is true for salmon from Norway and pangasius exported from Vietnam to Russia.
In the same way as the majority of anti-dumping cases involving seafood are related to aquaculture, this also seems to be the case for non-tariff barriers, although it is very hard to document. It is certainly the case, though, that with increased trade in aquaculture products, there are likely to be more cases of non-tariff barriers as well.
NON-GOVERNMENTAL EFFORTS TO PROMOTE
MARINE CONSERVATION
NGOs generally have not been satisfied with the track records of governments, trade policy, international agreements, and international organizations to promote marine conservation. Overfishing due to open access and the deleterious effects of fishing on marine biodiversity and unique marine habitats persist in many parts of the world. As a result, NGOs have begun to advocate using the market to influence fisheries management and marine conservation through consumer pressure (as distinct from market-based regulations like individual transferable quotas

13
[ITQs]). Some NGOs claim that consumers do not accept the mismanagement of fish stocks and wish to purchase sustainable seafood alternatives. Increasingly, aquaculture has received similar attention.
Ecolabelling is one market-based tool, allowing consumers to choose seafood only from well-managed fisheries. To strengthen the credibility of ecolabels, they often require third-party certification. The most notable certification body is the Marine Stewardship Council (MSC), which has certified a number of fisheries as meeting its standards for sustainability. Some examples include the Alaska (wild) salmon, Gulf of Alaska pollock, New Zealand hoki, Norway north east Arctic saithe, Oregon pink shrimp, South Africa hake trawl, and South Georgian Patagonian toothfish longline fisheries. Using an ecolabel will in most cases also require some kind of traceability to ensure that fish with the right to it is not mixed with other fish in the supply chain. From 2012, the MSC’s sister label for aquaculture products, the Aquaculture Stewardship Council (ASC), began operating. There are also other ecolabels for farmed fish, to some extent spurred by the (perceived) success of the MSC label. The Friend of the Sea label has been available for both wild and farmed seafood for a decade. There have also been a number of other attempts to label fish products as sustainable, including organic labelling, and certified best practice guidelines.
Certification, labelling, or meeting specific standards segment the market into products where the standard is met, and those where it is not. Meeting standards requires that producers provide information that otherwise would not be provided, and carry out costly additions to the production processes they otherwise would not undertake. These burdens make some producers unable or unwilling to meet standards and therefore further segments the market, reduces trade, or changes trade patterns. While some standards seem justified, the myriad of requirements that differ across countries creates barriers for many producers. This is particularly true for producers in developing countries, where limited infrastructure makes it very hard to document the production process even when it is compliant. The problem is particularly acute for ecolabelling, as many developing countries lack the governance structure for their producers to be certified. However, at the other end of the labelling spectrum, it is difficult to draw a clear distinction between a generic brand that focuses on promoting an attribute of the product, and a company brand that promotes certain attributes of the seller. Hence, if one were to implement measures that prohibit some voluntary labels because they are distorting trade, it is difficult to identify the point where labelling should not be allowed without outlawing all labels. When governments issue the labels, WTO rules do apply with respect to discriminatory behavior. There have not yet been any disputes regarding labelling of aquaculture products, but the General Agreement on Tariffs and Trade (GATT) and WTO have heard a number of cases related to the US dolphin-safe tuna labels.
CONCLUSIONS AND
RECOMMENDATIONS
Global aquaculture production increased from about 4 million tonnes in 1970 to 66 million tonnes in 2012, and the World Bank (2013) projects it will grow to 93.6 million tonnes in 2030. The FAO (2014) expects that aquaculture will become a more important source for seafood than wild harvest in 2014. Hence, aquaculture is already a major source of seafood. This development has been possible because aquaculture has been the world’s fastest growing food production technology during the last three decades.
There are, of course, a number of reasons for the rapid growth in aquaculture. First and foremost, aquaculture production is profitable for individual firms, as only industries that are profitable are able to attract investors and labor. Hence, the growth in aquaculture production also contributes to economic growth, and presumably, improved livelihoods for those who benefit from that economic growth. Aquaculture has provided economic opportunity because control of the production process allowed systematic R&D, and particularly the transfer of knowledge from the agro-sciences. For the World Bank’s 2030 projection of 93 million tonnes of farmed seafood to be fulfilled, this development must continue. Development is also likely, as there are substantial differences with respect to technology adoption between different species, and even the most developed species are far behind agriculture in terms of knowledge use and degree of technical sophistication. If the mode of production is an important characteristic, which it seems to be for environmental and public health reasons, one should require that farmed and wild fish can be differentiated in the HS nomenclature.
Seafood is generally regarded as being healthy, despite containing toxins and other contaminants. There is therefore a trade-off involved when consuming seafood, as with most other foods. Different organizations and governments generally recognize that public health will improve in most places if more seafood is consumed. These health benefits occur also when the seafood is imported.
However, aquaculture is also a new way of using the ecosystem. It has many similarities to agriculture when it comes to environmental impacts. As a rapidly growing industry, there are unfortunately too many examples where the environmental carrying capacity is exceeded, making the industry economically and environmentally unsustainable. While the causes differ from case to case, lack of or too lax regulations and poor or non-existent management are the root causes. The dominance of developing countries in aquaculture production is most likely caused by this factor—most developed countries are willing to accept so little

14
environmental risk or impacts that it is close to impossible for a new biology-based industry to develop in them. On the other hand, successful aquaculture requires infrastructure and knowledge in addition to water, explaining why its presence is limited in the poorest countries.
One cannot document that aquaculture is trade driven. However, the fact that global seafood trade continues to grow despite wild harvests stagnating is a strong indication that a substantial part of aquaculture is trade-driven. There are a number of examples of trade-driven production of specific species by some countries, such as shrimp and tilapia from Honduras or pangasius from Vietnam. As always, this creates winners and losers. Among the losers are local consumers who lose in the competition with the global market, people who lose their livelihoods when aquaculture producers take over communal lands, and producers of other foods in importing countries who get outcompeted. In aggregate, as always, societies will be better off with economic growth, although there are negative distributional consequences.
That aquaculture products are highly traded implies that trade measures can be very effective in changing behavior, whatever reason they are implemented for. The substantial negative environmental impacts of aquaculture that have been documented in a number of cases suggest that this is a tool that should be considered. However, aquaculture is not an inherently unsustainable production process in itself. It is rather lack of local management that seems to be the main issue. Hence, it is hard, perhaps even impossible, to find general measures addressing specific challenges. This is even more so as aquaculture is a production technology that primarily is carried out in developing countries. The rapid growth in production is an indication that it contributes to economic growth and development. Poorly directed trade measures could become trade barriers preventing economic development in developing countries. The positive health effects of consuming seafood are a positive effect of increased aquaculture production and trade. Aquaculture can also have positive environmental effects in the bigger picture, as higher food production from aquatic environments is likely to reduce pressure on marginal terrestrial lands for food production. If trade measures are to be implemented, they need to focus on specific environmental or management issues. More general measures are, if they are effective, only likely to reduce food production and economic growth in a number of developing countries.
Aquaculture products are involved in a very high share of anti-dumping cases that involve seafood. Given that few countries have export-oriented aquaculture growth strategies backed by money (subsidies), this is somewhat surprising. On the other hand, production growth in many species has been high enough to create substantial market disturbances. Given that the use of anti-dumping cases has exploded after WTO Members prohibited tariff increases (Prusa 1996), it is likely that a large number of these cases reflect protectionist measures rather that addressing true
grievances. That Norway and Chile were largely vindicated by WTO panels after a long series of anti-dumping cases against salmon exports is one such example. However, the anti-dumping rules are there for good reasons, and it is far from obvious that the trade system would be better if they were removed. The problem seems more to be that any rule is open to misuse. Clearer rules would be beneficial for how anti-dumping duties are computed, as there is a lot of creative math going on.
The fourth location of EU production is Portugal, which had a 6 percent share of the EU total in 1998, falling to 4 percent in 2007.
21
In the UK, ‘ambient’ product (‘shelf-stable’ in the US) refers to traditional canned products, as well as tuna in pouches and other so-called value-added tuna products that can be kept in non-refrigerated conditions for long periods (i.e. on the supermarket shelf).
22

15
Anderson, J. L. 1992. “Salmon Market Dynamics.” Marine Resource Economics, 7, pp. 87–88.
Anderson, J. L. 2002. “Aquaculture and the Future.” Marine Resource Economics, 17 (2), pp. 133–52.
Anderson, J. L., Asche, F. and Tveterås, S. 2010. “World Fish Markets.” In Handbook of Marine Fisheries Conservation and Management, R. Q. Grafton, R. Hilborn, D. Squires, M. Tait and M. Williams (Eds.), Oxford University Press, Oxford.
American Heart Association (AHA). 2012. “Sudden Cardiac Death.” http://newsroom.heart.org/news/american-heart-asso ciation-and-236771.
Asche, F. 2001. “Testing the Effect of an Anti-dumping Duty: The US Salmon Market.” Empirical Economics, 26, pp. 343–55.
Asche, F. 2008. “Farming the Sea.” Marine Resource Economics, 23, pp. 527–47.
Asche, F., Bellemare, M., Roheim, C., Smith, M. D. and Tveteras, S. 2015. “Fair Enough? Food Security and the International Seafood Trade.” World Development, 67, 151-160.
Asche, F., Bjørndal, T. and Young, J. A. 2001. “Market Interactions for Aquaculture Products.” Aquaculture Economics and Management, 5, pp. 303–18.
Asche, F., Hansen, H., Tveteras, R. and Tveterås, S. 2009. “The Salmon Disease Crisis in Chile.” Marine Resource Economics, 24 (4), pp. 405–11.
Asche, F., Roll, K. H., Sandvold, H. N., Sørvig, A. and Zhang, D. 2013. “Salmon Aquaculture: Larger Companies and Increased Production.” Aquaculture Economics and Management, 17 (3), pp. 322–39.
Asche, F., Oglend, A. and Tveteras, S. 2013. “Regime Shifts in the Fish Meal/Soybean Meal Price Ratio.” Journal of Agricultural Economics, 64, pp. 97–111.
Asche, F. and Tveterås, S. 2004. “On the Relationship between Aquaculture and Reduction Fisheries.” Journal of Agricultural Economics, 55 (2), pp. 245–65.
Barrett, C. B., Bachke, M. E., Bellemare, M. F., Michelson, H. C., Narayanan, S. and Walker, T. F. 2012. “Smallholder Participation in Contract Farming: Comparative Evidence from Five Countries.” World Development, 40, pp. 715–30.
REFERENCESBellemare, M. F. 2012. “As You Sow, So Shall You Reap: The Welfare Impacts of Contract Farming.” World Development, 40, pp. 1418–34.
Béné, C., Lawton, R. and Allison, E. H. 2009. “Trade Matters in the Fight Against Poverty: Narratives, Perceptions and, (Lack of) Evidence in the Case of Fish Trade in Africa.” World Development, 38, pp. 933–54.
Bennett, M. K. 1941. Wheat in National Diets. Stanford, CA: Stanford University Press.
Brander, J. A. and Taylor, M. S. 1998. “Open Access Renewable Resources Trade and Trade Policy in a Two-country Model.” Journal of International Economics, 44, pp. 181–210.
Cohen, J. T., Bellinger, D. C., Connor, W. E., Kris-Etherton, P. M., Lawrence, R. S., Savitz, D. A., Shaywitz, B. A., Teutsch, S. M. and Gray, G.M. 2005. “A Quantitative Risk-Benefit Analysis of Changes in Population Fish Consumption.” American Journal of Preventative Medicine, 29 (4), pp. 325–34.
Delgado, C. L., Wada, N., Rosengrant, M. W., Meijer, S. and Ahmed, M. 2003. Fish to 2020: Supply and Demand in Changing Global Markets. Washington: IFPRI.
Dietary Guidelines Advisory Committee.2004. “2005 Dietary Guidelines Committee,” www.health.gov/dietaryguidelines;dg a2005/report/.
Edward, P. 2006. “Examining Inequality: Who Really Benefits from Global Growth?” World Development, 34, pp. 1667–95.
FAO. 2006. The State of World Fisheries and Aquaculture 2006. Food and Agriculture Organization, Rome.
FAO. 2012a. The State of World Fisheries and Aquaculture 2012. Food and Agriculture Organization, Rome.
FAO. 2012b. “FAO Fisheries Department, Fishery Information and Statistics Unit.” FISHSTAT Plus Version 2.3.2, Database Aquaculture Production 1950–2010.
FAO, 2014. The State of World Fisheries and Aquaculture 2014. Food and Agriculture Organization, Rome.
Gordon, D. V. and Bjørndal, T. 2001. “A Comparative Study of Production Factors and Productivity for Shrimp Farms in Three Asian Countries: Bangladesh, India and Indonesia.” Aquaculture Economics and Management, 13, pp. 176–90.
Hites, R. A., Foran, J. A., Carpenter, D. O., Hamilton, M. C., Knuth, B.A. and S. J. Schwager. 2004. “Global Assessment of Organic Contaminants in Farmed Salmon.” Science, 303, pp. 226–29.
Keithly, W. R. Jr. and Poudel, P. 2008. “The Southeast US Shrimp Industry: Issues Related to Trade and Antidumping Duties.” Marine Resource Economics, 23, pp. 459–83.

16
Kinnucan, H. W. and Myrland, Ø. 2002. “The Relative Impact of the Norway-EU Salmon Agreement: A Mid-term Assessment.” Journal of Agricultural Economics, 53, pp. 195–220.
Kristofersson, D. and Anderson, J. L. 2006. “Is There a Relationship between Fisheries and Farming? Interdependence of Fisheries, Animal Production and Aquaculture.” Marine Policy, 30 (6), pp. 721–25.
Milazzo, M. 1998. “Subsidies in World Fisheries: A Reexamination.” World Bank Technical Paper No. 406, Washington, D.C.: World Bank.
Munro, G. R. and Sumaila, U. R. 2002. “Subsidies and their Potential Impact on the Management of the Ecosystems of the North Atlantic.” Fish and Fisheries, 3, pp. 233–50.
Naylor, R. L., Goldburg, R. J., Mooney, H., Beveridge, M., Clay, J., Folke, C., Kautsky, N., Lubchenco, J., Primavera, J. and Williams, M. 1998. “Nature’s Subsidies to Shrimp and Salmon Farming.” Science, 282, pp. 883–84.
Naylor, R. L., Goldburg, R. J., Primavera, J., Kautsky, N., Beveridge, M., Clay, J., Folke, C. and Lubchenco, J. 2000. “Effects of Aquaculture on World Fish Supplies.” Nature, 405 (29), pp. 1017–24.
National Academy of Sciences, Institute of Medicine. 2004. “Dietary Reference Intakes for Energy, Carbohydrate, Fiber, Fat, Fatty Acids, Cholesterol, Protein, and Amino Acids: Pt I.,” Washington, DC, http://darwin.nap.edu/books/0309085373/html.
National Academy of Sciences, Institute of Medicine. 2006. Seafood Choices: Balancing Benefits and Risks. Washington, DC, http://newton.nap.edu/catalog/11762.html.
National Fisheries Institute. 2013. “Top 10 Consumed Seafoods.” www.aboutseafood.com/about/about-seafood/ top-10-consumed-seafoods.
Norman-López, A. and Asche, F. 2008. “Competition between Imported Tilapia and US Catfish in the US Market.” Marine Resource Economics, 23, pp. 199–214.
OECD. 2005. “Subsidies: a Way Towards a Sustainable Fisheries?” Policy Brief, Organization for Economic Cooperation and Development, Paris.
OECD. 2006. Financial Support to Fisheries. Implications for Sustainable Development. OECD, Paris.
Parker, R. O. 2011. Aquaculture Science. 3rd edition, Cengage Learning, New York.
Prusa, T. J. 1996. “The Trade Effects of US Antidumping Actions.” In R. C. Feenstra (Ed.), Effects of US Trade Protection and Promotion Policies, Chicago, University of Chicago Press.
Roheim, C. 2004. “Trade Liberalization in Fish Products: Impacts on Sustainability of International Markets and Fish Resources.” In Global Agricultural Trade and Developing Countries, A. Aksoy and J. Beghin, eds, World Bank, Washington, DC, pp. 275–95.
Roheim, C. A. 2009. “An Evaluation of Sustainable Seafood Guides: Implications for Environmental Groups and the Seafood Industry.” Marine Resource Economics, 24, pp. 301–10.
Santerre, C. 2010. “The Risks and Benefits of Farmed Fish.” Journal of the World Aquaculture Society, 41 (2), pp. 250–57.
Swartz, W., Sumaila, U. R., Watson, R. and Pauly, D., 2010. “Sourcing Seafood for the Three Major Markets: The EU, Japan and the USA.” Marine Policy, 34, pp. 1366–73.
Smith, M. D., Roheim, C. A., Crowder, L. B., Halpern, B. S., Turnipseed, M., Anderson, J. L., Asche, F., Bourillón, L., Guttormsen, A. G., Kahn, A., Liguori, L. A., McNevin, A., O’Connor, M., Squires, D., Tyedemers, P., Brownstein, C., Carden, K., Klinger, D. H., Sagarin, R. and Selkoe, K. A. 2010. “Sustainability and Global Seafood.” Science, 327, pp. 784–86.
Sumaila, U. R., Khan, A., Andrew J. Dyck, A., Watson, R., Munro, G., Peter Tyedmers and Pauly, D. 2010. “A Bottom Up Re-estimation of Global Fisheries Subsidies.” Journal of Bioeconomics, 12, pp. 201–25.
Tacon, A. G. J. and Metian, M. 2008. “Global Overview on the Use of Fish Meal and Fish Oil in Industrially Compounded Aquafeeds: Trends and Future Prospects.” Aquaculture, 285, pp. 146–58.
Teutsch, S. M. and Cohen, J. T. 2005. “Health Trade-offs from Policies to Alter Fish Consumption.” American Journal of Preventative Medicine, 29 (4), p. 324.
Tveterås, S. 2002. “Norwegian Salmon Aquaculture and Sustainability: The Relationship between Environmental Quality and Industry Growth.” Marine Resource Economics, 17 (1), pp. 121–32.
Tveteras, S., Asche, F., Bellemare, M. F., Smith, M. D., Guttormsen, A. G., Lem, A., Lien, K. and Vannucini, S. 2012. “Fish is Food – The FAO’s Fish Price Index.” PLoS ONE, 7 (5), p. e36731.
Ward, T. and Phillips, B. (eds.). 2008. Seafood Ecolabeling: Principles and Practice. Wiley-Blackwell.
Willett, W. 2005. “Fish Balancing Health Risks and Benefits.” American Journal of Preventive Medicine, 29 (4), pp. 320–21.
World Bank. 2013. “Fish to 2030: Prospects for Fisheries and Aquaculture.” World Bank Report No. 83177-GLB, Washington, DC, Dec.

17
Fisheries Disputes in WTO
(1) European Community — Trade Description of Scallops, 1995, Complainants: Peru, Chile, and Canada.
(2) Australia — Measures Affecting Importation of Salmon, DS18. 1995. Complainant: Canada.
(3) Australia — Measures Affecting the Import of Salmonids, 1995. Complainant: United States.
(4) United States — Import Prohibition of Certain Shrimp and Shrimp Products, 1996, Complainants: India, Malaysia, Pakistan, and Thailand.
(5) United States — Import Prohibition of Certain Shrimp and Shrimp Products, 1996. Complainant: Philippines.
(6) United States — Countervailing Duty Investigation of Imports of Salmon from Chile, 1997. Complainant: Chile.
(7) Chile — Measures Affecting the Transit and Importing of Swordfish, 2000. Complainant: EC.
(8) Egypt — Import Prohibition on Canned Tuna with Soybean Oil, 2000. Complainant: Thailand.
(9) European Community — Trade Description of Sardines, 2001. Complainant: Peru.
(10) Japan — Import Quotas on Dried Laver and Seasoned Laver, 2004. Complainant: Korea.
(11) United States — Provisional Anti-Dumping Measures on Shrimp from Thailand, 2004. Complainant: Thailand.
(12) European Community — Definitive Safeguard Measure on Salmon, 2005. Complainant: Chile.
(13) European Communities — Definitive Safeguard Measure on Salmon, 2005. Complainant: Norway, joined by Chile.
(14) United States — Anti-Dumping Measure on Shrimp from Ecuador, 2005. Complainant: Ecuador.
(15) European Community — Anti-Dumping Measure on Farmed Salmon from Norway, 2006. Complainant: Norway.
(16) United States — Measures Relating to Shrimp from Thailand, 2006. Complainant: Thailand.
(17) United States — Measures Concerning the Importation, Marketing and Sale of Tuna and Tuna Products, 2008. Complainant: Mexico.
(18) United States — Anti-Dumping Measures on Shrimp and Diamond Saw Blades from China, 2011. Complainant: China.
(19) United States — Anti-Dumping Measures on Certain Frozen Warm Water Shrimp from Viet Nam, 2012. Complainant: Vietnam.
APPENDIX


Implemented jointly by ICTSD and the World Economic Forum, the E15Initiative convenes world-class experts and institutions to generate strategic analysis and recommendations for government, business and civil society geared towards strengthening the global trade system.


