THE INFLUENCE OF SOCIAL SELF-EFFICACY, SELF-ESTEEM, AND PERSONALITY

Louisiana State UniversityLSU Digital Commons
LSU Doctoral Dissertations Graduate School
2010
The influence of self-esteem and selecteddemographic characteristics on the academicachievement of freshman students in the College ofAgriculture at a Research-Extensive UniversityMae Blanchard GaspardLouisiana State University and Agricultural and Mechanical College
Follow this and additional works at: https://digitalcommons.lsu.edu/gradschool_dissertations
Part of the Human Resources Management Commons
This Dissertation is brought to you for free and open access by the Graduate School at LSU Digital Commons. It has been accepted for inclusion inLSU Doctoral Dissertations by an authorized graduate school editor of LSU Digital Commons. For more information, please [email protected].
Recommended CitationGaspard, Mae Blanchard, "The influence of self-esteem and selected demographic characteristics on the academic achievement offreshman students in the College of Agriculture at a Research-Extensive University" (2010). LSU Doctoral Dissertations. 921.https://digitalcommons.lsu.edu/gradschool_dissertations/921
THE INFLUENCE OF SELF-ESTEEM AND SELECTED DEMOGRAPHIC CHARACTERISTICS ON THE ACADEMIC ACHIEVEMENT
OF FRESHMAN STUDENTS IN THE COLLEGE OF AGRICULTURE AT A RESEARCH-EXTENSIVE UNIVERSITY
A Dissertation
Submitted to the Graduate Faculty of the Louisiana State University and
Agricultural and Mechanical College in partial fulfillment of the
requirements for the degree of Doctor of Philosophy
in
The School of Human Resource Education and Workforce Development
by Mae Blanchard Gaspard
B. S., Northwestern State University, 1972 M. S., Louisiana States University, 1994
May 2010
ii
© Copyright 2010 Mae Blanchard Gaspard
All rights Reserved

iii
This dissertation is dedicated to the memory of my grandparents Mary Anna Paxton
Blanchard and Albert Cyril Blanchard, Sr. and my father Albert Cyril Blanchard, Jr. They loved
me without condition.
iv
ACKNOWLEDGMENTS
Many people have encouraged and helped me prior to and during the years of this project.
A sincere thank you is extended to individuals listed herein, as well as others who have been
constant sources of encouragement to me.
I offer my deepest thanks to Dr. Michael Burnett, my major professor, for the endless
amounts of time he spent directing me in this study. There is no way I could repay Dr. Burnett
for what he has done for me. He is and always will be my teacher and my friend.
Dr. Satish Verma in his quiet and gentle manner has been a constant encourager and
source of wisdom to me. For this I sincerely thank him. Dr. Geraldine Johnson has exemplified
an enthusiasm for her work which is infectious. She has served as an inspiration to me. I am
thankful for her. Dr. Earl Johnson is a noble teacher. His willingness to serve as a committee
member is greatly appreciated. I also thank Dr. Krisanna Machtmes, who has shown by
example her priority is putting her students first in their endeavors to achieve their academic
goals. Dr. Nathan Crick, the Graduate School Dean’s Representative, offered invaluable insight
and I thank him for his contributions.
Mrs. Charlotte Robertson so kindly and efficiently typed and formatted this document for
me. I sincerely thank my new friend for her assistance. I have a deep appreciation for freshman
students in the College of Agriculture at the Research-Extensive University where this study was
conducted. While complete confidentiality has been promised, I thank these young people for
their participation.
It is with deep love and admiration that I thank my dear husband Camile for challenging
me years ago to enter the classroom to begin a graduate program. My children John and Mary
are now adults and our family has grown to include our son-in-law Odie and two wonderful little
v
girls, our granddaughters Katherine and Abbagayle. They are constant reminders to me of the
words that the Psalmist wrote “. . . I am fearfully and wonderfully made” (Psalm 139:14). With
this promise we can esteem ourselves not because of performance, but because of who we are---
God’s creation.
vi
TABLE OF CONTENTS
DEDICATION……………………………………………………………………… iii ACKNOWLEDGMENTS…………………………………………………………... iv LIST OF TABLES…………………………………………………………………… viii ABSTRACT………………………………………………………………………… x CHAPTER 1 INTRODUCTION…………………………………………………… 1 Rationale…………………………………………………………… 1 Purpose of the Study……………………………………………….. 12 2 REVIEW OF RELATED LITERATURE…………………………… 15 Introduction…………………………………………………………. 15 Academic Achievement…………………………………………….. 15 Self-Esteem Defined………………………………………………… 19 Development of Self-Esteem in the Individual……………………… 28 The College Years…………………………………………………… 32 Summary of the Review of Literature……………………………….. 49 3 METHODOLOGY…………………………………………………… 51 Purpose of Study…………………………………………………….. 51 Dependent Variable………………………………………………… 51 Specific Objectives…………………………………………………. 51 Population and Sample……………………………………………… 54 Instrumentation……………………………………………………… 54 Data Collection……………………………………………………… 55 Data Analysis……………………………………………………….. 56 4 FINDINGS…………………………………………………………… 63 Objective One………………………………………………………. 63 Objective Two……………………………………………………… 68 Objective Three…………………………………………………… .. 71 Objective Four……………………………………………………… 72 Objective Five……………………………………………………… 73 Objective Six……………………………………………………… .. 74 Objective Seven…………………………………………………….. 74 Objective Eight……………………………………………………… 82 5 SUMMARY OF FINDINGS, CONCLUSIONS AND RECOMMENDATIONS……………………………………… 90 Purpose and Objectives…………………………………………….. 90 Summary of Methodology………………………………………….. 93
vii
Summary of Major Findings……………………………………… 95 Conclusions and Recommendations………………………………. 102 REFERENCES…………………………………………………………………….. 114 APPENDIX A APPLICATION FOR EXEMPTION FROM INSTITUTIONAL OVERSIGHT……………………………………………………… 122 B CONSENT FORM………………………………………………… 124 C PERMISSION TO USE SAMPLES OF COPYRIGHT MATERIALS……………………………………………………… 126 D SAMPLES OF COPYRIGHT MATERIALS……………………... 128 E COLLEGE OF AGRICULTURE FRESHMAN QUESTIONNAIRE……………………………………………….. 130 VITA………………………………………………………………………………. 132
viii
LIST OF TABLES
1. Age of First Semester Freshman Students in the College of Agriculture at a Research-Extensive University………………………………… 64 2. Highest Level of Education Completed by Parents of First Semester Freshman Students in the College of Agriculture at a Research-Extensive University……………………………………………… 65 3. Marital Status of Parents of First Semester Freshman Students in the College of Agriculture at a Research-Extensive University……………… 66 4. Race of First Semester Freshman Students in the College of Agriculture at a Research-Extensive University………………………………… 67 5. Participation in Organizations and Groups during the First Semester of College Enrollment Reported by Students in the College of Agriculture at a Research-Extensive University………………………………… 69 6. Pretest and Posttest Self-Esteem Scores of First Semester Freshman Students in the College of Agriculture at a Research-Extensive University………………………………………………………………………… 71 7. Normative Data for Self-Esteem Scores of First Semester Freshman Students in the College of Agriculture at a Research-Extensive University………………………………………………………………………… 72 8. First Semester Grade Point Average of Freshman Students in the College of Agriculture at a Research-Extensive University……………………... 73 9. Relationship between Selected Demographic Characteristics and Academic Achievement of First Semester Freshman Students in the College of Agriculture at a Research-Extensive University…………………. 78 10. Multiple Regression Analysis of Academic Achievement as Measured by First Semester Grade Point Average and Selected Demographic Characteristics of Freshman Students in the College of Agriculture at a Research-Extensive University……………………………… 80 11. Relationship between Selected Demographic Characteristics and Self-Esteem of First Semester Freshman Students in the College of Agriculture at a Research-Extensive University………………………………… 86
ix
12. Multiple Regression Analysis of Self-Esteem as Measured by the Coopersmith Inventory and Selected Demographic Characteristics of First Semester Freshman Students in the College of Agriculture at a Research-Extensive University…………………………………………….. 88

x
ABSTRACT
The primary purpose of this study was to determine if a relationship existed between self-
esteem and academic achievement among students at the freshman level in the College of
Agriculture at a Research-Extensive University in the Southern Region of the United States.
The sample of the study was all students at one selected Research-Extensive University
enrolled in the Introduction to Agriculture course which was a requirement for agriculture
students at the freshman level. Three instruments were used for data collection. The Adult Form
of the Coopersmith Inventory was administered at two data collection points at the beginning and
end of the first semester of college enrollment. A researcher-designed questionnaire was used to
collect demographic information. A third instrument was a recording form on which data from
the Office of the University Registrar were downloaded and stored.
No significant relationship was found between self-esteem at the beginning of the first
semester of college and the first semester grade point average of students at the freshman level.
Using multiple regression analysis, a significant model was identified which explained 9.9% of
the variance in academic achievement. The variable that had the greatest impact on academic
achievement was membership in a departmental student organization. The variables whether or
not the father completed a graduate degree, membership in service organizations, and partici-
pation in sports also entered the model. Multiple regression analysis was also used to identify a
significant model that explained 17.3% of the variance in self-esteem at the end of the first
semester of college enrollment. The variable with the greatest impact on self-esteem was age.
Other variables which contributed significantly were membership in social sororities/fraternities,
membership in religious organizations, Hispanic Race, African American Race, and Caucasian
Race.

xi
The researcher concluded that there was no relationship between academic achievement and
self-esteem. The researcher recommended the development of an instrument to measure self-
attitudes regarding constructs specific to the college student. This instrument would serve the
function of measuring self-esteem for this intermittent stage in the lives of many young people.

1
CHAPTER 1
INTRODUCTION
Rationale
Importance of Agriculture
Agriculture is a very important enterprise in the modern world. Nowhere is the vital
nature of this industry more clearly conveyed than through the fact that “every 3.6 seconds
someone dies of hunger” (The world hunger problem, 2009).
A young truck farmer in the southern part of Louisiana was recently interviewed
regarding his success as a produce farmer. The reporter questioned the young man as to why he
had chosen his particular livelihood. He responded, “We are actually raising food for people to
live. It’s a trivial thing to some people but it’s a big thing to us” (Lockhart, 2007, p. 1). Indeed,
in a land of plenty where fast food and “take-out” have become the norm for some, Americans
may have the tendency to forget or fail to acknowledge the importance of agriculture in today’s
economy, political climate, or personal well- being of individuals who live in the United States
of America. They may not consider the power which results when a country can provide food
for its people.
From the earliest time in history humans fed themselves exclusively through hunting wild
animals and gathering wild plants (Diamond, 1998). In his book Guns, Germs, and Steel,
Diamond (1998) denoted this period as a time approximately seven million years ago. He
(Diamond, 1998) contended that within the last 11,000 years some people began domesticating
wild animals and plants and consuming the livestock and crops that resulted from their efforts.
Thus, they turned to food production. He believes the timing of food production due to
geographical differences has led to a contrast in the fates of continents. The resulting fates have

2
led to advantages for some. Considering the chain of events, those who ultimately domesticated
many plant and animal species could provide more consumable calories. Denser human
populations and more sedentary lifestyles followed. Higher population densities and good food
provided surpluses of food that equated to division of labor, resulting in invention or
technological advances. Many of the technological advances were designed for war and power
(Diamond, 1998). In addition to food, crops were of value as sources of natural fibers for
making clothing, blankets, nets, rope, and other products (Diamond, 1998).
Such a discussion leads one to consider the developmental theory of Abraham Maslow
(1954). Maslow (1954) conceived of different types of needs being in a pyramid-type structure
with physiological needs at the base of the pyramid. The higher level needs in ascending order
included safety needs, love and belonging needs, esteem needs, and self-actualization needs. As
a lower level need was satisfied, then one could strive for the next higher level. The
development of fine arts would address the needs levels of esteem and self-actualization.
However, this could not be accomplished without first satisfying the basic physiological needs of
food and shelter and the need for safety. Certainly the agricultural endeavor of food production
addresses the basic physiological needs of individuals in today’s global society.
The present world population is approximately 6 billion people. One farmer in the United
States produces the food to feed 129 people, of which 101 live in the United States and 28
abroad. Considering the abundance of agricultural products today, the food and fiber industry
generates approximately 20% of the United States’ gross national product and 20% of the
nation’s employment (Facts about American Agriculture, 2007). There are more than 972
million acres of farmland nationwide. The United States produces 42.7% of the world’s
soybeans, 34.4% of the world’s corn, and 11.6% of the world’s wheat. The United States also
3
produces 21.2% of the world’s cotton. The United States exports 43.5 billion dollars in
agricultural products annually. The United States imports 26.4 billion dollars in agricultural
products annually, with a positive net trade balance of 17.1 billion dollars (Facts about American
Agriculture, 2007). In addition, Americans spend a smaller portion of their income on food than
any other people in the world, leaving more money for them to spend on housing, transportation,
clothing, and other areas (Facts about Agriculture, 2007).
Impact of Education Regarding Agriculture
The United States of America is a democracy; and, in a democracy, government is by the
people as demonstrated by their participation in the voting mechanism which contributes to laws
and the formulation of policies. An uninformed voter is a dangerous voter, and this can apply to
the area of agriculture.
A discussion of education about agriculture becomes one of agricultural literacy. The
importance of agricultural literacy was discerned years ago by Mayer and Mayer (1974) when
they stated that “the failure of our secondary schools and liberal arts colleges to teach even
rudimentary courses on agriculture means that an enormous majority, even among well-educated
Americans, are totally ignorant of an area of knowledge basic to their daily style of life, to their
family economics, and indeed to their survival” (p. 84). Others have commented that in recent
years issues related to agriculture have become more compelling for the general public as well as
the profession of agricultural education (Powell, Agnew, & Trexler, 2008). This sentiment has
been echoed by Pope (1990) who elaborated that the “real need for an agriculturally literate
society is knowledge of the impact the industry, as a whole, has upon our daily lives’ (p. 23).
Russell, McCracken, and Miller (1990) have concluded that “most people still perceive
‘agriculture’ as synonymous with ‘farming’” (p. 13). In addition, youth and the public in

4
general have a poor understanding of the role of agriculture in the history of the United States, as
well as the quality of life of the nation’s citizens and the economic well being of the nation
(Russell et al., 1990).
An example of the impact of agriculture on the daily lives of Americans is that of the
Alar Scare in 1989 involving the use of the chemical daminozide (Alar) which keeps fruit firm
and full-colored beyond its natural shelf-life. The issue of safety began when a nonprofit group
reported Alar could cause cancer. This led to a news campaign which eventually became a news
storm after the story appeared on the CBS News program “60 Minutes” (Egan, 1991). As a
result Washington apple growers, producers of about 60% of the nation’s apple crop, lost at least
25 million dollars in the six months after the initial uproar. This estimation made by the United
States Department of Agriculture indicated there were no precise figures to determine how much
of the loss was contingent on how many farmers were forced out of business due to the Alar
Scare. There was also no indication of how much factors such as bad weather and the poor
quality of fruit could have contributed to losses (Egan, 1991). The issue led farmers and
broadcasters to the Federal courtroom. It has been stated that “of all the foods that have come
under scrutiny in recent years, few have attracted as much attention or emotion as apples” (Egan,
1991). Scientists have continued to debate the relative risks of Alar. However, the government
has never concluded whether the use of the chemical posed a serious cancer risk (Egan, 1991).
This example serves to emphasize that it is incumbent upon each individual to learn about
agriculture in order to make educated decisions regarding the barrage of competitive information
regarding agriculture and agricultural products to which he/she may be exposed. Not only does
education about agriculture allow the individual to make informed personal choices, it also
provides for the development of a wise consumer and responsible citizen, which enhances the
5
individual’s engagement in the democratic process. In so doing, the foundation for decisions
regarding the act of casting one’s vote or communication with legislators concerning issues
relating to the agricultural industry contribute to the formation of policy affecting food security
in the United States and other countries of the world.
The Alar example also relates to those concerns of leaders in the field of agricultural
education during the 1980s. It was understood that education about agriculture was of the utmost
importance to all students from kindergarten through the secondary level of education, and that
agriculture was a topic that commanded too much attention “to be taught only to the relatively
small percentage of students considering careers in agriculture and pursuing vocational
agriculture studies” (National Academy of Sciences, 1988, p.1). At a time when changing
demographics and urbanization, rapid gains in worldwide agriculture production capacity, and
domestic farm and trade policies were considered some of the challenges to American
agriculture, there was the recognition of a need to adjust policies and also for the educational
system to meet the challenges presented. In 1985, a study of agricultural education was initiated,
and the National Research Council established the Committee on Agricultural Education in
Secondary Schools upon the request of the United States Secretaries of Agriculture and
Education. The committee’s task was to “assess the contributions of instruction in agriculture to
the maintenance and improvement of United States agricultural productivity and economic
competitiveness here and abroad” (National Academy of Sciences, 1988, p. v). It was this
committee that developed “the idea of ‘agricultural literacy’--the goal of education about
agriculture” (National Academy of Sciences, 1988, p. v). The committee envisioned “that an
agriculturally literate person’s understanding of the food and fiber system would include its
history and its current economic, social, and environmental significance to all Americans”
6
(National Academy of Sciences, 1988, p. 8-9). In their report that focused on both agricultural
literacy and vocational agriculture, the committee used the terms “agriculture” and “agricultural
system” interchangeably in a definition of agriculture to:
. . . encompass the production of agricultural commodities, including food, fiber, wood products, horticultural crops, and other plant and animal products. The terms also include the financing, processing, marketing, and distribution of agricultural products; farm production supply and service industries; health, nutrition, and food consumption; the use and conservation of land and water resources; development and maintenance of recreational resources; and related economic, sociological, political, environmental, and cultural characteristics of the food and fiber system (National Academy of Sciences, 1988, p. vi). The committee further stated that “an understanding of basic concepts and knowledge
spanning and uniting all of these subjects define the term ‘agricultural literacy’” (National
Academy of Sciences, 1988, p. vi). They considered this understanding to be conveyed as a
complement to instruction in academic subjects as well as those included in vocational
agricultural education. Their reasoning was built upon a finding of the report that only a small
percentage of students at that time were enrolling in vocational agricultural programs in high
schools across the United States. As a consequence most high school students had limited or no
access to vocational agricultural or agricultural literacy programs. They found minority students
in urban schools had the least access to such programs. One of their recommendations involved
some systematic instruction about agriculture which began in kindergarten and continued
through the twelfth grade, with the suggestion that much of the instruction could be incorporated
into existing courses (National Academy of Sciences, 1988). Russell et al. (1990) included
university students at large as a group who should receive agricultural literacy instruction, taking
into account students in universities who do not have agricultural colleges or departments.
7
Need for Education in Agriculture
In addition to the need for the education of people about agriculture, there is a need to
educate young people to become leaders in the field of agriculture. Ball, Garton, & Dyer (2001)
have commented “change has been a defining characteristic of agriculture” (p. 54), and consider
education as a means to address the issue of the preparation of high caliber individuals ready to
function in a rapidly changing agricultural industry. This brings to the forefront the
responsibilities placed upon colleges of agriculture. As colleges of agriculture contribute to the
industry via research and development, it is also critical that their contribution includes an
environment which provides for students the opportunity for the enhancement of academic
performance. Russell (1993) has called for a strong commitment to youth development in order
to maintain strong programs of teaching and research in colleges of agriculture. He (Russell,
1993) has warned of the serious “brain drain” (p. 1) away from agriculture that he perceived to
be underway at the time of his writing. He suggested colleges of agriculture should redirect their
focus to the development of youth as a major human resource required for a viable agricultural
industry in the years that were to follow (Russell, 1993). It becomes incumbent upon those
involved in the education of agriculture students to discover ways of predicting academic success
of students in order to meet the challenges presented.
Secondary agricultural education has been one of the channels for conveying knowledge
stimulating the interest of young people in the area of agriculture. According to the National
FFA Organization more than 11,000 teachers are involved in delivering “an innovative, cutting-
edge and integrated curriculum to students” (National FFA Organization, 2007, p. 1). During the
period from 2005-2006, the number of Departments of Agricultural Education/Agribusiness
within the 50 states and Virgin Islands ranged from one in Puerto Rico to 1,048 in the state of
8
Texas. While there is no membership in Puerto Rico, 82% of the departments in the state of
Texas have membership in the National FFA Organization. Students participate and learn about
career opportunities, leading some to become interested in college preparation. Nevertheless, a
shortage of qualified agriculture teachers remains the greatest challenge facing FFA and
agricultural education (National FFA Organization, 2007), and some have cautioned enrollments
in colleges of agriculture nationally have declined in recent years despite increased opportunities
in the food and agricultural sciences for college graduates (Russell, 1993). This causes concern
for the extension system as its employees are drawn from colleges of agriculture and the major
portion of its clientele is involved in agriculture (Russell, 1993).
Many young people do enter post secondary programs in agriculture in colleges and
universities throughout the United States. Various disciplines lead to degrees in such areas as
agribusiness, agronomy and environmental management, biological and agricultural engineering,
food science and technology, animal science, nutritional sciences, horticulture, and human
resource education (Louisiana State University, 2007). The completion of bachelor of science
degrees in these areas furthers the development of students to assume roles as leaders, extension
educators, and scholars in the field of agriculture. As such they may positively influence the
lives of individuals, families, communities, and countries around the world.
In addition to specific scholarly interests or emphasis of study, students in the colleges of
agriculture throughout the nation have concerns which may be similar to those of other students
in the university setting. Most students enrolled in colleges and universities are members of
Generation X with birthdates between 1961 and 1981, and the Millennial generation born
between 1982 and 2002. Millennials have been influenced by a cultural environment which has
instilled in them many positive qualities as they have progressed through the developmental
9
process. Typically, they are hardworking and have been socialized to be successful in life by
supportive parents. These parents are often viewed as overprotective because they have hovered
over their children at every stage of the educational process, including preparation for college
(Elam, Stratton, & Gibson, 2007).
Students of the Millennial generation do, however, present challenges to teachers,
counselors, and administrators at the secondary and postsecondary levels. Some researchers
have concerns regarding the interpersonal skills of members of this generation and the shortening
of their attention spans due to the over-reliance on communications technology (Elam et al.,
2007). According to Elam et al. (2007), members of the Millennial generation are also noted to
“have high expectations for their own success as undergraduates” (p. 24). They (Elam et al.,
2007) consider it to be incumbent upon those in counseling and advising fields to ensure direct
and accessible educational paths for these students which are directed toward self-fulfillment.
However, a discussion of the Millennial generation should not imply that all individuals of this
age group have experienced equal levels of personal, social, or financial support (Elam et al.,
2007).
Factors Impacting Academic Success of Current College Students
Thought to possess great positive potential for society (Elam et al., 2007), the young
people of the Millennial generation demonstrate the influence of a variety of factors which effect
academic achievement. Some have related academic performance to parental values and
differences in parenting styles (Dornbush, Ritter, Leiderman, Roberts, & Farleigh, 1987). The
authoritarian pattern has been described as “being high in demandedness on the part of the
parents and low in parental responsiveness to the child” (Dornbusch et al., 1987, p. 1245).
Permissive parents are those who are tolerant and accepting toward the impulses of the child,
10
using as little punishment as possible and allowing considerable self-regulation by the child.
Authoritative parenting advocates an expectation of mature behavior from the child and clear
setting of standards by the parents. Rules and standards are firmly enforced, but the parent
encourages the child’s independence and individuality. Open communication exists between
parent and child. The research of Dornbusch et al. (1987) found authoritarian and permissive
parenting styles negatively associated with grades. Authoritative styles were shown to be
positively associated with grades.
Self-esteem has been considered a factor associated with academic achievement.
Judgment of self is first made at home by a child where he/she perceives a positive self-worth or
self-esteem due to the conveyance of unconditional love by warm loving parents or a diminished
sense of self-worth due to parental rejection (Coopersmith, 1981). As interaction with parents
expands to others outside the family, the development of self-esteem continues as the child
enters school. His/her opinion of self may be dependent upon the child’s perceptions of the
teacher’s reactions to his/her performance and the performance of his/her classmates (Crocker &
Cheeseman, 1988). As an individual continues to evaluate self, Coopersmith (1981) believed
that sometime preceding middle childhood a person arrives at a general appraisal of his/her
worth. The subjective appraisal remains fairly constant over a period of several years
(Coopersmith, 1981).
The literature records investigations of the relationship between academic achievement
and self-esteem. Researchers Robinson-Awana, Kehle, and Jenson (1986) examined female and
male sex role perceptions and self-esteem relative to academic competence. In the study boys,
when responding to a self-esteem inventory instrument, reported significantly higher levels of
11
self-esteem than girls. Both sexes when considering girls as a homogenous group credited boys
with higher self-esteem.
Raffini (1986) addressed student apathy and its impact on the individual student’s
achievement, noting students may be forced to choose apathy as a defense when self-worth is
threatened. He (Raffini, 1986) believed the measurement and evaluation system which compares
one student’s performance with another contributes to apathy and noninvolvement. Rather than
being labeled average or below average some students choose to stop trying (Raffini, 1986).
Researchers have also considered the influence of such variables as group membership
(Crocker, 2002), place of residence including college residential halls (Bettencourt, Charlton,
Eubanks, Kernahan, & Fuller 1999), and participation in learning communities called Freshman
Interest Groups (FIGs) (Ball et. al., 2001) and their implications for successful academic
performance in the college setting. Writers agreed that it is essential to target specific variables
that have the potential to enhance academic performance and student retention. Lutta (2008) has
written of the “all important first semester” (p. 182) in a recent study in which findings revealed
retention to be significantly related to the grade point average of the first semester of college.
Colleges of agriculture have an opportunity to be a part in the shaping of the changing
face of agriculture. It becomes paramount that methods of education and instruction produce
highly competent and motivated individuals for a challenging future for sustainable agriculture
within the United States. It will be a future which will continue to be faced with the reduction in
the number of farms and ranches, increase in farm and ranch size, and a major dependence on the
purchase of off-farm inputs. Continued considerations will also include environmental quality
and human health issues (Bird & Ikerd, 1993).
12
Purpose of the Study
The primary purpose of this study was to determine if a relationship exists between the
self-esteem and academic achievement of students at the freshman level in the College of
Agriculture at a Research-Extensive University in the Southern Region of the United States.
More specifically, the study sought to accomplish the following objectives:
1. Describe the students at the freshman level in the College of Agriculture at a
Research-Extensive University in the Southern Region of the United States on the
following demographic characteristics:
a. Age;
b. Highest level of education completed by father;
c. Highest level of education completed by mother;
d. Marital status of parents;
e. Race;
f. Gender;
g. Place of residence during the first semester of college; and
h. Whether or not the student held membership in selected groups and organizations during the first semester of college.
2. Determine the self-esteem of students at the freshman level in the College of
Agriculture at a Research-Extensive University in the Southern Region of the United
States as measured by the Adult Form of the Coopersmith Inventory.
3. Describe students at the freshman level in the College of Agriculture at a Research-
Extensive University in the Southern Region of the United States on academic
achievement as measured by their first semester grade point averages.
13
4. Compare the self-esteem of students at the freshman level in the College of
Agriculture at a Research-Extensive University in the Southern Region of the United
States, as measured by the Adult Form of the Coopersmith Inventory, at the
beginning and the end of their first semester of college enrollment.
5. Determine if a relationship exists between academic achievement, as measured by
high school grade point average, and self-esteem, as measured by the Adult From of
the Coopersmith Inventory at the beginning of the first semester of college
enrollment, among students at the freshman level in the College of Agriculture at a
Research-Extensive University in the Southern Region of the United States.
6. Determine if a relationship exists between self-esteem, as measured by the Adult
Form of the Coopersmith Inventory, at the beginning of the first semester of college
enrollment, and academic achievement, as measured by the first semester of college
grade point average, among students at the freshman level in the College of
Agriculture at a Research-Extensive University in the Southern Region of the United
States.
7. Determine if a model exists explaining a significant portion of the variability in their
academic achievement, as measured by the first semester grade point average, among
students at the freshman level in the College of Agriculture at a Research-Extensive
University in the Southern Region of the United States from the following:
a. Self-esteem at the beginning of the semester;
b. Age;
c. Highest level of education completed by father;
d. Highest level of education completed by mother;

14
e. Marital status of parents;
f. Race;
g. Gender;
h. Place of residence during the first semester of college; and
i. Whether or not the student held membership in selected groups and organizations during the first semester of college.
8. Determine if a model exists explaining a significant portion of the variability in their
self-esteem, as measured by the Adult Form of the Coopersmith Inventory, at the end
of the first semester of college enrollment among students at the freshman level in the
College of Agriculture at a Research-Extensive University in the Southern Region of
the United States from the following:
a. Academic achievement as measured by overall high school grade point average;
b. Age;
c. Highest level of education completed by father;
d. Highest level of education completed by mother;
e. Marital status of parents;
f. Race;
g. Gender;
h. Place of residence during the first semester of college; and
i. Whether or not the student held membership in selected groups and organizations during the first semester of college.
15
CHAPTER 2
REVIEW OF RELATED LITERATURE
Introduction
The college years—they are a time of excitement, transition, and adjustment. It is
understood that at this point in history, there is increased necessity and for some more
opportunity to attain the goal of completing a degree from a college or university. The university
setting is now home to a more diverse group of young people. Authors have described the
present college generation. They have discussed students’ academic achievement, self-esteem,
parental involvement, and the services provided by university administrators, faculty, and staff.
This writer seeks to explore the literature involving these issues, beginning with a discussion of
academic achievement and its significance in one’s path toward the college years.
Academic Achievement
A discussion of this nature would begin with the understanding that the concept of
achievement is relative to the various environments or situations in which the individual
functions (Nicholls, 1984). Webster (1977) has defined achievement as “successful completion”
(p. 10) and as “a result brought about by resolve, persistence, or endeavor” (p. 10). Expanding
this definition, the present discussion will focus on academic achievement, with the definition of
academic according to Webster (1977) stated as that “of, relating to, or associated with an
academy or school especially of higher learning” (p. 6).
While the research of this writer will deal with the academic achievement of students in
their first semester of enrollment at the freshman level of college, the measurement of
achievement in the area of academia begins with the earliest experiences of formal education. At
the primary level there are concerns regarding developmental benchmarks and their effects on
16
academic performance. This continues from the primary to the secondary level as evidenced by
the implementation of accountability measures of such legislation as the No Child Left Behind
Act of 2001 (United States Department of Education, 2002).
Educators and those involved in educational research have offered definitions of the
measuring instruments used in assessing student achievement. Ary, Jacobs, and Razavieh (2002)
have written “A test is a set of stimuli presented to an individual in order to elicit responses on
the basis of which a numerical score can be assigned” (p. 216). They continue that “this score,
based on a representative sample of the individual’s behavior, indicates the extent to which the
subject has the characteristic being measured” (Ary et al., 2002, p. 216). Achievement tests are
used in school systems to “measure mastery and proficiency in different areas of knowledge by
presenting subjects with a standard set of questions involving completion of cognitive tasks (Ary
et al., 2002, p. 216). Achievement tests may also be classified as standardized tests.
Standardized tests are published tests. They are prepared by experts, cover broad academic
objectives, and have established validity and reliability. Directions are given for administering
the instrument as well as prescribed scoring (Ary et al., 2002). In addition, standardized tests
may further be classified as norm-referenced or criterion-referenced. Norm-referenced tests
permit the comparison of an individual’s performance on the test to that of other individuals.
The individual’s performance is “interpreted in terms of his or her relative position in a specified
reference group known as the normative group” (Ary et al., 2002, p. 218). As such performance
is reported in terms of percentiles and standard scores, as well as similar measures (Ary et al.,
2002).
Popham (2001) considered the appropriate uses of standardized achievement tests. One
important use is to give parents an idea about how their children’s performances compare to that

17
of a national comparison group. Thus, they provide a meaningful and comparative interpretation
which can be used by teacher and parent to work together for the student’s best interests
(Popham, 2001). In the same manner, Popham (2001) saw standardized tests of benefit to
teachers who can profit from identifying the comparative strengths and weakness of their
students. Due to the norm-referenced comparisons among students, Popham (2001) considered
standardized tests to be ideally suited for informing decisions in fixed-quota settings. In these
cases there may be more applicants than openings for special programs. He (Popham, 2001) also
considered standardized achievement tests useful assessment tools for determining the use of
supplemental resources. When it is determined that there has been low performance on
standardized achievement tests, the allocation of supplementary funds can benefit the low
performing students in these schools with the provision of additional instruction.
Popham (2001) also identified what he considers inappropriate uses of standardized
achievement tests, the first being the judgment of schools chiefly on the basis of students’ scores
on these tests. He also considered the evaluation of teachers and promotion or retention of
students due to tests scores inappropriate. Marchant (2004) echoed these concerns by
commenting that although testing was originally designed to provide information regarding
individual student achievement and diagnostic/prescriptive teaching efforts, these tests have
become more high stakes in nature in their use for the evaluation of the success of students,
teachers, schools, and school districts. He (Marchant, 2004) stressed the importance of the
investigation of how well the scores reflect the quality of learning and education. While some
comment it is unlikely in this high stakes era that accountability testing “will abate any time
soon” (Bennett & Gitomer, 2009, p. 45), others endorse the consideration that standardized

18
assessment should be accommodated within a contemporary learner-centered paradigm
(Gallagher, 2003).
Paramount to those students who aspire to college attendance post-high school, college
entrance exams (CEE) become the focus at the secondary level. Historically college entrance
testing concentrated on identifying the most academically able students for admission to
selective institutions of the nation (About ACT, 2009). One of the two best known CEEs, the
Scholastic Aptitude Test (SAT), now known as the Scholastic Assessment Test I (SAT I)
(Camara & Echternacht, 2000), was developed by the College Entrance Examination Board
(CEEB) and first administered June 23, 1926 (Lawrence, Rigol, Essen, & Jackson, 2003).
Consisting of nine subtests at its inception, the SAT has evolved into an instrument which
measures verbal and mathematical “reasoning” (Lawrence et al., 2003, p.1). The test has been
redesigned periodically, and since 1970 its developers have emphasized the development of
content that is balanced and appropriate for those of different cultural and educational
backgrounds (Lawrence, et, al., 2003). The American College Testing Program, Incorporated in
1959 designed the ACT Assessment (ACT). The ACT assesses high school students’ general
educational development along with their readiness for college or ability to complete college-
level work (The ACT, 2009). Providing information which is helpful to colleges during the
process of admitting students, it also helps students to make better decisions about which
colleges to attend and choices of programs of study (About ACT, 2009).
In high school, students may also become focused on cumulative grade point average if
there is the intention to further their education beyond the secondary level. The grade point
average serves as a criterion measure of the student’s overall academic performance, and is
considered a statistically significant predictor of future performance, academic achievement, and
19
success at the post secondary level of education (Merritt, 2008). Colleges and universities also
use grade point averages to determine applicants’ eligibility for admission. Merritt (2008)
cautioned, however, grade point averages are norm-referenced within schools and are relative
measurements which can vary in significance across schools, districts, and states. He concluded
that admissions officers realize college success is more than just grades. Involvement in
athletics, student government, arts programs, and volunteer activities may demonstrate that high
school students possess personal qualities which contribute to their engagement and success in
college (Merritt, 2008).
Self-Esteem Defined
In order to discuss self-esteem as it applies to academic achievement, it must first be
defined in general terms. Many have their own views regarding the term. To quote Fleming and
Courtney (1984), “it is not possible to address all topical issues in self-esteem research, because
the literature is quite vast” (p. 404). This writer agrees as the research literature has only
expanded to overwhelming proportions since that statement was written. Another author
(Branden, 1997) has stated that “of all the judgments we pass in life, none is more important than
the judgment we pass on ourselves” (p. 1). With these thoughts expressed, it is understandable
that not all issues of self-esteem research can be discussed in the present review of literature.
However, the present review will consist of related literature which will be divided into three
sections. The first section will include a discussion of the definitions of self-esteem. This will be
followed by a short discussion of the developmental aspects of self-esteem. It will culminate
with comments regarding the variable self-esteem, along with other demographic characteristics
related to the academic achievement of college students, with an emphasis on students at the
freshman level of college.
20
Philosophers of old along with earlier psychologists and sociologists have expressed their
thoughts regarding the self. William James (1890) analyzed subjective experience and what he
considered the significance of the self. Writing over 100 years ago, James in his definition of a
man’s self stated:
In its widest possible sense, a man’s Self is the sum of all that he CAN call his, not only his body and his psychic powers, but his clothes and his horses, his wife and children, his ancestors and friends, his reputation and works, his lands and horses, and yacht and bank account. All these things give him the same emotions. If they wax and prosper, he feels triumphant; if they dwindle and die away, he feels cast down—not necessarily in the same degree for each thing, but much the same way for all (James, 1890, p. 291-292). James (1890) added that it was difficult to draw a line between what a man called “me”
and what he simply called “mine” (p. 291). He (James, 1890) also concluded that human
aspirations and values had an essential role in determining whether individuals regard themselves
favorably. Achievements are measured against aspirations for any given area of behavior.
James (1890) proposed a formula, “Self-esteem=Success/Pretensions” (p. 310). Self-feeling is
determined by the ratio of actualities to supposed potentialities. The pretensions are the
denominator, and the numerator is success. If achievements approach or meet aspirations in a
valued area, the result is high self-esteem. If there is a wide divergence individuals regard
themselves poorly. He stressed that individuals determine those valued areas of particular
significance when measuring achievement against aspirations (James, 1890).
Sociologist G. H. Mead (1934) contributed to the topic of self-esteem, elaborating on
what James (1890) called the social self. Mead’s concern as a sociologist dealt with the process
by which an individual becomes a compatible and integrated member of his/her social group. He
concluded that this process involved the internalization of the ideas and attitudes expressed by
the key figures in the individual’s life (Mead, 1934). The individual observed the key figures’
21
actions and attitudes, adopting them and expressing them as his/her own. The adoption of the
ideas could take place unknowingly. Individuals come to respond to themselves and develop
self-attitudes that are consistent with those expressed by others in their world who are significant
to them. Mead (1934) believed individuals, regardless of their isolation or perceived
independence, carried within themselves the reflecting mirrors of their social group. It was
Mead’s (1934) belief that as children, individuals internalize the criteria employed by the
important people of their social world. They observe how they are regarded and value
themselves accordingly. In this manner from childhood into adulthood if individuals place high
value on themselves there have been key persons in their lives who have treated them with
concern and respect. Mead (1934) was also of the opinion that if individuals hold themselves
lowly, others of importance to them have treated them as inferior objects.
While the views of James and Mead concerning self-esteem were formulated relatively
early in the emergence of psychology and sociology, others have expanded on their constructs.
Coopersmith (1981) stated that self-esteem “refers to the evaluation which an individual makes
and customarily maintains with regard to himself” (p. 4-5). This evaluation expressed an attitude
of approval or disapproval, and indicates the extent to which the individual believes
himself/herself to be “capable, significant, successful, and worthy” (Coopersmith, 1981, p. 5).
Coopersmith (1981) stated “in short, self-esteem is a personal judgment of worthiness that is
expressed in the attitudes the individual holds toward himself” (p. 5). He (Coopersmith, 1981)
directed the reader to certain features of his definition, the first of which is the notation that his
definition centers upon a relatively enduring estimate of general self-esteem. This he contrasted
to more specific and transitory changes in evaluation. While general and transitory evaluations
deal with the level of individual self-appraisal, they differ in the generality and reliability of the
22
appraisals. They also differ in the conditions under which they are made (Coopersmith, 1981).
He (Coopersmith, 1981) suggested that at some time preceding middle childhood “the individual
arrives at a general appraisal of his worth, which remains relatively stable and enduring over a
period of several years” (p. 5). While this appraisal can presumably be affected by “specific
incidents and environmental changes” (Coopersmith, 1981, p. 5), it may revert to its customary
level as conditions return to their “normal” and typical course (Coopersmith, 1981, p. 5). Self-
esteem may also vary across different areas of experience, as well as according to sex, age, and
other role defining conditions (Coopersmith, 1981).
In line with the views of James (1890), Cooopersmith (1981) believed the over-all
appraisal of one’s abilities to be a consideration of the areas and conditions according to their
subjective importance. Thus, one would be enabled to arrive at a general level of self-esteem
(Coopersmith, 1981). A third consideration in Coopersmith’s definition of self-esteem is his
suggestion of the clarification of the term “self-evaluation” (Coopersmith, 1981). In his research
the term referred to “a judgmental process in which the individual examines his performance,
capacities, and attributes according to his personal standards and values, and arrives at a decision
of his own worthiness” (Coopersmith, 1981, p. 7). He considered attitudes toward the self to be
like other attitudes in carrying positive and negative affective connotations. He also considered
them to be intertwined with intellectual and motivational processes or to carry “affective
loadings and motivational consequences” (Coopersmith, 1981, p. 7). While the individual may
not be aware of his/her attitudes toward himself/herself, Coopersmith (1981) considered the
attitudes to be expressed in the individual’s “voice, posture, gestures, and performance” (p. 7).
Early on, Coopersmith (1959) understood studies of self-esteem were difficult to evaluate
due to the vagueness of the term itself and the fact that it was subject to manifold interpretations.
23
During the beginnings of his research he conducted studies to develop measures capable of
distinguishing between self-evaluation and the manner of behavioral expression of self-
evaluation. He developed and administered two instruments, the Self-Esteem Inventory (SEI)
and a Self-Esteem Behavior Rating Form (BRF) which he administered to 102 fifth- and sixth-
grade students who were attending the public schools in a small Eastern city. The students in the
age group 10-12 were chosen because the personality had been relatively well formed by that
time (Coopersmith, 1959). He also considered this to be an appropriate age as “the adolescent
turmoil noted in our society is not yet likely to have occurred” (Coopersmith, 1959, p. 88).
Coopersmith (1959) constructed the Self-Esteem Inventory on the basis of items selected from
the Rogers and Dymond scale (1954) and reworded it for use with children. The entire
instrument was presented to five psychologists who then sorted the items into one of two groups,
one representing high self-esteem and the other low self-esteem. The instrument was
administered to two fifth-and sixth-grade classes on a group basis by the researcher. The Self-
Esteem Behavior Rating Forms were given to teachers and the principal of the students involved
in the study with the request to rate each child on behaviors presumed to be related to self-esteem
according to a 14-item, five-point scale. The teacher and principal independently rated the
students and at no time collaborated on their ratings. Test-retest reliability was high for both
instruments (a = .88 for the Self-Esteem Inventory and a = .96 by one teacher of 28 children). In
the majority of the cases for the group of 10-12 year old students, there was substantial
agreement between self-evaluation and behavioral expressions. It was also found that
individuals who had more successful experiences were significantly higher in the evaluations
than those who had fewer successful experiences (Coopersmith, 1959). The study also gave
credence to the value of the combination of subjective and observer evaluations in order to gain
24
greater predictability in determining what combinations of self-esteem variables are most
pertinent to certain situations. Researchers who have followed (Branden, 1994; Crocker, 2002;
Fleming & Watts, 1980; Marsh & Shavelson, 1985; Shavelson, Hubner, & Stanton, 1976) have
referenced Coopersmith, some (Shavelson et al., 1976) critical of his instrumentation and others
(Branden, 1994) praising Coopersmith for his work and referring to The Antecedents of Self
Esteem as a “landmark study” (p. 172).
In his formal definition, Branden (1994) has written “self-esteem is the disposition to
experience oneself as competent to cope with the basic challenges of life and as worthy of
happiness” (p. 27). He considered the definition to be composed of two components, self-
efficacy and self-respect. Self-efficacy is related to coping with basic challenges of life, or the
confidence the individual has in the functioning of the mind, the ability to think, understand the
facts of reality, and make decisions (Branden, 1994). Self-respect is the individual’s belief that
he/she is worthy of happiness. Branden (1994) presented his definition as one that is not a
product of a particular cultural “value bias” (p. 21), for he believed there is no society on earth
and no society even conceivable where people of that society do not face the challenges of
fulfilling their needs.
Reasoner (2008) considered self-esteem to include cognitive, affective, and behavioral
elements, a consideration which is held in general agreement in both psychological and
sociological arenas. The term self-esteem is cognitive in that one consciously thinks about and
considers the discrepancy between one’s ideal self, which is the person one wishes to be, and the
perceived self, who accounts for the realistic appraisal of how one views himself/herself. The
affective element refers to the feelings and emotions experienced as the individual considers the
discrepancy. Such behaviors as assertiveness, resilience, decisiveness, and respect of others are
25
the manifestations of the behavioral dimension of the term self-esteem. Reasoner (2008) believed
these multiple dimensions make it difficult to define self-esteem. Yet, referring to Nathaniel
Branden’s (1994) definition of self-esteem, Reasoner (2008) considered worthiness the
psychological aspect of self-esteem and competence the sociological or behavioral aspect. In
addition, Reasoner (2008) viewed self-esteem as “a person’s overall judgment of himself or
herself pertaining to self-competence and self-worth based on reality” (p. 2).
Some authors (Katz, 1993; Reasoner, 2008) cautioned against the confusion over what is
meant by the term self-esteem, citing such confusion as a result of programs and strategies not
founded in sound research. They noted such strategies as heaping children with undeserved
praise that is not preceded by accomplishment. A need has been identified (Katz, 1993) to
distinguish between self-esteem and narcissism. Katz (1993) has referred to narcissism as an
“excessive preoccupation with the self” (p. 8) and considered it detrimental to the development
of an accurate sense of competence and self-worth. Young-Eisendrath (2008) wrote of the “self-
esteem trap” (p.30) which she believed has come about due to the idea of the “special self”
(p.32), resulting from well meaning parents and educators who believe praise, encouragement,
and advantages can be transformed to childhood happiness and success in adulthood. Some of
the most lasting results, however, have become “negative self-absorption, an undervaluing of
being ordinary, and difficulties with seeing ourselves accurately and compassionately” (Young-
Eisendrath, 2008, p.32). She (Young-Eisendrath, 2008) believed children today have become
preoccupied with their own needs before they have the opportunity to develop those skills that
accurately assess strengths and weaknesses and are included in the knowledge base for accurate
self-esteem.
26
Beane (1991) referenced the idea of self-esteem as it has become a “source of
considerable controversy and contention in the school context” (p. 30). He differentiated
between self-concept, which he believed to be the description of self, and self-esteem, which he
considered to be the evaluation of self. Beane (1991) added that “self-esteem” is not just a
psychological construct” (p.30). He considered it to have meaning for creating and
understanding “the philosophical and sociological themes that permeate our lives” (Beane, 1991,
p 30).
Wylie (1961) discussed the empirical literature in the area of “self-psychology” (p. 2)
until the time of her research. Major emphasis was given to studies which pertained to a
conscious self-concept, also referred to at the time as the phenomenal self. She noted the term
self-concept to be intertwined with those of self-satisfaction, self-acceptance, and self-esteem,
and overlapping in the literature. For clarity in her discussion self meant the subject’s “view of
his actual self or real self, i.e., his concept of himself as he actually is” (Wylie, 1961, p. 40-41).
Some of the terms mentioned by Wylie (1961) remain intertwined in the literature. Branden
(1994) contended “a self-concept contains or includes our level of self-esteem, but is more
global” (p. 15). Shavelson et al. (1976) challenged the definition of self-concept, considering
definitions of self-concept to be imprecise with variability from one study to the next, with
classification according to different conceptual dimensions. They identified seven features which
they consider to be critical to the construct definition. Shavelson et al. (1976) stated “self-
concept may be described as: organized, multifaceted, hierarchical, stable, developmental,
evaluative, differentiable” (p. 411). In their discussion of the evaluative component of the
construct, they commented that the individual does not only develop a description of self in a
particular situation or class of situations; but there is also an evaluation of self. This evaluative

27
dimension can vary according to the individual as well as different situations. According to
Shavelson et al. (1976), “the distinction between self-description and self-evaluation has not
been clarified conceptually or empirically” (p. 414). Thus, in the literature the terms self-
concept and self-esteem have been used interchangeably (Shavelson et al., 1976). Finally, the
dimensions of the definition of self-concept would culminate in a hierarchical model with
general self-concept at its apex. General self-concept would then be divided into two
components, those of academic self-concept and nonacademic concept. Academic self-concept
could be further divided into subject areas, followed by specific areas within a subject matter.
Nonacademic self-concept would be divided into social and physical self-concepts, which then
could be divided into more specific facets in a similar manner as could be the academic self-
concept (Shavelson et al. 1976). Two studies followed that of Shavelson et al. (1976), one by
Fleming and Watts (1980) in which data via factor analysis offered considerable support for a
multidimensional conception regarding the measure self-esteem. The second study by Fleming
and Courtney (1984) was also concerned with the validity and utility of the facet model. These
researchers preferred the use of the term self-esteem to self-concept. They considered issues
related to dimensionality and used the term “centrality hypothesis” (Fleming & Courtney, 1984,
p. 405). According to this hypothesis, when self-concept is to be measured, the assessment
should take into account those dimensions which are central to or valued by the person being
assessed. They also considered self-concept to include pure self-descriptions which they
determined to be distinguishable from self-esteem, because these descriptions do not necessarily
imply judgments (Fleming & Courtney, 1984).
McCauley and VanVelsor (2004) believed self-esteem can be defined in two ways,
globally and specifically. Global self-esteem is defined as “feeling good about oneself in
28
general” and specific self-esteem is defined as “feeling worthy in relation to a specific task or
category of tasks” (McCauley & VanVelsor, 2004, p. 215). Specific self-esteem was referred to
on some occasions by these authors as self-efficacy (McCauley & VanVelsor, 2004).
Crocker and Wolfe (2001) studied the contingencies of self-worth or the criteria upon
which one bases self-esteem. Some of the contingencies are internal, while some are external
and require continued validation. They (Crocker and Wolfe, 2001) contrasted the contingencies
to the typical average or trait levels of self-esteem.
For the purpose of the present discussion self-esteem will be defined according to that
referenced by Coopersmith (1981) as “the evaluation which an individual makes and customarily
maintains with regard to himself” (p. 4-5). As referenced earlier, Coopersmith (1981) has also
stated that “in short, self-esteem is a personal judgment of worthiness that is expressed in the
attitudes the individual holds toward himself” (p. 5). In the present discussion this personal
judgment will also be considered a part of the evaluation of the subjective experience the
individual conveys to others verbally and through other overt expressive behavior (Coopersmith,
1981).
Development of Self-Esteem in the Individual
Child’s Judgment of Self in the Home
Neuroscientists have sought to explore the differences in human behavior; and observing
elements of cognition and affect, they consider the development of self-awareness a progression
from infancy which continues throughout the lifespan. Schore (1994) has targeted the
orbitofrontal region in the cerebral cortex of the brain to be uniquely involved in social and
emotional behavior. He considered this area to underlie the emergent psychological affect
regulatory function. This comes about in the critical period of primary socialization of

29
infancy during months 10-12 to 16-18 (Schore, 1994). Associated with the early experiences in
the care-giving relationship, the infant’s biologically organized affect core becomes “biased with
tendencies toward certain emotional responses” (Schore, 1994, p. 415).
In consideration of the caregiving relationship, one can surmise that the child’s first
judgment of self is made at home where he/she is either nurtured by warm loving parents who
consistently convey their unconditional acceptance of the child, or where he/she is rejected by
cold, hostile, or disapproving parents (Coopersmith, 1981). While the accepting parent may
express disapproval of particular deeds the child may have performed or omitted, the parent’s
acceptance of the child himself is unconditional. On the other hand, lack of affection and
attitudes of disapproval and hostility may be expressed as either passive or active forms of
rejection. These passive and active forms of rejection express disinterest, disapproval, and
distaste for the child. Acceptance has an enhancing effect upon self-esteem while parental
rejection contributes to a diminished sense of self-worth (Coopersmith, 1981). One author has
stated that it is not what is said or thought by the parent, but what is communicated that has the
impact on the child (Stanley, 1986). Coopersmith (1981) continued the communication of the
parent’s interest in the child’s affairs has an enhancing effect on self-esteem. The child reacts to
parental treatment he/she has received, and it is possible for the child to view his/her parents as
accepting and approving even in the face of restrictions and demands. This perception is the
result of the parents’ consistent and well-disposed attitude of concern and love (Coopersmith,
1981).
Child’s Judgment of Self Outside of the Home
The interaction with parents expands as the child relates to others outside the family. The
development of self-esteem continues as the child enters school. His/her opinion of self may be
30
dependent upon the way in which the child interprets the teacher’s reaction to his/her
performance and the performance of his/her classmates (Crocker & Cheeseman, 1988). A study
was designed by Crocker and Cheeseman (1988) to extend the knowledge of children’s abilities
to assess the academic worth of self and others in the earliest years of schooling. A sample of
141 children ranging from five to seven years in age was asked to rank everyone in their classes
as better than self at school work and those who the child thought were not as good as self. The
study concluded that it appeared there was always a high degree of agreement between self,
peers, and teacher of the rank order of children in any particular classroom (Crocker &
Cheeseman, 1988).
A discussion of the child’s judgment of self outside the home should include the
comments of G. Stanley Hall who has been labeled by historians as the father of the scientific
study of adolescence (Santrock, 1987). G. Stanley Hall’s concept of adolescence was considered
the first systematic portrayal of that stage of life in the modern world (Ross, 1972). In his
discussion of G. Stanley Hall, Ross (1972) reminded the reader of Hall’s reference to the
adolescent period. Hall deemed it as one of “storm and stress” (1924, p. xiii), a description he
borrowed from Rousseau and other European writers. He characterized this period of
development as one full of contradictions and wide swings in mood and emotions. While Hall’s
research may have been crude by today’s standards, he believed systematic methods should be
developed to study adolescence. The transformation of his ideas of youth into a modern concept
of adolescence was affected by the social setting of the 1890’s in America, and his view held
implications for both socialization and education (Santrok, 1987). Others followed G. Stanley
Hall in their research regarding the period of adolescence. Klein (1992) investigated the
relationship between temperament and self-esteem among late adolescents. She identified five
31
temperament dimensions—activity, adaptability, attention/distractibility, rhythmicity, and
reactivity. Adaptability and attention/distractibility were highly correlated with self-esteem.
Reactivity also showed a significant correlation. The child who can adapt and change readily in
response to contextual demands will receive positive feedback and will be more likely to
correctly view self as competent and successful. Authors have addressed student apathy (Raffini,
1986), overachievement (Shoss, 1992), and group affiliation (Brown & Lohr, 1987) during the
adolescent years.
Parenting Styles
Studies have been conducted examining investments in work and parenting. In one such
study of young children, Greenberger and Goldberg (1989) analyzed data which suggested
employed mothers committed to both work and parenting may be particularly likely to conform
to an authoritative parenting style. Dornbusch, et al. (1987) related parenting styles to adolescent
academic achievement. At the time of their study they indicated family types to differ in values,
behaviors and standards that children are expected to adopt. They also differed in the ways these
standards were transmitted (Dornbusch et al., 1987). Following the typology of parenting styles
identified in the research of Baumrind (1971), they (Dornbusch et al., 1987) defined three family
parenting styles which they considered to have consequences for the development of cognitive
and social competence. The authoritarian pattern was described as “being high in demandedness
on the part of parents and low in parental responsiveness to the child” (Dornbusch et al., 1987, p.
1245). Permissive parents were tolerant and accepting of the impulses of the child. They used
as little punishment as possible, allowing considerable self-regulation by the child. Authoritative
parenting advocates an expectation of mature behavior from the child and clear setting of
standards by the parents. Rules and standards are firmly enforced, but the parent encourages the
32
child’s independence and individuality, and open communication exists between parent and
child. The research of Dornbusch et al. (1987) found authoritarian and permissive parenting
styles to be negatively associated with grades. Findings showed authoritative styles positively
associated with grades. The study considered gender, age, parent education, ethnic and family
structure categories. Families with higher parental education tended to be somewhat lower in
authoritarian and permissive parenting. They tended to be higher in authoritative parenting.
Single mothers showed a higher level of permissiveness than households containing both natural
parents. Step families tended to be more permissive and authoritarian when compared to
families with two natural parents. Across ethnic groups, authoritarian and permissive styles were
associated with lower grades and authoritative style with higher grades (Dornbusch et al., 1987).
Findings from other research studies reflected these parenting characteristics to persist into
college years (Strage & Brandt, 1999; Hickman, Bartholomae, & McKenry, 2000).
The College Years
Dornbusch (2002) reminded the reader that “some have defined adolescence as the
second decade of life, whereas others stress the period as one of preparation for adult roles”
(p. 173). He contended there is no fixed upper boundary for adolescence according to the second
perspective, and that this apprenticeship for adulthood may continue until the individual engages
in full-time work or marriage or parenthood which proclaims the end of the preparatory period
(Dornbusch, 2002). His comments are applicable to the understanding of development during
both adolescence and the early adult years. He considered it important to learn those
characteristics of the adolescent experience that affect later life functioning (Dornbusch, 2002).
He believed there are multiple ways to measure successful functioning in the later period of
adolescence, especially when students move on to the university setting. He indicated the
33
importance of the explanatory process of context on various aspects of adolescent functioning
(Dornbusch, 2002).
Arnett (2000) proposed a new theory of development with a focus on ages 18-25 which
he describes as emerging adulthood. Arnett (2000) considered this to be an altered nature of
development in the late teens and early twenties for young people in industrialized societies. He
associated it with changes having occurred over the past half century in which there are delays in
marriage and parenthood. He argued that this period of emerging adulthood is neither
adolescence nor young adulthood. He considered it to be empirically distinct from both of these
periods of life, and believed that emerging adulthood should be distinguished from young
adulthood because it has characteristics that are more dynamic, changeable, and fluid (Arnett,
2000). It is a time when the individual has left the dependency of adolescence and experiences
relative independence from social roles and normative expectations. It becomes a time of
identity exploration and involves trying various life possibilities, gradually moving toward
making enduring decisions (Arnett, 2000). This period of development coincides with college
attendance. A college education may be pursued in a nonlinear manner, often combined with
work, and in some cases punctuated by periods of nonattendance. Graduate school has
increasingly become the choice of those who graduate with a four-year degree (Arnett, 2000).
The Millennial Generation
In regard to the young people who transition from the secondary to the post secondary
educational environment, Howe and Strauss (2000) referred to those students most recently
enrolled in colleges and universities as the Millennials or members of the Millennial generation.
These individuals, born between the years 1982 and 2002, along with the Generation X students,
born between the years 1961 and 1981, represent most of the students enrolled in colleges and
34
universities at the present time. Howe and Strauss (2000) discussed some of the characteristics of
the Millennials. Some (Elam, et al., 2007) have even labeled them the next great generation,
stating they fill a “cultural void left by the departing G. I. generation” (p. 21), those individuals
born between 1901 and 1924, who are associated with World War II. These students are
described as hardworking. They have been socialized to be successful in life by supportive
parents, having been engaged in numerous academic and extracurricular activities. Their parents
remain supportive forces in their education at the post secondary level. To be considered is the
contrast of their support to the support of parents of college-bound students of previous
generations. The support provided by parents from previous generations was more emotional
and financial in nature, with the recognition that formal education marked the transition from
“youth to adolescence and on to adulthood” (Elam et al., 2007, p. 22). Parents of Millennials
take a more aggressive participatory role. Murray (1997) believed this aggressive participation
stems from patterns in the parental generation. He wrote that parents of Millennials generally
delayed parenthood until their late 20s when they considered themselves financially secure.
Taking their child-rearing responsibilities seriously, they exposed their children to immense
cultural and social experiences. They continued this active involvement during the school age
years, with critical appraisals of schools, teachers, curricula, and coaches. The emphasis on
academic achievement continued through secondary school (Murray, 1997). Parental
involvement of these individuals does not wane once students matriculate at a particular college
or university, and they often expect to be involved throughout their child’s undergraduate
education in some fashion (Elam et al., 2007). This has prompted some universities to develop
parent-oriented links to their campus Web sites, publish recruitment materials geared to parents’

35
concerns and issues, and open parental relations offices to accommodate the involved parents
(Elam et al., 2007).
Millennial students have been described by Strange (cited in Elam et al., 2007) as
“conventionally motivated and respectful” (p.23); “structured rule followers” (p. 23); “protected
and sheltered” (p. 23); “cooperative and team-oriented” (p. 23); “talented achievers” (p.23); and
“confident and optimistic about their futures” (p. 23). He (Strange cited in Elam et al., 2007)
considered these qualities to have implications for educators at all levels. Yet, caution is
recommended, for some researchers fear Millennials are over-reliant on communications
technology which has resulted in stunted interpersonal or “face-to-face” skills (Elam et al. 2007,
p. 22). Others caution that there are individual members of the millennial generation who have
not been afforded equal levels of financial, personal, and social support, and suggest that high
school counselors and college admission officers will have the continued challenge of
formulating strategies to alleviate social inequalities in secondary and post secondary settings
(Elam et al. 2007). Broido (2004) characterized this generation of college students according to
their racial and ethnic diversity. She (Broido, 2004) considered them to be “poised to be the
generation most able to transform how they, and the larger world, think about and act on these
issues” (p. 83) of diversity.
First-Generation College Students
A segment of the Millennial generation described by Terenzini, Springer, Yaeger,
Pascarella and Nora (1996) are those students who represent the first members of their families
to attend college or first-generation college students. In a study which involved 2,685 students
from 23 diverse institutions nationwide who entered college in the fall of 1992 and completed
one year of study, the researchers found first-generation students to differ from their traditional
36
peers in both entering characteristics and college experiences. The sample consisted of 825 first-
generation students and 1,860 traditional students. Findings indicated first-generation students
were more likely to come from low-income families and to have weaker cognitive skills in
reading, math, and critical thinking. They were more likely to be Hispanic, and to have lower
degree aspirations. These students also tended to have been less involved with peers and
teachers in high school. They reported receiving less encouragement from their parents
regarding college attendance, more often had dependent children, and expected to take
longer to complete their degree programs. They also worked more hours off-campus. The
researchers believed these differences to be indicative of a subgroup that is at risk and that
is expected to continue to grow both in number and proportion to the total undergraduate
population (Terenzini et al., 1996). The researchers viewed the differences in characteristics
and experiences to be indicative of the need for more administrative attention to assure first-
generation students are successful in college. The researchers pointed to limitations in the
study. The 23 colleges and universities involved in the study were not randomly selected,
and to an unknown degree may not have been representative of the national mix of colleges
and universities. Due to time constraints and work required of each respondent, there was
some self-selection. Attempts in the initial sampling design were made to yield a sample of
students which was representative of the national population of students who entered college
in the fall of 1992. Yet, the resulting self-selection led to the question of representativeness
due to possible differing responses of those willing to participate in the study and those who
declined the invitation to participate. The effect size had constraints regarding cognitive
gains of first-generation and traditional students. While the findings were at least suggestive
37
of the dynamics of college impact in these areas, they were considered lower-bound estimates
(Terenzini et al., 1996).
Variables Influencing Adjustment and Academic Achievement
Crocker (2002) has explored the costs of the pursuit of self-esteem, which she considered
to be a preoccupation in American society. She equated the pursuit with the two psychological
needs of competency and relatedness, and views the pursuit of self-esteem as more relevant than
the levels of self-esteem, whether high or low. In her research involving an ethnically diverse
sample of 642 college freshmen, Crocker (2002) sought to examine the possibility of
contingencies of self-esteem, some more fragile than others and requiring a more relentless
engagement in their pursuit. Describing the contingencies as the external contingencies of self-
worth and the internal contingencies of self-worth, Crocker (2002) observed the external
contingencies to require more effort on the part of certain individuals to prove they are
worthwhile.
Students were first contacted during the summer before their freshman year with the
request that they complete the Contingencies of Self-Worth scale (CSW-65) which was a 65-
item scale of a measure assessing seven contingencies of self-worth (Crocker, 2002). These
seven contingencies (Crocker, 2002) include: 1) academic competence—“I feel better about
myself when I know I’m doing well academically” (p. 601); 2) appearance—“my sense of self-
worth suffers when I think I don’t look good” (p. 601); 3) others’ approval—“I don’t care what
others think of me” (p. 601); 4) competition—“outdoing others in competition” (p. 610); 5) love
and support of family—“it is important to my self-worth to feel loved by my family” (p. 601); 6)
virtue—“my self-esteem depends on whether or not I follow my moral/ethical principles” (p.
601); and 7) religious faith—“I feel worthwhile when I have God’s love” (p. 601). Near the end
38
of both the first and second semesters of college, students were asked to report what campus
organizations they had joined and the length of time spent in participation in a variety of
activities, including “studying, volunteering, going to church or synagogue, partying, socializing,
exercising, shopping for clothes, and grooming” (Crocker, 2002, p. 603).
Appearance, competition, and others’ approval were considered to be the most external
and unreliable of the contingencies assessed by the CSW-65. These were considered the
contingencies to cause an individual to become more relentless in the pursuit of self-esteem.
While considered a more stable source of self-esteem, family support was also considered
external. Religious faith and virtue were the internal sources of self-esteem. Academic
competence was considered to be either external or internal (Crocker, 2002).
In the research of the present discussion, Crocker (2002) found academic competences to
be more strongly associated with external contingencies, especially competition. Findings also
revealed contingencies of self-worth predicted joining campus organizations. When the
researcher controlled for gender, ethnicity, parents’ income and level of self-esteem, she found
students who base their self-esteem on appearance were more likely to join fraternities and
sororities. However, students who based their self-esteem on virtue or outdoing others in
competition were less likely to join these organizations. In addition, students who based their
self-esteem on religious faith were more likely to join religious organizations. When the
researcher controlled for differences associated with the gender, ethnicity, and socioeconomic
status of students, their level of self-esteem had little or no effect on how much time the students
spent in participation in most activities during their first semester of college. However,
contingencies of self-worth prior to entering college were significant in predicting their first
semester activities. The researcher (Crocker, 2002) concluded there may be a reciprocal causal

39
relationship between contingencies of self-esteem and time spent on activities by students. Yet,
the effect of prior contingencies on later behavior was stronger and more reliable than the effect
of prior behavior on contingencies. The data made it “less plausible that students were simply
telling us a good story about themselves, because the reported activities in which they indicated
their time spent were consistent with their contingencies of self-worth” (Crocker, 2002, p. 604).
Crocker (2002) suggested an alternative response to the threats to self-esteem that would
be more likely to satisfy the fundamental human needs for competence and relatedness. This
response involved shifting one’s goals from self to others. She equated the shift with pursuing
goals that are larger than self and which involve creating, building, and giving.
Another consideration is the collective self-esteem of college students. While self-esteem
is related to self-worth (Coopersmith, 1981, Rosenberg, 1965), Crocker, Luhtanen, Blaine, and
Broadnax (1994) considered it to also be strongly related “to how individuals experience
themselves and their worlds” (p. 503). Noting the personal, individualistic aspects of self may be
more important sources of self-esteem for people of Western cultures, they were led to
investigate collective self-esteem among White, Black, and Asian college students. They called
upon Tajfel (1981) to define the social or collective self. According to social identity theory
Tajfel (1981) defined the term as “that aspect of an individual’s self-concept which derives from
his knowledge or membership in a social group (or groups) together with the value and
emotional significance attached to that membership” (p. 255). Crocker et al. (1994) viewed
social identity through the lens of social identity theory “as a function of how one privately
evaluates one’s groups, how one believes others evaluate those groups, and how identified one is
with those groups” (p. 504). They reasoned that if the collective is an important aspect of the
self, the evaluation of the collective aspects of the self along with the evaluation of one’s ethnic
40
identity should be related to one’s psychological well-being. This would apply especially for
those individuals who consider their collective or ethnic identity important to their self-concept
(Crocker et al., 1994). In their study the researchers collected data from 238 students enrolled in
a large northeastern university on the measures of collective self-esteem and psychological well-
being. The psychological well-being measures included personal self-esteem, depression, life
satisfaction, and hopelessness. Data were collected over three academic semesters, or an 18-
month period. Results from the study were thought to have implications for the relationship
between public and private aspects of collective self-esteem as well as the relationship between
collective self-esteem and psychological well being. The results for White students were
consistent with predictions based on Mead’s (1934) thought of reflected appraisals. Their
evaluations of their social groups were largely consistent with how they believed others
evaluated those groups. Yet, results indicated Black students separated how they privately felt
about their groups from how they believed others evaluated the groups. Results representing
responses of Asian students were consistent with Asian cultural influences, including the
interconnected nature of the self and the importance of feelings and evaluation of others, as well
as the importance of one’s public image (Markus & Kitayama, 1991). The researchers
considered the study to underscore the importance collective self-esteem plays in psychological
well-being which leads to adjustment (Crocker et al., 1994).
Bettencourt et al. (1999) further examined the benefits of collective self-esteem for
adjustment in the context of the school environment, specifically that of residing in campus
residence halls. Measurements of variables were taken at two points divided by a time interval of
six months. Variables measured were personal self-esteem, academic adjustment, and social
adjustment. The sample consisted of 213 students with a mean age of 18 years who were
41
entering first year, first semester students. Of the 213 students in the sample, 77% were White
and 19% were Black. In addition, 2% were Hispanic and 2% were Asian/Asian American.
Results of the analysis of data revealed collective self-esteem and personal self-esteem to be
somewhat correlated for both phases of data collection. In the second phase collective self-
esteem and personal self-esteem were moderately correlated with both the quality of
interpersonal relationships and the number of extracurricular activities of participants. Although
not the emphasis of the study, the results also showed the increase in personal self-esteem to be
associated with social and academic adjustment. An increase in personal self-esteem was not
associated with grade point average. Also positively associated with social adjustment were the
number of extracurricular activities and the index of high school achievement. In addition, the
amount of extracurricular activity was associated with academic adjustment. The index of high
school achievement was also associated with grade point average. According to the researchers
their findings suggested academic practitioners should recognize the capacity of group
memberships to positively influence adjustment in the college context. They called upon
practitioners who seek to improve students’ adjustment to college to take note of group
memberships that are consistent with students’ social and academic adjustment needs
(Bettencourt et al., 1999).
Pascarella and Terenzini (1980) conducted a study involving an Experimental Living-
Learning Residence (LLR). The LLR had a series of organizational and programmatic features
which were typically absent from conventional freshman residential halls. Architectural
renovations had provided for multiple study areas and office space for academic and personal
counseling. There were seven live-in academic staff members. One was a full time faculty
member and the others were teaching assistants. There was a series of 20 credit-bearing courses
42
taught in the LLR. Features also included a faculty lecture series on current topics, a series of
regularly scheduled informal discussion sections with faculty and staff, and regularly scheduled
informal meetings with visiting scholars on campus (Pascarella & Terenzini, 1980). In addition,
there were regularly scheduled informal meetings with university deans and administrators. The
students involved in these residential arrangements were from all classes with the intention of
blending social, cultural, and academic activities and to provide for direct involvement of
academic staff (Pascarella & Terenzini, 1980). Results confirmed that a set of relationships
between students and faculty, as well as students and peers, was facilitated which differed from
those promoted in conventional residence halls. Results also confirmed the expectation that the
LLR would positively influence a range of freshmen outcomes. Of significance was the positive
association of the exposure to the LLR with freshman year persistence in contrast to voluntary
withdrawal from the university. The researchers considered the most important conceptual
finding to be that of the extent to which the environmental influence of the residence
arrangement was mediated by the quality and impact of interpersonal relationships with faculty
and peers (Pascarella & Terenzini, 1980).
In line with the studies of Bettencourt et al. (1999) and Pascarella and Terenzini (1980),
Pittman and Richmond (2007) addressed the topic of school belonging and the continuation of
the importance of the school context as late adolescents attend college. Pittman and Richmond
(2007) referred to school belonging as “connectedness to one’s school or perceived school
membership” (p. 271). This goes beyond identification with one’s school to include an
individual’s perceptions of fitting in and belonging with others at the same institution (Pittman &
Richmond, 2007). They suggested this factor may be even more important to the first-generation
college student. These researchers focused on the second semester of the freshman year in
43
college. The students reported on their current sense of belonging in the university setting as well
as retrospectively on their sense of school belonging in high school (Pittman & Richmond,
2007). The participants in the study included 266 late adolescents (18-19 years of age), who
were enrolled at a regional state university. Regarding the educational levels of their parents,
46% of the students had a parent with a college degree. Thirty-one percent of the students had a
parent who had attended college but had no degree, and 23% of the students had no parent that
had attended college. The students were considered to be diverse in ethnicity, with 60% of the
students reporting they were European American, 22% African American, 10% Hispanic
American, and 8% reporting they were Asian American (Pittman & Richmond, 2007). The
researchers found an association between university belonging and student outcomes to be
positive regarding academic performance, the feeling of more scholastic competence, and higher
self-worth, even with variations in the quality of the students’ relationships with family and
friends. In addition, retrospective reports of school belonging in high school were an important
predictor of most of the outcomes of these students. Parental education did not moderate the
relationship between university belonging and college adjustment for these students. Yet,
findings did indicate high school belonging was a more protective factor in predicting adjustment
to college among students whose parents had attended but not graduated from college. These
researchers suggest longitudinal studies to explore how earlier and current sense of school
belonging are linked to both academic and psychological development over time. They (Pittman
& Richard, 2007) saw freshmen orientation and residence hall programs designed and
implemented to target this construct worthy of testing for their effects on students’ adjustment
over the first year of college.
44
The perceptions of freshmen students regarding their first-semester experiences have
been examined at a major land-grant institution. The authors of this research (Thompson, Orr,
Thompson, & Grover, 2007) considered a profile of the student population at the freshman level
to be distinctive to any university and also to the schools and colleges within that institution.
They contended institutions must become familiar with the perceptions of students concerning
their early campus experiences. They surveyed 220 students who represented five of the six
schools and colleges on campus during the fall regarding six factors—“goal setting, campus
resources, stress, relationships, racial sensitivity, and belonging/identity” (Thompson et al., 2007,
p. 643). According to study findings, the majority of freshmen surveyed were living on campus.
Those students living on campus in Greek houses or residence halls, along with those stimulated
by their courses and satisfied with their experience at the university indicated a greater sense of
belonging. The researchers also found students from families of lower socioeconomic status to
more likely be the first in their family to attend college without reliance upon parental
knowledge regarding the social or academic aspects of college life. These researchers consider
understanding the freshmen population to be crucial, and called upon colleges and universities to
expand advising services to include mentoring of freshman-sophomore students. They also
called for mandatory mentoring for those determined to be at risk of leaving the college or
university (Thompson et al., 2007).
Students at the Freshman Level in Colleges of Agriculture
Regarding freshmen populations, Ball et al. (2001) addressed the issue of academic
performance of freshmen students in colleges of agriculture. They were specifically concerned
with the concept of the influence of participation in a learning community referred to as a
Freshman Interest Group (FIG) as it relates to academic performance of freshmen students in

45
colleges of agriculture. They were also interested in studying the influence of involvement in the
agricultural youth organizations of 4-H and FFA on academic performance and retention of
freshmen in the college of agriculture at the university involved in their research. The target
population for the study was freshmen entering the college of agriculture of the university in the
fall semesters of 1997 and 1998. They defined the accessible sample as intact groups of
freshmen enrolled in a college learning and development course during those semesters. A
Freshman Interest Group (FIG) consisted of approximately 20 students living in the same
residence hall. Involvement also included concurrent enrollment in at least three courses and a
weekly proseminar. Each weekly proseminar was led by a junior or senior student who served as
a peer advisor. The researchers determined participation in agricultural youth organizations to be
that of enrollment at the secondary level in either 4-H and/or FFA. The cumulative grade point
average of students was found to be significantly influenced by involvement in agricultural youth
organizations, while participation in Freshmen Interest Groups (FIG) was not shown to be a
significant variable influencing students’ academic performance. In addition, participation in
agricultural youth organizations was found to have a significant association with retention for the
sophomore year, while there was no such association with participation in Freshmen Interest
Groups (FIG) (Ball et al., 2001).
Granton, Ball, and Dyer (2002) considered data to be lacking which would describe the
relationship between university admission criteria and learning styles to the academic
performance of students in colleges of agriculture. They also investigated admission criteria of
ACT examinations, high school core grade point average, and class rank as predictors of
academic performance. They found learning styles to have no value in predicting academic
performance in the first year of enrollment in the college of agriculture. Results also indicated
46
the only successful predictor of the first year cumulative grade point average to be the traditional
university admission variable of core high school grade point average (Granton et al., 2002).
In a study conducted at The Ohio State University, researchers (Raven & Barrick, 1992)
sought to describe new first quarter freshmen (NFQF) entering the College of Agriculture in the
autumn semesters from 1982 to 1988, according to their rural, semi-rural, suburban, and urban
background. This longitudinal study spanned a period of time at The Ohio State University
before and after the implementation of a new admission policy of conditional /unconditional
admission contingent upon the completion of a core of college preparatory courses for entering
freshmen. The researchers (Raven & Barrick, 1992) also sought to determine any differences in
the academic background characteristics of the students within the categories of school location.
Findings revealed enrollment in the College of Agriculture was no longer dominated by students
from rural backgrounds, with a balanced composition of rural, semi-rural, suburban, and urban
NFQF. Results also indicated that the academic ability indicators ACT scores and class rank
increased from 1982 to 1986 for NFQF in the College of Agriculture. From 1984 to 1986 urban
NFQF exhibited higher measures of academic ability. They were also more likely to be admitted
unconditionally as compared to suburban, semi-rural, and rural students. However, in 1987 and
1988 there were fewer differences in the academic preparation and ability of students from rural,
semirural, suburban, and urban locations. While the percentage of NFQF who took vocational
agriculture for more than two years remained relatively constant, there was a steady decline in
the mean number of units of vocational agriculture taken by all types of students. From 1982 to
1988 there was an increase in the percentage of NFQF in the highest quartile of their high school
graduating classes (from 52% in 1982 to 65% in 1988). The ACT scores of NFQF also increased
from 1982 to 1988, with the mean score 20.6 in 1982 increasing to 22.3 in 1988. The
47
researchers (Raven & Barrick, 1992) considered the mean number of units of vocational
agriculture taken by NFQF to likely continue to decline as additional academic requirements are
placed on entering freshmen. They recommended that Ohio develop agricultural classes that can
satisfy admission requirements, with prime areas of study in the natural sciences and social
sciences a means of implementing such courses.
In another study of first term freshmen Son (1975) conducted research in order to
determine selected variables or a combination of variables which best predicted the first-term
grade point average (GPA) of students enrolled in the College of Agriculture at the University of
Missouri—Columbia. The sample of his study consisted of 322 entering freshmen, 172 of which
were from small schools and 81 from large high schools. Sixty-eight of the students were female
and 254 were male. Predictor variables included gender, high school size, type of high school
curriculum, high school rank, and scores of the Missouri Mathematics Placement Test (MMPT),
Missouri College English Test (MCET), School and College Ability Test-Quantitative (SCAT-
Q), and School and College Ability Test-Total (SCAT-T) (Son, 1975). Results of the analysis of
data indicated the composite set of SCAT-Total, MCET, MMPT and high school rank to be the
best combination in predicting the first-term grade point averages of freshman students in the
College of Agriculture. Results also indicated no significant differences in first-semester grade
point average, high school rank, and scores on freshman placement tests among students from
small, medium, and large high schools (Son, 1975). His findings also revealed vocational
agriculture students to perform academically as well as non-vocational agriculture students in the
College of Agriculture, with female students having higher high school rank and better
performance on the MCET than their male counterparts. One of his recommendations was a
replication of his study with the addition of more “non-intellective” (Son, 1975, p.179) predictor
48
variables such as “motivation, personality, study habits, social economic status….” (Son, 1975,
p. 179) in order for the accuracy and efficiency of the prediction of academic achievement to be
improved.
Dyer, Breja, and Andreasen (1999) conducted a study to assess the attitudes and
intentions of freshman students in the College of Agriculture at Iowa State University regarding
high school and university agriculture programs and the field of agriculture. Included in the
study was the investigation of student attitudes regarding the role of agricultural educators. A
descriptive survey was administered to 513 freshman students in the 1996-97 class of the College
of Agriculture. A majority of the student respondents were Caucasian (97%) and male (57%).
Almost half of the respondents (47.5%) were from farm backgrounds, with an additional 28.8%
of the students from rural areas which were not classified as farms or small towns of less than
10,000. The remaining 23.7% of the students indicated their geographical backgrounds to be
large or medium sized urban areas. Results indicated the attitudes of the respondents toward the
field of agriculture to be generally positive, viewing the field of agriculture as both scientific and
technical (Dyer et al., 1999). Generally, respondents indicated they believed everyone would
benefit from college courses in agriculture, with 76.1% of the students disagreeing that
agriculture courses in college were better suited to male students. Regarding their high school
agriculture program experiences, a majority of the College of Agriculture freshmen (54%)
reported course work in high school agriculture. Of the respondents 182 students (46%)
indicated they had no high school agricultural courses. Ninety-seven percent of the students
from high school agriculture programs indicated the intention to graduate from the College of
Agriculture and to enter an agricultural career. Of the students indicating they had not enrolled
in high school agriculture programs, 90.5% reported they planned to graduate from the College
49
of Agriculture. The researchers (Dyer et al., 1999) interpreted their findings to imply high
school agriculture programs are good investments by colleges of agriculture as well as those
interested in promoting agriculture. They commented many secondary students in Iowa did not
have the opportunity to enroll in high school agriculture programs, with 68% of the respondents
indicating they did not have access to such a program. Following as the second most cited reason
was the conflict with college preparatory courses. Dyer et al. (1999) recommended an increase
in the number of high school agriculture programs in the state as well as minimizing scheduling
conflicts. Additionally, 20% of students indicated their agriculture teacher to be the most
influential source in their decision to pursue a college degree. This would imply the importance
of a nurturing relationship between colleges of agriculture and agriculture teachers in order to
generate more effective recruitment efforts (Dyer et al., 1999).
Summary of the Review of Literature
The present review of related literature has led from the discussion of academic
achievement, with its beginning at the primary level and continuation through the college
experience. Educators have offered definitions of the measures of student achievement and their
concerns regarding developmental benchmarks, as well as the high risks nature of the use of
standardized tests (Marchant, 2004).
A discussion of the self-esteem movement ensued with an emphasis on the many
attempts to define self-esteem. Some researchers have even expressed what self-esteem does not
mean. Generally, there is the view that it is multifaceted. In building upon previous definitions
there is agreement that it does deal with one’s judgment of self and one’s worthiness
(Coopersmith, 1981).
50
The construct of self-esteem has affective roots in the early development of the individual
(Schore, 1994) indicated by the infant’s biologically organized affect core and its involvement in
the formation of certain emotional responses within the individual. Through the developmental
tasks of the formative years and the emerging years in elementary and secondary school, self-
esteem becomes an influencing factor in the child’s well-being. It is counted among those
variables which influence adjustment and achievement as the individual approaches the
transition to late adolescence and young adulthood.
The present discussion has also included those factors of parental involvement in the life
of the late adolescent as he/she enters the years of postsecondary education. Parenting styles in
early and late adolescence have been indicated. The diversity of the Millennial generation now
in the college setting has been a topic of discussion, along with the subgroup of first-generation
college students. Studies regarding residential living arrangements, along with identity and
belonging issues have been reviewed. With a focus on the student during the first year of
college, the review of literature continued with that of the adjustment and academic achievement
of the student at the freshman level in colleges of agriculture.
Finally, there is the consensus of researchers regarding the importance of the student’s
experiences during the first year of college. They consider attention to these variables to be
crucial to university administrators, faculty, admissions officers, and support services personnel
as they consider the provision of the best educational experience for the students once they have
enrolled at an institution of higher learning (Thompson et al., 2007).
51
CHAPTER 3
METHODOLOGY
Purpose of Study
The primary purpose of this study was to determine if a relationship existed between self-
esteem and academic achievement among students at the freshman level in the College of
Agriculture at a Research-Extensive University in the Southern Region of the United States.
Dependent Variable
The primary dependent variable in the study was academic achievement of students at the
freshman level in the College of Agriculture at a Research-Extensive University in the Southern
Region of the United States.
Specific Objectives
The following specific objectives were formulated to guide the research study:
1. Describe students at the freshman level in the College of Agriculture at a Research-
Extensive University in the Southern Region of the United States on the following
demographic characteristics:
a. Age;
b. Highest level of education completed by father;
c. Highest level of education completed by mother;
d. Marital status of parents;
e. Race;
f. Gender;
g. Place of residence during the first semester of college; and
52
h. Whether or not the student held membership in selected groups and organizations during the first semester of college.
2. Determine the self-esteem of students at the freshman level in the College of
Agriculture at a Research-Extensive University in the Southern Region of the United
States as measured by the Adult Form of the Coopersmith Inventory.
3. Describe students at the freshman level in the College of Agriculture at a Research-
Extensive University in the Southern Region of the United States on academic
achievement as measured by their first semester grade point averages.
4. Compare the self-esteem of students at the freshman level in the College of
Agriculture at a Research-Extensive University in the Southern Region of the United
States, as measured by the Adult Form of the Coopersmith Inventory, at the
beginning and the end of their first semester of college enrollment.
5. Determine if a relationship exists between academic achievement, as measured by
high school grade point average, and self-esteem, as measured by the Adult Form of
the Coopersmith Inventory at the beginning of the first semester of college
enrollment, among students at the freshman level in the College of Agriculture at a
Research-Extensive University in the Southern Region of the United States.
6. Determine if a relationship exists between self-esteem, as measured by the Adult
Form of the Coopersmith Inventory, at the beginning of the first semester of college
enrollment, and academic achievement, as measured by the first semester of college
grade point average, among students at the freshman level in the College of
Agriculture at a Research-Extensive University in the Southern Region of the United
States.
53
7. Determine if a model exists explaining a significant portion of the variability in their
academic achievement, as measured by the first semester grade point average, among
students at the freshman level in the College of Agriculture at a Research-Extensive
University from the following:
a. Self-esteem at the beginning of the semester;
b. Age;
c. Highest level of education completed by father;
d. Highest level of education completed by mother;
e. Marital status of parents;
f. Race;
g. Gender;
h. Place of residence during the first semester of college; and
i. Whether or not the student held membership in selected groups and organizations during the first semester of college.
8. Determine if a model exists explaining a significant portion of the variability in their
self-esteem, as measured by the Adult Form of the Coopersmith Inventory, at the end
of the first semester of college enrollment of students at the freshman level in the
College of Agriculture at a Research-Extensive University in the Southern Region of
the United States from the following:
a. Academic achievement as measured by overall high school grade point average;
b. Age;
c. Highest level of education completed by father;
d. Highest level of education completed by mother;
54
e. Marital status of parents;
f. Race;
g. Gender;
h. Place of residence during the first semester of college; and
i. Whether or not the student held membership in selected groups and organizations during the first semester of college.
Population and Sample
The target population for the study was defined as all students at the freshman level at a
Research-Extensive University in the Southern Region of the United States. The students at the
freshman level were defined by the researcher as those students in their first semester of college
enrollment. The accessible population was defined by the researcher as all students at one
selected Research-Extensive University in the Southern Region of the United States enrolled in
the Introduction to Agriculture course which was a requirement for agriculture students at the
freshman level. The sample was defined as 100% of the accessible population.
Instrumentation
A non-clinical consent form was completed by each student prior to the completion of the
three instruments which were used for data collection. The first instrument was the Adult Form
of the Coopersmith Inventory used for individuals over 15 years of age. This form consists of 25
items or statements to which the student responds “like me” or “unlike me” (Coopersmith, 1987,
p. 7). The statements are related to one’s attitude about self and are indicative of high self-esteem
or low self-esteem. The measures of self-esteem have been based on a general theory of self-
esteem and its relationship to academic performance (Mental Measurements Yearbook, 2007).
Cronbach’s alpha reliabilities of this instrument for age groups 16-19 and 20-34 are a = .80 and a
= .81 respectively (Coopersmith, 1989). The construct validity of the Coopersmith Inventory
55
was examined by Johnson, Redfield, Miller, and Simpson (1983) using the 50 item School Form
from which the Adult Form was adapted. The School Form consists of five subscales: an eight-
item lie scale designed as a provision of a measure of defensiveness; and, four subscales
designed to assess perceptions of parents (home-parents), school (school-academic), peers (social
self-peers), and self (general self). Johnson et al. (1983) considered their study to provide
evidence to support the construct validity of the Coopersmith Inventory in the five areas
identified. Cronbach’s alpha for the total test was a = .86 (Johnson et al., 1983).
The second instrument was a researcher-designed questionnaire used to collect
demographic information including age, gender, educational level of father, educational level of
mother, marital status of parents, mother’s work outside of the home during the student’s years
in elementary school, place of residence during the first semester of college, and group
affiliation. Demographic data were included in the survey as considered relevant to the study
based on the review of literature.
The third instrument was a recording form on which data from the Office of the
University Registrar were downloaded and stored. Specific demographic and academic variables
were selected from the review of literature in accordance with the research objectives of the
study. There was no individual identifying information included in the downloaded data in order
to assure complete confidentiality of research subjects.
Data Collection
Initially, the researcher met with the Dean of the College of Agriculture of the selected
Research-Extensive University to request permission to conduct the study using College of
Agriculture students. The Associate Dean of the College of Agriculture of the selected
Research-Extensive University was also in attendance at the meeting. The purpose of the study
56
and the nature of the questionnaires to be used were discussed at the meeting. Permission and
approval to conduct the study were obtained from the Institutional Review Board (IRB) of the
selected institution. The professor for the Introduction to Agriculture course was contacted in
advance of the administration of the instruments in order to determine the dates at the beginning
and at the end of the semester on which data would be collected. Instructions which were given
to students at the time of the administration of the instruments included the comment that all
information provided would be held in the strictest of confidence, and that all forms would be in
the researcher’s possession only and stored in a secure place.
Data Analysis
The data analysis was organized by the individual research objectives. The first objective
of the study was to describe students at the freshman level in the College of Agriculture at a
Research-Extensive University in the Southern Region of the United States on the following
demographic characteristics:
a. Age;
b. Highest level of education completed by father;
c. Highest level of education completed by mother;
d. Marital status of parents;
e. Race;
f. Gender;
g. Place of residence during the first semester of college; and
h. Whether or not the student held membership in selected groups and organizations during the first semester of college.
57
This objective was descriptive in nature and thus, was analyzed using descriptive
statistics. Frequencies and percentages were used for the variables that were measured on a
categorical scale (nominal or ordinal). The specific categorical variables were:
a. Age;
b. Highest level of education completed by father;
c. Highest level of education completed by mother;
d. Marital status of parents;
e. Race;
f. Gender;
g. Place of residence during the first semester of college; and
h. Whether or not the student held membership in selected groups and organizations during the first semester of college.
The second objective of the study was to determine the self-esteem of students at the
freshman level in the College of Agriculture at a Research-Extensive University in the Southern
Region of the United States as measured by the Adult Form of the Coopersmith Inventory. This
objective was descriptive in nature and was analyzed using descriptive statistics. The variable
self-esteem was measured on an interval scale. Data regarding this objective were summarized
using means and standard deviations.
The third objective of the study was to describe students at the freshman level in the
College of Agriculture at a Research-Extensive University in the Southern Region of the United
States on academic achievement as measured by their first semester grade point averages. The
objective was descriptive in nature and was analyzed using descriptive statistics. Grade point
average was measured on an interval scale. Therefore, data regarding this variable were
summarized using means and standard deviations.
58
The fourth objective of the study was to compare the self-esteem of students at the
freshman level in the College of Agriculture at a Research-Extensive University in the Southern
Region of the United States, as measured by the Adult Form of the Coopersmith Inventory, at the
beginning and at the end of their first semester of college enrollment. To accomplish this
objective the paired t test procedure was used to analyze the data. The variable self-esteem was
measured on an interval scale of measurement. Therefore, the paired t test procedure was used to
compare the self-esteem scores of students at the freshman level at the beginning of their first
semester to their scores at the end of the first semester of college enrollment. An á priori
significance level of < .05 was used to determine if the independent variables were significant.
The fifth objective of the study was to determine if a relationship existed between
academic achievement, as measured by high school grade point average, and self-esteem, as
measured by the Adult Form of the Coopersmtih Inventory at the beginning of the first semester
of college enrollment, among students at the freshman level in the College of Agriculture at a
Research-Extensive University in the Southern Region of the United States. The scores for the
measurement of the variables self-esteem and academic achievement were measured on an
interval scale of measurement. Pearson Product Moment Correlation Coefficients were
calculated between the students’ scores on the Adult Form of the Coopersmith Inventory and the
students’ grade point averages. The interpretations of these correlation coefficients were made
using the Davis’ descriptors of the degree of association (Davis, 1971). The descriptors include:
r = .01 - .09 negligible association
r = .10 - .29 low association
r = .30 - .49 moderate association
59
r = .50 - .69 substantial association
r > .70 strong association
The sixth objective of the study was to determine if a relationship existed between self-
esteem, as measured by the Adult Form of the Coopersmith Inventory, at the beginning of the
first semester of college enrollment, and academic achievement, as measured by the first
semester of college grade point average, among students at the freshman level in the College of
Agriculture at a Research-Extensive University in the Southern Region of the United States. The
scores for the measurement of the variables academic achievement and grade point average were
measured on an interval scale of measurement. Since both variables were interval, a Pearson
Product Moment Correlation Coefficient was calculated to determine if a relationship existed
between the first semester of college grade point average and the students’ self-esteem scores on
the Adult Form of the Coopersmith Inventory. The interpretations of these correlation
coefficients were made using the Davis’ descriptors of the degree of association (Davis, 1971).
The seventh objective of the study was to determine if a model existed explaining a
significant portion of the variability in their academic achievement, as measured by the first
semester grade point average, among students at the freshman level in the College of Agriculture
at a Research-Extensive University in the Southern Region of the United States from the
following:
a. Self-esteem at the beginning of the semester;
b. Age;
c. Highest level of education completed by father;
d. Highest level of education completed by mother;
60
e. Marital status of parents;
f. Race;
g. Gender;
h. Place of residence during the first semester of college; and
i. Whether or not the student held membership in selected groups and organizations during the first semester of college.
The researcher used multiple regression analysis to accomplish this objective. “The
objective of multiple regression analysis is to use the independent variables whose values are
known to predict the single dependent variable selected by the researcher” (Hair, Anderson,
Tatham, & Black, 1998, p. 149). The applications of multiple regression analysis fall into two
broad classes of research problems, that of prediction and explanation. The dependent variable
was a continuous variable measured on an interval scale of measurement. The independent
variables were measured on an interval scale or as dichotomous variables.
Because the study was exploratory in nature, the stepwise method of variable entry into
the regression analysis was used. The researcher examined the correlation matrix of the
independent variables to assess for collinearity. The tolerance value and the variance inflation
factor (VIF) were also examined. The first variable selected for entry was the one with the
highest bivariate correlation with the dependent variable. After the first variable was entered, the
remaining variables were examined for relationship with the dependent variable with the
influence of the first variable removed. The independent variables and their coding for the
analysis were as follows:
a. Self-esteem at the beginning of the semester-- measured as a continuous variable on an interval scale;
b. Age -- measured as a continuous variable on an interval scale;

61
c. Highest level of education completed by father—measured as categorical variables;
d. Highest level of education completed by mother—measured as categorical variables;
e. Marital status of parents—measured as categorical variables;
f. Race---measured as categorical variables;
g. Gender—measured as categorical variables;
h. Place of residence during the first semester of college—measured as categorical variables; and
i. Whether or not the student held membership in selected groups and organizations during the first semester of college---measured as categorical variables.
The researcher created dichotomies from each of the measured categories.
The eighth objective of the study was to determine if a model existed explaining a
significant portion of the variability in their self-esteem, as measured by the Adult Form of the
Coopersmith Inventory, at the end of the first semester of college enrollment among students at
the freshman level in the College of Agriculture at a Research-Extensive University in the
Southern Region of the United States from the following:
a. Academic achievement, as measured by high school grade point average;
b. Age;
c. Highest level of education completed by father;
d. Highest level of education completed by mother;
e. Marital status of parents;
f. Race;
g. Gender;
h. Place of residence during the first semester of college; and
i. Whether or not the student held membership in selected groups and organizations during the first semester of college.
62
Again, the researcher created dichotomies from each of the measured categories. As with
objective seven, the researcher used multiple regression analysis to accomplish this objective.
The dependent variable was a continuous variable measured on an interval scale of measurement.
The independent variables were measured on the interval scale of measurement or as
dichotomous variables. The stepwise method of variable entry into the regression analysis was
used. The researcher examined the correlation matrix of the independent variables to assess for
collinearity. The tolerance value and the variance inflation factor (VIF) were examined. The
first variable selected for entry was the one with the highest bivariate correlation with the
dependent variable. After the first variable was entered, the remaining variables were examined
for relationship with the dependent variable with the influence of the first variable removed. The
independent variables and their coding for the analysis were as follows:
a. Academic achievement—measured as a continuous variable on an interval scale;
b. Age—measured as a continuous variable on an interval scale;
c. Highest level of education completed by father—measured as categorical variables;
d. Highest level of education completed by mother—measured as categorical variables;
e. Marital status of parents—measured as categorical variables;
f. Race—measured as categorical variables;
g. Gender—measured as categorical variables;
h. Place of residence during the first semester of college---measured as categorical variables; and
i. Whether or not the student held membership in selected groups and organizations during the first semester of college—measured as categorical variables.
63
CHAPTER 4
FINDINGS
The primary purpose of this study was to determine if a relationship existed between the
self-esteem and academic achievement of students at the freshman level in the College of
Agriculture at a Research-Extensive University in the Southern Region of the United States.
The dependent variable in the study was academic achievement of students at the freshman level
in the College of Agriculture at a Research-Extensive University in the Southern Region of the
United States. Three data collection points/sources were used for the collection of data. At the
pretest measurement data were collected from 188 subjects. At the posttest measurement data
were collected from 163 subjects. Archived data existed for 218 subjects.
This chapter presents the results of the study by objective.
Objective One
The first objective of the study was to describe the students at the freshman level in the
College of Agriculture at a Research-Extensive University in the Southern Region of the United
States on selected demographic characteristics. This information was collected at the time of the
pretest measurement at the beginning of the course. The students were described on the
following demographic characteristics:
a. Age;
b. Highest level of education completed by father;
c. Highest level of education completed by mother;
d. Marital status of parents;
e. Race;
f. Gender;
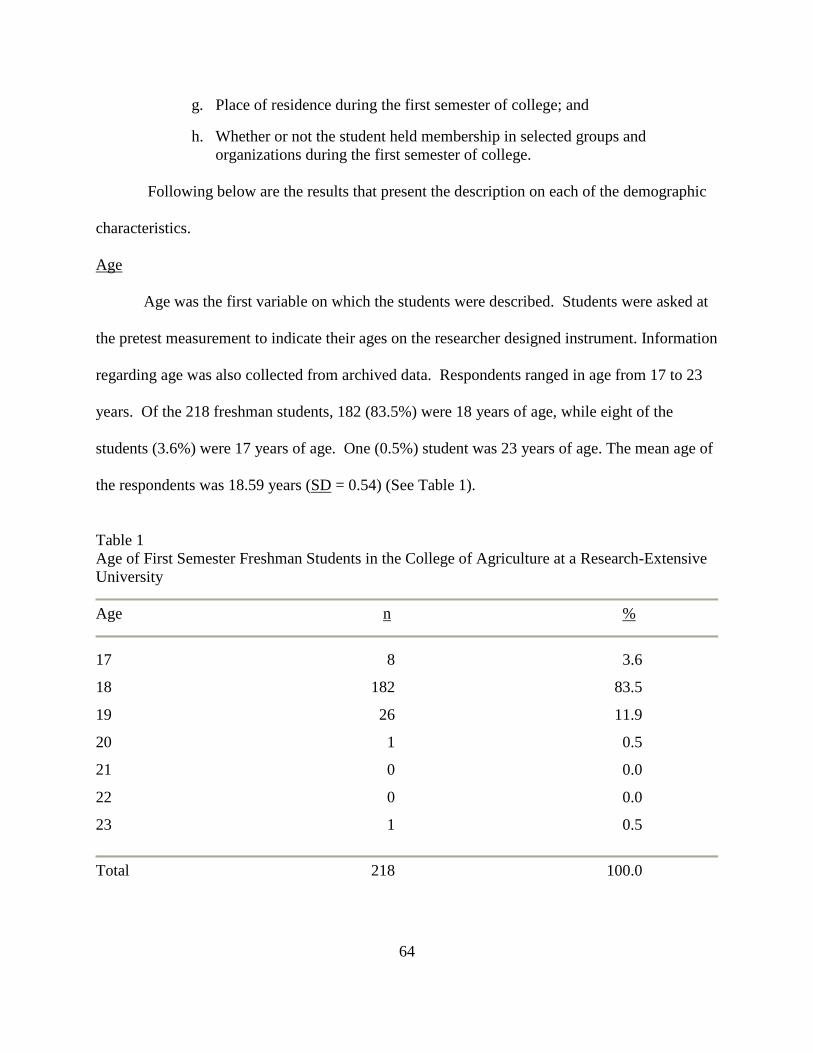
64
g. Place of residence during the first semester of college; and
h. Whether or not the student held membership in selected groups and organizations during the first semester of college.
Following below are the results that present the description on each of the demographic
characteristics.
Age
Age was the first variable on which the students were described. Students were asked at
the pretest measurement to indicate their ages on the researcher designed instrument. Information
regarding age was also collected from archived data. Respondents ranged in age from 17 to 23
years. Of the 218 freshman students, 182 (83.5%) were 18 years of age, while eight of the
students (3.6%) were 17 years of age. One (0.5%) student was 23 years of age. The mean age of
the respondents was 18.59 years (SD = 0.54) (See Table 1).
Table 1 Age of First Semester Freshman Students in the College of Agriculture at a Research-Extensive University
Age n %
17 8 3.6
18 182 83.5
19 26 11.9
20 1 0.5
21 0 0.0
22 0 0.0
23 1 0.5
Total 218 100.0
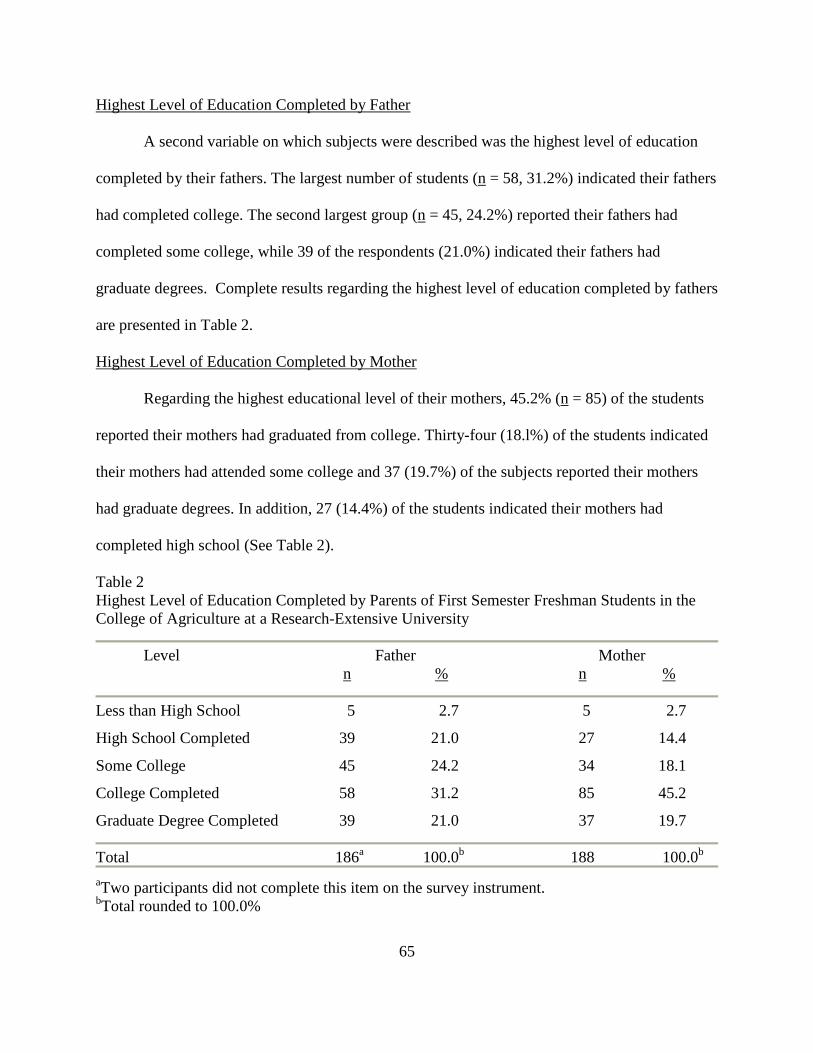
65
Highest Level of Education Completed by Father
A second variable on which subjects were described was the highest level of education
completed by their fathers. The largest number of students (n = 58, 31.2%) indicated their fathers
had completed college. The second largest group (n = 45, 24.2%) reported their fathers had
completed some college, while 39 of the respondents (21.0%) indicated their fathers had
graduate degrees. Complete results regarding the highest level of education completed by fathers
are presented in Table 2.
Highest Level of Education Completed by Mother
Regarding the highest educational level of their mothers, 45.2% (n = 85) of the students
reported their mothers had graduated from college. Thirty-four (18.l%) of the students indicated
their mothers had attended some college and 37 (19.7%) of the subjects reported their mothers
had graduate degrees. In addition, 27 (14.4%) of the students indicated their mothers had
completed high school (See Table 2).
Table 2 Highest Level of Education Completed by Parents of First Semester Freshman Students in the College of Agriculture at a Research-Extensive University
Level Father Mother n % n %
Less than High School 5 2.7 5 2.7
High School Completed 39 21.0 27 14.4
Some College 45 24.2 34 18.1
College Completed 58 31.2 85 45.2
Graduate Degree Completed 39 21.0 37 19.7
Total 186a 100.0b 188 100.0b
aTwo participants did not complete this item on the survey instrument. bTotal rounded to 100.0%

66
Marital Status of Parents
Another variable on which respondents were described was the marital status of their
parents. A majority of the students (n = 132, 70.6%) indicated their parents were married, while
37 (19.8%) of the students reported their parents to be divorced (See Table 3).
Table 3 Marital Status of Parents of First Semester Freshman Students in the College of Agriculture at a Research-Extensive University
Status n %
Married 132 70.6
Divorced 37 19.8
Separated 6 3.2
Single 6 3.2
Widowed 6 3.2
Total 187a 100.0
aOne participant did not complete this item on the survey instrument.
Race
Students were also described on their race. Four (1.8 %) of the students did not report
information regarding their race. Seventeen (8.0%) of the students reported they were
Black/Non-Hispanic, while 180 (84.1%) indicated they were Caucasian/Non-Hispanic (See
Table 4).
Gender
Another variable on which participants were described was gender. Of the 218 students
at the freshman level who were participants in the study, 46 (21.1%) were identified as male and
172 (78.9%) were identified as female.
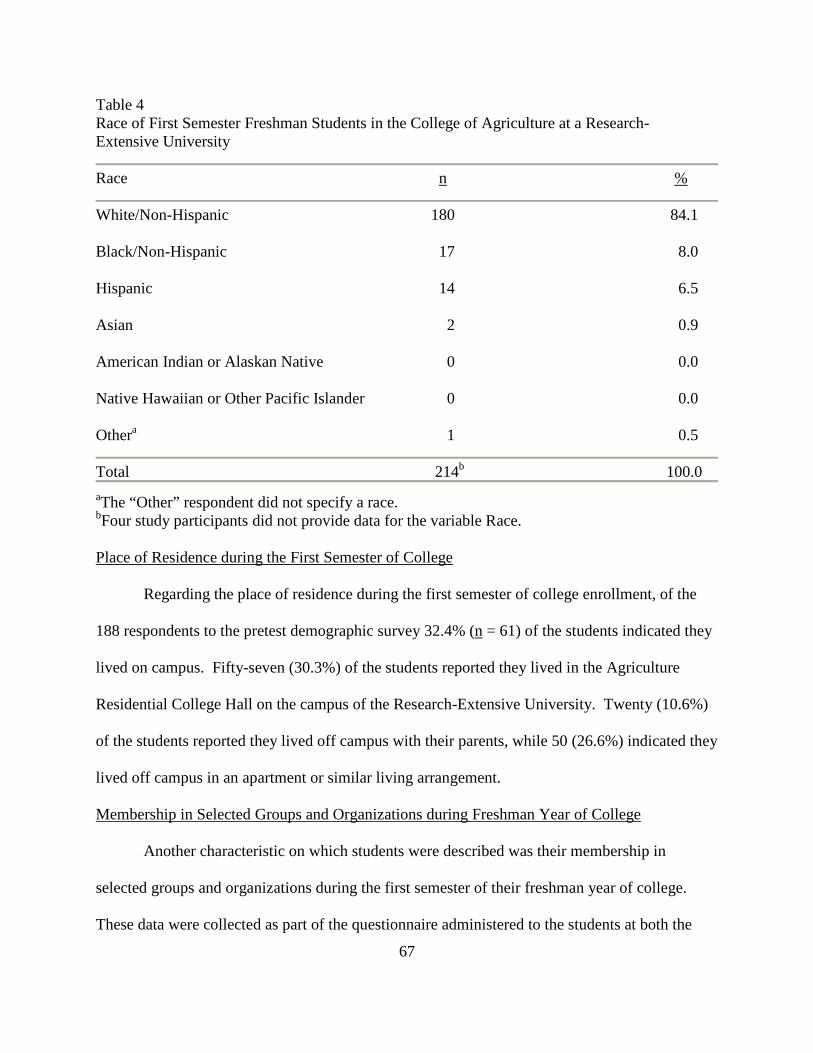
67
Table 4 Race of First Semester Freshman Students in the College of Agriculture at a Research- Extensive University
Race n %
White/Non-Hispanic 180 84.1
Black/Non-Hispanic 17 8.0
Hispanic 14 6.5
Asian 2 0.9
American Indian or Alaskan Native 0 0.0
Native Hawaiian or Other Pacific Islander 0 0.0
Othera 1 0.5
Total 214b 100.0
aThe “Other” respondent did not specify a race. bFour study participants did not provide data for the variable Race.
Place of Residence during the First Semester of College
Regarding the place of residence during the first semester of college enrollment, of the
188 respondents to the pretest demographic survey 32.4% (n = 61) of the students indicated they
lived on campus. Fifty-seven (30.3%) of the students reported they lived in the Agriculture
Residential College Hall on the campus of the Research-Extensive University. Twenty (10.6%)
of the students reported they lived off campus with their parents, while 50 (26.6%) indicated they
lived off campus in an apartment or similar living arrangement.
Membership in Selected Groups and Organizations during Freshman Year of College
Another characteristic on which students were described was their membership in
selected groups and organizations during the first semester of their freshman year of college.
These data were collected as part of the questionnaire administered to the students at both the
68
pretest and posttest data collection points. A total of 188 students responded to these items at the
pretest; however, percentages do not sum to 100 since respondents were asked to check all that
applied to them from among the items available. The organization/group that was reported by
the largest number of students (n = 62, 33.0%) as one in which they were participating was
“Social Sorority/Fraternity.” The organization/group that was reported by the second largest
number of students at the pretest was “Service Organization” (n = 54, 28.7%). Additionally, 38
(20.2%) individuals reported that they participated in an “Other” organization/group. The
“Other” organizations/groups reported by these students are included as a note to Table 5.
At the posttest measurement a total of 163 students responded to the items on the
questionnaire. The organization/group that was reported by the largest number of students
(n = 45, 27.6%) as one in which they were participating was “Social Sorority/Fraternity.”
The organization/group that was reported by the second largest number of students at the
posttest was “Service Organization” (n = 31, 19%). Thirty-one (19%) students indicated that
they participated in “Other” organization/group. Once again, percentages do not sum to 100
since respondents were asked to check all that applied to them among items listed on the
questionnaire and the “Other” groups/organizations reported by these students are included
as a note to Table 5.
Objective Two
Objective two of the study was to determine the self-esteem of students at the freshman
level in the College of Agriculture at a Research-Extensive University in the Southern Region of
the United States as measured by the Adult Form of the Coopersmith Inventory. The Adult Form of the Coopersmith Inventory was administered as a pretest measurement at the beginning
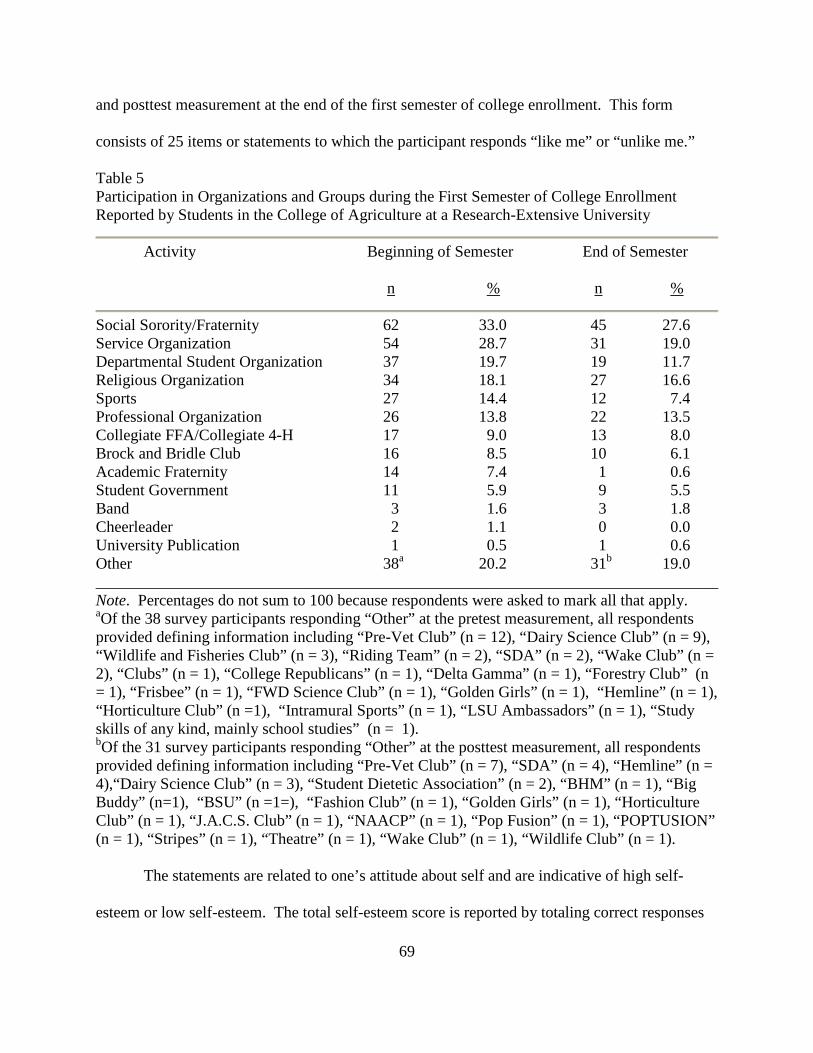
69
and posttest measurement at the end of the first semester of college enrollment. This form
consists of 25 items or statements to which the participant responds “like me” or “unlike me.”
Table 5 Participation in Organizations and Groups during the First Semester of College Enrollment Reported by Students in the College of Agriculture at a Research-Extensive University
Activity Beginning of Semester End of Semester
n % n %
Social Sorority/Fraternity 62 33.0 45 27.6 Service Organization 54 28.7 31 19.0 Departmental Student Organization 37 19.7 19 11.7 Religious Organization 34 18.1 27 16.6 Sports 27 14.4 12 7.4 Professional Organization 26 13.8 22 13.5 Collegiate FFA/Collegiate 4-H 17 9.0 13 8.0 Brock and Bridle Club 16 8.5 10 6.1 Academic Fraternity 14 7.4 1 0.6 Student Government 11 5.9 9 5.5 Band 3 1.6 3 1.8 Cheerleader 2 1.1 0 0.0 University Publication 1 0.5 1 0.6 Other 38a 20.2 31b 19.0 ______________________________________________________________________________ Note. Percentages do not sum to 100 because respondents were asked to mark all that apply. aOf the 38 survey participants responding “Other” at the pretest measurement, all respondents provided defining information including “Pre-Vet Club” (n = 12), “Dairy Science Club” (n = 9), “Wildlife and Fisheries Club” (n = 3), “Riding Team” (n = 2), “SDA” (n = 2), “Wake Club” (n = 2), “Clubs” (n = 1), “College Republicans” (n = 1), “Delta Gamma” (n = 1), “Forestry Club” (n = 1), “Frisbee” (n = 1), “FWD Science Club” (n = 1), “Golden Girls” (n = 1), “Hemline” (n = 1), “Horticulture Club” (n =1), “Intramural Sports” (n = 1), “LSU Ambassadors” (n = 1), “Study skills of any kind, mainly school studies” (n = 1). bOf the 31 survey participants responding “Other” at the posttest measurement, all respondents provided defining information including “Pre-Vet Club” (n = 7), “SDA” (n = 4), “Hemline” (n = 4),“Dairy Science Club” (n = 3), “Student Dietetic Association” (n = 2), “BHM” (n = 1), “Big Buddy” (n=1), “BSU” (n =1=), “Fashion Club” (n = 1), “Golden Girls” (n = 1), “Horticulture Club” (n = 1), “J.A.C.S. Club” (n = 1), “NAACP” (n = 1), “Pop Fusion” (n = 1), “POPTUSION” (n = 1), “Stripes” (n = 1), “Theatre” (n = 1), “Wake Club” (n = 1), “Wildlife Club” (n = 1). The statements are related to one’s attitude about self and are indicative of high self-
esteem or low self-esteem. The total self-esteem score is reported by totaling correct responses
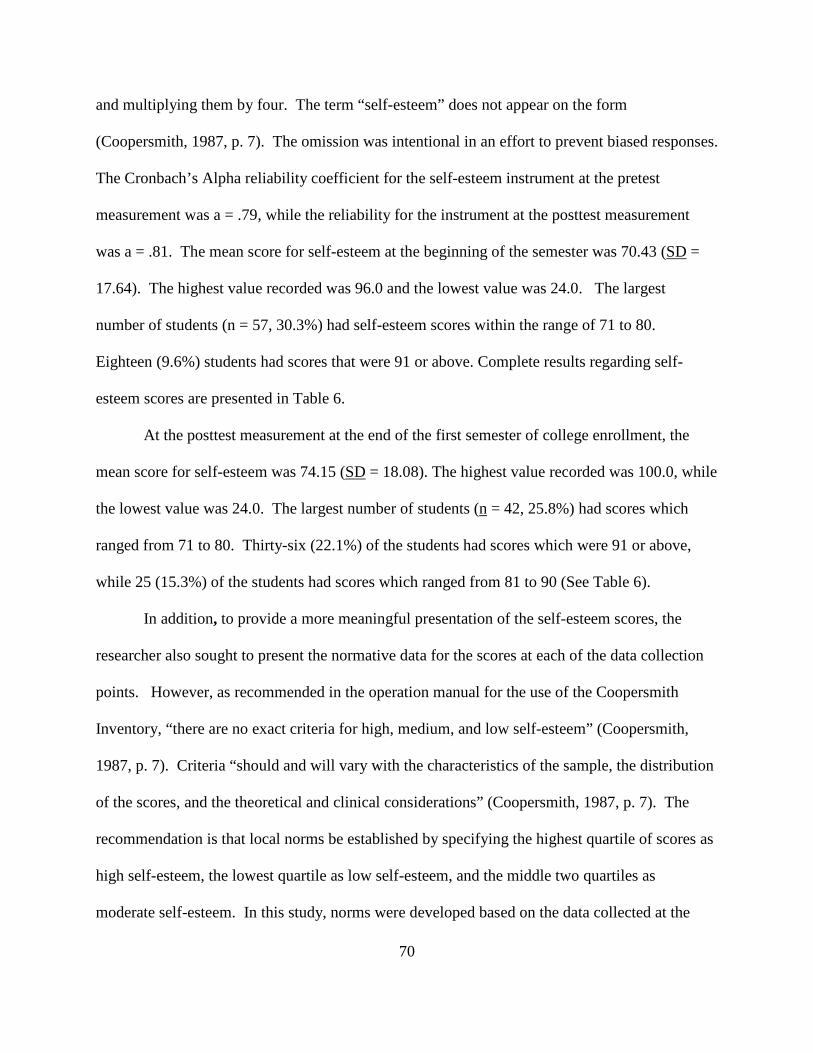
70
and multiplying them by four. The term “self-esteem” does not appear on the form
(Coopersmith, 1987, p. 7). The omission was intentional in an effort to prevent biased responses.
The Cronbach’s Alpha reliability coefficient for the self-esteem instrument at the pretest
measurement was a = .79, while the reliability for the instrument at the posttest measurement
was a = .81. The mean score for self-esteem at the beginning of the semester was 70.43 (SD =
17.64). The highest value recorded was 96.0 and the lowest value was 24.0. The largest
number of students (n = 57, 30.3%) had self-esteem scores within the range of 71 to 80.
Eighteen (9.6%) students had scores that were 91 or above. Complete results regarding self-
esteem scores are presented in Table 6.
At the posttest measurement at the end of the first semester of college enrollment, the
mean score for self-esteem was 74.15 (SD = 18.08). The highest value recorded was 100.0, while
the lowest value was 24.0. The largest number of students (n = 42, 25.8%) had scores which
ranged from 71 to 80. Thirty-six (22.1%) of the students had scores which were 91 or above,
while 25 (15.3%) of the students had scores which ranged from 81 to 90 (See Table 6).
In addition, to provide a more meaningful presentation of the self-esteem scores, the
researcher also sought to present the normative data for the scores at each of the data collection
points. However, as recommended in the operation manual for the use of the Coopersmith
Inventory, “there are no exact criteria for high, medium, and low self-esteem” (Coopersmith,
1987, p. 7). Criteria “should and will vary with the characteristics of the sample, the distribution
of the scores, and the theoretical and clinical considerations” (Coopersmith, 1987, p. 7). The
recommendation is that local norms be established by specifying the highest quartile of scores as
high self-esteem, the lowest quartile as low self-esteem, and the middle two quartiles as
moderate self-esteem. In this study, norms were developed based on the data collected at the

71
Table 6 Pretest and Posttest Self-Esteem Scores of First Semester Freshman Students in the College of Agriculture at a Research-Extensive University
Pretesta Posttestb Score n % n %
91 or more 18 9.6 36 22.1
81-90 37 19.7 25 15.3
71-80 57 30.3 42 25.8
61-70 23 12.2 23 14.1
51-60 24 12.8 15 9.2
41-50 14 7.4 11 6.8
31-40 9 4.8 9 5.5
30 or less 6 3.2 2 1.2
Total 188 100.0 163 100.0
aThe mean pretest score was 70.43 (SD = 17.64). Self-esteem scores ranged from 24 to 96. bThe mean posttest score was 73.77 (SD = 18.08). Self-esteem scores ranged from 24 to 100.
pretest measurement at the beginning of the semester. The same norms were used at the posttest
measurement at the end of the first semester of college enrollment. At the pretest measurement
the largest group of scores (n = 80, 42.6%) were in the moderate self-esteem category, while the
fewest scores were in the low self-esteem category (n = 53, 28.2%). At the end of the semester
the largest group of the scores (n =65, 39.9%) were in the moderate self-esteem category. The
least number of scores (n = 37, 22.7%) were in the low self-esteem category (See Table 7).
Objective Three
Another objective of the study was to describe students at the freshman level in the
College of Agriculture at a Research-Extensive University on academic achievement as
measured by their first semester grade point averages.
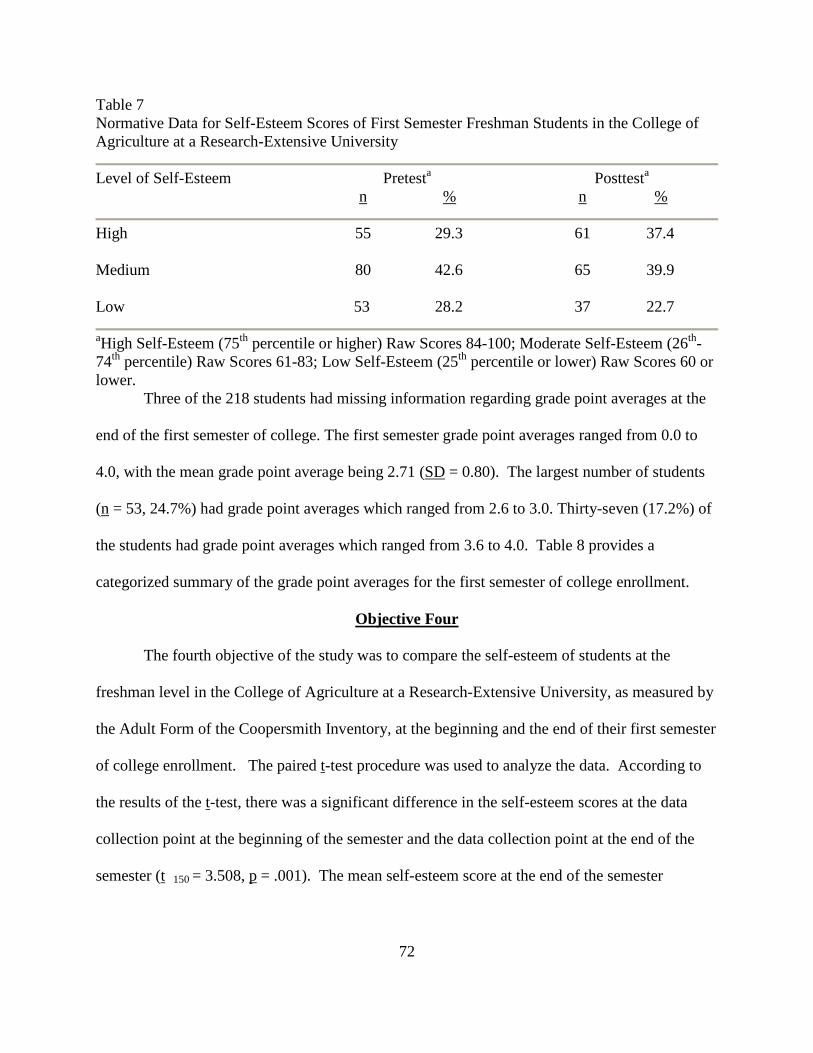
72
Table 7 Normative Data for Self-Esteem Scores of First Semester Freshman Students in the College of Agriculture at a Research-Extensive University
Level of Self-Esteem Pretesta Posttesta n % n %
High 55 29.3 61 37.4 Medium 80 42.6 65 39.9 Low 53 28.2 37 22.7
aHigh Self-Esteem (75th percentile or higher) Raw Scores 84-100; Moderate Self-Esteem (26th-74th percentile) Raw Scores 61-83; Low Self-Esteem (25th percentile or lower) Raw Scores 60 or lower. Three of the 218 students had missing information regarding grade point averages at the
end of the first semester of college. The first semester grade point averages ranged from 0.0 to
4.0, with the mean grade point average being 2.71 (SD = 0.80). The largest number of students
(n = 53, 24.7%) had grade point averages which ranged from 2.6 to 3.0. Thirty-seven (17.2%) of
the students had grade point averages which ranged from 3.6 to 4.0. Table 8 provides a
categorized summary of the grade point averages for the first semester of college enrollment.
Objective Four
The fourth objective of the study was to compare the self-esteem of students at the
freshman level in the College of Agriculture at a Research-Extensive University, as measured by
the Adult Form of the Coopersmith Inventory, at the beginning and the end of their first semester
of college enrollment. The paired t-test procedure was used to analyze the data. According to
the results of the t-test, there was a significant difference in the self-esteem scores at the data
collection point at the beginning of the semester and the data collection point at the end of the
semester (t 150 = 3.508, p = .001). The mean self-esteem score at the end of the semester

73
Table 8 First Semester Grade Point Average of Freshman Students in the College of Agriculture at a Research-Extensive University
Grade Point Average (GPA) n %
3.6-4.0 37 17.2
3.1-3.5 45 20.9
2.6-3.0 53 24.7
2.1-2.5 41 19.1
1.6-2.0 19 8.8
1.1-1.5 13 6.0
0.0-1.0 7 3.3
Total 215a 100.0
Note: The mean GPA was 2.71 (SD = 0.80). The GPAs ranged from 0.0 to 4.0. aThree students had missing information regarding GPAs at the end of the first semester of college enrollment. (M =74.15, SD = 18.08) was significantly higher than the mean self-esteem score at the
beginning of the semester (M = 70.99, SD = 17.48).
Objective Five
Objective five of the study was to determine if a relationship existed between academic
achievement, as measured by high school grade point average, and self-esteem, as measured by
the Adult Form of the Coopersmith Inventory at the beginning of the first semester of college
enrollment, among students at the freshman level in the College of Agriculture at a Research-
Extensive University in the Southern Region of the United States. When examining the
relationship between the overall high school grade point average and self-esteem scores at the
beginning of the first semester of college enrollment, the Pearson Product Moment Correlation
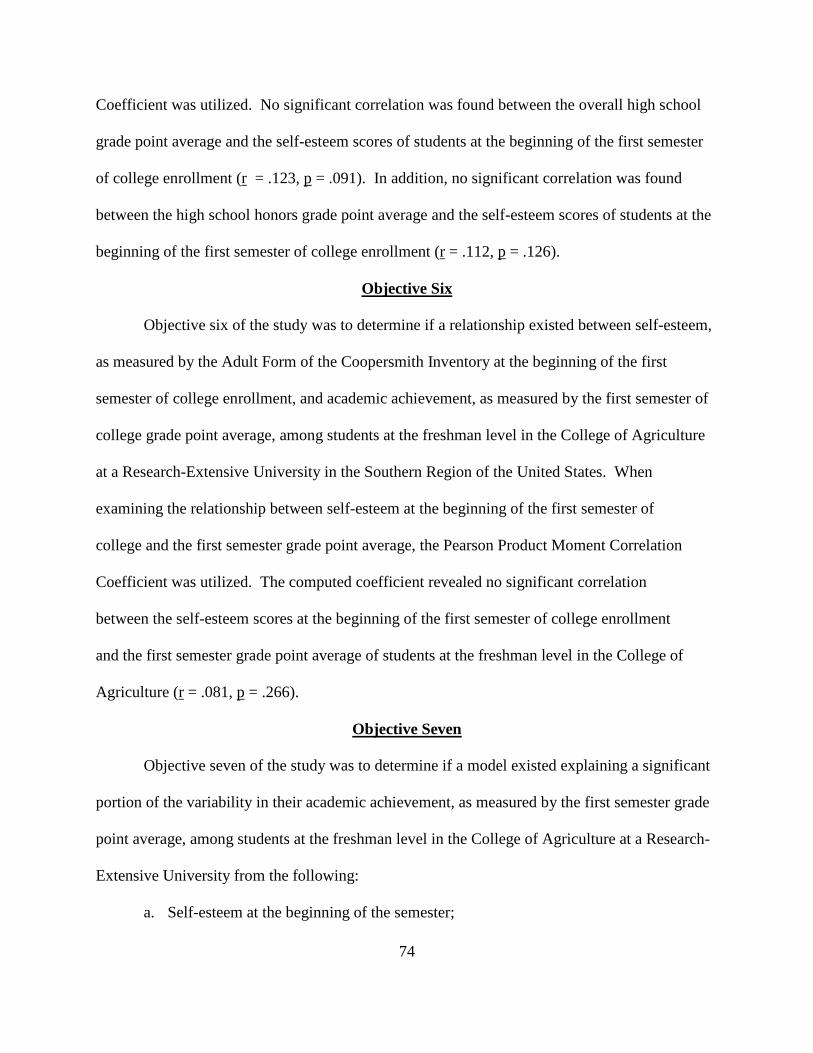
74
Coefficient was utilized. No significant correlation was found between the overall high school
grade point average and the self-esteem scores of students at the beginning of the first semester
of college enrollment (r = .123, p = .091). In addition, no significant correlation was found
between the high school honors grade point average and the self-esteem scores of students at the
beginning of the first semester of college enrollment (r = .112, p = .126).
Objective Six
Objective six of the study was to determine if a relationship existed between self-esteem,
as measured by the Adult Form of the Coopersmith Inventory at the beginning of the first
semester of college enrollment, and academic achievement, as measured by the first semester of
college grade point average, among students at the freshman level in the College of Agriculture
at a Research-Extensive University in the Southern Region of the United States. When
examining the relationship between self-esteem at the beginning of the first semester of
college and the first semester grade point average, the Pearson Product Moment Correlation
Coefficient was utilized. The computed coefficient revealed no significant correlation
between the self-esteem scores at the beginning of the first semester of college enrollment
and the first semester grade point average of students at the freshman level in the College of
Agriculture (r = .081, p = .266).
Objective Seven
Objective seven of the study was to determine if a model existed explaining a significant
portion of the variability in their academic achievement, as measured by the first semester grade
point average, among students at the freshman level in the College of Agriculture at a Research-
Extensive University from the following:
a. Self-esteem at the beginning of the semester;

75
b. Age;
c. Highest level of education completed by father;
d. Highest level of education completed by mother;
e. Marital status of parents;
f. Race;
g. Gender;
h. Place of residence during the first semester of college; and
i. Whether or not the student held membership in selected groups and organizations during the first semester of college.
In order to accomplish the objective the researcher used multiple regression analysis. In
conducting the multiple regression analysis, the dependent variable was academic achievement
as measured by the first semester grade point average. This variable was measured on an
interval scale of measurement. The independent variables included the self-esteem pretest score
and age which were also measured as continuous variables on an interval scale. The other
independent variables included highest level of education completed by father, highest level of
education completed by mother, marital status of parents, race, place of residence during the first
semester of college, and whether or not the student held membership in selected groups and
organizations during the first semester of college enrollment. These independent variables were
categorical in nature and had to be restructured as dichotomous variables in preparation for entry
into the analysis. Gender was also a categorical variable. However, since its natural occurrence
is a dichotomy, it did not have to be restructured. Stepwise entry of variables was used due to
the exploratory nature of the study. Variables that increased the explained variance by one
percent or more were entered into the regression equation as long as the overall equation
remained significant.
76
The categorical variable, whether or not the student held membership in selected groups
and organizations during the first semester of college enrollment, was measured in 14 response
categories. Of these 14 response categories, the three categories band, cheerleader, and
university publication, did not have adequate frequencies to include as a variable of
investigation. In addition, the “Other” response was not included since the variety of responses
created a variable with little continuity. The categorical response “Departmental Student
Organization” was restructured to a dichotomous variable “Member of a Departmental Student
Organization” or “Not a Member of a Departmental Student Organization.” The dichotomous
variable was then entered into the regression analysis as an independent variable. Similarly, the
response “Service Organization,” a response to the categorical variable regarding membership in
organizations, was restructured as having membership in a service organization or not having
membership in a service organization. Established as such it was used for entry into the analysis.
Ten of the 14 categories that had 10 or more responses were restructured in this manner.
The categorical variable “Highest Level of Education of Father” was measured in four
response categories. Each of these four response categories was established as a separate
dichotomous variable. For example, the response “Graduate Degree” as the highest level of
education completed by father was specified as “Graduate Degree” or “No Graduate Degree”
and this dichotomous variable was entered into the regression analysis as an independent
variable. This remained constant with the categorical variable “Highest Level of Education of
Mother” which was also measured in the same four response categories, high school completed,
some college, college degree, and graduate degree. Again each of the four response categories
was established as a separate dichotomous variable.
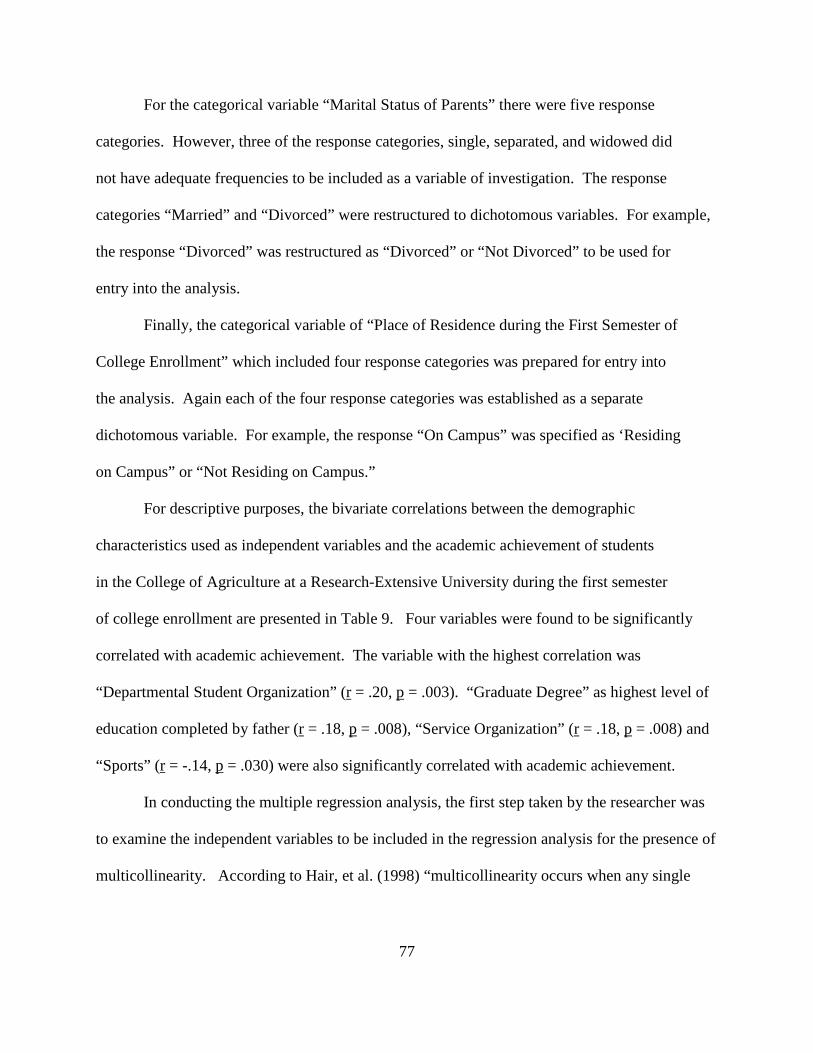
77
For the categorical variable “Marital Status of Parents” there were five response
categories. However, three of the response categories, single, separated, and widowed did
not have adequate frequencies to be included as a variable of investigation. The response
categories “Married” and “Divorced” were restructured to dichotomous variables. For example,
the response “Divorced” was restructured as “Divorced” or “Not Divorced” to be used for
entry into the analysis.
Finally, the categorical variable of “Place of Residence during the First Semester of
College Enrollment” which included four response categories was prepared for entry into
the analysis. Again each of the four response categories was established as a separate
dichotomous variable. For example, the response “On Campus” was specified as ‘Residing
on Campus” or “Not Residing on Campus.”
For descriptive purposes, the bivariate correlations between the demographic
characteristics used as independent variables and the academic achievement of students
in the College of Agriculture at a Research-Extensive University during the first semester
of college enrollment are presented in Table 9. Four variables were found to be significantly
correlated with academic achievement. The variable with the highest correlation was
“Departmental Student Organization” (r = .20, p = .003). “Graduate Degree” as highest level of
education completed by father (r = .18, p = .008), “Service Organization” (r = .18, p = .008) and
“Sports” (r = -.14, p = .030) were also significantly correlated with academic achievement.
In conducting the multiple regression analysis, the first step taken by the researcher was
to examine the independent variables to be included in the regression analysis for the presence of
multicollinearity. According to Hair, et al. (1998) “multicollinearity occurs when any single
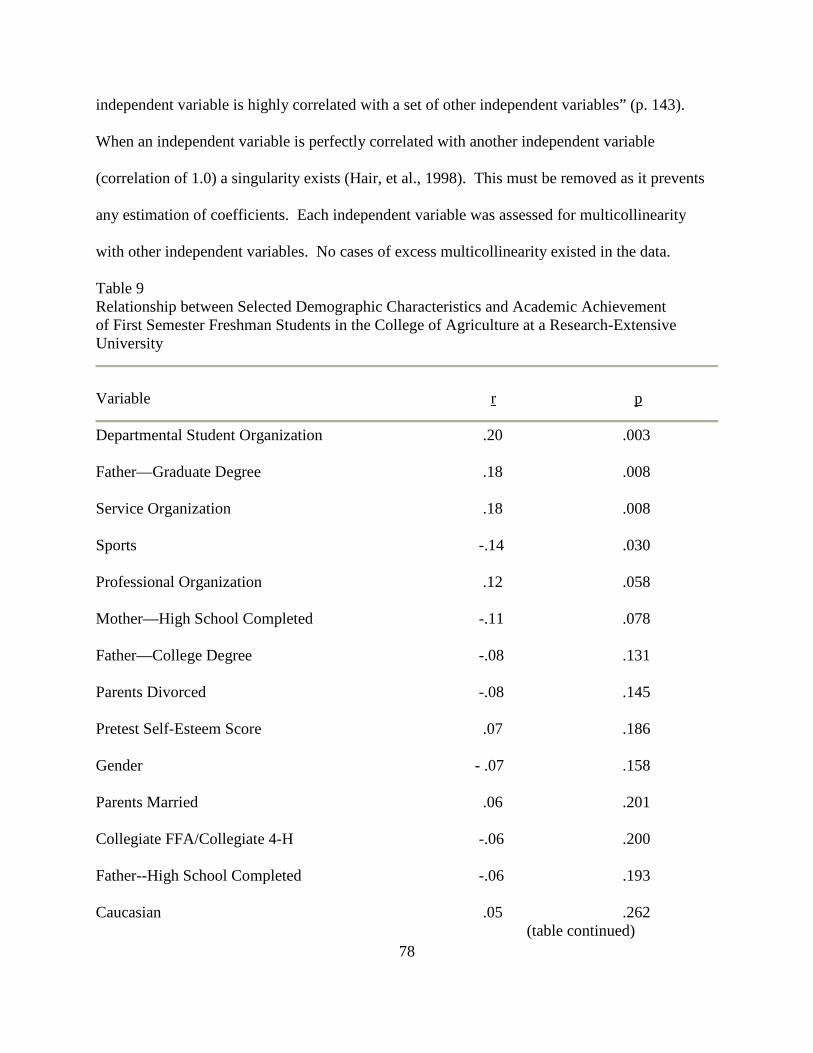
78
independent variable is highly correlated with a set of other independent variables” (p. 143).
When an independent variable is perfectly correlated with another independent variable
(correlation of 1.0) a singularity exists (Hair, et al., 1998). This must be removed as it prevents
any estimation of coefficients. Each independent variable was assessed for multicollinearity
with other independent variables. No cases of excess multicollinearity existed in the data.
Table 9 Relationship between Selected Demographic Characteristics and Academic Achievement of First Semester Freshman Students in the College of Agriculture at a Research-Extensive University
Variable r p
Departmental Student Organization .20 .003 Father—Graduate Degree .18 .008 Service Organization .18 .008 Sports -.14 .030 Professional Organization .12 .058 Mother—High School Completed -.11 .078 Father—College Degree -.08 .131 Parents Divorced -.08 .145 Pretest Self-Esteem Score .07 .186 Gender - .07 .158 Parents Married .06 .201 Collegiate FFA/Collegiate 4-H -.06 .200 Father--High School Completed -.06 .193 Caucasian .05 .262 (table continued)
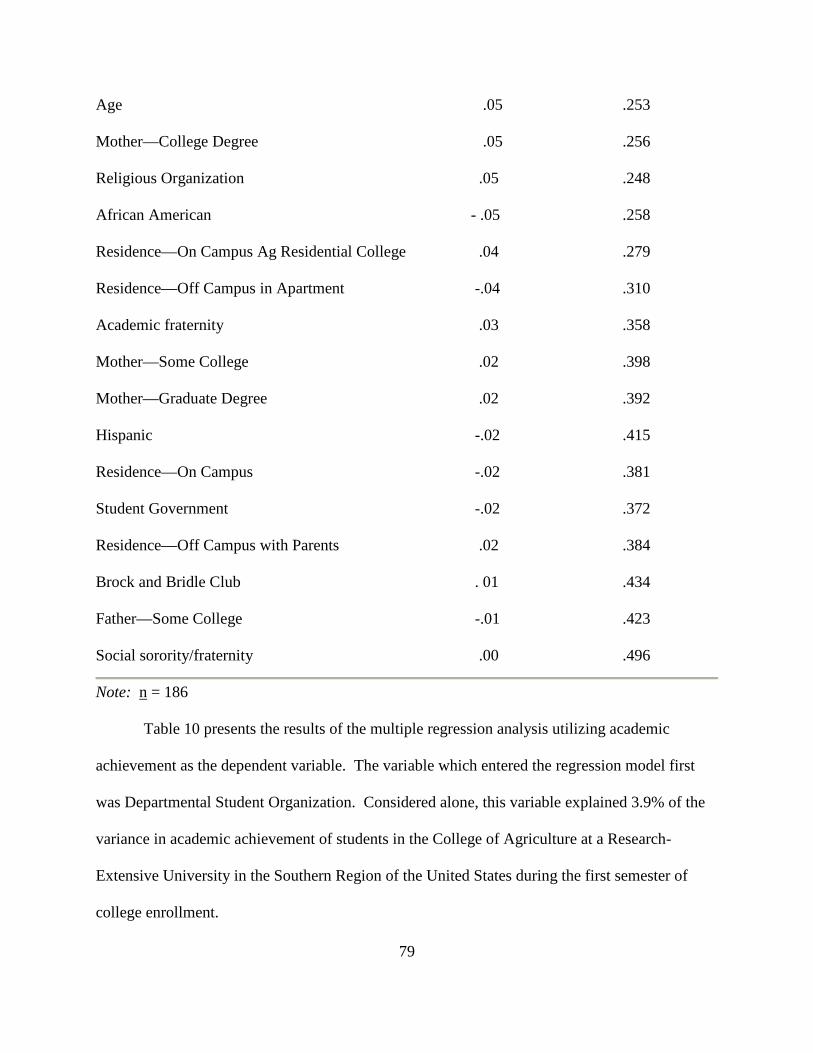
79
Age .05 .253 Mother—College Degree .05 .256 Religious Organization .05 .248 African American - .05 .258 Residence—On Campus Ag Residential College .04 .279 Residence—Off Campus in Apartment -.04 .310 Academic fraternity .03 .358 Mother—Some College .02 .398 Mother—Graduate Degree .02 .392 Hispanic -.02 .415 Residence—On Campus -.02 .381 Student Government -.02 .372 Residence—Off Campus with Parents .02 .384 Brock and Bridle Club . 01 .434 Father—Some College -.01 .423 Social sorority/fraternity .00 .496
Note: n = 186
Table 10 presents the results of the multiple regression analysis utilizing academic
achievement as the dependent variable. The variable which entered the regression model first
was Departmental Student Organization. Considered alone, this variable explained 3.9% of the
variance in academic achievement of students in the College of Agriculture at a Research-
Extensive University in the Southern Region of the United States during the first semester of
college enrollment.

80
Three additional variables explained an additional 6% of the variance in academic
achievement. Those variables were “Graduate Degree” as father’s highest level of education,
membership in “Service Organizations,” and “Sports.” The four variables which entered into the
regression model explained 9.9% of the variance in academic achievement of students in the
College of Agriculture at a Research-Extensive University in the Southern Region of the United
States during the first semester of college enrollment (See Table 9). The nature of the influence
of the variables that entered the model was such that students who held membership in
departmental student organizations tended to have higher grade point averages during the first
semester of college enrollment. In addition, students whose fathers held graduate degrees and
those who responded that they were members of service organizations also tended to have higher
grade point averages during the first semester of college enrollment. Participation in sports,
however, had a negative influence on academic achievement. The nature of the influence was
such that students who participated in sports tended to have lower grade point averages.
Table 10 Multiple Regression Analysis of Academic Achievement as Measured by First Semester Grade Point Average and Selected Demographic Characteristics of Freshman Students in the College of Agriculture at a Research-Extensive University
__________________________________ANOVA____________________________________ Source of Variation df MS F-ratio p _____________________________________________________________________________ Regression 4 2.689 4.959 .001 Residual 181 .542 Total 185 _____________________________________________________________________________ ___________________________________Model Summary_____________________________ (table continued)

81
Model R R2 R2 F df1 df2 Sig. F β Cumulative Change Change Change
Departmental Student Organization .197 .039 .039 7.463 1 184 .007 .150 Father— Graduate Degree .258 .067 .028 5.407 1 183 .021 .176 Service Organization .295 .087 .021 4.124 1 182 .044 .132 Sports .314 .099 .012 2.315 1 181 .130 -.109
______________________________Variables not in the Equation________________________ Variables t Sig. t
Age .522 .602 Father—High School -.479 .632 Father –Some College 1.015 .311 Father—College Degree -.568 .571 Mother—High School -1.108 .269 Mother—Some College .249 .803 Mother—College Degree 1.141 .255 Mother—Graduate Degree -.694 .489 Parents—Married .113 .910 Parents-Divorced -.717 .474 Race-African American -.918 .360 Race—Caucasian .787 .432 Race—Hispanic -.309 .758 Gender -.699 .485 Residence—on Campus -.035 .972 Residence—Ag Residence College .020 .984 Residence—Off Campus with Parents .582 .561 Residence—Off Campus in Apartment -.389 .698 Social Sorority/Fraternity .073 .942 Academic Fraternity .082 .935 Student Government Organization -.592 .555 Collegiate FFA/4-H -1.125 .262 Brock and Bridle Club .097 .923 Professional Organization .635 .526 Religious Organization .455 .650 Self-Esteem Score .921 .358

82
Objective Eight
The eighth objective of the study was to determine if a model existed explaining a
significant portion of the variability in their self-esteem, as measured by the Adult Form of the
Coopersmith Inventory, at the end of the first semester of college enrollment among students at
the freshman level in the College of Agriculture at a Research-Extensive University in the
Southern Region of the United States from the following:
a. Academic achievement, as measured by overall high school grade point average;
b. Age;
c. Highest level of education completed by father;
d. Highest level of education completed by mother;
e. Marital status of parents;
f. Race;
g. Gender;
h. Place of residence during the first semester of college; and
i. Whether or not the student held membership in selected groups and organizations during the first semester of college.
Again, the researcher used multiple regression analysis to accomplish this objective. In
conducting the multiple regression analysis, the dependent variable was self-esteem among
students at the freshman level in the College of Agriculture at a Research-Extensive University
in the Southern Region of the United States, as measured by the Coopersmith Inventory, at the
end of the first semester of college enrollment. The variable was a continuous variable measured
on an interval scale of measurement. The independent variables included academic achievement
and age which were also measured as continuous variables on an interval scale. The other
independent variables were highest level of education of father, highest level of education of
83
mother, marital status of parents, race, place of residence during the first semester of college,
and whether or not the student held membership in selected groups and organizations during the
first semester of college enrollment. These independent variables were categorical in nature and
had to be restructured as dichotomous variables in preparation for entry into the analysis.
Gender was also a categorical variable. However, since its natural occurrence is a dichotomy, it
did not have to be restructured. Once again, stepwise entry of variables was used, and variables
that increased the explained variance by one percent or more were entered into the regression
equation as long as the overall equation remained significant.
As in objective seven, the categorical variable whether or not the student held
membership in selected groups and organizations during the first semester of college enrollment
was measured in 14 response categories. Three of these 14 categories band, cheerleader, and
university publication did not have adequate frequencies to include as a variable of investigation.
In addition, the response “Other” was not included since the variety of responses created a
variable with little continuity. Remaining categorical responses were restructured to
dichotomous variables. For example, the categorical response “Social Sorority/ Fraternity” was
restructured to a dichotomous variable “Member of a Social Sorority/Fraternity” or “Not a
Member of a Social Sorority/Fraternity.” The variable was then entered into the regression
analysis as an independent variable. Similarly, the variable “Religious Organization” which was
a response to the categorical variable regarding membership in organizations was restructured as
“Membership in a Religious Organization” or “No Membership in a Religious Organization.”
Established as such it was used for entry into the analysis. Ten of the 14 categories that had 10
or more responses were restructured in this way.

84
The categorical variable “Highest Level of Education of Father” was measured in four
response categories. Each of these four response categories was established as a separate
dichotomous variable. For example the response “Graduate Degree” as the highest level of
education completed by father was specified as “Graduate Degree” or “No Graduate Degree,”
and this dichotomous variable was entered into the regression analysis as an independent
variable. The categorical variable “Highest Level of Education of Mother” was measured in the
same four response categories, “High School Completed,” “Some College,” “College Degree,”
and “Graduate Degree.” As with the categorical variable “Highest Level of Education of
Father,” each of the four response categories was restructured as a separate dichotomous variable
for entry into the analysis as an independent variable.
With regard to the categorical variable “Marital Status of Parents,” there were five
response categories. In this instance three of the response categories, single, separated, and
widowed did not have adequate frequencies to be included as a variable of investigation. The
response categories “Married” and “Divorced” were restructured as dichotomous variables. For
example, the response “Divorced” was restructured as “Divorced” or “Not Divorced” to be
entered into the regression analysis.
Finally, the categorical variable “Place of Residence during the First Semester of
College” included four response categories. These response categories “Residing on Campus,”
“Residing on Campus in the Agriculture Residential College,” “Residing off Campus with
Parents,” and “Residing off Campus in an Apartment” were each established as a dichotomous
variable. For example, the response “Residing on Campus” was specified as “Residing on
Campus” or “Not Residing on Campus.”
85
Bivariate correlations are presented in Table 11. These correlations, presented for
descriptive purposes, represent those between the demographic characteristics used as
independent variables and the self-esteem of students in the College of Agriculture at a
Research-Extensive University during the first semester of college enrollment. Six variables
were found to be significantly correlated with self-esteem. The variable with the highest
correlation was “Age” (r = -.18, p =.013). The variables “Social Sorority/Fraternity” (r = .18, p =
.014), “Residence off Campus in an Apartment” (r = -.17, p = .020), “Religious Organization” (r
= .15, p = .032), “Hispanic Race” (r = -.14, p = .040), and “African American Race” (r = .14, p =
.046) were also significantly correlated with the variable self-esteem.
The first step taken by the researcher in conducting the multiple regression analysis was
to examine the independent variables to be included in the analysis for the presence of
multicollinearity. High multicollinearity exists if the correlation between any two or more
independent variables approaches 1.0. A singularity exists if the correlation coefficient is equal
to 1.0. This must be removed as it prevents the estimation of coefficients (Hair, et, al., 1998).
Each independent variable was assessed for multicollinearity with other independent variables.
No cases of excess multicollinearity existed in the data.
Table 12 presents the results of the multiple regression analysis utilizing self-esteem as
the dependent variable. The variable which entered the regression model first was “Age.”
Considered alone, this variable explained 3.3% of the variance in the self-esteem of students in
the College of Agriculture at a Research-Extensive University in the Southern Region of the
United States during the first semester of college enrollment.
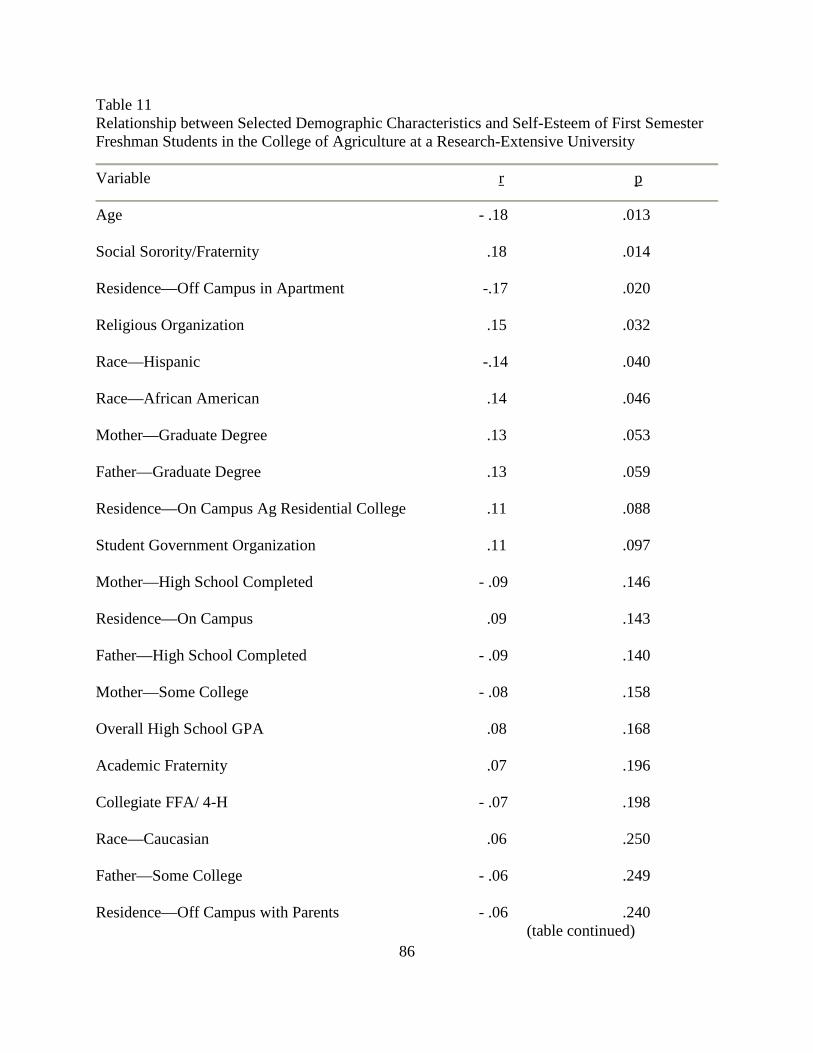
86
Table 11 Relationship between Selected Demographic Characteristics and Self-Esteem of First Semester Freshman Students in the College of Agriculture at a Research-Extensive University
Variable r p
Age - .18 .013
Social Sorority/Fraternity .18 .014
Residence—Off Campus in Apartment -.17 .020
Religious Organization .15 .032
Race—Hispanic -.14 .040
Race—African American .14 .046
Mother—Graduate Degree .13 .053
Father—Graduate Degree .13 .059
Residence—On Campus Ag Residential College .11 .088
Student Government Organization .11 .097
Mother—High School Completed - .09 .146
Residence—On Campus .09 .143
Father—High School Completed - .09 .140
Mother—Some College - .08 .158
Overall High School GPA .08 .168
Academic Fraternity .07 .196
Collegiate FFA/ 4-H - .07 .198
Race—Caucasian .06 .250
Father—Some College - .06 .249
Residence—Off Campus with Parents - .06 .240 (table continued)
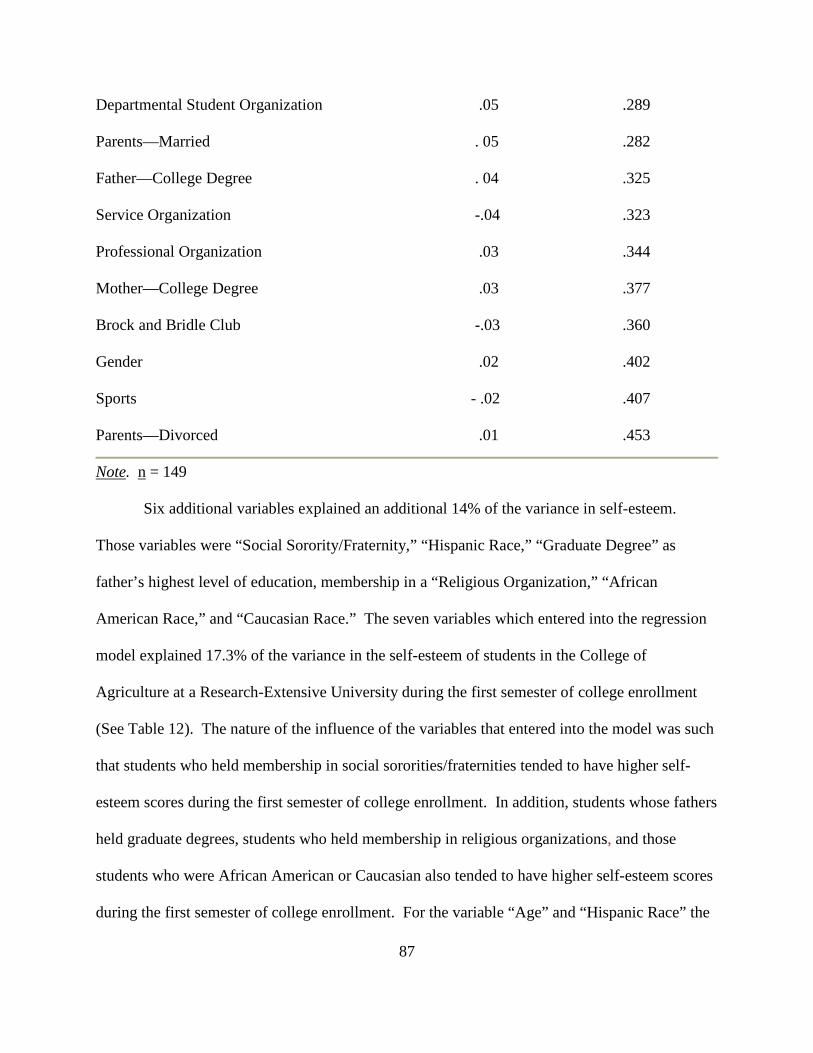
87
Departmental Student Organization .05 .289
Parents—Married . 05 .282
Father—College Degree . 04 .325
Service Organization -.04 .323
Professional Organization .03 .344
Mother—College Degree .03 .377
Brock and Bridle Club -.03 .360
Gender .02 .402
Sports - .02 .407
Parents—Divorced .01 .453
Note. n = 149 Six additional variables explained an additional 14% of the variance in self-esteem.
Those variables were “Social Sorority/Fraternity,” “Hispanic Race,” “Graduate Degree” as
father’s highest level of education, membership in a “Religious Organization,” “African
American Race,” and “Caucasian Race.” The seven variables which entered into the regression
model explained 17.3% of the variance in the self-esteem of students in the College of
Agriculture at a Research-Extensive University during the first semester of college enrollment
(See Table 12). The nature of the influence of the variables that entered into the model was such
that students who held membership in social sororities/fraternities tended to have higher self-
esteem scores during the first semester of college enrollment. In addition, students whose fathers
held graduate degrees, students who held membership in religious organizations, and those
students who were African American or Caucasian also tended to have higher self-esteem scores
during the first semester of college enrollment. For the variable “Age” and “Hispanic Race” the
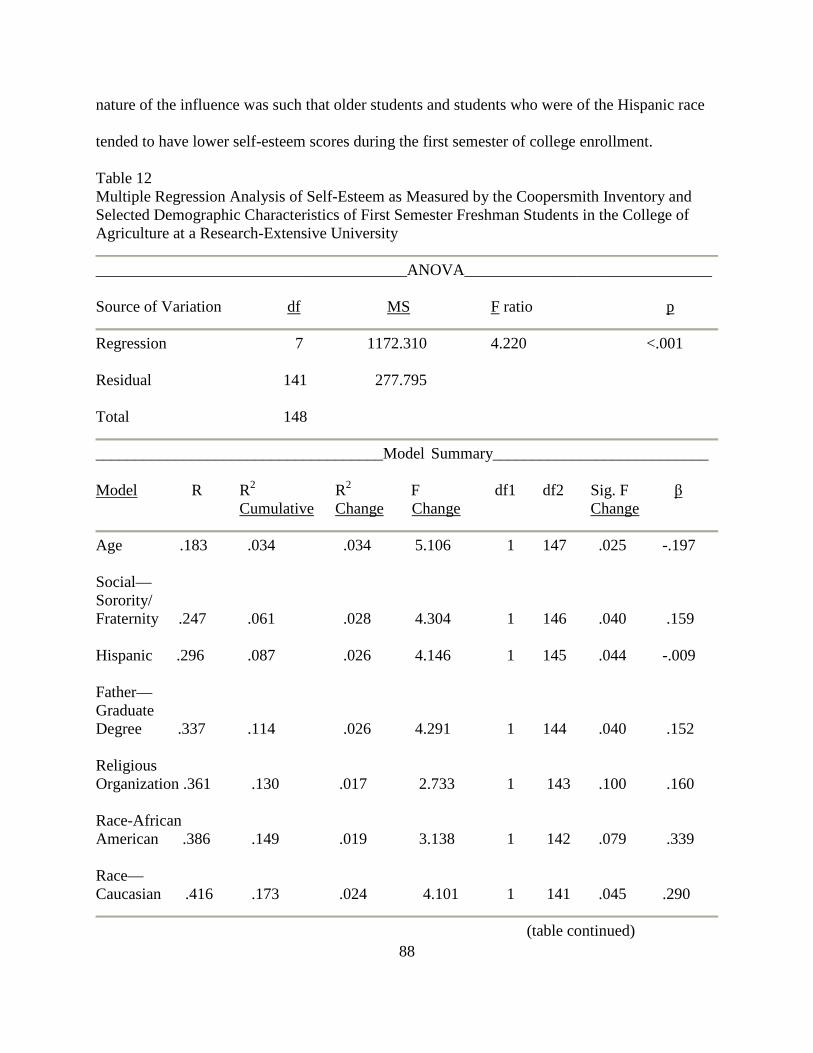
88
nature of the influence was such that older students and students who were of the Hispanic race
tended to have lower self-esteem scores during the first semester of college enrollment.
Table 12 Multiple Regression Analysis of Self-Esteem as Measured by the Coopersmith Inventory and Selected Demographic Characteristics of First Semester Freshman Students in the College of Agriculture at a Research-Extensive University
_______________________________________ANOVA_______________________________ Source of Variation df MS F ratio p
Regression 7 1172.310 4.220 <.001 Residual 141 277.795 Total 148
____________________________________Model Summary___________________________ Model R R2 R2 F df1 df2 Sig. F β Cumulative Change Change Change
Age .183 .034 .034 5.106 1 147 .025 -.197 Social— Sorority/ Fraternity .247 .061 .028 4.304 1 146 .040 .159 Hispanic .296 .087 .026 4.146 1 145 .044 -.009 Father— Graduate Degree .337 .114 .026 4.291 1 144 .040 .152 Religious Organization .361 .130 .017 2.733 1 143 .100 .160 Race-African American .386 .149 .019 3.138 1 142 .079 .339 Race— Caucasian .416 .173 .024 4.101 1 141 .045 .290
(table continued)

89
_________________________________Variables not in Equation_______________________ Variable t Sig. t
Father—High School -.394 .694 Father—Some College .059 .953 Father—College Degree .502 .617 Mother—High School -.288 .774 Mother—Some College -1.250 .213 Mother—College Degree .458 .647 Mother—Graduate Degree .998 .320 Parents—Married -.183 .855 Parents—Divorced .833 .406 Gender .094 .925 Residence—On Campus .813 .418 Residence—Ag Residential College .785 .434 Residence—Off Campus with Parent -.422 .673 Residence—Off Campus in Apartment -1.361 .176 Academic Fraternity .152 .879 Sports -.347 .729 Student Government Organization .824 .411 Departmental Student Organization .276 .783 Collegiate FFA/4-H -1.158 .249 Brock and Bridle Club - .173 .863 Service Organizations -1.273 .205 Professional Organizations .008 .994 High School Overall GPA -.233 .816
90
CHAPTER 5
SUMMARY OF FINDINGS, CONCLUSIONS AND RECOMMENDATIONS
Purpose and Objectives
The primary purpose of the study was to determine if a relationship existed between self-
esteem and academic achievement among students at the freshman level in the College of
Agriculture at a Research-Extensive University in the Southern Region of the United States. The
primary dependent variable in the study was academic achievement of students at the freshman
level in the College of Agriculture at a Research-Extensive University in the Southern Region of
the United States.
The following specific objectives were formulated to guide the research study:
1. Describe students at the freshman level in the College of Agriculture at a Research-
Extensive University in the Southern Region of the United States on the following
demographic characteristics:
a. Age;
b. Highest level of education completed by father;
c. Highest level of education completed by mother;
d, Marital status of parents;
e. Race;
f. Gender;
g. Place of residence during the first semester of college; and
h. Whether or not the student held membership in selected groups and organizations during the first semester of college.

91
2. Determine the self-esteem of students at the freshman level in the College of
Agriculture at a Research-Extensive University in the Southern Region of the
United States as measured by the Adult Form of the Coopersmith Inventory. 3. Describe students at the freshman level in the College of Agriculture at a Research-
Extensive University in the Southern Region of the United States on academic
achievement as measured by their first semester grade point averages. 4. Compare the self-esteem of students at the freshman level in the College of
Agriculture at a Research-Extensive University in the Southern Region of the United
States, as measured by the Adult Form of the Coopersmith Inventory, at the
beginning and the end of their first semester of college enrollment. 5. Determine if a relationship exists between academic achievement, as measured by
high school grade point average, and self-esteem, as measured by the Adult Form of
the Coopersmith Inventory at the beginning of the first semester of college
enrollment, among students at the freshman level in the College of Agriculture at a
Research-Extensive University in the Southern Region of the United States. 6. Determine if a relationship exists between self-esteem, as measured by the Adult
Form of the Coopersmith Inventory, at the beginning of the first semester of college
enrollment, and academic achievement, as measured by the first semester of college
grade point average, among students at the freshman level in the College of
Agriculture at a Research-Extensive University in the Southern Region of the United
States. 7. Determine if a model exists explaining a significant portion of the variability in their
academic achievement, as measured by the first semester grade point average, among
92
students at the freshman level in the College of Agriculture at a Research-Extensive
University from the following:
a. Self-esteem at the beginning of the semester;
b. Age;
c. Highest level of education completed by father;
d. Highest level of education completed by mother;
e. Marital status of parents;
f. Race;
g. Gender
h. Place of residence during the first semester of college; and
i. Whether or not the student held membership in selected groups and organizations during the first semester of college. 8. Determine if a model exists explaining a significant portion of the variability in their
self-esteem, as measured by the Adult Form of the Coopersmith Inventory, at the end
of the first semester of college enrollment of students at the freshman level in the
College of Agriculture at a Research-Extensive University, in the Southern Region of
the United States from the following:
a, Academic achievement as measured by overall high school grade point average b. Age;
c. Highest level of education completed by father;
d. Highest level of education completed by mother;
e. Marital status of parents;
f. Race;

93
g. Gender;
h. Place of residence during the first semester of college; and i. Whether or not the student held membership in selected groups and organizations during the first semester of college.
Summary of Methodology
The target population for the study was defined as all students at the freshman level at a
Research-Extensive University in the Southern Region of the United States. The students at the
freshman level were defined by the researcher as those students in their first semester of college
enrollment. The accessible population was defined by the researcher as all students at one
selected Research-Extensive University in the Southern Region of the United States enrolled in
the Introduction to Agriculture course which was a requirement for agriculture students at the
freshman level. There were 218 students in the accessible population. The sample was defined
as 100% of the accessible population. Thus, there were 218 students in the sample for the study.
A non-clinical consent form was completed by each student prior to the completion of the
three instruments used for the collection of data. The first instrument used was the Adult Form
of the Coopersmith Inventory. This instrument used for individuals over 15 years of age consists
of 25 items or statements to which the student responds “like me” or “unlike me” (Coopersmith,
1987, p.7). The statements are related to one’s attitude regarding self and are indicative of high
self-esteem or low self-esteem.
The second instrument was a researcher-designed questionnaire used to collect
demographic information including educational level of father, educational level of mother,
marital status of parents, place of residence during the first semester of college, and group
affiliation.
94
The third instrument was a recording form on which data from the Office of the
University Registrar was downloaded and stored. Initially, the researcher met with the Dean of
the College of Agriculture of the selected Research-Extensive University to request permission
to conduct the study using College of Agriculture students. The Associate Dean of the College
of Agriculture of the selected Research-Extensive University was also in attendance at the
meeting. Permission and approval to conduct the study were obtained from the Institutional
Review Board (IRB) of the selected institution. At the time of the administration of the
instruments the researcher commented to students that all information provided would be held in
the strictest of confidence, and that all forms would be in the researcher’s possession only and
stored in a secure place.
Objectives one, two, and three were descriptive in nature and were analyzed using
descriptive statistics. Means and standard deviations were used for variables that were measured
on an interval scale. Frequencies and percentages were used for variables that were measured on
a categorical scale.
The paired t-test was used to analyze the data to accomplish the fourth objective. The
variable self-esteem was measured on an interval scale. The paired t-test was used to compare
the self-esteem scores of students at the freshman level at the beginning and at the end of the first
semester of college enrollment. An á priori significance level of < .05 was used to determine if
the variables were significantly different.
Objective five sought to determine if a relationship existed between academic
achievement, as measured by high school grade point average, and self-esteem scores at the
beginning of the first semester of college. Objective six sought to determine if a relationship
existed between self-esteem scores at the beginning of the first semester of college and academic
95
achievement as measured by the first semester of college grade point average. Variables in both
objectives were measured on an interval scale. The Pearson Product Moment Correlation
Coefficients were calculated and interpretations of theses correlation coefficients were made
using the Davis’ descriptors of the degree of association (Davis, 1971). The descriptors include:
r = .01 - .09 negligible association
r = .10 - .29 low association
r = .30 - .49 moderate association
r = .50 - .69 substantial association
r > .70 strong association
Multiple regression analysis was used to accomplish objectives seven and eight of the
study. In objective seven the dependent variable was academic achievement as measured by the
first semester grade point average. This variable was measured on an interval scale. The
independent variables were entered as either continuous or dichotomous variables as appropriate.
In objective eight, the dependent variable was self-esteem, as measured by the Adult Form of the
Coopersmith Inventory, at the end of the first semester of college. This variable was measured
on an interval scale. The independent variables were again entered as either continuous or
dichotomous variables as appropriate.
Summary of Major Findings
Objective One
The first objective of the study sought to describe the students at the freshman level in the
College of Agriculture at a Research-Extensive University in the Southern Region of the United
States on selected demographic characteristics. The students were described according to the
following demographic characteristics:
96
a. Age;
b. Highest level of education completed by father;
c. Highest level of education completed by mother;
d. Marital status of parents;
e. Race;
f. Gender;
g. Place of residence during the first semester of college; and
h. Whether or not the student held membership in selected groups and organizations during the first semester of college
Findings for objective one indicated the age of respondents ranged from 17 to 23 years.
A majority of the students (n = 182, 83.5%) were 18 years of age. Seventeen (3.6%) of the
students were 17 years of age, while 26 (11.9%) of the respondents were 19 years of age. One
(0.5%) student was 20 years of age and one (0.5%) student was 23 years of age. The mean age
of the respondents was 18.59 years (SD = 0.54). A majority of the respondents were identified
as female (n = 172, 78.9%). Forty-six (21.1%) were identified as male. Similarly, a majority (n
= 108, 84.1%) of the students were identified as White/NonHispanic, while 17 (8.0%) of the
students were identified as Black/NonHispanic, and 14 (6.5%) of the students were identified as
Hispanic. Two (0.9%) of the students identified themselves as Asian. A majority of the students
(n = 132, 70.6%) indicated their parents were married. Thirty-seven (19.8%) of the respondents
reported their parents to be divorced.
Regarding the highest level of education completed by parents, 58 (31.2%) of the
students indicated their fathers had completed college, while 39 (21.0%) respondents indicated
their fathers had graduate degrees. Eighty-five (45.2%) of the students reported their mothers
had graduated from college, and 37 (19.7%) indicated their mothers had graduate degrees.
97
In reference to the place of residence during the first semester of college, of the 188
respondents, 32.4% (n = 61) of the students reported they lived on campus. In addition, 30.3%
(n = 57) of the students reported living in the Agricultural Residential College Hall. Twenty
(10.6%) of the students reported they lived off campus with their parents, while 50 (26.2%)
indicated they lived off campus in an apartment or similar living arrangement.
At the pretest measurement point of the first semester of college enrollment, 33.0%
(n = 62) of the students indicated membership in social sororities/fraternities. Service
organizations were indicated as the organizations with the second largest membership (n = 54,
28.7%). Seventeen (9.0%) of the students indicated they held membership in Collegiate FFA/4-
H, and 16 students (8.5%) reported they were members of the Brock and Bridle Club. The
organization reported to have the least participation was a university publication (n = 1, 0.5%).
Objective Two
This objective was to determine the self-esteem of students at the freshman level in the
College of Agriculture at a Research-Extensive University in the Southern Region of the United
States as measured by the Adult Form of the Coopersmith Inventory. The pretest measurement
was made at the beginning of the semester and the posttest measurement was made at the end of
the first semester of college enrollment. The pretest measurement scores ranged from the highest
value of 96.0 to the lowest value of 24.0. The mean score for self-esteem at the pretest
measurement was 70.43 (SD = 17.64). At the posttest measurement at the end of the first
semester of college, the mean self-esteem score was 73.33 (18.08). The highest value recorded
was 100.0, while the lowest value was 24.0. Normative data for each of the data collection
points were established by specifying the highest quartile of scores as high self-esteem, the
lowest quartile as low self-esteem, and the middle two quartiles as moderate self-esteem. At the

98
pretest measurement high self-esteem (75th percentile or higher) raw scores ranged from 84 to
100. Moderate self-esteem (26th-74th percentile) raw scores ranged from 61to 83, and low self-
esteem (25th percentile or lower) were 60 or lower. The same normative data were used at the
posttest measurement at the end of the semester. At the pretest measurement, the largest number
of students (n = 80, 42.6%) had scores within the moderate range. At the posttest measurement,
again the largest number of students (n = 65, 39.9%) had scores within the moderate range.
Objective Three
Objective three of the study was to describe the students at the freshman level in the
College of Agriculture at a Research-Extensive University in the Southern Region of the
United States on academic achievement as measured by their first semester grade point
averages. First semester grade point averages ranged from 0.0 to 4.0. The mean grade
point average was 2.71 (SD = 0.80). Thirty-seven (17.2%) students had grade point averages
ranging from 3.6 to 4.0, while seven students (3.3%) had grade point averages which ranged
from 0.0 to 1.0.
Objective Four
The fourth objective of the study was to compare the self-esteem of students at the
freshman level in the College of Agriculture at a Research-Extensive University in the
Southern Region of the United States, as measured by the Adult Form of the Coopersmith
Inventory, at the beginning and the end of the first semester of college. There was a significant
difference between the self-esteem scores at the pretest and posttest measurement (t 150 = 3.508
p = .001). The mean self-esteem score at the end of the semester (M = 74.15, SD = 18.08) was
significantly higher than the mean self-esteem score at the beginning of the semester (M = 70.99,
SD = 17.48).
99
Objective Five
Objective five of the study was to determine if a relationship existed between academic
achievement, as measured by high school grade point average, and self-esteem, as measured by
the Adult Form of the Coopersmith Inventory at the beginning of the first semester of college
enrollment, among students at the freshman level in the College of Agriculture at a Research-
Extensive University in the Southern Region of the United States. No significant correlation
was found between the overall high school grade point average and the self-esteem scores of
students at the beginning of the first semester of college (r = .123, p = .091). In addition, no
significant correlation was found between the high school honors grade point average and
the self-esteem scores of students at the beginning of the first semester of college (r = .112,
p = .126).
Objective Six
The sixth objective of the study was to determine if a relationship existed between
self-esteem, as measured by the Adult Form of the Coopersmith Inventory at the beginning
of the first semester of college, and academic achievement, as measured by the first semester
grade point average, among students at the freshman level in the College of Agriculture at a
Research-Extensive University in the Southern Region of the United States. The computed
coefficient revealed no significant correlation between the self-esteem scores at the beginning
of the first semester of college and the first semester grade point average of students (r = .081,
p = .266).
Objective Seven
Objective seven sought to determine if a model existed explaining a significant portion of
the variability in their academic achievement, as measured by the first semester grade point

100
average among students at the freshman level in the College of Agriculture at a Research
University in the Southern Region of the United States from the following:
a. Self-esteem at the beginning of the semester;
b. Age;
c. Highest level of education completed by father;
d. Highest level of education completed by mother;
e. Marital status of parents;
f. Race;
g. Gender;
h. Place of residence during the first semester of college; and
i. Whether or not the student held membership in selected groups and organizations during the first semester of college.
Utilizing multiple regression analysis the first variable which entered the model was
“Departmental Student Organization.” Considered alone, this variable explained 3.9% of the
variance in academic achievement. Three additional variables explained an additional 6% of the
variance in academic achievement. Those variables were “Graduate Degree” as father’s highest
level of education, “Member Service Organization,” and “Sports.” The four variables which
entered the regression model explained 9.9% of the variance in academic achievement. The
nature of the influence of the variables that entered the model was such that students who held
membership in student organizations tended to have higher grade point averages during the first
semester of college. In addition, students whose fathers held graduate degrees and those
involved in service organizations also tended to have higher grade point averages during the first
semester of college enrollment. Participation in sports, however, had a negative influence on
101
academic achievement. The nature of the influence was such that students who participated in
sports tended to have lower grade point averages.
Objective Eight
The eighth objective sought to determine if a model existed explaining a significant
portion of the variability in their self-esteem, as measured by the Adult Form of the Coopersmith
Inventory, at the end of the first semester of college enrollment among students at the freshman
level of the College of Agriculture at a Research-Extensive University from the following:
a. Academic achievement as measured by overall high school grade point average;
b. Age;
c. Highest level of education completed by father;
d. Highest level of education completed by mother;
e. Marital status of parents;
f. Race;
g. Gender;
h. Place of residence during the first semester of college; and
i. Whether or not the student held membership in selected groups and organizations during the first semester of college.
The first variable to enter the model utilizing multiple regression analysis was “Age.”
This variable considered alone explained 3.3% of the variance in the self-esteem of students
during the first semester of college. Six additional variables explain an additional 14% of the
variance in self-esteem. Those variables were “Social Sororities/Fraternities,” “Hispanic Race,”
“Graduate Degree” as father’s highest level of education, membership in a “Religious
Organization,” “African Race,” and “Caucasian Race.” The seven variables which entered into
102
the regression model explained 17.3% of the variance in the self-esteem of students. The nature
of the influence of the variables that entered into the model was such that students who held
membership in social sororities/fraternities tended to have higher self-esteem scores during the
first semester of college. In addition, students whose fathers held graduate degrees, students who
held membership in religious organizations, and those students who were African American or
Caucasian also tended to have higher self-esteem scores during the first semester of college. For
the variable “Age” and “Hispanic Race” the nature of the influence was such that older students
and students who were of the Hispanic Race tended to have lower self-esteem during the first
semester of college.
Conclusions and Recommendations
Based on the findings of the study, the researcher presents the following conclusions and
recommendations:
Conclusion One
A majority of the students were Caucasian.
This conclusion is based on the findings that 84.1% (n = 180) of the students were
identified as White/Non-Hispanic. These findings are consistent with findings of Dyer et al.
(1999) in their study of freshmen students in the College of Agriculture at Iowa State University
regarding the racial composition of this group. The findings are also consistent with those of
Bettencourt et al. (1999), in which 77% of first year, first-semester students were White. In this
study 19% of the participants were Black, while 2% of the students were Hispanic and 2% were
Asian/Asian American (Bettencourt et al., 1999).
This researcher considers the findings to have implications regarding the recruitment of
minority students to colleges of agriculture. The findings speak to all institutions of higher
103
learning. The racial composition of students at the freshman level in the present study is not
reflective of the diverse groups of people living in the United States today. According to
estimates released by the United States Census Bureau, the nation’s Hispanic and Asian
populations continue to grow at much faster rates than the population as a whole. The
population of Hispanics who may or may not be White accounted for approximately one-half of
the 9.4 million residents added to the nation’s population since the 2000 Census (United States
Census Bureau, 2009). The Non-Hispanic White population is to increase by 7% between 2000
and 2050, with the group projected to lose population in the 2040s. The Black population is
projected to rise from 35.8 million to 61.4 million by 2050, a 71% increase (United States
Census Bureau, 2009). The diversity of groups within colleges of agriculture and all institutions
of higher learning should be consistent with those of the present society and beyond. The
institutions of higher learning provide the environments for the preparation of students to work
and function in a society representative of many groups.
The researcher recommends the colleges of agriculture at research-extensive universities
conduct further study regarding the racial composition of the students and why minority students
enter colleges of agriculture at the freshman level. A qualitative research study could be
conducted in which focused interviews would be used to obtain data from minority students
regarding their perceptions of their experiences during the recruitment process, admission
procedures, and orientation to the institution. Information could be gathered from these students
regarding their academic experiences and social adjustment during the first semester of college
enrollment. Findings of such a study could be used by the recruitment office of the College of
Agriculture and of the university, as well as the office of admissions and the office of diversity or
minority affairs for the strategic planning of efforts to establish more effective recruitment
104
functions to attract minority students to the College of Agriculture, and the university at large.
Findings would also serve the efforts of programs to enhance experiences which elicit more
positive responses to the first semester of college.
Conclusion Two
A majority of the students at the freshman level were female.
This conclusion is based on the finding that 172 (78.9%) of the students at the freshman
level in the College of Agriculture was identified as female. This finding is inconsistent with the
study of Son (1975) involving first term freshmen in which the sample of 322 entering freshmen
consisted of 68 females and 254 males. It is, however, consistent with findings of Dyer et al.
(1999) in which 76.1% of the respondents disagreed that agriculture courses in college were
better suited to male students. These findings have implications for agricultural education which
has been traditionally male at the secondary and post secondary levels. This situation continues
to change as more females become interested in pursuing a college degree in the field of
agriculture and assume leadership roles in the agricultural industry.
This researcher recommends that the College of Agriculture at the Research-Extensive
University where the present study was conducted initiate further research that would involve
the identification of specific majors to determine the extent to which gender progress has been
made in nontraditional area majors. For example the study could gather data to determine if
real progress has been made in a major such as animal science. If the follow-up study finds a
substantial increase in enrollment of females in this major, then the question becomes what
has brought about progress in recruitment of females into nontraditional majors.
Conclusion Three
A majority of the students came from homes with a traditional family structure.
105
This conclusion is based on the findings that 132 (70.6%) of the students indicated their
parents were married. These findings are consistent with the historically traditional farm family
and earlier studies regarding traditional families in rural settings. In a study of the influence of
self-esteem on academic achievement of rural ninth grade students at one rural high school in
Louisiana (Gaspard & Burnett, 1991) 83.3% (n = 55) of the respondents indicated their
traditional family unit was intact. Twelve percent (n = 8) of the students indicated they were
from homes where the parents were divorced.
The findings are, however, inconsistent with comments of Broido (2004) that there has
been a change in the family structures in which the Millenial generation has been reared. These
students, more than any other generation, have come from single-parent homes, as well as
blended families and stepfamilies.
Conclusion Four
Freshman students in the College of Agriculture had a moderate level of self-esteem.
This conclusion is based on the findings that at the pretest measurement most of the
students (n = 80, 46.2%) had self-esteem scores between the 26th and 74th percentile or raw
scores from 61 to 83. At the posttest measurement most of the students (n = 65, 39.9%) had self-
esteem scores between the 26th and 74th percentile or scores ranging from 61 to 83. Although the
overall mean scores at the pretest measurement (M =70.43, SD = 17.64) and the posttest
measurement (M = 73.33, SD = 18.08) were in the moderate self-esteem range, it should be
noted that these mean scores were above the 50th percentile, and the comparative groups in the
normative sample had a mean score of 66.70 (SD = 19.20) (Coopersmith, 1987, p. 19). These
findings were consistent with those of Gaspard and Burnett (1991) when they studied the
influence of self-esteem on academic achievement of ninth grade students in a rural high school.
106
In their study the School Form of the Coopersmith Inventory was used. This instrument
consisted of the subscales General self-esteem, Social-peers, Home-parents, and School-
achievement. A Total self-esteem score was reported by totaling all of the four subscales and
multiplying the total by two. The largest group of students in the study had scores of moderate
levels on all subscales of the instrument (General self-esteem--43.9%; Social-peers--46.9%;
Home-parents--45.4%; School-achievement--50%; and Total--48.4%).
Conclusion Five
Students’ self-esteem increased from the beginning to the end of their first semester of
college.
This conclusion is based on the finding that there was a significant difference in the self-
esteem scores at the pretest and posttest measurement (t 150 = 3.508, p = .001). The mean self-
esteem score of freshman students was 70.99 (SD = 17.48) at the pretest measurement and 74.15
(SD = 18.08) at the posttest measurement. An increase in self-esteem scores of freshman
students from the pretest measurement to the posttest measurement in the present study is
relevant for the period of development from late adolescence to early adulthood, the period
which coincides with college attendance. A time of change and exploration, it marks movement
from parental dependence to individual independence and expectations. This time can be a
period that is marked by a decline in self-esteem which is also relevant as one considers those
experiences and expectations of the first semester of college and the influence on academic
achievement, retention, and graduation from a college or university.
This researcher recommends that researchers in higher education identify factors which
promote higher levels of an authentic and healthy self-esteem as they seek to prepare students for
leadership positions in their careers of choice. The studies could include the use of instruments
107
which gather data regarding context related variables which relate specifically to the college
environment. The researcher further recommends that the findings be used by college
administrators to implement programs that will enhance students’ self-esteem as they function in
the college setting. For example, social events such as picnics on the president’s lawn, activities
fostering interpersonal skills among freshmen, and activities consistent with the freshman year
experience can enhance the personal and collective self-esteem of students, giving them a sense
of belonging and closeness to fellow members of the freshman class which may grow throughout
the college years and beyond.
Conclusion Six
Among students in this study there is no relationship between self-esteem and academic
achievement.
This conclusion is based on the findings that no significant correlation was found
between the overall high school grade point average and the self-esteem scores of students at the
beginning of the first semester of college (r = .123, p = .091). In addition, no significant
correlation was found between the high school honors grade point average and the self-esteem
scores of students at the beginning of the first semester of college (r = .112, p = .126). The
conclusion is also based on the finding that the computed coefficient revealed no significant
correlation between self-esteem scores at the beginning of the first semester of college and the
first semester grade point average of students (r = .081, p = .266).
These findings are inconsistent with the findings of Gaspard (1994) which sought to
determine if a relationship existed between academic achievement as measured by end-of-the-
year grade point average and subsequent year self-esteem as measured by the School Form of the
Coopersmith Inventory in a study of rural high school students. The Coopersmith Inventory had
108
subscales General self-esteem, School-achievement, Home-parents, Social-peers, and Total self-
esteem. The self-esteem measure that was found to have the highest association with academic
achievement was the School subscore (r = .38, p = .007). This relationship was classified as a
moderate degree of association using descriptors developed by Davis (1971). The nature of the
association was such that students having higher grade point averages at the end of the 9th grade
had higher School self-esteem scores at the 10th grade collection point. Data collected at the
second data collection point (grade 10 end-of-the-year grade point average and grade 11 self-
esteem subscores) revealed a relationship between academic achievement and self-esteem
(r = .39, p = .018). The relationship was classified as a moderate degree of association. The
nature of the association was such that respondents who had higher grade point averages tended
to have higher School self-esteem scores. At the third data collection point (grade 11 end-of-the-
year grade point average and grade 12 self-esteem measures) the School score was found to be
correlated with academic achievement. This association was a moderate positive relationship (r
= .46, p = .004). The nature of the relationship was such that those students who had higher
grade point averages tended to have higher School self-esteem scores.
The finding that there was no significant relationship between self-esteem and academic
achievement during the first semester of college is consistent with findings of Bettencourt et al.
(1999) which showed an increase in personal self-esteem to be associated with social and
academic adjustment but not with grade point average. While there was no relationship between
self-esteem and academic achievement in the present findings, there are implications regarding
instrumentation and its use in the measurement of the variable self-esteem. The measurement of
self-esteem with the use of the Adult Form of the Coopersmith Inventory for individuals 16 years
and above was a more global measurement in the present study. The Student Form of the
109
Coopersmith Inventory is used with students 15 years and under and has subscales for the
measurement of self-attitudes in the areas of personal interests, peers, parents, and school
(Coopersmith, 1987). This researcher recommends the development of an instrument to measure
self-attitudes regarding constructs specific to the college student. This instrument would serve
the function of measuring self-esteem for this intermittent stage in the lives of many young
people. It would measure self-esteem as it relates to those aspects of the college years which
involve work, additional family responsibilities, and other experiences which become paramount
to individuals in this setting. Other instruments have been used in the college setting. One such
instrument, the Contingencies of Self-Worth Scale (CSW-65), measures the contingencies or
criteria on which individuals base their worthiness (Crocker, 2002). Some of the contingencies
measured are internal, while others are external and require validation from others. The
instrument has been used to measure the pursuit of self-esteem rather than the level of self-
esteem. This researcher recommends the development of an instrument that would include
subscales that address the measurement of the level of self-esteem and its influence on variables
in various domains of daily activities of college students including academics, social activities,
and personal responsibilities such as work and family.
These findings also lead the researcher to recommend that the College of Agriculture at
the Research-Extensive University and all colleges of agriculture further study those variables
which do impact academic achievement. A qualitative study could be conducted in which
personal interviews of first semester freshmen would be used to gather information regarding
students’ perceptions of and attitudes toward existing programs which facilitate adjustment to the
college environment. Academic counselors could benefit from findings of such studies as they
advise students regarding semester courses and plan and implement academic tutoring for those
110
students in need of additional instructional opportunities and assistance. Such information as the
student’s involvement in work-related activities can be used in scheduling academic tutoring.
Information can also be used in the development of mentoring programs involving upper class
students as mentors and tutors within the College of Agriculture.
Conclusion Seven
Participation in extracurricular activities had an influence on academic achievement of
college freshmen.
This conclusion is based on the findings that participation in departmental student
organizations explained 3.9% of the variance in academic achievement. Two additional
participation variables membership in service organizations (R2 change = .021) and participation
in sports (R2 change = .012) explained an additional 3.3% of the variance. The nature of the
influence of the variables that entered the model was such that students who held membership in
service organizations tended to have higher grade point averages during the first semester of
college. However, participation in sports had a negative influence on academic achievement.
The nature of the influence was such that students who participated in sports tended to have
lower grade point averages.
These findings are consistent with those of Bettencourt et al. (1999) in which results of
their study led them to suggest academic practitioners should recognize the capacity of group
memberships to positively influence adjustment in the college context. Findings regarding the
conclusion of the present study would imply that students should be encouraged to participate in
departmental student organizations as well as service organizations as they enter the first
semester of college enrollment. The variables “Departmental Student Organization” and
“Service Organization” entered the regression model explaining a significant portion of the

111
variance in academic achievement. This finding also follows the intent of Ball et al. (2001) who
were interested in studying the influence of the involvement in the agricultural youth
organizations 4-H and FFA on academic performance and retention of freshmen in the college of
agriculture at the university involved in their research. The researchers determined participation
in the agricultural youth organizations at the secondary level positively influenced academic
achievement of freshmen students. In addition, participation in agricultural youth organizations
was found to have a significant association with retention for the sophomore year (Ball et al.,
2001). These findings have implications regarding the present study of freshmen students in the
College of Agriculture. This researcher recommends that the College of Agriculture at the
Research-Extensive University involved in the study further investigate participation in
agricultural student organizations on campus. Students could be surveyed to determine their
extent of involvement in these organizations, including their goals for participation. Data
gathered in such a study could be used by faculty advisors in further expansion of the programs
and in developing future vision and goals for the organizations.
Conclusion Eight
Demographics had an influence on the self-esteem of college freshmen.
This conclusion is based on findings that age explained 3.3% of the variance in the
self-esteem of students during the first semester of college. Four additional demographic
variables explained 9.5% of the variance in self-esteem. Those variables were “Hispanic Race”
(R2 change = .026), “Graduate Degree” as father’s highest level of education (R2 change = .026),
“African American Race” (R2 change = .019), and “Caucasian Race” (R2 change = .024).
Students whose fathers held graduate degrees and those students who were African American or
Caucasian tended to have higher self-esteem scores during the first semester of college. For the
112
variable “Age” and “Hispanic Race” the nature of the influence was such that older students and
students who were of the Hispanic Race tended to have lower self-esteem during the first
semester of college.
The finding that the nature of the influence of age was such that older students tended to
have lower self-esteem during the first semester of college has implications in view of comments
of Arnett (2000) regarding what he described as emerging adulthood. He (Arnett, 2000)
considered emerging adulthood a time of identity exploration and involving trying various life
possibilities, gradually making more enduring decisions. A period of development that coincides
with college attendance, one’s college education may often be combined with work, family
responsibilities, and in some cases may be punctuated with periods of nonattendance.
The finding that the nature of the influence of the variable “Graduate Degree of Father”
was such that those students whose fathers with graduate degrees had higher levels of self-
esteem implies that these students may have more parental support in the form of knowledge of
expectations regarding the first year of college enrollment and guidance during the admissions
process. This educational level of the father may also contribute to an economic status that
enhances the access of educational opportunity. Both may facilitate adjustment to the demands
of the college setting and foster the perception of well-being.
All of the analyzed variables of race entered the regression model. The finding that the
nature of the influence of Hispanic Race was such that students of Hispanic Race tended to have
lower self-esteem during the first semester of college also has implications when considering
self-esteem of students at the freshman level. When one considers that the Hispanic student may
be an immigrant or the child of immigrants whose level of English language skills may differ
from other freshmen students, there is an emphasis on the demographic shifts evident in the

113
generation now enrolled in universities (Briodo, 1999). While the number of Hispanic students
in higher education is increasing, they are more likely to be the first in their families to attend
college (Terenzini, 1996).
The nature of the influence of African American Race was such that students who were
African American tended to have higher self-esteem during the first semester of college. This
finding has implications for colleges and universities in a society in which the demographic
profile of students continues to change. Crocker et al. (1994) in their study of collective self-
esteem considered that Black students may exhibit public expressions of self-esteem that are
reactions to their heritage of prejudice and discrimination. Higher levels of self-esteem among
Caucasian students were consistent with the predominance of literature that addresses this issue.
The nature of the association of the different views of diversity and social justice issues become
more prevalent considerations for colleges and universities.
This researcher recommends that the College of Agriculture of the Research-Extensive
University of the present study address these concerns as they apply to agricultural education at
both the secondary and postsecondary levels. This may include a study of agriculture teachers at
the secondary level and a collection of their perceptions and considerations of Hispanic students
as they enter school systems within the United States. Secondary students have indicated their
agriculture teachers to be the most influential source in their decisions to pursue college degrees
(Dyer et al., 1999). This accentuates the bond which could be cultivated leading to an interest in
and about agriculture and ultimately a positive educational experience at the postsecondary level.
Beyond the college classroom there would be implications for employment and leadership in the
agricultural industry for a diverse group of individuals in the present generation.
114
REFERENCES
About ACT: History. (n.d.) Retrieved October 11, 2009, from http://www.act.org/aboutact/ history.html ACT at 50—A mission in progress. (Autumn, 2009). Activity. Retrieved October 11, 2009, from http://ww.act.org/activity/autumn2009/anniversary.html Alexandratos, N. (1999). World food and agriculture: Outlook for the medium and long term. Proceedings of the National Academy of Sciences, USA, 96, 5908-5914.
Arnett, J. J. (2000). Emerging adulthood: A theory of development from the late teens
through the twenties. American Psychologist, 55(5), 469-480. Ary, D., Jacobs, L. C., & Razavieh, A. (2002). Introduction to research in education (6th ed.). Belmont, CA: Wadsworth/Thomas Learning. Ball, A. L., Garton, B. L., & Dyer, J. E. (2001). The influence of learning communities and 4-H/FFA participation on college of agriculture students’ academic performance and retention. Journal of Agricultural Education, 42(4), 54-62. Baum, C. L. (2004). The long-term effects of early and recent maternal employment on a child’s academic achievement. Journal of Family Issues, 25(1), 29-60. Baumrind, D. (1971). Current patterns of parental authority. Developmental Psychology Monograph, 4(1), 1-103. Beane, J. A. (1991). Sorting out the self-esteem controversy. Educational Leadership,49(1), 25-30. Bennett, R. E., & Gitomer, D. H. (2009). Transforming K-12 assessment: Integrating Accountability testing, formative assessment and professional support. In C. Wyatt-Smith & J. J. Cumming (Eds.). Educational Assessment in the 21st Century (pp. 43-61). doi 10. 1007/978-1-4020-9964-9_3 Bettencourt, B. A., Charlton, K., Eubanks, J., Kernahan, C., & Fuller, B. (1999). Development of collective self-esteem among students: Predicting adjustment to college. Basic and Applied Social Psychology, 21(3), 213-222. Bird, G. W., & Ikerd, J. (1993). Sustainable agriculture: A twenty-first century system. ANNALS of the American Academy of Political and Social Science, 539, 92-102.
Branden, N (1994). The six pillars of self-esteem. New York: Bantam Books.

115
Branden, N. (1997). Article adapted from The Art of Living Consciously. New York: Simon & Schuster, retrieved October 8, 2008, from
http://www.nathanielbranden/com/catalog/pdf/what self-esteem.pdf
Branden, N (1994). The six pillars of self-esteem. New York: Bantam Books. Broido, E. M. (2004). Understanding diversity in millennial students. New Directions for Student Services, 106, 73-85. Brown, B. B., & Lohr, M. J. (1987). Peer group affiliation and adolescent self-esteem: An integration of ego identity and symbolic interaction theories. Journal of Personality and Social psychology, 52(1), 47-55. Burd, S. (2001). Lack of need-based financial aid still impedes access to college for low- income students, report finds. The Chronicle in Higher Education, 47(25), p. 26. Camara, W. J., & Echternacht, G. (2000). The SAT I and high school grades: Utility in predicting success in college (Report No. CB-RN-10). New York: College Entrance Examination Board. Center for Rural Affairs. (2009). Beginning farmer and rancher opportunities. Retrieved
January 26, 2009, from http://www.cfra.org/resource/beginning_farmer
Coopersmith, S. (1959). A method of determining types of self-esteem. The Journal of Abnormal and Social Psychology, 59(10), 87-94. Coopersmith, S. (1981). The antecedents of self-esteem. Palo Alto, CA: Consulting Psychologists Press, Inc. Coopersmith, S. (1987). SEI: Self-esteem inventories. Palo Alto: CA: Consulting Psychologists Press, Inc. Crocker, J. (2002). The costs of seeking self-esteem. Journal of Social Issues, 58(3), 597-615. Crocker, A. C., & Cheeseman, R. G. (1988). The ability of young children to rank themselves for academic ability. Educational Studies, 14(1), 105-110. Crocker, J., Luhtanen, R., Blaine, B., & Broadnax, S. (1994). Collective self-esteem and psychological well-being among white, black, and Asian college students. Personality and Social Psychology Bulletin, 20(5), 503-513. Crocker, J., & Wolfe, C. T. (2001). Contingencies of self-worth. Psychological Review, 108(3), 593-623. Davis, J. A. (1971). Elementary survey analysis. Englewood Cliffs, N J: Prentice Hall.
116
Diamond, J. (1998). Guns, germs, and steel: The fates of human societies. New York: W. W. Horton & Company.
Dornbusch, S. (2002). Transitions from adolescence: A discussion of seven articles. Journal of Adolescent Research, 15(1), 173-177. Dornbush, S., Ritter, P. L., Leiderman, P. H., Roberts, D. E., & Farleigh, M. J. (1987). The
relationship of parenting style to adolescent school performance. Child Development, 58(5), 1244-1257.
Duckworth, A. L., & Seligman, M. E. P. (2005). Self-discipline outdoes I Q in predicting
academic performance of adolescents. Psychological Science, 16(12), 939-944.
Dyer, J. E., Breja, L. M., & Andreasen, R. J. (1999). Attitudes of college of agriculture freshmen toward agriculture. Journal of Agricultural Education, 40(2), 1-9. Ediger, M. (2003). Philosophy and measurement of school achievement. Journal of
Instructional Psychology, 30(3), 231-236. Egan, T. (1991, January 9). Apple growers bruised and bitter after alar scare. The New York
Times, Retrieved November 12, 2007, from http://query.nytimes.com/gst/ fullpage.html?res=9DOCE7DB163BF93AA35754C0A9679
Elam, C., Stratton, T., & Gibson, E. G. (2007). Welcoming a new generation to college: The millennial students. The Journal of College Admission, 195, 21-25. Facts about American Agriculture. (n. d.). Utah Agricultural Education Home Page.
Retrieved October 14, 2007, from http://www.usoe.k12.ut.us/ate/Ag/agr/facts.html Fleming, J. S., & Courtney, B. E. (1984). The dimensionality of self-esteem: II. Hierarchical facet model for revised measurement scales. Journal of Personality and Social Psychology, 46(2), 404-421. Fleming, J. S., & Watts, W. A. (1980). The dimensionality of self-esteem: Some results for a college sample. Journal of Personality and Social Psychology, 39(5), 921-929. Gallagher, C. J. (2003). Reconciling a tradition of testing with a new learning paradigm. Educational psychology Review, 15(1), 83-99. Gaspard, M. B. (1994). The relationship between self-esteem and academic achievement of rural high school students. Unpublished master’s thesis, Louisiana State University, Baton Rouge, Louisiana. Gaspard, M. R., & Burnett, M. F. (1991). The relationship between self-esteem and academic achievement of rural ninth grade students. Journal of Rural and Small Schools, 4(3), 2-9.
117
Granton, B. L., Ball, A. L., & Dyer, J. E. (2002). The academic performance and retention of college of agriculture students. Journal of Agricultural Education, 43(1), 46-55. Greenberger, E., & Goldberg, W. A. (1989). Work, parenting, and the socialization of children. Developmental Psychology, 25(1), 22-35. Hair, J. F., Anderson, R. E., Tatham, R. L., & Blacke, W. C. (1998). Multivariate
analysis (5th ed.). Upper Saddle River, NJ: Prentice-Hall. Hall, G. S. (1924). Adolescence: Its psychology and its relations to physiology, anthropology, sociology, sex, crime, religion and education (Vol. 1). New York: D. Appleton and
Company. Hickman, G. P., Bartholomae, S., & McKenry, P. C. (2000). Influence of parenting styles on the adjustment and academic achievement of traditional college freshmen. Journal of College Student Development, 41(1), 41-54. Hinkle, D. D., Wiersma, W., & Jurs, S. G. (2003). Applied statistics for the
behavioral sciences (5th ed.). Boston: Houghton Mifflin Company.
Hoffman, L. W. (1989). Effects of maternal employment in the two-parent family. American Psychologist, 44(2), 283-292. Howe, N., & Strauss, W. (2000). Millenials rising: The next great generation. New York: Vintage Books. Howell, M. C. (1973). Effects of maternal employment on the child (II). Pediatrics, 52 (3), 327-343. Jalonick, M. C. (2007, October 15). Farm disaster program draws foes. The Advocate, A7.
James, W. (1890). The principles of psychology. New York: Henry Hall and Company. Johnson, B. W., Redfield, D. L., Miller, R. L., & Simpson, R. E. (1983). The
Coopersmith self-esteem inventory: A construct validation study. Educational and Psychological Measurement, 43(3), 907-913. Kadison, R. (2006). College psychiatry 2006: Challenges and opportunities. Journal of
American College Health, 54(6), 338-340. Katz, L. G. (1993). Distinctions between self-esteem and narcissism: Implications for practice. Retrieved November 1, 2008, from http://ceep.crc.uiuc.edu/eecearchive/ books/selfe/intro.html Klein, H. A. (1992). Temperament and self-esteem in adolescence. Adolescence, 27, 689-694.
118
Kuhn, D. (2007). How to produce a high-achieving child. Phi Delta Kappan, 88(10), 757-764. Lawrence, I. M., Rigol, G. W., Essen, T.V., & Jackson, C. A. (2003). A historical perspective on the content of the SAT (College Board Research Report No. 2003-3 ETS RR-03-10). New York: College Entrance Examination Board. Lockhart, M. L. (2007, October 1). Local flavor. The Riverside Reader, p. 1.
Louisiana State University. (2007). The General Catalog, 99(1), 93-112.
Lutta, J. M. (2008). Factors that influence traditional-age college students to re-enroll in their
third year at a research extensive university in the southern region of the United States. Unpublished doctoral dissertation, Louisiana States University, Baton Rouge.
Marchant, G. (2004). What is at stake with high stakes testing? A discussion of issues and research. The Ohio Journal of Science, 104(2), 2-7. Markus, H. R., & Kitayama, S. (1991). Culture and the self: Implications for cognition, emotion, and motivation. Psychological Review, 98(2), 224-253. Marsh, W. M., & Shavelson, R. (1985). Self-concept: Its multifaceted, hierarchical structure. Educational Psychologist, 20(3), 107-123. Maslow, A. H. (1954). Motivation and personality. New York: Harper & Brothers. Mayer, A., & Mayer, J. (1974). Agriculture, the island empire. DAEDALUS Journal of the Academy of Arts and Sciences, 103(30), 83-95.
McCauley, C. D., & VanVelsor, E. (Eds.). (2004). The center for creative leadership handbook of leadership development (2nd ed.). San Francisco: Jossey-Bass. Mead, G. H. (1934). Mind, self, and society. Chicago: University of Chicago Press. Mental Measurements Yearbook. Coopersmith self-esteem inventories (n.d.). Retrieved
November 8, 2007, from http://web.ebcohost.com.libezp.lib.lsu/ehost/ detail?vid=3&hid=104&sid=1043e01c-4
Merritt, R. D. (2008). Grade point averages. Research Starters Education. Retrieved April 7, 2009, from http://web.ebscohost.com/ehost/delivery?vid=8&hie=116&sid= 67b7410e-c997-49c3-bfae-5 Murray, N. D. (1997). Welcome to the future: The millennial generation. Journal of Career Planning and Employment, 57(3), 36-42. National Academy of Sciences—National Research Council. (1988). Cultivating agriculture: New directions for education. Washington, D. C.: National Academy Press.
119
National FFA Organization. Agricultural Education. (n. d.). Retrieved October 28, 2007, from http://www.ffa.org/index.cfm?method=c_about.stats
Nicholls, J. G. (1984). Achievement motivation: Concepts of ability, subjective experience, task choice, and performance. Psychological Review, 91(3), 328-346. Pascarella, E., & Terenzini, P. T. (1980). Student-faculty and student-peer relationships as mediators of the structural effects of undergraduate residence arrangement. Journal of Educational Research, 73(6), 344-353. Pittman, L. D., & Richmond, A. (2007). Academic and psychological functioning in late adolescence: The importantance of school belonging. The Journal of Experimental Education, 75(4), 270-290. Pope, J. (1990). Agricultural literacy: A basic American need. The Agricultural Education Magazine, 62(9), 8, 23. Popham, W. J. (2001). Uses and misuses of standardized tests. NASSP Bulletin, 85(24), 24-31. Powell, D., Agnew, D., & Trexler, C. (2008). Agricultural literacy: Clarifying a vision for practical application. Journal of Agricultural Education, 49(1), 85-98. Raffini, P. R. (1986). Student apathy: A motivational dilemma. Educational Leadership, 1(44), 53-55.
Raven, M. R., & Barrick, R. K. (1992). The academic preparation of rural and non-rural students prior to enrollment in a college of agriculture. Journal of Agricultural Education, 33(2), 10-18. Reasoner, R. (2008). The true meaning of self-esteem. Retrieved November 1, 2008, from http://www.self-esteem-nase.org/what.php Robinson-Awana, P., Kehle, T., & Jenson. W. (1986). But what about smart girls?
Adolescent self-esteem and sex role perceptions as function of academic achievement. Educational Psychology, 78(3), 179-183.
Rogers, C., & Dymond, R. (1954). Psychotherapy and personality change. Chicago: University of Chicago Press. Rosenberg, M. (1965). Society and the adolescent self-image. Princeton: Princeton University Press. Ross, D. (1972). G. Stanley Hall: The psychologist as prophet. Chicago: University of Chicago Press.
120
Russell, E. B. (1993). Attracting youth to agriculture. Journal of Extension, 31(4), Retrieved October 28, 2007, from http://www.joe.org/joe/1993winter/a2.html
Russell, E. B., McCracken, J. D., & Miller, W. W. (1990). Position paper on agricultural literacy. The Agricultural Education Magazine, 62(9), 13-14, 23.
Santrock, J. W. (1987). Adolescence: An introduction. Dubuque, IA: William C. Brown Publishers. Santrock, J. W. (2004). Life-span development (9th ed.). Boston: The McGraw-Hill Companies, Inc. Schore, A. N. (1994). Affect regulation and the origin of the self: The neurobiology of emotional development. Hillsdale, NJ: Lawrence Erlbaum Associates, Publishers. Shalveson, R. J., Hubner, J. J., & Stanton, G. C. (1976). Self-concept: Validation of construct interpretations. Review of Educational Research, 46(3), 407-441. Shoss, B. (1992, Fall). Is your teen obsessed with grades? Family Safety and Health, PP. 6-8. Son, N. H. (1975). Correlations between selected predictor variables and academic achievement of freshmen in the college of agriculture (Doctoral Dissertation, University of Missouri—
Columbia, 1975). Stanley, C. (1986). How to keep your kids on your team. New York: Nelson Publishers. Strage, A., & Brandt, T. S. (1999). Authoritative parenting and college students’ academic adjustment and success. Journal of Educational Psychology, 91(1), 146-156. Tajifel, H. (1981). Human groups and social categories: Studies in social psychology. Cambridge: Cambridge University Press. Terenzini, P. T., Springer, L., Yaeger, P. M., Pascarella, E. T., & Nora, A. (1996). First-generation college students: Characteristics, experiences, and cognitive development, Research in Higher Education, 37(1), 1-22. The ACT. (2009). The ACT test, Retrieved March 31, 2009, from http://www.act.org/aap/ The world hunger problem: Facts, figures and statistics. (n. d.). Retrieved February 19, 2009,
from http://library.thinkquest.org/C002291/high/present/stats.htm
Thompson, D. E., Orr, B. Thompson, C., & Grover, K. (2007). Examining students’ perceptions of their first-semester experience at a major land-grant institution. College Student Journal, 41(3), 640-648.
121
United States Census Bureau. (n.d.). Race and ethnicity---American Fact Finder. Retrieved November 15, 2009, from http://www.factfinder.census.gov/jsp/staff/SAFFInfo.jsp?_ pageId=tp9_race_ethnicity United States Department of Education. (8 January 2002). Public law print of PL 107-110,
The No Child Left Behind Act of 2001. Retrieved November 14, 2009, from http://www.ed.gov/policy/elsec/leg/esea02/107-110.pdf
United States Department of Labor, Bureau of Labor Statistics. (30 May 2008). Employment
characteristics of families in 2007. Retrieved March 25, 2009, from http://www.bls.gov/news.release/pdf/frame.pdf
Webster’s new collegiate dictionary: A merriam-webster. (1977). Springfield, MA: G. & C. Merriam Company. Wylie, R. C. (1961). The self-concept. Lincoln: University of Nebraska Press. Young-Eisendrath, P. (2008). The self-esteem trap: Raising confident and compassionate kids in an age of self-importance. New York: Little, Brown and Company.
122
APPENDIX A
APPLICATION FOR EXEMPTION FROM INSTITUTIONAL OVERSIGHT
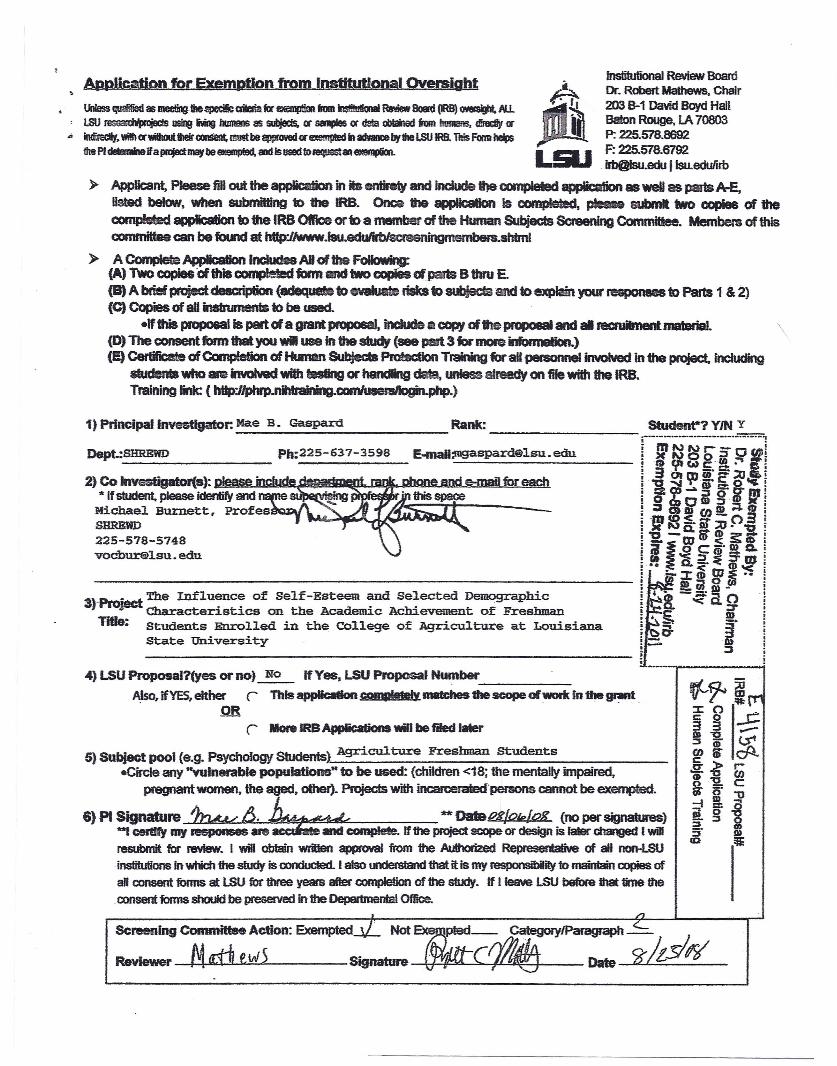
Application for Exemption from Institutional Oversight Institutional Review BoardDr. Robert. MaIhews. Chair2D3 B-1 David Boyd HallBaton Rouge, LA 70803P: 225.578.8692F: [email protected] Ilsu.eduIkb
» Applicant. Please fin out the application in iI8 entirety and include ltJe completed application as well as parts A-E.listed below, when submitting to the IRS. Once the application is completed, please submit 1M) copies of thecompleted application to the IRS Office or to a member of the Human Subjects Screening Commtttee. Members of thiscommittee can be foood at hUp:IJwww.fsu.edulirblscreenistdml
> A Complete Application Includes AI of the ~(A) Two coplesof this completed fann and two copi8s d parts B thru E.(B) A brief project description (adequate to evaluate risks to subjects and to explain your responses to Par1s 1 & 2)(C) Copies of au insfrumen1s to be used.
.•If this pmpoaaI is part fAa grant propoeaJ, include a CI1/II d the pmpoeaI and aI recruilmentmalBriaJ.(D) The consent form that you VIiIuse in the sludy (see part 3 for mole inrormation.)(E) Certificate ofCampletian of HlInan Subjects Protection Trainklg for all persorn"lel irNolved in the project. including
students who are invoIwId with testing or handing data, unless already on file with the IRB.Training link: ( htIp:lJphrp.nltlraining.conVuseJsIIoginphp.)
Unless quamedas ~1IIe~aieria U ~ fRn 'dlIIool8I Re.iew BoaRt (IRB)~ AU.I.SU ~ ~ MIg IJmIans as Ujects. €X saJIIIes €X data obIailed tom InmIans. dfIecIIY(I"
" lndirecly, will €XwilllcUlIIeir CGn!feIlt, mustbe ~ (I" 8I!e!ft!*!d m advaocebylle LSU IRS. Uris FoRDhelps1IlePlcllilemlNlfap!qectmaybe~ aId/susedfDR!qUe5t.~
\
1) Principal Investigator: MaeB. Gaspard Rank: Student"? YIN Y---------------- -.-.--.- ..-..-.---- .•-..-.•-•.-.•-.-~mNNr--o,i>eNOo:l !CD at W c:!! ~i3 J; ii' ;; ;:0 a.!~ ...,rp- c: 0 'C" •=cp •..•.!otrmlo (Dom:l II);(!-:m~!tJ·~~J·i)c.Na.~,.,. '0 :
. "2. -m CI)~ s:S' !!~loc-·mQ.i!I "o::::l(l)s: !; •• a.-'~(l)m!. • < "'1'< I! .••••z·Clt u.I •.• i------------------------------------------------------------! Om ~O i! •.. =!!.~- .;3)-Project The Influence of Self-Esteem and Selected Demographic 1 & -< a.:;rO !
Characteristics on the Academic Achievement of Freshman ; • S. !!!. iTItle: Students Enroll.ed in the COllege of Agriculture at Louisiana i a- ~!
state University ; -» l_______________________________________________________i ~;; I
Dept.:SHREWD Pb:225-637-3598 [email protected]
2) Co Investigator(s): pIease~' . ~e-mailfor~"'fstudent, please identify and .~ . ~ _ _Michael Burnett. Profes [email protected]
4)LS;, _._.- .
U Proposal?(yes or no) ~ If Yes, LSU Proposal Number rf,~I(T1Also. ifYES,either l This appIca80n coma •••• 1yal8tches the scope oIWD1kIn 1hegrant .OR if b' ~r IIIore IRS Applications will be filed taler 33·
Al"O -
ubJecl pool (e.g. Psychology Students) Agriculture Freshman Students::I ii" u-tUJ S" cA
eCirde any "vulnerable populations" to be used: (children <18; the mentally impaired, .§: -6" t)CD "0 C
pregnant women, the aged, olher). ProjecIs with incaroerated-pefSOI1S cannot be exempted. n.=• ·0 "
Signature ~ ~. ~ **DateRS/Ole/oK (no per signatures)-f~aS; 0 "0-:::s 02. CD-. certify my IeSPOIiS8s..e ;;ct._ If the project scope or design is faIer changed rWill ::I SI)
resubmit for review. I wiD obtain writIen approval from the Authorized RepreserUtive of all non-LSUID !it:
.institutions in which the study is oonducled.. I also oodefsIand that it is my feSPOI'\SibiIily to mail ilait I copies ofaft consent forms at lSU for tbree years after completion of the study. If I feaIIe LSUbefOre Ihat time the.consent fomIs should be preserved in the Departmental Office.
/1
_IngCommlllaeA-..:_-L Not~~h <- ~.
Reviewer --1la:rl ew5 Signature - C1lliJj Date W -W
5)S
6) PI
124
APPENDIX B
CONSENT FORM
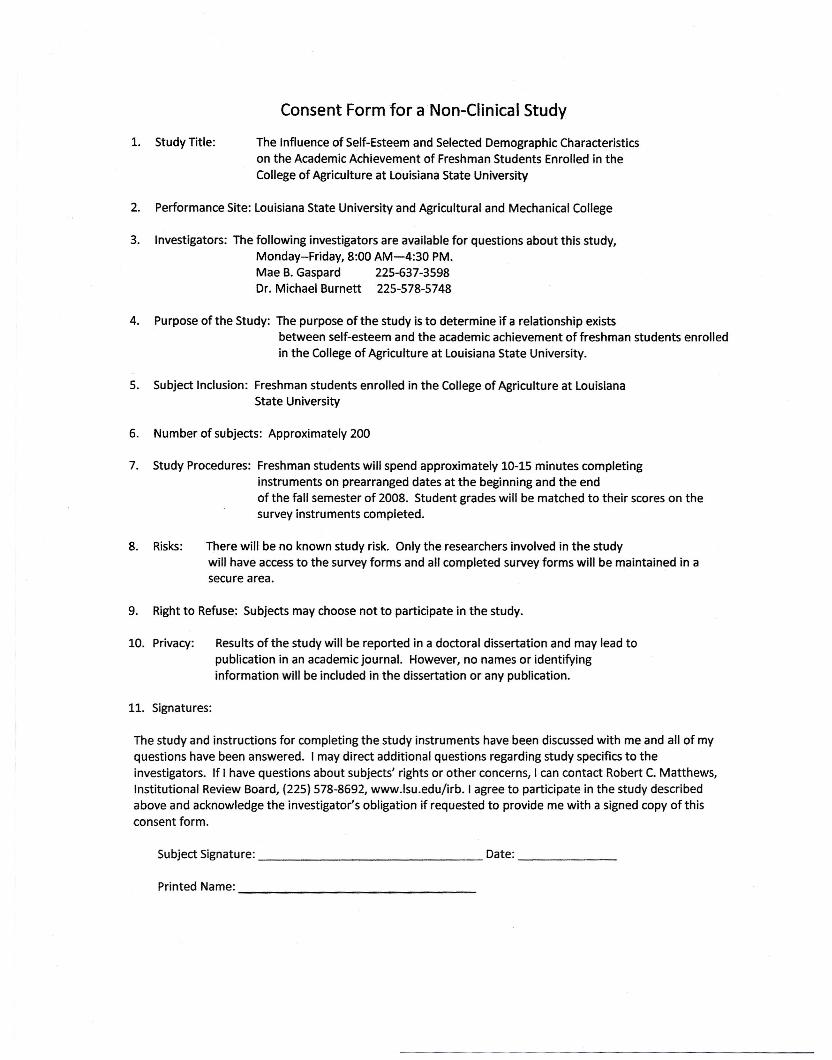
Consent Form for aNon-Clinical Study
1. Study Title: The Influence of Self-Esteem and Selected Demographic Characteristicson the Academic Achievement of Freshman Students Enrolled in theCollege of Agriculture at Louisiana State University
2. Performance Site: Louisiana State University and Agricultural and Mechanical College
3. Investigators: The following investigators are available for questions about this study,Monday-Friday, 8:00 AM-4:30 PM.Mae B. Gaspard 225-637-3598Dr. Michael Burnett 225-578-5748
4. Purpose of the Study: The purpose of the study is to determine if a relationship existsbetween self-esteem and the academic achievement of freshman students enrolledin the College of Agriculture at Louisiana State University.
5. Subject Inclusion: Freshman students enrolled in the College of Agriculture at LouisianaState University
6. Number of subjects: Approximately 200
7. Study Procedures: Freshman students will spend approximately 10-15 minutes completinginstruments on prearranged dates at the beginning and the endof the fall semester of 2008. Student grades will be matched to their scores on thesurvey instruments completed.
8. Risks: There will be no known study risk. Only the researchers involved in the studywill have accessto the survey forms and all completed survey forms will be maintained in asecure area.
9. Right to Refuse: Subjects may choose not to participate in the study.
10. Privacy: Results of the study will be reported in a doctoral dissertation and may lead topublication in an academic journal. However, no names or identifyinginformation will be included in the dissertation or any publication.
11. Signatures:
The study and instructions for completing the study instruments have been discussed with me and all of myquestions have been answered. I may direct additional questions regarding study specifics to theinvestigators. If I have questions about subjects' rights or other concerns, I can contact Robert C. Matthews,Institutional Review Board, (225) 578-8692, www.lsu.edu/irb. I agree to participate in the study describedabove and acknowledge the investigators obligation if requested to provide me with a signed copy of thisconsent form.
Subject Signature: Date: _
Printed Name: _
126
APPENDIX C
PERMISSION TO USE SAMPLES OF COPYRIGHT MATERIAL
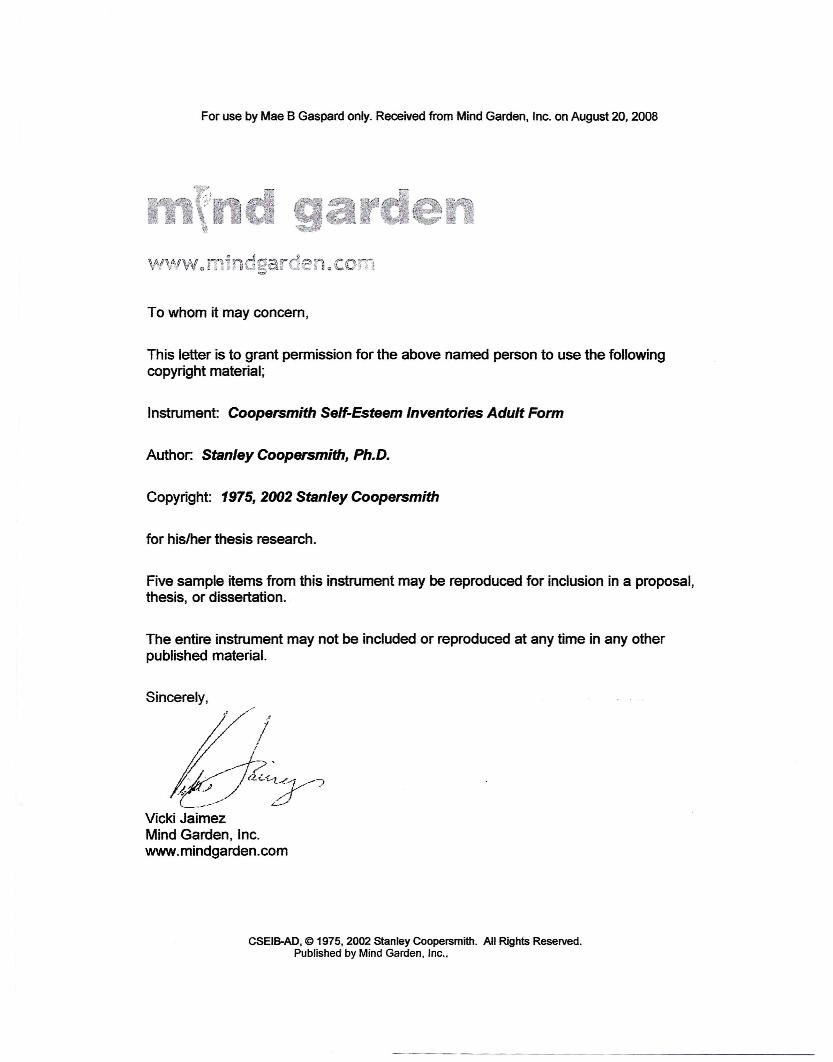
For use by Mae 8 Gaspard only. Received from Mind Garden, Inc. on August 20, 2008
To whom it may concern,
This letter is to grant permission for the above named person to use the followingcopyright material;
Instrument: Coopersmith Seff-Esteem Inventories Adult Form
Author: Stanley Coopersmith, Ph.D.
Copyright: 1975, 2002 Stanley Coopersmith
for hislher thesis research.
Five sample items from this instrument may be reproduced for inclusion in a proposal,thesis, or dissertation.
The entire instrument may not be included or reproduced at any time in any otherpublished· material.
Sincerely,
":/';,
~.'=.~/'4< J1 ,/
-~Vicki JaimezMind Garden, Inc.www.mindgarden.com
CSEIB-AD, © 1975, 2002 Stanley Coopersmith. All Rights Reserved.Published by Mind Garden, Inc.,
128
APPENDIX D
SAMPLES OF COPYRIGHT MATERIALS

129
Coopersmith Inventory Adult Form
Sample Items
Like Me Unlike Me
[ ] [ ] 1. Things usually don’t bother me.
[ ] [ ] 2. I find it very hard to talk in front of a group.
[ ] [ ] 3. There are lots of things about myself I’d change if I could.
[ ] [ ] 4. I can make up my mind without too much trouble.
[ ] [ ] 5. I’m a lot of fun to be with.

130
APPENDIX E
COLLEGE OF AGRICULTURE FRESHMAN QUESTIONNAIRE
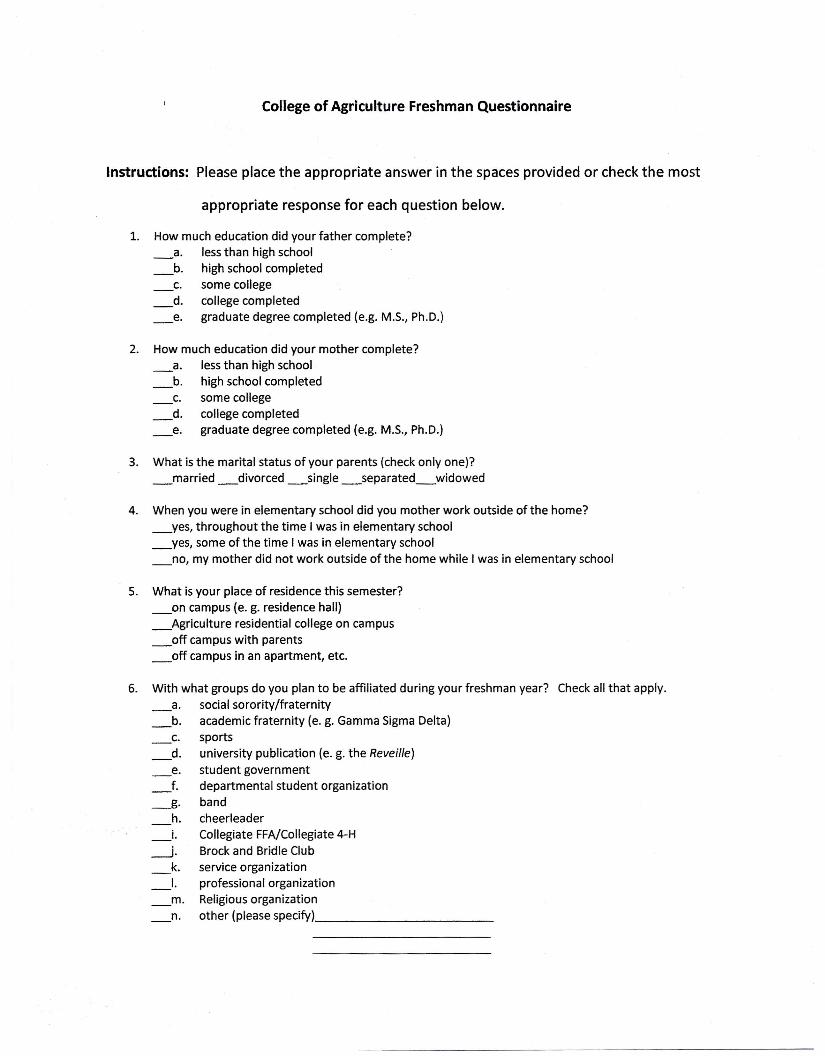
College of Agriculture Freshman Questionnaire
Instructions: Please place the appropriate answer in the spaces provided or check the most
appropriate response for each question below.
1. How much education did your father complete?_a. lessthan high school_b. high school completed_c. some college_d. college completed_e. graduate degree completed (e.g. M.S., Ph.D.)
2. How much education did your mother complete?_a. lessthan high school_b. high school completed_c. some college_d. college completed_e. graduate degree completed (e.g. M.S., Ph.D.)
3. What is the marital status of your parents (check only one)?_married _divorced _single _separated_widowed
4. When you were in elementary school did you mother work outside of the home?_yes, throughout the time I was in elementary school_yes, some of the time I was in elementary school_no, my mother did not work outside of the home while I was in elementary school
5. What is your place of residence this semester?_on campus (e. g. residence hall)_Agriculture residential college on campus_off campus with parents_off campus in an apartment, etc.
6. With what groups do you plan to be affiliated during your freshman year? Checkall that apply._a._b._c._d._e._f.~._h._i.
~.k.
-I._m._ no
social sorority/fraternityacademic fraternity (e. g. Gamma SigmaDelta)sportsuniversity publication (e. g. the Reveille)student governmentdepartmental student organizationbandcheerleaderCollegiate FFA!Coliegiate4-HBrock and Bridle Clubservice organizationprofessional organizationReligiousorganizationother {please specify) _

132
VITA
Mae Blanchard Gaspard was born in September 1950, in Monroe, Louisiana. She
obtained her high school education at Livonia High School in Livonia, Louisiana. She
completed a Bachelor of Science degree in nursing with honors from Northwestern State
University in Natchitoches, Louisiana, in 1972. She received a Master of Science degree in
vocational education from Louisiana State University in Baton Rouge, Louisiana, in 1994. She
was elected to Alpha Lambda Delta as a college freshman. She holds membership in Phi Kappa
Phi, the Louisiana School Nurses Association, and the National Association of School Nurses.
In 1991, Mae co-authored an article entitled “The Relationship between Self-Esteem and
Academic Achievement of Rural 9th Grade Students” in The Journal of Rural and Small Schools.
Mae’s work experiences include that of a registered nurse in the hospital setting and more
recently as a school nurse in the public school setting in rural South Louisiana. She has also
acted in the capacity of a graduate assistant in Career Services at Louisiana State University.
Mae is married to Camile Gaspard and has a son, John, and daughter and son-in-law,
Mary and Odie Roberts. She also has two granddaughters Katherine and Abbagayle. Her other
activities and interests encompass participation in church and school activities along with
volunteer nursing activities.