THE INFLUENCE OF HUMAN VARIABLES ON CONSUMERS’ SHOPPING
202
THE INFLUENCE OF HUMAN VARIABLES ON CONSUMERS’ SHOPPING EXPERIENCE IN FMCG RETAIL STORES IN EKURHULENI by Henry Shitisang Malope Submitted in accordance with the requirements for the degree of Master of Commerce in the subject Business Management at the University of South Africa Supervisor: Ms S.S.L.N Mosupyoe Co-supervisor: Dr J.A.R Botha 01 March 2019
Transcript of THE INFLUENCE OF HUMAN VARIABLES ON CONSUMERS’ SHOPPING

THE INFLUENCE OF HUMAN VARIABLES ON CONSUMERS’ SHOPPING
EXPERIENCE IN FMCG RETAIL STORES IN EKURHULENI
by
Henry Shitisang Malope
Submitted in accordance with the requirements for the degree of
Master of Commerce
in the subject
Business Management
at the
University of South Africa
Supervisor: Ms S.S.L.N Mosupyoe
Co-supervisor: Dr J.A.R Botha
01 March 2019

i
DECLARATION
Name: Henry Shitisang Malope
Student number: 40369005
Degree: Master of Commerce in Business Management (Marketing
specialisation).
THE INFLUENCE OF HUMAN VARIABLES ON CONSUMERS’ SHOPPING
EXPERIENCE IN FMCG RETAIL STORES IN EKURHULENI.
I declare that the above dissertation is my own work and that all the sources that I have
used or quoted have been indicated and acknowledged by means of complete
references.
I further declare that I submitted the dissertation to originality checking software and that
it falls within the accepted requirements for originality.
I further declare that I have not previously submitted this work, or part of it, for examination
at Unisa for another qualification or at any other higher education institution.
01 March 2019
SIGNATURE DATE

ii
DEDICATION
This dissertation is dedicated to my late father, Babusiye Malope. Things would have
been different if you were still around. To my mother who raised us as a single parent:
I’m grateful for all that you have done for us.

iii
ACKNOWLEDGEMENTS
I would like to take this opportunity to thank the following individuals for making it possible
to complete this dissertation:
To my supervisor, Ms S.S.L.N Mosupyoe and co-supervisor, Dr J.A.R Botha, for
your guidance, support and encouragement.
To my family for supporting me.
Mr Hennie Gerber and Mr Andries Masenge for assisting me with the statistical
analysis.
Mr Jack Chokwe for editing this dissertation.
Mr Ferdi van der Linde for granting me permission to pre-test my questionnaire.
Ms Lee-Anne Leathley and Ms Sonya Cawood for allowing me to conduct a
survey at your shopping malls.
All the respondents who participated in the study.
The University of South Africa for financial assistance.
iv
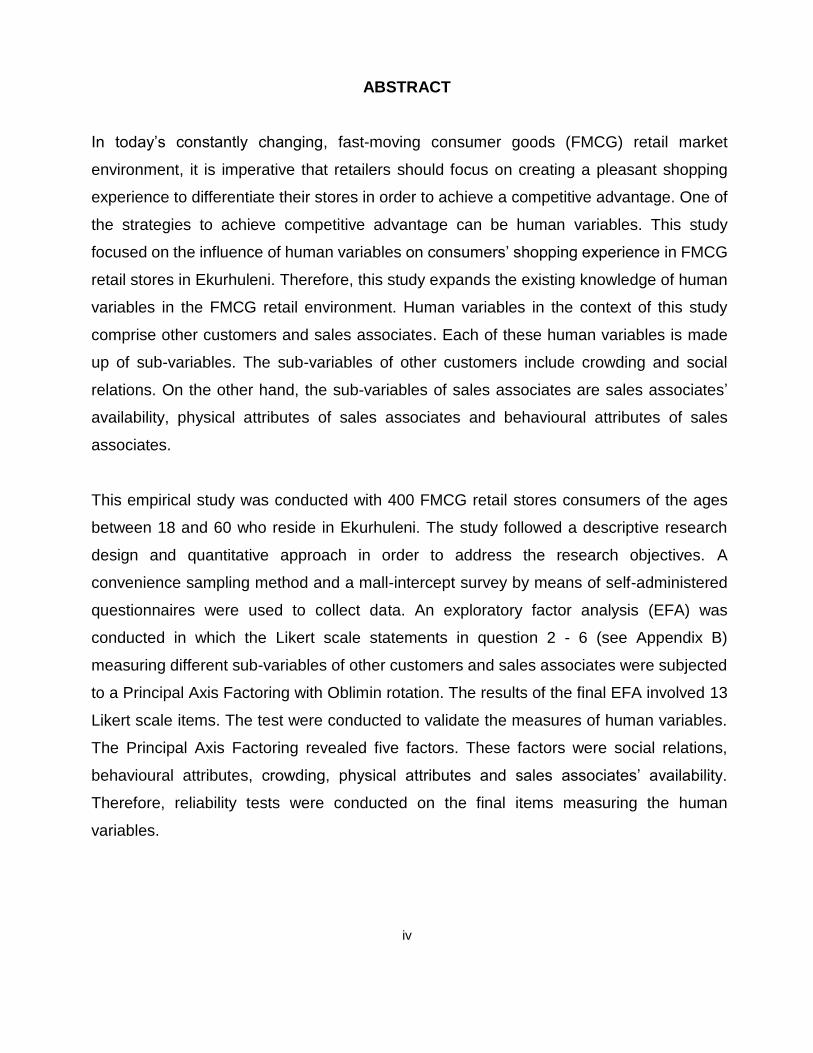
ABSTRACT
In today’s constantly changing, fast-moving consumer goods (FMCG) retail market
environment, it is imperative that retailers should focus on creating a pleasant shopping
experience to differentiate their stores in order to achieve a competitive advantage. One of
the strategies to achieve competitive advantage can be human variables. This study
focused on the influence of human variables on consumers’ shopping experience in FMCG
retail stores in Ekurhuleni. Therefore, this study expands the existing knowledge of human
variables in the FMCG retail environment. Human variables in the context of this study
comprise other customers and sales associates. Each of these human variables is made
up of sub-variables. The sub-variables of other customers include crowding and social
relations. On the other hand, the sub-variables of sales associates are sales associates’
availability, physical attributes of sales associates and behavioural attributes of sales
associates.
This empirical study was conducted with 400 FMCG retail stores consumers of the ages
between 18 and 60 who reside in Ekurhuleni. The study followed a descriptive research
design and quantitative approach in order to address the research objectives. A
convenience sampling method and a mall-intercept survey by means of self-administered
questionnaires were used to collect data. An exploratory factor analysis (EFA) was
conducted in which the Likert scale statements in question 2 - 6 (see Appendix B)
measuring different sub-variables of other customers and sales associates were subjected
to a Principal Axis Factoring with Oblimin rotation. The results of the final EFA involved 13
Likert scale items. The test were conducted to validate the measures of human variables.
The Principal Axis Factoring revealed five factors. These factors were social relations,
behavioural attributes, crowding, physical attributes and sales associates’ availability.
Therefore, reliability tests were conducted on the final items measuring the human
variables.

v
The results of this research study indicate that social relations, sales associates’ availability,
physical attributes of sales associates and behavioural attributes of sales associates
influence consumers’ shopping experience in FMCG retail stores in Ekurhuleni. However,
the consumers felt neutral with regard to crowding. The test results of a chi-square for equal
proportion revealed that all the five hypotheses (H1, H2, H3, H4, and H5) were supported as
the proportions of consumers with regard to the influence of these sub-variables on their
shopping experience were statistically different. Furthermore, ANOVA and F-test results for
testing whether there were differences between demographics indicated that H1a, H2b and
H5c were supported because there were statistically significant differences between
genders with regard to the influence of crowding, between age groups regarding social
relations, as well as between racial groups with regard to the influence of behavioural
attributes of sales associates on consumers’ shopping experience.
Key terms:
Crowding; demographic variables; fast moving consumer goods (FMCG); human variables;
other customers; retailing; sales associates’ attributes; shopping experience; social
relations; store atmospherics

vi
TABLE OF CONTENTS
DECLARATION ............................................................................................................... i
DEDICATION .................................................................................................................. ii
ACKNOWLEDGEMENTS .............................................................................................. iii
ABSTRACT .................................................................................................................. iv
CHAPTER 1: INTRODUCTION
1.1 INTRODUCTION ................................................................................................ 1
1.2 BACKGROUND .................................................................................................. 3
1.2.1 The South African retail industry ......................................................................... 4
1.2.2 The importance of human variables in FMCG retail stores ................................ 5
1.3 PROBLEM STATEMENT ................................................................................... 6
1.4 PURPOSE OF THE STUDY ............................................................................... 7
1.5 OBJECTIVES OF THE STUDY .......................................................................... 8
1.5.1 Primary objective ................................................................................................ 8
1.5.2 Secondary objectives ......................................................................................... 8
1.6 SIGNIFICANCE OF THE STUDY ....................................................................... 9
1.7 DEFINITIONS OF KEY TERMS ......................................................................... 9
1.8 RESEARCH METHODOLOGY ........................................................................ 11
1.8.1 Research design ............................................................................................... 11
1.8.2 Sampling........................................................................................................... 13
1.9 QUESTIONNAIRE DESIGN ............................................................................. 15
1.10 PRE-TEST THE QUESTIONNAIRE ................................................................. 16
1.11 DATA COLLECTION ........................................................................................ 16
1.12 DATA ANALYSIS ............................................................................................. 16
1.13 RESEARCH ETHICS ....................................................................................... 17
1.14 DELIMITATIONS OF THE STUDY ................................................................... 17
1.15 CHAPTER OUTLINE ........................................................................................ 18
1.16 SUMMARY ....................................................................................................... 19
vii
CHAPTER 2: HUMAN VARIABLES
2.1 INTRODUCTION. ............................................................................................. 20
2.2 HUMAN VARIABLES DEFINED ....................................................................... 22
2.3 HUMAN VARIABLES DISCUSSED .................................................................. 22
2.3.1 The effects of other customers ......................................................................... 25
2.3.2 The effects of sales associates ......................................................................... 30
2.4 CONSUMER BUYING BEHAVIOUR ................................................................ 36
2.5 DEMOGRAPHIC VARIABLES .......................................................................... 38
2.6 CONSUMER SHOPPING EXPERIENCE ......................................................... 39
2.6.1 Consumer shopping experience defined ......................................................... 39
2.6.2 Consumers’ evaluation of shopping experience .............................................. 40
2.7 THE INFLUENCE OF HUMAN VARIABLES ON CONSUMERS’
SHOPPING EXPERIENCE ............................................................................... 41
2.8 SUMMARY ....................................................................................................... 42
CHAPTER 3: CONCEPTUAL FRAMEWORK AND HYPOTHESES TESTING
3.1 INTRODUCTION. ............................................................................................. 43
3.2 THE CONCEPTUAL FRAMEWORK TESTED IN THE STUDY ....................... 43
3.2.1 Overview of the conceptual framework ............................................................. 44
3.2.2 Measuring the influence of human variables on consumers shopping
experience ........................................................................................................ 46
3.2.3 The five sub-variables of other customers and sales associates ...................... 46
3.3 SUMMARY....................................................... ................................................. 54
CHAPTER 4: RESEARCH METHODOLOGY
4.1 INTRODUCTION .............................................................................................. 56
4.2 MARKETING RESEARCH PROCESS ............................................................. 56
4.2.1 Step 1: Define the research problem ................................................................ 58
4.2.2 Step 2: Identify the research objectives ............................................................ 59
4.2.3 Step 3: Identify information types and sources ................................................ 60

viii
4.2.4 Step 4: Determine the research design ............................................................ 62
4.2.5 Step 5: Prepare the research design. ............................................................... 66
4.2.6 Step 6: Design the questionnaire ...................................................................... 74
4.2.7 Step 7: Pre-test the questionnaire .................................................................... 78
4.2.8 Step 8: Collect the data .................................................................................... 79
4.2.9 Step 9: Process and analyse data .................................................................... 79
4.2.10 Step 10: Interpret the findings and compile the report ...................................... 82
4.3 ETHICAL CONSIDERATIONS ......................................................................... 82
4.4 SUMMARY ....................................................................................................... 83
CHAPTER 5: RESEARCH FINDINGS AND INTERPRETATION
5.1 INTRODUCTION .............................................................................................. 84
5.2 THE RESEARCH FINDINGS ........................................................................... 84
5.2.1 Sample distribution ........................................................................................... 84
5.2.2 The qualifying question ..................................................................................... 85
5.2.3 Demographic profile of respondents ................................................................. 85
5.3 MEASURING INSTRUMENT ........................................................................... 87
5.3.1 Validity .............................................................................................................. 87
5.3.2 Reliability .......................................................................................................... 94
5.4 COMPOSITE SCORES .................................................................................... 98
5.4.1 Crowding ........................................................................................................ 100
5.4.2 Social relations ............................................................................................... 101
5.4.3 Sales associates’ availability .......................................................................... 102
5.4.4 Physical attributes .......................................................................................... 103
5.4.5 Behavioural attributes ..................................................................................... 103
5.5 HYPOTHESES TEST ..................................................................................... 104
5.5.1 Determining the influence of crowding ............................................................ 105
5.5.2 Determining the influence of social relations .................................................. 106
5.5.3 Determining the influence of sales associates’ availability ............................. 107
5.5.4 Determining the influence of physical attributes ............................................. 108

ix
5.5.5 Determining the influence of behavioural attributes ........................................ 109
5.6 TEST FOR SIGNIFICANT DIFFERENCES BETWEEN MEANS .................... 110
5.6.1 Differences between demographics with regard to crowding.......................... 111
5.6.2 Differences between demographics with regard to
social relations ................................................................................................ 115
5.6.3 Differences between demographics with regard to
the sales associates’ availability ..................................................................... 118
5.6.4 Differences between demographics with regard to
physical attributes ........................................................................................... 121
5.6.5 Differences between demographics with regard to
behavioural attributes ..................................................................................... 125
5.7 INTEGRATION OF THE RESULTS, RESEARCH OBJECTIVES,
HYPOTHESES AND DISCUSSION ............................................................... 129
5.8 SUMMARY ..................................................................................................... 136
CHAPTER 6: CONCLUSIONS AND RECOMMENDATIONS
6.1 INTRODUCTION ............................................................................................ 139
6.2 THE PURPOSE AND IMPORTANCE OF THE STUDY ................................. 139
6.2.1 Main purpose of the study .............................................................................. 139
6.2.2 The importance of the study ........................................................................... 140
6.3 DISCUSSIONS ............................................................................................... 140
6.4 THEORETICAL CONTRIBUTION OF THE STUDY ....................................... 146
6.5 PRACTICAL CONTRIBUTION OF THE STUDY ............................................ 147
6.6 LIMITATIONS OF THE STUDY ...................................................................... 147
6.7 RECOMMENDATIONS .................................................................................. 148
6.8 SUGGESTIONS FOR FUTURE RESEARCH. ............................................... 149
6.9 SUMMARY ..................................................................................................... 150
REFERENCES............................................................................................................. 151
APPENDIX A: Informed consent .............................................................................. 169
APPENDIX B: Research instrument ......................................................................... 172

x
APPENDIX C: Permission letters ............................................................................. 178
APPENDIX D: Language editing certificate ............................................................. 182
APPENDIX E: Ethical clearance certificate ............................................................. 184

xi
LIST OF FIGURES
Figure 2.1: Conceptual framework of human-related environmental stimuli ............... 24
Figure 2.2: An example of a less crowded FMCG retail store .................................... 27
Figure 2.3: An example of an overcrowded FMCG retail store ................................... 28
Figure 2.4: An example of an overcrowded FMCG retail store ................................... 28
Figure 3.1 Conceptual framework tested in the study ............................................... 45
Figure 4.1 The marketing research process .............................................................. 57
Figure 4.2 Types of research design ......................................................................... 62
Figure 4.3 Steps in the sampling plan ....................................................................... 66
Figure 4.4 Types of probability and non-probability sampling ................................... 68
Figure 5.1: Scree plot for factor retention ................................................................... 92

xii
LIST OF TABLES
Table 2.1 Classification of store atmospheric variables ........................................... 21
Table 4.1 Advantages and disadvantages of secondary data .................................. 61
Table 4.2 Comparison of qualitative and quantitative research ................................ 65
Table 4.3 Advantages and disadvantages of convenience sampling ....................... 70
Table 4.4 Types of survey method ........................................................................... 72
Table 4.5 Advantages and disadvantages of self-administered questionnaire ......... 73
Table 4.6 Structure of the questionnaire for this study………………………………... 77
Table 4.7 Measures used in the study ..................................................................... 78
Table 5.1 Total number of respondents per shopping mall ...................................... 84
Table 5.2: Demographic profile of respondents ........................................................ 86
Table 5.3: KMO and Bartlett’s Test of Sphericity ...................................................... 88
Table 5.4: Communalities ......................................................................................... 89
Table 5.5: Factor extraction using principal axis factoring......................................... 91
Table 5.6: Pattern matrix ........................................................................................... 93
Table 5.7: Interpretation of Cronbach’s alpha ........................................................... 95
Table 5.8: Overall coefficient for human variables scale ........................................... 95
Table 5.9: Internal consistency reliability for social relations sub-scale .................... 96
Table 5.10 Internal consistency reliability for behavioural attributes sub-scale .......... 97
Table 5.11: Internal consistency reliability for crowding sub-scale .............................. 97
Table 5.12: Internal consistency reliability for physical attributes sub-scale................ 98
Table 5.13: Internal consistency reliability for sales associates’
availability sub-scale ................................................................................ 98
Table 5.14: Descriptive statistics for composite scores ............................................... 99
Table 5.15: Indicate the level of agreement or disagreement with
regard to crowding ................................................................................. 100
Table 5.16: Indicate the level of agreement or disagreement with
regard to social relations ........................................................................ 101
Table 5.17: Indicate the level of agreement or disagreement with
xiii
regard to sales associates’ availability ................................................... 102
Table 5.18: Indicate the level of agreement or disagreement with
regard to physical attributes ................................................................... 103
Table 5.19: Indicate the level of agreement or disagreement with
regard to behavioural attributes .............................................................. 104
Table 5.20: Frequency distribution scores for crowding ............................................ 105
Table 5.21: Chi-square test on crowding................................................................... 106
Table 5.22: Frequency distribution scores for social relations................................... 107
Table 5.23: Chi-square test on social relations ......................................................... 107
Table 5.24: Frequency distribution scores for sales associates’ availability .............. 108
Table 5.25: Chi-square test on sales associates’ availability .................................... 108
Table 5.26: Frequency distribution scores for physical attributes .............................. 109
Table 5.27: Chi-square test on physical attributes .................................................... 109
Table 5.28: Frequency distribution scores for behavioural attributes ........................ 110
Table 5.29: Chi-square test on behavioural attributes .............................................. 110
Table 5.30: One-way ANOVA on gender regarding crowding ................................... 111
Table 5.31: ANOVA F-test on gender regarding crowding ........................................ 112
Table 5.32: One-way ANOVA on age regarding crowding ........................................ 113
Table 5.33: ANOVA F-test on age regarding crowding ............................................. 113
Table 5.34: One-way ANOVA on race regarding crowding ....................................... 114
Table 5.35: ANOVA F-test on race regarding crowding ............................................ 114
Table 5.36: One-way ANOVA on gender regarding social relations ......................... 115
Table 5.37: ANOVA F-test on gender regarding social relations ............................... 116
Table 5.38: One-way ANOVA on age regarding social relations ............................... 116
Table 5.39: ANOVA F-test on age regarding social relations .................................... 117
Table 5.40: One-way ANOVA on race regarding social relations .............................. 117
Table 5.41: ANOVA F-test on race regarding social relations ................................... 118
Table 5.42: One-way ANOVA on gender regarding sales associates’
availability .............................................................................................. 119
Table 5.43: ANOVA F-test on gender regarding sales associates’ availability .......... 119

xiv
Table 5.44: One-way ANOVA on age regarding sales associates’ availability .......... 120
Table 5.45: ANOVA F-test on age regarding sales associates’ availability ............... 120
Table 5.46: One-way ANOVA on race regarding sales associates’ availability ......... 121
Table 5.47: ANOVA F-test on race regarding sales associates’ availability .............. 121
Table 5.48: One-way ANOVA on gender regarding physical attributes .................... 122
Table 5.49: ANOVA F-test on gender regarding physical attributes .......................... 122
Table 5.50: One-way ANOVA on age regarding physical attributes .......................... 123
Table 5.51: ANOVA F-test on age regarding physical attributes ............................... 123
Table 5.52: One-way ANOVA on race regarding physical attributes ......................... 124
Table 5.53: ANOVA F-test on race regarding physical attributes .............................. 125
Table 5.54: One-way ANOVA on gender regarding behavioural attributes ............... 125
Table 5.55: ANOVA F-test on gender regarding behavioural attributes .................... 126
Table 5.56: One-way ANOVA on age regarding behavioural attributes .................... 127
Table 5.57: ANOVA F-test on age regarding behavioural attributes ......................... 127
Table 5.58: One-way ANOVA on race regarding behavioural attributes ................... 128
Table 5.59: ANOVA F-test on race regarding behavioural attributes ........................ 128
Table 6.1: The results of the hypotheses tested in the study .................................. 142
1
CHAPTER 1
INTRODUCTION, BACKGROUND AND OBJECTIVES OF THE STUDY
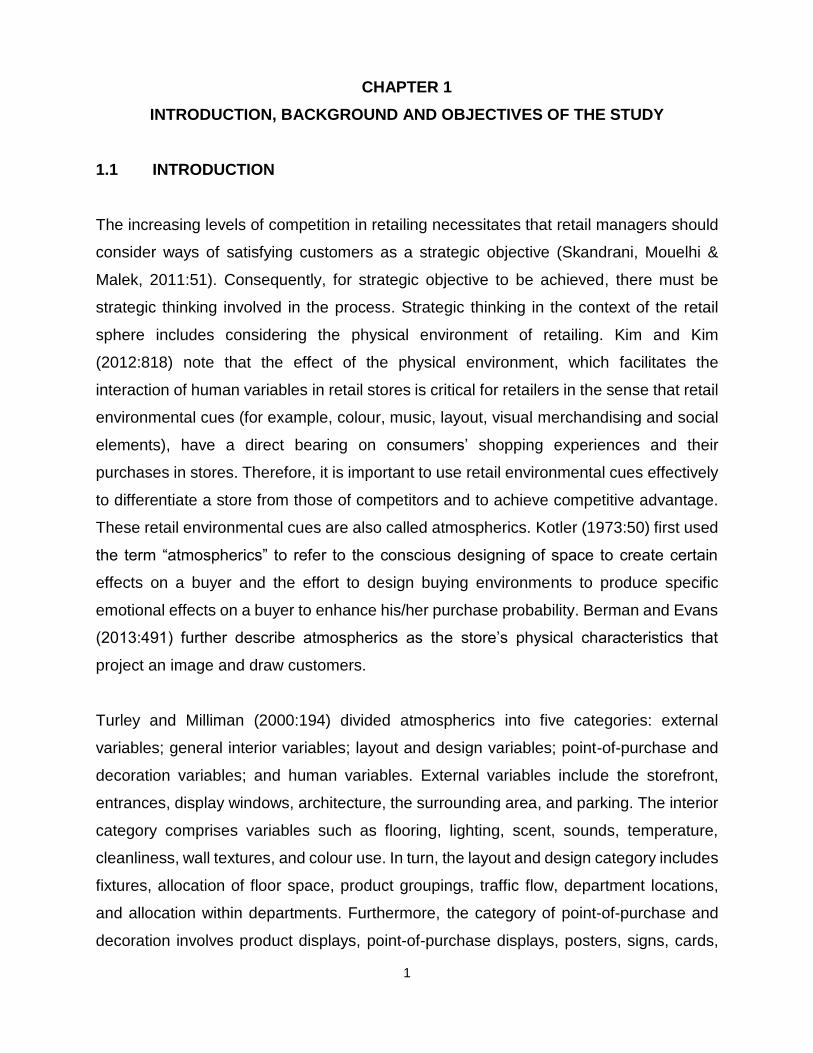
1.1 INTRODUCTION
The increasing levels of competition in retailing necessitates that retail managers should
consider ways of satisfying customers as a strategic objective (Skandrani, Mouelhi &
Malek, 2011:51). Consequently, for strategic objective to be achieved, there must be
strategic thinking involved in the process. Strategic thinking in the context of the retail
sphere includes considering the physical environment of retailing. Kim and Kim
(2012:818) note that the effect of the physical environment, which facilitates the
interaction of human variables in retail stores is critical for retailers in the sense that retail
environmental cues (for example, colour, music, layout, visual merchandising and social
elements), have a direct bearing on consumers’ shopping experiences and their
purchases in stores. Therefore, it is important to use retail environmental cues effectively
to differentiate a store from those of competitors and to achieve competitive advantage.
These retail environmental cues are also called atmospherics. Kotler (1973:50) first used
the term “atmospherics” to refer to the conscious designing of space to create certain
effects on a buyer and the effort to design buying environments to produce specific
emotional effects on a buyer to enhance his/her purchase probability. Berman and Evans
(2013:491) further describe atmospherics as the store’s physical characteristics that
project an image and draw customers.
Turley and Milliman (2000:194) divided atmospherics into five categories: external
variables; general interior variables; layout and design variables; point-of-purchase and
decoration variables; and human variables. External variables include the storefront,
entrances, display windows, architecture, the surrounding area, and parking. The interior
category comprises variables such as flooring, lighting, scent, sounds, temperature,
cleanliness, wall textures, and colour use. In turn, the layout and design category includes
fixtures, allocation of floor space, product groupings, traffic flow, department locations,
and allocation within departments. Furthermore, the category of point-of-purchase and
decoration involves product displays, point-of-purchase displays, posters, signs, cards,
2
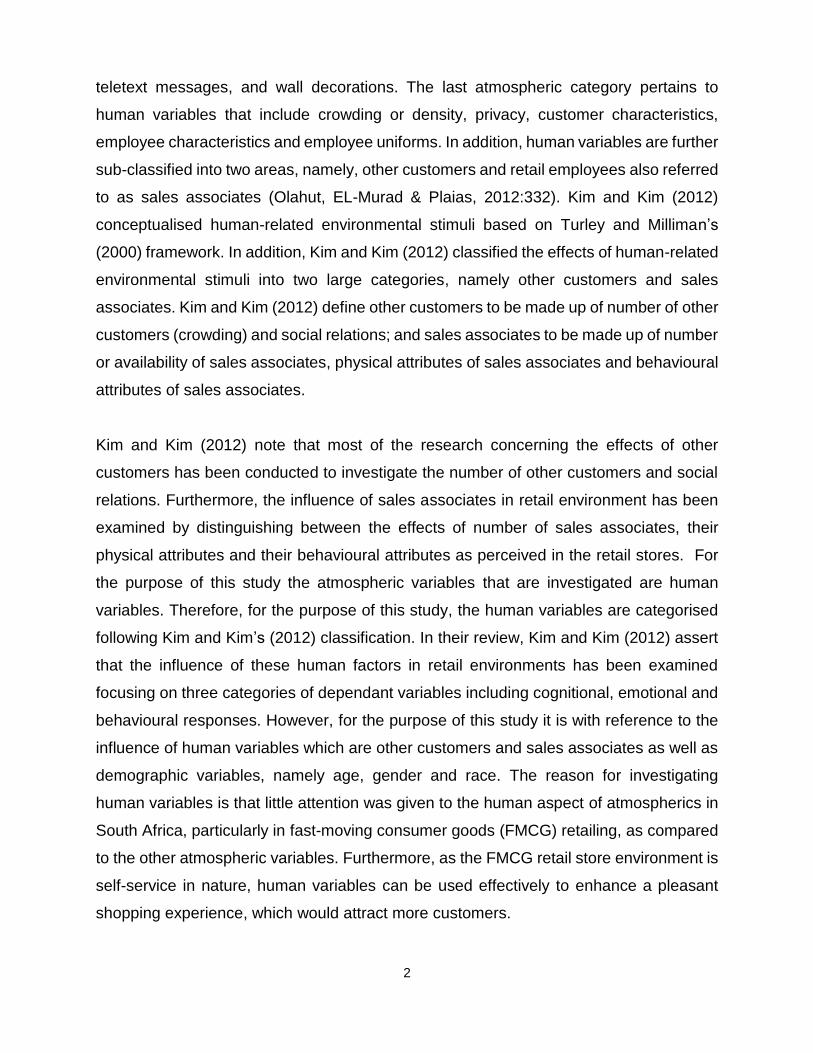
teletext messages, and wall decorations. The last atmospheric category pertains to
human variables that include crowding or density, privacy, customer characteristics,
employee characteristics and employee uniforms. In addition, human variables are further
sub-classified into two areas, namely, other customers and retail employees also referred
to as sales associates (Olahut, EL-Murad & Plaias, 2012:332). Kim and Kim (2012)
conceptualised human-related environmental stimuli based on Turley and Milliman’s
(2000) framework. In addition, Kim and Kim (2012) classified the effects of human-related
environmental stimuli into two large categories, namely other customers and sales
associates. Kim and Kim (2012) define other customers to be made up of number of other
customers (crowding) and social relations; and sales associates to be made up of number
or availability of sales associates, physical attributes of sales associates and behavioural
attributes of sales associates.
Kim and Kim (2012) note that most of the research concerning the effects of other
customers has been conducted to investigate the number of other customers and social
relations. Furthermore, the influence of sales associates in retail environment has been
examined by distinguishing between the effects of number of sales associates, their
physical attributes and their behavioural attributes as perceived in the retail stores. For
the purpose of this study the atmospheric variables that are investigated are human
variables. Therefore, for the purpose of this study, the human variables are categorised
following Kim and Kim’s (2012) classification. In their review, Kim and Kim (2012) assert
that the influence of these human factors in retail environments has been examined
focusing on three categories of dependant variables including cognitional, emotional and
behavioural responses. However, for the purpose of this study it is with reference to the
influence of human variables which are other customers and sales associates as well as
demographic variables, namely age, gender and race. The reason for investigating
human variables is that little attention was given to the human aspect of atmospherics in
South Africa, particularly in fast-moving consumer goods (FMCG) retailing, as compared
to the other atmospheric variables. Furthermore, as the FMCG retail store environment is
self-service in nature, human variables can be used effectively to enhance a pleasant
shopping experience, which would attract more customers.

3
Human variables refer to the occupants of the space of sale (customers and sales
associates) who can affect the perception and behaviour of consumers (Hamrouni &
Touzi, 2011:309). This study investigated other customers and sales associates to
determine their influence on consumers’ shopping experience in the FMCG retail stores
in Ekurhuleni. Other customers can be defined as customers who are in the same retail
store simultaneously with, and who are unacquainted with a focal customer (Brocato,
Voorhees & Baker, 2012:385). In turn, sales associates can be defined as retail sales
assistants with the emphasis on the importance of the professional nature of the sales
function (Levy & Weitz, 2012:611). Human variables can add towards creating a pleasant
shopping experience in stores, in this instance, in the FMCG retail stores in Ekurhuleni.
Retailers need to do more than presenting appealing merchandise to provide rewarding
shopping experience – they can achieve this by creating a pleasant store atmosphere
(Levy & Weitz, 2012: 489). Many retailers view a store’s environment as increasingly
important to satisfy their customers by providing a positive total shopping experience
(Olahut et al., 2012:317). This study expands on the existing review study of Kim and Kim
(2012) by empirically testing these constructs in a South African context.
This chapter provides background of the study. After the background discussion, the
problem statement, purpose of the study, research objectives and significance of the
study are provided, followed by definitions of key terms. The chapter concludes with a
brief description of the research methodology used to achieve the objectives of this study.
1.2 BACKGROUND OF THE STUDY
In the 21st century, bricks and mortar retailers have to adapt to the constantly changing
needs of customers. Bricks and mortar retailers refer to retailers who operate in a physical
building (Lusch, Dunne & Carver, 2011:6). Retailing can be described as the set of
business activities that add value to the products and services sold to consumers for their
personal or family use (Levy & Weitz, 2012:6). Stats SA (2018a:13) describes a retailer
as an enterprise that derives more than 50% of its turnover from sales of goods to the
general public for household use. Retail trade includes reselling new and used goods and

4
products to the general public to be used for household purposes (Stats SA, 2018a:13).
Some of these goods fall in the category of FMCG.
This study focuses on FMCG in the bricks and mortar retailing industry. FMCG refer to
products such as soft drinks, toiletries and grocery items that are sold quickly and at
relatively low cost (Nayyab, Javed, Ibraheem & Safdar, 2011:804; Tiwari, 2012:168).
FMCG are products that are generally replaced or fully used up over a short period of
days, week and month or within a year (Tiwari, 2012:168). Furthermore, FMCG products
are frequently purchased (Mann & Kaur, 2013:6; Tiwari, 2012:168). According to Nayyab
et al. (2011:804), the FMCG retail market is divided into four major consumer categories,
namely, food, toiletries, household, and health categories. The largest portion of
consumers’ monthly budget is spent on these products. The returns in this sector are
large because these products represent the basic necessities of life (Nayyab et al., 2011:
804). Since the study was conducted in the South African context, it is therefore
necessary to consider an overview of the South African retail industry. The overview is
briefly explained below.
1.2.1 The South African retail industry
The latest statistics indicate that the retail industry is one of the largest contributors to the
South African economy’s total income, and recorded a growth of 3.1% in the first quarter
of 2018 (Stats SA, 2018a:2). According to Stats SA (2018a:2), FMCG have a significant
impact on the retail industry and contributes towards its growth. Therefore, it is important
that the FMCG retail industry should continue to devise creative and innovative ways to
develop store-related aspects. There are various types of FMCG retailers. These usually
include supermarket and hypermarket stores. A supermarket is a self-service retail food
store offering groceries, meat, produce and non-food items such as toiletries, health,
beauty aids and general merchandise (Levy & Weitz, 2012:35). Supermarket retailers in
South Africa include stores such as Shoprite and Spar. Hypermarkets, in turn, refer to
retail stores that are larger than a supermarket and that sell groceries, clothing,
appliances and other categories (Levy & Weitz, 2012:38), for example Pick ‘n Pay
Hypermarket and Checkers Hyper. Since the focus of this study was on human variables,

5
an overview on the importance of human variables in FMCG retail stores is given in the
next section.
1.2.2 The importance of human variables in FMCG retail stores
Brocato et al. (2012:384) posit that a retail store’s atmosphere involves human variables
that have a social influence. Therefore, retailers can use human variables effectively to
create a pleasant shopping experience. Due to the competitive nature of the FMCG retail
market, it is essential for retailers to understand the importance of human variables from
consumers’ perspective in order to gain and retain a competitive advantage. Therefore,
this study investigated the influence of human variables on consumers’ shopping
experience in FMCG retail stores in Ekurhuleni. Understanding consumer buying
behaviour is important for FMCG retailers when studying the influence of human variables
on consumers’ shopping experience. A detailed discussion of human variables is
provided in Chapter 2.
Consumer buying behaviour refers to activities undertaken by people in the process of
obtaining, using and disposing of products and services for personal use (Blythe, 2013:5).
In addition, Parumasur and Roberts-Lombard (2014:2) concur that consumer behaviour
is a combination of activities and influences that occur before, during and after the
purchase itself. Retailers that understand consumer behaviour succeed in the constantly
changing market environment. In addition, retail marketers that study the behaviour of
consumers know why consumers make decisions that they do and have a better
understanding of their target market. According to Parumasur and Roberts-Lombard
(2014:263) and Schiffman, Kanuk and Wisenblit (2010:418), consumers are continuously
making decisions on what products and services to consume. Therefore, human variables
create shopping experiences that are likely to influence consumers’ decision-making.
Consumer buying behaviour is discussed in section 2.4 in Chapter 2 of the study.
When analysing the influence of human variables in FMCG retail environment, it is
therefore important for retailers to understand relevant demographic variables since these

6
have an effect on the behaviour of consumers also, in this instance, in the FMCG retail
stores.
Demographics refer to population characteristics such as gender, age, race, education,
and income (Kotler & Keller, 2016:96). According to Levy and Weitz (2012:99),
demographic variables are the most effective means of defining retail market segments
because consumers can be easily identified and the size of demographic groups can be
determined. In this study, it is posited that human variables can contribute towards
creating a pleasant shopping atmosphere that is likely to impact on consumers’
purchasing decisions. Therefore, human variables create shopping experiences that are
likely to influence consumers’ decision-making. Demographics are discussed in section
2.5 in Chapter 2.
Consumers’ shopping experience is defined as a multidimensional construct focusing on
customers’ cognitive, emotional, behavioural, sensorial, and social responses to a retail
store’s offerings during the customer’s entire purchase journey (Lemon & Verhoef,
2016:3). Bagdare and Jain (2013:790) described consumer shopping experience as an
integrated series of events leading to pleasurable, involving, relaxing, rewarding and
delightful retail consumer experience in shopper’s life. Consumers’ shopping experience
is discussed in section 2.6 in Chapter 2.
1.3 PROBLEM STATEMENT
This study sets out to investigate the influence of human variables on consumers’
shopping experience in FMCG retail stores in Ekurhuleni. The highly competitive nature
of the retail market requires that retailers should differentiate themselves by creating a
pleasant store environment that will enhance consumers’ shopping experience to be
successful. Existing research concerning retail atmospherics tend to focus on ambient
and design factors such as music (Bailey & Areni, 2006; Cadwell & Hibbert, 2002; Dube
& Morin, 2001; Morin, Dube & Chebat, 2007), scent (Bone & Ellen 1999; Chebat & Mihon,
2003), and layout (Newman & Foxall, 2003). However, research on human variables has
7
received scant attention. Some scholars explored the dimension of other customers and
as the importance of managing other customers (Grove & Fisk, 1997; Martin & Pranter,
1989; Miao & Mattila, 2013), customer to customer interactions (Borges, Chebat & Babin,
2010; Dorsey, Ashley & Oliver, 2016; Moore, Moore & Capella, 2005; Zourrig & Chebat,
2009) and impact of other customers’ similarity (Brack & Benkenstein, 2012; Kwon, Ha &
Im, 2015). Several studies have been conducted on the effect of sales associates on
consumers in the retail environment (Abbes & Goudey, 2015; Azimia, Hussain & Ali,
2013; Darian, Tucci & Wiman, 2001; Hawes, Rao & Baker 1993; Jones, Moore, Stanaland
& Wyatt, 1998; Kim, Ju & Johnson, 2009; Swan, Bowers & Richardson, 1999; Yurchisin
& Damhorst, 2009). Some studies focused on investigating employee-to-customer
interactions (Beatty, Mayer & Lee, 1996; Gremler & Gwinner, 2000; Kim & Kim, 2014;
Koistinen & Jarvinen, 2016).
Most of these studies explored the retail industry in general, as well as apparel retail and
online retail, but none focused on investigating the influence of the selected human
variables (other customers and sales associates) on consumers’ shopping experience.
Furthermore, studies on all the main human variables, namely, other customers and sales
associates are only covered in reviews, and have been conducted in the retail industry in
general (Kim & Kim, 2012). Therefore, this study addressed the gap in the existing
literature that was identified by investigating the influence of the two selected human
variables (other customers and sales associates) on consumers’ shopping experience in
FMCG retail stores in a South African context.
The research problem of this study is therefore to investigate the influence of human
variables on consumers’ shopping experience in FMCG retail stores in Ekurhuleni.
1.4 PURPOSE OF THE STUDY
The purpose of this study was to investigate the influence of human variables on
consumers’ shopping experience in the FMCG retail store environment. This study
expands on a review study by Kim and Kim (2012) by empirically testing the human

8
variables. In order to do so, the human variables were empirically tested in a South African
context.
The study will provide Ekurhuleni FMCG retailers with a better understanding of the
influence that human variables have on consumers’ shopping experience. Furthermore,
the study can benefit FMCG retailers in Ekurhuleni as it will provide insight into the value
of human variables in creating a pleasant shopping experience. The rationale for focusing
on human variables is because the nature of FMCG retail store environment is self-
service. Therefore, human variables can differentiate the store from competitors by
creating a pleasant shopping experience.
1.5 RESEARCH OBJECTIVES
Based on the problem statement, a number of specific objectives were formulated:
1.5.1 Primary objective
To determine the influence of human variables, namely, other customers and sales
associates on consumers’ shopping experience in FMCG retail stores in Ekurhuleni.
1.5.2 Secondary objectives
To determine the influence of crowding on consumers’ shopping experience in
FMCG retail stores in Ekurhuleni.
To determine the influence of social relations on consumers’ shopping experience
in FMCG retail stores in Ekurhuleni.
To determine the influence of sales associates’ availability on consumers’
shopping experience in FMCG retail stores in Ekurhuleni.
To determine the influence of physical attributes of sales associates on
consumers’ shopping experience in FMCG retail stores in Ekurhuleni.
To determine the influence of behavioural attributes of sales associates on
consumers’ shopping experience in FMCG retail stores in Ekurhuleni.

9
To determine the influence of demographic variables on consumers’ shopping
experience in FMCG retail stores in Ekurhuleni.
Specific hypotheses related to the above-mentioned research objectives were tested in
the study. These hypotheses were introduced in Chapter 3 and the results are reported
in Chapter 5.
1.6 SIGNIFICANCE OF THE STUDY
The contributions of this study to the FMCG retailing sphere are both theoretical and
practical in nature. From a theoretical perspective, this study contributes to the body of
knowledge and literature of FMCG retail environment by investigating human variables.
Although available research has highlighted how effective atmospherics are in retail
environment, empirical work is mostly limited to the physical store domain, leaving the
human aspects of retail environments relatively less explored. This study sheds light on
these aspects by investigating the influence that sales associates and other customers
have on consumers’ shopping experience in FMCG retail environment.
From a practical perspective, this study aimed to provide insight and guidelines for FMCG
retailers to create a pleasant atmosphere in their stores that influence consumers’
shopping experience. Most importantly, the guidelines from the findings of the study could
help FMCG retailers to utilise sales associates effectively to create a pleasant shopping
experience. Furthermore, the findings of this study aim to highlight the influence of human
variables on consumers’ shopping experience in the FMCG retail store environment by
supporting the claim that management decisions regarding retail atmospherics cannot be
completed without considering human variables (Kwon, Ha & Im, 2015:5).
1.7 DEFINITIONS OF KEY TERMS
Appearance is defined as an aspect of culture that involves the human body as well as
the coverings and embellishments placed upon it (Hillestad, 1980:117; Kim, Won Ju &
Johnson, 2009:407).

10
Atmospherics refer to the design of an environment through visual communication,
lighting, colours, music and scent to stimulate consumers’ perceptual and emotional
responses and, ultimately, to affect their purchasing behaviour (Levy & Weitz, 2012:592).
Bricks and Mortar refer to retailers who operate in a physical building (Lusch et al.,
2011:6).
Consumer behaviour refers to the activities undertaken by people in the process of
obtaining, using and disposing of goods and services for personal use (Blythe, 2013:5).
Consumer shopping experience is the total summary of a consumer interaction with a
retail company beginning before a consumer walks into the store and ending long after
he or she leaves (Choi, Yang, Yang & Cheung, 2015:10).
Crowding refers to the number of persons in a given space (Noone & Mattila, 2009:31).
Fast-moving consumer goods refer to products that are sold quickly and at relatively
low cost, such as soft drinks, toiletries and grocery items (Nayyab et al., 2011:804; Tiwari,
2012:168).
Human variables refer to the occupants of the space of sale (customers and employees)
that can affect the perceptions and behaviours of individuals (Hamrouni & Touzi,
2011:309).
Hypermarket refers to a retail store that is larger than a supermarket and which sells
groceries, clothing, appliances, and other product categories (Levy & Weitz, 2012:38).
Other customers are defined as customers who are in the same facility simultaneously
and who are unacquainted with a focal customer (Brocato et al., 2012:385).
Retailing can be defined as the set of business activities that add value to products and
services sold to consumers for their personal or family use (Levy & Weitz, 2012:6).
11
Sales associates refer to retail sales assistants with emphasis on the importance and
professional nature of the sales function (Levy & Weitz, 2012:611).
Social factor refers to as the number, type and behaviour of customers and employees
(Lam, 2001:190).
Supermarket is a large self-service retail food store offering groceries, meat, produce,
and non-food items such as toiletries, health and beauty aids as well as general
merchandise (Levy & Weitz, 2012:35).
The research methodology used in this study is discussed in the next section.
1.8 RESEARCH METHODOLOGY
This section provides a description of the research methodology used in this study and a
discussion of the research design. The objectives of the study inform the research design
and the methodology that was selected. The sampling methods used in this study are
discussed below, followed by an overview of the questionnaire design and data collection
procedures. The issues of research ethics and the data analysis methods were also
explained. The section concludes with an indication of the delimitations of the study.
A more detailed discussion of the research methodology for the study is presented in
Chapter 4.
1.8.1 Research design
For the purpose of this study, a descriptive research design was followed. Descriptive
studies usually make use of large sample sizes and use survey and questionnaire
techniques to gather the data required (Solomon, Marshall & Stuart, 2006:113). A cross-
sectional descriptive research approach was used by employing sample surveys that are
representative of the target population. A cross-sectional design refers to the collection
12
of information from any given sample of population elements only once (Malhotra, Birks
& Wills, 2012:91). Therefore, it was appropriate for this study since the aim was to
determine consumers’ shopping experience as influenced by human variables at a
particular point in time. These consumers purchase products sold at FMCG retail stores.
A quantitative approach was therefore deemed appropriate. Quantitative research is
described as research that makes use of structured, closed-ended questions and
predesigned response options in questionnaires that are usually distributed to a
considerable number of respondents (Hair, Bush & Ortinau, 2009:154). This study was
quantitative in nature because it yielded data that was analysed statistically. In addition,
the questions in the questionnaire are closed-ended. Primary data was collected to
address the objectives of this study. This type of data refers to data collected for the
purpose of a particular study (Churchill & Brown, 2007:146).
The data collection method used in this study was a survey. According to Malhotra et al.
(2012:327), the survey method entails the use of a structured questionnaire administered
to a sample of a target population. Participants may be asked a variety of questions
regarding their behaviours, intentions, attitudes awareness, motivations, demographics,
and lifestyle characteristics (Malhotra et al., 2012:327). Surveys can be designed to
capture diverse types of information on many diverse topics and subjects (Aaker, Kumar,
Day & Leon, 2013:181). Therefore, the survey method was deemed appropriate for this
study since it set out to determine the influence of human variables on consumers’
shopping experience in the FMCG retail environment. The survey instrument used to
collect data for this study was a self-administered questionnaire. This type of
questionnaire is a survey instrument in which selected respondents take the responsibility
of reading and completing the questionnaires on their own (Zikmund & Babin, Carr &
Griffin, 2013:217). Questionnaires were handed to respondents during the mall-intercept
phase of the study for completion.

13
1.8.2 Sampling
Sampling refers to the process of obtaining information from a subset of a larger group
(McDaniel & Gates, 2013:380).
The sampling methods that were used in this study are discussed in the next sections.
1.8.2.1 Target population
The target population for this study were consumers who purchase products and services
at the FMCG retail stores. These were consumers from two shopping malls in Ekurhuleni,
namely, the East Rand Mall in Boksburg and the Festival Mall in Kempton Park. The East
Rand Mall was selected because it was rated among the top 10 malls in the Gauteng
Province, and it was also voted as the most popular shopping mall in the Ekurhuleni
Region (Trip Advisor, South Africa, 2016-2017). In turn, the Festival Mall was selected
because it is one of two shopping malls in Ekurhuleni Region with all the major FMCG
retail stores under one roof, namely Pick n’ Pay, Checkers Hyper, Game store (food
department) and a Woolworths food market. In addition, the Festival Mall is situated in
the proximity of the busiest airport in Africa, namely, OR Tambo International Airport.
Furthermore, both shopping malls were selected based on being cooperative since they
granted the researcher the necessary permission to conduct the survey. Two other
shopping malls, namely Lakeside and Carnival Malls, were also selected but refused to
grant permission.
1.8.2.2 Sampling method
A non-probability sampling method was used in this study. Non-probability refers to
instances when the chances of selecting members from the population in the sample are
unknown (Tustin, Ligthelm, Martins & Van Wyk, 2005:344). According to Malhotra et al.
(2012:501), non-probability sampling relies on the personal judgement of the researcher
rather than on chance to select sample elements. Consequently, non-probability samples
may yield good estimates of the population’s characteristics. However, they do not allow

14
for a completely objective evaluation of the precision of the results (Malhotra et al.,
2012:501). Probability sampling refers to a technique used to draw sample in which
individuals have a known chance of being selected for sample (Tustin et al., 2005:344).
The reason for selecting a non-probability sampling method over a probability method in
this study is that the researcher selected respondents based on accessibility. In addition,
respondents were conveniently intercepted at the malls and asked to participate in the
study.
The non-probability sampling method that was used to select the sample for this study
was convenience sampling. Convenience sampling refers to selecting a sample based
on being easily accessible (McDaniel & Gates, 2013:396; Tustin et al., 2005:346).
Malhotra et al. (2012:502) note that convenience sampling is the least expensive and
least time-consuming of all sampling techniques. The rationale for selecting convenience
sampling is that the sampling units were accessible, easy to measure and it was assumed
that they would be cooperative. Therefore, for the purpose of the study, convenience
sampling was deemed appropriate and convenient. The main disadvantage of
convenience sampling is that the sample may not be representative. However, the main
aim of the study was not to be entirely representative, but rather to suggest that the
findings could inform other research studies and to provide the FMCG retailers in
Ekurhuleni with knowledge regarding the influence that human variables have on
consumers’ shopping experience (Detailed limitations of the study are discussed in
Chapter 6).
1.8.2.3 Sample size
Sample size refers to the number of individual elements included in the sample of the
study (Tustin et al., 2005:97). According to Malhotra et al. (2012:499), a sample size is
influenced by the average size of the samples in studies similar to the present study. The
sample size for this study included 400 respondents. This number was based on the
sample size of similar studies guided by Bartlett, Kotrlik and Higgins (2001). Furthermore,
other similar studies that used the mall-intercept approach included El-Adly and Eid
(2015:857) who used 368 sample. Millan and Howard (2007:477) also used a 355

15
acceptable sample. Michon, Yu, Smith and Chebat (2007:492) used a 312 sample, which
was also considered acceptable. Therefore, these studies used a similar sample size as
the sample in this study.
1.9 QUESTIONNAIRE DESIGN
A five-point Likert scale was used in the questionnaire. Hair, Bush and Ortinau,
(2006:392) propound that a Likert scale asks respondents to specify the degree to which
they agree or disagree with several psychological or behavioural conviction statements
about a given entity. The items for all constructs were measured on a five-point Likert
scale (5= strongly agree, 4 = agree, 3 = neutral, 2 = disagree and 1 = strongly disagree).
A self-administered questionnaire was designed for the target sample. Because this study
adapted the work done by Kim and Kim (2012) by empirically testing the selected
constructs, all questions asked in the questionnaire were developed by the researcher to
satisfy the research objectives of the study. A detailed description of the questionnaire
designed is covered in Chapter 4; a copy of the questionnaire is attached to this
dissertation (see Appendix B).
The final questionnaire was divided into seven sections and was structured as follows:
First section – qualifying question
Second section – measured crowding
Third section – measured social relations.
Fourth section – measured the sales associates’ availability.
Fifth section – measured the physical attributes of sales associates.
Sixth section – measured the behavioural attributes of sales associates.
Seventh section – determined relevant demographic information of respondents.
The sub-variables that were measured included crowding, social relations, sales
associates’ availability, physical attributes of sales associates and behavioural attributes

16
of sales associates. Each sub-variable was measured through a specific set of scale
items.
1.10 PRE-TEST THE QUESTIONNAIRE
A pre-test refers to a trial run of a questionnaire (Aaker et al., 2013:263; McDaniel &
Gates, 2013:360). According to Aaker et al. (2013:263), the main purpose of pre-testing
is to ensure that the questionnaire meets the researcher’s expectations in terms of the
information obtained. The questionnaire for this study was pre-tested among 40
consumers at Lambton Shopping Mall. Data was pre-tested to ensure that the questions
were clear and could be answered easily. Furthermore, pre-testing was done to minimise
errors that could occur and to indicate necessary corrections to questions that might be
difficult for respondents to answer, as well as respondents’ general reactions to the
interview.
1.11 DATA COLLECTION
Data were collected at the two shopping malls in Ekurhuleni, namely, the Festival Mall in
Kempton Park and East Rand Mall in Boksburg. Respondents were intercepted at the exit
of the shopping malls. A mall-intercept involves recruiting shoppers in a shopping mall,
qualifying them and conducting the interview at the researcher’s interviewing facilities in
the shopping mall (McDaniel & Gates, 2013:159; Tustin et al., 2005:152). Questionnaires
were distributed by the researcher to consumers who were at the malls for shopping at
the various FMCG retail stores. Customers were asked to participate in the survey on a
voluntary basis.
1.12 DATA ANALYSIS
Data for this study were analysed with descriptive and inferential statistics. The software
used to analyse data was SPSS version 24. Data are illustrated in tables and mean
scores. Prior to analysis, the research instrument was tested for reliability and validity to
ensure that the selected research method produces suitable data to address the research
problem and objectives. Reliability refers to the extent to which a scale produces

17
consistent results (Wiid & Diggines, 2015:249). The Cronbach’s alpha, which is also
known as coefficient alpha, was used in this study to assess internal consistency
reliability. Cronbach’s alpha involves computing mean reliability coefficient estimates for
all possible ways of splitting sets of items in half (McDaniel & Gates, 2013:288).
McDaniel and Gates (2013:289) define validity as the degree to which an instrument
measures what it is intended to measure. Exploratory factor analysis (EFA) was utilised
in the study using principal axis factoring. Furthermore, the rotation method considered
was Oblinim with Kaiser Normalisation. A chi-square for equal proportion was utilised to
test the hypotheses that determined the statistically differences in consumers’ proportions
regarding the influence of crowding, social relations, sales associates’ availability,
physical attributes of sales associates and behavioural attributes of sales associates on
their shopping experience. On the other hand, analysis of variance (ANOVA) and F-test
were used to test the hypotheses that determined if there were statistically significant
differences between gender, age and race (A detailed discussion of data analysis is
provided in Chapter 4).
1.13 RESEARCH ETHICS
The researcher had to adhere to ethical principles when collecting data from respondents
such as respecting their rights and informing them (Clow & James, 2014:49). Ethics can
be defined as the moral principles or values generally governing the conduct of an
individual or group (McDaniel & Gates, 2013:36). Ethical clearance was requested from
the research ethics committee of the Department of Marketing and Retail Management
at the University of South Africa, and it was obtained before data were collected (see
appendix E). Respondents were asked to sign a consent form before data collection could
proceed (see appendix A).
1.14 DELIMITATIONS OF THE STUDY
The results obtained in this study were limited to the targeted Ekurhuleni Region of the
Gauteng Province. Therefore, the study cannot be generalised to the entire South African

18
population. The unit of analysis for the study consisted of consumers who were between
the ages of 18 and 60 only. As convenience sampling was used in this study, the main
aim was not to be representative, but to make findings available for academic purposes
and to provide knowledge to the management of selected FMCG retail stores in
Ekurhuleni.
The chapter outline of the study is presented in the next section.
1.15 CHAPTER OUTLINE
This section outlines the six chapters of the study.
Chapter 1: Introduction and background
This chapter introduced the study and provided the background, problem statement,
purpose of the study, research objectives, significance of the study and definitions of key
terms. The chapter concluded with a brief description of the research methodology used.
Chapter 2: Human variables
The chapter provides a detailed discussion of the constructs other customers and sales
associates. The discussion on other customers focuses on sub-variables, crowding and
social relations. Then the sub-variables that make up sales associates, namely sales
associates’ availability, physical attributes and behavioural attributes of sales associates
were discussed. Discussion on consumer buying behaviour was provided followed by
discussions on demographics and consumer shopping experience to conclude the
chapter.
Chapter 3: Conceptual framework and hypotheses testing
This chapter provides an overview of the conceptual framework and research hypotheses
that were tested in the study. The chapter provides discussion on the human variables
19
that are investigated and tested in this study. The chapter also presents the formulated
hypotheses and provide a motivation for these. Furthermore, the chapter presents
hypotheses relating to the sub-variables of other customers and sales associates as well
as the demographics concerned for the study.
Chapter 4: Research methodology
This chapter describes the research methodology that was followed. The research design
is discussed, then the sampling approach is explained, together with designing the
questionnaire and pre-testing. Data collection and data analysis are also explained. The
researcher concludes the chapter with an explanation of the ethical considerations.
Chapter 5: Research findings
The chapter contains detailed discussion on the empirical findings of the study.
Chapter 6: Conclusions and recommendations
This chapter provides an overview of the findings. Conclusions and recommendations
based on the findings are made. These are followed by discussions on the contribution
of the study and its limitations. The chapter concludes with suggestions for future
research.
1.16 SUMMARY
The present chapter provided an overview of the study and what it aimed to achieve. It
states the background, the problem statement, purpose of the study, research objectives,
followed by the research design. Data analysis is briefly explained, followed by
delimitations of the study and a chapter outline.
20
CHAPTER 2
HUMAN VARIABLES
2.1 INTRODUCTION
The purpose of this chapter is to provide background to the notion of human variables,
by commencing with defining human variables, followed by a discussion on the influence
of other customers, which includes crowding and social relations. Then the influence of
sales associates, including sales associates’ availability, sales associates’ physical
attributes and sales associates’ behavioural attributes are also discussed. Consumer
buying behaviour and demographics were briefly discussed. Consumer shopping
experience and how human variables influence it were also discussed to conclude the
chapter.
Human variables that include other customers and sales associates can make an impact
in retail settings (Kim & Kim, 2012:819). Human variables are also referred to as social
dimensions or social factors (Baker, Grewal & Parasuraman, 1994:332; Olahut et al.,
2012:321). Turley and Milliman (2000:194) developed a framework and coined human
variables as one of the five categories of store atmospheric variables. In order to
understand human variables as an atmospheric element, various frameworks that
recognise its importance as critical factor affecting retail environments are illustrated in
Table 2.1.
Table 2.1 illustrates the classification of atmospheric variables in a retail store
environment by various authors.
Kotler (1973-1974) introduced four dimensions of store atmospherics, namely visual,
aural, tactile, and olfactory dimensions. This typology excludes crowding and employee
dimensions. Baker (1986) presented a framework that was classified into three
dimensions, namely, ambient, design and social. However, this framework does not
include exterior design. The third framework indicated in Table 2.1 was developed by
Bitner (1992) which was regarded as the most complete framework as it included ambient

21
conditions, spatial layout and functionality, signs, symbols, and artefacts. Berman and
Evans (1995) identified four key variables pertaining to store atmospherics, but excluded
human variables – on which this study focused. D’strous (2000) introduced a framework
that was inspired by Baker’s (1986) typology. As indicated in Table 2.1, the last framework
was developed by Turley and Milliman (2000) which has built on Berman and Evans’s
(1995) typology by including human variables. According to Oluhut et al. (2012:320) and
Skandani et al. (2011:53), this is the most complete framework.
Table 2.1: Classification of store atmospheric variables/dimensions
Authors Year Atmospheric variables Specifications
Kotler (1973-1974)
Four dimensions: visual, aural, tactile, olfactory.
This typology does not include human dimensions.
Baker (1986) Three dimensions: ambient, design, and social.
This typology takes into account the social dimension (human variables), but excludes the interior and exterior design of the retail store.
Bitner (1992)
Three dimensions: ambient conditions, spatial layout and functionality, and signs, symbols and artefacts.
The framework is comprehensive. Nevertheless, research on the employee side is scarce.
Berman and Evans
(1995)
Four dimensions: external variables, internal variables, landscaping and interior design, and layout.
This framework does not include the human component, and ambient factor variables are considered among the internal variables of the store.
D’Astous
(2000)
Three dimensions: irritant ambient factors, irritant design factors, and irritant social factors.
This framework is inspired by Baker’s (1996) typology.
Turley and Milliman
(2000)
Five dimensions: general exterior, general interior, layout and design, point-of-purchase and decoration, and human variables
This framework is built on Berman and Evans’ (1995) typology and it is regarded as the most complete one.
Source: Olahut et al. (2012:320) and Skandani et al. (2011:53)
22
Therefore, this study expands on Kim and Kim’s (2012) framework, which expanded on
Turley and Milliman’s (2000) framework as it is the most complete classification of
atmospheric variables, and it includes a human component. Therefore, for the purpose of
this study, human variables were adapted as categorised by Kim and Kim (2012).
As this study focuses on human variables, it is important to begin by defining the concept.
2.2 HUMAN VARIABLES DEFINED
Human variables can be defined as the occupants of the space of sale who can affect the
perceptions and behaviours of individuals (Baker et al., 1994:331; Hamroun & Touzi,
2011:309; Osman, Ong, Othman & Khong, 2014:180). The occupants of the space of
sale include the retail store customers and employees. Yoon, Seo and Yoon (2004:394)
highlight the importance of human variables in a retail store environment because
interaction encountered between employees (sales associates) and customers can
influence both. In addition, from retail store sales associates’ perspective, it can influence
their work efforts and emotional states; especially if they perceive friendliness, respect,
courtesy, and clear attentive communication from customers. This could stimulate efforts
and increase job satisfaction. Furthermore, from customers’ perspectives, interaction
encounter could play a positive role in creating a pleasant shopping environment when
they perceive sales associates as knowledgeable, friendly and professional in
appearance (Yoon et al., 2004:394).
2.3 HUMAN VARIABLES DISCUSSED
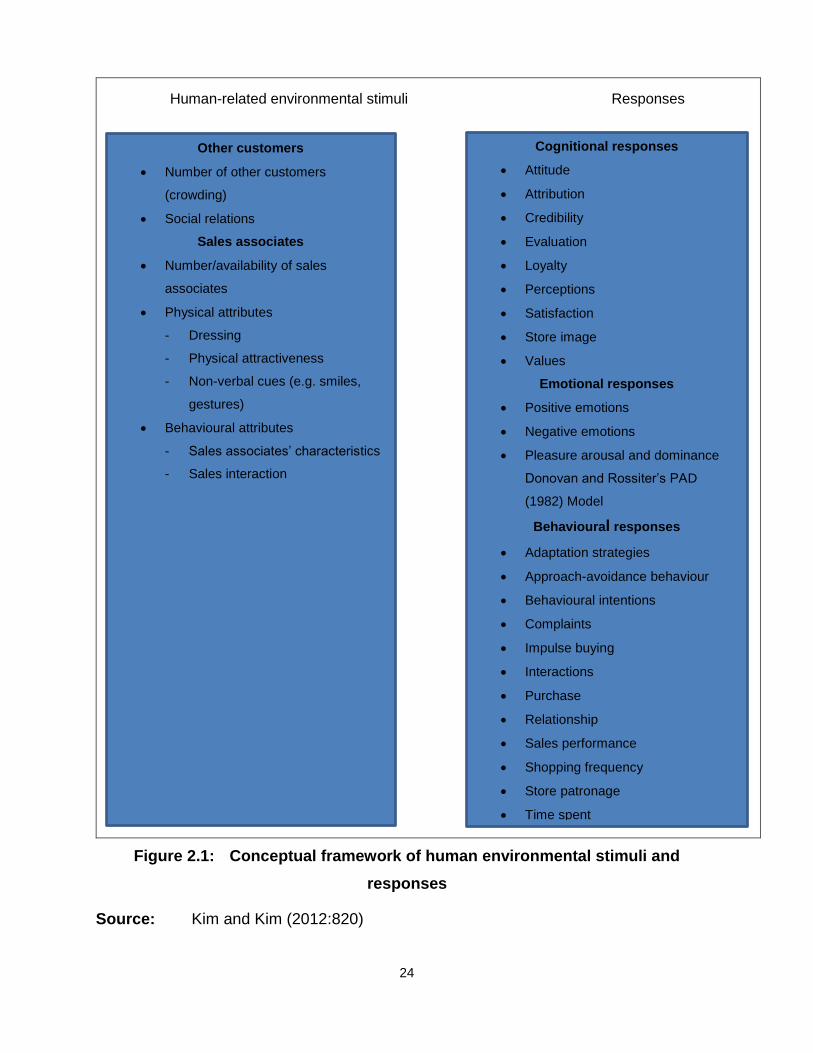
Human variables can be explained by means of the model of human environmental stimuli
as depicted in Figure 2.1 that serves as the basis of the discussion for this chapter. The
figure presents the conceptual framework of human-related environmental stimuli and
responses conceptualised by Kim and Kim (2012:820). However, for the purpose of this
study, the focus is on the first box in Figure 2.1: Human-related environmental stimuli.
Therefore, responses in the second box are excluded from the present study because the
focus of the study was to empirically test human variables in a South African context as
23
opposed to the review by Kim and Kim (2012) on which this study expands. The reason
for excluding responses in Figure 2.1 is that they were used by Kim and Kim (2012) to
classify the findings of various previous studies that were reviewed as they did not
conduct empirical research for their study.
The human-related environmental stimuli model classifies human variables into two large
categories as indicated in the first box of Figure 2.1 below. Each category includes the
following sub-variables:
Category 1: Other customers’ sub-variables are:
Crowding (number of other customers).
Social relations.
Category 2: Sales associates’ sub-variables comprise:
Sales associates’ availability.
Physical attributes of sales associates.
Behavioural attributes of sales associates.
24
Human-related environmental stimuli Responses
Figure 2.1: Conceptual framework of human environmental stimuli and
responses
Source: Kim and Kim (2012:820)
Other customers
Number of other customers
(crowding)
Social relations
Sales associates
Number/availability of sales
associates
Physical attributes
- Dressing
- Physical attractiveness
- Non-verbal cues (e.g. smiles,
gestures)
Behavioural attributes
- Sales associates’ characteristics
- Sales interaction
Cognitional responses
Attitude
Attribution
Credibility
Evaluation
Loyalty
Perceptions
Satisfaction
Store image
Values
Emotional responses
Positive emotions
Negative emotions
Pleasure arousal and dominance
Donovan and Rossiter’s PAD
(1982) Model
Behavioural responses
Adaptation strategies
Approach-avoidance behaviour
Behavioural intentions
Complaints
Impulse buying
Interactions
Purchase
Relationship
Sales performance
Shopping frequency
Store patronage
Time spent

25
2.3.1 The effects of other customers
Other customers can be defined as customers who are in the same service facility
simultaneously with, and who are unacquainted with a focal customer (Brocato et al.,
2012:385). According to Van Rompay, Krooshoop, Verhoeven, and Pruyn (2012:1126),
being with other customers may not be a pleasurable experience. However, sometimes
the presence of others may be stimulating and appreciated. Therefore, such opposing
effects indicate that there is a need for both social contact and solitude to shape
consumers’ shopping experiences (Van Rompay et al., 2012:1126). Other customers in
retailing include crowding and social relations among customers, which are discussed in
the next section.
2.3.1.1 Crowding
Harrell, Hutt and Anderson (1980) introduced retail crowding as a concept to explain the
number of other customers in retail marketing context. The number of other customers
has an effect on how individual consumers feel in a retail store. Therefore, studies of other
customers’ attributes in retail stores have centred on the number of other customers in a
retail context (Kim & Kim, 2012:821). Mehta (2013:642) points out that crowding as an
important element of human variables is also called perceived crowding or perceived
retail crowding. Crowding is defined as the evaluation or judgment of perceived density
against certain standards, norms and desired levels of interaction and information
(Rapoport, 1976:136).
Pons, Mourali and Giroux (2014:55) define density as the perception and estimate of the
number of people present in a given area, the space available and its organisation.
Therefore, density plays an essential role in the evaluation of crowding and is a necessary
antecedent for the experience of crowding (Pons et al., 2014:55). Furthermore, crowding
can be defined either from a physical perspective (number of persons in a given space)
or from a psychological perspective (perceived crowding) (Noone & Mattila, 2009:31).
Perceived crowding appears to be a multidimensional construct comprising human
crowding perceptions and spatial crowding perceptions. Human crowding perceptions

26
refer to the number of individuals and the extent of social interactions. On the contrary,
spatial crowding perceptions refer to crowding perceptions based on the amount of
merchandise and fixtures with their configuration within the store (Eroglu, Machleit & Barr,
2005:1147; Machleit, Eroglu & Mantel, 2000:30). Therefore, perceived crowding as part
of the overall environment of the store is an important determinant of customer
satisfaction (Eroglu et al., 2005:1147).
Eroglu and Machleit (1990:217) found that in high retail density conditions, task-oriented
customers experienced more retail crowding than non-task-oriented customers.
Perceived risks and time pressure associated with purchases have been shown to
intensify shopper perceived retail crowding in the environment only under conditions of
high retail density. Furthermore, in high levels of retail density, time pressure was found
to negatively affect satisfaction in the shopping environment (Eroglu & Machleit,
1990:218). However, Machleit et al. (2000:40) suggest that the effect of retail crowding
on shopping satisfaction is indirect. A crowded store may or may not result in decreased
satisfaction, depending on a number of different individual and situational factors
(Machleit et al., 2000:40).
Noone and Mattila (2009:31) examined the moderating effect of consumption goals in the
perceived crowding-satisfaction relationship. They found that regardless of service level
and customer tolerance of crowding, significantly lower satisfaction ratings associated
with crowded service environment were found when the primary consumption goal for the
service experience is utilitarian rather than hedonic in nature (Noone & Mattila, 2009:36).
Hedonic consumption refers to purchases or consumption for pleasure-related products
while utilitarian consumption refers to purchasing products for specific task (Poncin &
Ben-Mimoun, 2014:3). Task-oriented shoppers are utilitarian and non-task-oriented
shoppers are associated with hedonic behaviour. Pons et al. (2014:54) examined how
individuals react in crowded utilitarian settings and investigated the specific role of
scarcity in the density-dissatisfaction relationship. The results suggest that the scarcity of
the situation can reduce the extent to which consumers perceive negative experiences in
a dense retail situation (Pons et al., 2014:57).

27
According to Van Rompay, et al. (2012:1130), shoppers with a strong sense of affiliation
need to value the presence of others in terms of opportunities for gauging of management
behaviours. In contrast, shoppers with low affiliation needs perceive the presence of
others as a burden or constraint. In a crowded store, potential buyers may even deviate
from their planned shopping experience, such as spending less money than planned or
even leaving the store without making a purchase (Yildirim & Baskaya, 2007:3411).
Therefore, retailers should put more emphasis on managing crowding in order to create
a pleasant store atmosphere. It is important to note that crowding in the FMCG retail store
means good business for retailers, but the crowd of customers should be properly
managed to enhance consumers’ shopping experience.
Figure 2.2 below illustrates example of a less crowded FMCG retail store in South Africa.
Figure 2.2: An example of a less crowded FMCG retail store
Source: Pick n Pay South Africa
Overcrowding examples in the FMCG retail stores in South Africa are illustrated in Figure
2.3 and 2.4 to support the above discussion.

28
Figure 2.3: Example of an overcrowded FMCG store
Source: Pick n Pay South Africa
Figure 2.4: Example of an overcrowded FMCG retail store
Source: Picture provided by Checkers Holdings

29
Social relations among customers are discussed in the next section.
2.3.1.2 Social relations
The notion of other customers in retail stores also focuses on social relations among
customers. Hu and Jasper (2006:25) regard retail stores as a place of socialising. As a
result, they examined the effect of social cues on consumers’ perceptions of store image.
They found that consumers had favourable attitudes towards merchandise and service
quality, and were pleased with the stores that have more social cues. Consumers further
indicated that they were more likely to purchase in a store that had more in-store displays
of graphics with social meaning (Hu & Jasper, 2006:44).
Latane’s (1981) social impact theory is considered the most effective theory to measure
other customers’ social influence. Argo, Dahl and Manchanda (2005:207) used the social
impact theory of Latane (1981) to analyse the influence of the social presence of other
customers in a retail context. The social impact theory posits that as the size of social
presence increases, it has an escalating impact on people’s emotions and behaviours.
An increase in audience size results in participants experiencing more negative emotions
(Argo et al., 2005:208). In the same vein, Kwon, et al. (2015:2) concur by using the social
impact theory, as proposed by Latane (1981) suggesting that as number of others
increases, people feel less comfortable and experience more tension and nervousness.
Similarly, Soderlund (2011:178) also affirms that other customers who are strangers and
who are present within the same retail environment as the individual customer have an
impact on the individual customer’s overall evaluation of the retailer.
According to Brocato et al. (2012:384), perceptions of customers who are often strangers
have the potential to enhance or detract from an individual customer’s evaluation of the
retail store and shopping experience. Furthermore, customers impact one another
through interpersonal encounters directly during shopping and can indirectly have an
impact by being part of the environment (Bracato et al., 2012:384).

30
The effect of similarity in customers’ social relations
Social relations can further be analysed by considering how perceived similarity impacts
on a customer who tends to share the same environment with customers similar to
him/her and who influence his or her evaluation of the shopping experience. Kwon, et al.
(2015:2) define perceived similarity to other customers as the degree to which other
customers are perceived as resembling an individual customer. Furthermore, Brack and
Benkenstein (2012:502) describe similarity as the extent to which an individual consumer
feels that he/she is similar to other customers in the retail store. According to Byrne’s
(1971), similarity-attraction paradigm, consumers are attracted to others who have similar
traits as themselves. In addition, an individual consumer’s judgement of similarity may
include different dimensions such as appearance, race and age (Brack & Benkenstein,
2012:502; Kwon et al., 2015:2). Therefore, it is important for retailers to understand that
similarity plays a major role in creating a pleasant store atmosphere. It is also important
to look at the effects of sales associates and how they contribute to the creation of a
pleasant atmosphere in the store.
The second category of human variables that involves sales associates is discussed
below.
2.3.2 The effects of sales associates
The retail sales associate often serves as a critical nexus between retailers and their
consumers because sales associates can provide information and services to assist
consumers during the purchasing process (Osman, et al., 2014:182). The effects of sales
associates’ sub-variables, namely, sales associates’ availability, physical attributes of
sales associates and behavioural attributes of sales associates are discussed in the next
sections.

31
2.3.2.1 Sales associates’ availability
Kim and Kim (2012:824) emphasise sales associates’ impact on consumers’ responses
towards the FMCG retail stores. Consumers are likely to respond positively towards
FMCG retail stores that have sales associates that are always available to assist them.
The main purpose of sales associate availability in a physical retail store is to assist
consumers whenever the need arises. Assistance that consumers might need include
help such as when they are confused by various product offerings or shopping for
unfamiliar or complex products, or when they cannot find a particular product (Komiak,
Wang & Benbasa, 2005:50). Furthermore, the key role played by the number of sales
associates in determining quality of service as well as influencing store image is pointed
out (Kim & Kim, 2012:824). According to Kang (2012:9359), a salesperson who is flexible,
autonomous and creative is more desirable as he/she is the most important business
asset to enable a retailer to achieve a better competitive advantage. In addition, sales
associates’ performance relates strongly to the company’s performance and sales (Kang,
2012:9359).
Baker, Grewal and Levy (1992:45) assert that the number, appearance and behaviour of
retail store sales associates may help shape customers’ perceptions of service levels in
a store. Furthermore, a larger number of sales associates increase the arousal levels in
the store. However, too many sales associates and their constant badgering “Can I help
you” can irritate other customers. Nonetheless, an arousing store environment will attract
customers to remain longer in the store. According to Zourrig and Chebat (2009:154),
when customers perceive more sales associates visible in the retail store, their waiting
expectations in the queue are more positive. Baker et al. (2002:127) suggest that the
number of sales associates on the floor influence customers’ time or effort cost
perceptions. Furthermore, Shao, Baker and Wagner (2004:1166) highlight that sales
associates’ availability in the retail store positively affect consumers’ shopping
experience.
It is clear that retailers should focus on hiring a sufficient number of sales associates and
equip them with the necessary customer interaction skills in order to be successful. In

32
addition, FMCG retailers should ensure that sales associates are always available to
assist customers.
2.3.2.2 Physical attributes of sales associates
Kim and Kim (2012:824) regard sales associates’ physical attributes as the most
important element of retailers’ brand strategy to communicate their brand image. Brand
image refers to the consumers’ perceptions about the brand as reflected by the brand
associations held in the consumer’s memory (Keller, 2013:72). Sales associates’
appearance is a powerful design component that helps to create an impression. In
addition, attractive people are considered more sociable and more accomplished at tasks
(Nelson & Bowen, 2000:87). The sub-variables of physical attributes include dress,
physical attractiveness and non-verbal cues.
2.3.2.2.1 Dress
Dress can be defined as the total arrangement of material dimensions such as garments,
jewellery and accessories to the body and detectable modifications of the body (Kang,
Sklar & Johnson, 2011:412; Shao et al., 2004:1165). Dress in the retail context is one of
the tangibles associated with a company’s service that directly influence customers’
expectations (Shao et al., 2004:1165). Sales associates wearing appropriate dress
influence consumers’ purchase intentions, particularly in a situation where consumers are
not highly involved in a purchase situation (Kim, Ju & Johnson, 2009:409). In addition,
consumers’ age moderates the influence of sales associates’ clothing type on their
attitudes towards sales associates; for example, sales associates’ informal clothing may
appeal to young consumers, while formal clothing influences senior consumers (Kim et
al., 2009:409). Yurchisin and Damhost (2009:458) point out that sales associates’
appearance reflects the retail store’s identity. Sales associates who share common traits
with the retail store for which they work can express both their own traits and their stores’
image through their dress. Furthermore, sales associates’ appearance may be one of the
behaviours indicative of employee-organisation identification (Yurchisin & Damhost,

33
2009:259). Therefore, the clothing worn by sales associates forms part of the
performance of an organisation (Pettinger, 2004:180).
According to Olahut et al. (2012:333), professionally appearing sales associates are
important to perceptions of service; for example, the effects of sales personnel who are
wearing aprons can lead customers to have certain perceptions of high level of service
quality in a retail setting. Therefore, retailers should understand that the physical
appearance of sales associates has an impact on consumers’ perceptions of their
shopping experience.
2.3.2.2.2 Physical attractiveness
According to Soderlund and Julander (2009:217), the physical attractiveness of sales
associates has a significant impact on the customers’ evaluation of sales associates such
as liking, trust and perceived expertise. In addition, physical attractiveness of sales
associates produces more highly valued outcomes such as customer satisfaction and can
encourage store management in terms of rewarding a sales associate (Soderlund &
Julander, 2009:222). Physically attractive sales associates have a positive impact on
customers’ purchase intentions (DeShield, Kara & Kaynak, 1996:92). Furthermore,
Nickson, Warhurst and Dutton (2005:196) emphasise the importance of sales associates’
ability to look good physically. Most importantly, this indicates how important physical
attractiveness could be to persuade consumers to spend more and make unplanned
purchases in FMCG retail stores.
2.3.2.2.3 Non-verbal cues
According to Kim and Kim (2012: 824), non-verbal communications of sales associates
displayed through facial expressions, tone of voice, gestures, and body movements have
been found to be important aspects of physical attributes. Non-verbal communication is
the most important means of interaction between sales associates and customers (Orth,
Bouzdine-Chameeva & Brand, 2013:301).

34
Limbu, Jayachandran, Babin and Peterson (2016:657) introduced a non-verbal
immediacy model that entails a set of behaviours that enhance closeness and non-verbal
interaction with another and reduce psychological distance between individuals. The non-
verbal communication cues that increase immediacy include eye contact, gestures,
relaxed body, position, vocal expressiveness, movement, and proximity. Furthermore,
non-verbal communication has been found to exert a significant effect on a customers’
evaluation of a service encounter (Limbu et al., 2016:657). According to Drollinger and
Comer (2013:51), sales associates who display active listening behaviours with empathy
are able to pick up non-verbal emotional messages such as excitement, urgency, anxiety,
and anger from the customer and respond in a verbal and nonverbal manner that
expresses understanding rather than imitation. Empathic understanding provides the
sales associates with insightful information regarding the nature of the interaction and
also helps to guide them to be more self-aware of their own non-verbal actions and words
(Drollinger & Comer, 2013:51).
2.3.2.3 Behavioural attributes of sales associates
Consumers of goods and products deem determining sales associates’ behavioural
attributes most important. Retailers need to understand the nature of the attributes that
their sales associates provide as part of the retail store’s total attribute bundle (Hawes,
Rao & Baker, 1993:62). In addition, sales associate need to have a sound understanding
of customer’s view of his/her role as a facilitator in the purchasing process (Hawes et
al.,1993:62). The effect of sales associates’ behavioural attributes is divided into two sub-
variables, namely characteristics and sales interaction, as indicated in Figure 2.1.
2.3.2.3.1 Sales associates’ characteristics
Sales associates’ characteristics are also termed attributes that play a major role in the
retailer’s business success (Hawes et al., 1993:63). The most frequently noticed sales
associates’ characteristics include sales associates’ respect for customers; their
knowledge of products and services; their responsiveness (which is the willingness and
readiness to provide prompt service); their friendliness to customers; and their availability

35
(Darrian et al., 2001:208; Sum & Hui, 2009:100). It was further indicated that sales
associates are important because they have selling roles, representing the company as
a contact point, interact with customers and influence their final purchasing decisions
(Kang, 2012:9360). In addition, Kang (2012:9360) points out the critical role played by a
sales associate who is customer-oriented. Sales associates’ customer orientation refers
to the extent to which the sales associate knows and responds to customers’ needs or
wants (Kang, 2012:9360). In addition, Broxendorf, Muhlmeier, Tomczak, and Eisend
(2010:1149) highlight the importance of sales associates’ competence characteristics in
terms of task competence and interaction competence. Task competence refers to the
knowledge, the ability and the concern to fulfil the task based on the expertise regarding
the customers’ needs while interaction competence relates to satisfying the customers
(Broxendorf et al., 2010:1149).
According to Orth, et al. (2013:301), sales associates’ characteristics are regarded as the
drivers of successful retail communication. The outcomes of sales associates’
characteristics include trust, satisfaction, loyalty, and a positive shopping experience
(Orth et al., 2013:301). Trust as part of the results of sales associates’ characteristics is
regarded as the most important aspect that strengthens the relationship between a sales
associate and a customer. According to Swan, Bowers and Richardson (1999:94),
customers’ trust in sales associates has two components, namely, affect and cognition.
Affect refers to feeling secure or insecure about relying on a sales associate, while
cognition is the belief that the sales associate has both the necessary competence and
motivation to be relied upon (Swan et al., 1999:94). Therefore, FMCG retailers should
understand that sales associates’ characteristics are valuable in persuading consumers
to make purchases in the store. It can thus be said that the same can be true for sales
associates’ selling interactions.
2.3.2.3.2 Sales interaction
Sales associates epitomise, represent and define the brand to the customer by
transforming and implementing a company’s brand strategy (Broxendorf, et al.,
2010:1148). This is what sales associate do when they interact with customers during the

36
sales process. The customer’s interaction with the sales associate impacts his/her
perception of the sales associate and the brand (Broxendorf et al., 2010:1148). During a
sales encounter, the interaction between sales associates and the customer therefore
has an impact on the customer’s perception of the sales associate and the perception of
the brand (Brexendorf et al., 2010:1148). In addition, customers frequently experience
emotions when they are involved in interactions with a retail sales associate (Menon &
Dube, 2000:285).
According to Abed and Haghighi (2009:268), sales associates should establish and
maintain long-term relationships with customers through their behaviour. Therefore,
enhancing the sales associate’s skills in terms of selling strategies would lead to a better
ability to understand the situation of the customer, which could lead to improved
interaction with customers and hone their ability to build and maintain relationships with
customers (Abed & Haghighi, 2009:268). The customer service provided by sales
associates is a critical element in attracting and retaining customers (Sum & Hui,
2009:99). Therefore, it is important to understand that sales associates are likely to have
an effect on how the customer feels about the retail store through their interactions
(Osman et al., 2014:182).
As this study sought to determine the influence of human variables on consumers’
shopping experience, it is important to provide a brief discussion of consumer buying
behaviour.
2.4 CONSUMERS’ BUYING BEHAVIOUR
Consumers exchange their money for goods and services on a daily basis for own use
and for their families. Individual consumers choose products that will satisfy their needs,
and make buying decisions that will affect their lives for years to come (Blythe, 2013:4).
Furthermore, Schiffman and Wisenblit 2015:30) stated that consumer behaviour explains
how individuals make decisions to spend their available resources such as money, time
and efforts on products that the marketers offers for sale. Moreover, the study of
consumer behaviour describes what products and brands consumers buy, why they buy

37
them, when they buy them, where they buy them, how often they buy them, how often
they use them, how often they evaluate them after the purchase, and whether or not they
buy them repeatedly (Schiffman & Wisenblit, 2015:30).
Consumer behaviour is defined as the totality of consumers’ decisions with respect to the
acquisitions, consumptions and disposition of goods, services, activities, experiences,
people, and ideas by decision-making units (Hoyer, Maclinnis & Pieters, 2013:3; Ling,
Alessandro & Winzar 2015:6). Similarly, Parumasur and Roberts-Lombard (2014:2)
describe consumer behaviour as a combination of activities and influences that occurs
before, during and after the purchase itself. FMCG retailers should understand consumer
behaviour in relation to using and disposing of products as well as how consumers buy
those products.
According to Hoyer et al. (2013:4), consumer behaviour involves more than just buying.
It includes the following activities that consumers perform:
Acquiring represents acquisition behaviour, the behaviour that consumers
displays on acquiring products and services.
Using involves how consumers use the products they acquired. When it comes
to usage, marketers are interested in knowing when consumers are likely to use
the product and how they react after using it, such as spreading positive or
negative word of mouth.
Disposing involves how consumers get rid of the product that they have
purchased.
It is therefore important for FMCG retailers to understand these activities. The above
activities are influenced by individual and group factors that affect consumers’ decisions
to purchase products and services. Individual factors include motivation, perception,
learning ability, attitudes, personality, and life-styles. Individual factors refer to factors
inherent in human behaviour that will influence an individual’s behaviour as a consumer
(Cant, 2010b:104). Group factors are the concepts and ideas that influence consumers

38
when interacting with others (Cant, 2010b:62). Group factors include culture, family,
reference groups, social class and opinion leaders.
Consumers follow various stages in the consumer decision-making process when they
discover that they have a need that must be satisfied. These stages are very important
for FMCG retailers to understand because they will enable them to understand how
consumers gather information that leads them to purchasing decision-making.
Human variables and demographics determine consumers’ buying behaviour towards the
FMCG retail stores, also in the case of the selected malls in Ekurhuleni. Therefore, it is
important to understand consumers’ demographics as discussed below.
2.5 DEMOGRAPHIC VARIABLES
Demographics can be defined as the study of human population based on age, race,
gender, economic status, education, income, and employment (Kotler & Keller, 2016:96;
Levy & Weitz, 2012:597; Wiid, 2014:23). Cant (2013b:37) describes demographics as an
objective characteristics of an individual’s age, race, gender, income, and education.
According to Wiid (2014:23), demographic variables can provide insight into various
groups of consumers and their behaviour. Furthermore, they can enable the FMCG
retailers to characterise consumers correctly and create demographic profiles for different
market segments (Wiid, 2014:23). Demographic variables are therefore important in
terms of how consumers behave towards FMCG retail stores. Demographic shifts such
as changing trends regarding the population size and composition are at the root of many
changes in the society (Louw & Venter, 2010:181). Therefore, changes in any or more of
these demographic variables over time could have a significant impact on the FMCG retail
industry in Ekurhuleni (Louw & Venter, 2010:182).
Demographic variables in the FMCG retail environment may also have a positive impact
on the buyer-seller relationship (Kwak & Sojka, 2011:118). In addition, Mittal, Cambra-
Fierror, Pres, and Grott (2017:222) highlight the importance of consumers’ demographic
characteristics in retailing because different profiles may lead to different behaviours.

39
Interestingly, customers and sales associates’ similarity in terms of age, height, race, and
gender increase the probability of sales (Kim & Kim, 2012:825). Therefore, it is important
for FMCG retailers to understand demographic variables since they play a crucial role in
determining consumers’ reaction towards human variables in the store.
The demographic variables that this study focuses on include gender, age and race. For
the purpose of the study, these demographic variables were tested with regard to the
influence of crowding, social relations, sales associates’ availability, physical attributes of
sales associates, and behavioural attributes of sales associates on consumers’ shopping
experience.
2.6 CONSUMER SHOPPING EXPERIENCE
In today’s constantly changing market, retailers acknowledge consumers’ shopping
experience as an important component in sustaining a competitive advantage (Stein &
Ramaseshan, 2016:8). In the context of this study, it is important to understand the
significant role that pleasant shopping experience play in attracting consumers to the
FMCG stores and encourage repeat purchases.
2.6.1 Consumer shopping experience defined
Consumers’ shopping experience is defined as the total summary of a consumer’s
interaction with a retail company beginning before the consumer walks into the store and
ending long after he/she leaves it (Choi, Yang, Yang & Cheung, 2015:10). Lang and
Hooker (2013:640) consider shopping experience as the intersection between retail
setting and consumer behaviour, as shopping within a well-designed retail environment
is an important part of acquisition. Moreover, Bagdare and Jain (2013:790) describe
consumer shopping experience as an integrated series of events leading to pleasurable,
involving, relaxing, rewarding, and delightful retail consumer experience in a shopper’s
life. Furthermore, retail consumer shopping experience involves dimensions such as joy,
mood, leisure, and distinctive (Bagdare & Jain, 2013:792).
40
Joy of shopping involves the fun and pleasure derived from entertaining shopping
experiences (Bagdare & Jain, 2013:792). A joyful shopping experience consists
of engaging, involving and entertaining based on active or passive participation
of the customer in the entire shopping experience. FMCG retailers in Ekurhuleni
should create a joyful shopping experience to encourage repeat purchases.
Mood refers to a mild, transient generalised affective state that creates the
shopping experience (Bagdare & Jain, 2013:793; Osman et al., 2014:182).
According to Osman et al. (2014:182), a store atmosphere affects shoppers’
mood and influence purchasing behaviour. The store environment can create a
positive or negative mood. Positive mood can be generated by pleasant
environment and influence approach behaviour, while a negative mood is
generated by unpleasant store environment and can create avoidance response
(Osman et al., 2014:183). FMCG retailers in Ekurhuleni should consider creating
a pleasant environment to enhance shopping experience and differentiate the
store from competitors.
Leisure refers to the free choice of activity associated shopping (Backstrom,
2011:200). A leisure activity turns a shopping result into pleasure, enjoyment,
perceived freedom, and customer delight (Bagdare & Jain, 2013:793). Therefore,
it is important for FMCG retailers to use leisure activity to persuade consumers
to spend more time in their stores in order to make more purchases.
Distinctive awareness involves creating a store environment that gives a unique
experience (Bagdare & Jain, 2013:793). The FMCG retail store that creates
unique and pleasurable events develops a distinctive image for identification and
recognition.
2.6.2 Consumers’ evaluation of shopping experience
FMCG retailers should understand that any experience that consumers have with the
store will be critical in their evaluation of shopping outcomes, such as being pleasurable
or not. According to Millan and Howard (2007:475), any kind of shopping should be
pleasurable as certain groups of shoppers are more interested in pleasure outcomes of

41
shopping than others. Therefore, stores that produce emotions that are more pleasurable
may relate to different purchasing behaviours. Juwaheer, Punderuthis and Ramdin
(2013:179) highlight the strategic importance of shopping experience to increase
customer patronage in retail stores. Srivastava and Kaul (2014:1029) emphasise the role
that shopping experience play as consumers are not only visiting the FMCG retail stores
only for purchase, but also for enjoyment and entertainment purposes. In addition,
consumers evaluate the retail stores in terms of how much pleasure or fun they have
received (Srivastava & Kaul, 2014:1029). Consumer shopping experience in the retail
environment is widely recognised as the internal and subjective response that consumers
have to any interaction with the retail store (Pine & Gilmore, 1998:99). Moreover,
consumers have experiences anytime they touch any part of the product, service or brand
(Stein & Ramaseshan, 2016:8). Furthermore, EL-Adly and Eid (2015:849) state that
social interaction value also enhances consumers shopping experience. Social
interaction value refers to the benefit consumers enjoy in positive shopping experience
through interacting with other customers and sales associates in the FMCG retail store
(EL-Adly & Eid 2015:849).
2.7 THE INFLUENCE OF HUMAN VARIABLES ON CONSUMERS’ SHOPPING
EXPERIENCE
The literature highlighted that the FMCG consumers’ needs in the 21st century are more
than just the products and services. Therefore, pleasant consumers’ shopping experience
is the most powerful component to position the retail store. In this case, human variables
can be one of the effective tools to create consumers’ shopping experience. FMCG
retailers can use human variables to influence the behaviour of consumers towards their
stores. This could be done by managing crowding effectively, and equip their sales
associates with necessary knowledge of creating a pleasant shopping atmosphere that
will enhance consumers’ shopping experience. As mentioned earlier, some consumers
are positively influenced by the presence of other customers while some tend to be
negatively influenced as they feel frustrated in a crowded retail store (Van Rompay et al.,
2012:1126).

42
Furthermore, sales associates could play a crucial role in providing an interpersonal retail
experience as they influence consumers’ emotions in the FMCG retail store (Osman et
al., 2014:182). The literature review emphasised that other customers and sales
associates influence consumers’ shopping experience in the retail stores. Kim and Kim
(2012:836) indicate that human variables in the retail store influence consumers’
perceptions towards the stores and their own behaviour. According to Srivastava and
Kaul (2014:1030), the social environment of the store as well as the interactions between
the sales associates and the customers affects consumers’ shopping experience at a
retail store. In addition, interactions among customers can also have an influence on
consumer shopping experience (Srivastava & Kaul 2014:1030).
2.8 SUMMARY
The literature indicate that crowding, social relations, sales associates’ availability,
physical attributes of sales associates and behavioural attributes of sales associates
influences consumers. The influence of human variables in creating a pleasant store
atmosphere was also highlighted. The aim of this chapter was to provide background on
pertinent human variables and to define these human variables. The influence that other
customers have, which is made up of sub-variables, namely crowding and social
relations, was also discussed. The influence of sales associates on consumers was
therefore perused, after the sub-variables of sales associates (which include sales
associates’ availability, physical attributes and behavioural attributes) were discussed.
The influence of human variables with regard to demographics was then discussed.
Consumer shopping experience was defined and consumers’ evaluation of shopping
experience was discussed as well as the influence that human variables have on
consumers’ shopping experience to conclude the chapter.
The hypotheses and conceptual framework of this study are discussed in the next
chapter.

43
CHAPTER 3
THE CONCEPTUAL FRAMEWORK AND HYPOTHESES
3.1 INTRODUCTION
In this chapter, an overview of the conceptual framework of the study is provided, followed
by a description of crowding, social relations, sales associates’ availability, physical
attributes of sales associates, and behavioural attributes of sales associates. The chapter
also provides a motivation for the hypotheses tested in the study.
3.2 THE CONCEPTUAL FRAMEWORK TESTED IN THE STUDY
This study determines the influence of human variables on consumers’ shopping
experience in FMCG retail stores in Ekurhuleni. As mentioned in Chapter 1 and 2, the two
main types of human variables on which the study focused are other customers and sales
associates. These human variables comprise sub-variables. The sub-variables for other
customers include crowding and social relations, while sales associates’ sub-variables
include sales associates’ availability, physical attributes of sales associates and
behavioural attributes of sales associates (Kim & Kim, 2012:820).
Human variables can be defined as the occupants of the space of sale who may affect
the perceptions and behaviours of individuals (Baker et al., 1994:331; Hamroun & Touzi,
2011:309; Osman, et al., 2014:180). For this study, the occupants of space of sale pertain
to other customers and sales associates. Other customers with regard to crowding and
social relations were determined by testing various hypotheses discussed later in this
chapter. On the other hand, the hypotheses that determine the influence of sales
associates on consumers’ shopping experience were tested with regard to sales
associates’ availability, physical attributes of sales associates, and behavioural attributes
of sales associates. Furthermore, the hypotheses were also tested on demographic
variables, namely gender, age and race to determine if there are significant differences
with regard to the influence of crowding, social relations, sales associates’ availability,

44
physical attributes of sales associates, and behavioural attributes of sales associates on
consumers’ shopping experience.
Sales associates can facilitate how consumers feel with regard to crowding and social
relations. Sales associates can have an effect on how consumers feel when shopping in
the FMCG retail stores as they are likely to impact on customers’ moods (Osman et al.,
2014:182). In addition, sales associates play a critical role in FMCG retailing as their
assistance to consumers can positively impact on consumers’ experience about the store
(Kim & Kim, 2012:819).
3.2.1 An overview of the conceptual framework tested in this study
The conceptual framework tested in this study is illustrated in Figure 3.1. The framework
is based on five sub-variables of other customers and sales associates. The sub-variables
of other customers as depicted in the framework are crowding and social relations.
Conversely, the human variables’ sales associates in the framework are made up of sales
associates’ availability, physical attributes of sales associates and behavioural attributes
of sales associates. The objectives of this study were to determine consumers’ shopping
experience in light of these five sub-variables and demographic variables in FMCG retail
stores in Ekurhuleni. These five sub-variables and demographic variables of consumers
that participated in the study, namely, gender, age and race are illustrated in Figure 3.1
below.
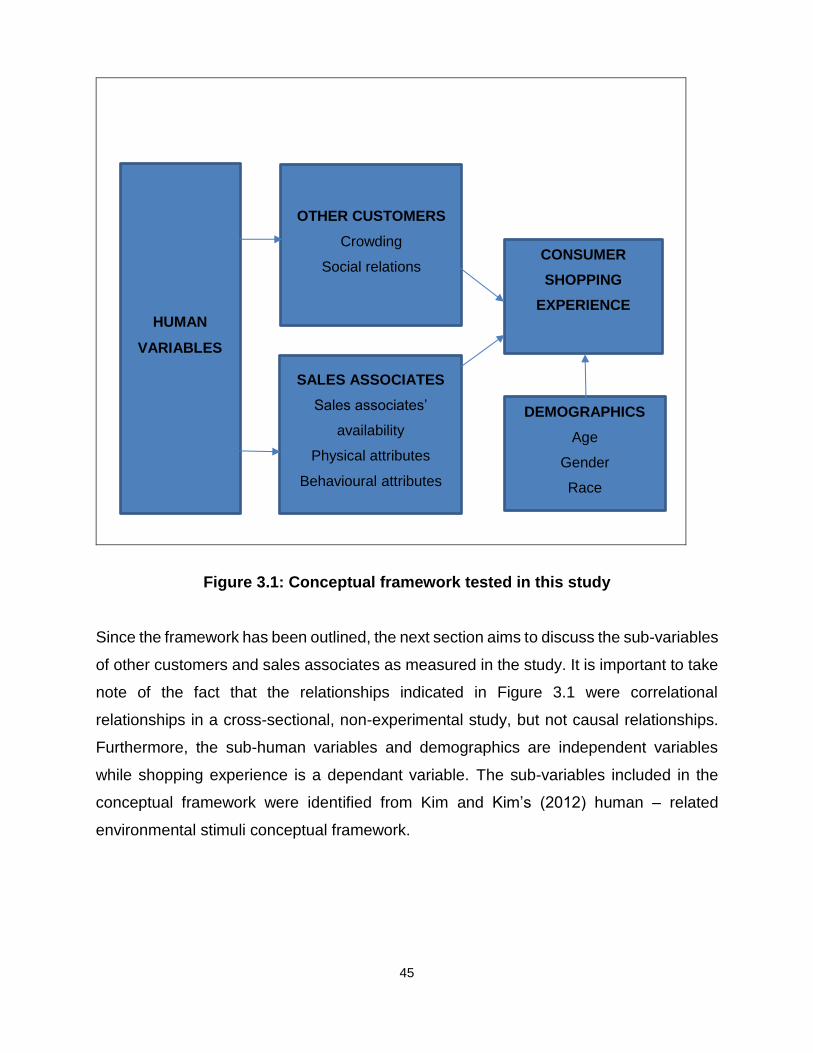
45
Figure 3.1: Conceptual framework tested in this study
Since the framework has been outlined, the next section aims to discuss the sub-variables
of other customers and sales associates as measured in the study. It is important to take
note of the fact that the relationships indicated in Figure 3.1 were correlational
relationships in a cross-sectional, non-experimental study, but not causal relationships.
Furthermore, the sub-human variables and demographics are independent variables
while shopping experience is a dependant variable. The sub-variables included in the
conceptual framework were identified from Kim and Kim’s (2012) human – related
environmental stimuli conceptual framework.
CONSUMER
SHOPPING
EXPERIENCE
SALES ASSOCIATES
Sales associates’
availability
Physical attributes
Behavioural attributes
DEMOGRAPHICS
Age
Gender
Race
OTHER CUSTOMERS
Crowding
Social relations
HUMAN
VARIABLES
46
3.2.2 Measuring the influence of human variables on consumers’ shopping
experience
A five point Likert scale ranging from 1 = strongly disagree to 5 = strongly agree was used
to measure the influence of other customers and sales associates’ attributes. The two
sub-variables of other customers, namely crowding and social relations were measured
with four statements/items each (see questionnaire: appendix B). Conversely, sales
associates’ attributes were measured with three sub-variables, namely availability (3
statements), physical attributes (3 statements) and behavioural attributes (4 statements),
(see the questionnaire in Appendix B). It is important to indicate that there are some
statements that were eliminated owing to low loading (see Table 5.6 in Chapter 5).
The hypotheses of this study are linked to the secondary objectives to test if the
proportions of consumers are statistically different regarding the influence of crowding,
social relations, sales associates’ availability, physical attributes of sales associates, and
behavioural attributes of sales associates on their shopping experience in FMCG retail
stores in Ekurhuleni. On the other hand, the hypotheses were also formulated to test if
there are statistically significant differences between demographics, namely gender, age
and race with regard to the influence of crowding, social relations, sales associates’
availability, physical attributes of sales associates and behavioural attributes of sales
associates on consumers’ shopping experience (see the formulated hypotheses in
section 3.2.3).
The human variables (the sub-variables of other customers and sales associates’
attributes) are discussed in the next section.
3.2.3 The five sub-variables of other customers and sales associates
The focus of this study was on the sub-variables of other customers and sales associates
as the human variables that form the basis of the hypotheses that were tested in this
study.

47
These sub-variables of other customers and sales associates are tested on crowding,
social relations, sales associates’ availability, physical attributes, and behavioural
attributes of sales associates, as well as across gender, age and race. These are
discussed in the next sections. Nevertheless, hypotheses pertaining to qualification and
income were not tested as these proved to be the most sensitive demographic variables.
The researcher identified this sensitivity during the collection of data when respondents
seemed to be uncomfortable about revealing their highest qualifications and monthly
income. The challenges of high illiteracy level and lack of decent jobs in South Africa
could be the reason for respondents’ sensitivity regarding qualification and income. Since
human variables were classified into two categories (other customers and sales
associates), the development of hypotheses firstly focused on other customers’ sub-
variables and lastly, on sales associates’ sub-variables. In addition, each sub-variable
has four hypotheses, in which one hypothesis was formulated in determining if the
proportions of consumers regarding its influence on their shopping experience are
statistically different, and the other three for determining if there are statistically significant
differences between demographics (gender, age and race).
The hypotheses for other customers’ sub-variables are discussed in the next section.
3.2.3.1 Crowding
Crowding refers to the number of persons in a given space (Noone & Mattila, 2009:31;
Eroglu & Machleit, 1990). In addition, crowding can positively or negatively impact on
consumers’ experience as it may influence them to decide whether they remain or leave
the FMCG retail store (Hwang, Yoon & Bendle, 2012:225). Interestingly, a crowded store
may create an image of excitement or a feeling of restricted movement, or both (Hwang
et al., 2012:225). According to Mehta (2013:646), the assistance provided by sales
associates can reduce the negative effects of crowding. Pons et al. (2014:58) investigated
the role of scarcity and customers’ affective reactions in crowded retail situations and
found that a crowded condition hinders relaxed and peaceful shopping experience.
According to Machleit et al. (2000:29), the level of in-store crowding perceived by
shoppers can affect their patronage decisions as well as satisfaction with the overall

48
shopping activity. Eroglu et al. (2005:1151) investigated perceived retail crowding and
shopping satisfaction. The results indicated that perceived retail crowding negatively
affects shopping values.
Kim and Runyan (2011) conducted a study on the effects of mall kiosks on perceived
retail crowding. The findings revealed that consumers perceive the environment with
kiosk as crowded, and this perception of overcrowding negatively affects their approach
behaviour, leading to lower intentions to patronise (Kim & Runyan, 2011:138). In their
study, Pan and Siemens (2011:108) found that individual customers prefer a medium
level of crowding than a store with low or high crowding. Based on this discussion, the
following hypothesis was developed:
H1: Crowding influence consumers’ shopping experience in FMCG retail stores
in Ekurhuleni.
Mehta (2013:648) highlights the important role that demographic variables can play in
crowding research. Studies conducted by Raju (1980); Zuckerman, Eysenck and Eysenck
(1978) showed that gender, age, level of education, and employment status in a crowded
retail environment are correlated with individuals’ optimal stimulation levels. Optimum
stimulation levels refer to one’s desired level of environmental stimulation and
predisposition to act in the presence of environment (Wang, Chang & Wysong, 2012:7).
Yilidirim and Akalin-Baskaya (2007) conducted a study to investigate perceived crowding
in a restaurant with different seating densities. The findings indicated that male customers
had more positive perception of densities than female customers. In addition, female
customers seemed to be more critical than male customers about atmospheric attributes.
Moreover, the difference between male and female consumers was found to be
statistically significant (Yildirim & Akalin-Baskaya, 2007:3415). In addition, Baker and
Wakefield (2012) conducted a study on how shopping orientation influenced perceived
crowding, excitement and stress in a mall. The findings revealed significant differences
between male and female consumers as well as different age groups.
49
Based on the above discussion, the following hypotheses were formulated regarding
gender, age and race on the influence of crowding:
H1a: There are differences between genders with regard to the influence of
crowding on consumers’ shopping experience in FMCG retail stores in
Ekurhuleni.
H1b: There are differences between age groups with regard to the influence of
crowding on consumers’ shopping experience in FMCG retail stores in
Ekurhuleni.
H1c: There are differences between races with regard to the influence of crowding
on consumers’ shopping experience in FMCG retail stores in Ekurhuleni.
3.2.3.2 Social relations
Interaction with other customers during shopping can influence a consumer’s shopping
experience in the FMCG retail stores (Kim & Kim, 2012:823). Tombs and McColl-Kennedy
(2010:121) argue that even when customers do not interact with each other, the mere
presence of others elicits them to monitor the social behaviour of others. In addition, the
presence of others increases arousal levels within the individual consumer, which in turn,
enhances the expression of dominant behaviour (Tombs & McColl-Kennedy, 2010:121).
Brack and Benkenstein (2011:501) conducted a study on the effects of similarity
regarding the customer-to-customer relationship in a service context. Their findings
showed that similarity has a positive effect in relation to attitudes towards the service.
Soderlund (2011:174) investigated how customers who are strangers to an individual
consumer affect his/her overall evaluation of the store. The results indicated that
interacting with other customers in a retail store and purchasing activities impact on an
individual’s attitude towards a retailer and the overall evaluation.
Therefore, the following hypothesis was formulated:

50
H2: Social relations influence consumers’ shopping experience in FMCG retail
stores in Ekurhuleni.
Soderlund (2011:178) further found that there was a significant difference between
genders, as female consumers had a more positive attitude towards the store than male
consumers. Jubas (2011) conducted a study on shopping for identity taking gender, race
and class of critical consumers into consideration. The findings showed that participants’
perceptions of race and gender differed significantly.
Therefore, the following hypotheses were formulated:
H2a: There are differences between genders with regard to the influence of social
relations on consumers’ shopping experience in FMCG retail stores in Ekurhuleni.
H2b: There are differences between age groups with regard to the influence of
social relations on consumers’ shopping experience in FMCG retail stores in
Ekurhuleni.
H2c: There are differences between races with regard to the influence of social
relations on consumers shopping experience in FMCG retail stores in Ekurhuleni.
The hypotheses based on sales associates’ sub-variables are discussed and formulated
in the next section. These hypotheses are also based on three demographic variables,
namely, gender, age and race.
3.2.3.3 Sales associates’ availability
Sales associates are considered the most important variable that influences how
customers respond to a retail store (Kim & Kim, 2012:824). According to Darian et al.
(2001:211), customers prefer to shop in a retail store where sales associates are readily
available and tend to avoid retail stores where sales associates are hard to find. Baker,
Parasuraman and Grewal (1994:332) found that sales associates who greet customers
when they enter the retail store create a pleasant shopping experience. Furthermore, the

51
presence of a sufficient number of sales associates suggest that customers will be
satisfied with the retail store as they would spend less time searching for merchandise as
opposed to when there are few sales associates on the floor because these customers
may become annoyed and frustrated (Baker, Grewal, Parasuraman & Voss, 2002:127).
Therefore, the following hypothesis was formulated:
H3: Sales associates’ availability influence consumers’ shopping experience in
FMCG retail stores in Ekurhuleni.
A study by Lieven (2016) that explored customers’ choice of salespersons during the
initial sales encounter found that there was a significant difference between male and
female respondents’ preferences in terms of sales associates and the service provided.
In addition, men and women do not react in a significantly different manner towards the
influence of multi-store environment cues (Baker et al., 2002:134). However, the present
study sets out to establish whether male and female consumers in the FMCG retail stores
differ significantly or not.
Retailing studies on advertising and communication suggest that there are significant
differences among consumers in terms of both age and race. A study by Sharma (2015)
on communication across age groups found that age groups differed significantly
regarding attitudes towards advertisements. In turn, Gao, Xu and Kim (2013) investigated
the effect of racial cues on readers’ responses to advertisements. They found that
consumers of different race groups reacted differently toward brands advertisements.
Furthermore, consumers tended to react negatively towards brands that used models of
the opposite racial groups, and positively towards brands that used models of racial
groups similar to them.
The following hypotheses were formulated based on the above discussion:
H3a: There are differences between genders with regard to the influence of sales
associates’ availability on consumers’ shopping experience in FMCG retail stores
in Ekurhuleni.
52
H3b: There are differences between age groups with regard to the influence of
sales associates’ availability on consumers’ shopping experience in FMCG retail
stores in Ekurhuleni.
H3c: There are differences between races with regard to the influence of sales
associates’ availability on consumers’ shopping experience in FMCG retail stores
in Ekurhuleni.
3.2.3.4 Physical attributes of sales associates
Sales associates’ appearance and behaviour are perceived to correlate with the quality
of products and service offered in a retail store (Haj-Salem, Chebat, Michon & Oliveira,
2016:1222). Tsai and Huang (2004:1006) found that sales associates who display
positive behaviour such as greeting, smiling and establishing eye contact increase
customers’ willingness to return and recommend the store to others. Soderlund and
Julander (2009:216) investigated the effects of attractiveness of service workers on
customers’ satisfaction, and found that high levels of physical attractiveness produced
high levels of satisfaction. Therefore, the following hypothesis was formulated:
H4: Physical attributes of sales associates influence consumers’ shopping
experience in FMCG retail stores in Ekurhuleni.
Osman, et al. (2014:182) assert that sales associates’ physical attributes include dress,
physical attractiveness, demographics, and non-verbal cues. In turn, Richard, Stuart,
McKay, and Sackett (2017), investigated the impact of store-unit–community racial
diversity congruence on store-unit sales performance. The results indicated that racial
diversity congruence resulted in significantly higher store-unit sales performance than
racial diversity incongruence. Shao, et al. (2004) investigated the effects of
appropriateness of the clothing of service contact personnel on customers’ expectations
of services quality and purchase intention. Their findings revealed that male and female
customers were significantly different in their cognitive responses to the dress of service
contact personnel (Shao et al., 2004:1173).
53
Therefore, the following hypotheses were formulated:
H4a: There are differences between genders with regard to the influence of
physical attributes of sales associates on consumers’ shopping experience in
FMCG retail stores in Ekurhuleni.
H4b: There are differences between age groups with regard to the influence of
physical attributes of sales associates on consumers shopping experience in
FMCG retail stores in Ekurhuleni.
H4c: There are differences between races with regard to the influence of physical
attributes of sales associates on consumers’ shopping experience in FMCG retail
stores in Ekurhuleni.
3.2.3.5 Behavioural attributes of sales associates
The influence of sales associates’ behavioural attributes can be divided into two
categories, namely, characteristics and interaction (Kim & Kim, 2012:826). Customers’
satisfaction with their shopping experience is also influenced by the quality of interaction
with sales associates since highly empathetic sales associates evoke more attention from
customers because empathy stimulates interaction (Srivastava & Kaul, 2014:1030).
Darian et al. (2001:210) investigated how sales associates’ behavioural attributes
influence customers’ retail patronage intentions. The results indicated that sales
associates’ respect for customers, knowledge and responsiveness are the most important
attributes that influence customers to patronise a retailer. Menon and Dube (2000:285)
conducted a study to investigate salespersons’ responses to customers’ emotions with a
view to ensure greater satisfaction. The findings showed that salespersons’ positive
responses led to greater customer satisfaction. Therefore, this hypothesis was
formulated:
H5: Behavioural attributes of sales associates influence consumers’ shopping
experience in FMCG retail stores in Ekurhuleni.

54
Prendergast, Li and Li (2014), investigated consumers’ perception, gender and credibility.
The results showed that there were significant differences between male and female
consumers regarding sales associate’s credibility in terms of trustworthiness and
attractiveness. However, with regard to perceived expertise, there was no significant
difference between genders (Prendergast et al., 2014:204). In addition, Jones et al.
(1998) conducted a study on sales person’ race and gender, and found that race and
gender showed significant differences on the impact of buyer seller’s credibility and
trustworthiness.
Therefore, the following hypotheses were formulated:
H5a: There are differences between genders with regard to the influence of
behavioural attributes of sales associates on consumers’ shopping experience in
FMCG retail stores in Ekurhuleni.
H5b: There are differences between age groups with regard to the influence of
behavioural attributes of sales associates on consumers’ shopping experience in
FMCG retail stores in Ekurhuleni.
H5c: There are differences between races with regard to the influence of
behavioural attributes of sales associates on consumers’ shopping experience in
FMCG retail stores in Ekurhuleni.
The results for testing these hypotheses are presented in Chapter 5.
3.3 SUMMARY
This chapter presented the hypotheses formulated for the present study. These
hypotheses are based on five sub-variables, namely crowding, social relations, sales
associates’ availability, as well as their physical attributes and behavioural attributes.
Each sub-variable was considered in light of three demographic variables, namely
gender, age and race. This chapter also provided the theoretical background of each sub-
variable to support the formulation of the hypotheses. It was indicated that all secondary

55
objectives were used to measure the influence of human variables on consumers’
shopping experience in FMCG retail stores in Ekurhuleni. In addition, the hypotheses are
linked to the objectives of the study.
The research design and methodology used for this study are discussed in Chapter 4.

56
CHAPTER 4
RESEARCH METHODOLOGY
4.1 INTRODUCTION
This chapter presents the research methodology used for the present study. The research
process and the steps that were followed in this study are also discussed, together with
an explanation of the research design, the sample, sampling techniques, and data
collection methods. The analysis of the data is presented and finally ethical issues are
discussed.
4.2 THE MARKETING RESEARCH PROCESS
Marketing research can be defined as the systematic gathering and analysis of marketing-
related data to provide information that can be used by FMCG retailers in decision-making
processes (Clow & James, 2014:3; McDaniel & Gates 2013:4). Marketing research
involves following a systematic sequence of steps that can produce viable and valid data
(Clow & James, 2014:3).
The research process entails a systematic, planned approach to ensure that all aspects
of the study are properly addressed (Aaker et al., 2013:42). The research design and
implementation thereof must correlate with the research purpose and objectives to ensure
that the results are useful. For the purposes of this study, the steps in the research
process are depicted in Figure 4.1 below. These form the basis of discussions for the
present chapter.

57
Figure 4.1: The marketing research process
Source: Aaker et al. (2013:43); McDaniel and Gates (2013:67) and Tustin et al.
(2005:76)
STEP 4: Determine the research design
STEP 5: Prepare the research design
Develop the sample plan
Determine the data collection approach and instrument
STEP 6: Design the questionnaire
STEP 7: Pre-test the questionnaire
STEP 8: Collect the data
STEP 9: Process and analyse data
STEP 10: Interpret the findings and compile the research report
STEP 3: Identify information types and sources
Secondary data
Primary data
STEP 2: Identify the research objectives
STEP 1: Define the research problem

58
These steps are discussed in the next sections.
4.2.1 Step 1: Define the research problem
The first step in the marketing research process defines the research problem as set out
in Chapter 1 of the study. A marketing research problem is a statement that specifies the
type of information needed to solve the problem, and how that information can be
obtained efficiently and effectively (Lamb, Hair & McDaniel, 2012:297; McDaniel & Gates,
2013:66).
This study investigate the influence of human variables, namely other customers and
sales associates on consumers’ shopping experience in FMCG retail stores in Ekurhuleni.
The self-service nature of the FMCG retail store environment requires retailers to create
a pleasant shopping experience to attract customers and differentiate their stores from
competitors.
In Chapter 2, the influence of human variables on consumers’ shopping experience in
FMCG retailing was highlighted since these variables, from customers’ perspective, could
create a pleasant atmosphere. This is especially true if customers perceive sales
associates as knowledgeable, friendly and appear professional (Yoon et al., 2004:394).
In addition, Van Rompay et al. (2012:1130) indicated that consumer’s interactions with
other shoppers in the retail store can also lead to satisfaction of social needs. Existing
research on human variables tends to focus on the retail industry in general, or on apparel
and online retail stores specifically. However, there is no research on FMCG retail stores
in particular (Beatty, Mayer & Lee, 1996; Gremler & Gwinner, 2000; Kim & Kim, 2014;
Koistinen & Jarvinen, 2016). Aspects of the key human variables were only covered on
reviews, but have not been empirically tested in the retail industry (Kim & Kim, 2012).
Therefore, this study addresses the gap in the existing literature that was identified by
investigating the influence of human variables on consumers’ shopping experience in
FMCG retail stores in a South African context.

59
Therefore, the research problem of this study was to investigate the influence of human
variables (other customers and sales associates) on consumers’ shopping experience in
FMCG retail stores. Human variables are valuable in retail environment and particularly
to FMCG retailers as they can be used to create a pleasant store atmosphere that will
enhance consumers’ shopping experience in the FMCG retail stores.
Formulating the research objectives is the next step in the marketing research process
as indicated in Figure 4.1. These are discussed in the next section.
4.2.2 Step 2: Identify the research objectives
The research objectives were formulated based on the research problem. Marketing
research objectives refer to goal statements that indicate the information needed to solve
the marketing research problem (Aaker et al., 2013:48; McDaniel & Gates, 2013:64).
Well-formulated objectives serve as a road map when pursuing the research project
(McDaniel & Gates, 2013:66). The primary and secondary objectives formulated for the
purpose of this study are indicated in Chapter 1, and reiterated below.
The following primary research objective was formulated from the literature review:
To determine the influence of human variables, namely other customers and sales
associates on consumers’ shopping experience in FMCG retail stores in Ekurhuleni.
The secondary research objectives developed from the primary objective are as follows:
To determine the influence of crowding on consumers’ shopping experience in
FMCG retail stores in Ekurhuleni.
To determine the influence of social relations on consumers’ shopping experience
in FMCG retail stores in Ekurhuleni.
To determine the influence of sales associates’ availability on consumers’
shopping experience in FMCG retail stores in Ekurhuleni.

60
To determine the influence of physical attributes of sales associates on
consumers’ shopping experience in FMCG retail stores in Ekurhuleni.
To determine the influence of behavioural attributes of sales associates on
consumers’ shopping experience in FMCG retail stores in Ekurhuleni.
To determine the influence of demographic variables on consumers’ shopping
experience in FMCG retail stores in Ekurhuleni.
As indicated in Figure 4.1 the third step in the research process is the identification of
information types and sources, which is explained in the next section.
4.2.3 Step 3: Identify information types and sources
It is important for the researcher to determine whether to use primary or secondary
information to achieve the research objectives of the study.
4.2.3.1 Secondary data
Secondary data refers to existing data collected for purposes other than the problem at
hand (Aaker et al., 2013:84; Bradley, 2013:63; Clow & James, 2014:63). There are two
sources of secondary data, namely, internal and external sources (McDaniel & Gates,
2013:90). Internal sources include information available within the organisation such as
sales records, annual reports and customer profiles (Aaker et al., 2013:87; McDaniel &
Gates, 2013:90). External sources refer to information that originated outside the
company, including government publications, periodical and journals, academic sources,
professional bodies, and trade press (Bradley, 2013:89). According to McDaniel and
Gates (2013:90), secondary data can be a cost-effective and efficient means of obtaining
information for marketing research. Researchers usually start their investigation by
examining the readily available secondary data to see whether they can solve the problem
before collecting primary data (Kotler & Keller, 2016:126).

61
Table 4.1 below illustrates the advantages and disadvantages that the researcher should
consider when using secondary data.
Table 4.1: Advantages and disadvantages of secondary data
Advantages Disadvantages
May help in classifying or redefining the problem Collected for some other purpose
May provide solution to the problem No control over data collection
May provide alternative primary data methods May not be very accurate
Secondary data can alert researchers of potential problems and difficulties
May be outdated
May provide necessary background information and build credibility for research report
May not meet data requirements
It may provide the sample frame May not be reported in the required form
Source: Aaker et al. (2013:87); McDaniel and Gates (2013:90)
For the purpose of this study, there was no internal secondary data that was used.
However, external secondary data was used. The external secondary data used include
academic articles, academic textbooks and internet sources. The latter external
secondary data was utilised to formulate the literature review and to develop appropriate
constructs for this study (see Chapter 2).
Secondary data could not solve the problem of this study. Therefore, primary data had to
be collected as discussed in the next section.
4.2.3.2 Primary data
Primary data refers to data that is collected to solve the problem under investigation
(McDaniel & Gates, 2013:90; Bradley, 2013:112). Primary data uses survey, observation
and experimental methods (McDaniel & Gates, 2013:90), which are discussed in the next
step. According to Malhotra et al. (2012:114), the researcher should collect primary data
after analysing secondary data and concluding that it is not sufficient to solve the problem
at hand. Primary data was collected for the present study.

62
The research design selected for the study is discussed in the next section.
4.2.4 Step 4: Determine the research design
A research design is the plan that is followed to address the research objectives
(McDaniel & Gates, 2013:66). Aaker et al. (2013:63) define a research design as the
detailed blueprint used to guide the study towards its objectives. The research design
represents the master plan that specifies the methods and procedures for collecting and
analysing the required information (Tustin et al., 2005:82). There are three main types of
research designs, namely exploratory, descriptive and causal research, as depicted in
Figure 4.2 below.
Figure 4.2: Types of research design
Source: Aaker et al. (2013:64); Clow and James (2014:27); Tustin et al. (2005:83)
According to McDaniel and Gates (2013:66), there is no single best research design.
Instead, different designs offer an array of choices, each with advantages and
disadvantages. The choice of a research approach depends on the nature of the research
to be conducted (Aaker et al., 2013:65).
Research design types
Exploratory research Descriptive research Causal research
63
4.2.4.1 Exploratory research
Exploratory research is used when seeking insight into the general nature of a problem
(Aaker et al., 2013:65). According to Clow and James (2014:27), exploratory research
involves a preliminary examination of the problem or situation to identify parameters to
be studied further and in some cases, even to define the problem itself. Exploratory
research is suitable when the researcher is not clear about problems that might be
experienced during the investigation (Clow & James, 2014:27; Cooper & Schindler,
2014:129). Furthermore, exploratory research allows the researcher to establish priorities
among research questions and to learn about problems that are practical in nature when
conducting the study (Tustin et al., 2005:85).
4.2.4.2 Causal research
Causal research is used to determine whether one variable causes another (Clow &
James, 2014:29). McDaniel and Gates (2013:67) described causal research as the
research design that determines whether the value of one variable causes the value of
other variables. In other words, it determines whether an independent variable has an
effect on a dependent variable. The goal of causal research is to control and eliminate all
possible causes of an effect, except the one being studied (Clow & James, 2014:29).
4.2.4.3 Descriptive research
Descriptive research is conducted to answer the who, what, when, where, and how
questions (McDaniel & Gates, 2013:66; Tustin et al., 2005:86). Researchers who use
descriptive research usually have a clear understanding of the problem at hand (Clow &
James, 2014:28). The purpose of descriptive research is to provide an accurate snapshot
of the market environment (Aaker et al., 2013:66). Furthermore, descriptive research
provides the researcher with an elucidation of the phenomenon associated with the
subject population (Cooper & Schindler, 2014:134).

64
For the purpose of this study, a descriptive research design was used because the study
investigates a current phenomenon, namely the influence of human variables on
consumers’ shopping experience in FMCG retail stores in Ekurhuleni. The findings of this
study can provide FMCG retailers with information on how human variables influence
consumers’ shopping experience. According to Clow and James (2014:163), descriptive
research can be divided into cross-sectional and longitudinal studies. Cross-sectional
studies are conducted at a single point in time and therefore provide snapshot of the
subject or topic being studied at that time. Longitudinal research refers to studies that ask
the same questions at multiple points in time (Clow & James, 2014:163; Zikmund et al.,
2013:196).
Cross-sectional descriptive research was used with sample surveys that are
representative of the target population. The study determined the influence of human
variables on consumers’ shopping experience in FMCG retail stores at a particular point
in time. Each respondent completed the questionnaire only once.
There are also two data collection research approaches, namely, qualitative and
quantitative research. These are explained in the next section.
4.2.4.4 Qualitative and quantitative research
The researcher should decide whether to use a qualitative or quantitative approach.
Qualitative research is a research approach that involves unstructured data
collection methods that provide results that are subjectively interpreted (Clow &
James, 2014:41). The findings of qualitative research are not subject to
quantification (McDaniel & Gates, 2013:117). According to Bradley (2013:236),
qualitative research uses techniques that attempts to glean opinions and
attitudes. It is used for exploratory research.
Quantitative research can be described as a research approach that involves a
structured data collection method that provides results that can be converted into
numbers and analysed by means of statistical procedures (Bradley, 2013:268;

65
Clow & James, 2014:41; McDaniel & Gates, 2013:17). Quantitative research is
used for descriptive and causal research (Clow & James, 2014:43).
A comparison between qualitative and quantitative approaches is depicted in Table 4.2
below:
Table 4.2: Comparison between qualitative and quantitative research
RESEARCH ASPECT QUALITATIVE RESEARCH QUANTITATIVE RESEARCH
Type of research Exploratory Descriptive or causal
Sample size Small Large
Type of questions Unstructured Structured
Type of analysis Subjective, interpretive Objective, statistical
Generalisability Limited High
Cost (typically) Lower More expensive
Time frame Shorter Longer
Hardware Sound recorders, projection devices, video recorder, pictures, discussion guides
Questionnaires, computers, printouts, mobile devices
Research training Psychology, sociology, consumer behaviour, marketing, marketing research
Statistical, decision models, decision support systems, computer programming and marketing research.
Source: Clow and James (2014:42); McDaniel and Gates (2013:117)
This study followed a quantitative approach. The rationale for selecting this research
approach is that the study used a self-administered questionnaire with structured
questions to obtain information from consumers by means of mall-intercept. In addition,
the study aimed to describe the characteristics of the population in terms of human
variables and how they influence consumers’ shopping experience. Lastly, it was selected
because responses in the questionnaire were assigned numbers for the purposes of
statistical analysis.
The next step in the research process is to prepare the research design for collecting the
primary data for this study.

66
4.2.5 Step 5: Prepare the research design
This is the fifth step as indicated in Figure 4.1 of the marketing research process.
The sample plan is the first phase of preparing research design and is discussed in the
next section.
4.2.5.1 Design the sample plan
Sampling refers to the process of obtaining information from the population sample
(McDaniel & Gates, 2013:80). A sample is described as a subset of all members of the
population (McDaniel & Gates, 2013:380; Tustin et al., 2005:337). The sample for this
study was drawn from FMCG consumers between the ages of 18 and 60 who reside in
Ekurhuleni. According to McDaniel and Gates (2013:81), the basic issue in developing a
sample plan is to specify the characteristics of the individuals from whom information is
needed in order to address the research objectives. The process of developing a sample
plan involves various steps as shown in Figure 4.3.
Figure 4.3: Steps in developing the sampling plan
Source: Aaker et al. (2013:304); Cant (2013b:79) and Malhotra et al. (2012:496).
STEP 1: Define the population
STEP 2: Specify the sample frame
SPEP 3: Select the sampling method
STEP: Determine the sample size
STEP 5: Select the sample
67
Step 1: Define the target population
Defining the target population is the first step in the sampling process. According to
McDaniel and Gates (2013:380), the target population is the entire group of people about
whom data will be obtained. The target population for this study were consumers who
shop at the FMCG retail stores in shopping malls, which can be defined as the population
of the study. For the sake of practicality and cost, the focus of this study was delineated
to the population of Ekurhuleni as it is considered to be one of the largest regions in
Gauteng Province with a population of over 3.1 million (Stats SA, 2016). Respondents
were asked a qualifying question to ensure that they reside in Ekurhuleni metropolitan
area.
Therefore, the units of analysis for this study were individual consumers of FMCG retailers
in selected shopping malls (East Rand mall and Festival mall) in Ekurhuleni.
Step 2: Identify the sampling frame
A sampling frame can be defined as a list of population elements from which units to be
sampled can be selected (Cooper & Schindler, 2014:347; McDaniel & Gates, 2013:384).
This study used a mall-intercept sampling method (see step 3) as a formal documented
plan was not available. Nevertheless, the sample frame for this study can be said to
comprise consumers of FMCG retail stores who reside in Ekurhuleni, who were readily
available, and who agreed to participate in the study.
The next step is to determine the sampling method as discussed in the next section.
Step 3: Determine the sampling method
Determining the sampling method is the third step in the sampling plan design. The
researcher had to determine whether to use probability or non-probability sampling in
order to achieve the objectives of this study. There are various types of probability and
non-probability sampling methods as shown in Figure 4.4 below.

68
Figure 4.4: Types of probability and non-probability sampling
Source: Bradley (2013:162); Cant (2013b:80)
Probability sampling refers to instances in which all members of the population have a
known probability of being selected in the sample (Aaker et al., 2013:309; McDaniel &
Gates, 2013:389). The advantage of probability sampling is that it allows the researcher
to obtain representative samples of a larger population (Aaker et al., 2013:309).
Probability sampling also has disadvantages such as high cost to reach the target
population. It is also more time-consuming than non-probability sampling (Cooper &
Schindler, 2014:350).
There are various types of probability sampling that a researcher can use (Aaker et al.,
2013:310-314; Malhotra et al., 2012:508-512; McDaniel & Gates, 2013:389-394) as
depicted in Figure 4.4.
Simple random sampling refers to random selection of population members in
which every member of the population has a known and equal probability of being
selected in the sample.
Probability sampling
Simple random sampling
Systematic sampling
Stratified random sampling
Cluster sampling
Other types
Non-probability sampling
Quota sampling
Judgement sampling
Convenience sampling
Snowball sampling
Other types
Sampling types

69
Systematic sampling involves selecting a sample by systematically spreading
the sample through a list of population members.
Stratified sampling entails dividing the population into sub-sets termed strata,
for example, male and female, and then selecting random samples from each of
the subsets independently of each other.
Cluster sampling refers to dividing the population into sub-sets termed clusters
and then randomly selecting a sample of clusters.
Non-probability sampling is a sampling method that relies on the personal judgement
of the researcher rather than on chance to select the sample elements (Malhotra et al.,
2012:501). Non-probability sampling can yield good estimates of the population
characteristics, but does not allow for the objective evaluation of the sample results
(Malhotra et al., 2012:501). Types of non-probability sampling methods (Aaker et al.,
2013:315-317; Malhotra et al., 2012:502-506; McDaniel & Gates, 2013:396-397) as
illustrated in Figure 4.4 above are also explained below.
Convenience sampling refers to selecting respondents based on ease of
access.
Judgement sampling is a method in which respondents are selected based on
the researcher’s judgement about their representativeness of the population
being studied.
Quota sampling refers to selecting respondents on quotas based on
classification factors selected by the researcher for population sub-groups.
Snowball sampling is a method where additional respondents are selected
based on referrals from initial respondents.
For the purpose of this study, non-probability sampling and convenience sampling
(mall-intercept) were used. The rationale for selecting convenience sampling was that
the target population comprised consumers of the FMCG retail stores in Ekurhuleni and
were intercepted at the selected shopping malls. Therefore, any individual consumer who
had made purchases from the FMCG retail stores and any readily available individual that
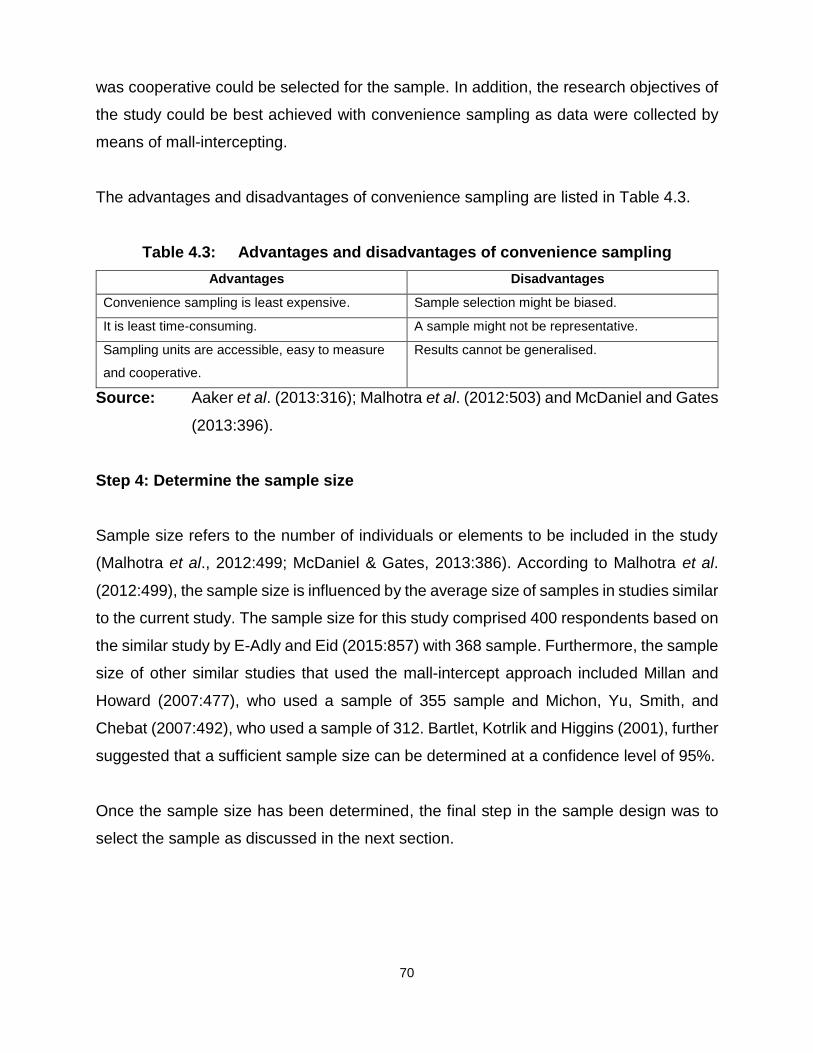
70
was cooperative could be selected for the sample. In addition, the research objectives of
the study could be best achieved with convenience sampling as data were collected by
means of mall-intercepting.
The advantages and disadvantages of convenience sampling are listed in Table 4.3.
Table 4.3: Advantages and disadvantages of convenience sampling
Advantages Disadvantages
Convenience sampling is least expensive. Sample selection might be biased.
It is least time-consuming. A sample might not be representative.
Sampling units are accessible, easy to measure
and cooperative.
Results cannot be generalised.
Source: Aaker et al. (2013:316); Malhotra et al. (2012:503) and McDaniel and Gates
(2013:396).
Step 4: Determine the sample size
Sample size refers to the number of individuals or elements to be included in the study
(Malhotra et al., 2012:499; McDaniel & Gates, 2013:386). According to Malhotra et al.
(2012:499), the sample size is influenced by the average size of samples in studies similar
to the current study. The sample size for this study comprised 400 respondents based on
the similar study by E-Adly and Eid (2015:857) with 368 sample. Furthermore, the sample
size of other similar studies that used the mall-intercept approach included Millan and
Howard (2007:477), who used a sample of 355 sample and Michon, Yu, Smith, and
Chebat (2007:492), who used a sample of 312. Bartlet, Kotrlik and Higgins (2001), further
suggested that a sufficient sample size can be determined at a confidence level of 95%.
Once the sample size has been determined, the final step in the sample design was to
select the sample as discussed in the next section.

71
Step 5: Select the sample
The researcher intercepted consumers at FMCG retail stores at the selected malls and
asked them to participate in the study. The researcher provided a brief description of the
study to every consumer who agreed to participate.
4.2.5.2 Determine the data collection approach
After determining the research design, the researcher needs to select a means of
gathering data. There are three basic methods of gathering data, namely surveys
observation and experimental research.
Observational research refers to the systematic process of recording the
behaviours or results of behaviour of people, objects and occurrences of events
(Clow & James, 2014:128).
Experimental research involves measuring causality. Here the researcher
changes one or more independent variable(s) and observes the effect of the
changes on a dependant variable (McDaniel & Gates, 2013:69).
Survey research refers to a method that captures a wide variety of information
on many diverse topics and subjects (Aaker et al., 2013:181). A survey involves
collecting information from individuals and organisations by means of structured
questionnaires or interviews (Remler & Van Ryzin, 2011:212). Survey research
is often used for descriptive purposes and is suitable to describe a phenomenon,
behaviour and situations (Clow & James, 2014:163). This type of research relies
on a questionnaire to collect data from respondents (McDaniel & Gates,
2013:336).
Survey research was selected as an appropriate data collection method for the purpose
of this study in order to achieve the objectives. Aaker et al., (2013:181) and Leedy and
Ormrod (2013:189) indicate several advantages of using survey method to collect data.
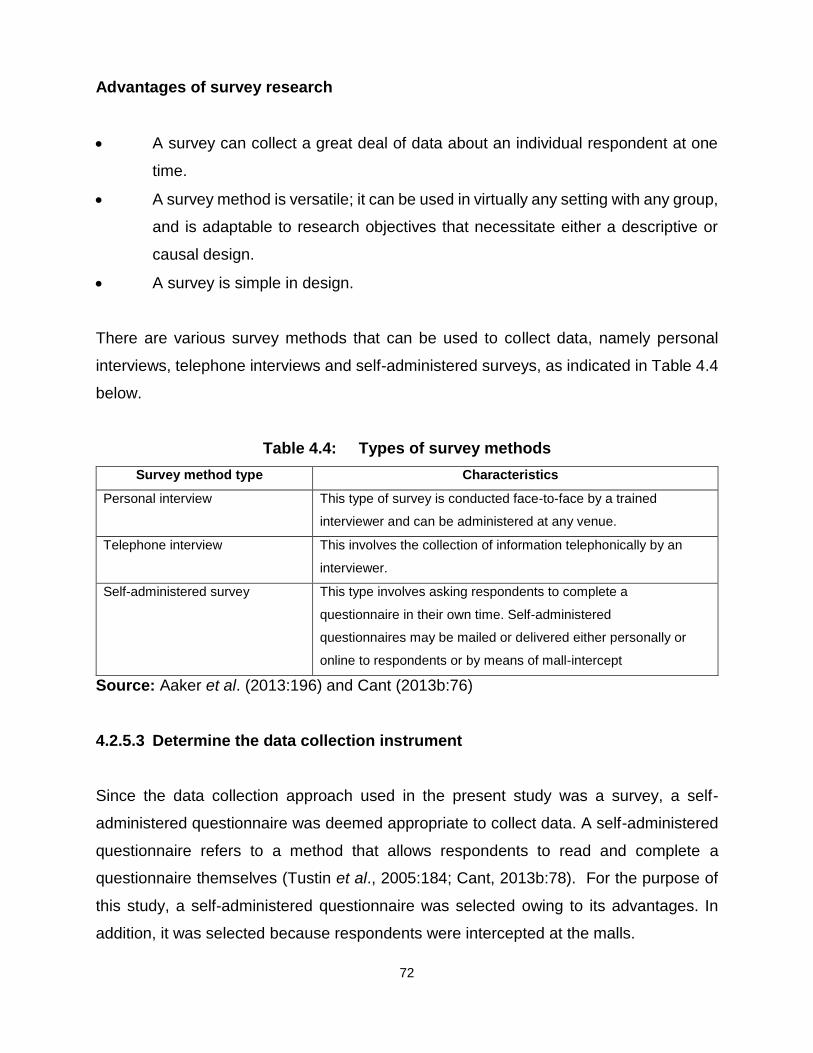
72
Advantages of survey research
A survey can collect a great deal of data about an individual respondent at one
time.
A survey method is versatile; it can be used in virtually any setting with any group,
and is adaptable to research objectives that necessitate either a descriptive or
causal design.
A survey is simple in design.
There are various survey methods that can be used to collect data, namely personal
interviews, telephone interviews and self-administered surveys, as indicated in Table 4.4
below.
Table 4.4: Types of survey methods
Survey method type Characteristics
Personal interview
This type of survey is conducted face-to-face by a trained
interviewer and can be administered at any venue.
Telephone interview
This involves the collection of information telephonically by an
interviewer.
Self-administered survey
This type involves asking respondents to complete a
questionnaire in their own time. Self-administered
questionnaires may be mailed or delivered either personally or
online to respondents or by means of mall-intercept
Source: Aaker et al. (2013:196) and Cant (2013b:76)
4.2.5.3 Determine the data collection instrument
Since the data collection approach used in the present study was a survey, a self-
administered questionnaire was deemed appropriate to collect data. A self-administered
questionnaire refers to a method that allows respondents to read and complete a
questionnaire themselves (Tustin et al., 2005:184; Cant, 2013b:78). For the purpose of
this study, a self-administered questionnaire was selected owing to its advantages. In
addition, it was selected because respondents were intercepted at the malls.

73
Table 4.5 below illustrates the advantages and disadvantages of self-administered
questionnaires.
Table 4.5: Advantages and disadvantages of self-administered questionnaires
Advantages Disadvantages
It is fairly low in cost. The questionnaire length is limited and
instructions are necessary.
Extended geographic coverage is possible
without increasing costs. This method has a low response rate.
There is sufficient time for respondents to think
about their answers.
The respondent needs to be in an environment
that has few distractions.
Incentives may be used. Respondents who represent extremes can skew
the data.
It is fairly easy to reach inaccessible
respondents. The mailing list used must be accurate, if used.
Respondents perceive this method to be
anonymous.
Visual illustrations may be used.
It allows for rapid data collection.
Source: Aaker et al. (2013:204) and Cant (2013b:78)
4.2.5.4 Determine the data collection method
In this study, mall-intercept was used to collect data. Shopping mall-intercept surveys
entail conducting interviews by intercepting shoppers and interviewing them face-to-face
(Aaker et al., 2013:197; McDaniel & Gates, 2013:159). According to McDaniel and Gates
(2013:159), the main advantage of using the mall-intercept method is that it is not very
expensive because respondents are already in the mall. Therefore, interviewers spend
more time interviewing and less time looking for shoppers to interview. However, mall-
intercept is also associated with some disadvantages such as some customers may
refuse mall interviews, and shoppers who are not representative of the general population
also visit the mall for shopping (Aaker et al., 2013:197; McDaniel & Gates.2013:159). The
disadvantages were addressed by approaching FMCG consumers residing in Ekurhuleni,
who are readily available and willing to participate in the study. The researcher collected
74
data for this study for three days in each of the two shopping malls. In addition, the
researcher did not use fieldworkers as he collected data himself.
The next step of the marketing research process is to design the research instrument/
questionnaire, as illustrated in Figure 4.1.
4.2.6 Step 6: Design the questionnaire
A questionnaire refers to a set of questions designed to generate the data necessary to
address the objectives of the study (McDaniel & Gates, 2013:336). Malhotra et al.
(2012:452) define a questionnaire as a structured technique for data collection consisting
of a series of questions, written or verbal, that participants answer. A good questionnaire
should achieve the following objectives (Malhotra et al., 2012:452):
It must translate the information needed into a set of specific questions that
participants can answer.
It must uplift, motivate and encourage the participant to become involved, to
cooperate and to complete the task.
It should minimise response errors.
The questions in questionnaires can be divided into three categories, namely structured
(close-ended), unstructured (open ended) and semi-structured questions as discussed
below:
Structured questions are closed-ended questions that allow the researcher to
specify the set of response alternatives and response format. The types of
structured questions include multiple choice, dichotomous and scaled questions
(Aaker et al., 2013:252; Malhotra et al., 2012:465).
Unstructured questions are open-ended questions that allow respondents to
respond in their own words (Malhotra et al., 2012:463).

75
Semi-structured questions involve a mixture of close-ended and open-ended
questions. The introductory question may be structured (Tustin et al., 2005:393).
For the purpose of this study, the questionnaire contained structured questions. These
questions included dichotomous, multiple choice and scaled questions.
Dichotomous questions have only two response alternatives that a respondent
chooses from, such as “yes or no” (Malhotra et al., 2012:466; McDaniel & Gates,
2013:350). An example of dichotomous question from the questionnaire of this
study:
Do you reside in Ekurhuleni?
Yes 1
No 2
Multiple choice questions refer to questions where the researcher provides a
choice of answers and respondents are asked to select one option that correctly
expresses his/her opinion (McDaniel & Gates, 2013:351).
An example of multiple-choice question from the questionnaire of the study is:
Please indicate your age group.
17 - 23 1
24 - 35 2
36 - 45 3
46 - 60 4
Scaled questions involve creating continuum on which objects are located
according to the measured characteristics they possess (Aaker et al., 2013:224).
For the purpose of this study, a Likert scale was used. A Likert scale uses rating
scales that require the respondents to indicate a degree of agreement or
disagreement with each of a series of statements about the stimulus objects
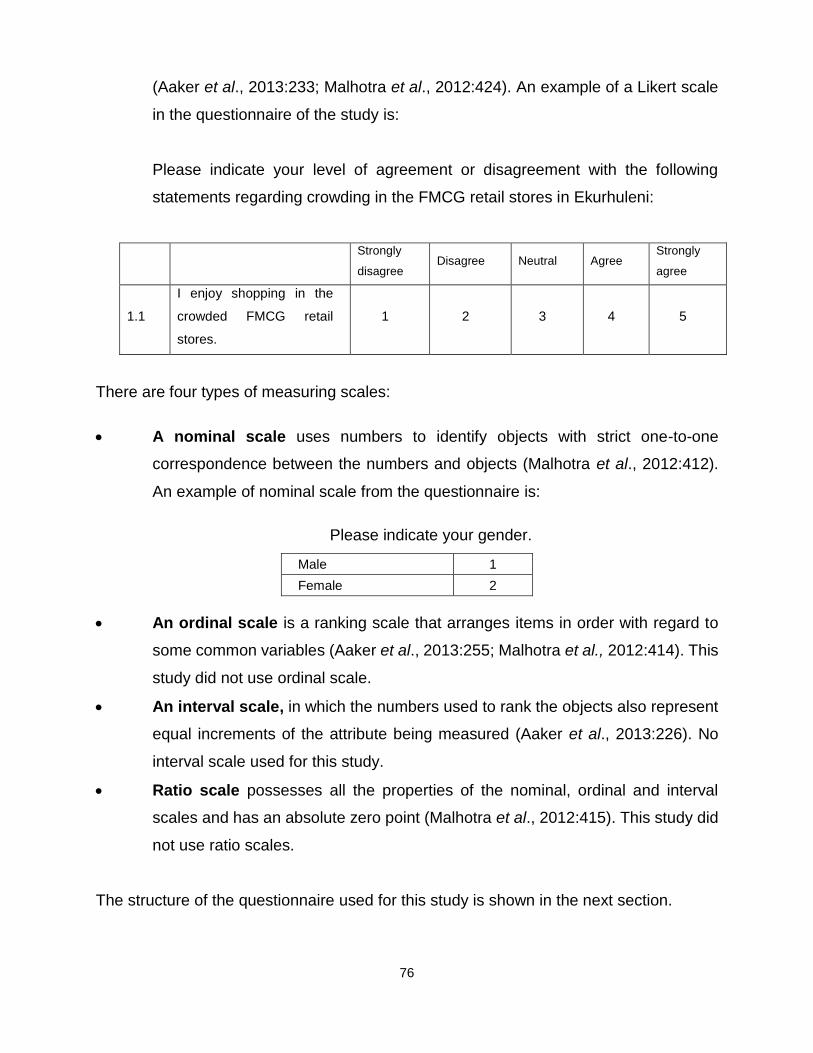
76
(Aaker et al., 2013:233; Malhotra et al., 2012:424). An example of a Likert scale
in the questionnaire of the study is:
Please indicate your level of agreement or disagreement with the following
statements regarding crowding in the FMCG retail stores in Ekurhuleni:
Strongly
disagree Disagree Neutral Agree
Strongly
agree
1.1
I enjoy shopping in the
crowded FMCG retail
stores.
1 2 3 4 5
There are four types of measuring scales:
A nominal scale uses numbers to identify objects with strict one-to-one
correspondence between the numbers and objects (Malhotra et al., 2012:412).
An example of nominal scale from the questionnaire is:
Please indicate your gender.
Male 1
Female 2
An ordinal scale is a ranking scale that arranges items in order with regard to
some common variables (Aaker et al., 2013:255; Malhotra et al., 2012:414). This
study did not use ordinal scale.
An interval scale, in which the numbers used to rank the objects also represent
equal increments of the attribute being measured (Aaker et al., 2013:226). No
interval scale used for this study.
Ratio scale possesses all the properties of the nominal, ordinal and interval
scales and has an absolute zero point (Malhotra et al., 2012:415). This study did
not use ratio scales.
The structure of the questionnaire used for this study is shown in the next section.

77
Table 4.6: Structure of the questionnaire for this study
Section A comprised question 1
Qualifying question
Question 1 focused on establishing whether a respondent resided in Ekurhuleni or not
Section B comprised questions 2-6
Other customers questions
Question 2 addressed crowding
Question 3 focuses on social relations among customers
Sales associates questions
Question 4 enquired about the availability of sales associates
Question 5 focused on the physical attributes of sales associates
Question 6 addressed behavioural attributes of sales associates
Section C comprised questions 7-11
Demographic questions
Question 7 addressed respondents’ gender
Question 8 required respondents to indicate their age groups
Question 9 asked about respondents’ race
Question 10 enquired about the highest qualification of respondents
Question 11 addressed respondents’ monthly gross income
The measures used in this study are depicted in Table 4.6 below. It is important to
highlight that the questions in the questionnaire were developed based on the literature
review. Since Kim and Kim (2012) developed a conceptual framework and not empirical
testing of the constructs. As it was indicated in Chapter 2, this study expands on Kim and
Kim’s (2012) study that was a review not empirical. Therefore, the researcher developed
the questionnaire for this study (see the attached questionnaire in Appendix B).

78
Table 4.7: Measures used in the study
Research objectives Question number and variables in
the questionnaire
To determine the influence of crowding on consumers’
shopping experience in FMCG retail stores in Ekurhuleni
Question 2, 4 statements:
2.1 – 2.4
To determine the influence of social relations on
consumers’ shopping experience in FMCG retail stores in
Ekurhuleni
Question 3, 4 statements: 3.1 – 3.4
To determine the influence of sales associates’ availability
on consumers’ shopping experience in FMCG retail stores
in Ekurhuleni
Question 4, 3 statements:
4.1 – 4.3
To determine the influence of physical attributes of sales
associates on consumers’ shopping experience in FMCG
retail stores in Ekurhuleni
Question 5, 3 statements:
5.1 – 5.3
To determine the influence of behavioural attributes of sales
associates on consumers’ shopping experience in FMCG
retail stores in Ekurhuleni
Question 6, 4 statements:
6.1 - 6.4
To determine the influence of demographic variables on
consumers’ shopping experience in FMCG retail stores in
Ekurhuleni
Question 7, 8 and 9, 3 statements:
7-9
Once the questionnaire has been designed, the next step of the marketing research
process as depicted in Figure 4.1 is to pre-test the questionnaire as discussed in the next
section.
4.2.7 Step 7: Pre-test the questionnaire
Pre-testing the questionnaire should be conducted before data could be collected for the
main study. A pre-test refers to a trial run of the questionnaire (McDaniel & Gates,
2013:360). According to Aaker et al. (2013:263), the purpose of pre-testing is to ensure
that the questionnaire meets a researcher’s expectations in terms of information that
needs to be obtained. Furthermore, pre-testing is done to assess the questions and to
minimise errors before the actual data collection (Cooper & Schindler, 2014:324). Pre-
testing should be conducted in the same mode as the final interview (McDaniel & Gates,
2013:360). For example, this study was done by means of a mall-intercept, and therefore,
the pre-test had to follow the same procedure.

79
The questionnaire used in this study was pre-tested among 40 customers of Lambton
Shopping Mall in Ekurhuleni because the management of the mall granted permission to
the researcher to conduct the procedure. The reason for pre-testing the questionnaire at
a shopping mall (Lambton) other than the ones at which the actual data was collected,
was owing to the fact that the East Rand mall and Festival Mall did not allow the
researcher to conduct pre-testing, but granted him permission to collect the actual data
for the study. Furthermore, there were no changes made in the questionnaire after pre-
testing as the researcher did not see any problem that was experienced by respondents.
4.2.8 Step 8: Collect the data
This is the step where the actual data was collected by means of the research instrument
(the questionnaire). The researcher conducted the survey at the East Rand Mall in
Boksburg and the Festival Mall in Kempton Park. The management of both shopping
malls granted permission to conduct the research. The self-administered questionnaires
were distributed to respondents by means of mall-intercept survey. Accordingly,
consumers who agreed to participate in the study were required to sign the consent form
before completing the questionnaires. The completed questionnaires were returned to the
researcher. The researcher collected data.
The next step after collecting data as indicated in Figure 4.1 is data analysis.
4.2.9 Step 9: Process and analyse data
The collected data was analysed by means of descriptive and inferential statistics.
Descriptive statistics involves summarising the characteristics of large set of data
(McDaniel & Gates, 2013:456). The software used to analyse data is SPSS version 24.
Data are illustrated in tables. The statistical techniques used in the case of descriptive
statistics help to summarise, classify and describe the set of data characteristics including
standard deviation and measures of central tendency (which are the arithmetic mean
median and mode) (McDaniel & Gates, 2013:458).
80
According to Leedy and Ormrod (2013:282), descriptive statistics involve discussing how
to determine three things that the researcher might want to know about a data set: point
of central tendency, amount of variability, and the extent to which two or more variables
are associated with one another. Conversely, inferential statistics allows the researcher
to draw inferences about large populations from relatively small samples (Leedy &
Ormrod, 2013:294). Inferential statistics also allow one to reach conclusions that beyond
the data set or sample from which the data is compiled (Duignan, 2014:14).
The reliability and validity of the research instrument were tested with Cronbach’s alpha
and exploratory factor analysis to ensure that the measurement was reliable and valid
(Malhotra et al., 2012:196).
4.2.9.1 Validity
Validity refers to the degree to which the research instrument measures what it is
supposed to measure (Wiid & Digines, 2015:242). Factor analysis is a technique of
statistically identifying a reduced number of factors from a larger number of measured
variables (Zikmund et al., 2013:595). Exploratory factor analysis is a data reduction
method that can be used to identify constructs or hidden underlying dimensions that may
or may not be apparent from direct analysis (Cleff, 2014:183). Accordingly, exploratory
factor analysis was used to determine the validity of the study. Furthermore, an
exploratory factor analysis determined whether the individual questions loaded or
contributed to the constructs as intended in the questionnaire. The extraction method
used in this study is the Principal axis factoring. The rotation method that was used is
Oblinim with Kaiser Normalisation. Exploratory factor analysis that focused on principal
axis factoring was conducted to group the items under the five factors.
Kaiser Meyer-Olkin’s (KMO) measure of sampling adequacy and Bartlett Sphericity were
used to determine measure of the appropriateness when conducting the exploratory
factor analysis. KMO can be described as the ratio of the sum squared correlation plus
sum of the squared partial correlations (Cleff, 2014:185). The KMO value varies between
0 and 1 with 0.5, indicating that it was acceptable and viable to conduct an exploratory
81
factor analysis. Bartlett’s test for Sphericity was conducted to determine correlations
between variables (Wiid & Diggines, 2015:242).
4.2.9.2 Reliability
Reliability refers to the extent to which a scale produces consistent results if
measurements are repeated (Malhotra et al., 2012:433; McDaniel & Gates, 2013:286).
Cronbach’s alpha, which is also known as coefficient alpha, was used in this study to
assess internal consistency and reliability. Cronbach’s alpha involves computing mean
reliability coefficient estimates for all possible ways of splitting a set of items in half
(McDaniel & Gates, 2013:288). Malhotra et al. (2012:434) describe Cronbach’s alpha as
a measure of central consistency reliability that is the average of all possible split-half
coefficients resulting from different splittings of the scale items. It can vary between 0 (no
consistency among items) to 1 (complete consistency). Furthermore, a Cronbach’s alpha
above 0.8 indicates good reliability, while a score between 0.6 and 0.8 is acceptable.
However, a Cronbach’s alpha below 0.6 means that reliability is unacceptable (Malhotra
et al., 2012:434). This study set out to determine whether the scale could measure the
same underlying constructs consistently.
Descriptive statistics for the total composite scores and individual questions in the
questionnaire
A five-point Likert scale ranging from strongly disagree – 1 to strongly agree – 5 was
used to measure the constructs investigated in this study. The means and standard
deviations for the human variables were presented for the composite scores. The results
of individual questions in the questionnaire are also reported in Chapter 5, section 5.4.
4.2.9.3 Hypotheses test for the study
A chi-square for equal proportions was used to test the hypotheses. This determine if the
proportions of consumers are statistically different with regard to the influence of
crowding, social relations, sales associates’ availability, physical attributes of sales

82
associates, and behavioural attributes of sales associates on their shopping experience
in FMCG retail stores in Ekurhuleni. A chi-square is a measure of the extent to which
some observed data depart from expectation (Bruce & Bruce, 2017:112). Furthermore,
other hypotheses were also formulated to determine if there were statistically significant
differences between demographic variables, namely gender, age and race with regard to
the influence of crowding, social relations, sales associates’ availability, physical
attributes of sales associates, and behavioural attributes on consumers’ shopping
experience. The statistical differences were tested with the F-test and analysis of variance
(ANOVA). The F-test is a technique used to determine if the difference between the mean
scores is statistically significant or not (Malhotra et al., 2012:644; Wiid & Diggines,
2015:284). ANOVA is a statistical method used to determine whether there are
statistically significant differences between means of independent groups (Tustin et al.,
2005:682). One-way ANOVA was also used. One-way ANOVA is a statistical test to
determine if more than two means are equal (Wiid & Diggines, 2015:282).
The hypotheses test results are reported in Chapter 5 (see Section 5.5 and 5.6).
4.2.10 Step 10: Interpret the findings and compile the report
The final step in the marketing research process is to interpret the findings/results and to
compile the report (Aaker et al., 2013:493). According to Leedy and Ormrod (2013:310),
a research report is a clear document that presents what the researcher has done to
resolve the research problem in a precise manner. The findings, conclusions and
recommendations of this study are presented in Chapters 5 and 6.
4.3 ETHICAL CONSIDERATIONS
Ethics refers to moral principles or values that generally govern the conduct of individuals
or groups (Aaker et al., 2013:19; McDaniel & Gates, 2013:36). In addition, Aaker et al.
(2013:19) note that researchers have responsibilities to their profession, clients and
respondents. Therefore, they must adhere to high ethical standards to ensure that neither
the function nor the information not brought into disrepute (Aaker et al., 2013:19).

83
Furthermore, the researcher ensure that the respondents in the study have the right to
choose to participate or not, and should respect their right to safety, to be informed, and
their right to privacy (Aaker et al., 2013:20; McDaniel & Gates, 2013:43). For this study
the researcher adhered to all these ethical principles.
Ethical clearance was obtained from the Research Ethics Committee of the Department
of Marketing and Retail Management at the University of South Africa (see appendix E).
This was to ensure that the study is conducted ethically and the rights of respondents
were upheld. East Rand Shopping Mall and Festival Shopping Mall granted permission
to collect data. In addition, Lambton shopping mall granted permission to pre-test the
questionnaire. Consent forms were attached to the questionnaires in order to gain
permission from the respondents. These forms also indicated the purpose of the study
and explained that respondents’ confidentiality would be respected.
4.4 SUMMARY
This chapter provided a brief explanation of the importance of marketing research in the
organisations. The marketing research process was discussed followed by a detailed
discussion of each step. The research design used for the present study was also
addressed. The sample plan and research instrument designed for data collection were
described together with ethical considerations.
The next chapter presents the findings and interpretations gleaned from the data.

84
CHAPTER 5
FINDINGS AND INTERPRETATIONS
5.1 INTRODUCTION
The empirical findings of the study are presented in this chapter together with
interpretations to demonstrate how the objectives of the study were achieved. The
chapter provides an overview of the research findings by presenting descriptive statistical
analysis to profile respondents, after which discussions on inferential statistics and factor
analysis follow. The chapter also presents the results of the hypotheses tested in this
study. Integration of the research objectives, hypotheses and discussion of the results
were provided to conclude the chapter.
5.2 THE RESEARCH FINDINGS
The research findings are presented and interpreted in the next sections.
5.2.1 Sample distribution
The number of respondents who participated in this study per shopping mall are illustrated
in Table 5.1 below. There were 200 respondents who participated at East Rand Mall
(Boksburg) and 200 respondents were from Festival Mall (Kempton Park). These
shopping malls fall under the Ekurhuleni region. The total number of respondents for both
shopping malls was 400.
Table 5.1: Total number of respondents per shopping mall
Shopping malls Number of respondents Percentage
East Rand shopping mall 200 50%
Festival shopping mall 200 50%
Total 400 100%

85
5.2.2 The qualifying question
The research instrument included a qualifying question that screened respondents to
determine whether they qualified to participate in the sample, namely “Do you reside in
Ekurhuleni?” Respondents who answered “Yes” were asked to proceed with the
questionnaire, while those who answered “No” were asked not to proceed. For this study,
the researcher was asking every respondent before he/she can start completing the
questionnaire if they reside in Ekurhuleni or not in order to ensure that all respondents
who participated in the study were eligible. Table 5.1 shows that all 400 respondents who
completed the questionnaires answered “Yes” to indicate that they resided in Ekurhuleni.
The following section provides the demographic data used to profile respondents.
5.2.3 Demographic profile of the respondents
In this study, the demographic attributes of respondents were based on age, gender, race,
income level, and qualification level. Demographics refer to a population’s characteristics
such as gender, age, race, education and income (Levy & Weitz, 2012:597). The
demographic attributes of respondents were used to profile the respondents who
participated in this study. These enabled the researcher to understand the type of
consumers who were most likely to be influenced by human variables.

86
Table 5.2: A demographic profile of respondents
Demographic profile of respondents (n=400)
VARIABLE FREQUENCY PERCENTAGE
Gender Male Female
224 176
56.% 44.%
Age 18-23 24-35 36-45 46-60
122 135 78 65
30% 34% 20% 16%
Race African White Coloured Indian
228 102 43 27
57% 25% 11% 7%
Qualification Did not complete Grade 12 Completed Grade 12 Diploma Undergraduate degree Postgraduate degree
27 116 103 100 54
7% 29% 26% 25% 13%
Income Below R5 000 R5 000-R10 000 R11 000-R20 000 R21 000-R30 000 Above R31 000
59 129 100 32 80
15% 32% 25% 8% 20%
Table 5.2 indicates that 56% (n=224) of respondents who participated in this study were
male while 44% (n=176) were female. A significant number of respondents who
participated in the study were between the ages of 24 and 35 (n=135, 34%). Then, 30%
(n=122) of respondents were between the ages of 18 and 23 respectively while 20%
(n=78) were between the ages of 36 and 45. The lowest number of respondents was in
the age group of 46 to 60. Furthermore, the table indicates that the majority of
respondents (57%; n=228) are Africans and the least represented racial group were
Indian with 7% (n=27). White respondents were the second highest represented racial
group in the sample with 25% (n=102), followed by 11% (n=43) coloured respondents.

87
Table 5.2 also shows that 29% (n=116) of respondents had a grade 12 certificate. Most
respondents had diploma as their highest qualification. About 25% (n=100) held an
undergraduate degree, and only 13% (n=54) had a postgraduate degree. It was also
revealed that 32% (n=129) of respondents earned between R5 000 and R10 000 a month
while 25% (n=100) were in the income bracket of R11 000 – R20 000. Furthermore, 20%
(n=80) earned more than R31 000. A small number of respondents 8% (n=32) indicated
an income of R21 000 to R30 000 per month and 15% (n=59) were earning below R5 000
a month.
5.3 THE MEASURING INSTRUMENT
The measuring instrument used a five-point Likert scale, which comprised strongly
disagree (1), disagree (2), neutral (3), agree (4), and strongly agree (5). Exploratory factor
analysis was conducted to obtain valid constructs from responses. In addition, exploratory
factor analysis was used to ensure that the measurement was valid (Malhotra et al.,
2012:196).
Responses on question 2 to 6 of the Likert scale questions were used to measure
crowding, social relations, sales associates’ availability, physical attributes of sales
associates and behavioural attributes of sales associates.
5.3.1 Validity
As discussed in Chapter 4, validity refers to the degree to which the research instrument
measures what it is supposed to measure (Aaker et al., 2013:242; McDaniel & Gates,
2013:289). Factor analysis is a technique of statistically identifying a reduced number of
factors from a larger number of measured variables (Clow & James, 2014:311; Zikmund
et al., 2013:595).
Exploratory factor analysis was applied to responses of 18-item questionnaire. The
extraction method used was principal axis factoring, and this followed by Oblimin with
Kaiser Normalisation rotation. The first five factor solution was the most interpretable.

88
Therefore, only five factors were retained for rotation. Questionnaire items and
corresponding factor loadings are presented in Table 5.6. In interpreting the rotated factor
pattern, an item was said to load on a given factor if the item was 0.40 or greater for that
factor and less than 0.40 for the other factor. Using these criteria, three items were found
to load on the first factor, which was subsequently labelled, four items loaded on the
second factor, two items loaded on the third factor labelled, there were two items loaded
on the fourth factor labelled, and also two items loaded on the fifth factor labelled. There
was question 5.3 that was retained in the second factor as it loaded higher than on the
fourth factor. A total of 13 items were retained from the questionnaire (see Table 5.6).
Kaiser Meyer-Olkin’s (KMO) measure of sampling adequacy and Bartlett’s Sphericity
were used to determine the measure of appropriateness determined by exploratory factor
analysis. Bartlett’s test of Sphericity was conducted to determine correlations between
variables. The results of these tests are depicted in Table 5.3.
Table 5.3: KMO and Bartlett’s test of Sphericity
Kaiser-Meyer-Olkin’s measure of sampling adequacy. .649
Bartlett's test of Sphericity
Approx. chi-square 1811.664
Df 153
Sig. .000
Table 5.3 above indicates that the value for KMO for this study was 0.649 above the
minimum threshold. Furthermore, Bartlett’s test indicated significance (1811.664, df=153,
Sig. =.000). These findings indicated that the use of factor analysis was appropriate.
5.3.1.1 Communalities
Communalities in this study were inspected to determine whether individual statements
or items could be grouped with the retained factors. Communality refers to common
variance as opposed to unique variance, that is, variance that is unique to an item.
Communalities, in turn, indicate the extent to which an individual item associates with the
other items (Wiid & Diggines, 2015:242).
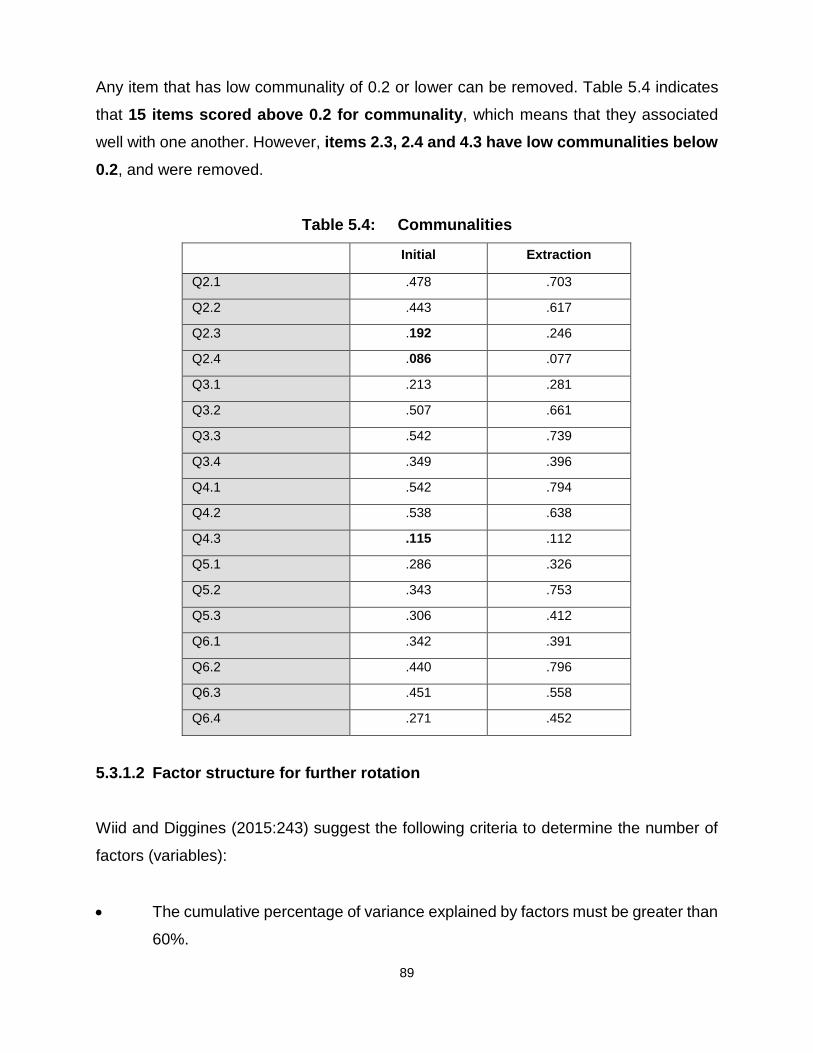
89
Any item that has low communality of 0.2 or lower can be removed. Table 5.4 indicates
that 15 items scored above 0.2 for communality, which means that they associated
well with one another. However, items 2.3, 2.4 and 4.3 have low communalities below
0.2, and were removed.
Table 5.4: Communalities
Initial Extraction
Q2.1 .478 .703
Q2.2 .443 .617
Q2.3 .192 .246
Q2.4 .086 .077
Q3.1 .213 .281
Q3.2 .507 .661
Q3.3 .542 .739
Q3.4 .349 .396
Q4.1 .542 .794
Q4.2 .538 .638
Q4.3 .115 .112
Q5.1 .286 .326
Q5.2 .343 .753
Q5.3 .306 .412
Q6.1 .342 .391
Q6.2 .440 .796
Q6.3 .451 .558
Q6.4 .271 .452
5.3.1.2 Factor structure for further rotation
Wiid and Diggines (2015:243) suggest the following criteria to determine the number of
factors (variables):
The cumulative percentage of variance explained by factors must be greater than
60%.
90
The eigenvalues should be greater than 1.0.
Significant decline in scree plot.
The eigenvalues are illustrated in Table 5.5. According to Wiid and Diggines (2015:243),
if the eigenvalue for a factor is 1 or higher, that factor can be considered as meaningful
in the exploratory factor analysis. The exploratory factor analysis was conducted using
SPSS version 24. The 18 statements from question 2-6 in a Likert scale of the
questionnaire were extracted with principal axis factoring and oblimin rotation. The
eigenvalues as depicted in Table 5.5 shows seven factors with eigenvalues greater than
1, although the scree plot indicated a possible 5 to 6 factors. Considering the factor
loadings, the seventh factor did not have any item loading meaningful to it, while the sixth
factor only had two items for which one was cross-loading. Therefore, the five factor
solution was tried.
The eigenvalue for the first factor is 3.093, for the second 2.507; 1.674 for the third, for
the fourth factor 1.507, and 1.324 for the fifth factor. The percentages of variance are
factor 1 at 17.2%, factor 2 at 13.9%, factor 3 at 9.3%, factor 4 at 8.4% and factor 5 at
7.4%. A cumulative percentage of variance of 67.8% for seven factors was determined
since five factors scored below the recommended 60% (Wiid & Diggines, 2015:243).

91
Table 5.5: Factor extraction using Principal axis factoring
Factor
Initial Eigenvalues Extraction sums of squared loadings
Total % of variance
Cumulative
% Total % of variance Cumulative %
1 3.093 17.183 17.183 3.093 17.183 17.183
2 2.507 13.927 13.927 2.507 13.927 13.927
3 1.674 9.299 40.409 1.674 9.299 40.409
4 1.507 8.374 48.783 1.507 8.374 48.783
5 1.324 7.354 56.137 1.324 7.354 56.137
6 1.067 5.928 62.065 1.067 5.928 62.065
7 1.038 5.769 67.834 1.038 5.769 67.834
8 0.895 4.972 72.806
9 0.835 4.639 77.445
10 0.678 3.766 81.211
11 0.664 3.686 84.897
12 0.563 3.126 88.024
13 0.531 2.950 90.974
14 0.423 2.350 93.323
15 0.340 1.889 95.213
16 0.315 1.753 96.965
17 0.284 1.576 98.541
18 0.263 1.459 100.000
Extraction method: principal axis factoring

92
The scree plot depicted in Figure 5.1 supports the interpretation of the extracted factors.
Figure 5.1: Scree plot for factor retention
A scree plot indicates the eigenvalues plotted against the number of factors in the order
that they can be extracted, and is used to identify the factors that are appropriate (Cleff,
2014:187). The scree plot in Figure 5.1 indicates that the slope of the line declines after
the fifth factor. This implies that five is the appropriate number of factors to be considered.
Therefore, factors 1, 2, 3, 4, and 5 were retained.
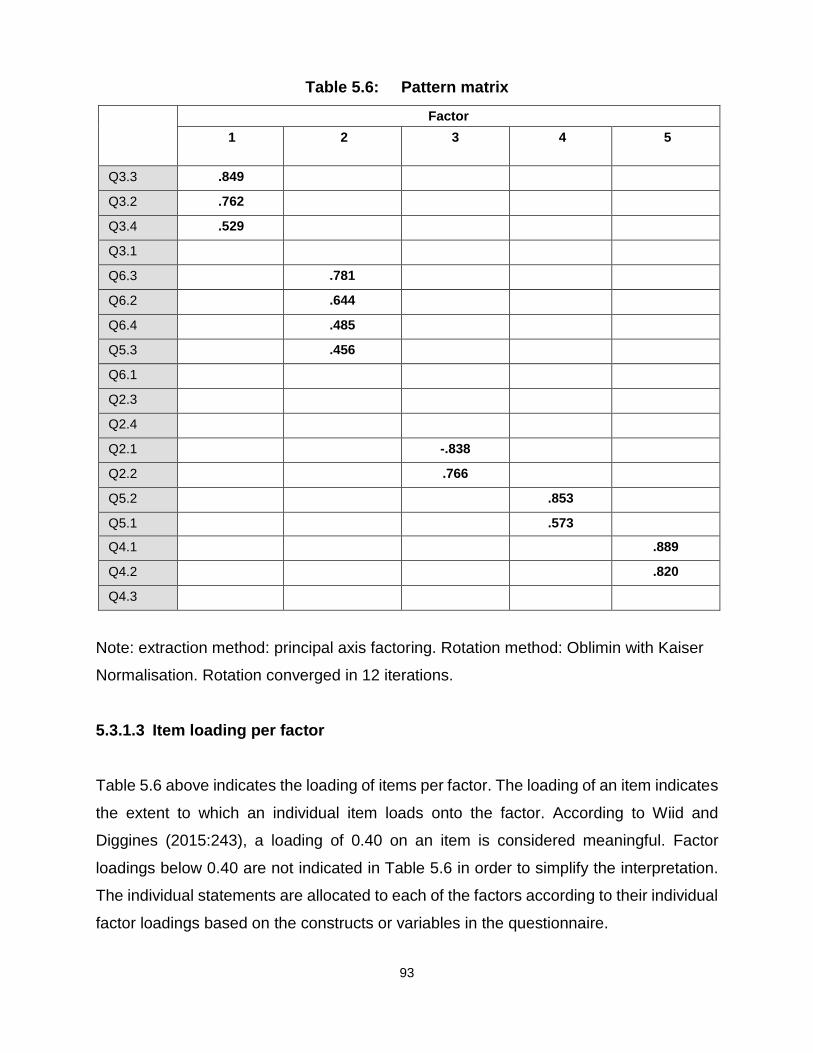
93
Table 5.6: Pattern matrix
Factor
1
2
3
4
5
Q3.3 .849
Q3.2 .762
Q3.4 .529
Q3.1
Q6.3 .781
Q6.2 .644
Q6.4 .485
Q5.3 .456
Q6.1
Q2.3
Q2.4
Q2.1 -.838
Q2.2 .766
Q5.2 .853
Q5.1 .573
Q4.1 .889
Q4.2 .820
Q4.3
Note: extraction method: principal axis factoring. Rotation method: Oblimin with Kaiser
Normalisation. Rotation converged in 12 iterations.
5.3.1.3 Item loading per factor
Table 5.6 above indicates the loading of items per factor. The loading of an item indicates
the extent to which an individual item loads onto the factor. According to Wiid and
Diggines (2015:243), a loading of 0.40 on an item is considered meaningful. Factor
loadings below 0.40 are not indicated in Table 5.6 in order to simplify the interpretation.
The individual statements are allocated to each of the factors according to their individual
factor loadings based on the constructs or variables in the questionnaire.

94
Factor 1 was named social relations.
This factor consists of the following: Q3.2, Q3.3, and Q3.4. Question 3.1 was eliminated
because of its loading, which was below 0.4. The loading for statement 3.3 was 0.849.
This means that it loaded higher than the other three statements in factor 1.
Factor 2 was named behavioural attributes.
The second factor includes these statements: Q6.2, Q6.3 and Q6.4. However, statement
Q6.1 had a low loading of lower than 0.4, which meant that it was eliminated. The low
loading could be attributed to the use of the word ‘knowledge’.
Factor 3 was named crowding
In the case of factor 3, statements Q2.3 and Q2.4 loaded lower than 0.40. These two
statements were not considered for further analysis. Therefore, factor 3 comprised Q2.1
and Q2.2.
Factor 4 was named physical attributes
Q5.3’s statement loaded in factor 2. This could be attributed to the use of the word
‘professionally’, which is associated with behavioural attributes. Therefore, this statement
was retained in factor 2. The fourth factor statements are Q5.1 and Q5.2.
Factor 5 was named sales associates’ availability
In this factor, statement Q4.3 had a weak loading and was not considered for further
analysis. The removal of Q4.3 left factor 5 with Q4.1 and Q4.2.
The reliability test results are discussed in the next section.
5.3.2 Reliability
Reliability as discussed in Chapter 4 refers to the extent to which a scale produces
consistent results if measurements are repeated (Malhotra et al., 2012:433; McDaniel &
Gates, 2013:286). The Cronbach’s alpha, also known as coefficient alpha, was used in
this study to assess internal consistency reliability.

95
Table 5.7 below indicates the interpretation of the overall Cronbach’s alpha value for
reliability.
Table 5.7: Interpretation of Cronbach’s alpha
Range Strength
Above 0.8 Good reliability
Between 0.6 and 0.8 Acceptable reliability
Below 0.6 Unacceptable reliability
Source: Malhotra et al. (2012:434) and Wiid and Diggines (2015:249)
The reliability results for crowding, social relations, sales associates’ availability, physical
attributes, and behavioural attributes of sales associates are illustrated in Table 5.8. From
Table 5.8, it emerged that crowding had two items that were retained with 0.780 indicative
of an acceptable Cronbach’s alpha. Social relations’ Cronbach’s Alpha was 0.697, which
is acceptable with three items, sales associates’ availability had a good reliability of 0.828
with two items, while the Cronbach’s alpha of the physical attributes of sales associates
was 0.651, which is acceptable for the two items. The last factor was the behavioural
attributes of sales associates with four items and an acceptable Cronbach’s alpha of
0.666. These Cronbach’s alpha results indicate that the scale is reliable.
Table 5.8: Overall coefficient for the human variables scale
Variables Items Cronbach’s
alpha Reliability
Crowding Q2.1, Q2.2, 0.780 Acceptable
Social relations Q3.2, Q3.3, Q3.4 0.697 Acceptable
Sales associates’ availability Q4.1, Q4.2, 0.828 Good
Physical attributes of sales
associates
Q5.1, Q5.2 0.651 Acceptable
Behavioural attributes of sales
associates
Q6.2, Q6.3, Q6.4,
Q5.3
0.666 Acceptable
The individual Cronbach alpha values next to the items (or questions) indicate the change
in the overall Cronbach’s alpha value. This implies that the corresponding item should be

96
removed from the construct. The corrected item-total correlation indicates the correlation
of the specific item (or question) with the total correlation of all the questions. The higher
this correlation, the better this item or question form part of the construct. If the individual
Cronbach alpha is higher (usually at least 2-4%) than the overall Cronbach alpha (entire
set) and the corrected item-total correlation is low or negative (below 0.1) then this
individual item could be removed.
The coefficient sub-scales for each sub-variable are discussed below.
The internal consistency reliability sub-scale for social relations was indicated in Table
5.9. Statements Q3.2, Q3.3 and Q3.4 loaded strongly on factor 1. However, statement
Q3.1 had a low loading that qualified it for removal. This statement was not removed to
improve reliability. The reliability for these retained statements produced a Cronbach’s
alpha of 0.697. Therefore, statement Q3.2, Q3.3 and Q3.4 were used to measure the
influence of social relations on consumers’ shopping experience in FMCG retail stores in
Ekurhuleni.
Table 5.9: Internal consistency reliability for social relations sub-scale
Scale Mean if Item
Deleted
Scale Variance if
Item Deleted
Corrected Item-
Total Correlation
Cronbach's alpha
if Item Deleted
Q3_3 12.00 3.683 .653 .512
Q3_2 11.87 3.950 .632 .535
Q3_4 11.88 4.621 .417 .671
Q3_1 11.74 5.166 .259 .759
Table 6.10 indicates internal consistency reliability sub-scale for behavioural attributes.
In addition, the table indicates that statement Q5.3 loaded strongly together with Q6.2,
Q6.3, and Q6.4 on factor 2. It means that Q5.3 was retained in factor 2 instead of factor
4. The Cronbach’s alpha for the statements that loaded strongly on factor 2 is 0.666.
Statement Q6.1 was removed owing to its lower loading when the final exploratory factor
analysis was conducted.

97
Table 5.10: Internal consistency reliability for behavioural attributes sub-scale
Scale Mean if Item
Deleted
Scale Variance if
Item Deleted
Corrected Item-
Total Correlation
Cronbach's alpha
if Item Deleted
Q6_3 16.72 4.804 .549 .567
Q6_2 16.74 4.853 .562 .566
Q5_3 17.03 4.438 .412 .622
Q6_4 16.92 4.961 .334 .654
Q6_1 17.18 4.810 .323 .664
The internal consistency reliability for crowding sub-scale was shown in Table 5.11.
These statements Q2.1 and Q2.2 from the questionnaire loaded strongly together on
factor 3. The pseudo Cronbach’s alpha coefficient was calculated for crowding as a
proper Cronbach’s alpha could not be calculated. The analysis of reliability for these two
items produced 0.780 Cronbach’s alpha. Therefore, these two statements were used to
measure the influence of crowding on consumers’ shopping experience in FMCG retail
stores in Ekurhuleni.
It is important to indicate that pseudo Cronbach’s alpha coefficient was calculated as a
proper Cronbach’s alpha could not be calculated for crowding, physical attributes of sales
associates and sales associates’ availability (see Table 5.11, 5.12 and 5.13 below).
Table 5.11: Internal consistency reliability for crowding sub-scale
Scale Mean if Item
Deleted
Scale Variance if
Item Deleted
Corrected Item-
Total Correlation
Q2_2 2.8250 1.914 .641
Q2_1 3.1275 2.237 .641
Table 5.12 indicates the internal consistency reliability for the physical attributes of sales
associates. Statements Q5.1 and Q5.2 loaded on factor 4 and both reflect physical
attributes. For physical attributes, pseudo-Cronbach’s alpha coefficient was also
calculated as a proper Cronbach’s alpha could not be calculated. The reliability analysis
revealed a Cronbach’s alpha of 0.651. Therefore, these two statements were used to
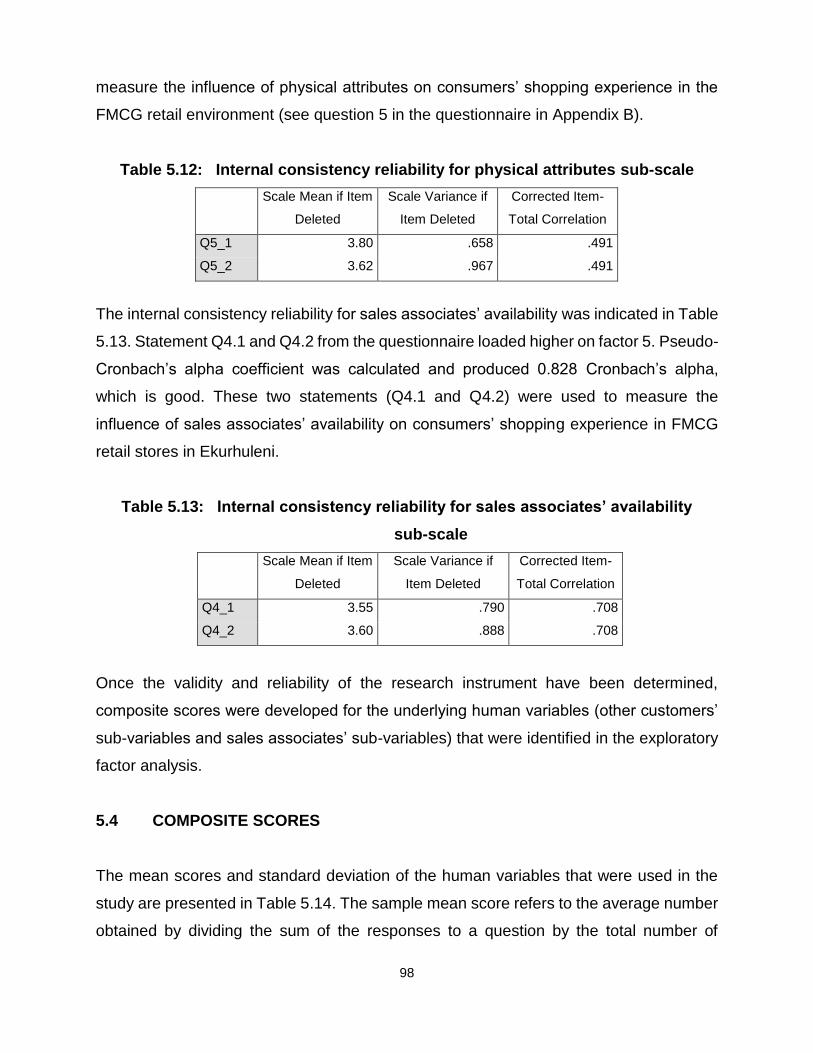
98
measure the influence of physical attributes on consumers’ shopping experience in the
FMCG retail environment (see question 5 in the questionnaire in Appendix B).
Table 5.12: Internal consistency reliability for physical attributes sub-scale
Scale Mean if Item
Deleted
Scale Variance if
Item Deleted
Corrected Item-
Total Correlation
Q5_1 3.80 .658 .491
Q5_2 3.62 .967 .491
The internal consistency reliability for sales associates’ availability was indicated in Table
5.13. Statement Q4.1 and Q4.2 from the questionnaire loaded higher on factor 5. Pseudo-
Cronbach’s alpha coefficient was calculated and produced 0.828 Cronbach’s alpha,
which is good. These two statements (Q4.1 and Q4.2) were used to measure the
influence of sales associates’ availability on consumers’ shopping experience in FMCG
retail stores in Ekurhuleni.
Table 5.13: Internal consistency reliability for sales associates’ availability
sub-scale
Scale Mean if Item
Deleted
Scale Variance if
Item Deleted
Corrected Item-
Total Correlation
Q4_1 3.55 .790 .708
Q4_2 3.60 .888 .708
Once the validity and reliability of the research instrument have been determined,
composite scores were developed for the underlying human variables (other customers’
sub-variables and sales associates’ sub-variables) that were identified in the exploratory
factor analysis.
5.4 COMPOSITE SCORES
The mean scores and standard deviation of the human variables that were used in the
study are presented in Table 5.14. The sample mean score refers to the average number
obtained by dividing the sum of the responses to a question by the total number of
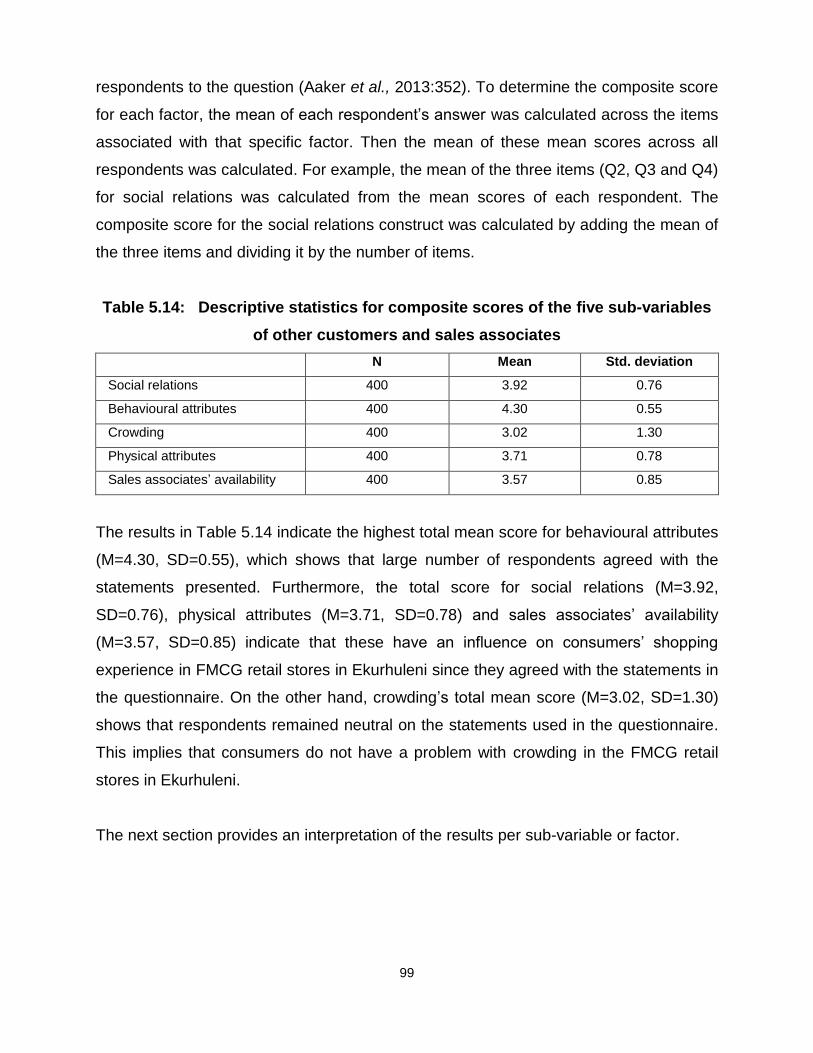
99
respondents to the question (Aaker et al., 2013:352). To determine the composite score
for each factor, the mean of each respondent’s answer was calculated across the items
associated with that specific factor. Then the mean of these mean scores across all
respondents was calculated. For example, the mean of the three items (Q2, Q3 and Q4)
for social relations was calculated from the mean scores of each respondent. The
composite score for the social relations construct was calculated by adding the mean of
the three items and dividing it by the number of items.
Table 5.14: Descriptive statistics for composite scores of the five sub-variables
of other customers and sales associates
N Mean Std. deviation
Social relations 400 3.92 0.76
Behavioural attributes 400 4.30 0.55
Crowding 400 3.02 1.30
Physical attributes 400 3.71 0.78
Sales associates’ availability 400 3.57 0.85
The results in Table 5.14 indicate the highest total mean score for behavioural attributes
(M=4.30, SD=0.55), which shows that large number of respondents agreed with the
statements presented. Furthermore, the total score for social relations (M=3.92,
SD=0.76), physical attributes (M=3.71, SD=0.78) and sales associates’ availability
(M=3.57, SD=0.85) indicate that these have an influence on consumers’ shopping
experience in FMCG retail stores in Ekurhuleni since they agreed with the statements in
the questionnaire. On the other hand, crowding’s total mean score (M=3.02, SD=1.30)
shows that respondents remained neutral on the statements used in the questionnaire.
This implies that consumers do not have a problem with crowding in the FMCG retail
stores in Ekurhuleni.
The next section provides an interpretation of the results per sub-variable or factor.

100
5.4.1 Crowding
Respondents were asked in question 2 to indicate their level of agreement or
disagreement with the following statements regarding crowding in FMCG retail stores in
Ekurhuleni: “I prefer to shop in a crowded FMCG retail stores” and “I often try to avoid
shopping in the crowded FMCG retail stores”. Therefore, the researcher used opposing
statements to measure crowding. The results in Table 5.15 reveal that more respondents
25.50% (n=102) agreed and 21.00% (n=84) strongly agreed that they prefer to shop in
the crowded FMCG retail stores in Ekurhuleni, while 20.75% (n=83) were neutral.
However, 17.25% (n=69) strongly disagreed. There were 22.50% (n=90) respondents
who strongly disagreed that they tried to avoid shopping in crowded FMCG retail stores,
with 22.25% (n=89) feeling neutral. It was also found that many respondents strongly
agreed 26.50% (n=106) and agreed with the second statement. In summary, these results
show that 25.5% (n=102) of the respondents prefer to shop in crowded FMCG retail
stores, while 26.5% (n=106) of them avoid shopping in crowded FMCG retail stores in
Ekurhuleni. These results indicate neutrality as the statements used to measure crowding
are opposite to each other.
Statements 2.3 and 2.4 were excluded for further analysis as they had low loadings (refer
to Table 5.6).
Table 5.15: Indicate the level of agreement or disagreement with regard to the
influence of crowding on your shopping experience
Strongly
disagree
Disagree Neutral Agree Strongly agree
N % N % N % N % N %
Q2.1 69 17.25% 62 15.50% 83 20.75% 102 25.50% 84 21.00%
Q2.2 90 22.50% 48 12.00% 89 22.25% 67 16.75% 106 26.50%
Source: Question 2

101
5.4.2 Social relations
There were three statements in question 3 in the questionnaire. They include 3.2 “I like
to make new friends when I’m shopping, 3.3 “I often prefer to have fun with other
customers shopping next to me”, and 3.4 “I like to talk to other customers who have goals
that are similar to mine”. Respondents had to indicate their level of agreement or
disagreement (refer to Table 5.6). Statement 3.1 was not considered for further analysis
as its reliability was very low. Most respondents 41.25% (n=165) agreed and 31.00%
(n=124) strongly agreed with the statement 3.2: “I like to make new friends when I’m
shopping”. The results in Table 5.16 also indicate that 21.50% (n=86) remained neutral
while only 5.50% (n=22) of respondents disagreed. Most respondents 38.25% (n=153)
agreed and 27.75% (n=111) strongly agreed with statement 3.3: “I often prefer to have
fun with other customers shopping next to me”. In addition, 24.00% of respondents felt
were neutral about the statement. The same applied to statement 3.4: “I like to talk to
other customers who have goals that are similar to mine”. Here, a large percentage of
respondents 43.75% (n=175) agreed and 29.5% (n=118) strongly agreed with the
statement while 20.0% (n=80) respondents remained neutral and 6.0% (n=24) disagreed.
These results indicate that social relations have an influence on consumers’ shopping
experience in FMCG retail stores in Ekurhuleni.
Table 5.16: Indicate the level of agreement or disagreement with regard to the
influence of social relations on your shopping experience
Strongly disagree Disagree Neutral Agree Strongly agree
N % N % N % N % N %
Q3.2 3 0.75% 22 5.50% 86 21.50% 165 41.25% 124 31.00%
Q3.3 3 0.75% 37 9.25% 96 24.00% 153 38.25% 111 27.75%
Q3.4 3 0.75% 24 6.00% 80 20.00% 175 43.75% 118 29.50%
Source: Question 3

102
5.4.3 Sales associates’ availability
Table 5.17 presents the results obtained for question 4 where respondents were asked
to indicate their level of agreement or disagreement with the influence of sales associates’
availability on their shopping experience in FMCG retail stores. The statements are as
follows: Statement 4.1: “Enough sales associates are always available and willing to
assist customers in the FMCG retail stores” and 4.2: “Sales associates always welcome
customers when they enter the FMCG retail stores with a friendly smile”. Statement 4.3
was eliminated owing to its low loading. The results in Table 5.17 show that 49.75%
(n=199) of respondents agreed that they are always welcomed by sales associates who
are willing to assist them when they enter the FMCG retail stores as opposed to the 27.0%
(n=108) respondents who were neutral and 6.25% (n=25) who opted to disagree. More
respondents 24.75% (n=171) also agreed that sales associates always welcomed them
to the FMCG retail stores with a friendly smile, while 33.25% (n=133) were neutral and
10.0% (n=40) disagreed. Therefore, it is clear that most respondents enjoy shopping in
FMCG retail stores because they feel that there are enough sales associates who are
always available and willing to assist customers. Respondents also liked FMCG retail
stores where sales associates always welcome customers with friendly smiles. Therefore,
influence their shopping experience.
Table 6.17: Indicate the level of agreement or disagreement with regard to the
influence of sales associates’ availability on your shopping experience
Strongly
disagree
Disagree Neutral Agree Strongly agree
N % N % N % N % N %
Q4.1 18 4.50% 25 6.25% 108 27.00% 199 49.75% 50 12.50%
Q4.2 6 1.50% 40 10.00% 133 33.25% 171 42.75% 50 12.50%
Source: Question 4

103
5.4.4 Physical attributes of sales associates
From the results in Table 5.18, it is evident that many respondents (38.25%) (n=153) like
to shop in the FMCG retail stores that have well-dressed and presentable sales
associates. However, 30.75% (n=123) respondents remained neutral and further 9.00%
(n=36) decided to disagree. Furthermore, many respondents 46% (n=46.00% (n=184)
agreed and 19.25% (n=77) strongly agreed that “the neat uniforms that sales associates
wear represent the FMCG retail stores’ brand very well”, while 30.75% (n=123)
respondents felt neutral. However, there were only 3.25% (n=13) respondents who
disagreed with the second statement. These results prove that the physical attributes of
sales associates positively influence consumers’ shopping experience in the FMCG retail
stores in Ekurhuleni.
Table 5.18: Indicate the level of agreement or disagreement with regard to the
influence of physical attributes on your shopping experience
Strongly
disagree
Disagree Neutral Agree Strongly agree
N % N % N % N % N %
Q5.1 11 2.75% 36 9.00% 123 30.75% 153 38.25% 77 19.25%
Q5.2 3 0.75% 13 3.25% 123 30.75% 184 46.00% 77 19.25%
Source: Question 5
5.4.5 Behavioural attributes of sales associates
In question 6, respondents were asked to indicate their agreement or disagreement level
regarding behavioural attributes statements. Table 5.19 illustrates the results for
statements 6.2 – 6.4 and 5.3 that loaded in this second factor instead of factor 4 (see
Table 5.6 for loading results). As can be seen in Table 5.19, many respondents strongly
agreed 48.75% (n=195) and agreed 43.75% (n=175) with statement 6.2: “I like sales
associates that are friendly and patient”. Only 6.75% (n=27) respondents remained
neutral. The results also indicated that most respondents 52.75% (n=211) strongly agreed
and 37.75 % (n=151) agreed with statement 6.3: “I prefer to shop at the FMCG retail

104
stores that have sales associates who can understand customers’ needs”. Only 0.75%
(n=3) of respondents disagreed with this statement. Statement 6.4: “Sales associates
who are honest and professional can be trusted” yielded 43.25% respondents who
strongly agreed and 40.00% (n=160) who agreed. Only 14.25% (n=57) respondents
remained neutral, while 1.25% (n=5) disagreed and strongly disagreed 1.25% (n=5). For
statement 5.3 that was retained in factor 2 (behavioural attributes), “professionally
appearing sales associates create a pleasant atmosphere in the FMCG retail stores”,
38.0% (n=152) of respondents agreed and strongly agreed (40.5%, n=162) while only
16.0% (n=64) respondents felt neutral and 4.0% disagreed. These results imply that
behavioural attributes of sales associates are the most influential sub-variable on
consumers’ shopping experience in the FMCG retail stores in Ekurhuleni.
Table 5.19: Indicate the level of agreement or disagreement with regard to the
influence of behavioural attributes on your shopping experience
Strongly
disagree
Disagree Neutral Agree Strongly agree
N % N % N % N % N %
Q6.2 0 0.00% 3 0.75% 27 6.75% 175 43.75% 195 48.75%
Q6.3 0 0.00% 2 0.50% 36 9.00% 151 37.75% 211 52.75%
Q6.4 5 1.25% 5 1.25% 57 14.25% 160 40.00% 173 43.25%
Q5.3 6 1.50% 16 4.00% 64 16.00% 152 38.00% 162 40.50%
Source: Question 6
Once the results for crowding, social relations, sales associates’ availability, physical
attributes of sales associates and behavioural attributes of sales associates have been
interpreted, the hypotheses and test results are presented in the next section.
5.5 HYPOTHESES TEST
Hypothesis testing is used to compare a set of observed frequencies, means or
proportions with a set of theoretical frequencies means or proportions (Tustin et al.,
2005:608). The hypotheses to determine if the proportions of consumers in the three
categories, namely disagree, neutral and agree are not statistically different with regard

105
to the influence of crowding, social relations, sales associates’ availability, physical
attributes and behavioural attributes of sales associates on their shopping experience in
FMCG retail stores in Ekurhuleni were tested with chi-square for equal proportion. The
chi-square test is used with count data to test how well it fits some expected distribution.
A chi-square is a measure of the extent to which some observed data departs from
expectation (Bruce & Bruce, 2017:112). These hypotheses are H1, H2, H3, H4, and H5.
The five-point Likert scale was reduced to three categories in order to simplify reporting
of these hypotheses test results. The three categories are disagree, neutral and agree.
This was done by combining strongly disagree with disagree and strongly agree with
agree.
5.5.1 Determining the influence of crowding on consumers’ shopping experience
Table 5.20 illustrates the distribution of scores for consumers’ perceptions regarding
crowding and the p-value is provided in the chi-square for equal proportion in Table 5.21
to test if the proportions of consumers who falls within the three categories, agree, neutral
and disagree are statistically different regarding their perception that crowding has an
influence on consumers’ shopping experience in FMCG retail stores. The test results in
Table 5.20 indicate that 40.5% (n=162) of respondents agreed that crowding influence
consumers’ shopping experience in FMCG retail stores, as opposed to the 32% and
27.5% of respondents who disagreed and remain neutral respectively. These results
conclude that less than half of respondents perceived crowding as a factor that influences
their shopping experience in FMCG retail stores.
Table 5.20: Frequency distribution scores for crowding
Crowding Frequency Percent
Disagree 128 32.00
Neutral 110 27.50
Agree 162 40.50
The p-value that determine whether H1 is supported or not is depicted in Table 5.21
below.
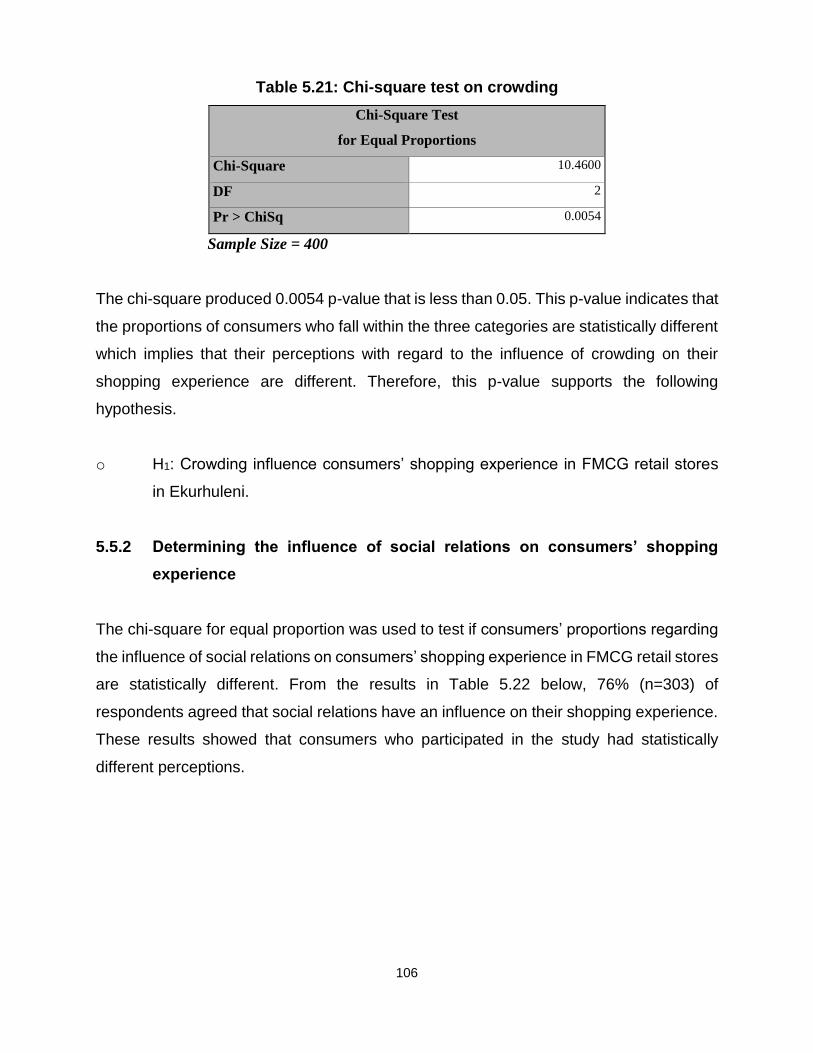
106
Table 5.21: Chi-square test on crowding
Chi-Square Test
for Equal Proportions
Chi-Square 10.4600
DF 2
Pr > ChiSq 0.0054
Sample Size = 400
The chi-square produced 0.0054 p-value that is less than 0.05. This p-value indicates that
the proportions of consumers who fall within the three categories are statistically different
which implies that their perceptions with regard to the influence of crowding on their
shopping experience are different. Therefore, this p-value supports the following
hypothesis.
o H1: Crowding influence consumers’ shopping experience in FMCG retail stores
in Ekurhuleni.
5.5.2 Determining the influence of social relations on consumers’ shopping
experience
The chi-square for equal proportion was used to test if consumers’ proportions regarding
the influence of social relations on consumers’ shopping experience in FMCG retail stores
are statistically different. From the results in Table 5.22 below, 76% (n=303) of
respondents agreed that social relations have an influence on their shopping experience.
These results showed that consumers who participated in the study had statistically
different perceptions.
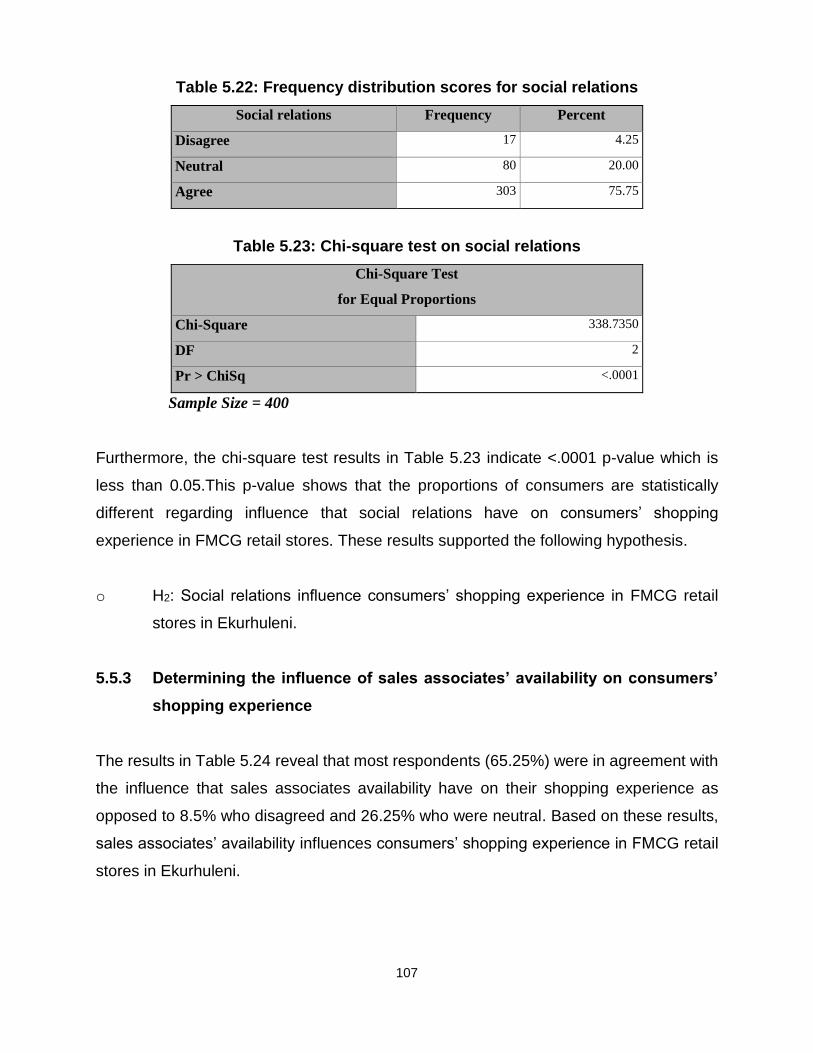
107
Table 5.22: Frequency distribution scores for social relations
Social relations Frequency Percent
Disagree 17 4.25
Neutral 80 20.00
Agree 303 75.75
Table 5.23: Chi-square test on social relations
Chi-Square Test
for Equal Proportions
Chi-Square 338.7350
DF 2
Pr > ChiSq <.0001
Sample Size = 400
Furthermore, the chi-square test results in Table 5.23 indicate <.0001 p-value which is
less than 0.05.This p-value shows that the proportions of consumers are statistically
different regarding influence that social relations have on consumers’ shopping
experience in FMCG retail stores. These results supported the following hypothesis.
o H2: Social relations influence consumers’ shopping experience in FMCG retail
stores in Ekurhuleni.
5.5.3 Determining the influence of sales associates’ availability on consumers’
shopping experience
The results in Table 5.24 reveal that most respondents (65.25%) were in agreement with
the influence that sales associates availability have on their shopping experience as
opposed to 8.5% who disagreed and 26.25% who were neutral. Based on these results,
sales associates’ availability influences consumers’ shopping experience in FMCG retail
stores in Ekurhuleni.

108
Table 5.24: Frequency distribution scores for sales associates’ availability
Availability Frequency Percent
Disagree 34 8.50
Neutral 105 26.25
Agree 261 65.25
The chi-square results for equal proportion are interpreted in the next section.
Table 5.25: Chi-square test on sales associates’ availability
Chi-Square Test
for Equal Proportions
Chi-Square 202.2650
DF 2
Pr > ChiSq <.0001
Sample Size = 400
It is indicated in Table 5.25 that the p-value obtained for the influence of sales associates’
availability on consumers’ shopping experience in FMCG retail stores is <.0001. This p-
value is less than 0.05, which indicate that there is a statistically difference in the
proportions of consumers. Based on this p-value the hypothesis below was supported:
o H3: Sales associates’ availability influence consumers’ shopping experience in
FMCG retail stores in Ekurhuleni.
5.5.4 Determining the influence of physical attributes of sales associates on
consumers’ shopping experience
As can be seen in Table 5.26 the results indicate that most respondents (68%, n=271)
agreed that physical attributes of sales associates influence their shopping experience in
FMCG retail stores in Ekurhuleni compared to less than half of the respondents (30.25%,
n=121) who disagreed.

109
Table 5.26: Frequency distribution scores for physical attributes
Physical attributes Frequency Percent
Disagree 8 2.00
Neutral 121 30.25
Agree 271 67.75
Table 5.27: Chi-square test on physical attributes
Chi-Square Test
for Equal Proportions
Chi-Square 261.0950
DF 2
Pr > ChiSq <.0001
Sample Size = 400
It is indicated in Table 5.27 that the proportions of consumers with regard to the influence
of crowding on their shopping experience are statistically different as the p-value is less
than 0.05. It is therefore that this p-value (<.0001) confirm that the following hypothesis
was supported.
o H4: Physical attributes of sales associates influence consumers’ shopping
experience in FMCG retail stores in Ekurhuleni.
5.5.5 Determining the influence of behavioural attributes of sales associates on
consumers’ shopping experience
The hypothesis in this section was tested to determine if the proportions of consumers
within the three categories (disagree, neutral and agree) differ statistically regarding
behavioural attributes of sales associates’ influence on their shopping experience. The
results in Table 5.28 indicate a high percentage of respondents (94.5%, n=378) who
agreed that behavioural attributes of sales associates influences their shopping
experience in FMCG retail stores in Ekurhuleni.
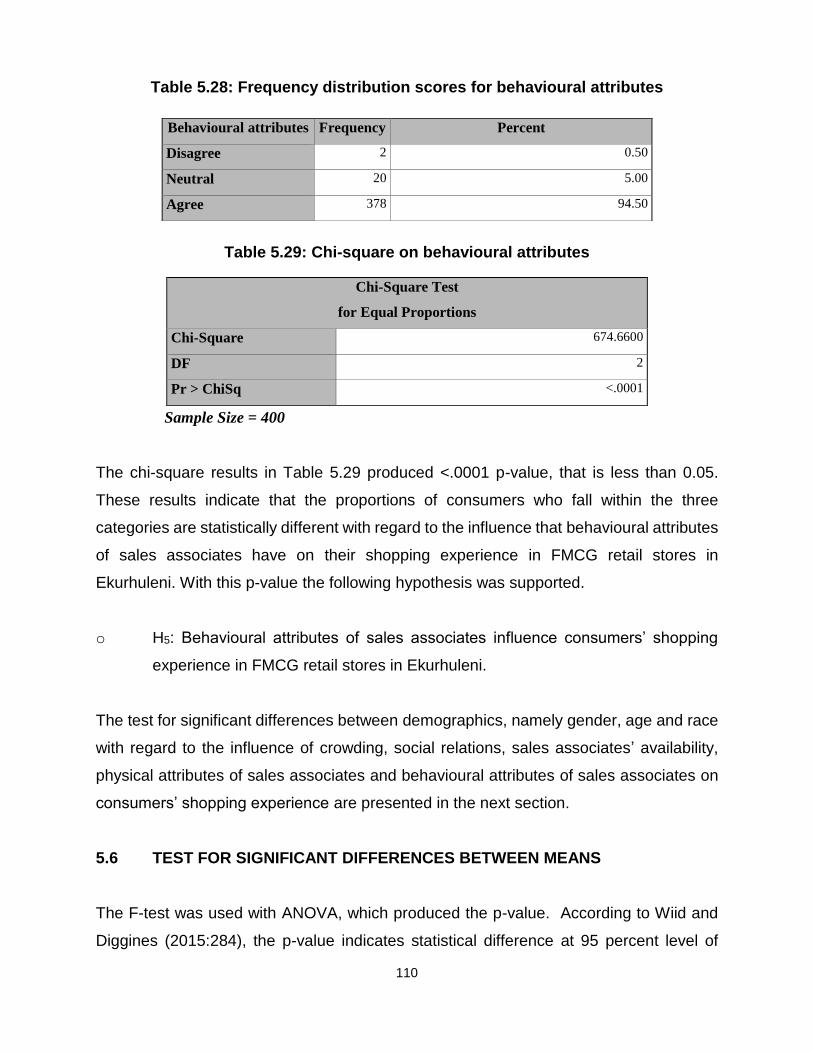
110
Table 5.28: Frequency distribution scores for behavioural attributes
Table 5.29: Chi-square on behavioural attributes
Sample Size = 400
The chi-square results in Table 5.29 produced <.0001 p-value, that is less than 0.05.
These results indicate that the proportions of consumers who fall within the three
categories are statistically different with regard to the influence that behavioural attributes
of sales associates have on their shopping experience in FMCG retail stores in
Ekurhuleni. With this p-value the following hypothesis was supported.
o H5: Behavioural attributes of sales associates influence consumers’ shopping
experience in FMCG retail stores in Ekurhuleni.
The test for significant differences between demographics, namely gender, age and race
with regard to the influence of crowding, social relations, sales associates’ availability,
physical attributes of sales associates and behavioural attributes of sales associates on
consumers’ shopping experience are presented in the next section.
5.6 TEST FOR SIGNIFICANT DIFFERENCES BETWEEN MEANS
The F-test was used with ANOVA, which produced the p-value. According to Wiid and
Diggines (2015:284), the p-value indicates statistical difference at 95 percent level of
Behavioural attributes Frequency Percent
Disagree 2 0.50
Neutral 20 5.00
Agree 378 94.50
Chi-Square Test
for Equal Proportions
Chi-Square 674.6600
DF 2
Pr > ChiSq <.0001

111
confidence if the calculated p-value is smaller than 0.05. ANOVA is a technique that tests
the differences in means of the interval dependant for various categories of independent
variables (Tustin et al., 2005:682). One-way ANOVA was used to compare the mean
differences. One-way ANOVA is a statistical test used to determine if more than two
means are equal (Cooper & Schindler, 2014:453). These tests determine whether there
are statistically significant differences between participating consumers’ demographics,
namely gender, age and race with regard to the influence of crowding, social relations,
sales associates’ availability, physical attributes and behavioural attributes of sales
associates on their shopping experience in FMCG retail stores in Ekurhuleni. It was
therefore important to test if there were differences between genders, between age
groups and between races as the literature that led to the formulation of hypotheses in
Chapter 3 indicated some differences.
5.6.1 Differences between consumers’ demographics with regard to crowding
The results to test the statistically significant differences between gender, age and race
regarding crowding are illustrated in Tables 5.30 – 5.35.
5.6.1.1 Gender with regard to crowding in FMCG retail stores in Ekurhuleni.
One-way ANOVA was used to indicate different mean levels of gender with regard to
crowding in the FMCG retail stores in Ekurhuleni. The results in Table 5.30 indicate that
females (M=3.21) had a higher mean score than male respondents (M=2.88). This
showed that consumers who participated in this study were neutral with regard to the
influence of crowding in the FMCG retail stores in Ekurhuleni. The reason both mean
scores are neutral is because the mean score above 2.50 fell under neutral which is
leaning towards 3.00 in the Likert scale that was used.
Table 5.30: One-way ANOVA on gender regarding crowding
Level Number Mean Std. error Lower 95% Upper 95%
Male 224 2.87723 0.08653 2.7071 3.0474
Female 176 3.21023 0.09762 3.0183 3.4022

112
To determine whether there are statistically significant differences between the
respondents’ genders regarding crowding, ANOVA was used with an F-test to produce
probability value (p-value). The results in Table 5.31 indicate a p-value of 0.0111, which
is below 0.05. This p-value shows that there is a statistically significant difference between
genders with regard to crowding’s influence on consumers’ shopping experience at a 95%
level of confidence (Wiid & Diggines, 2015:284). Based on this p-value=0.0111* which
revealed that a statistically significant difference exists, the following hypothesis was then
supported:
o H1a: There are differences between genders with regard to the influence of
crowding on consumers’ shopping experience in FMCG retail stores in
Ekurhuleni.
Table 5.31: ANOVA F-test on gender regarding crowding
Source DF Sum of squares Mean square F-ratio Prob > F
Q7 Gender 1 10.92890 10.9289 6.5155 0.0111*
Error 398 667.59547 1.6774
Total 399 678.52437
*Significant difference
5.6.1.2 Age with regard to crowding in FMCG retail stores in Ekurhuleni
In order to determine whether there is a statistically significant difference between the
age groups of respondents, one-way ANOVA and an F-test were used.
The mean scores obtained from the one-way ANOVA as illustrated in Table 5.32 indicates
the responses of age groups in terms of feelings regarding crowding. The results indicate
that the mean scores differ slightly in the age group 24 to 35 (M=2.96) and 36 to 45
(M=2.94) leaned towards neutral. The mean score of respondents between the ages 18
to 23 (M=3.16) was the highest, followed by ages of 46 to 60 with 3.00 mean score. These
results indicate that respondents from different age groups remained fairly neutral
regarding the influence of crowding in their shopping experience in FMCG retail stores in
Ekurhuleni.

113
Table 5.32: One-way ANOVA on age regarding crowding
Level Number Mean Std. error Lower 95% Upper 95%
18-23 122 3.15984 0.11821 2.9274 3.3922
24-35 135 2.96296 0.11238 2.7420 3.1839
36-45 78 2.93590 0.14784 2.6452 3.2266
46-60 65 3.00000 0.16195 2.6816 3.3184
The F-test that was conducted with ANOVA produced a p-value of 0.5745 as shown in
Table 5.33. This indicates that there is no statistically significant difference between age
groups of respondents regarding the influence of crowding on their shopping experience
in the FMCG retail stores since the p-value obtained from the F-test results was above
0.05. As there was no difference, the following hypothesis was not supported:
o H1b: There are differences between age groups with regard to the influence of
crowding on consumers’ shopping experience in FMCG retail stores in
Ekurhuleni.
Table 5.33: ANOVA F-test on age regarding crowding
Source DF Sum of squares Mean square F-ratio Prob > F
Q8 Age group 3 3.39688 1.13229 0.6642 0.5745
Error 396 675.12750 1.70487
Total 399 678.52437
*Significant difference
5.6.1.3 Race with regard to crowding in the FMCG retail stores in Ekurhuleni
One-way ANOVA shown in Table 5.34 and F-test in Table 5.35 were used to determine
whether there was a statistically significant difference between respondents’ race groups
and crowding in FMCG retail stores in Ekurhuleni.
The mean scores for African (M=2.99) and white (M=2.96) respondents were almost the
same. Furthermore, the mean scores for coloured (M=3.27) and Indian (M=3.15)
respondents were relatively higher. The results indicate that most respondents from the

114
various racial groups remained neutral with regard to how crowding influence their
shopping experience in FMCG retail stores in Ekurhuleni.
Table 5.34: One-way ANOVA on race regarding crowding
Level Number Mean Std. error Lower 95% Upper 95%
African 228 2.99342 0.08646 2.8235 3.1634
White 102 2.95588 0.12926 2.7018 3.2100
Coloured 43 3.26744 0.19908 2.8761 3.6588
Indian 27 3.14815 0.25124 2.6542 3.6421
As shown in Table 5.35, the F-test results produced a p-value (p=0.5440) that is larger
than 0.05. This p-value indicates that there is no statistically significant difference
between respondents’ racial groups regarding how they felt about the influence of
crowding on their shopping experience in FMCG retail stores in Ekurhuleni. Therefore,
the following hypothesis was not supported:
o H1c: There are differences between race groups with regard to the influence of
crowding on consumers’ shopping in FMCG retail stores in Ekurhuleni.
Table 5.35: ANOVA F-test on race regarding crowding
Source DF Sum of squares Mean square F-ratio Prob > F
Q9 Racial group 3 3.65095 1.21698 0.7141 0.5440
Error 396 674.87343 1.70423
Total 399 678.52437
*Significant difference
It is important for the FMCG retailers to understand consumers’ reactions towards
crowding in order to be able to create a pleasant shopping experience in the FMCG retail
stores.

115
5.6.2 Differences between consumers’ demographics with regard to social
relations
One-way ANOVA and F-test with ANOVA were also used to test whether there were
differences in terms of gender, age and income. Understanding consumers’ demographic
differences is important to the FMCG retailers because it will create greater understanding
of consumers’ perceptions of a pleasant shopping experience.
5.6.2.1 Gender with regard to social relations in FMCG retail stores in Ekurhuleni
As indicated in Table 5.36, the mean scores for male (M=3.96) and female (M=3.85)
respondents are similar, although the mean score for male respondents was slightly
higher. These mean scores indicate that consumers agreed that social relations influence
their shopping experiences in the FMCG retail stores in Ekurhuleni.
Table 5.36: One-way ANOVA on gender regarding social relations
Level Number Mean Std. error Lower 95% Upper 95%
Male 224 3.96280 0.05049 3.8635 4.0621
Female 176 3.85417 0.05696 3.7422 3.9662
The results of the F-test with ANOVA in Table 5.37 shows a p-value of 0.1543 that is
larger than 0.05. This p-value indicates that there is no statistically significant difference
between male and female respondents regarding social relations. With this p-value
(0.1543), the following hypothesis was not supported:
o H2a: There are differences between genders with regard to the influence of social
relations on consumers’ shopping experience in FMCG retail stores in Ekurhuleni.

116
Table 5.37: ANOVA F-test on gender regarding social relations
Source DF Sum of Squares Mean Square F-Ratio Prob > F
Q7 Gender 1 1.16308 1.16308 2.0367 0.1543
Error 398 227.28026 0.57106
Total 399 228.44333
*Significant difference
5.6.2.2 Age with regard to social relations in FMCG retail stores in Ekurhuleni
One-way ANOVA was used to determine if there are differences between the mean
scores. It can be seen in Table 5.38 that the mean score for the age group 46 - 60 differs
from those of age groups 18-23, 24-35 and 36-45. However, most respondents from all
age groups agreed that social relations influence their shopping experience in the FMCG
retail stores in Ekurhuleni.
An F-test was conducted to determine whether there was a statistically significant
difference or not between the various age groups regarding social relations.
Table 5.38: One-way ANOVA on age regarding social relations
Level Number Mean Std. error Lower 95% Upper 95%
18 – 23 122 3.77322 0.06800 3.6395 3.9069
24 – 35 135 3.98025 0.06464 3.8532 4.1073
36 – 45 78 3.88034 0.08504 3.7131 4.0475
46 – 60 65 4.08718 0.09316 3.9040 4.2703
The F-test results in Table 5.39 indicate a p-value of 0.0312, which is below 0.05. The
results indicate that there is a statistically significant difference between respondents’ age
groups with regard to the influence of social relations on their shopping experience in the
FMCG retail stores in Ekurhuleni at a 95% confidence level. With this significant
difference, the following hypothesis was supported:

117
o H2b: There are differences between age groups with regard to the influence of
social relations on consumers’ shopping experience in FMCG retail stores in
Ekurhuleni.
Table 5.39: ANOVA F-test on age regarding social relations
Source DF Sum of
squares
Mean square F-ratio Prob > F
Q8 Age group 3 5.04764 1.68255 2.9825 0.0312*
Error 396 223.39570 0.56413
Total 399 228.44333
*Significant difference
5.6.2.3 Race with regard to social relations in FMCG retail stores in Ekurhuleni
One-way ANOVA was conducted to test whether there are differences in the mean scores
of the racial groups and F-test to determine the significance of the difference.
The results in Table 5.40 indicate that the mean score for Coloured respondents (M=4.08)
was higher than those for African, White and Indian respondents. Furthermore, the results
show that most respondents agreed that social relations influence their shopping
experience in the FMCG retail stores in Ekurhuleni.
Table 5.40: One-way ANOVA on race regarding social relations
Level Number Mean Std. error Lower 95% Upper 95%
African 228 3.94883 0.04990 3.8507 4.0469
White 102 3.76797 0.07461 3.6213 3.9147
Coloured 43 4.07752 0.11491 3.8516 4.3034
Indian 27 3.92593 0.14501 3.6408 4.2110
It is indicated in Table 5.41 that the F-test produced a p-value of 0.0976, which is above
0.05. This p-value indicates that there is no statistically significant difference between
racial groups regarding social relations in the FMCG retail stores in Ekurhuleni. Therefore,
the following hypothesis was not supported:

118
o H2c: There are differences between race groups with regard to the influence of
social relations on consumers’ shopping experience in FMCG retail stores in
Ekurhuleni.
Table 5.41: ANOVA F-test on race regarding social relations
Source DF Sum of
squares
Mean square F-ratio Prob > F
Q9 Racial group 3 3.60481 1.20160 2.1163 0.0976
Error 396 224.83852 0.56777
Total 399 228.44333
*Significant difference
The interpretation of the results for testing the significant differences between gender,
age and race with regard to sales associates’ availability follows in the next section.
5.6.3 Differences between consumers’ demographics with regard to sales
associates’ availability
The researcher used one-way ANOVA and F-test to compare the mean scores ranking
and to determine the significant differences between demographics (gender, age and
race). The results are presented in Tables 5.42 – 5.47.
5.6.3.1 Gender with regard to sales associates’ availability in FMCG retail stores in
Ekurhuleni
The mean scores depicted in Table 5.42 indicate that male (M=3.60) and female (M=3.53)
respondents did not differ in terms of how they feel about sales associates being always
available to assist customers in the FMCG retail stores. The results further show that both
genders agreed that the availability of sales associates play an influential role on their
shopping experience in the FMCG retail stores in Ekurhuleni. The results could help
FMCG retailers to understand the need to put more emphasis on the availability of sales

119
associates to create a pleasant atmosphere in the FMCG retail stores that will enhance
consumers’ shopping experience.
Table 5.42: One-way ANOVA on gender regarding sales associates’ availability
Level Number Mean Std. error Lower 95% Upper 95%
Male 224 3.60268 0.05656 3.4915 3.7139
Female 176 3.53125 0.06381 3.4058 3.6567
The ANOVA with F-test in Table 5.43 produced a p-value of 0.4027. This p-value is above
0.05, which indicates that there is no statistically significant difference between gender
groups regarding the influence of sales associates’ availability in FMCG retail stores in
Ekurhuleni. However, this result did not support the following hypothesis:
o H3a: There are differences between genders with regard to the influence of sales
associates’ availability on consumers’ shopping experience in the FMCG retail
stores in Ekurhuleni.
Table 5.43: ANOVA F-test on gender regarding sales associates’ availability
Source DF Sum of squares Mean square F-ratio Prob > F
Q7 Gender 1 0.50286 0.502857 0.7017 0.4027
Error 398 285.21652 0.716624
Total 399 285.71937
*Significant difference
5.6.3.2 Age with regard to sales associates’ availability in FMCG retail stores in
Ekurhuleni
Table 5.44 and 5.45 presented the results for one-way ANOVA and the F-test that
determined whether there is a statistically significant difference between age groups, as
well as the mean rankings with regard to the availability of sales associates in the FMCG
retail stores.

120
The age group of 18-23 yielded a low mean score (below 3.50), which indicates that this
group were neutral as opposed to respondents from other age groups who agreed that
they prefer FMCG retail stores that always have sales associates available.
Table 5.44: One-way ANOVA on age regarding sales associates’ availability
Level Number Mean Std. error Lower 95% Upper 95%
18-23 122 3.49180 0.07659 3.3412 3.6424
24-35 135 3.58148 0.07281 3.4383 3.7246
36-45 78 3.55128 0.09579 3.3630 3.7396
46-60 65 3.72308 0.10493 3.5168 3.9294
The ANOVA F-test results with a p-value of 0.3584 indicate that there is no statistically
significant difference between various age groups regarding the influence of sales
associates’ availability on their shopping experience. This p-value is above 0.05, and the
results indicate that the following hypothesis was not supported:
o H3b: There are differences between age groups with regard to the influence of
sales associates’ availability on consumers’ shopping experience in FMCG retail
stores in Ekurhuleni.
Table 5.45: ANOVA F-test on age regarding sales associates’ availability
Source DF Sum of squares Mean square F-ratio Prob > F
Q8 Age group 3 2.31361 0.771204 1.0776 0.3584
Error 396 283.40576 0.715671
Total 399 285.71937
*Significant difference
5.6.3.3 Race with regard to sales associates’ availability in FMCG retail stores in
Ekurhuleni
The results pertaining to differences among race groups are illustrated in Tables 5.46 and
5.47. The mean scores in Table 5.46 indicate that Coloured respondents recorded the
lowest mean score of 3.34, which shows neutrality. The mean scores obtained for African,
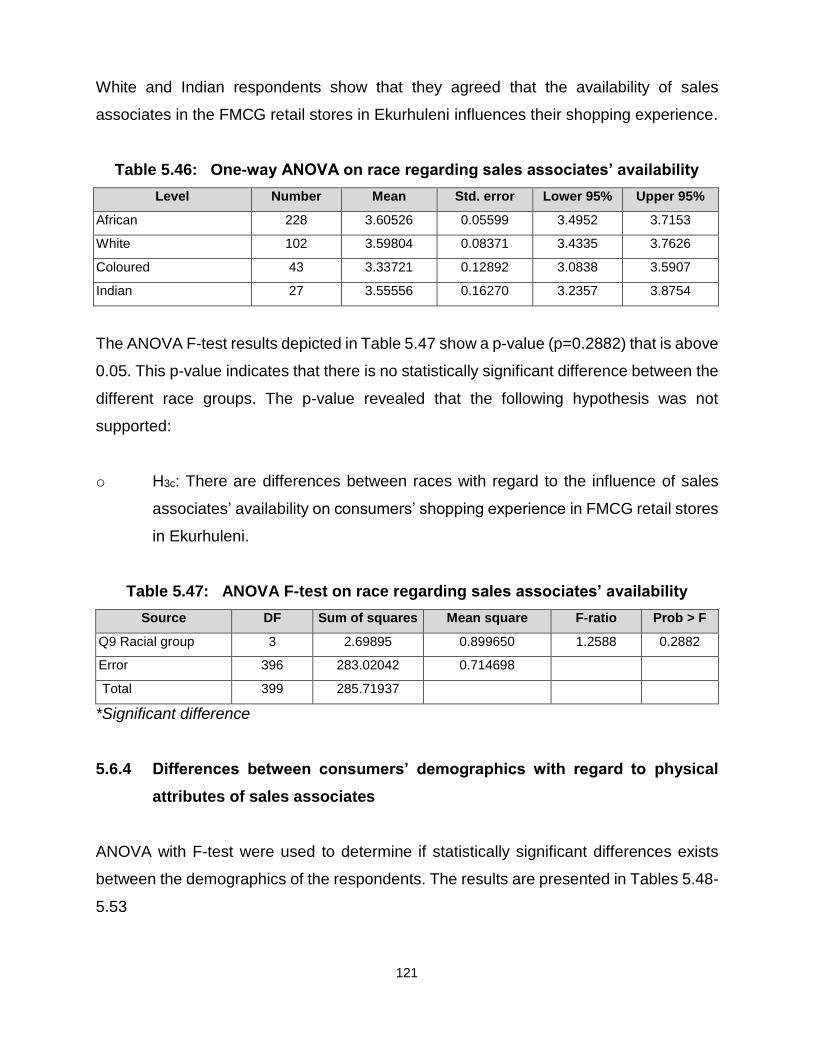
121
White and Indian respondents show that they agreed that the availability of sales
associates in the FMCG retail stores in Ekurhuleni influences their shopping experience.
Table 5.46: One-way ANOVA on race regarding sales associates’ availability
Level Number Mean Std. error Lower 95% Upper 95%
African 228 3.60526 0.05599 3.4952 3.7153
White 102 3.59804 0.08371 3.4335 3.7626
Coloured 43 3.33721 0.12892 3.0838 3.5907
Indian 27 3.55556 0.16270 3.2357 3.8754
The ANOVA F-test results depicted in Table 5.47 show a p-value (p=0.2882) that is above
0.05. This p-value indicates that there is no statistically significant difference between the
different race groups. The p-value revealed that the following hypothesis was not
supported:
o H3c: There are differences between races with regard to the influence of sales
associates’ availability on consumers’ shopping experience in FMCG retail stores
in Ekurhuleni.
Table 5.47: ANOVA F-test on race regarding sales associates’ availability
Source DF Sum of squares Mean square F-ratio Prob > F
Q9 Racial group 3 2.69895 0.899650 1.2588 0.2882
Error 396 283.02042 0.714698
Total 399 285.71937
*Significant difference
5.6.4 Differences between consumers’ demographics with regard to physical
attributes of sales associates
ANOVA with F-test were used to determine if statistically significant differences exists
between the demographics of the respondents. The results are presented in Tables 5.48-
5.53

122
5.6.4.1 Gender with regard to physical attributes of sales associates in FMCG retail
stores in Ekurhuleni
The one-way ANOVA results in Table 5.48 indicate the same mean scores for male and
female respondents. These mean scores of 3.70 and 3.71 respectively indicates that
respondents agreed that physical attributes of sales associates influences their shopping
experience, as they highlighted that they like to shop in the FMCG retail stores that have
presentable sales associates.
Table 5.48: One-way ANOVA on gender regarding physical attributes
Level Number Mean Std. error Lower 95% Upper 95%
Male 224 3.70759 0.05192 3.6055 3.8097
Female 176 3.71307 0.05858 3.5979 3.8282
The ANOVA F-test results in Table 5.49 show a p-value of 0.9442, which indicate that
there is no statistically significant difference between male and female respondents. This
p-value is larger than 0.05. The results also indicate that the following hypothesis was not
supported:
o H4a: There are differences between genders with regard to the influence of
physical attributes of sales associates on consumers’ shopping experience in
FMCG retail stores in Ekurhuleni.
Table 5.49: ANOVA F-test on gender regarding physical attributes
Source DF Sum of squares Mean square F-ratio Prob > F
Q7 Gender 1 0.00296 0.002959 0.0049 0.9442
Error 398 240.35704 0.603912
Total 399 240.36000
*Significant difference

123
5.6.4.2 Age with regard to physical attributes of sales associates in FMCG retail
stores in Ekurhuleni
The results of one-way ANOVA and ANOVA with F-test that were conducted on gender
are illustrated in Tables 5.50 and 5.51. The mean scores in Table 5.50 did not show much
difference as they were all leaning towards the agree level, which is above 3.50. This
indicates that respondents across age groups recognised the influence that sales
associates’ physical attributes have on their shopping experience in the FMCG retail
stores in Ekurhuleni.
Table 5.50: One-way ANOVA on age regarding physical attributes of sales
associates
Level Number Mean Std. error Lower 95% Upper 95%
18-23 122 3.66393 0.07032 3.5257 3.8022
24-35 135 3.76667 0.06684 3.6353 3.8981
36-45 78 3.76282 0.08794 3.5899 3.9357
46-60 65 3.61538 0.09633 3.4260 3.8048
The ANOVA F-test results depicted in Table 5.51 indicate that the p-value is 0.4810. This
is larger than 0.05, which indicates that there is no statistically significant difference
between age groups. Therefore, this hypothesis was not supported:
o H4b: There are differences between age groups with regard to the influence of
physical attributes of sales associates on consumers’ shopping experience in
FMCG retail stores in Ekurhuleni.
Table 5.51: ANOVA F-test on age regarding physical attributes of sales
associates
Source DF Sum of squares Mean square F-ratio Prob > F
Q8 Age group 3 1.49189 0.497298 0.8244 0.4810
Error 396 238.86811 0.603202
Total 399 240.36000
*Significant difference

124
5.6.4.3 Race with regard to physical attributes of sales associates in FMCG retail
stores in Ekurhuleni
Table 5.52 indicates that the Indian respondents recorded a mean score of 3.90, which
is higher than the other race groups. However, the mean scores for African, White and
Coloured respondents fell under the same level with the Indian consumers as they agreed
that they like the FMCG retail stores that have presentable sales associates.
Table 5.52: One-way ANOVA on race regarding physical attributes of sales
associates
Level Number Mean Std. error Lower 95% Upper 95%
African 228 3.68640 0.05147 3.5852 3.7876
White 102 3.72059 0.07695 3.5693 3.8719
Coloured 43 3.68605 0.11851 3.4531 3.9190
Indian 27 3.90741 0.14956 3.6134 4.2014
Table 5.53 shows the results of the ANOVA with F-test that was conducted to determine
whether there was a statistically significant difference between the racial groups in FMCG
retail stores in Ekurhuleni. The results produced a p-value of 0.5704, above 0.05. This
indicates that there is no statistically significant difference between racial groups with
regard to the influence of physical attributes of sales associates on their shopping
experience. Therefore, it is that the hypothesis below was not supported:
o H4c: There are differences between races with regard to the influence of physical
attributes of sales associates on consumers’ shopping experience in FMCG retail
stores in Ekurhuleni.

125
Table 5.53: ANOVA F-test on race regarding physical attributes of sales
associates
Source DF Sum of squares Mean square F-ratio Prob > F
Q9 Racial group 3 1.21524 0.405079 0.6708 0.5704
Error 396 239.14476 0.603901
Total 399 240.36000
*Significant difference
5.6.5 Differences between consumers’ demographics with regard to behavioural
attributes of sales associates
To determine whether there is a statistically significant difference between respondents’
demographics with regard to behavioural attributes of sales associates, ANOVA was used
with F-test. Furthermore, one-way ANOVA was used to arrange the mean scores of
respondents in ranking order.
5.6.5.1 Gender with regard to behavioural attributes of sales associates in FMCG
retail stores in Ekurhuleni
The one-way ANOVA results in Table 5.54 reveal that female respondents (M=4.31) had
a higher mean score than males (M=4.28). Overall, the mean scores of male and female
respondents indicate that they would prefer the FMCG retail stores that have sales
associates who are professional, friendly and understand customers’ needs. These mean
scores differences can make the FMCG retailers aware of the value that sales associates’
behavioural attributes might add to enhance consumers’ shopping experience as they
have an influence.
Table 5.54: One-way ANOVA on gender regarding behavioural attributes of sales
associates
Level Number Mean Std. error Lower 95% Upper 95%
Male 224 4.28125 0.03666 4.2092 4.3533
Female 176 4.31250 0.04136 4.2312 4.3938

126
The ANOVA with F-test results that were conducted to determine if there was a
statistically significant difference between genders are shown in Table 5.55. The p-value
for gender was 0.5721, which is larger than 0.05. This p-value 0.5721 indicates that there
is no statistically significant difference between male and female respondents with regard
to the influence of behavioural attributes of sales associates on consumers shopping
experience. Based on the results, the following hypothesis was not supported:
o H5a: There are differences between gender groups with regard to the influence of
behavioural attributes of sales associates on consumers’ shopping experience in
FMCG retail stores in Ekurhuleni.
Table 5.55: ANOVA F-test on gender regarding behavioural attributes of sales
associates
Source DF Sum of squares Mean square F-ratio Prob > F
Q7 Gender 1 0.09625 0.096250 0.3196 0.5721
Error 398 119.84375 0.301115
Total 399 119.94000
*Significant difference
5.6.5.2 Age with regard to behavioural attributes of sales associates in FMCG retail
stores in Ekurhuleni
The researcher also used ANOVA and F-test to determine whether statistically significant
differences exist between respondents’ age groups with regard to the influence of
behavioural attributes of sales associates in FMCG retail stores in Ekurhuleni. In addition,
one-way ANOVA was utilised to determine the mean scores differences.
The mean scores in Table 5.56 indicate how respondents felt regarding the influence of
behavioural attributes of sales associates on their shopping experience in FMCG retail
stores. The results indicate that the mean scores of different age groups are quite similar.
These mean scores show that they agreed that behavioural attributes have an influence
on their shopping experience in the FMCG retail stores in Ekurhuleni.

127
Table 5.56: One-way ANOVA on age regarding behavioural attributes of sales
associates
Level Number Mean Std. error Lower 95% Upper 95%
18-23 122 4.30328 0.04955 4.2059 4.4007
24-35 135 4.22222 0.04711 4.1296 4.3148
36-45 78 4.37179 0.06197 4.2500 4.4936
46-60 65 4.33846 0.06789 4.2050 4.4719
The ANOVA F-test results as depicted in Table 5.57 show a p-value of 0.2269, which is
larger than 0.05. This p-value indicates no statistically significant difference between the
age groups of respondents. Owing to the fact that there is no statistically significant
difference, the following hypothesis was not supported:
o H5b: There are differences between age groups with regard to the influence of
behavioural attributes of sales associates on consumers’ shopping experience in
FMCG retail stores in Ekurhuleni.
Table 5.57: ANOVA F-test on age regarding behavioural attributes of sales
associates
Source DF Sum of squares Mean square F-ratio Prob > F
Q8 Age group 3 1.30618 0.435394 1.4533 0.2269
Error 396 118.63382 0.299580
Total 399 119.94000
*Significant difference
5.6.5.3 Race with regard to behavioural attributes of sales associates in FMCG
retail stores in Ekurhuleni
The results of ANOVA with F-test and one-way ANOVA on race regarding behavioural
attributes of sales associates are presented in Tables 5.58 and 5.59.
In Table 5.58, the results of the one-way ANOVA indicate that the mean score for Indian
(M=4.50) respondents is higher than those of the other racial groups. It shows that Indian
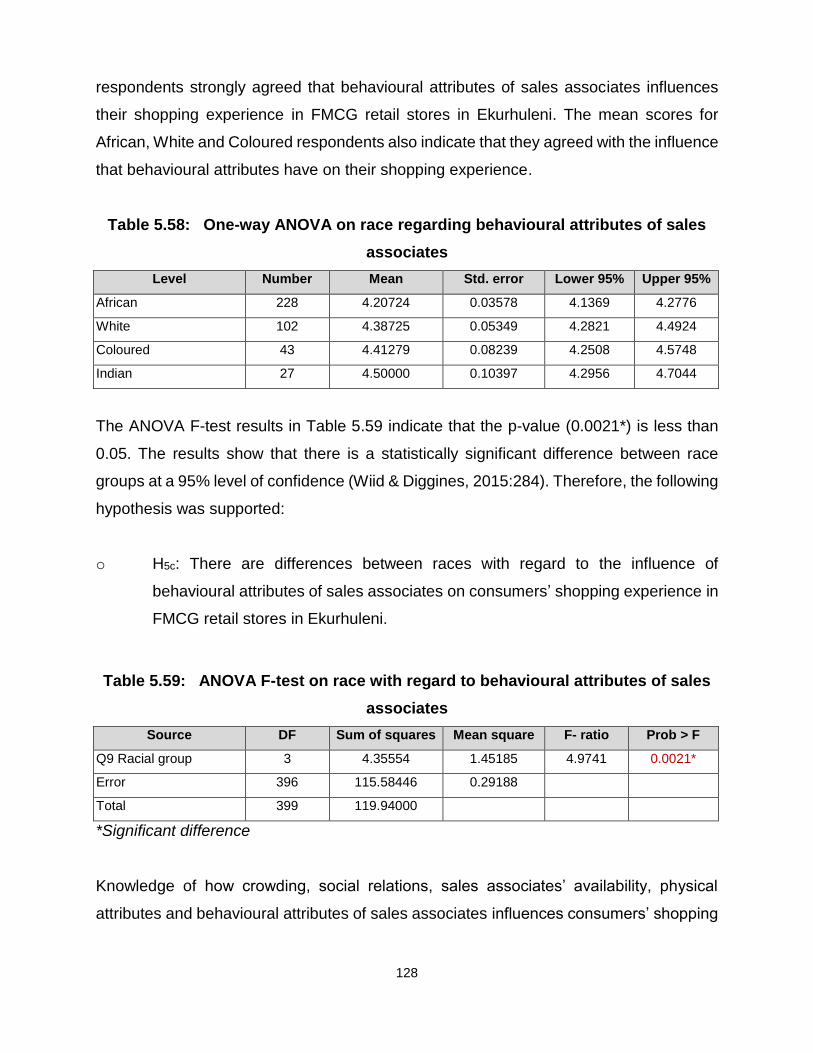
128
respondents strongly agreed that behavioural attributes of sales associates influences
their shopping experience in FMCG retail stores in Ekurhuleni. The mean scores for
African, White and Coloured respondents also indicate that they agreed with the influence
that behavioural attributes have on their shopping experience.
Table 5.58: One-way ANOVA on race regarding behavioural attributes of sales
associates
Level Number Mean Std. error Lower 95% Upper 95%
African 228 4.20724 0.03578 4.1369 4.2776
White 102 4.38725 0.05349 4.2821 4.4924
Coloured 43 4.41279 0.08239 4.2508 4.5748
Indian 27 4.50000 0.10397 4.2956 4.7044
The ANOVA F-test results in Table 5.59 indicate that the p-value (0.0021*) is less than
0.05. The results show that there is a statistically significant difference between race
groups at a 95% level of confidence (Wiid & Diggines, 2015:284). Therefore, the following
hypothesis was supported:
o H5c: There are differences between races with regard to the influence of
behavioural attributes of sales associates on consumers’ shopping experience in
FMCG retail stores in Ekurhuleni.
Table 5.59: ANOVA F-test on race with regard to behavioural attributes of sales
associates
Source DF Sum of squares Mean square F- ratio Prob > F
Q9 Racial group 3 4.35554 1.45185 4.9741 0.0021*
Error 396 115.58446 0.29188
Total 399 119.94000
*Significant difference
Knowledge of how crowding, social relations, sales associates’ availability, physical
attributes and behavioural attributes of sales associates influences consumers’ shopping

129
experience as well as demographic differences is important to the FMCG retailers as it
could help them to develop appropriate and effective marketing strategies.
Discussion of the results, integration of the research objectives and hypotheses are
presented in the next section.
5.7 INTEGRATION OF RESEARCH OBJECTIVES, HYPOTHESES AND
DISCUSSION OF RESULTS
The secondary research objectives of the study are addressed below and the results are
discussed with regard to each objective in relation to the hypotheses. The five-point Likert
scale results for disagreement (“disagree and strongly disagree”) and agreement (“agree
and strongly agree”) were combined to make the reporting of the results clear in this
section (see Tables 5.15 to 5.19 in this Chapter 5). The hypotheses are linked to the
objectives of the study.
5.7.1 Secondary objective 1: To determine the influence of crowding on
consumers’ shopping experience in FMCG retail stores in Ekurhuleni
This study found that the reactions of most respondents towards crowding were neutral
with a total mean score of 3.02 as depicted in Table 5.14 in this chapter. It is clear that
consumers who participated in the study did not seem to be concerned about crowding.
The results further indicated that crowding in the FMCG retail stores in Ekurhuleni did not
have an influence on consumers’ shopping experience. This was indicated by consumers’
responses to the two opposing statements used to measure crowding as they did not
bother to comment on whether “they prefer to shop in the crowded FMCG retail stores”
or “whether they tried to avoid shopping in crowded FMCG retail stores” (see Table 5.15
in this chapter).
The results of the chi-square indicated that there were statistically different proportions of
respondents with regard to the influence of crowding on their shopping experience in
130
FMCG retail stores as shown in Table 5.21. Therefore, the findings supported the
following hypothesis:
o H1: Crowding influences consumers’ shopping experience in FMCG retail stores
in Ekurhuleni.
The results of the ANOVA and F-test to determine if there are significant differences
between demographics with regard to crowding indicated that there is a statistically
significant difference that exist between genders (see Table 5.31). Therefore, it is that this
hypothesis was supported:
o H1a: There are differences between genders with regard to the influence of
crowding on consumers’ shopping experience in FMCG retail stores in
Ekurhuleni.
Furthermore, the results of the ANOVA, F-test revealed that there were no statistically
significant differences between age groups and between races regarding the influence of
crowding on consumers’ shopping experience in FMCG retail stores (see Table 5.33 and
5.35). Therefore, these findings did not support the following hypotheses:
o H1b: There are differences between age groups with regard to the influence of
crowding on consumers’ shopping experience in FMCG retail stores in
Ekurhuleni.
o H1c: There are differences between races with regard to the influence of crowding
on consumers’ shopping experience in FMCG retail stores in Ekurhuleni.
5.7.2 Secondary objective 2: To determine the influence of social relations on
consumers’ shopping experience in FMCG retail stores in Ekurhuleni
The influence of social relations on consumers’ shopping experience in FMCG retail
stores in Ekurhuleni as depicted in tables 5.14 and 5.16 indicated that most respondents
felt strongly about the influence of social relations on their shopping experience.

131
Based on the results shown in Table 5.16, 72.25% of respondents” like to make new
friends when they are shopping in the FMCG retail stores”, and 66% “often prefer to have
fun with other customers shopping next to them”. Most respondents (73.2%) like to talk
to customers who have goals that are similar to theirs. It could therefore be concluded
that consumers tend to agree that social relations influences their shopping experience
in FMCG retail stores in Ekurhuleni. In addition, the findings of this study regarding social
relations indicated that many respondents consider the interaction with other customers
as an opportunity to satisfy their social needs. Therefore, it is important for the FMCG
retailers to create a pleasant shopping experience that would enable social relations
among customers.
The chi-square test results confirmed that the proportions of consumers were different
regarding the influence that social relations have on their shopping experience in FMCG
retail stores (see Table 5.23). The results supported this hypothesis:
o H2: Social relations influence consumers’ shopping experience in FMCG retail
stores in Ekurhuleni.
In determining if there were differences between demographics, namely gender, age and
race with regard to the influence of social relations, the ANOVA F-test results further
indicated that statistically significant differences exist between age groups (see Table
5.39). Therefore, the following hypothesis was supported:
o H2b: There are differences between age groups with regard to the influence of
social relations on consumers’ shopping experience in FMCG retail stores in
Ekurhuleni.
The ANOVA F-test results show that there were no statistically significant differences
between genders and between races regarding the influence of social relations (see
Table 5.37 and 5.41). Based on these results, the hypotheses below were not supported:
o H2a: There are differences between genders with regard to the influence of social
relations on consumers’ shopping experience in FMCG retail stores in Ekurhuleni.

132
o H2c: There are differences between races with regard to the influence of social
relations on consumers’ shopping experience in FMCG retail stores in Ekurhuleni.
5.7.3 Secondary objective 3: To determine the influence of sales associates’
availability on consumers’ shopping experience in FMCG retail stores in
Ekurhuleni.
From the results in Table 5.17, it was indicated that 62.2% of respondents preferred to
shop in the FMCG retail stores that have a sufficient number of sales associates who are
available and willing to assist them. Most respondents (55.2%) also emphasised the
influence of sales associates’ availability by agreeing that they like sales associates who
welcome customers when they enter the FMCG retail stores with a friendly smile. Based
on these results, it could be concluded that sales associates’ availability influences
consumers’ shopping experience in FMCG retail stores in Ekurhuleni.
As indicated in Table 5.25, the chi-square results indicated that respondents’ proportions
were statistically different regarding the influence that sales associates’ availability has
on their shopping experience in FMCG retail stores in Ekurhuleni. Therefore, the findings
supported this hypothesis:
o H3: Sales associates’ availability influence consumers’ shopping experience in
FMCG retail stores in Ekurhuleni.
It was indicated in Table 5.43, 5.45 and 5.47 that there were no statistically significant
differences between gender, age and race regarding sales associates’ availability.
Therefore, the following hypotheses were not supported:
o H3a: There are differences between genders with regard to the influence of sales
associates’ availability on consumers’ shopping experience in FMCG retail stores
in Ekurhuleni.
o H3b: There are differences between age groups with regard to the influence of
sales associates’ availability on consumers’ shopping experience in FMCG retail
stores in Ekurhuleni.
133
o H3c: There are differences between races with regard to the influence of sales
associates’ availability on consumers’ shopping experience in FMCG retail stores
in Ekurhuleni.
5.7.4 Secondary objective 4: To determine the influence of physical attributes of
sales associates on consumers’ shopping experience in FMCG retail stores
in Ekurhuleni.
Most respondents (58%) indicated that they like to do their shopping in the FMCG retail
stores that have well-dressed and presentable sales associates. Nearly two-thirds
(65.2%) further indicated that they preferred to shop in the stores that have sales
associates who wear neat uniforms that represent the FMCG retail store’s brand very well
(see Table 5.18). These findings clearly confirmed that sales associates’ availability
influences consumers’ shopping experience in FMCG retail stores in Ekurhuleni.
The results of the chi-square in Table 5.27 revealed that the proportions of consumers
were statistically different regarding the influence of physical attributes of sales associates
on their shopping experience in FMCG retail stores. In this case, the results supported
the hypothesis below:
o H4: Physical attributes of sales associates influence consumers’ shopping
experience in FMCG retail stores in Ekurhuleni.
The ANOVA F-test results indicated that there were no statistically significant differences
between genders, age groups and races with regard to physical attributes of sales
associates in FMCG retail stores in Ekurhuleni (see Table 5.49, 5.51 and 5.53). The
findings did not support the following hypotheses:
o H3a: There are differences between genders with regard to the influence of
physical attributes of sales associates on consumers’ shopping experience in
FMCG retail stores in Ekurhuleni.
134
o H3b: There are differences between age groups with regard to the influence of
physical attributes of sales associates on consumers’ shopping experience in
FMCG retail stores in Ekurhuleni.
o H3c: There are differences between races with regard to the influence of physical
attributes of sales associates on consumers’ shopping experience in FMCG retail
stores in Ekurhuleni.
5.7.5 Secondary objective 5: To determine the influence of behavioural attributes
of sales associates on consumers’ shopping experience in FMCG retail
stores in Ekurhuleni
The results in Table 5.19 indicate that 93% of respondents likes sales associates that are
friendly and patient, while 91% preferred to shop at the FMCG retail stores that have got
sales associates who can understand customers’ needs. It was also indicated that 83%
of respondents believed that the FMCG retail stores’ sales associates that are honest and
professional can be trusted. Furthermore, 79% agreed that professionally appearing sales
associates create a pleasant atmosphere in the FMCG retail stores in Ekurhuleni. These
results clearly show that behavioural attributes of sales associates have a huge influence
on consumers’ shopping experience in FMCG retail stores in Ekurhuleni.
The chi-square results indicated that there were statistically differences in the proportions
of respondents with regard to the influence of behavioural attributes of sales associates
on their shopping experience as shown in Table 5.29. Therefore, the following hypothesis
was supported:
o H5: Behavioural attributes of sales associates influence consumers’ shopping
experience in FMCG retail stores in Ekurhuleni.
Furthermore, the ANOVA, F-test results indicated that the statistically significant
differences regarding behavioural attributes of sales associates only existed between
racial groups (see Table 5.59). Therefore, this hypothesis was supported:

135
o H5c: There are differences between races with regard to the influence of
behavioural attributes of sales associates on consumers’ shopping experience in
FMCG retail stores in Ekurhuleni.
The results also showed that there were no statistically significant differences between
genders and between age groups with regard to the influence of behavioural attributes of
sales associates on consumers’ shopping experience in FMCG retail stores in Ekurhuleni
as presented in Table 5.55 and 5.57. Therefore, the following hypotheses were not
supported:
o H5a: There are differences between genders with regard to the influence of
behavioural attributes of sales associates on consumers’ shopping experience in
FMCG retail stores in Ekurhuleni.
o H5b: There are differences between age groups with regard to the influence of
behavioural attributes of sales associates on consumers’ shopping experience in
FMCG retail stores in Ekurhuleni.
5.7.6 Secondary objective 6: To determine the influence of demographic
variables on consumers’ shopping experience in FMCG retail stores in
Ekurhuleni
The results indicated that for other customers, statistically significant difference exists
with regard to crowding between genders (p-0.0111*) as shown in Table 5.31. However,
there were no differences between age groups and between races regarding the influence
of crowding on consumers’ shopping experience (see Table 5.33 and 5.35). Furthermore,
there was a statistically significant difference between age groups regarding the influence
of social relations on consumers’ shopping experience in FMCG retail stores in Ekurhuleni
with 0.0312* p-value as indicated in Table 5.39. The results further indicated that there
were no statistically significant differences between gender and between races with
regard to social relations (see Table 5.37 and 5.41).

136
On the other hand, for sales associates, the results in Table 5.59 indicated that statistically
significant difference only exist between race groups regarding the influence of
behavioural attributes on consumers’ shopping experience with 0.0021* p-value. While
there were no statistically significant differences between genders and between age
groups with regard to behavioural attributes of sales associates (see Table 5.55 and
5.57). The results further indicated that there were no statistically significant differences
between the demographic variables, namely gender, age and race with regard to the
influence of sales associates’ availability on consumers’ shopping experience as shown
in Table 5.43, 5.45 and 5.47. The results also revealed that there were no statistically
significant differences between gender, between age groups and between races
regarding the influence of physical attributes of sales associates on consumers’ shopping
experience in FMCG retail stores in Ekurhuleni (see Table 5.49, 5.51 and 5.53).
In conclusion, based on the findings presented above, the objectives of this study were
achieved because they were all measured successfully. Furthermore, all the hypotheses
were successfully tested to determine if the proportions of respondents/consumers were
statistically different with regard to the influence of crowding, social relations, sales
associates’ availability, physical attributes of sales associates, and behavioural attributes
of sales associates on their shopping experience in FMCG retail stores in Ekurhuleni. In
addition, the statistically significant differences between demographics, namely gender,
age and race with regard to the influence of these sub-variables were also determined.
5.8 SUMMARY
This chapter presented the findings and interpretations of the results of this study. The
demographic profiles of respondents were provided. An exploratory factor analysis was
conducted to determine if individual questions loaded onto, or contributed to the
constructs as intended in the questionnaire. The extraction method used was principal
axis factoring with the KMO measure of sampling adequacy and Barttlet’s test of
Sphericity. These were used to test the validity of the study. To test the reliability of the
Likert scales, Cronbach’s alpha was used. An SPSS version 24 was used to analyse the
data obtained by means of frequency counts and mean scores. The mean ranking

137
differences were analysed with one-way ANOVA, while ANOVA with F-tests were used
to test the significant differences between demographics (gender, age and race) with
regard to the influence of the sub-variables of other customers and sales associates on
consumers’ shopping experience in FMCG retail stores in Ekurhuleni. A chi-square for
equal proportion was utilised to test H1, H2, H3, H4, and H5 respectively. The results
indicated that the proportions of consumers were statistically different regarding the
influence that crowding, social relations, sales associates’ availability, physical attributes,
and behavioural attributes of sales associates have on their shopping experience. Then,
the findings supported these hypotheses.
Three hypotheses pertaining to demographic variables, namely, gender, age and race
were tested for each of the five sub-variables, which are crowding, social relations, sales
associates’ availability, physical attributes and behavioural attributes of sales associates.
The ANOVA, F-test results for other customers indicated that on crowding, they
supported H1a as there was a statistically significant difference between genders. H1b and
H1c were not supported because there were no statistically significant differences. For
social relations, the results indicated that there was a statistically significant difference
between age groups while there were no statistically significant differences pertaining to
gender and race. Therefore, H2b was supported, but H2a and H2c were not supported. The
hypotheses test results for sales associates indicated that there was a statistically
significant difference between races regarding behavioural attributes, which supported
H5c. However, there were no statistically significant differences for gender and age.
Therefore, H5a and H5b were not supported. Furthermore, the hypotheses test results
revealed that there were no statistically significant differences pertaining to gender, age
and race with regard to physical attributes of sales associates and sales associates’
availability. Based on these results, H3a, H3b, H3c, H4a, H4b, and H4c were not supported
with regard to both sales associates’ availability and physical attributes of sales
associates.
The composite scores as depicted in Table 5.14 indicated that crowding did not seem to
influence consumers’ shopping experience as they remain neutral with a total mean score
of 3.02, while they agreed with the influence of social relations with a total mean score of

138
3.92. The results further indicated that consumers agreed that sales associates’
availability (M=3.57), physical attributes (M=3.71) and behavioural attributes of sales
associates (M=4.30) have an influence on their shopping experience.
Conclusions and recommendations are presented in the next chapter.

139
CHAPTER 6
CONCLUSIONS AND RECOMMENDATIONS
6.1 INTRODUCTION
The purpose of this study was to investigate the influence of human variables on
consumers’ shopping experience in FMCG retail stores in Ekurhuleni. This chapter
provides an overview of the research findings of this study. As the research results were
presented in Chapter 5, then the conclusions drawn from the findings and
recommendations were made in this chapter. This chapter also provides the contribution
of the study to the FMCG retail industry in Ekurhuleni, followed by an assessment of the
limitations of the study and concluded with suggestions for future research.
6.2 THE PURPOSE AND IMPORTANCE OF THE STUDY
This study revealed that other customers and sales associates have an influence on
consumers’ shopping experience in FMCG retail store environment. The results
emphasised this by indicating that for other customers, social relations is the only
influential sub-variable, as opposed to crowding that did not seem to influence consumers’
shopping experience in FMCG retail stores. In case of sales associates, all the sub-
variables were shown to have an influence on consumers’ shopping experience as
behavioural attributes is the most influential followed by physical attributes and sales
associates’ availability.
6.2.1 The main purpose of the study
This study sought to investigate the influence of human variables on consumers’ shopping
experience in the FMCG retail stores. As this study expanded on Kim and Kim’s (2012)
review study, the sub-variables were empirically tested in a South African context.
The study will also provide FMCG retailers in Ekurhuleni with a better understanding of
how human variables influence consumers’ shopping experience. In addition, this study

140
will benefit FMCG retailers in Ekurhuleni as it will provide insight into the value that human
variables could add in creating a pleasant shopping experience. The knowledge that
FMCG retailers will gain from this study could help them in differentiating their stores from
competitors.
6.2.2 The importance of the study
The importance of this study lies on its theoretical, practical and empirical contribution.
Theoretically, the study contributes to the existing literature by examining the influence
that other customers and sales associates have on consumers’ shopping experience.
From practical perspective, the study provides guidelines to FMCG retailers on how to
use human variables in creating a pleasant shopping experience (see section 6.4 and
6.5). This study was conducted empirically by investigating the influence of other
customers and sales associates on consumers’ shopping experience in a South African
context. A further importance of the empirical investigation of this study is that the findings
might help FMCG retailers to develop effective marketing strategies as they provide
consumers’ perceptions on the influence of human variables as well as their demographic
differences.
6.3 DISCUSSIONS
The research findings as discussed in Chapter 5 assessed the demographic profile of
respondents and the respondents’ perceptions on the influence of human variables (other
customers and sales associates) in the FMCG retail stores. The majority of respondents
who participated in this study were males (56%, n=224). The largest group of respondents
were between the ages of 24 and 35 years (34%, n=135). More respondents indicated
that they earned between R5 000 and R10 000 (32%, n=129) per month. The results
further indicated that 25% (n=100) of respondents possessed an undergraduate degree.
The findings of the study as presented in Chapter 5, Table 5.14, revealed that behavioural
attributes is the most influential sub-human variable with a total mean score of 4.30. The
results simply indicated that behavioural attributes of sales associates have an influence
on consumers’ shopping experience in FMCG retail stores in Ekurhuleni. The influence
141
of behavioural attributes of sales associates indicate that the results are consistent with
findings of Darian et al (2001:210), who found that sales associates’ respect for
customers, knowledge and responsiveness are the most important attributes that
influence customers to patronise a retailer. Menon and Dube (200:285) also confirmed
that sales associates’ positive responses to customers led to greater satisfaction.
The results further indicated that social relations is the second most influential sub-human
variable on consumers’ shopping experience in FMCG retail stores in Ekurhuleni with a
total mean score of (M=3.92). In addition, Brack and Benkenstein’s (2011:501) findings
showed that consumer’s similarity with other customers has a positive effect in relation to
attitudes towards the service in the retail store. However, Soderlund’s (2011:178) study
found that other customers who are strangers and present in the same retail environment
with the individual customer have an impact on his/her overall evaluation of the retailer.
Physical attributes of sales associates influences consumers’ shopping experience in
FMCG retail stores with 3.71 total mean score. These results are in line with the previous
studies. Soderlund and Julander 2009:216) found that high levels of sales associates’
physical attractiveness produced high levels of customers’ satisfaction. Furthermore, Tsai
and Huang (2004:1006) found that sales associates’ positive behaviour such as greeting,
smiling and establishing eye contact increase customers’ willingness to return and
recommend the store to others.
The results also indicated that sales associates’ availability influences consumers’
shopping experience in FMCG retail stores in Ekurhuleni with a total mean score of 3.57.
These results are in line with the findings of Baker et al. (1992:458) and Sharma and
Stafford (2000) as they found that sales associates’ availability has an influence on
consumers’ evaluations of the stores and also interacts with store ambient factors.
However, most respondents felt neutral regarding the influence of crowding on their
shopping experience with a total mean score of 3.02. This could mean that crowding in
the FMCG retail stores in Ekurhuleni does not bother consumers. The results pertaining
to crowding are in line with Machleit et al. (2000:40) who find that a crowded store may

142
or may not result in decreased satisfaction, depending on the number of individuals and
situational factors. Furthermore, these results indicate that although emotions partially
mediate the crowding satisfaction relationship, the decrease in shopping satisfaction
owing to crowding is mediated by expectations and tolerance of crowding (Machleit et al.,
2000:40). The influence of crowding on consumers’ shopping experience in this study can
also be supported by the findings of Van Rompay et al. (2012:1130) in that some
shoppers like crowded retail stores since it affords them the opportunity to impress and
to draw comparisons. However, some consumers perceive a crowded store environment
as a burden or constraint (Van Rompay et al., 2012:1130). In addition, Hwang’s et al.
(2012:241) findings showed that crowding induced both negative and positive emotions
of consumers. Therefore, these previous studies support neutrality.
A summary of the tested hypotheses is presented in Table 6.1 in the next section.
Table 6.1: The results of the hypotheses tested in the study
Wording of alternative hypotheses P-
value Summary of the results
Crowding
H1: Crowding influence consumers’ shopping experience in FMCG retail stores in Ekurhuleni.
0.0054*
H1, alternative hypothesis supported
H1a: There are differences between gender groups with regard to the influence of crowding on consumers’ shopping experience in FMCG retail stores in
Ekurhuleni.
0.0111*
H1a, alternative hypothesis supported
H1b: There are differences between age groups with regard to the influence of crowding on consumers’ shopping experience in FMCG retail stores in Ekurhuleni.
0.5745
H1b, alternative hypothesis not supported.
H1c: There are differences between races with regard to the influence of crowding on consumers’ shopping experience in FMCG retail stores in Ekurhuleni.
0.5440
H1c, alternative hypothesis not supported.
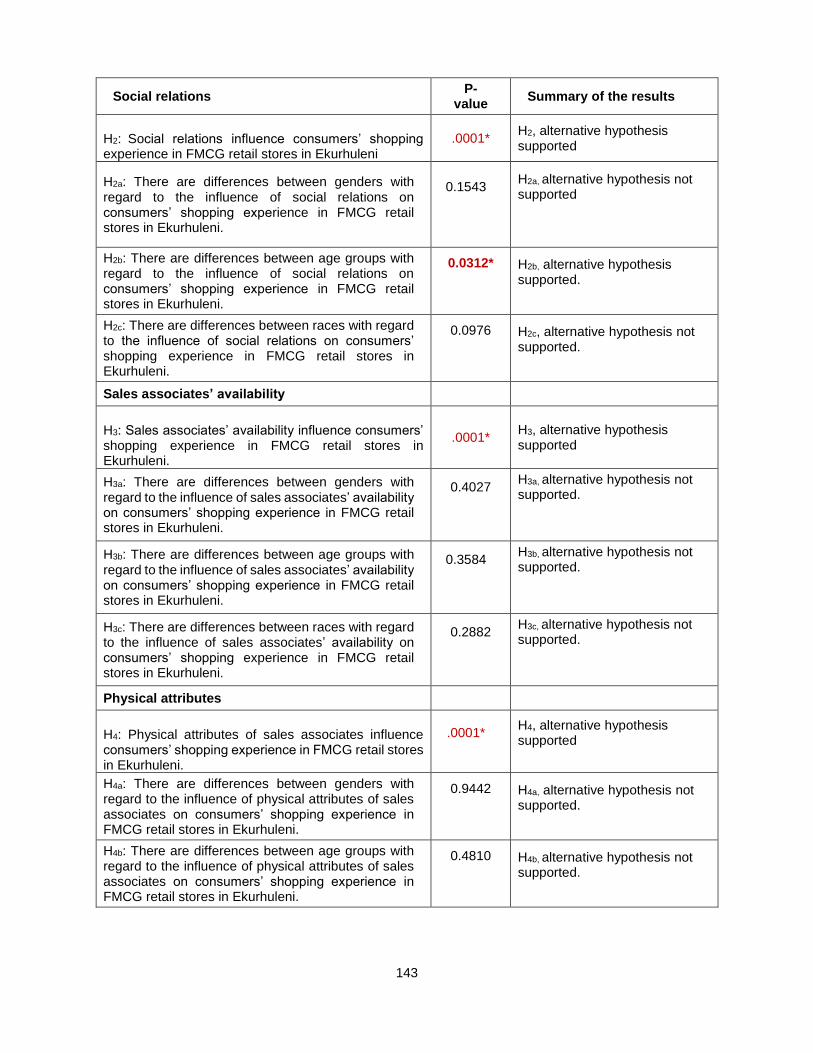
143
Social relations P-
value Summary of the results
H2: Social relations influence consumers’ shopping experience in FMCG retail stores in Ekurhuleni
.0001* H2, alternative hypothesis supported
H2a: There are differences between genders with regard to the influence of social relations on consumers’ shopping experience in FMCG retail stores in Ekurhuleni.
0.1543
H2a, alternative hypothesis not supported
H2b: There are differences between age groups with regard to the influence of social relations on consumers’ shopping experience in FMCG retail stores in Ekurhuleni.
0.0312*
H2b, alternative hypothesis supported.
H2c: There are differences between races with regard to the influence of social relations on consumers’ shopping experience in FMCG retail stores in Ekurhuleni.
0.0976
H2c, alternative hypothesis not supported.
Sales associates’ availability
H3: Sales associates’ availability influence consumers’ shopping experience in FMCG retail stores in Ekurhuleni.
.0001* H3, alternative hypothesis supported
H3a: There are differences between genders with regard to the influence of sales associates’ availability on consumers’ shopping experience in FMCG retail stores in Ekurhuleni.
0.4027
H3a, alternative hypothesis not supported.
H3b: There are differences between age groups with regard to the influence of sales associates’ availability on consumers’ shopping experience in FMCG retail stores in Ekurhuleni.
0.3584
H3b, alternative hypothesis not supported.
H3c: There are differences between races with regard to the influence of sales associates’ availability on consumers’ shopping experience in FMCG retail stores in Ekurhuleni.
0.2882
H3c, alternative hypothesis not supported.
Physical attributes
H4: Physical attributes of sales associates influence consumers’ shopping experience in FMCG retail stores in Ekurhuleni.
.0001*
H4, alternative hypothesis supported
H4a: There are differences between genders with regard to the influence of physical attributes of sales associates on consumers’ shopping experience in FMCG retail stores in Ekurhuleni.
0.9442
H4a, alternative hypothesis not supported.
H4b: There are differences between age groups with regard to the influence of physical attributes of sales associates on consumers’ shopping experience in FMCG retail stores in Ekurhuleni.
0.4810
H4b, alternative hypothesis not supported.

144
H4c: There are differences between races with regard to the influence of physical attributes of sales associates on consumers’ shopping experience in FMCG retail stores in Ekurhuleni.
0.5704
H4c, alternative hypothesis not supported.
Behavioural attributes P-
value Summary of the results
H5: Behavioural attributes of sales associates influence consumers’ shopping experience in FMCG retail stores in Ekurhuleni.
.0001*
H5, alternative hypothesis supported
H5a: There are differences between genders with regard to influence of behavioural attributes of sales associates on consumers’ shopping experience in FMCG retail stores in Ekurhuleni.
0.5721
H5a, alternative hypothesis not supported.
H5b: There are differences between age groups with regard to the influence of behavioural attributes of sales associates on consumers’ shopping experience in FMCG retail stores in Ekurhuleni.
0.2269
H5b, alternative hypothesis not supported.
H5c: There are differences between races with regard to the influence of behavioural attributes of sales associates on consumers’ shopping experience in FMCG retail stores in Ekurhuleni.
0.0021*
H5c, alternative hypothesis supported.
*Significant difference
Table 6.1 illustrates the hypotheses and results as presented in Chapter 5. These
hypotheses are linked to the objectives of the study. For other customers, the chi-
square results indicated that H1 and H2 were supported as consumers’ proportions were
statistically different regarding the influence that crowding and social relations have on
their shopping experience.
In determining the differences between demographics, H1a for crowding was supported
because there is a statistically significant difference between genders. However, there
were no statistically significant differences between age groups and between races.
Therefore, H1b and H1c were not supported. The existing difference between genders in
the results of this study regarding the influence of crowding is consistent with Yildirim and
Akalin-Baskaya’s (2007) study. The difference between male and female consumers was
found to be statistically significant because male customers had more positive
perceptions of densities than female customers (Yildirim & Akalin-Baskaya, 2007:3415).
Baker and Wakefield’s (2012) findings revealed that there were significant differences
145
between male and female consumers as well as different age groups on how shopping
orientations influence their perception of crowding. However, the results of this study only
differ with Baker and Wakefield (2012) because of age differences.
Regarding social relations, H2b was supported because there was a statistically
significant difference between age groups, while H2a and H2c were not supported owing
to the fact that there were no statistically significant differences between genders and
between races. However, the results of this study were not expected to differ with these
previous studies. Soderlund (2011:178) revealed that female participants had a more
positive attitude towards the store than male participants as they interact with other
customers. Furthermore, Jubas (2011) found that there were differences between
consumers’ race, gender and social class regarding their shopping identity.
On the other hand, the chi-square test results for sales associates revealed that
consumers’ proportions were statistically different regarding the influence of sales
associates’ availability, physical attributes of sales associates and behavioural attributes
of sales associates. It was further indicated that H3, H4 and H5 were supported as shown
in Table 6.1.
The ANOVA F-test results for determining if there are differences between demographics
indicated that there were no statistically significant differences between gender, age and
race with regard to sales associates’ availability. It is therefore that H3a, H3b and H3c
were not supported. This results are consistent with Osman’s et al. (2014:190) findings,
which indicated that there was no significant difference between consumers’ age groups
regarding the influence of sales associates on in-store behaviour. However, the results
differ with the findings of the study by Lieven (2016), which explored customers’ choice
of salespersons during the initial sales encounter which found that there was a significant
difference between male and female respondents’ preferences in terms of sales
associates and the service provided.
The hypotheses test results also indicated that there were no statistically significant
differences in gender, age and race with regard to the influence of physical attributes of

146
sales associates on consumers’ shopping experience in FMCG retail stores in Ekurhuleni.
Therefore, H4a, H4b and H4c were not supported. These results tend to differ with the
expected results based on the previous studies in the literature review. Shao et al.’s
(2004:1173) findings revealed that male and female customers were significantly different
in their cognitive responses to the dress of service contact personnel.
Furthermore, the results in Table 6.1 indicated that H5c was supported for behavioural
attributes as there was a statistically significant difference between race groups. In
addition, there were no statistically significant differences for gender and age, regarding
behavioural attributes, and therefore, H5a and H5b were not supported. These results are
partially in line with the findings of Jones et al. (1998), who found that race and gender
showed significant differences on the impact of buyer seller’s credibility and
trustworthiness. However, these findings were not anticipated as Prendergast, Li and Li
(2014:204) suggested. Their findings indicated that there were significant differences
between male and female consumers regarding sales associates’ credibility in terms of
trustworthiness and attractiveness.
As the results were interpreted, it is important to highlight the contribution that the study
will make in the FMCG retail industry.
6.4 THEORETICAL CONTRIBUTION OF THE STUDY
This study set out to make theoretical contribution to the FMCG retail industry. From a
theoretical perspective, this study contributes towards the body of knowledge and
literature of FMCG retail environment by investigating human variables, namely other
customers and sales associates in FMCG retail stores in Ekurhuleni. Furthermore, this
study determined consumers’ perceptions on the influence of other customers with regard
to crowding and social relations, as well as sales associates with regard to sales
associates’ availability, physical attributes of sales associates and behavioural attributes
of sales associates in FMCG retail stores in Ekurhuleni.

147
6.5 PRACTICAL CONTRIBUTION OF THE STUDY
From a practical perspective, this study also provides significant insights and guidelines
for retailers to create a pleasant shopping experience for consumers. The results of this
study have practical relevance for FMCG retail management. Sales associates’ positive
attributes create a pleasant atmosphere in the store that enhances consumers’ shopping
experience. Therefore, staff training should focus on improving individual sales
associates’ ability to understand customers’ needs, to equip them with knowledge about
products sold in the FMCG retail stores, to dress in a presentable way and to be
approachable.
The presence of other customers which may result in crowding in the FMCG retail stores
can affect consumers’ satisfaction. Therefore, management should manage crowding
and social interactions among customers to enhance their overall shopping experience.
Furthermore, this study contributes to the FMCG retail industry by providing
recommendations on how human variables can be used to create a pleasant shopping
experience.
6.6 LIMITATIONS
The results that were obtained for this study were limited to the targeted Ekurhuleni
region. Therefore, the study cannot be generalised to the entire South African population.
Owing to the fact that non-probability sampling and convenience sampling methods were
used, the main aim was not to be representative, but to make findings available for
academic purposes and to provide knowledge to the management of the FMCG retail
stores in Ekurhuleni.
Another limitation is that this study did not cover human variables in other sectors such
as online retail market, apparel retail market, furniture, and hardware markets. In addition,
this study covered human variables from customers’ perspective only not retailers’
perspective. There was also a limitation of the research instrument as a scale must have

148
at least five items measuring a construct or variable. Hence after exploratory factor
analysis, some sub-variables were measured with only two items.
The recommendations based on the conclusions drawn from the findings are presented
in the next section.
6.7 RECOMMENDATIONS
Recommendations are made based on the findings presented in Chapter 5 and the
conclusions drawn above. These recommendations are as follows:
Although respondents seemed to be neutral with regard to crowding in the FMCG
retail stores in Ekurhuleni, retailers need to consider managing crowding as
consumers in a crowded store may spend less money than they planned, or even
leave the store without making purchases (Yildirim & Baskaya, 2007:3411). It is
therefore recommended that FMCG retail store managers should introduce
activities that can keep waiting customers busy/entertained in order to avoid
dissatisfaction caused by a crowded environment. Furthermore, sales associates
should be trained on how to manage crowding professionally in the FMCG retail
stores.
Respondents emphasised that they preferred to make new friends, to have fun
with other customers and to talk to other customers who have goals that are
similar to theirs. Therefore, it is recommended that FMCG retailers should
combine human variables with other atmospheric elements to create a pleasant
shopping experience that will make customers feel comfortable and spend more
time shopping and interacting in the stores. A further recommendation is to
broaden the store layout in order to create space for movement.
Because the results have indicated that respondents agreed with their preference
for the availability of sales associates, consumers are likely to spend their money
at the FMCG retail stores that have sales associates who are always available
and willing to assist. Therefore, it is highly recommended that FMCG retailers
149
should ensure that sales associates are always available in all departments in the
store and greet customers as an indication of welcoming and appreciating them.
This could create a pleasant shopping experience as consumers will not struggle
when they need assistance.
Respondents highlighted that they were able to recognise the influence of sales
associates’ physical attributes on their shopping experience in the FMCG retail
stores. The recommendation to FMCG retailers is that they should put greater
emphasis on encouraging sales associates to dress professionally and
presentably, as well as ensuring that they understand that the uniform represents
the retail store’s brand.
The findings indicated that sales associates’ friendliness and patience play an
important role in enhancing consumers’ shopping experience in the FMCG retail
stores. It is highly recommended that FMCG retailers should consider motivating
their sales associates to be professional by being friendly and patient to
customers in the stores.
Respondents indicated that the FMCG retail stores that have sales associates
who understand customers’ needs are preferred by customers. A further
recommendation to FMCG retailers is to ensure that their sales associates are
equipped with knowledge of their target markets and products sold to be able to
understand their customers’ needs in order to create a pleasant shopping
experience. This could be achieved by means of staff training.
6.8 SUGGESTIONS FOR FUTURE RESEARCH
Owing to the fact that the results of this study cannot be generalised to the entire
South African population, since non-probability sampling was used, future
research should use probability sampling.
This study focused on the FMCG retail industry only. Future research could focus
on investigating these human variables on other retail sectors such as online
retail, furniture retail and hardware retail.
150
Since human variables were investigated from customers’ perspective, future
research could also conduct studies on human variables from retailers’
perspective or both in one study.
This study used quantitative research with structured questions. Future studies
could use a mixed-method approach to include qualitative approach, which could
include open-ended questions as well.
This study covered human variables in detail. Therefore, future research should
attempt to investigate the interaction between human variables and other
atmospherics variables such as ambient and design.
6.9 SUMMARY
This chapter discussed the conclusions of the study drawn from the findings to address
the objectives and indicate how they were achieved. Recommendations were also made,
followed by a discussion of the theoretical and practical contribution of the study to the
FMCG retail industry in Ekurhuleni. Suggestions for future research were made and
limitations of the study were identified.
The findings indicated that consumers who participated in the study agreed that other
customers influence their shopping experience with regard to social relations. However,
they did not seem to be bothered by crowding. Furthermore, there was a statistically
significant differences between genders regarding crowding and between age groups with
regard to social relations. Respondents also highlighted the influence that sales
associates have on their shopping experience with regard to sales associates’ availability,
as well as their physical attributes and behavioural attributes by agreeing with the
statements used in the questionnaire. The findings of the study further established that
the statistically significant differences for sales associates existed only between race
groups with regard to behavioural attributes.

151
REFERENCES
Aaker, D. A., Kumar, V., Leon, R. P. & Day, G.S. 2013. Marketing research. 11th ed.
Singapore: John Wiley & Sons.
Abbes, M. & Goudey, A. 2015. How salespersons induce trust between consumers and
retailers. International Journal of Retail and Distribution Management,
43(12):1104-1125.
Abed, M., G. & Haghighi, M. 2009. The effect of selling strategies on sales performance.
Business Strategy Series, 10(5):266-284. [Online] Available from:
http://dx.doi.org/10.1108/17515630910989169. [Accessed: 01-08-2015].
Argo, J.J., Dahl, D.W. & Manchanda, R.V. 2005. The influence of mere social presence
in a retail context. Journal of Consumer Research, 32:207-212.
Backstrom, K. 2011. Shopping as a leisure: An exploration of manifoldness and dynamics
in consumers’ shopping experiences. Journal of Retailing and Consumer
Services, 18:200-209.
Bagdare, S. & Jain, R. 2013. Measuring retail customer experience. International Journal
of Retail and Distribution Management, 41(10):790-804.
Bailey, N. & Areni, C.S. 2006. When a few minutes sound like lifetime: Does atmospherics
expand or contract perceived time? Journal of Retailing, 82(3):189-202.
Baker, J. 1986. The role of the environment in marketing services: the consumer
perspective. The services challenge: integrating for competitive advantage.
American Marketing Association, 79-84.
Baker, J., Grewal, D. & Levy, M. 1992. An experimental approach to making retail store
environmental decisions. Journal of Retailing, 68:445-460.
Baker, J., Grewal, D. & Parasuraman, A. 1994. The influence of store environment on
quality inferences and store image. Journal of the Academy of Marketing Service,
22(4):328-339.

152
Baker, J., Parasuraman, A., Grewal, D. & Voss, G.B. 2002. The influence of multiple store
environment cues on perceived merchandise value and patronage intentions.
Journal of Marketing, 66:120-141.
Baker, J. & Wakefield, K.L. 2012. How shopping orientation influenced perceived
crowding, excitement and stress in the mall. Journal of the Academy of Marketing
Science 40:791–806. [Online] Available from: DOI 10.1007/11747-011-0284.
[Accessed: 15-10-2017].
Bartlett, J., Kotrlik, J. & Higgins, C. 2001. Organisational research: determining
appropriate sample size in survey research. Technology, Learning and
Performance Journal, 19(1):45-50.
Bazin, Y. & Aubert-Tarby, C. 2013. Dressing professional, an aesthetic experience of
profession. Society and Business Review, 8(3):251-268.
Beatty, S.E., Mayer, M., Coleman, J.E., Reynolds, K.E. & Lee, J. 1996. Customer-sales
associate retail relationships. Journal of Retailing, 72(3):223-247.
Berman, B. & Evans, J.R. 2013. Retailing management: a strategic approach. 12th ed.
Upper Saddle River, N.J.: Prentice Hall.
Bitner, M.J. 1992. Servicescapes: The impact of physical surroundings on customers and
employees. Journal of Marketing, 56(4):57-71.
Blythe, J. 2013. Consumer behaviour. 2nd ed. London: Sage Publications.
Bone, P.F. & Ellen, P.S. 1999. Scents in the market place: Exploring a fraction of olfaction.
Journal of Retailing, 75:243-262.
Borges, A., Chebat, J.C. & Babin B.J. 2010. Does a companion always enhance the
shopping experience? Journal of Retail and Consumer Services, 17:294-299.
Brack, A.D. & Benkenstein. M., 2012. The effects of overall similarity regarding the
customer to customer relationship in a service context. Journal of Retailing and

153
Consumer Services.19:501509. [Online] Available from:
http://dx.doi/10.1016/j.jretconser.2012.06.006 [Accessed: 19-4-2015].
Bradley, N. 2013. Marketing research: Tools and techniques. 3rd ed. Oxford: Oxford
University Press.
Brocato, E.D., Voorhees, C.M. & Baker, J. 2012. Understanding the influence of cues
from other customers in the service experience: a scale development and
validation. Journal of Retailing, 88(3):384-398. [Online] Available from:
http://doi.10.1016/j.jretai.2012.01.006. [Accessed: 24-2-2015]
Broxendorf, T.O., Muhlmeier, S., Tomczak, T. & Eisend, M. 2010. The impact of sales
encounters on brand loyalty. Journal of Business Research, 63:1148-1155.
Bruce, P. & Bruce, A. 2017. Practical statistics for data scientists. 1st ed. USA: O’Reilly.
Byrne, D. 1971. The attraction paradigm. New York: Academic Press.
Cadwell, C. & Hibbert, S.A. 2002. The influence of music tempo and musical preference
on restaurant patrons’ behaviour. Psychology and Marketing, 19(11):895-917.
Cant, M. C. 2010a. Marketing: An introduction. Cape Town, South Africa: Juta.
Cant, M. C. 2013b. Marketing: An introduction. 2nd ed. Cape Town: Juta.
Cant, M.C. 2010b. The essentials of marketing. 3rd ed. Cape Town: Juta.
Cant, M. 2013a. The essentials of marketing. 4th ed. Cape Town: Juta.
Cant, M. C., Brink, A. & Brijball, S. 2006. Consumer behaviour. Cape Town: Juta.
Cant, M.C., Van Heerden, C.H. & Ngambi, H.C. 2010. Marketing management: A South
African perspective. Cape Town: Juta.
Chebat, J.C. & Michon, R. 2003. Impact of ambient odours on mall shoppers’ emotions
cognition and spending: A test of competition causal theories, Journal of Business
Research, 56:529-539.

154
Choi, S.H., Yang, Y.X., Yang, B. & Cheung, H.H. 2015. Item-Level RFID for enhancement
of customer shopping experience in apparel retail. Computers in industry, 71:10-
23. [Online] Available from: http://dx.doi.org/10.1016/j.compind.2015.03.003.
[Accessed: 08-05-2015].
Churchill, G.A & Brown T.J 2007. Basic marketing research. 6th ed. Ohio: Thomson
South-Western.
Cleff, T. 2014. Exploratory data analysis in business and economics. Switzerland:
Springer International Publishing.
Clow, K.E. & James, K. E. 2014. Essentials of marketing research: Putting research in
practice. Upper Saddle River: Sage Publications.
Cooper, D.R. & Schindler, P.S. 2014. Business research methods. 12 ed. New York:
McGraw-Hill Education.
Darian, J.C., Tucci, L.A. & Wiman, A.R. 2001. Perceived sales person service attributes
and retail patronage intentions. International Journal of Retail and Distribution
Management, 29(5):205-213.
D’Astous, A. 2000. Irritating aspects of the shopping environment. Journal of Business
Research, 49(2):149-156.
DeShields Jr, O.W., Kara, A. & Kaynak, E. 1996. Source effects in purchase decisions:
The impact of physical attractiveness and accent of salesperson. International
Journal of Research in Marketing, 13:89-101.
Dion, D. 2004. Personal control and coping with retail crowding. International Journal of
Service Industry Management, 15 (3): 250-263.
Dorsey, J.D., Ashley, C. & Oliver, J.D. 2016. Triggers and outcomes of customer to
customer aisle rage. Journal Retailing and Consumer Services, 32:67-77.
Drolinger, T & Comer, L., B. 2013. Salesperson’s listening ability as antecedent to
relationship selling. Journal of Business and Industrial Marketing, 28(1):50-59.

155
[Online] Available from: http:// DOI 10.1108/08858621311285714. [Accessed:
02-02-2016].
Dube, L. & Morin, S. 2001. Background music pleasure and store evaluation intensity
effect and psychological mechanisms. Journal of Business Research, 54:107-
113.
Duignan, J. 2014. Quantitative methods for business research. UK: Cengage learning.
El-Adly, M. I. & Eid, R. 2015. Measuring perceived value of malls in a non-western
context: The case of UAE. International Journal of Retail and Distribution
Management, 43(9):849-869.
Eroglu, S.A., & Machleit, K.A. 1990. An empirical study of retail crowding: Antecedents
and consequences. Journal of Retailing, 66 (2): 201-221.
Eroglu, S.A., Machleit, K.A, & Barr, T.F. 2005a. Perceived retail crowding and shopping
Satisfaction: The role of shopping values. Journal of Business Research,
58(8):1146-1153. [Online] Available from: http//www.sciencedirect.com
doi.10.1016j.j/busres 2004.01.005 [Accessed: 2015-02-14].
Eroglu, S.A., Machleit, K. & Chebat, J.C. 2005. The interaction of retail density and music
tempo: effects on shopper responses. Psychology and Marketing, 22(7):577-589.
Fiore, A.M. & Kim, J. 2007. An integrative framework capturing experiential and utilitarian
shopping experience. International Journal of Retail and Distribution
Management, 35(6):421-442.
Gao, Z., Xu J.H. & Kim J. 2013. The effect of racial cues on the reader's response to
advertisements: A US-China comparative study. Asia Pacific Journal of
Marketing and Logistics, 25(3):510-532. [Online] Available from:
https://doi.org/10.1108/APJML-11-2012-0120. [Accessed: 20-11-2017].
Gorsuch, R.L. 1983. Factor analysis. 2nd ed. Hillsdale, NJ: Lawrence Erlbaum
Associates.

156
Gremler, D.D. & Gwinner, K.P. 2000. Customer-employee rapport in-service
relationships. Journal of Service Research, 3:82-104.
Grove, S.J. & Fisk, R.P. 1997. The impact of other customers on service experience: A
critical ambient examination of “getting along”. Journal of Retailing, 3:63-85.
Hair J, Bush R. & Ortinau D. 2006. Marketing research within a changing environment.
3rd ed. New York: McGraw Hill.
Hair, J.F., Bush, R.P. & Ortinau, D.J. 2009. Marketing research in a digital information
environment. 4th ed. New York: Mc Graw-Hill.
Hamrouni, A.D. & Touzi, M. 2011. Technique of collage for store design atmospherics.
An International Journal, 14(3):304-323. [Online] Available from:
http://www.emeraldinsight.com/1352-2752htmDOI.10.1108/1352751111137523
[Accessed: 27-05-2014].
Harrell, G.D., Hutt, M.D. & Anderson, J.C. 1980. Path analysis of buyer behaviour under
conditions of crowding. Journal of Marketing Research, 9(2):132-140.
Hawes, J.M., Rao, F.C.P. & Baker, T.L. 1993. Retail sales person attributes and the role
of dependability in the selection of durable goods. Journal of Personal Selling and
Sales Management, 13(4):61-71.
Hill, C.A. 1987. Affiliation motivation: People who need people, but in different ways.
Journal of Personality and Social Psychology, 52:1008-1018.
Hillestad, R.1980. The underlying structure of appearance. Dress, 5:117-125.
Hoyer, W.D., Maclinnis, D.J. & Pieters, R. 2013. Consumer behaviour. (6th ed.). San
Francisco, CA: South-Western: Cengage learning.
Hu, H. & Jasper, C.R. 2006. Social cues in the store environment and their impact on
store image. International Journal of Retail & Distribution Management, 34(1):25-
48 [Online] Available from: http://dx.doi.org/10.1108/09590550610642800
[Accessed: 18-04-2015].

157
Hur, W, Woo, J. & Kim, Y. 2015. The role of consumer values and socio- demographics
in green products satisfaction. Psychological reports. Employment Psychology
and Marketing, 117 (2): 406-427.
Hwang, J., Yoon, S. & Bendle, L.J. 2012. Desired privacy and the impact of crowding on
customer emotions and approach–avoidance responses. International Journal of
Contemporary Hospitality Management, 24(2):224-250. [Online] Available from:
http//www.emeraldinsight.com/0959-6119.htm [Accessed: 2015-04-05].
Jamal, A. & Adelowore, A. 2008. Customer - employee relationship. European Journal of
Marketing, 42(11/12):1316-1345.
Jones, J. 2013. Trans dressing in a workplace. Equality, Diversity and Inclusion: An
International Journal, 32(5):503-514.
Jones, E., Moore. J.N. & Stanaland, J.S. & Wyatt, R.A.J. 1998. Sales persons’ race,
gender, the access and legitimacy paradigm: Does difference make a difference?
Journal of Personal Selling and Sales Management, 18(4): 71-88.
Joubert, P. 2013. Introduction to consumer behaviour. 2nd ed. Cape Town, South Africa:
Juta.
Jubas, K. 2011. Shopping for identity: articulation of gender, race and class by critical
consumers. Social Identities, 17 (3): 321-335. [Online] Available from: http//: DOI:
10.1080/13504630.2011.5709 Accessed: 15-11-2017].
Juwaheer, T.D., Pudaruth, S. & Ramdin, P. 2013. Enhancing customer shopping
experience in malls of emerging countries. Journal of Entrepreneurship
Management and Sustainable Development, 9(2):178-190. [Online] Available
from: http://dx.doi.org.10.1108/WJEMSD-01-2013-0005. [Accessed: 25-04-
2015].
Kang, B. 2012. The influence of sales persons’ psychological attributes on customers’
performance. African Journal of Business Management, 6(32):9359-9369.

158
Keller, K.L. 2013. Strategic brand management: Building, measuring and managing brand
equity. 4th ed. Essex, England: Pearson Education Limited.
Kim, J.E. & Kim, J. 2012. Human factors in retail environments: A review. International
Journal of Retail and Distribution Management, 40(11):818-841. [Online]
Available from: http://dx.doi.org/10.1108/09590551211267593 [Accessed: 13-
02-2015].
Kim, J. & Kim, J.E. 2014. Making customer engagement fun: Customer sales person
interaction in luxury fashion retiling. Journal of Fashion Marketing and
Management, 88(2):133-144.
Kim, J., Ju, H. W. & Johnson, K.P. 2009. Sales associates’ appearance: Links to
consumers’ emotions, store image and purchases. Journal of Retailing and
Consumer Services, 16:407-413.
Kim, J.H. & Runyan, R. 2011. Where did all the benches go? The effects of mall kiosk.
International Journal of Retail and Distribution Management, 39(2):130-143.
Koistinen, K. & Jarvinen, R. 2016. Comparing perceived insecurity among customers and
retail staff during service encounters. Journal of Retailing and Consumer
Services, 31:80-92.
Komiak, S.Y.X. Wang, W. & Bembasat, I. 2005. Trust building in virtual sales person
versus in human sales person: Similarities and differences. Proceedings of the
38th Hawaii International Conference Systems Sciences, 49-105.
Kotler, P. 1973 -1974. Atmospherics as a marketing tool. Journal of Retailing, 49(4):48-
61.
Kotler, P. & Armstrong, G. 2014. Principles of marketing. 15th ed. Essex, England:
Pearson Education Limited.
Kotler, P. & Keller, K.L. 2016. Marketing management. 15th ed. Essex, England: Pearson
Education Limited.

159
Kwon, H., Ha, S. & Im, H. 2015. The impact of perceived similarity to other customers on
shopping mall satisfaction. Journal of Retailing and Consumer Services, 1-6.
Lam, S.Y. 2001. The effects of store environment on shopping behaviours: a critical
review. Advances in Consumer Research, 28:190-197.
Lamb, C.W., Hair, J.F. & McDaniel, C. 2012. Essentials of marketing. (7th ed.). San
Francisco, CA: South-Western Cengage Learning.
Lang, M. & Hooker, N.H. 2013. An empirical test of experiential shopping in food retailing.
British Food Journal, 115(5):639-652.
Latane, B. 1981. The psychology of social impact. American Psychologist, 36(4):343-356.
Leedy, P.D. & Ormrod, J.E. 2013. Practical research: planning and design. 10th ed. New
York: Pearson Education.
Lieven, T. 2016. Customers’ choice of salesperson during the initial sales encounter.
Journal of Retailing and Consumer Services, 32:109-116. [Online] Available from:
http://dx.doi.org/10.1016/j.jretconser.2016.06.005. [Accessed: 7-10-2016].
Le-Hew, M. L. M. & Wesley, S.C. 2007. Tourist shoppers’ satisfaction with regional
shopping mall experiences. International Journal of Culture, Tourism and
Hospitality Research, 1(1):82-96.
Lemon, K. N. &. Verhoef, P. C. 2016. Understanding customer experience throughout the
customer journey. Journal of Marketing, 80(11): 69–96.
Levy, M., & Weitz, B.A. 2012. Retailing management. 8th ed. New York: McGraw Hill,
Irwin.
Limbu, B. Y., Jayachandran, C., Babin, B.J. & Peterson, R.T. 2016. Empathy, nonverbal
immediacy and sales performance: the mediating role of adaptive selling
behaviour. Journal of Business and Industrial Marketing, 31(5):654-667.
http://www.emeraldinsight.com/0885-8624.htm [Accessed: 25-11-2017].
160
Ling, P., D’Alessandro, S. & Winzar, H. 2015. Consumer behaviour. South Melbourne,
Australia: Oxford University Press.
Louw, L. & Venter, P. 2010. Strategic management. Developing sustainability in Southern
Africa. (2nd ed.). Cape Town, South Africa: Oxford University Press.
Lui, Y., & Jang, SS. 2009. The effect of dining atmospherics: An extended Mehrabian –
Russell Model, International Journal of Hospitality Management, 28:494-503.
Lusch, R.F., Dunne, P.M. & Carver, J.R. 2011. Introduction to retailing. 7th ed. San
Francisco, CA: South-Western Cengage Learning.
Machleit, K.A., Eroglu, S.A. & Mantel, S.P. 2000. Perceived retail crowding shopping
satisfaction: What modifies this relationship? Journal of Consumer Psychology,
9(1):29-42.
Machleit, K.A., Kallaris, J.J. & Eroglu, S.A. 1994. Human versus spatial dimensions of
crowding perceptions in retail environments: A note on the measurement and
effect on shopper satisfaction. Marketing Letters, 5:183-194.
Malhotra, N.K., Birks, D.F. & Wills, P. 2012. Marketing research: An applied approach. 4th
ed. London: Pearson Education Ltd.
Mann, S.F.B. & Kaur, M. 2013. Exploring branding strategies of FMCG services and
durable brands: Evidence from India. Journal of Product and Brand Management,
22(1):6-17.
Mariadoss, B.J., Milewicz, C., Lee, S. & Sahaym, A. 2013. Salespersons’ competitive
intelligence and performance: The role of product knowledge and salesforce
automation usage. Industrial Journal of Marketing Management, 43:136-145.
Martin, C.L. & Pranter, C.A. 1989. Compatibility management: Customer-to-customer
relationships in service environments. Journal of Service Marketing, 3(3):5-15.
McDaniel Jr, C. & Gates, R. 2013. Marketing research. 9th ed. Singapore: John Wiley &
Sons.

161
Mehra, R. 2016. Effects of demographic factors on the purchase of private label brands
of food products from organized retail stores in Chandigarh. Journal of Commerce
and Management Thoughts, 7(1): 144-162. [Online] Available from: http//:
DOI:10.5958/0976-478X.2016.00010.0. [Accessed: 21-10-2017].
Mehrabian, A. & Russell, J.A. 1974. An approach to environmental psychology.
Cambridge, M.A.: The MIT Press.
Mehta, R. 2013. Understanding perceived retail crowding: a critical review and research
agenda. Journal of Retail Consumer Service, 20:642-649.
Menon, K. & Dube, L. 2000. Ensuring greater satisfaction by engineering sales response
to customer emotions. Journal of Retailing, 76(3):285-307.
Miao, L. & Mattila, S. 2013. The impact of other customers on customer experiences: a
psychological distance perspective. Journal of Hospitality and Tourism Research,
37:77-99.
Moore, R., Moore, M.L. & Capella, M. 2005. The impact of customer to customer
interactions in a high personal contact service setting. Journal of Service
Marketing, 19:482-491.
Michon, R., Yu, H., Smith, D. & Chebat, J.C. 2007. The shopping experience of female
fashion leaders. International Journal of Retail and Distribution Management,
35(6):488-501.
Millan, E.S. & Howard, E. 2007. Shopping for pleasure? Shopping experiences of
Hungarian consumers. International Journal of Retail and Distribution
Management, 35(6):474-487.
Morrin, S. & Dube, L. Chebat, J.C. 2007. The role of pleasant music in servicescapes: A
test of the dual model of environmental perception. Journal of Retailing,
83(1):115-130.

162
Nayyab, H.H., Javed, H., Ibraheem, A. & Safdar, L. 2011. The impact of consumer
behaviour on FMCG’s. A study of Okara Punjab. Interdisciplinary Journal of
Contemporary Research in Business, 3(2):804-833.
Nelson, K. & Boven, J. 2000. The effect of employee uniforms on employee satisfaction.
Cornell Hotel and Restaurant Administration Quarterly, Ch. 2: 86.
Newman, A. & Foxall, J. 2003. In-store customer behaviour in fashion sector: some
emerging methodological and theoretical directions. International Journal of
Retail and Distribution Management, 31(11):591-600.
Nickson, D., Warhurst, C. & Dutton, E. 2005. The importance of attitude and appearance
in the service encounter in retail and hospitality. Managing Service Quality,
15(2):195-208.
Noone, B.M. & Mattila, A.S. 2009. Consumer reaction to crowding for extended service
encounters. Managing Service Quality, 19(1):31-41).
Olahut, M. R., El-Murad, J. & Plaias, I. 2012. Store atmosphere: Conceptual issues and
its impact on shopping behaviour. Proceedings of the International Conference
“Marketing – from Information to Decision”.
Orth, U.R., Bouzdine-Chameeva, T. & Brand, K. 2013. Trust during retail encounters: A
touchy proposition. Journal of Retailing, 89(3):301-314).
Osman, S. Ong, F.S. Othman, M. & Khong, K.W. 2014. The mediating effect of mood on
in-store behaviour among Muslim shoppers. Journal of Islamic Marketing,
5(2):178-198. [Online] Available from: http://www.emeraldinsight.com/1759-
0833.htm . dx.doi.org/10.1108/JIMA-01 [Accessed: 01-08-2016].
Pan, C. & Siemens, J.C. 2011. The differential effects of retail density: An investigation
of goods versus service setting. Journal of Business Research, 64:105-112.
[Online] Available from: http//www.science direct
doi:10.1016/j.jbusres.2010.02.011 [Accessed: 2016-08-01].

163
Parumasur, S. & Roberts-Lombard, M. 2014. Consumer behaviour. 3rd ed. Cape Town,
South Africa: Juta.
Patino, A., Kalticheva, V.D., Pitta, D., Sriram, V. & Winsor, R.D. 2014. How important are
different socially responsible practices? An exploratory study of gender, race and
income differences. Journal of Consumer Marketing, 31(1):2-12. [Online]
Available from: http://doi.org/10.1108/JCM-10-2013-0733 [Accessed: 15-11-
2017].
Poncin, I. & Ben Mimoun, M.S. 2014. The impact of e-atmospherics on physical stores.
Journal of Retailing and Consumer Services, 1-9. [Online] Available from:
http//www.elsvier.com/locate/rentconser.dx.doi.org./10.1016/j.jretconser.
[Accessed: 17-4-2014].
Pons, F., Mourali, M. & Giroux, M. 2014. The density satisfaction relationship revisited:
The role of scarcity and consumers’ affective reactions in a crowded retail
situation. Journal of Retailing and Consumer Services, 21:54-60. [Online]
Available from: http://www. Elsvier.com/locate/jetconser.dx.doi.org.101016.
[Accessed: 14-2-2014].
Prendergast, G. P., Li, S.S. & Li, C. 2014. Consumers’ perceptions, gender and credibility:
an evolutionary explanation. Journal of Consumer Marketing, 31(3): 200-211,
[Online] Available from: https://doi.org/10.1108/JCM-09-2013-0695 [Accessed
on: 15-11-2017].
Raju, P.S. 1980. Optimum stimulation level: Its relationship to personality, demographics
and exploratory behaviour. Journal of Consumer Research 7(3): 272–282.
Rapoport, A. 1976. Toward a redefinition of density. Environment and Behaviour,
7(2):133-158.
Roman, S. & Ruiz, S. 2005. Relationship outcomes of perceived ethical sales behaviour:
the consumer perspective. Journal of Business Research, 58:439-445.
164
Remler, K.D. & Van Ryzin, G.G. (2011). Research methods in practice. San Francisco,
CA: SAGE Publications, Inc.
Richard, O.C., Stuart, M.M., McKay, P.F. & Sackett, T.W. 2017. The impact of store-unit–
community racial diversity congruence on store-unit sales performance. Journal
of Management, 43(7):2386–2403. [Online] Available from: DOI:
10.1177/0149206315579511
Shao, C. Y. Baker, J. & Wagner, J.A. 2004. The effects of appropriateness of service
contact personnel dress on customer expectations of service quality and
purchase intention: The moderating influences of involvement and gender.
Journal of Business Research, 57:1164-1176. [Online] Available from: http//: DOI:
1016/S0148-2963(02)00326-0. [Accessed: 02-02-2016].
Sharma, A. & Staford, T.F. 2000. The effects of retail atmospherics on customers’
perceptions of sales people and customer’s persuasion: An empirical
investigation. Journal of Business Research, 49(2):183-192.
Schiffman, L.G., Kanuk, L.L. & Hansen, H. 2008. Consumer behaviour. 9th ed. New York:
Pearson.
Schiffman, L.G., Kanuk, L.L & Wisenblit, J. 2010. Consumer behaviour. 10th ed. Upper
Saddle River, New Jersey: Pearson Education.
Schiffman, L.G. & Wisenblit, J. 2015. Consumer behaviour. 11th ed. New York: Pearson
Education.
Seock, Y. & Sauls, N. 2008. Hispanic consumers' shopping orientation and apparel retail
store evaluation criteria: An analysis of age and gender differences. Journal of
Fashion Marketing and Management: An International Journal, 12(4):469-486.
[Online] Available from: https://doi.org/10.1108/13612020810906137.
[Accessed: 15-11-2017].
Skandani, H., Monelhi, N.B. D. & Malek, F. 2011. Effect of store atmospherics on
employees’ reactions. International Journal of Retail and Distribution

165
Management, 39(1):51-67. [Online]: Available from:
http://www.emeraldinsight.com/0959-
0552.htm.doi.101108/09590551111104477. [Accessed: 12-7-2014].
Solomon, M.R., Marshal, G.W. & Stuart, E.W. 2006. Marketing: real people, real choices.
Upper Saddle River, NJ: Pearson Prentice Hall.
Soderlund, M. 2011. Other customers in the retail environment and their impact on the
customers’ evaluation of the retailer. Journal of Retailing and Consumer Services,
18:174-182.
Soderlund, M. & Julander, C. 2009. Physical attractiveness of the service worker in the
moment of truth and its effect on customer satisfaction. Journal of Retailing and
Consumer Services, 16:216-226. [Online] Available from:
http://www.elsvier.com/jretcontserver/ doi.10.1016. Accessed: 19-4-2015].
Srivastava, M. & Kaul, D. 2016. Exploring the link between customer experience-loyalty-
consumer spend. Journal of Retailing and Consumer services, 31:277-286.
[Online] Available from: http://dx.doi.org/10.1016/j.jretconser.2016.04.009.
Accessed: 10-07-2016.
Statistics South Africa. 2018. Retail trade sales. Statistical release P6242.1. April.
Pretoria: Statistics South Africa. [Online] Available from:
http//www.statssa.gov.za [Accessed: 2018-07-14].
Stein, A. & Ramaseshan, B. 2016. Towards the identification of customer experience
touch point elements. Journal of Retailing and Consumer Services, 30:8-19.
Sum, C.Y. & Hui, S.C.L. 2009. Salesperson’s service quality and customers’ loyalty in
fashion chain stores. Journal of Fashion Marketing and Management, 13(1):98-
108.
Swan, J.E., Bowers, M.R. & Richardson, L.D. 1999. Customer trust in the salesperson:
An integrative review and meta-analysis of the empirical literature. Journal of
Business Research, 44:93-107.
166
Swimberghe, K., Jones, R.P. & Darrat, M., 2014. Deviant behaviour in retail when sales
associates “Go Bad”: Examining the relationship between the work family
interface, job stress and sales person deviance. Journal of Retailing and
Consumer Services, 21:424-431.
Thakor, M., Rajneesh S. & Katayoun, S. 2008. Effects of service setting and other
consumers’ age on the service perceptions of young consumers. Journal of
Retailing, 84(2):536-52.
Tiwari, M.K. 2012. An empirical analysis of effect of advertising on marketing of FMCG
products. International Journal of Marketing and Technology, 2(6):167-200.
Tombs, A.G. & McKennedy, J.R. 2010. Social and spatial influence of customers on other
customers in the social servicescape. Australian Marketing Journal, 18:120-131.
[Online] Available from: http://dx.doi/10.1016/j.ausm.j. 2010.04.001. [Accessed:
19-4-2015].
Trip Advisor. 2017. [Online] Available from:http//: www.tripadvisor.com. [Accessed: 12-
02-2017].
Tsai, W.C. & Huang, Y. 2002. Mechanism linking employee delivery and customer
behavioural intentions. Journal of Applied Psychology, 87(5):1001-1008.
Turley, L.W. & R.E. Milliman 2000. Atmospheric effects on shopping behaviour. A review
of the experimental evidence. Journal of Business Research, 49(2):193-211.
Tustin, D.H, Ligthelm, A.A, Martins, J.H. & Van Wyk, H. 2005. Marketing research in
practice. Pretoria, South Africa: Unisa Press.
Uhrich, S. & Luck, M. 2012. Not too many but also not too few: exploring the explanatory
mechanisms for the negative effects of low customer density in retail settings:
quality of marketing research. International Journal, 15:290-308.

167
Uhrich, S. & Tombs, A. 2014. Retail self-awareness: The individuation effects of others.
Journal of Business Research, 67:1439-1446. [Online] Available from:
http://dx.doi.org.101016/j.jbusres.2013.07.023. [Accessed: 19-4-2015].
Van Dolen, W., Lemmink. J., De Ryter, K. & De Jong, A. 2002. Customer-sales employee
encounters a dyadic perspective. Journal of Retailing, 78:265-279.
Van Rompay, T. J. L., Krooshoop, J., Verhoeven, J.W.M. & Pruyn, A.T.H. 2012. With or
without you: Interactive effects of retail density and need for affiliation on
shopping pleasure and spending. Journal of Business Research, 65:1126-1131.
Wang, L.C., Chang, L. & Wysong, C. 2012. An empirical investigation of optimum
stimulation levels in retailing. International Journal of Retailing and Distribution
Management, 40(1):620.
Wiid, J. & Diggines, C. 2015. Marketing research. 3rd ed. Cape Town, South Africa: Juta.
Wiid, J. 2014. Strategic marketing. Cape Town, South Africa: Juta.
Wu, L.L., Mattila, A.S. & Han, J.R. 2014. The territoriality revisited: Other customers’
perspective. International Journal of Hospitality Management, 38:48-56. [Online]
Available from: http://www.elsvier.com/locate/hosman.dx.doi.org.10.1016/j.ijhm
[Accessed: 12-6-2015].
Yoon, M.H., Seo, J.H. & Yoon, T.S. 2004. Effects of contact employee supports on critical
employee and customer service evaluation. Journal of Service Marketing, 13
(5):395-412.
Yilidirim, K. & Akalin-Baskaya, K. 2007. Perceived crowding in café/restaurant with
different seating densities. Building and Environment, 42:3410-3417. [Online]
Available from: http//www.sciencedirect.com.doi:10.1016/j.buildenv.2006.08.014
[Accessed: 2015-02-14].

168
Yurchisin, J. & Damhost, J.M.L. 2009. An investigation of sales person’s appearance and
organizational identification. Journal of Fashion Marketing and Management,
13(3):458-470.
Zikmund, G.W., Babin, B.J., Carr, C.J. & Griffin, M. 2013. Business research methods.
9th ed. San Francisco, CA: South-Western Cengage Learning.
Zourrig, H. & Chabat, J.C. 2009. Waiting in a queue with strangers and acquaintances:
An integrative model of customer-to-customer interactions. International Journal
of Quality and Service Sciences, 1(2):145-159.
Zuckerman, M., Eysenck, S.B.J. & Eysenck, H.J. 1978. Sensation seeking in England
and America: cross-cultural, age, and sex comparisons. Journal of Consulting
and Clinical Psychology 46 (1):139–149.

169
APPENDIX: A
- Informed consent form -

170
Informed consent to participate in an academic research study
Dept. of Marketing and Retail Management
Title of the study:
The influence of human variables on consumers’ shopping experience in FMCG retail
stores in Ekurhuleni
Research conducted by:
Mr H.S. Malope (40369005)
Cell: 082 837 8163
Dear Respondent
You are invited to participate in an academic research study conducted by Mr H.S. Malope, a
Masters student from the Department of Marketing and Retail Management at the University of
South Africa. The purpose of the study is “to investigate the influence of human variables on
consumers’ shopping experience in FMCG retail stores in Ekurhuleni”.
Please note the following:
This survey is anonymous, and your name will not appear on the questionnaire. The answers
you give will be treated as strictly confidential and you cannot be identified in person based
on the answers you give.
Your participation in this study is very important to us. You may, however, choose not to
participate and you may also stop participating at any time without any negative
consequences.
Please answer the questions in the attached questionnaire as completely and honestly as
possible. This should not take more than 15 minutes of your time.
The results of the study will be used for academic purposes only and may be published in an
academic journal. I will provide you with the summary of our findings on request.
If you have any question or comment regarding the study please contact the researcher, Mr
H.S Malope, Cell: 082 837 8163, Email: [email protected].

171
Please sign the form to indicate that:
You have read and understand the information provided above.
You give your consent to participate in the study on voluntary basis.
................................................................... ...............................
Respondent’s signature Date

172
APPENDIX: B
- Research instrument -
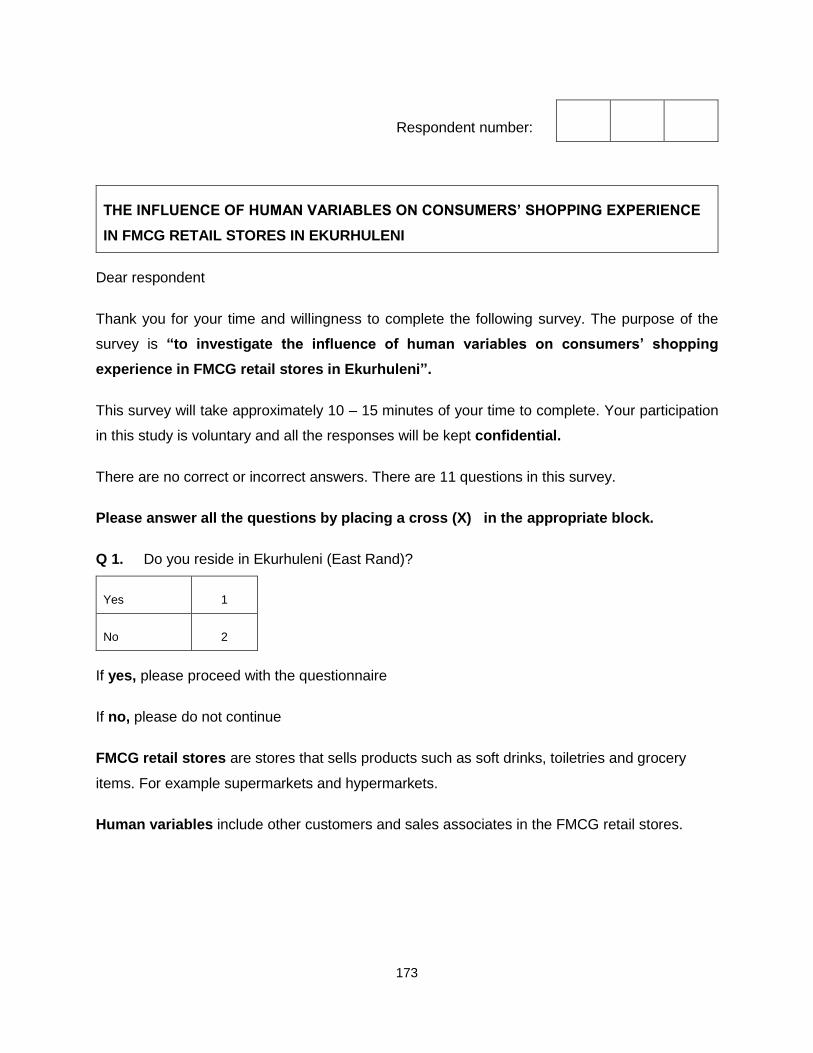
173
Respondent number:
THE INFLUENCE OF HUMAN VARIABLES ON CONSUMERS’ SHOPPING EXPERIENCE
IN FMCG RETAIL STORES IN EKURHULENI
Dear respondent
Thank you for your time and willingness to complete the following survey. The purpose of the
survey is “to investigate the influence of human variables on consumers’ shopping
experience in FMCG retail stores in Ekurhuleni”.
This survey will take approximately 10 – 15 minutes of your time to complete. Your participation
in this study is voluntary and all the responses will be kept confidential.
There are no correct or incorrect answers. There are 11 questions in this survey.
Please answer all the questions by placing a cross (X) in the appropriate block.
Q 1. Do you reside in Ekurhuleni (East Rand)?
Yes 1
No 2
If yes, please proceed with the questionnaire
If no, please do not continue
FMCG retail stores are stores that sells products such as soft drinks, toiletries and grocery
items. For example supermarkets and hypermarkets.
Human variables include other customers and sales associates in the FMCG retail stores.

174
Q 2. Please indicate your level of agreement or disagreement with the following statements
regarding the influence of crowding on your shopping experience in FMCG retail stores in
Ekurhuleni.
Strongly
disagree
Disagree Neutral Agree Strongly
agree
2.1 I prefer to shop in the crowded FMCG retail
stores.
1 2 3 4 5
2.2 I often try to avoid shopping in the crowded
FMCG retail stores.
1 2 3 4 5
2.3 The FMCG retail stores in Ekurhuleni
manage crowding very well to create a
pleasant shopping experience.
1 2 3 4 5
2.4 The FMCG retail stores in Ekurhuleni do not
experience crowding, as there are usually few
shoppers.
1 2 3 4 5
Q 3. Please indicate your level of agreement or disagreement with the following statements
regarding the influence of social relations on your shopping experience in FMCG retail
stores in Ekurhuleni.
Strongly
disagree
Disagree Neutral Agree Strongly
agree
3.1 I enjoy interacting with friendly customers
during my shopping at the FMCG retail
stores.
1 2 3 4 5
3.2 I like to make new friends when I’m
shopping.
1 2 3 4 5
3.3 I often prefer to have fun with other
customers shopping next to me.
1 2 3 4 5
3.4 I like to talk to other customers who have
goals that are similar to mine.
1 2 3 4 5

175
Q 4. Please indicate you level of agreement or disagreement with the following statements
regarding the influence of sales associates’ availability on your shopping experience in
FMCG retail stores in Ekurhuleni.
Strongly
disagree
Disagree Neutral Agree Strongly
agree
4.1 Enough sales associates are always
available and willing to assist customers
in the FMCG retail stores.
1 2 3 4 5
4.2 Sales associates always welcome
customers when they enter the FMCG
retail stores with a friendly smile.
1 2 3 4 5
4.3 It is not easier for customers to find sales
associates when they need assistance in
the FMCG retail stores.
1 2 3 4 5
Q 5. Please indicate your level of agreement or disagreement with the following statements
regarding the influence of physical attributes of sales associates on your shopping
experience in FMCG retail stores in Ekurhuleni.
Strongly
disagree
Disagree Neutral Agree Strongly
agree
5.1 I like shopping in the FMCG retail stores
that have well dressed and presentable
sales associates.
1 2 3 4 5
5.2 The neat uniform that sales associates
wear represent the FMCG retail store’s
brand very well.
1 2 3 4 5
5.3 Professionally appearing sales associates
create a pleasant atmosphere in the
FMCG retail stores.
1 2 3 4 5

176
Q 6. Please indicate your level of agreement or disagreement with the following statements
regarding the influence of behavioural attributes of sales associates on your shopping
experience in FMCG retail stores in Ekurhuleni.
Strongly
disagree
Disagree Neutral Agree Strongly
agree
6.1 Sales associates are knowledgeable
about the products sold in the FMCG retail
stores and can answer customers
questions.
1 2 3 4 5
6.2 I like sales associates that are friendly and
patient.
1 2 3 4 5
6.3 I prefer to shop at the FMCG retail stores
that have got sales associates who can
understand customers’ needs.
1 2 3 4 5
6.4 Sales associates that are honest and
professional can be trusted.
1 2 3 4 5
Q 7. Please indicate your gender.
Male 1
Female 2
Q 8 Please indicate your age group.
18 - 23 1
24 - 35 2
36 - 45 3
46 - 60 4
Q 9 Please indicate your racial group.
African 1
White 2
Coloured 3
Indian 4
Other 5
If other, please specify ……………………………………………………………
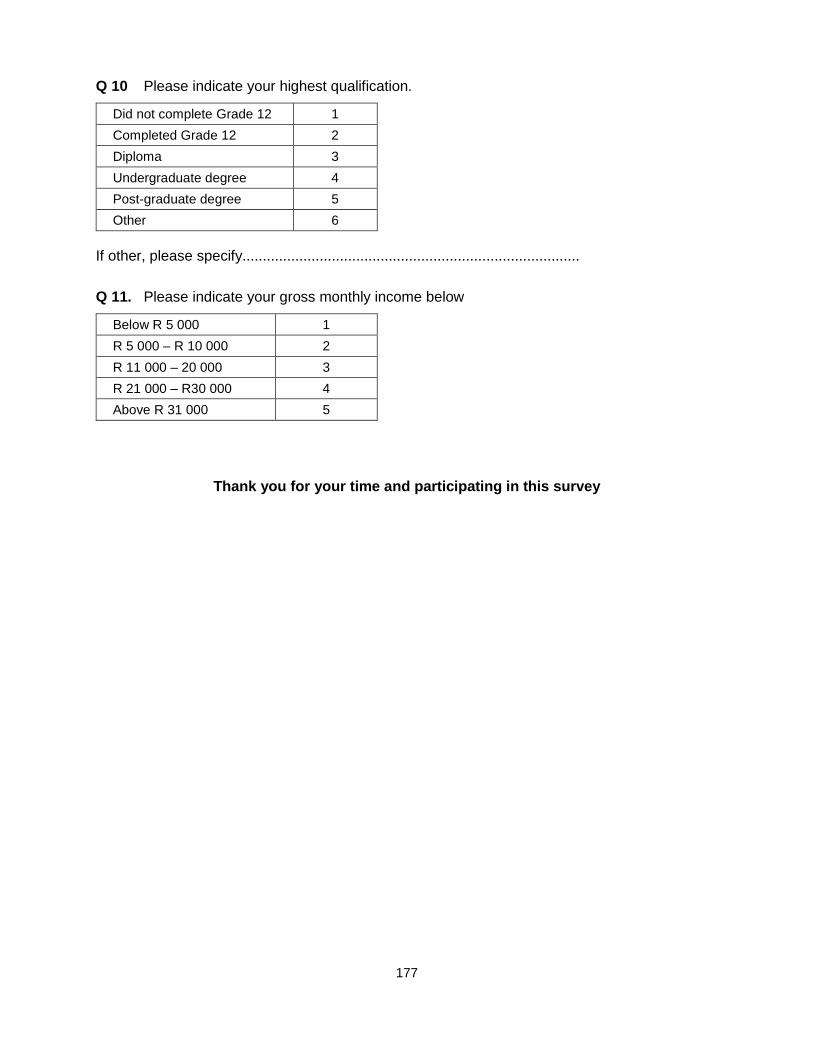
177
Q 10 Please indicate your highest qualification.
Did not complete Grade 12 1
Completed Grade 12 2
Diploma 3
Undergraduate degree 4
Post-graduate degree 5
Other 6
If other, please specify...................................................................................
Q 11. Please indicate your gross monthly income below
Below R 5 000 1
R 5 000 – R 10 000 2
R 11 000 – 20 000 3
R 21 000 – R30 000 4
Above R 31 000 5
Thank you for your time and participating in this survey

178
APPENDIX: C
- Permission letters -

179
06 - 04 - 2016
Dear Henry
Approval has been granted for you to proceed, provided you follow the 5 principles
listed on your application letter.
Please advise the date and time that you will be executing this so that we can inform
our security department.
Please also note that you will need to come and sign in at the centre management
offices before you commence with your research.
Warm regards
Lee-Anne Leathley
Marketing Manager: Festival Mall, East Rand Value Mall & Sunward
Centre
Mustard Seed Relationship Marketing CC
Cell: 076 134 9782
Tel: 011 394 7549
Block E, Capital Place, Neutron Avenue, Techno Park, Stellenbosch,
7600
www.mseed.co.za

180
20 – 05 - 2016
Permission Granted for Research Survey
Dear Henry S Malope I hereby give you permission to conduct a confidential survey that will be only need to be made available to East Rand Mall Centre Management. Kindly note that we are unable to assist with the research survey as a marketing team as we have very little resources. Kind regards
181
22 – 04 - 2016
PERMISSION GRANTED FOR PRE-TESTING QUESTIONNAIRE AT LAMBTON SHOPPING MALL Hi Henry You can proceed with arrangements to do your questionnaire. Regards
182
APPENDIX: D
- Language editing certificate -

183
184
APPENDIX: E
- Ethical clearance certificate -

185
UNISA
MARKETING AND RETAIL MANAGEMENT RESEARCH ETHICS
REVIEW COMMITTEE
23 November 2016
Dear Mr HS Malope
Name: HS Malope, [email protected], +27828378163
Supervisor: SSLN Mosupyoe, [email protected], +27124294510
Co-supervisor: Dr JAR Botha, [email protected], +27124294610
Proposal: The influence of human variables on consumers' shopping experience in
FMCG retail stores in East Rand/Ekurhuleni.
Qualification: Postgraduate degree
Thank you for the application for research ethics clearance by the Marketing and Retail
Management Research Ethics Review Committee for the above mentioned research.
Final approval is granted for the duration of your study.
Ref
Name of applicant
(student/researcher): Mr HS
Malope
Student #: 40369005
Staff # : n/a
Decision: Ethics Approval
186
For full approval: The application was reviewed in compliance with the Unisa Policy on
Research Ethics by the Marketing and Retail Management Research Ethics Review Committee
on 23 November 2016.
The proposed research may now commence with the proviso that:
1) The researcher/s will ensure that the research project adheres to the values and
principles expressed in the UNISA Policy on Research Ethics.
2) Any adverse circumstance arising in the undertaking of the research project that is
relevant to the ethicality of the study, as well as changes in the methodology, should be
communicated in writing to the Marketing and Retail Management Ethics Review
Committee. An amended application could be requested if there are substantial
University of South Africa Preller Street. Muckleneuk Ridge. City of Tshwane PO Box 392 UNSA
0003 South Telephone +27 12 429 I Facsimile: +27 12 429 4150 www.unisa.ac.za
Open Rubric

187
changes from the existing proposal, especially if those changes affect any of the study-
related risks for the research participants.
3) The researcher will ensure that the research project adheres to any applicable national
legislation, professional codes of conduct, institutional guidelines and scientific standards
relevant to the specific field of study.
Note:
The reference number 2016_MRM_010 should be clearly indicated on all forms of
communication [e.g. Webmail/, E-mail messages, letters] with the intended research participants,
as well as with the Marketing and Retail Management Ethics Review Committee, RERC.
Prof JA Wiid Prof MT Mogale
Chairperson
012)4293939
Executive dean
University of South Africa
Prelter Street. Muckleneuk University Ridge. City of Tshware
PO Box 392 UNISA 0003 South Telephone: +27 12 429 31 i I Facsimile: +27 12 429 4150