The influence of culture and cognition on the entrepreneurial strategy...
60
The influence of culture and cognition on the entrepreneurial strategy of Start-Ups: the case of Turkey. By Altay Șahbaz “Those who have knowledge, don't predict. Those who predict, don't have knowledge” ― Lao Tzu A thesis submitted in partial fulfilment of the requirements for the Degree of Master of Science in Business Administration UNIVERSITY OF TWENTE Faculty: Behavioural, Management and Social Sciences (BMS) Drienerlolaan 5, 7522 NB Enschede OV The Netherlands Supervisors: M.R. (Martin) Stienstra MSc Dr. M.L. (Michel) Ehrenhard August 2017 ©2017 Altay Șahbaz, University of Twente
Transcript of The influence of culture and cognition on the entrepreneurial strategy...

The influence of culture and cognition on the entrepreneurial
strategy of Start-Ups: the case of Turkey.
By
Altay Șahbaz
“Those who have knowledge, don't predict. Those who predict, don't have knowledge”
― Lao Tzu
A thesis submitted in partial fulfilment of the requirements for the
Degree of Master of Science in Business Administration
UNIVERSITY OF TWENTE
Faculty: Behavioural, Management and Social Sciences (BMS)
Drienerlolaan 5, 7522 NB Enschede OV
The Netherlands
Supervisors:
M.R. (Martin) Stienstra MSc
Dr. M.L. (Michel) Ehrenhard
August 2017
©2017 Altay Șahbaz, University of Twente
2
Abstract
Why do some start-up entrepreneurs make entrepreneurial decisions based on effectual logic and
others on causal logic? People have the ability to make decisions based on either their intuitive-
experiential- or analytical-rational system. The question is whether one of these is linked to the
entrepreneurial decision-making logics: effectuation or causation. Previous studies have shown that
culture plays a role in how people in general process information. For example, in some countries the
majority of the population make their decisions based on their intuitive-experiential system, whereas
in other countries the majority make decisions based on their analytical-rational system.
The goal of this study is finding out whether the entrepreneurial logic of effectuation or causation is
related to the entrepreneur’s decision-making and culture. The following research question has been
drawn up for this purpose:
To what extent do entrepreneurs have a tendency for effectual(reasoning) over/vs causal (reasoning)
and does culture have an interacting effect?
This research has been conducted to assess the effects of differences between cultures and the effects
on people’s decision-making with a view to whether people live in a tight or a loosely organised
environment. Two types of cultures have been taken as the basis for this study: a tight culture with
many strong norms and a low tolerance of deviant behaviour as well as a loose culture with weak
social norms and a high tolerance of deviant behaviour.
A survey has been conducted among Turkish start-up entrepreneurs as a basis for this study. The
findings show that these entrepreneurs prefer causation over effectuation and they demonstrate no
clear difference in the way they process information. They obviously perceive their culture as rather
tight.
It appears that entrepreneurs who make their decisions based on effectuation generally process
information depending on an intuitive-experiential system, but as soon as culture is taken into account
this relation largely disappears. However, entrepreneurs who use causation in their decision-making do
not directly process information based on an analytical-rational system. In contrast, when culture is
taken into account, the relation between causation and the analytical-rational system becomes
significant. These outcomes suggest that culture plays an important role in the relation between
entrepreneurial decision-making and a cognitive style.
This paper highlights the importance of the entrepreneur’s cultural background in the way how
information is processed and how entrepreneurial decisions are made. Therefore, in further
entrepreneurial and cognition studies, culture may not be neglected in order to reach a comprehensive
outcome in any study on this subject.

3
Content 1. Introducing topic .................................................................................................................... 4
1.1. Contribution ..................................................................................................................... 8
2. Theoretical orientation ........................................................................................................... 9
2.1. Cognition ......................................................................................................................... 9
2.2. Effectuation and causation ............................................................................................. 11
2.2.1. Basis for taking action ............................................................................................ 12
2.2.2. View of risk and resources ...................................................................................... 13
2.2.3. Attitude towards others ........................................................................................... 13
2.2.4. Attitude towards unexpected events ....................................................................... 14
2.2.5. View of the future ................................................................................................... 14
2.3. Country’s tightness or looseness ................................................................................... 16
2.4. Hypotheses ..................................................................................................................... 19
3. Methodology ........................................................................................................................ 22
3.1. Sample ........................................................................................................................... 22
3.2. Scales ............................................................................................................................. 23
3.2.1. Cognition: intuition-experiential vs analytical-rational .......................................... 23
3.2.2. Entrepreneurial decision-making: effectuation & causation ................................... 24
3.2.3. National culture: tightness vs looseness.................................................................. 24
3.3. Method of analysis ......................................................................................................... 25
3.3.1. Reliability analysis .................................................................................................. 25
3.3.2. Factor analysis ........................................................................................................ 26
3.3.3. Normal distribution ................................................................................................. 29
3.4. Control variables ............................................................................................................ 29
4. Results .................................................................................................................................. 30
4.1. Descriptive statistics ...................................................................................................... 30
4.2. Correlation ..................................................................................................................... 31
4.3. Tightness/Looseness score ............................................................................................ 33
4.4. Hypotheses ..................................................................................................................... 34
5. Discussion ............................................................................................................................ 41
(Management) Implications .................................................................................................. 43
Limitations and Future research ........................................................................................... 44
Conclusion ............................................................................................................................ 46
Bibliography ............................................................................................................................. 47
Appendix .................................................................................................................................. 56

4
1. Introducing topic “Those who have knowledge, don't predict. Those who predict, don't have knowledge”. In this rapidly
-changing world it is near impossible to predict. Among others, entrepreneurs need to deal with these
events for the sake of survival or for gaining competitive advantage. Entrepreneurs are individuals that
launch and manage ventures. According to literature, a regularly used definition of entrepreneurship is:
“The process by which individuals – either on their own or inside organizations – pursue opportunities
without regard to the resources they currently control” (Stevenson & Jarillo, 1990, p. 23). The starting
point of this definition focuses on the opportunity recognition, which is in line with the widely-
accepted component of Kirzner’s (1973) ‘alertness to opportunity’. Stevenson’s definition and
opportunity view is mentioned extensively in management literature, since it is coherent with modern
and conventional definitions of entrepreneurship (Brown, Davidsson and Wiklund, 2001).
The question on how opportunities get recognised has been a subject of intensive research for many
years, comprehensive studies have been devoted on several components of opportunity recognition.
Among others: the entrepreneur’s prior knowledge (Shane & Venkataraman, 2000), specific traits,
skills, motivations (Baum and Locke, 2004; Garg, Matshediso & Gard, 2011), alertness (Kirzner,
1973; Shane & Venkataraman, 2000; Gaglio & Katz, 2001), strategic decision making (Busenitz &
Barney, 1997) and cognition (Zahra, Korri & Yu, 2005) play a significant role in recognising
opportunities. Most attention in this paper will be devoted to the entrepreneur’s decision making
because the question arises on how an entrepreneur deals with opportunities and decides to use them.
Does the entrepreneur first invent a strategic business plan including Ansoff-strategies, SWOT-
analyses, and competitive profile matrices just like what has been taught by 78 of the top 100 Business
schools in the US and probably the rest of the world (Honig, 2004) or is the entrepreneur more flexible
and does he make more emergent decisions related to the situation?
Business management scholars have comprehensively elaborated on entrepreneurial decision making
so far. In the approach to launching a company many developments have taken place. For many years
the plan-based approach was the leading way to launch a company (Honig & Karlsson, 2004; Liao &
Gartner, 2006). However, some scientists among others Sarasvathy (2001) have intensely studied this
process from another angle: the more unplanned and intuitive approach. Instead of looking at the goal
that the entrepreneur wants to reach, it first looks at the available means in house. This phenomenon is
known as effectuation and the previously-explained way of entrepreneurial decision-making is known
as causation (Sarasvathy, 2001). This twofold distinction on decision making of entrepreneurs has
been a popular research topic in this millennium (Nielsen & Lassen, 2012).
5
On the one hand, there are entrepreneurs who start a company by defining their goal first, already
looked to their potential customers, potential competitors in advance, and predict how much return
they could expect. Those entrepreneurs define and approach their market based on a plan. Kotler
(2012) states that the market should be approached in a structured way as explained above. Everything
is stipulated and if the available resources are insufficient, outside funds will be needed and
unexpected events should be avoided, because those were not considered and could harm the
competitive advantage. These steps belong to causation (Sarasvathy, 2001).
On the other hand, instead of tracing market opportunities, inventing a goal and searching for the
means to achieve that goal, there is effectuation. The entrepreneur first looks at the available means:
Who am I? What are my skills or abilities? What can I do myself? What do I know? So how far do my
expertise and knowledge reach? Whom do I know? Can my network do something for me? Or when I
look at my available resources: what is at my disposal? This is not only about money or physical
assets, but also about customers, expertise, image, stakeholders etc. (Sarasvathy, 2001). The premise is
different here, nothing is set at the start, along the way new incentives will arise and be used to find
the matching products to sell. If new people or new events are faced, they will be recognised as
opportunities to polish the end result. There is no fixed plan at the start. This way of making
entrepreneurial decisions is optimistic and not anxious for changes (Sarasvathy, 2001; Chetty, Ojala,
Leppäaho, 2015). Causation and effectuation decision-making processes are two different logics,
however both ways of decision making can occur at the same time in overlapping and intertwisting
situations (Sarasvathy, 2001).
The decision-making process is different for every person and the way in which decisions are being
made heavily depends on several factors, such as skills, experience, abilities, cognitive style, life style,
and preferences (Upadhyay, Kumar Singh, & Thomas, 2007; Ozcelik & Paprika, 2010; Riding &
Pearson, 1994). Essential in this research is the role of the entrepreneur’s cognitive style. Sarasvathy
(2001) states that effectuative decisions during venture creation are in fact a cognition-based theory.
This is also supported by Grégoire & Corbett (2011), who state that effectuation focuses on “cognitive
implications of uncertainty and the consequent constraints it places on both information processing
and the use of planning heuristics in entrepreneurship.’’ (pp. 19) Each entrepreneur processes
incoming information differently and has his/her own cognitive style, which is the personal approach
to coordinate, manage and process incoming information during learnable input (Messick, 1984;
Tennant, 1998). Over the years, psychologists and psychiatrists have diagnosed many different
cognitive styles. Riding and Cheema (1991) reviewed and reassessed most frequent styles and
concluded that all styles could be allocated either under wholist-analytic and verbal-imagery.

6
The wholist-analytic cognitive style is most likely related to the intuitive-experiential and the
analytical-rational system (Allison & Hayes, 1996). This component corresponds to the theory on how
the human brain functions. The brain consists of two parts. The right hemisphere is known as intuitive
and creative, while the left hemisphere is known as the rational and logical part (Ornstein, 1997;
Schore 2001). Entrepreneurs who tend to use the cognitive style of intuitive-experiential for a decision
most likely make them on the preconscious level, fast, automatic, associationistic, primarily non-
verbal. Alternatively, those entrepreneurs who are inclined to adopt the cognitive style of analytical-
rational for a decision most likely make them on the conscious level and intentional, analytic, and
primarily verbal (Epstein, Pacini, Denes-Raj and Heier, 1996). The decision-making process through
either causation or effectuation is a mental process and cognition based. When decision makers assess
the future as moderately predictable or estimable, it is likely that they will do analytical research. In
contrast if the future is assessed as unpredictable, the decision makers are expected to confide in
experiential and iterative learning techniques to combine means to get to an effect (Sarasvathy, 2001).
The role of information processing (and cognitive style) in entrepreneurial decision-making is
therefore an important aspect that previously mentioned scholars tend to approach together.
According to the literature, the decision-making process and the thought of an individual is strongly-
related to each other (Sarasvathy, 2001). It is therefore important to know why some people are
inclined to keep to an analytical mode of thought rather than an intuitive one. Norenzayan, Smith,
Kim, and Nisbett (2002) assign this difference to the individual’s cultural background. In some
countries people are less prone to fundamental attribution error (Ross, 1977) or try to attribute findings
to a wider range of factors to explain an event (Fischhoff, 1975) where other people from other
countries will do the opposite. Therefore, the actions and ways of thinking by an individual are highly
driven by his/her cultural setting. This applies to the entrepreneurial context as well. Hayton, George,
and Zahra (2002) have elaborated the relation between information processing and cultural
background in the context of entrepreneurial decision-making. Their model intertwines these three
components and highlights the presence of them. García-Cabrera & García-Soto (2008) as well as
Hopp & Stephan (2012) support this claim and have proven in their researches that both entrepreneurs
and their decision making are affected by their national culture. For example, entrepreneurs from more
collectivist societies are more comfortable to corporate entrepreneurship, whereas entrepreneurs from
individualistic cultures are more associated to being founders or individual entrepreneurs (Tiessen,
1997). Brinckmann, Grichnik, and Kapsa (2010) show that entrepreneurs in some cultures have more
effectual characteristics than in others within the setting of the entrepreneurial decision-making
ranging from effectuation to causation.
7
Culture plays a significant role in the way people act, decide, assess, etc. (Hofstede, 1993; Gelfand et
al., 2011; Yates & de Olievera, 2016). Instead of focusing on the traditional dimensions of Hofstede
(2011): power distance, uncertainty avoidance, individualism/collectivism, masculinity/femininity,
long/short term orientation, and indulgence/restraint; the view of Gelfand et al. (2011) on culture will
be used. She and her colleagues have supplied not another dimension, but complemented previous
work by considering how tight or how loose a culture can be (Verbeke & Merchant, 2012; Aktas,
Gelfand & Hanges, 2015). As a summary of what is meant by a tight culture and loose culture: tight
cultures generally have strong norms and have a low tolerance regarding deviant behaviour of an
individual. The opposite are loose cultures: norms are generally weak in such cultures and deviant
behaviour is highly tolerated. So, in this study the interest lies also in whether the entrenched
loose/tight culture of the entrepreneur influences his/her cognition and dichotomous way of decision
making as presented by Sarasvathy (2001): effectuation or causation. Over the course of years, a lot of
research has been done within the University of Twente on the concept of culture and effectuation.
There is no clear decisive answer in whether there is an influence. Some say yes, others say no.
Therefore, there is a need to further explore this possible relation. Mainly culture has been measured
by using the concepts of Hofstede and Globe. Although, a few students have been using the concept of
Gelfand et al. (2011) so far, still some extension is needed to give the general research more value.
By means of this paper a contribution to the existing literature is set out to be made by researching the
following central question: ‘’ To what extent do entrepreneurs have a tendency for
effectual(reasoning) over/vs causal (reasoning) and does culture have an interacting effect?’’
8
1.1. Contribution Effectuation is considered a new academic concept, which received its ‘name’ in its latest form in
2001. Research has been carried out on the topic of effectuation and causation. Sarasvathy (2001) as
well as Dew, Read, Sarasvathy and Wilbank (2007; 2009) and more recent scholars Woetmann (2014)
conducted research on effectuation and causation among successful top CEOs as experts and Post
MBA students as entrepreneurs. It appeared that 89% of 27 experts used effectuation, whereas 81% of
37 Post MBA students used causation (Sarasvathy, Dew, Read & Wiltbank, 2007). Sarasvathy, Dew,
Read and Witbank (2007) state that expert-entrepreneurs make decisions based upon experience and
Post MBA students make decisions based on predictable logic. However, these relations have not been
researched into detail and will be examined in this study.
In existing academia, the relation between entrepreneurial decision-making, cognition and culture has
not been researched extensively. The ones that exist, mostly operate the concepts differently. For
example, Mitchell et al. (2002) applied the dimensions of Hofstede and measured cognition based on
the model of Busenitz & Lau (1996). Hayton, George, and Zahra (2002) have developed a new model
and integrated the aforesaid variables on the basis of existing literature. There it became clear that on
the whole the work of Globe and Hofstede was used to operationalise culture. Furthermore, among
others Stienstra, Singaram and Ehrenhard (2014) made use of the scale of Allinson & Hayes (1996) to
operationalise cognition on the concept of entrepreneurial decision-making. It appears that a wide
variety of scales has been used in studies on entrepreneurial, decision-making, cognition, and culture.
However, the studies that took culture into account have indicated it as a variable in a wider process.
This paper aims to discuss the relation between entrepreneurial information processing and decision-
making by means of research within the context of culture and whether culture moderates
(strengthens/weakens) the relation between cognition and entrepreneurial decision-making process.
The scales of Alsos, Clausen and Solvoll, (2014 *NYP), Epstein et al. (1996) and Gelfand et al. (2011)
will be used. These scales have not previously been used together in a single study.

9
2. Theoretical orientation As explained in the introduction, this research consists of three concepts: cognition, cultural
tightness/looseness, and entrepreneurial decision-making effectuation/causation. The existing relevant
academic theory related to these concepts will be analysed in this first part.
2.1. Cognition The word ‘cognition’ originates from Latin and means ‘to give’ or ‘to know’ (Tsvetkov, 2014).
However, the definition used by far exceeds the original meaning. In science, it has been generally
accepted that cognition is about the mental process of how an individual encodes, stores, retrieves,
structures, uses or learns incoming information (Neisser, 1967, as cited in Lutz & Huitt, 2003). People
get many incentives daily, the way how people process the incoming information has to do with their
awareness, perception, reasoning, coding, planning and own judgement (Brandimonte, Bruno, Collina,
Pawlik & d’Ydewalle (2016). This process differs per individual and is known as cognitive style. In
theory, this is defined as the personal approach to coordinate, manage and process incoming
information during learnable input (Messick, 1984; Tennant, 1998). Over the years, it turned out that
in practice a couple of methods have consistently been used by individuals. It depends on the type of
information; which method is needed and whether the effect on the performance will be positive or
negative. In some cases, a specific style fits the given task better than another. It is also possible to use
different styles or to combine them (Riding & Sadler-Smith, 1997).
Over the years, different names have been given to frequent cognitive styles among others:
dependence – independence (Witkin, Dyk, Fattuson, Karp & Goodenough 1962), impulsivity -
reflectivity (Kagan, 1965), convergent – divergent (Hudson, 1966), leveller – sharpener (Holzman &
Klein, 1954), holists – serialist (Pask, 1972), and verbaliser-imager (Riding & Taylor, 1976). Riding
and Cheema (1991) researched all these styles and concluded, after critically reading the definitions,
testing the correlations, assessing the methodologies of the tests, and at last reviewing their effects on
behaviour, that these styles are different beliefs of the same dimensions which belong to two general
families: Wholist-Analytic and Verbal-Imagery. The wholist-analytic family will be examined in this
study. An individual may automatically dissect incoming information to its component part, which is
known as analytic. The wholist cognitive style is expressed as individuals who keep the overall or
general view of the incoming information. For both ways, there may exist a deficiency, a wholist can
risk blurriness in the distinction between the parts of a topic. An analytic may risk unequal focus on
the divided parts and therefore, neglect important information or pay too much attention to one part
and unconsciously exaggerate its importance (Riding & Sadler-Smith, 1997). It should be considered
that both dimensions of cognitive styles are not dependent on each other i.e. a person could be a
wholist and verbaliser simultaneously or the other way around. This differs also per individual (Riding
& Cheema, 1991).
10
The interest lies in the entrepreneurs’ cognitive style, the role of the intuitive-experiential- and
analytical-rational system, for making key decisions. This mental way of making decisions between
the intuitive-experiential- and analytical-rational belongs to the wholist-analytic family (Allinson &
Hayes, 1996; Riding & Sadler-Smith, 1997). Based on these cognitive styles, Epstein et al. (1996)
have developed a theory and introduced a self-report measure on how the individual processes
information. This measure is known as the Rational Experiential Inventory (REI) and determines an
individual’s preference for processing information as either intuitive-experiential or analytic-rational.
Epstein et al. (1996) do not perceive intuition as a single component of information processing, they
attach an individual’s experience directly to intuition. Shane (2011, as cited in Blume & Covin, 2011)
attribute more value to the role of experience in intuition by saying that when entrepreneurs have no
experience in an entrepreneurial context, their prior knowledge will not be the basis of their decisions
and therefore its chance of leading to an effective entrepreneurial intuition will be ruled out. Referring
to Epstein’s measurement, they included in their measurement two different scales: one scale that
covers the analytic-rational system known as NFC (need for cognition) and the other scale, which
covers the intuitive-experiential system and is known as faith-in-intuition (FI). They tested this on
undergraduate psychology students and concluded that NFC and FI are two independent systems. This
theory is all covered and known as the cognitive-experiential self-theory (CEST) of Epstein (1990,
1991, 1993, 1994, as cited in Epstein et al., 1996). The first system: analytical-rational information
processing occurs on the conscious level and is intentional, analytic, principally verbal, and relatively
affect free while the other system: the intuitive-experiential, occurs on the preconscious level and is
automatically, holistic, makes associations, chiefly non-verbal, and closely associated with effects.
This is in line with a dilemma on a daily basis: how do people respond to a task based on their feeling
or do they really think in depth about it to get to a solution?
Scientists like Mintzberg (1976) say that in some situations your intuition should direct you in making
a decision, others say that you should think thoroughly and analyse the possibilities before making a
decision. Hayashi (2001) states that people unconsciously combine both processes before making a
decision. Without knowing, our emotions and feelings help us filter between different choices, even
though our conscious mind is unaware of this action. Cognition is a complex concept and therefore it
is attractive to do further research on whether this is related to entrepreneurial decision-making as
suggested by Sarasvathy (2001).
11
2.2. Effectuation and causation Sarasvathy (2001) has proposed two logics of entrepreneurial decision-making, either through
effectuation or causation. Both concepts must not be seen as contrary, although their reasoning is both
based on an entirely separate logic. It totally depends on the timing and situation which approach
should be used (Sarasvathy, 2008; Perry, Chandler, & Markova, 2012). In more recent studies, it is
argued that it is not entirely impossible for entrepreneurs to combine both strategies (Alsos et al.,
2014). Sarasvathy (2001) exemplified effectuation and causation as the bipolar way on how a chef can
prepare a meal and stated the following:
“The host or client picks out a menu in advance. All the chef needs to do is list the ingredients needed,
shop for them, and then actually cook the meal” (Sarasvathy, 2001, p. 245). This logic is known as
causation. Effectual logic is exemplified in the paper as follows: “The host asks the chef to look
through the cupboards in the kitchen for possible ingredients and utensils and then cook a meal. Here,
the chef has to imagine possible menus based on the given ingredients and utensils, select the menu,
and then prepare the meal” (Sarasvathy, 2001, p. 245)”. The difference between both logics is in what
the entrepreneur takes as his/her starting point. If an entrepreneur first looks at the goal (s)he wants to
reach and then focuses on the means to reach that goal, (s)he follows a causal logic. When an
entrepreneur first looks at the available means and decides which effects can be created from combing
those means and therefrom sets a goal, (s)he follows an effectual logic (Sarasvathy, 2001).
One of the key characteristics is that causation determines the customers ex ante and effectuation ex
post i.e. causation is used when the future is predictable and effectuation used when the future is
unpredictable (Sarasvathy, 2001). Therefore, it is argued that causation is the strategy which can be
used in industries where the future is predictable (Sarasvathy et al., 2007). Harms and Schiele (2012)
stick to the principle that the world is a rapidly changing environment, which influences the
entrepreneur and it is therefore comprehensible that it might be more efficient to follow an effectual
logic instead of a causal logic. A year before Sarasvathy et al. (2007) found supporting evidence
among experts as entrepreneurs. 89% of them used effectuation in favour of causation. However, in
contrast to experts, MBA students as entrepreneurs preferred causation over effectuation in 81% of the
cases. The latter is perfectly conceivably, because in business studies it has been taught that decision
makers start by identifying a potential market for a specific product, followed by inventing and
implementing the appropriate marketing strategy for the potential customers in order to acquire
substantial market share; known as the STP-process (Sarasvathy, 2001; Honig, 2004).
12
Sarasvathy (2005) worked on different principles to make both logics clear from both perspectives.
Over the years she came up with five key principles in order to differentiate effectuation from
causation. In current literature, they are known as the patchwork quilt-, affordable loss-, bird-in-hand-,
lemonade-, and the pilot-in-the-plane principle (Sarasvathy, 2005), although Alsos et al. (2014) found
gaps in work published earlier and built upon Sarasvathy’s theory but which approached the relation
between causation and effectuation differently. Previously published work either took causation as
one-dimensional measure (DetTienne and Chandler, 2010), took both methods as direct opposites
from each other (Brettel, Mauer, Engelen & Küpper, 2012; as cited in Alsos et al., 2014) or analysed
the construct of causation and its principles as one (Fisher, 2012). Therefore, Alsos et al. (2014) placed
both effectuation and causation next to each other as two possible entrepreneurial decision-making
strategies, which both consist of a set of five contrasting principles. In general, the five principles are
known as: basis for taking action, view of risk and resources, attitude towards others, attitude towards
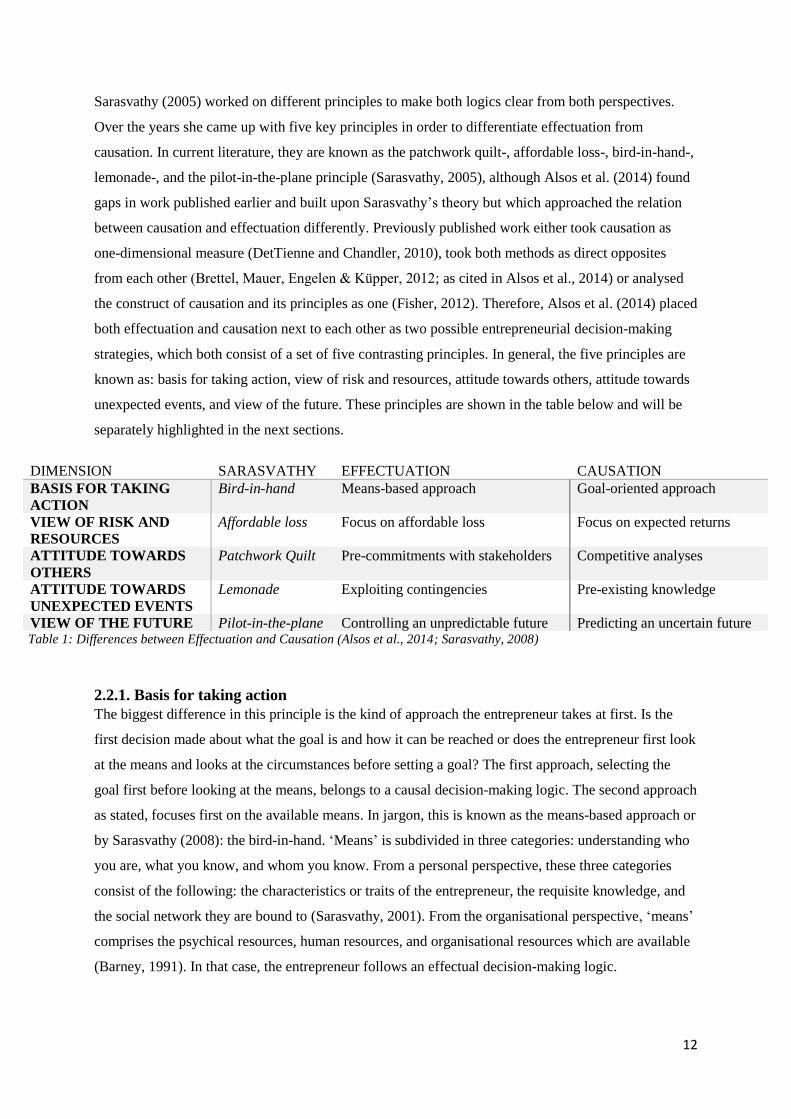
unexpected events, and view of the future. These principles are shown in the table below and will be
separately highlighted in the next sections.
Table 1: Differences between Effectuation and Causation (Alsos et al., 2014; Sarasvathy, 2008)
2.2.1. Basis for taking action
The biggest difference in this principle is the kind of approach the entrepreneur takes at first. Is the
first decision made about what the goal is and how it can be reached or does the entrepreneur first look
at the means and looks at the circumstances before setting a goal? The first approach, selecting the
goal first before looking at the means, belongs to a causal decision-making logic. The second approach
as stated, focuses first on the available means. In jargon, this is known as the means-based approach or
by Sarasvathy (2008): the bird-in-hand. ‘Means’ is subdivided in three categories: understanding who
you are, what you know, and whom you know. From a personal perspective, these three categories
consist of the following: the characteristics or traits of the entrepreneur, the requisite knowledge, and
the social network they are bound to (Sarasvathy, 2001). From the organisational perspective, ‘means’
comprises the psychical resources, human resources, and organisational resources which are available
(Barney, 1991). In that case, the entrepreneur follows an effectual decision-making logic.
DIMENSION SARASVATHY EFFECTUATION CAUSATION
BASIS FOR TAKING
ACTION
Bird-in-hand Means-based approach Goal-oriented approach
VIEW OF RISK AND
RESOURCES
Affordable loss Focus on affordable loss Focus on expected returns
ATTITUDE TOWARDS
OTHERS
Patchwork Quilt Pre-commitments with stakeholders Competitive analyses
ATTITUDE TOWARDS
UNEXPECTED EVENTS
Lemonade Exploiting contingencies Pre-existing knowledge
VIEW OF THE FUTURE Pilot-in-the-plane Controlling an unpredictable future Predicting an uncertain future

13
2.2.2. View of risk and resources
Effectuation focuses on affordable loss, known as the affordable loss-principle of Sarasvathy (2008).
The entrepreneur decides and determines how much loss is acceptable beforehand. Based on that (s)he
makes entrepreneurial decisions with the comprehension and admission that the resources may be lost
(Sarasvathy, 2008; Chandler et. al, 2011). In contrast, entrepreneurs who stick to a causal logic focus
on maximising returns of their investments and select between alternative strategies, the one which has
the highest predictability in terms of returns. If the necessary means are not available, they will be
requested from outside lenders. For this method, a lot of preparation is needed because entrepreneurs
base their decision on complete competitive analysis and the entrepreneur needs to sketch the whole
life cycle of the organisation beforehand (Sarasvathy, 2008; Newbert, 2015; Honig, 2004).
Take as an example an entrepreneur who is about to start a company. In order to acquire knowledge of
the market and competitors he starts to do some analysis because he would want to know something
about the risks and potential returns. In addition, he would do some cost analysis and budgeting and
conclude that he needs €1.5 million to make his dream come true and start his own company. Due to
his father who recently died and left him a legacy and because of his own well-paid job he would only
need €750K and then in the industry concerned it would take only 3 years to become profitable. This
example shows how an entrepreneur who makes decision based on a causal logic acts. In contrast, the
entrepreneur who makes decisions based on an effectual logic first looks how much he can spend and
then designs his business idea. Based on €750K the company will be sketched, formed, and launched.
2.2.3. Attitude towards others
This principle is about the entrepreneur’s perspective on (potential) stakeholders. An entrepreneur who
makes use of an effectual logic looks upon them as positive influencers or allies to some extent,
whereas an entrepreneur who makes use of a causal logic sees them as business opponents. An
effectual logic values alliances and commitments from stakeholders in order to become more certain
and to lower barriers in the industry (Sarasvathy, 2008). One frequent approach then is hooking up to
incumbents and signalling your presence in the industry to others (Zaheer, Gözübüyük & Milanov,
2010). Entrepreneurs following an effectual logic are open for any kind of stakeholders and have them
make commitments to getting engaged in forming the company no matter what the opportunity costs
are because in the future they can get their stake in the company. Therefore, this type of cooperating is
labelled as crazy-quilt or patchwork-quilt (Sarasvathy, 2008). Entrepreneurs, who follow a causal logic
see others as threats because they start the process with a pre-determined goal and expected turnover
for their company. During the business plan phase, they have made a thorough competitive analysis
and consider every entity that can lower their income, make their goal unreachable or steal a slice of
the pie; as a potential threat.
14
2.2.4. Attitude towards unexpected events
The difference in this principle is how an entrepreneur reacts to unforeseen challenges. The goals of
entrepreneurs who follow an effectual logic are not predetermined. They might have a slight idea of
their goal, but their plans will be made along their path and incoming uncertain information will be
seen as guidance in determining their goal (Lindblom, 1959 as cited in Sarasvathy, 2008). Therefore,
this principle is recorded as the lemonade principle and is line with the expression, ‘When life gives
you lemons, make lemonade’ (Sarasvathy, 2008). In other words, unexpected events should be seen as
positive input. The contra-distinction is for entrepreneurs that follow a causal logic, who see
uncertainties as new obstructions to reach their predetermined goal. Those entrepreneurs want to
reduce the chance of getting non-expected outcomes (University of Virginia, 2011). In most cases,
their existing knowledge about innovations or new technology functions as their competitive strength
and if for example unexpected events occur, their whole plan may be discomposed.
2.2.5. View of the future
In this dimension, there is a clear distinction by how forecasting is done. Both approaches want to
control the future as much as possible. However, entrepreneurs who follow a causal logic focus more
on the predictable aspects of the unknown future. They say: ‘To the extent that we can predict the
future, we can control it’. In contrast, entrepreneurs who follow an effectual logic are engaged with the
controllable aspect of the unpredictable future. Their logic is as follows: ‘To the extent that we can
control the future, we do not need to predict it’ (Read, Sarasvathy, Dew, Wiltbank & Ohlsson, 2010;
Sarasvathy, 2008). Sarasvathy (2008) labels this principle as ‘pilot-in-the-plane’ and it is related to
human behaviour. It stems from the idea that you must trust and give responsibility to employees. If
this is the case, all the rest will flow like enabling the automatic pilot mode in the airplane. If
entrepreneurs who follow an effectual logic are given freedom, and are not told that they should
comply with strict formats, agreements, and procedures; they will be able to respond effectively to
new trends and uncertainties (Sarasvathy, 2008).

15
Overall, an entrepreneur who makes decisions based on a causal logic has a goal-oriented approach,
which does not fully depend on the available resources and in some cases, borrows resources to reach
the goal. Furthermore, it focuses on predetermined returns in the coming years, sees others in this
industry as competitors, reacts anxiously to new unexpected events and tries to predict the uncertain
future. This contrasts with the entrepreneur who makes decisions based on an effectual logic and who
has a different view on doing business. Such an entrepreneur first looks at the means, looks at the
resources (s)he can afford to lose and does not expect that the investment will pay off for sure. (S)he
considers others in the industry not as competitors but as allies with whom to cooperate to some
extent. Furthermore, (s)he reacts to unexpected events positively and tries to convert them into
opportunities, and finally (s)he does not try to predict the future but tries to control it as far as it is
possible (Alsos et al., 2014). It is essential to repeat the fact that Sarasvathy (2008) does not view them
as direct opposites but as strategies, while causation fits better in some industries and effectuation in
others. The model of Sarasvathy and Dew (2005) shows the way how effectuation and causation
approach entrepreneurship:
Figure 1: Contrasting causation with effectuation (Sarasvathy & Dew, 2005)

16
2.3. Country’s tightness or looseness When talking about culture, well-educated businesspeople frequently think of Geert Hofstede and his
corresponding dimensions (Wursten & Jacobs, 2013). It is therefore not surprising that his work has
been used in more than 100,000 scientific papers and books since 2009 (as cited in the Social Sciences
Citation Index, 2016). The overall influence of Hofstede in science, education and the business world
is tremendously high, therefore Fang (2010) cited the following: ‘’Hofstede’s masterful capacity to
elaborate the complex phenomenon of culture in simple and measurable terms explains his enormous
popularity’’ (p. 156). However, as an artefact’s popularity grows, more people will question its
robustness. Therefore, over the years Hofstede’s earlier cultural work has been criticised by various
scientists on: among others validity (Schwartz, 1999), generalisability (Dorfman & Howell, 1988),
timing (Sondergaard, 1994; Newman, 1996), delimitation of the world (McSweeney, 2000, as cited in,
Shaiq, Khalid, Akram & Ali, 2011), statistical integrity (Jones, 2007).
In order to get everyone on the same line, this study aims to concretise how the concept of ‘culture’ is
to be perceived and interpreted as a major influential factor in entrepreneurial practice. According to
Hill (1997, as cited Doney, Cannon, and Mullen, 1998), who based his definition on the work of
Kroeber and Kluckhohn (1952), Namenwirth and Weber (1987, as cited in Doney et al., 1998), Clark
(1990, as cited in Doney et al., 1998), and Hofstede (1984, as cited in Doney et al., 1998), culture
means: "A system of values and norms that are shared among a group of people and that when taken
together constitute a design for living" (Doney et al., 1998, p. 607). To give a practical meaning to the
definition: culture is a pattern of unconsciously and partly intangible deeply ingrained behaviour,
which influences the daily life and view of life (Schiffman, Kanuk & Hansen, 2012; Stienstra, Harms,
Van der Ham & Groen, 2012). In culture, one can make a distinction that exists on different levels:
organisational, national, clan and individual culture (Mitchell et al., 2002, as cited in Stienstra et al.,
2012). The distinction between cultures becomes apparent through the ‘Onion Diagram’ of Hofstede
(2010), which consists of four layers: values, rituals, heroes, and symbols. These layers are
experienced differently per group, whereas some groups are different from each other, other groups
can be nearly the same. The values, which belong to the not directly visible part, are known as the core
which makes the distinction between one group and the other (Hofstede, 2010). This gave rise to the
world-famous six dimensions of Hofstede, which are known as: power distance, individualism vs.
collectivism, masculinity vs. femininity, uncertainty avoidance index, long term orientation vs. short
term normative orientation and indulgence vs. restraint (Hofstede, 2010).
17
The national culture will be further analysed since this group of individuals, according to both
Hofstede (2010) and Trompenaars (2007 as cited in Stienstra et al., 2012) is the best representative of
culture. However, instead of adhering to the dimensions by Hofstede, the complementary work by
Gelfand, Nishii and Raver (2006) that deals with national culture in a business environment will be
used. She and her colleagues have looked to cultural differences from a different angle by looking at
how tight and loose cultures are. They expanded on early research in anthropology, sociology, and
psychology which proved the existence of tightness and looseness in cultural differences (Gelfand et
al., 2006). But what does it mean? The essential point is that tightness and looseness function as
complementary to the dimensions by Hofstede and are unique. All the combinations are possible e.g. a
country can be loose and have a high uncertainty avoidance or vice versa which is also applicable to
the other dimensions. Tightness and looseness are related to the influence of social norms and
sanctions on individualistic behaviour. Tight cultures are described as a country’s society which have
strong norms and low tolerance of deviant behaviour, whereas loose cultures are contradictory and
have fewer norms and less tolerance of deviant behaviour (Gelfand et al., 2006).
Tightness and looseness have been caused by a wide variety of both ecologically and human-made
social threats that countries have experienced over the years. If a country faced many threats of this
kind in its history, its willingness of becoming more secure increases (Berry, 1979; Triandis, 1972, as
cited in Gelfand et al., 2011). To reach more security in a country, stricter norms are needed to ensure
that people will show less deviant behaviour. To both frighten and discourage people from showing
intolerant behaviour, individuals who have shown intolerant action will be punished. All these actions
are aimed at creating social coordination for survival (Gelfand et al., 2011). Some examples that can
have a negative impact on the social coordination of a country are: a high population density, resource
shortage, natural disasters, territorial attacks/threats or spread of diseases. Countries that have faced or
are being threatened with such challenges are expected to have strong norms and a low level of
tolerance of deviant behaviour in order to maintain social coordination and to deal with such threats
appropriately. In contrast, countries with less ecological and human-made danger are in need of order
and social coordination to a far less extent, thus having weaker social norms and are less stringent
(Gelfand et al., 2011).

18
People that have been raised in a country that is considered tight or who have been in such a country
for a longer period experience a limited variety of behavioural options. They know that every
behaviour and action will be judged and that they might be punished if their action is not within the
(subjective) range of family, friends, or state. For this reason, they will be more preventive so as to
avoid making mistakes, they will constantly try to act appropriately and in accordance with every
situation, and will have a higher degree of self-monitoring ability. As opposed to this, people who
have been raised in a country that is considered loose or people who have lived in a such a country for
a longer period of time will show opposite behaviour and will have opposite thoughts (Gelfand et al.,
2011). To make it more concrete, Gelfand et al. (2011) exemplified activities where the characteristic
differences between a loose and tight country become clear.
Table 2: Differences between tight- and loose countries (Gelfand et al., 2011)
ACTIVITY: TIGHT COUNTRY: LOOSE COUNTY:
PREVAILING INSTITUTIONS
AND PRACTICES
Narrow socialisation restricting the range of
permissible behaviour
Encourage broad socialisation affording a
broader range of permissible behaviour
GOVERNING SYSTEM Autocratic Democratic
FREEDOM OF SPEECH Different views are being suppressed People are allowed to say nearly anything
MEDIA INSTITUTIONS Restricted content, more laws, and controls Freedom of media
CRIMINAL JUSTICE
SYSTEMS
High monitoring, more severe punishments
more deterrence and high control of crime
Less monitoring/suspicious, appropriate
sanction, less deterrence and low control
of crime
RELIGIOUS PRACTICE More religious people More paganists
CHALLENGES TO SOCIAL
INSTITUTIONS
(DEMONSTRATIONS,
BOYCOTTS, STRIKES)
Less common More freedom to strike or demonstrate in
disagreements
EVERYDAY SITUATIONS IN
LOCAL WORLDS (HOME,
HORECA, SCHOOLS, WORK,
LEISURE FACILITIES ETC.)
Higher range of restricted appropriate
behaviour, higher censuring, little room for
individual judgement
few external constraints
on individuals, afford a wide range of
behavioural options, and leave much room
for individual discretion

19
2.4. Hypotheses The research question consists of various components and in order to answer it, testable hypotheses
will be compiled. The earlier explained components together will be visualised in the conceptual
model below, this will give more clarity on how this study has been constructed.
Figure 2: Conceptual model
As in Sarasvathy et al. (2007) there was evidence that most expert entrepreneurs identified the market
for a product by using effectuation compared to MBA-graduates, who used causation. The difference
between this group is that the expert entrepreneurs mostly make decisions based upon their
experience. They seek for effects by combing the means they have at their disposal. Due to the
presence of their experience they are able to integrate and synthesis this knowledge into a tangible
asset (Boshuizen & Schmidt, 1992; Blume & Covin, 2011). Combing this way of thinking (cognition)
forms the basis of the effective use of intuition (Chase & Ericsson, 1981). It is therefore expected that
entrepreneurs whose decisions are based upon their expertise-intuition system have a propensity to
prefer an effectual logic of decision-making.
𝐻1: Entrepreneurs with an intuitive-experiential thinking style have a propensity to prefer effectual
over causal decision-making.
At the same time, Sarasvathy et al. (2007) proved the that most MBA students used the other
approach, causation, to select a market for a product. This entrepreneurial decision-making process is
based on the logic of prediction. Entrepreneurs tend to do systematic research to gather information,
order that information and spend some time to reasonably analyse that information when they think
that the future is somewhat predictable (Sarasvathy, 2001; Sarasvathy et al., 2007). This is in
alignment with the analytical-rational system of Epstein et al. (1996). Decisions are based upon
analyses: information will be gathered, ordered, if needed split, and processed on a rational level.
Since these both theories comply with each other it is expected that entrepreneurs whose decisions are
based upon their analytical-rational system have a propensity to prefer a causal decision-making logic.
𝐻2: Entrepreneurs with an analytical-rational thinking style have a propensity to prefer causal over
effectual decision-making.

20
This research is examining the role of culture in the entrepreneurial decision-making process as well as
the role of cognition. Culture influences the characteristics of people and can create more
entrepreneurs in a certain country. It is important, since it influences values, motives, and beliefs of
people (Davidsson & Wiklund, 1997). Therefore, Hayton et al. (2011) highlighted the importance of
culture as a component of entrepreneurial decision-making. Since this research has been performed in
Turkey, it is of utmost importance to determine how Turkish entrepreneurs perceive their culture.
Gelfand et al. (2011) surveyed this among various types of individuals and described Turkish culture
as one of the tightest cultures with a score of 9.2. It is interesting to find out whether entrepreneurs
perceive their culture the same as their fellow citizens.
𝐻3: Entrepreneurs from Turkey have the propensity to perceive their culture tight.
Existing scholars suggest that people from tight cultures are more preventive and have a higher need
for structure in order to avoid making mistakes. Everything is tightly planned to minimise possible
deviation (Gelfand et al., 2011). As in the causal decision-making process, first the purpose i.e. goals,
the strategy and resources are defined before starting. During this process, every decision is made to
achieve the stated long-term goals. Short-term goals are considered irrelevant and surprises are seen as
something bad (Sarasvathy, 2001).
Therefore, we expect that entrepreneurs who perceive their country as tight follow the same principles
as causal decision-makers. In Turkey, it is expected that the culture is perceived tight as suggested by
Gelfand et al. (2011) and it is therefore interesting to establish whether Turkish entrepreneurs will
make decisions based on causation. An important side note is that Stienstra et al. (2012) found
contradictory results. Germany, perceived as a tight culture, preferred effectuation over causation. But
Mexico was in line with the hypothesis, since that culture is perceived as tight and entrepreneurs
preferred causation over effectuation. This makes it more attractive to see whether the theory could be
replicated in Turkey as well. Therefore, the following hypothesis is established:
𝐻4: Entrepreneurs from a tight culture have a propensity to prefer causal- over effectual decision
making.
Norenzayan et al. (2002) have proven that there exists a relation between culture and the preference
for either formal (analytic or rule based) or intuitive (experience-based or holistic). They have shown
that East Asian undergraduate students tend to favour analytical reasoning in contrast to European
American university students who rely more on intuitive reasoning. This is supported by Nisbett,
Peng, Choi, and Norenzayan (2001) that an analytic mode of processing information is predominant in
Western cultural countries and that an intuitive mode of thought has been predominated in East Asian
countries.

21
The countries which have been examined are Chinese and Korean for the East-Asian. The Western
countries in this study are Europeans who were emigrated and live in America. The East-Asian
countries are defined as rather tight (China: 7.9 and South Korea: 10.0). The Western countries,
among others the USA, are defined as a looser culture (5.1) and so is the average of the European
countries (5.8) (Gelfand et al., 2011). The average of Europe is taken, since this paper does not
provide more specific information about the European American’s country of origin (Nisbett et al.,
2001). It appears from literature that perceived loose cultures (Western-countries) held an analytic way
of processing whereas perceived tight cultures (East-Asian) held a more intuitive mode of thought.
However, Turkey according to Gelfand et al. (2011), scores a 9.2 and therefore belongs to the category
tight and the people, according to the theory, are expected to prefer an intuitive way of processing
information. This makes it attractive to see whether it also applies in this research.
𝐻5: People from a tight culture have a propensity to process information based on intuition.
People from different national cultures all have their own manner of addressing particular problems or
how to decide (Mitchell et al., 2002). This has been supported by existing academia, who state the
factors that influence venture-creation decisions and business planning diversify across national
cultures (Busenitz, Gomez, & Spencer, 2000; Brinckmann et al., 2010). In Hayton et al. (2002)
evidence has been found that cultural context influences the way how entrepreneurs process
information and that it amplifies entrepreneurs in making decisions. Therefore, it is expected that the
culture moderates between cognition and entrepreneurial decision making. (This also tests the
conceptual model of this research).
𝐻6: The relationship between cognition and entrepreneurial decision-making is affected by the
culture.

22
3. Methodology In this section, the methodology will be examined. First the sample will be described, followed by the
operationalisation of the variables, analyses, and the control variables.
3.1. Sample This research has been conducted using a quantitative method. The sample of this research consists of
Turkish entrepreneurs originating from the country itself, whose own launched venture is not older
than 5 years (start-up) and who are higher educated i.e. at least graduated at a Bachelor level. This
country has been chosen on the basis of both practical- and academical reasons: due to my Turkish
background, I knew how to find the Turkish start-up entrepreneurs and since not many studies about
entrepreneurship have been conducted there. The survey has been sent via University of Twente
Student email and has been drafted by making use of Qualtrics, an online survey tool. In order to find
suitable candidates, AngelList (a website where start-ups can enrol themselves) and TechnoParks
(local high-tech industrial parks belonging to Universities) were used. The following TechnoParks
have been addressed: Eskişehir Teknoloji Geliştirme Bölgesi, Teknopark İstanbul, Bilkent Cyberpark,
Erciyes Teknopark, ODTÜ Teknokent, SUCool, and Teknopark İzmir. These websites show lists of
companies and in most cases their year of founding. After 2,5 weeks about 65 entrepreneurs
responded. At that moment, I decided to send a reminder and in one day 29 people responded. On the
28th of May the survey was closed and the total number of respondents was 103. This number is
consistent with previous theses within the University of Twente on the concept of effectuation.
The 103 respondents included some respondents who did not meet the following requirements:
company older than 5 years, study-level (at least a Bachelor degree), not the founder or raised outside
Turkey (based on the nationalities (s)he had and universities (s)he went to). Furthermore, a control for
outliers on the scales has been carried out. This test is known as the Mahalanobis-distance
(Mahalanobis, 1936) with a threshold of 0.001 (Gemperline & Boyer, 1995). Values below this
threshold indicate the presence of one or more multivariate outliers, which should be excluded since
they can harm the test (Filzmoser, Maronna & Werner, 2004). After filtering these respondents out,
the number was 78.

23
3.2. Scales The questionnaire completed by the respondents included questions about different aspects of
effectuation/causation, influence of culture, and intuitive-experiential/analytical-rational information
processes. These statements were in English and needed to be translated. In cooperation with two
native speakers, who are currently teachers of English and psychology, these statements were
translated into Turkish. The English statements were also mentioned next to the Turkish version in
order to avoid confusion. To make sure that the influence of these variables was measured several
control variables were questioned, among others about age, previous experience in a venture and prior
study. The measurement methods of the variables will be explained in the upcoming section.
3.2.1. Cognition: intuition-experiential vs analytical-rational
The ten-item scale of Epstein et al. measures which cognitive style the entrepreneur uses (1996). This
scale has been used to measure the entrepreneur’s personality and is called the rational-experiential
inventory (REI). The questionnaire was set up to determine the information processing style and has
been widely used in psychology and social cognition literature (Evans, 2008). In the same way, it has
been used to measure cognitive characteristics of entrepreneurs in entrepreneurship literature (Blume
& Covin, 2011; Krueger & Kickul, 2006; Haynie & Shephard, 2009). The scale consists of five
statements about need for cognition (NFC) and five statements about faith in intuition (FI) in order to
determine which cognitive style is preferred. The NFC-scale represents the analytical-rational system
and the FI-scale represent the intuitive-experiential system. These two scales are not contradictory, but
they exemplify two different kinds of independent information processing (Epstein et al., 1996). The
entrepreneurs are expected to give an answer based on a 5-point Likert scale; 1 indicates: I strongly
disagree and 5 indicates: I strongly agree. The REI consists of 3 (1,2 & 5) reversed items. These will
be recoded (1 = 5, 2 = 4, 3 = 3, 4 = 2, and 5 = 1).
24
3.2.2. Entrepreneurial decision-making: effectuation & causation
This research topic and the dependent variables is about the binominal entrepreneurial decision-
making process of effectuation and causation as introduced by Sarasvathy (2001). To operationalise
these concepts, the measurement scale of Alsos et. al (2014) has been used. They revised earlier
measurement scales and found gaps: Chandler et al. (2011) as well as Gabrielsson and Politis (2011)
did not treat effectuation and causation reciprocally or equally, Brettel et al. (2012, as cited in Alsos et
al., 2014)) as well as Wernhan and Brettel (2012 as cited in Alsos et al., 2014)) failed to treat
effectuation and causation as contrasting, Chandler et al. (2011), da Costa and Brettel (2011) as well
as Johansson and McKelvie (2012) lacked construct and discriminant validity in their research, Brettel
et al., (2012), Chandler et al. (2011) as well as Da Costa & Brettel (2011) had a low internal reliability
in their research and finally Brettel et al. (2012), Da Costa & Brettel, (2011), DeTienne & Chandler,
(2010), Gabrielsson & Politis, (2011), Johansson & McKelvie, (2012) as well as Werhahn & Brettel,
(2012) lacked criterion validity in their scale. Alsos et al. (2014) tried to improve these shortcomings
and introduced a 10-item questionnaire with a high reliability and validity on both decision-making
processes. Thus, it accurately measures effectuation and causation, it also includes the five principles
in order to measure effectuation properly. The respondents can answer in the range from 1 to 7, where
1 is ‘I strongly disagree’ and 7 is ‘I strongly agree’ (Alsos et al., 2014).
3.2.3. National culture: tightness vs looseness
In order to measure how entrepreneurs, experience their own national culture, the scale based upon the
theory of Gelfand et al. (2011) has been used and the participants have been asked to assess the degree
to which social norms and sanctioning exists in their country. The questionnaire covers 6 statements
about tightness and looseness. Answers on the questionnaire could be given between 1, indicating
strong disagreement and 6, indicating strongly agreement. The higher the scores given, the tighter the
national culture is perceived. This scale consists of 1 (4) reversed item, this will be recoded (1 = 6, 2 =
5, 3 = 4, 4 = 3, 5 = 2, and 6 = 1)

25
3.3. Method of analysis
The application IBM SPSS Statistics 23.0 has been used to analyse the results of the survey. The first
analysis is known as the reliability analysis followed by the explanatory factor analysis, and by the
distribution-testing.
3.3.1. Reliability analysis
In order to ascertain whether the survey measures what it should measure, the construct will be tested
among the several scales in this study (Dooley, 2001). A tool for that is Cronbach’s Alpha. This tests
the internal consistency of the statements in the survey (Dooley, 2001). The threshold is somewhat
arbitrary as well. Hair et. al (2010) have set 0.7 as acceptable, whereas Loewenthal (2001) accepts 0.6,
though under strict conditions. In several scholars, the threshold for acceptance ranges from 0.7 to
0.95 (Nunnally & Bernstein, 1994; Bland & Altman, 1997; DeVilles, 2016) and therefore the support
for the outcome is highly important (Takavol & Dennick, 2011). An important note has been made by
Sijtsma (2009), who states that Cronbach’s Alpha underestimates the true reliability, and that it should
be seen as a lower boundary to the reliability. Thus, in theory it is possible that the Alpha can be
higher than the outcome.
First the Cronbach’s Alpha has been tested for the cognition scales. The α for the NFC scale is 0.455.
At this moment this is unacceptable, but the reliability can be improved to an acceptable level when
the 4th statement: ‘’I prefer complex to simple problems’’ gets removed. It is expected that this
statement will conflict in the factor analysis as well. The α for the FI scale is 0.782 indicating a good
reliable measurement level. For the scales of Alsos et al. (2014) to measure effectuation and causation
both Cronbach’s Alphas are at an acceptable level. The scale of causation has an α of 0.625 and the α
of effectuation is 0.648. The scales without NFC are not highly acceptable and as Loewenthal (2001)
suggests these levels are acceptable under strict conditions. Streiner (2003) gives a possible
explanation why this is the case. He states that the length of the scale can have a negative influence on
the alpha level as well. Since the scales in this research are relatively small, this suggestion may not be
excluded. Furthermore, since this research is of exploratory nature i.e. therefore less bounded by strict
rules, it is imaginable that the Cronbach’s alpha is lower as well (Hair et al., 2010).
26
3.3.2. Factor analysis
This analysis identifies the underlying structure of the variables used in this survey and tests whether
there is a relation between the variables (Hair, Black, Babin & Anderson, 2010). This type of factor
analysis fits better than its alternative, confirmatory factor analysis, since we have no prior knowledge
of the possible relations. Thus, we generate new hypotheses instead of confirming existing ones (Hair
et al., 2010). To test whether factor analysis is the right tool, the sampling adequacy should be checked
by applying the Kaiser-Meyer-Olkin (KMO) test because KMO tests whether correlations between
pairs of variables can or cannot be explained by other variables (Cerny & Kaiser, 1977). This
threshold is set at 0.5, which is acceptable. At least 0.7 is preferable. However, below 0.5 means that
the data has widespread correlations, which make the data unsuitable for a factor analysis (Hair et al.,
2010). The rotation technique that has been used is varimax, since we expect no relation between the
variables during the rotation (Field, 2009). The last part of the factor analysis is Bartlett’s Test of
Sphericity. Here, the assumption that will be tested is about whether one deals with an identity matrix
or not, i.e. a problem exists here because of a low correlation between variables. This will be tested
using a 0-hypothesis, indicating that the population variances are equal (identity matrix). The
alternative hypothesis states that at least one population has a different variance with respect to the
others (α <0.05) (Hair et al., 2010). Normally, the choice of extraction between the principal
component and common factor should depend on the amount of measurement error expected in the
survey. Principal component analysis will be used to stay consistent with Chandler, DeTienne,
McKelvie, and Mumford (2011) as well as with Harms and Schiele (2012), who have done research on
the concept of effectuation as well.
Cognition scale (REI):
The correlations between the variables of cognition have been looked at. In this stage, it becomes
evident how much the variables correlate with each other and whether measurement error plays a part.
When looking at the variables it becomes clear that, as expected, the variables indicating causation
correlate negatively with the variables that indicate effectuation. Furthermore, Kaiser-Meyer-Olkin
(KMO) is a statistic that determines whether the sample is adequate and indicates whether the
variables should be reconsidered or whether more respondents are needed. This is the case when the
KMO < 0.5 (Field, 2009). In this case the KMO is 0.73 indicating a good and adequate sample size.
To ensure for this issue that the data are being organised as an identity matrix, Bartlett’s Test of
Sphericity has been carried out. Identity matrix means that every individual variable correlates
extremely low with all the other variables (Field, 2009) i.e. there is no relation between the items in
the scale. The p-value is < 0.001 indicating that we can reject the hypothesis stating that there is an
identity matrix (Henseler, 2016).

27
Furthermore, it has been assumed that in these scales not a lot of measurement error is being expected
(Hair et al., 2010) and therefore principal component analysis will be used. Since we deal with two
principles (NFC and FI), it is expected that two factors will appear (Eigenvalue >1.0). However, this is
not the case. There are 3 factors standing out, all the statements indicate that NFC and FI correlate
well with each other, however the 4th statement of NFC ‘’I prefer complex to simple problems’’ stands
on its own as expected and the third factor only correlates highly with the 3rd NFC variable: ‘’ I prefer
to do something that challenges my reasoning abilities rather than something that requires little
thought’’. Also after rotating this remains still the case. See the original component matrix below.
FACTOR 1 FACTOR 2 FACTOR 3
FI 1 0.395 NFC 1 0.801
FI 2 0.679 NFC 2 0.631
FI 3 0.826 NFC 3 0.386 NFC 3 0.748
FI 4 0.838 NFC 4 -0.165 NFC 4 0.680
FI 5 0.842 NFC 5 0.740 Table 3: Factor analysis (after rotation) on FI & NFC
Instead of running a factor analysis based on the eigenvalue of 1.0, I tried to limit the number of
factors to 2. Here it became evident again that the 4th statement is conflicting.
Effectuation vs Causation scale:
For effectuation and causation, the KMO is 0.69 thus indicating a good and adequate sample size. The
Bartlett’s Test of Sphericity is (P-value) < 0.001 as well indicating that there is no identity matrix in
this scale. For the correlation, the same problem appears as in the previous scale. The third statement
of causation: ‘’ We work systematically in order to achieve long-term goals and do not consider short-
term opportunities’’ conflicts with his original scale and stands on its own.
FACTOR 1 FACTOR 2 FACTOR 3
CAUS 1 0.384 EFFE 1 0.845
CAUS 2 0.697 EFFE 2 0.805
CAUS 3 0.018 EFFE 3 0.298 CAU 3 0.677
CAUS 4 0.693 EFFE 4 0.527
CAUS 5 0.770 EFFE 5 0.546 Table 4: Factor analysis on causation & effectuation
Running this tool by limiting the number of factors to two, increases the loading (Caus. 3: 0.190
0.291), but in the meantime lowers the power of some of the variables in both factors. Therefore, it
will not be changed.

28
Monte Carlo simulation
Based on the theory, it was expected that the factor analysis would only produce four factors in total
(NFC & FI and causation & effectuation). However, it became clear that at both times the factor
analysis was run, that instead of two factors, three factors popped up. A possible explanation could be
the limited number of respondents and the need for control of this matter, which resulted in the use of
the Monte Carlo simulation for this research.
This statistical method is used to calculate with probabilistic or stochastic systems i.e. this method
stimulates and relies on repeated random sampling to obtain results. Scientists mostly make use of this
method when there are a lot of uncertainties expected in their research. For example, when it is
expected that a single simulation (based on one sample) does not sufficiently represent the truth or the
population. Furthermore, due to the algorithm of Monte Carlo, SPSS is able to stimulate about (or
less) than 10,000 ‘samples’ based upon the data that have been used in these tests (Murthy, 2004;
Matala, 2008). Besides that, in Monte Carlo one is not fixed to the widely accepted threshold in factor
analysis to compute factors that have at least an eigenvalue of 1.0 (Matsunaga, 2010). In Monte Carlo,
these eigenvalues are based on raw data eigenvalues and percentile (based on confidence level)
random data eigenvalues.
Unfortunately, this tool is no longer provided by SPSS and therefore has been used by making use of
specific codes which have been entered and conducted via Syntax. O’Connor (2000) provided these
codes and therefore it was possible to carry this method out.
As in the factor analysis, all the NFC and FI statements have been taken together totalling a number of
10 statements. Based on 1000 samples and 95% confidence, the Monte Carlo simulation indicated two
factors (the raw data EV that are higher than the random data EV are the factors). The same shows for
the causation and effectuation statements. Under the same conditions, Monte Carlo indicated two
factors as well. This meets the theory of both Epstein et al. (1996) and Alsos et al. (2014). An
overview of the values:
NFC & FI Causation & Effectuation
Raw Data EV Random Data EV Raw Data EV Random Data EV
2,235217 1,787377 (1) 3,074706 1,787377 (1)
1,890136 1,533691 (2) 1,7701188 1,533691 (2)
1,280536 1,356080 1,245155 1,356080
1,112512 1,220916 0,865754 1,220916
Table 5: Monte Carlo Simulation NFC & FI and Causation & Effectuation

29
3.3.3. Normal distribution
Multiple methods have been used to test whether data are approximately normally distributed. This
means that the, the testable variables are approximately symmetrically bell-shaped curved. It is highly
essential that the dependent variables are being assessed, since the independent variables are not based
on possible relations in this research. To exemplify, the choice of effectual/ causal decision-making
can be influenced by the gender. However, the gender cannot be influenced by effectual or causal
decision making. An overview of the concepts and their distribution is shown below. The appendix
provides more elaboration on the plots, Shapiro & Wilk, and the kurtosis of the concepts is given.
Dependent variables Outcome
Need for cognition (NFC) Normal distribution
Faith in Intuition (FI) Non-normal distribution (due to skewness)
Causation Normal distribution
Effectuation Normal distribution
Gelfand Tightness- Looseness Normal distribution Table 6: Distribution of variables
To ensure that all variables are treated equally, this research will be continued by treating the data as
approximately normally-distributed. Looking at the graphs, which give a good indication, all the
variables are bell-shaped, the dots are in the normal Q-Q plots along the line, and the outcomes (based
on Shapiro & Wilk, kurtosis, and significance level) apart from the variable Faith in Intuition, were
approximately normally distributed.
3.4. Control variables Test variables could always be influenced by other variables than the independent ones. These should
be controlled to ensure that the results are not being influenced by them. The control variables in our
case are: (1) gender. Bardasi, Sabarwal and Terrel (2011) have found significant results that gender
can influence the entrepreneurial decision-making process. (2) Age and (3) previous working
experience as well as (4) entrepreneurial experience could have an influence. Shepherd, Zacharakis
and Baron (2003) show that experience influences the decision-making, although not entirely positive
in some cases, but still has an effect. The last control variable is about a distinction between the study
of the entrepreneurs. Entrepreneurs, who graduated from a (5) STEM-discipline (technology,
engineering, and mathematics-related studies) and who did not graduate from a STEM-discipline
could influence the results as well. Berry (1996) states that the mindset of these type of entrepreneurs
is different and that they pay more attention to the technical aspects of their business ideas. He,
therefore, argues that STEM entrepreneurs make sense of their business opportunity in another way
than non-STEM entrepreneurs. Based upon the overview of STEM-studies provided by ICE (2012) the
studies have been either categorised as 1: STEM, 2: non-STEM or 3: Both. Both mean that the
entrepreneur both had a background in a STEM and non-STEM studies. All these variables say
something about the entrepreneur and these could be the basis of them making certain entrepreneurial
decisions and should therefore be controlled.

30
4. Results
4.1. Descriptive statistics The testable sample consists of (n=) 78 Turkish higher educated start-up entrepreneurs. All the
respondents have only one nationality, which is the Turkish one (n=78). The variable gender has been
looked at in this sample. It appeared that N=71 males (91%) and N=7 females (9%) have filled in the
survey. This distinction was expected since Turkey had approximately 7.5% of women at the top in
2012, although this percentage is growing it still will not be equally divided (Ökten, 2015). The age of
the entrepreneurs ranges from (min) 24 to (max) 54 with an average (x̄) of 33 years old (σ = 6.149).
The entrepreneurs have entrepreneurial experience of 4.4 years on average (x̄) (σ = 3.541). This ranges
from only 8 months experience to 20 years of entrepreneurial experience (excluding one case since he
gave the same figure for his age than for his entrepreneurial experience =38, thus in this case n=80).
Most entrepreneurs are active in the ICT-industry (n=35), followed by the manufacturing (n=10). 66 of
the respondents only operate in Turkey with their company and 12 operate outside Turkey as well. 4
respondents did not fill in in which specific country they were operating outside Turkey. The most
frequently mentioned country abroad is the USA (n=6). All 78 were the founders of the companies,
however 2 are not the owner at this moment anymore.
Looking at the spread of the type of studies followed by the entrepreneurs, it appears that 59 (75.6%)
entrepreneurs have finished a STEM study. 12 (15.4%) followed a non-STEM study, 4 (5.1%) have
studied both a STEM and non-STEM study and 3 (3.8%) did not fill in their type of study. 52 (66.7%)
followed courses related to entrepreneurship and 26 (33.3%) did not. Fewer entrepreneurs ever
followed courses related to Business Administration/ Management, only 40 (51.3%) and 38 did not
(48.7%). 29 entrepreneurs (37.2%) know the term effectuation or have heard about it. 49 (62.8%)
entrepreneurs did not and this could be due to the fact that these terms were introduced in 2001 and
that there are universities where this is not covered (Sarasvathy, 2001).
The NFC-statements have a mean (x̄) of 3.70 (σ = 0.636) and the FI-statements have a mean (x̄) of
3.52 (σ = 0.651). Here, the differences are minute. Further elaboration is therefore needed. The second
measured scale is about causation and effectuation. The mean (x̄) of the causation-measuring
statements is 3.86 (σ = 0.564) and the mean (x̄) of the effectuation-measuring statements is 2.80 (σ =
0.746). In this scale, the difference is much clearer. It shows that causation is preferred among this
sample.
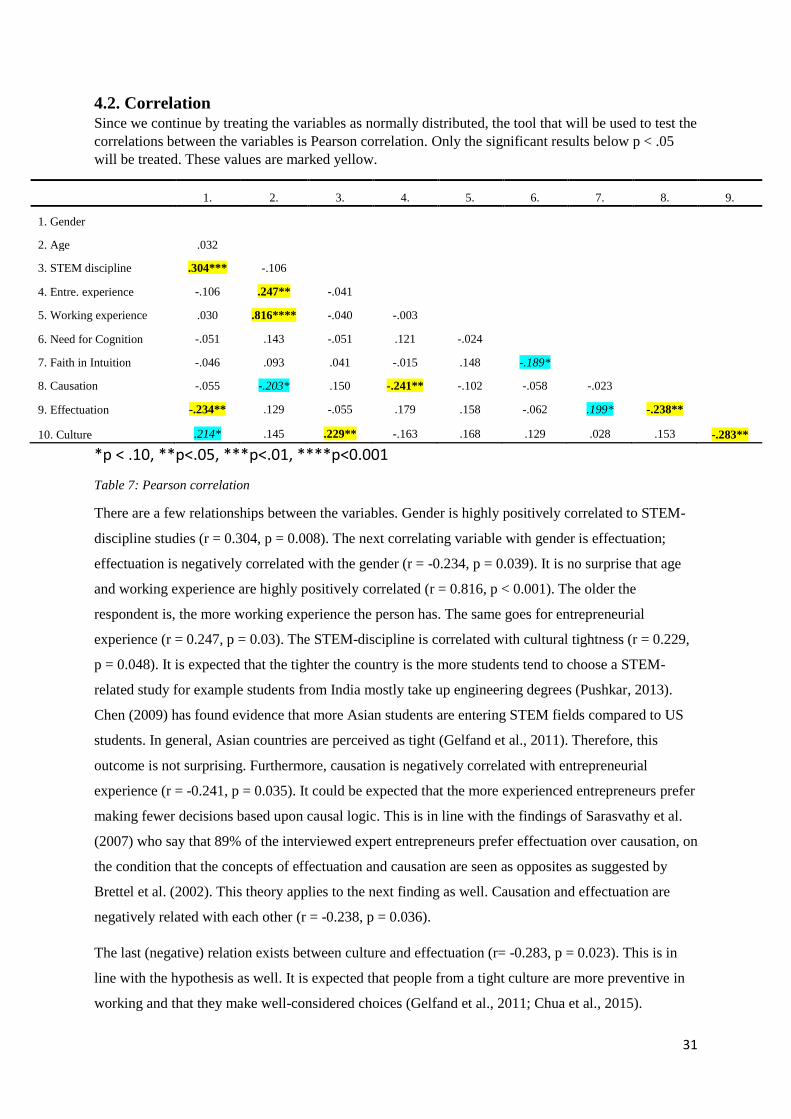
31
4.2. Correlation Since we continue by treating the variables as normally distributed, the tool that will be used to test the
correlations between the variables is Pearson correlation. Only the significant results below p < .05
will be treated. These values are marked yellow.
1. 2. 3. 4. 5. 6. 7. 8. 9.
1. Gender
2. Age .032
3. STEM discipline .304*** -.106
4. Entre. experience -.106 .247** -.041
5. Working experience .030 .816**** -.040 -.003
6. Need for Cognition -.051 .143 -.051 .121 -.024
7. Faith in Intuition -.046 .093 .041 -.015 .148 -.189*
8. Causation -.055 -.203* .150 -.241** -.102 -.058 -.023
9. Effectuation -.234** .129 -.055 .179 .158 -.062 .199* -.238**
10. Culture .214* .145 .229** -.163 .168 .129 .028 .153 -.283**
*p < .10, **p<.05, ***p<.01, ****p<0.001
Table 7: Pearson correlation
There are a few relationships between the variables. Gender is highly positively correlated to STEM-
discipline studies (r = 0.304, p = 0.008). The next correlating variable with gender is effectuation;
effectuation is negatively correlated with the gender (r = -0.234, p = 0.039). It is no surprise that age
and working experience are highly positively correlated (r = 0.816, p < 0.001). The older the
respondent is, the more working experience the person has. The same goes for entrepreneurial
experience (r = 0.247, p = 0.03). The STEM-discipline is correlated with cultural tightness (r = 0.229,
p = 0.048). It is expected that the tighter the country is the more students tend to choose a STEM-
related study for example students from India mostly take up engineering degrees (Pushkar, 2013).
Chen (2009) has found evidence that more Asian students are entering STEM fields compared to US
students. In general, Asian countries are perceived as tight (Gelfand et al., 2011). Therefore, this
outcome is not surprising. Furthermore, causation is negatively correlated with entrepreneurial
experience (r = -0.241, p = 0.035). It could be expected that the more experienced entrepreneurs prefer
making fewer decisions based upon causal logic. This is in line with the findings of Sarasvathy et al.
(2007) who say that 89% of the interviewed expert entrepreneurs prefer effectuation over causation, on
the condition that the concepts of effectuation and causation are seen as opposites as suggested by
Brettel et al. (2002). This theory applies to the next finding as well. Causation and effectuation are
negatively related with each other (r = -0.238, p = 0.036).
The last (negative) relation exists between culture and effectuation (r= -0.283, p = 0.023). This is in
line with the hypothesis as well. It is expected that people from a tight culture are more preventive in
working and that they make well-considered choices (Gelfand et al., 2011; Chua et al., 2015).
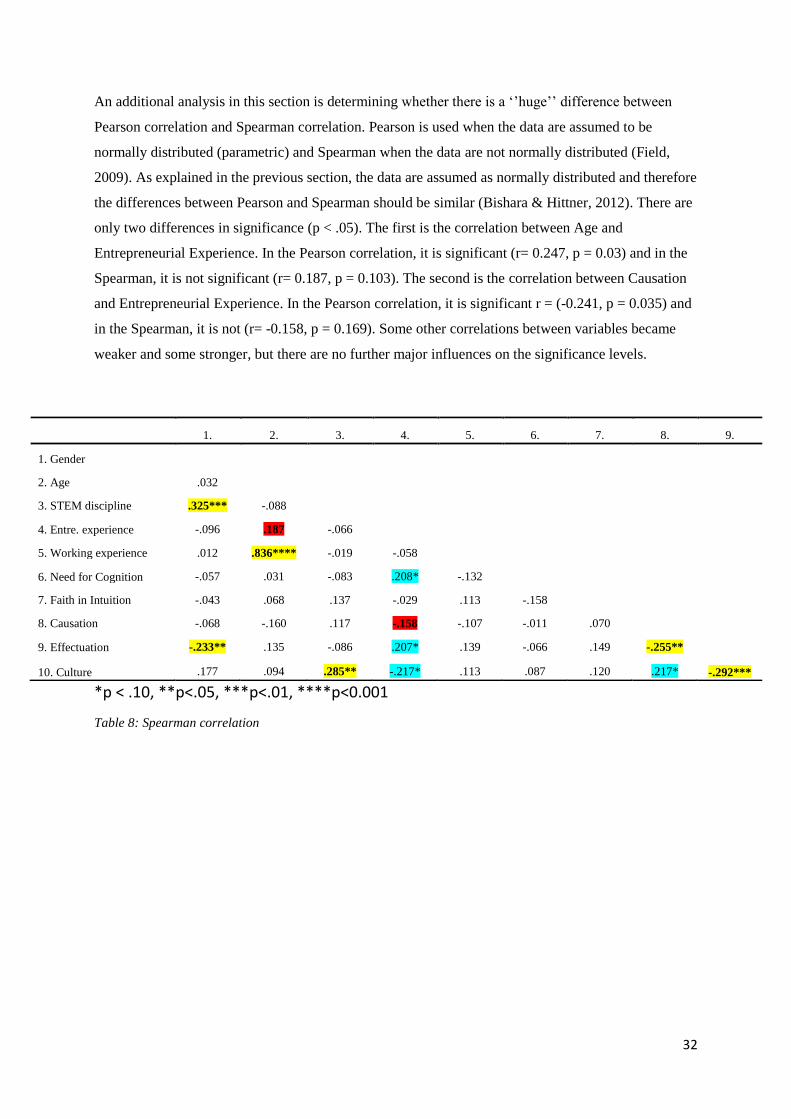
32
An additional analysis in this section is determining whether there is a ‘’huge’’ difference between
Pearson correlation and Spearman correlation. Pearson is used when the data are assumed to be
normally distributed (parametric) and Spearman when the data are not normally distributed (Field,
2009). As explained in the previous section, the data are assumed as normally distributed and therefore
the differences between Pearson and Spearman should be similar (Bishara & Hittner, 2012). There are
only two differences in significance (p < .05). The first is the correlation between Age and
Entrepreneurial Experience. In the Pearson correlation, it is significant (r= 0.247, p = 0.03) and in the
Spearman, it is not significant (r= 0.187, p = 0.103). The second is the correlation between Causation
and Entrepreneurial Experience. In the Pearson correlation, it is significant r = (-0.241, p = 0.035) and
in the Spearman, it is not (r= -0.158, p = 0.169). Some other correlations between variables became
weaker and some stronger, but there are no further major influences on the significance levels.
1. 2. 3. 4. 5. 6. 7. 8. 9.
1. Gender
2. Age .032
3. STEM discipline .325*** -.088
4. Entre. experience -.096 .187 -.066
5. Working experience .012 .836**** -.019 -.058
6. Need for Cognition -.057 .031 -.083 .208* -.132
7. Faith in Intuition -.043 .068 .137 -.029 .113 -.158
8. Causation -.068 -.160 .117 -.158 -.107 -.011 .070
9. Effectuation -.233** .135 -.086 .207* .139 -.066 .149 -.255**
10. Culture .177 .094 .285** -.217* .113 .087 .120 .217* -.292***
*p < .10, **p<.05, ***p<.01, ****p<0.001
Table 8: Spearman correlation

33
4.3. Tightness/Looseness score Finally, the entrepreneurs’ perceptions of tightness/looseness have been compared to the scores
Gelfand and colleagues have given for that specific country. However, Gelfand et al. (2011) make use
of standardised scores and since answers on their questionnaire should be given based on a 6-point
Likert scale, some modification is needed. The average scores should be calculated and standardised to
compare the findings of Gelfand with the scores of the entrepreneurs (Eun, Wang, and Xiao, 2015).
For Turkey, the mean (x̄) based upon the six-point-Likert scale is 3.69 (σ = 0.744) indicating that the
country tends to be perceived tight. It appeared, after discussion with experts on the field of
methodology, that with the information revealed it is impossible to get to the final index scores as
computed by Gelfand et al. (2011). All the outcomes of the survey have been translated to a within-
subject standardised score and have been multiplied by 10 as suggested by Eun et al. (2015). However,
the indexed tightness score was not in line with the scores proposed by Gelfand et al. (2011).
Therefore, the mean (x̄) as calculated before will be used as base for further research. This is in line
with the methodology of Rauch et al. (2013) who made use of the mean values to operationalise
cultural practises as perceived by business owners.
As previously suggested the 4th statement: ‘’People in this country have a great deal of freedom in
deciding how they want to behave in most situations’’ is reversed coded. Since we do not stick to
Gelfand et al. (2011), the mean of this score (without reversing) should be compared and checked
whether it differs notably. With reversing the scores were x̄ = 3.69 (σ = 0.744) and without reversing
the scores are x̄ = 3.29 (σ = 0.926). Both scores still indicate that the country tends to be perceived
tight and that the differences are minimal, therefore the original outcome (with reversing the 4th item)
according to Gelfand et al. (2011) will be used.
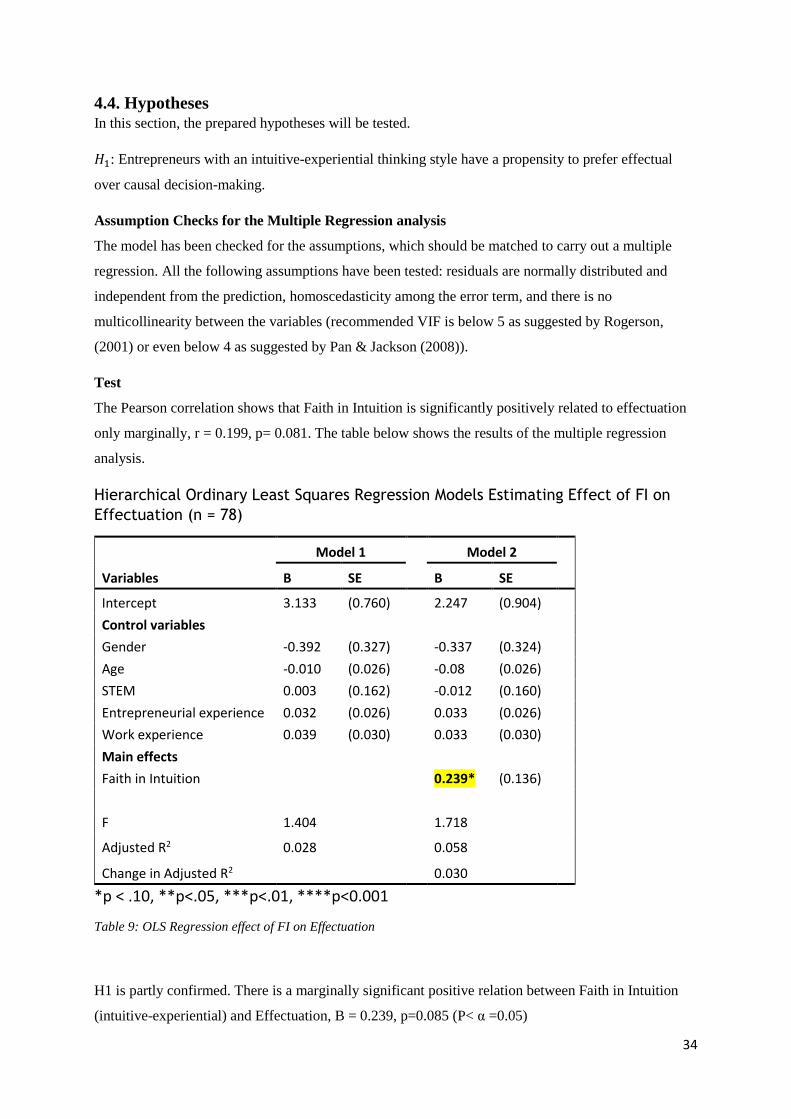
34
4.4. Hypotheses In this section, the prepared hypotheses will be tested.
𝐻1: Entrepreneurs with an intuitive-experiential thinking style have a propensity to prefer effectual
over causal decision-making.
Assumption Checks for the Multiple Regression analysis
The model has been checked for the assumptions, which should be matched to carry out a multiple
regression. All the following assumptions have been tested: residuals are normally distributed and
independent from the prediction, homoscedasticity among the error term, and there is no
multicollinearity between the variables (recommended VIF is below 5 as suggested by Rogerson,
(2001) or even below 4 as suggested by Pan & Jackson (2008)).
Test
The Pearson correlation shows that Faith in Intuition is significantly positively related to effectuation
only marginally, r = 0.199, p= 0.081. The table below shows the results of the multiple regression
analysis.
Hierarchical Ordinary Least Squares Regression Models Estimating Effect of FI on
Effectuation (n = 78)
Variables
Model 1 Model 2
B SE B SE
Intercept 3.133 (0.760) 2.247 (0.904)
Control variables
Gender -0.392 (0.327) -0.337 (0.324)
Age -0.010 (0.026) -0.08 (0.026)
STEM 0.003 (0.162) -0.012 (0.160)
Entrepreneurial experience 0.032 (0.026) 0.033 (0.026)
Work experience 0.039 (0.030) 0.033 (0.030) Main effects
Faith in Intuition 0.239* (0.136)
F 1.404 1.718
Adjusted R2 0.028 0.058
Change in Adjusted R2 0.030
*p < .10, **p<.05, ***p<.01, ****p<0.001
Table 9: OLS Regression effect of FI on Effectuation
H1 is partly confirmed. There is a marginally significant positive relation between Faith in Intuition
(intuitive-experiential) and Effectuation, B = 0.239, p=0.085 (P< α =0.05)
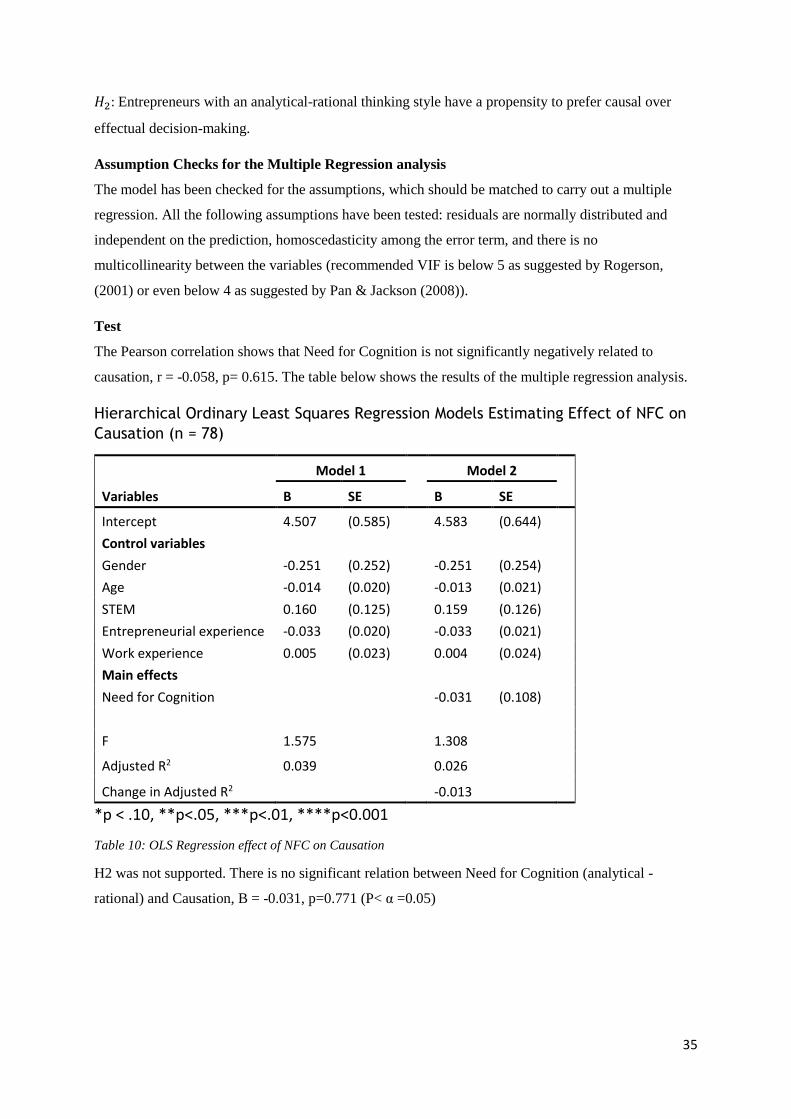
35
𝐻2: Entrepreneurs with an analytical-rational thinking style have a propensity to prefer causal over
effectual decision-making.
Assumption Checks for the Multiple Regression analysis
The model has been checked for the assumptions, which should be matched to carry out a multiple
regression. All the following assumptions have been tested: residuals are normally distributed and
independent on the prediction, homoscedasticity among the error term, and there is no
multicollinearity between the variables (recommended VIF is below 5 as suggested by Rogerson,
(2001) or even below 4 as suggested by Pan & Jackson (2008)).
Test
The Pearson correlation shows that Need for Cognition is not significantly negatively related to
causation, r = -0.058, p= 0.615. The table below shows the results of the multiple regression analysis.
Hierarchical Ordinary Least Squares Regression Models Estimating Effect of NFC on
Causation (n = 78)
Variables
Model 1 Model 2
B SE B SE
Intercept 4.507 (0.585) 4.583 (0.644)
Control variables
Gender -0.251 (0.252) -0.251 (0.254)
Age -0.014 (0.020) -0.013 (0.021)
STEM 0.160 (0.125) 0.159 (0.126)
Entrepreneurial experience -0.033 (0.020) -0.033 (0.021)
Work experience 0.005 (0.023) 0.004 (0.024) Main effects
Need for Cognition -0.031 (0.108)
F 1.575 1.308
Adjusted R2 0.039 0.026
Change in Adjusted R2 -0.013
*p < .10, **p<.05, ***p<.01, ****p<0.001
Table 10: OLS Regression effect of NFC on Causation
H2 was not supported. There is no significant relation between Need for Cognition (analytical -
rational) and Causation, B = -0.031, p=0.771 (P< α =0.05)
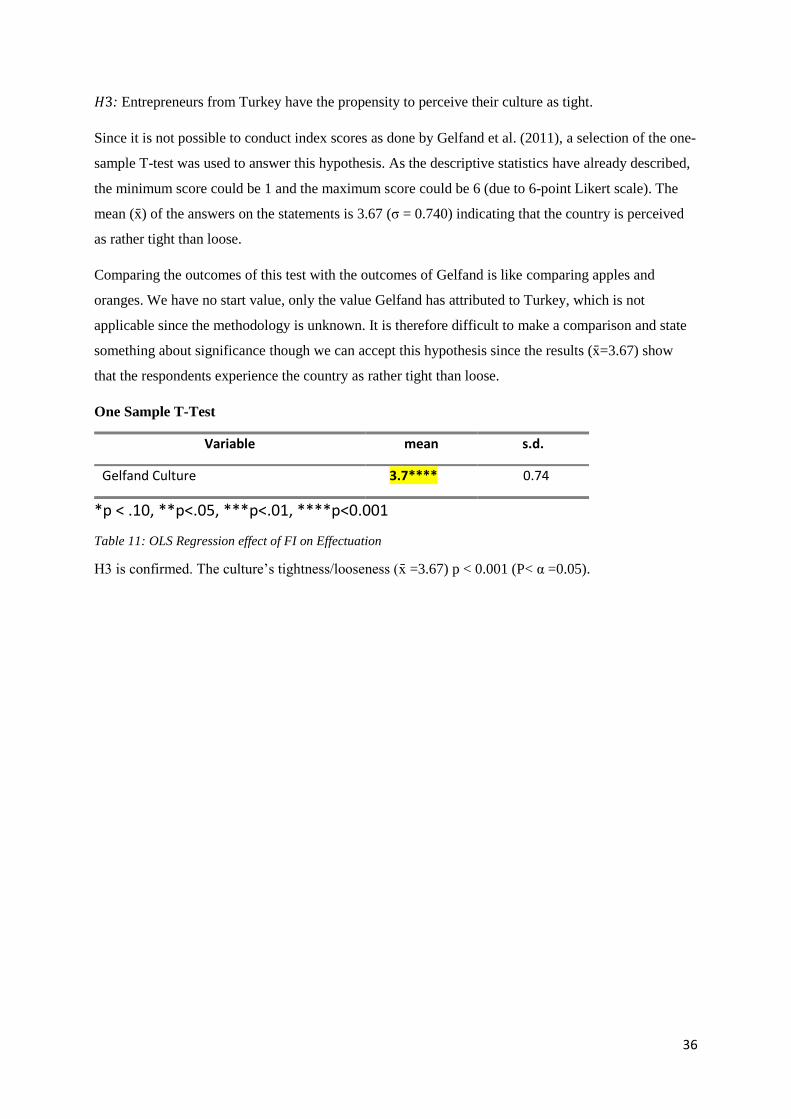
36
𝐻3: Entrepreneurs from Turkey have the propensity to perceive their culture as tight.
Since it is not possible to conduct index scores as done by Gelfand et al. (2011), a selection of the one-
sample T-test was used to answer this hypothesis. As the descriptive statistics have already described,
the minimum score could be 1 and the maximum score could be 6 (due to 6-point Likert scale). The
mean (x̄) of the answers on the statements is 3.67 (σ = 0.740) indicating that the country is perceived
as rather tight than loose.
Comparing the outcomes of this test with the outcomes of Gelfand is like comparing apples and
oranges. We have no start value, only the value Gelfand has attributed to Turkey, which is not
applicable since the methodology is unknown. It is therefore difficult to make a comparison and state
something about significance though we can accept this hypothesis since the results (x̄=3.67) show
that the respondents experience the country as rather tight than loose.
One Sample T-Test
Variable mean s.d.
Gelfand Culture 3.7**** 0.74
*p < .10, **p<.05, ***p<.01, ****p<0.001
Table 11: OLS Regression effect of FI on Effectuation
H3 is confirmed. The culture’s tightness/looseness (x̄ =3.67) p < 0.001 (P< α =0.05).

37
𝐻4: Entrepreneurs from a tight culture have a propensity to prefer causal- over effectual decision
making.
Assumption Checks for the Multiple Regression analysis
The model has been checked for the assumptions, which should be matched to carry out a multiple
regression. All the following assumptions have been tested: residuals are normally distributed and
independent from the prediction, homoscedasticity among the error term, and there is no
multicollinearity between the variables (recommended VIF is below 5 as suggested by Rogerson,
(2001) or even below 4 as suggested by Pan & Jackson (2008)).
Test
The Pearson correlation shows that a tight culture is not significantly positively related to a tight
culture, r = 0.153, p= 0.182. The table below shows the results of the multiple regression analysis.
Hierarchical Ordinary Least Squares Regression Models Estimating Effect of Culture
on Causation (n = 78)
Variables
Model 1 Model 2
B SE B SE
Intercept 4.507 (0.585) 4.203 (0.638)
Control variables
Gender -0.251 (0.252) -0.300 (0.255)
Age -0.014 (0.020) -0.016 (0.020)
STEM 0.160 (0.125) 0.133 (0.127)
Entrepreneurial experience -0.033 (0.020) -0.030 (0.021)
Work experience 0.005 (0.023) 0.004 (0.023) Main effects
Gelfand 0.115 (0.098)
F 1.575 1.552
Adjusted R2 0.039 0.045
Change in Adjusted R2 0.004
Table 12: OLS Regression effect of culture on Causation
H4 was not supported. There is no significant relation between a tight culture (x̄ =3.67) and Causation,
B = 0.115, p=0.243 (P< α =0.05). However, surprisingly there is a marginally negatively significant
relation between a tight culture (x̄ =3.67) and Effectuation: B= -.242, p = .057 (P< α =0.05).

38
𝐻5: Entrepreneurs from a tight culture have a propensity to process information based on intuition.
Assumption Checks for the Multiple Regression analysis
The model has been checked for the assumptions, which should be matched to carry out a multiple
regression. All the following assumptions have been tested: residuals are normally distributed and
independent from the prediction, homoscedasticity among the error term, and there is no
multicollinearity between the variables (recommended VIF is below 5 as suggested by Rogerson,
(2001) or even below 4 as suggested by Pan & Jackson (2008)).
Test
The Pearson correlation shows that a tight culture is not significant positive related to intuition, r =
0.028, p= 0.807. The table below shows the results of the multiple regression analysis. In this case, the
control variable age is taken into account since the older a person is the more (s)he will be aware of
the home culture. The only control variables in this case are gender and age. The older people get, the
more familiar they will be with their culture (Seginer & Halabi-Kheir, 1998) and for a woman or a
man culture can be experienced differently (Bagozzi, Wong & Youjae Yi, 1999).
Hierarchical Ordinary Least Squares Regression Models Estimating Effect of Culture
on Faith in Intuition (n = 78)
Variables
Model 1 Model 2
B SE B SE
Intercept 3.312 (0.492) 3.253 (0.562)
Control variables
Gender -0.111 (0.260) -0.123 (0.268)
Age 0.010 (0.012) 0.10 (0.012) Main effects
Gelfand 0.023 (0.105)
F 0.416 0.291
Adjusted R2 -0.015 -0.028
Change in Adjusted R2 -0.013
Table 13: OLS Regression effect of culture on FI
H5 was not supported. There is no significant relation between a tight culture (x̄ =3.67) and Faith in
Intuition (intuitive-experiential), B = 0.023, p=0.824 (P< α =0.05).
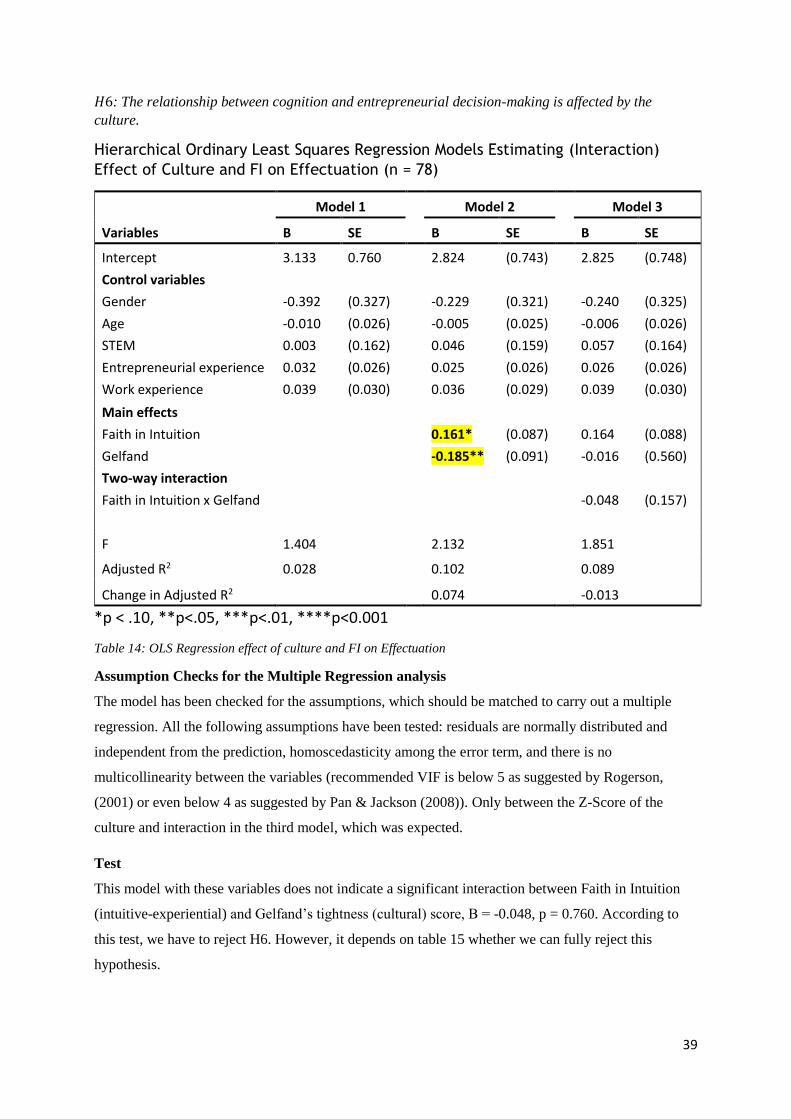
39
𝐻6: The relationship between cognition and entrepreneurial decision-making is affected by the
culture.
Hierarchical Ordinary Least Squares Regression Models Estimating (Interaction)
Effect of Culture and FI on Effectuation (n = 78)
Variables
Model 1 Model 2 Model 3
B SE B SE B SE
Intercept 3.133 0.760 2.824 (0.743) 2.825 (0.748)
Control variables
Gender -0.392 (0.327) -0.229 (0.321) -0.240 (0.325)
Age -0.010 (0.026) -0.005 (0.025) -0.006 (0.026)
STEM 0.003 (0.162) 0.046 (0.159) 0.057 (0.164)
Entrepreneurial experience 0.032 (0.026) 0.025 (0.026) 0.026 (0.026)
Work experience 0.039 (0.030) 0.036 (0.029) 0.039 (0.030)
Main effects
Faith in Intuition 0.161* (0.087) 0.164 (0.088)
Gelfand -0.185** (0.091) -0.016 (0.560)
Two-way interaction
Faith in Intuition x Gelfand -0.048 (0.157)
F 1.404 2.132 1.851
Adjusted R2 0.028 0.102 0.089
Change in Adjusted R2 0.074 -0.013
*p < .10, **p<.05, ***p<.01, ****p<0.001
Table 14: OLS Regression effect of culture and FI on Effectuation
Assumption Checks for the Multiple Regression analysis
The model has been checked for the assumptions, which should be matched to carry out a multiple
regression. All the following assumptions have been tested: residuals are normally distributed and
independent from the prediction, homoscedasticity among the error term, and there is no
multicollinearity between the variables (recommended VIF is below 5 as suggested by Rogerson,
(2001) or even below 4 as suggested by Pan & Jackson (2008)). Only between the Z-Score of the
culture and interaction in the third model, which was expected.
Test
This model with these variables does not indicate a significant interaction between Faith in Intuition
(intuitive-experiential) and Gelfand’s tightness (cultural) score, B = -0.048, p = 0.760. According to
this test, we have to reject H6. However, it depends on table 15 whether we can fully reject this
hypothesis.

40
Hierarchical Ordinary Least Squares Regression Models Estimating (Interaction)
Effect of Culture and NFC on Causation (n = 78)
Variables
Model 1 Model 2 Model 3
B SE B SE B SE
Intercept 4.507 0.585 4.569 (0.609) 4.525 (0.592)
Control variables
Gender -0.251 (0.252) -0.303 (0.256) -0.328 (0.249)
Age -0.014 (0.020) -0.013 (0.021) -0.008 (0.021)
STEM 0.160 (0.125) 0.130 (0.128) 0.083 (0.126)
Entrepreneurial experience -0.033 (0.020) -0.029 (0.021) -0.030 (0.020)
Work experience 0.005 (0.023) 0.001 (0.024) 0.001 (0.023)
Main effects
Need for Cognition -0.033 (0.069) -0.047 (0.067)
Gelfand 0.091 (0.074) 0.134* (0.075)
Two-way interaction
Need for Cogn. x Gelfand -0.151** (0.069)
F 1.575 1.347 1.848
Adjusted R2 0.039 0.034 0.088
Change in Adjusted R2 -0.005 0.054
*p < .10, **p<.05, ***p<.01, ****p<0.001
Table 15: OLS Regression effect of culture and NFC on Causation
Assumption Checks for the Multiple Regression analysis
The model has been checked for the assumptions, which should be matched to carry out a multiple
regression. All the following assumptions have been tested: residuals are normally distributed and
independent from the prediction, homoscedasticity among the error term, and there is no
multicollinearity between the variables (recommended VIF is below 5 as suggested by Rogerson,
(2001) or even below 4 as suggested by Pan & Jackson (2008)).
Test
There was a significant interaction between Need for Cognition (analytical-rational) and Gelfand’s
tightness (cultural) score, B = -0.151, p = 0.032. This means that an increase in the respondent’s
preference for an analytical-rational information-processing system will decrease the choice for causal
decision-making, and this relation will be even stronger when one lives in a tighter culture in contrast
to a looser culture. Therefore, we do not reject H6 based on this test.

41
5. Discussion The findings of this study are quite surprising. Since relatively little research has been done on the
relation between entrepreneurial information processing and decision-making in the context of culture
based on the theory of Gelfand et al. (2011), there are some insights which need further elaboration.
These concepts have been operationalised by the scales of Alsos et al. (2014), Gelfand et al. (2011),
and Epstein et al. (1996). These relations have been partly assessed by fellow- students from the
University of Twente, who cooperated on the concept of effectuation. Some students only assessed the
relation between entrepreneurial decision-making and cognition, where others assessed the relation
between entrepreneurial decision-making and cultural influences. In general, they have been using
other scales to assess these variables. This research has been carried out among Turkish start-up (0-5
years) entrepreneurs and evidence was found to support (some partially) three out of six hypotheses.
Although results showed that the intuitive-experiential- and the analytical-rational system both are
used to process information, this does not always significantly influence the choice of making decision
based on a causal or effectual logic. The theory states that entrepreneurs who think that the future is
somewhat predictable (a causal logic) tend to do systematic analytical research to gather information
so as to find the right product (Sarasvathy et al., 2007). However, there was no significant evidence to
support this statement. In other words, the entrepreneurs who make well-considered and deeply
analysed decisions do not per se prefer causation over effectuation. Entrepreneurs who do the
opposite, thus making use of their experience and intuition, are expected to prefer an effectual
decision-making because they are expected to combine the available means to get an effect (Blume &
Covin, 2011; Sarasvathy, 2001). For this hypothesis, we found evidence and we (marginally) replicate
the theory indicating that entrepreneurs, who make choices based on their intuitive-experiential system
prefer effectuation. A side note is that it should be taken into account that there are only a few women
in this survey.
The relation between effectuation/causation and the degree of tightness and looseness is stated in some
hypothesis. Six statements operationalise the degree of tightness i.e. the presence of social norms and
the denial of an individual’s deviant behaviour. The higher the scores on the statements, the tighter the
country. According to Gelfand et al. (2011) Turkish culture has been considered as tight, since the
score is 9.2. This has been confirmed by one of the co-authors of this article. Unfortunately, due to
limited information, it was not possible to calculate the index score and therefore the mean as
suggested by Rauch et al. (2013) has been used. With an average score of 3.69 out of 6, the third
hypothesis, proposing that Turkish entrepreneurs have the propensity to perceive their culture as tight,
can be confirmed.

42
As theory suggests, people from tighter cultures are more preventive and have a higher need for
structure to avoid making mistakes (Gelfand et al., 2011). It was therefore expected that the
entrepreneurs from Turkey have a propensity for a planned-based approach (causation). The results
were somewhat surprising. There was no significant relation found between a tight culture and
causation. However, it was obvious that the tighter the culture becomes, the more the entrepreneurs
stand away from effectuation. Therefore, the fourth hypothesis should be rejected, though with some
reservation. It might be accepted, when considering effectuation and causation as opposites, that when
an individual goes further away from effectuation (s)he gets closer to effectuation as proposed by
Brettel et al (2002). However, Perry et al. (2012) as well as Sarasvathy (2001) do not treat effectuation
and causation as opposites, but state that entrepreneurs can use both depending on the situation.
Norenzayan et al. (2002) suggest that an analytic mode of processing information is predominant in
Western cultural countries and that intuitive mode of thought predominates in East Asian, indicating
that the Western countries are loose compared to the East Asian countries which are perceived as tight
(Gelfand et al., 2011). The theory suggested that individuals from tighter countries therefore are
expected to rely more on intuitive reasoning than an analytical one. However, during the test it became
clear that there is no significant relation between both phenomena. Thus, this hypothesis has been
rejected. It is important to again address the fact that the Turkish entrepreneurs tend to perceive their
culture as tight and in proportion to the East Asian countries, it is less tight.
Lastly, the overall model has been tested. According to Michell et al. (2002) the culture has an
influence on the way of processing information and decision-making. The results show that culture
functions as an interactor. The more an individual makes use of the analytical-rational decision-
making system, the less (s)he will make use of causation and this relation is even stronger when one
perceives culture as tighter. This agrees with Hayton et al. (2002), who place cultural values and
cognition as possible amplifiers in the relation between institutional context and entrepreneurship,
including decision making process. It is therefore expected that culture plays a part in this relation.
However, when testing the other part of the independent variable, effectuation, there is no significant
effect. Therefore, this statement is partially accepted.

43
(Management) Implications The outcome of this study is especially interesting for Angel investors. Every entrepreneur has his/her
own reason to start a company and some are successful others are not. Understanding the
entrepreneurs’ way of thinking and their decision-making process could provide investors more clarity
why start-up entrepreneurs choose to chase a specific product or deviate from their original idea.
Angel Investors are normally very tough in funding start-up entrepreneurs if they have not a solid
business plan to show which product they sell and how much revenue they expect to generate (Mason
& Stark, 2004). Therefore, it is very difficult for effectuative decision-makers to get funds. This study
also shows that there are many entrepreneurs that make use of effectuation and they should not be
excluded. The same goes for educational purposes as well, since this topic also needs more attention.
Almost every study related to business administration teaches how to approach a market based on
theory, which is described by Sarasvathy as causation (Honig, 2004). Previous research and this area
has shown that this way of decision-making is not the leading way among expert entrepreneurs and
therefore the other entrepreneurial decision-making process (effectuation) should be nominated more
often to give a clear picture on how entrepreneurship works starting from different views (Sarasvathy
et al., 2007).
Furthermore, the relation between entrepreneurial decision-making and cognition has been tested. This
is interesting for social studies and for business psychologists who now could get a more
comprehensive knowledge of the link between ways of thinking and certain entrepreneurial decisions.
This research provides evidence that entrepreneurs who make decision based on their experience and
intuition have a propensity to prefer effectuation as suggested by Blume and Covin (2011). On the
other hand, entrepreneurs who make decisions based upon analytical research do not per se tend to use
causation. It does not seem that these relations exist as proposed by Sarasvathy et al. (2007). However,
this relation does exist though in a negative form, when culture is added as a moderator. In a tighter
culture, people who make use of analytical research, stand more away from causation. The possibility
exists that entrepreneurs who make use of effectuation can also base their decisions on analytical
research. This relation may be tested in the future.

44
For scientists who would like to do a research in the Turkish context (among others based on the paper
by Gelfand et al. (2011), this paper offers more elaboration on how the Turkish culture should be
perceived and addressed. Owing to the efforts by Gelfand et al. (2011) Turkey is currently considered
as a tight culture, since it scored high on the scale (9.2). In reality, it has a tendency to be tight but it is
not that tight as has been suggested. Therefore, in any future studies on the culture the level of
tightness should be reinvestigated. In this research, it has not been proved that entrepreneurs from this
country prefer a more causal decision-making approach. Again, that could be devoted to the fact that
Turkey is not perceived as that tight as suggested in existing literature. In the meantime, this research
does show that the tighter an entrepreneur perceives his/her culture, the further (s)he stands away from
effectuation. Thus, Gelfand’s theory can be confirmed stating that the tighter a society is, the more a
planned-based approach an individual will use. Sticking to the theory of Brettel et al. (2012) that
effectuation and causation are polar opposites. When an individual deviates from one of the two
decision-making processes, (s)he automatically gets closer to the other one.
Limitations and Future research As in every research, this research also has its deficiencies. The first limitation is that the Cronbach
alpha levels are in general not very high (as in the original articles), but are acceptable. This could
have several reasons. One could be the interpretation or translation. In the future, these statements
could be independently translated by several native speakers of both English and Turkish. In this
research, one person translated the questions and the other double checked it. Another solution could
be that another native speaker tries to translate the questions back to English and look whether the
statements remain the same as in the paper. Another reason for low alphas can be allocated to the
small scales. Only 5 statements to operationalise a concept is very small and it could therefore be the
case that the alpha is low (Field, 2009). For the next study, the original scales which are stated in the
paper could be used since they exist of more statements. This scale was tested in Norway, but it
appeared to be not highly correlated (Alsos et al., 2014). However, that could be due to the setting and
the outcome could be different in Turkey. Furthermore, it cannot be due to outliers i.e. respondents
who filled in the questionnaire without any attention, since the Mahalanobis test has been carried out.
Unfortunately, the division between the level of education could not be clearly surveyed. In this
research, the only distinction has been made between the intermediate vocational education (or high
school), university and others. No distinction has been made between the levels of university: A
bachelor from a university of applied sciences, master from a university of applied sciences, bachelor
from a research university (BSc.), Master from a research University (MSc.) or a PhD. Therefore,
mutual differences could not be tested. However, the distinction between higher and lower education
was clear and therefore enough for the hypotheses stated for this research.
45
In possible further studies, the successfulness of both ways of entrepreneurial decision-making may be
tested. At an early stage of this paper, this variable was included. This kind of information however is
sensitive and therefore difficult to acquire but it may be obtained and tested in the future in
cooperation with and on behalf of potentially interested investors. At this particular point, it has been
difficult to find respondents and it would have been even tougher to get respondents if information
such as the increase in number of employees and increase in turnover/profit had been requested.
In this study, the division between male and female entrepreneurs was skewed. 91% (71) of the
respondents were male and only 9% (7) were female. Therefore, it was in this study impossible to
draw general conclusions about the entrepreneurs, since the sample of the females was too small. For a
further study, it might be interesting to look at the differences between the decision-making of both
males and females.
In addition, this research has focussed only on the cultural influence as a moderator on the relation
between cognition and the entrepreneurial decision-making process. Besides these independent
variables there could be more concepts that predict entrepreneurial decision-making.
46
Conclusion The reason for conducting this research is to get an understanding of whether cultural tightness-
looseness has a moderating influence on cognition and entrepreneurial decision-making. Cultural
tightness-looseness is measured by means of the Gelfand-scale (Gelfand et al., 2011). The REI-scale
of Epstein et al. (1996) has measured cognition on a scale of several statements. The statements in this
scale indicate whether an individual processes information based on expertise and intuition or on an
analytical and rational basis. Furthermore, entrepreneurial decision-making is measured by making use
a scale for effectuation and causation that was developed by Alsos et al. (2014). They revised the
effectuation and causation scales of various other scholars and improved its shortcomings. The
moderating influence of cultural tightness on the relation between cognition and the entrepreneurial
decision-making process is applied as the 6th hypothesis in order to answer the central research
question:
‘’ To what extent do entrepreneurs have a tendency for effectual(reasoning) over/vs causal
(reasoning) and does culture have an interacting effect?’’
Evidence has been found that entrepreneurs who are influenced by a tight culture and process
information based on the analytical and rational system, use a less causal logic in their decision-
making process. Furthermore, no significant evidence has been found for entrepreneurs who are
influenced by a tight culture and who process information based on the intuitive and experiential
system, that they rely on an effectual logic in their decision-making process. The first finding indicates
that culture acts as a moderator between information processing and decision-making. However, in the
other finding this is refuted. Testing the hypotheses independently, it appears that effectuative
decision-making is positively correlated with intuitive-experiential information processing and this
relation vanishes as soon as culture is taken into account. This contrasts with causal decision-making
which is not significantly correlated with rational-analytical information processing. This relation
becomes significant when culture is being added as a moderator.
Therefore, the outcome of this research is in line with the papers by Mitchell et al. (2002) and Hayton
et al. (2002), which indicate that the cultural context plays a significant role in the way how
individuals process information and make entrepreneurial decisions.
47
Bibliography
Aktas, M., Gelfand, M. J., & Hanges, P. J. (2016). Cultural tightness–looseness and perceptions of
effective leadership. Journal of Cross-Cultural Psychology, 47(2), 294-309.
Alsos, G. A., Clausen, T. H., & Solvoll, S. (2014). Towards a better measurement scale of causation
and effectuation. Paper presented at Academy of Management Meeting, *Not yet published.
Allinson, C. W., & Hayes, J. (1996). The cognitive style index: A measure of intuition‐analysis for
organizational research. Journal of Management studies, 33(1), 119-135.
Ardishvili, A., Cardozo, S., Harmon, S., & Vadakath, S. (1998). Towards a theory of new venture
growth. Babson entrepreneurship research conference, 21-23.
Baliamoune-Lutz, M., & Garello, P. (2014). Tax structure and entrepreneurship. Small Business
Economics, 42(1), 165-190.
Bagozzi, R. P., Wong, N., & Yi, Y. (1999). The role of culture and gender in the relationship between
positive and negative affect. Cognition & Emotion, 13(6), 641-672.
Bardasi, E., Sabarwal, S., & Terrell, K. (2011). How do female entrepreneurs perform? Evidence from
three developing regions. Small Business Economics, 37(4), 417.
Barney, J. (1991). Firm resources and sustained competitive advantage. Journal of
management, 17(1), 99-120.
Batjargal, B., Hitt, M. A., Tsui, A. S., Arregle, J. L., Webb, J. W., & Miller, T. L. (2013). Institutional
polycentrism, entrepreneurs' social networks, and new venture growth. Academy of Management
Journal, 56(4), 1024-1049.
Baum, J. R., & Locke, E. A. (2004). The relationship of entrepreneurial traits, skill, and motivation to
subsequent venture growth. Journal of applied psychology, 89(4), 587.
Baum, J. R., Locke, E. A., & Smith, K. G. (2001). A multidimensional model of venture
growth. Academy of management journal, 44(2), 292-303.
Benz, M. (2009). Entrepreneurship as a non-profit-seeking activity. International Entrepreneurship
and Management Journal, 5(1), 23-44.
Berry, J. W. (1979). A cultural ecology of social behavior. Advances in experimental social
psychology, 12, 177-206.
Bishara, A. J., & Hittner, J. B. (2012). Testing the significance of a correlation with nonnormal data:
comparison of Pearson, Spearman, transformation, and resampling approaches. Psychological
methods, 17(3), 399.
Bland, J. M., & Altman, D. G. (1997). Statistics notes: Cronbach's alpha. British Medical Journal,
314, 572.
Blume, B. D., & Covin, J. G. (2011). Attributions to intuition in the venture founding process: Do
entrepreneurs actually use intuition or just say that they do? Journal of Business Venturing, 26(1),
137-151.
Boshuizen, H., & Schmidt, H. G. (1992). On the role of biomedical knowledge in clinical reasoning by
experts, intermediates and novices. Cognitive science, 16(2), 153-184.
Bosma, N., Van Praag, M., & De Wit, G. (2000). Determinants of successful entrepreneurship.

48
Brandimonte, M. A., Bruno, N., & Collina, S. In P. Pawlik and G. d’Ydewalle (2006) Psychological
Concepts: An International Historical Perspective.
Brettel, M., Mauer, R., Engelen, A., & Küpper, D. (2012). Corporate effectuation: Entrepreneurial
action and its impact on R&D project performance. Journal of Business Venturing, 27(2), 167-184.
Brinckmann, J., Grichnik, D., & Kapsa, D. (2010). Should entrepreneurs plan or just storm the castle?
A meta-analysis on contextual factors impacting the business planning–performance relationship in
small firms. Journal of Business Venturing, 25(1), 24-40.
Brown, T. E., Davidsson, P., & Wiklund, J. (2001). An operationalization of Stevenson's
conceptualization of entrepreneurship as opportunity‐based firm behavior. Strategic management
journal, 22(10), 953-968.
Busenitz, L. W., & Barney, J. B. (1997). Differences between entrepreneurs and managers in large
organizations: Biases and heuristics in strategic decision-making. Journal of business venturing, 12(1),
9-30.
Busenitz, L. W., Gomez, C., & Spencer, J. W. (2000). Country institutional profiles: Unlocking
entrepreneurial phenomena. Academy of Management journal, 43(5), 994-1003.
Cardon, M. S., Gregoire, D. A., Stevens, C. E., & Patel, P. C. (2013). Measuring entrepreneurial
passion: Conceptual foundations and scale validation. Journal of Business Venturing, 28(3), 373-396.
Carland, J. W., Hoy, F., Boulton, W. R., & Carland, J. A. C. (1984). Differentiating entrepreneurs
from small business owners: A conceptualization. Academy of management review, 9(2), 354-359.
Cassar, G. (2007). Money, money, money? A longitudinal investigation of entrepreneur career
reasons, growth preferences and achieved growth. Entrepreneurship and Regional
Development, 19(1), 89-107.
Cerny, B. A., & Kaiser, H. F. (1977). A study of a measure of sampling adequacy for factor-analytic
correlation matrices. Multivariate Behavioral Research, 12(1), 43-47.
Chan, A. P., Scott, D., & Lam, E. W. (2002). Framework of success criteria for design/build
projects. Journal of management in engineering, 18(3), 120-128.
Chandler, G. N., DeTienne, D. R., McKelvie, A., & Mumford, T. V. (2011). Causation and
effectuation processes: A validation study. Journal of business venturing, 26(3), 375-390.
Chase, W. G., & Ericsson, K. A. (1981). Skilled memory. Cognitive skills and their acquisition, 141-
189.
Chen, X. (2009). Students Who Study Science, Technology, Engineering, and Mathematics (STEM) in
Postsecondary Education. Stats in Brief. NCES 2009-161. National Center for Education Statistics.
Chetty, S., Ojala, A., & Leppäaho, T. (2015). Effectuation and foreign market entry of entrepreneurial
firms. European Journal of Marketing, 49(9/10), 1436-1459.
Chua, R. Y., Roth, Y., & Lemoine, J. F. (2015). The impact of culture on creativity: How cultural
tightness and cultural distance affect global innovation crowdsourcing work. Administrative Science
Quarterly, 60(2), 189-227.
Davidsson, P., & Wiklund, J. (1997). Values, beliefs and regional variations in new firm formation
rates. Journal of Economic psychology, 18(2), 179-199.
DeTienne, D. R., & Chandler, G. N. (2010). The impact of motivation and causation and effectuation
approaches on exit strategies. Frontiers of entrepreneurship research, 30(1), 1.
49
DeVellis, R. F. (2016). Scale development: Theory and applications (Vol. 26). Sage publications.
Dew, N., Read, S., Sarasvathy, S. D., & Wiltbank, R. (2009). Effectual versus predictive logics in
entrepreneurial decision-making: Differences between experts and novices. Journal of business
venturing, 24(4), 287-309.
Delmar F. (1997). Measuring Growth: Methodological Considerations and Empirical Results. In:
Donckels, R., & Miettinen, A. (Eds.). (1997). Entrepreneurship and SME research: on its way to the
next millennium.
Doney, P. M., Cannon, J. P., & Mullen, M. R. (1998). Understanding the influence of national culture
on the development of trust. Academy of management review, 23(3), 601-620.
Dorfman, P. W., & Howell, J. P. (1988). Dimensions of national culture and effective leadership
patterns: Hofstede revisited. Advances in international comparative management, 3(1), 127-150.
Epstein, S., Pacini, R., Denes-Raj, V., & Heier, H. (1996). Individual differences in intuitive–
experiential and analytical–rational thinking styles. Journal of personality and social
psychology, 71(2), 390.
Eun, C. S., Wang, L., & Xiao, S. C. (2015). Culture and R 2. Journal of Financial Economics, 115(2),
283-303.
Evans, J. S. B. (2008). Dual-processing accounts of reasoning, judgment, and social cognition. Annu.
Rev. Psychol., 59, 255-278.
Fang, T. (2010). Asian management research needs more self-confidence: Reflection on Hofstede
(2007) and beyond. Asia Pacific Journal of Management, 27(1), 155-170.
Filzmoser, P., Maronna, R., & Werner, M. (2008). Outlier identification in high
dimensions. Computational Statistics & Data Analysis, 52(3), 1694-1711.
Fischhoff, B. (1975). Hindsight is not equal to foresight: The effect of outcome knowledge on
judgment under uncertainty. Journal of Experimental Psychology: Human perception and
performance, 1(3), 288.
Fisher, G. (2012). Effectuation, causation, and bricolage: a behavioral comparison of emerging
theories in entrepreneurship research. Entrepreneurship theory and practice, 36(5), 1019-1051.
Gaglio, C. M., & Katz, J. A. (2001). The psychological basis of opportunity identification:
Entrepreneurial alertness. Small business economics, 16(2), 95-111.
García-Cabrera, A. M., & García-Soto, M. G. (2008). Cultural differences and entrepreneurial
behaviour: an intra-country cross-cultural analysis in Cape Verde. Entrepreneurship and Regional
Development, 20(5), 451-483.
Garg, A. K., Matshediso, I. B., & Garg, D. (2011). An individual’s motivation to become
entrepreneur: evidences from a mineral based economy. International Journal of Entrepreneurship
and Small Business, 12(1), 109-127.
Gelfand, M. J., Nishii, L. H., & Raver, J. L. (2006). On the nature and importance of cultural
tightness-looseness. Journal of Applied Psychology, 91(6), 1225
Gelfand, M. J., Raver, J. L., Nishii, L., Leslie, L. M., Lun, J., Lim, B. C., ... & Aycan, Z. (2011).
Differences between tight and loose cultures: A 33-nation study. science, 332, 1100-1104.
50
Gemperline, P. J., & Boyer, N. R. (1995). Classification of near-infrared spectra using wavelength
distances: comparison to the Mahalanobis distance and residual variance methods. Analytical
Chemistry, 67(1), 160-166.
Germak, A. J., & Robinson, J. A. (2014). Exploring the motivation of nascent social
entrepreneurs. Journal of Social Entrepreneurship, 5(1), 5-21.
Gentry, W. M. (2015). Capital Gains Taxation and Entrepreneurship. Tax Law Review, 69, 321.
George, N. M., Parida, V., Lahti, T., & Wincent, J. (2016). A systematic literature review of
entrepreneurial opportunity recognition: insights on influencing factors. International
Entrepreneurship and Management Journal, 12(2), 309-350.
Grégoire, D. A., Corbett, A. C., & McMullen, J. S. (2011). The cognitive perspective in
entrepreneurship: An agenda for future research. Journal of Management Studies, 48(6), 1443-1477.
Greve, H. R. (1998). Managerial cognition and the mimetic adoption of market positions: What you
see is what you do. Strategic management journal, 19(10), 967-988.
Hair, J. F., Anderson, R. E., Babin, B. J., & Black, W. C. (2010). Multivariate data analysis: A global
perspective. Upper Saddle River, NJ: Pearson.
Hakkert, R., Kemp, R. G. M., & Zoetermeer, S. (2006). An ambition to grow: A multidisciplinary
perspective on the antecedents of growth ambitions. EIM SCALES, 8-21.
Harms, R., & Schiele, H. (2012). Antecedents and consequences of effectuation and causation in the
international new venture creation process. Journal of international entrepreneurship, 10(2), 95-116.
Hayashi, A. M. (2001). When to trust your gut. Harvard Business Review, 79(2), 59-65.
Haynie, M., & Shepherd, D. A. (2009). A measure of adaptive cognition for entrepreneurship
research. Entrepreneurship Theory and Practice, 33(3), 695-714.
Hayton, J. C., George, G., & Zahra, S. A. (2002). National culture and entrepreneurship: A review of
behavioral research. Entrepreneurship theory and practice, 26(4), 33.
Hisrich, R. D. (1984). The woman entrepreneur in the United States and Puerto Rico: a comparative
study. Leadership & Organization Development Journal, 5(5), 3-8.
Hmieleski, K. M., & Corbett, A. C. (2006). Proclivity for improvisation as a predictor of
entrepreneurial intentions. Journal of Small Business Management, 44(1), 45-63
Hofstede, G., Hofstede, G. J., & Minkov, M. (2010). Cultures and organizations: Software of the
mind. Revised and expanded. McGraw-Hill, New York.
Honig, B. (2004). Entrepreneurship education: Toward a model of contingency-based business
planning. Academy of Management Learning & Education, 3(3), 258-273.
Honig, B., & Karlsson, T. (2004). Institutional forces and the written business plan. Journal of
Management, 30(1), 29-48.
Hudson, L. (1966). Contrary Imaginations, by Liam Hudson. Methuen.
Holzman, P. S., & Klein, G. S. (1954). Cognitive system-principles of levelling and sharpening:
Individual differences in assimilation effects in visual time-error. The Journal of Psychology, 37(1),
105-122.

51
Jo, H., & Lee, J. (1996). The relationship between an entrepreneur's background and performance in a
new venture. Technovation, 16(4), 161-211.
Kirzner, I. M. (1979). Perception, opportunity and profit: Studies in the Theory of Entrepreneurship.
The University of Chicago Press, 8(2), 183-188.
Kagan, J. (1965). Individual differences in the resolution of response uncertainty. Journal of
Personality and Social Psychology, 2(2), 154.
Knight, F. (1921). Risk, uncertainty, and profit. Hart Schaffner and Marx prize essays no 31. Boston
and New York: Houghton Mifflin.
Kotler P, Armstrong G (2012). Principles of Marketing, 14th Edition, New Jersey, USA. Pearson
Education Inc.
Kroeber, A. L., & Kluckhohn, C. (1952). Culture: A critical review of concepts and
definitions. Papers. Peabody Museum of Archaeology & Ethnology, Harvard University.
Krueger, N. F., & Kickul, J. (2006). So you thought the intentions model was simple? Cognitive style
and the specification of entrepreneurial intentions models.
Lee, D. Y., & Tsang, E. W. (2001). The effects of entrepreneurial personality, background and
network activities on venture growth. Journal of management studies, 38(4), 583-602.
Levy, O., Beechler, S., Taylor, S., & Boyacigiller, N. A. (2007). What we talk about when we talk
about ‘global mindset’: Managerial cognition in multinational corporations. Journal of International
Business Studies, 38(2), 231-258.
Liao, J., & Gartner, W. B. (2006). The effects of pre-venture plan timing and perceived environmental
uncertainty on the persistence of emerging firms. Small Business Economics, 27(1), 23-40.
Linnanen, L. (2005). An insider’s experiences with environmental entrepreneurship. Making
ecopreneurs: Developing sustainable entrepreneurship, 72-88.
Locke, E. A., & Latham, G. P. (1990). A theory of goal setting & task performance. Prentice-Hall, Inc.
Loewenthal, K. M. (2001). An introduction to psychological tests and scales. Psychology Press.
Lutz, S., & Huitt, W. (2003). Information processing and memory: Theory and
applications. Educational Psychology Interactive, 1-17.
Mahalanobis, P. C. (1936). On the generalized distance in statistics. Proceedings of the National
Institute of Sciences (Calcutta), 2, 49-55.
Markman, G. D., & Baron, R. A. (2003). Person–entrepreneurship fit: why some people are more
successful as entrepreneurs than others. Human resource management review, 13(2), 281-301.
Marshall, A., & Guillebaud, C. W. (1961). Principles of Economics. 9th (variorum) ed. Macmillan.
Mason, C., & Stark, M. (2004). What do investors look for in a business plan? A comparison of the
investment criteria of bankers, venture capitalists and business angels. International small business
journal, 22(3), 227-248.
52
Matala, A. (2008). Sample size requirement for Monte Carlo simulations using Latin hypercube
sampling. Helsinki University of Technology, Department of Engineering Physics and Mathematics,
Systems Analysis Laboratory. Matsunaga, M. (2010). How to Factor-Analyze Your Data Right: Do's, Don'ts, and How-
To's. International Journal of Psychological Research, 3(1).
Mitchell, R. K., Smith, J. B., Morse, E. A., Seawright, K. W., Peredo, A. M., & McKenzie, B. (2002).
Are entrepreneurial cognitions universal? Assessing entrepreneurial cognitions across
cultures. Entrepreneurship: Theory and Practice, 26(4), 9-33.
Messick, S. (1984). The nature of cognitive styles: Problems and promise in educational
practice. Educational psychologist, 19(2), 59-74.
Newbert, S. L. (Ed.). (2015). Small Business in a Global Economy: Creating and Managing
Successful Organizations [2 volumes]: Creating and Managing Successful Organizations. ABC-
CLIO.
Newman, K. L., & Nollen, S. D. (1996). Culture and congruence: The fit between management
practices and national culture. Journal of international business studies, 27(4), 753-779.
Nielsen, S. L., & Lassen, A. H. (2012). Identity in entrepreneurship effectuation theory: a
supplementary framework. International Entrepreneurship and Management Journal, 8(3), 373-389.
Nisbett, R. E., Peng, K., Choi, I., & Norenzayan, A. (2001). Culture and systems of thought: holistic
versus analytic cognition. Psychological review, 108(2), 291.
Norenzayan, A., Smith, E. E., Kim, B. J., & Nisbett, R. E. (2002). Cultural preferences for formal
versus intuitive reasoning. Cognitive Science, 26(5), 653-684.
Nunnally, J. (1994). Bernstein (1994), Psychometric Theory. Aufl., New York ua.
Rogerson, P. (2001). Statistical methods for geography. Sage.
O’Connor, B. P. (2000). SPSS and SAS programs for determining the number of components using
parallel analysis and Velicer’s MAP test. Behavior Research Methods, 32(3), 396-402.
Okten, C. (2015). Female Entrepreneurship in Turkey.
Ozcelik, H., & Paprika, Z. Z. (2010). Developing emotional awareness in cross-cultural
communication: A videoconferencing approach. Journal of Management Education, 34(5).
Pan, Y., & Jackson, R. T. (2008). Ethnic difference in the relationship between acute inflammation
and serum ferritin in US adult males. Epidemiology & Infection, 136(3), 421-431.
Park, J. S. (2005). Opportunity recognition and product innovation in entrepreneurial hi-tech start-ups:
a new perspective and supporting case study. Technovation, 25(7), 739-752.
Pask, G. (1972). A fresh look at cognition and the individual. International Journal of Man-Machine
Studies, 4(3), 211-216.
Perry, J. T., Chandler, G. N., & Markova, G. (2012). Entrepreneurial effectuation: a review and
suggestions for future research. Entrepreneurship Theory and Practice, 36(4), 837-861.
Pushkar, D. R. (2013, June 03). Why Do Indian Students Take Up Engineering Degrees? Retrieved
from https://www.asianscientist.com/2013/06/features/indian-students-engineering-degrees-2013/

53
Rauch, A., Frese, M., Wang, Z. M., Unger, J., Lozada, M., Kupcha, V., & Spirina, T. (2013). National
culture and cultural orientations of owners affecting the innovation–growth relationship in five
countries. Entrepreneurship & Regional Development, 25(9-10), 732-755.
Read, S., Sarasvathy, S., Dew, N., Wiltbank, R., & Ohlsson, A. V. (2010). Effectual entrepreneurship.
Taylor & Francis.
Reckwitz, A. (2000). The status of mind in culturalist explanations of action. On the issue of the
relation between behaviour and knowledge according to Stephen Turner and Theodore
Schatzki. ZEITSCHRIFT FUR SOZIOLOGIE, 29(3), 167-+.
Reijonen, H., & Komppula, R. (2007). Perception of success and its effect on small firm
performance. Journal of Small Business and Enterprise Development, 14(4), 689-701.
Riding, R., & Cheema, I. (1991). Cognitive styles—an overview and integration. Educational
psychology, 11(3-4), 193-215.
Riding, R. J., & Sadler‐Smith, E. (1997). Cognitive style and learning strategies: Some implications
for training design. International Journal of Training and Development, 1(3), 199-208.
Riding, R. J., & Taylor, E. M. (1976). Imagery performance and prose comprehension in seven‐year‐old children. Educational Studies, 2(1), 21-27.
Ross, L. (1977). The intuitive psychologist and his shortcomings: Distortions in the attribution
process. Advances in experimental social psychology, 10, 173-220.
Sarasvathy, S. D. (2008). Effectuation: Elements of entrepreneurial expertise. Edward Elgar
Publishing.
Sarasvathy, S. D. (2001). Causation and effectuation: Toward a theoretical shift from economic
inevitability to entrepreneurial contingency. Academy of management Review, 26(2), 243-263.
Sarasvathy, S. D., & Dew, N. (2005). Entrepreneurial logics for a technology of
foolishness. Scandinavian Journal of Management, 21(4), 385-406.
Sarasvathy, S. D., Dew, N., Read, S., & Wiltbank, R. (2007). Effectual entrepreneurial expertise:
Existence and bounds. Academy of Management Journal, 1-46.
Say, J. B., & Biddle, C. C. (1851). A treatise on political economy. J. Grigg.
Schumpeter, J. A. (1934). The theory of economic development: An inquiry into profits, capital, credit,
interest, and the business cycle (Vol. 55). Transaction publishers.
Schwartz, S. H. (1999). A theory of cultural values and some implications for work. Applied
psychology, 48(1), 23-47.
Seginer, R., & Halabi-Kheir, H. (1998). Adolescent passage to adulthood: Future orientation in the
context of culture, age, and gender. International Journal of Intercultural Relations, 22(3), 309-328.
Shaiq, H. M. A., Khalid, H. M. S., Akram, A., & Ali, B. (2011). Why not everybody loves Hofstede?
What are the alternative approaches to study of culture. European Journal of Business and
Management, 3(6), 101-111.
Shane, S. A. (1992). Why do some societies invent more than others? Journal of Business Venturing,
7(1), 29-46.
Shane, S. (1993). Cultural influences on national rates of innovation. Journal of Business Venturing,
8(1), 59-73.
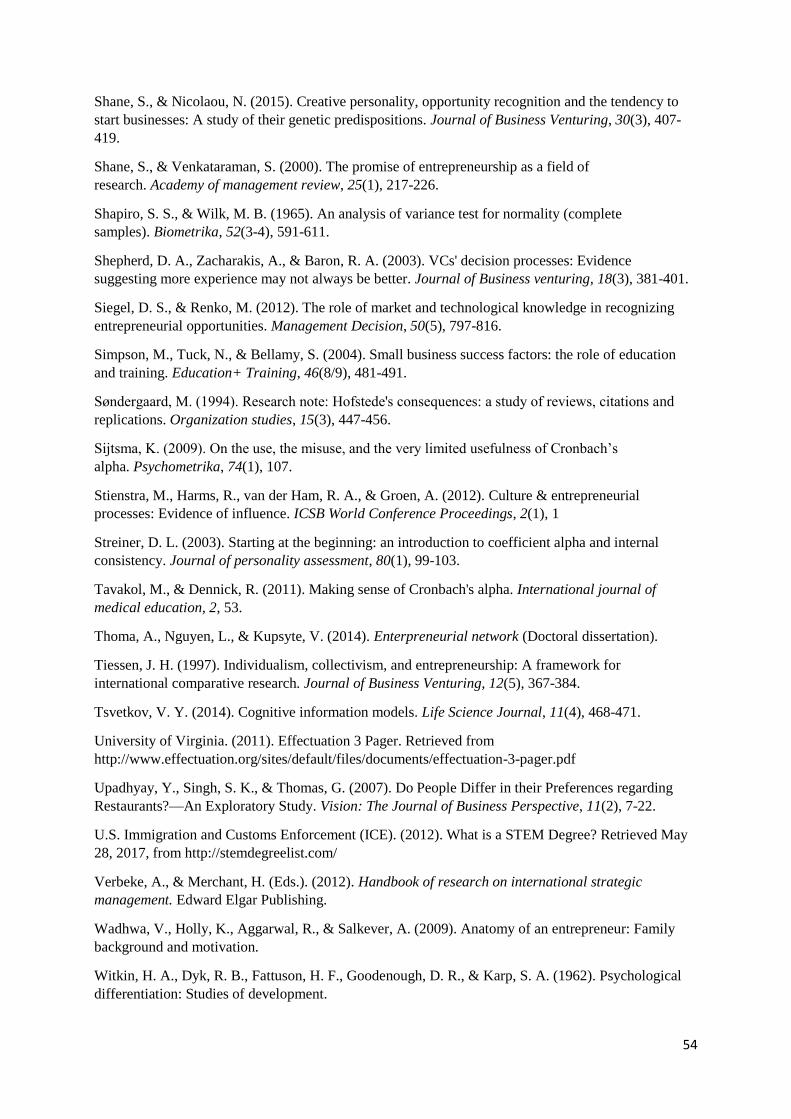
54
Shane, S., & Nicolaou, N. (2015). Creative personality, opportunity recognition and the tendency to
start businesses: A study of their genetic predispositions. Journal of Business Venturing, 30(3), 407-
419.
Shane, S., & Venkataraman, S. (2000). The promise of entrepreneurship as a field of
research. Academy of management review, 25(1), 217-226.
Shapiro, S. S., & Wilk, M. B. (1965). An analysis of variance test for normality (complete
samples). Biometrika, 52(3-4), 591-611.
Shepherd, D. A., Zacharakis, A., & Baron, R. A. (2003). VCs' decision processes: Evidence
suggesting more experience may not always be better. Journal of Business venturing, 18(3), 381-401.
Siegel, D. S., & Renko, M. (2012). The role of market and technological knowledge in recognizing
entrepreneurial opportunities. Management Decision, 50(5), 797-816.
Simpson, M., Tuck, N., & Bellamy, S. (2004). Small business success factors: the role of education
and training. Education+ Training, 46(8/9), 481-491.
Søndergaard, M. (1994). Research note: Hofstede's consequences: a study of reviews, citations and
replications. Organization studies, 15(3), 447-456.
Sijtsma, K. (2009). On the use, the misuse, and the very limited usefulness of Cronbach’s
alpha. Psychometrika, 74(1), 107.
Stienstra, M., Harms, R., van der Ham, R. A., & Groen, A. (2012). Culture & entrepreneurial
processes: Evidence of influence. ICSB World Conference Proceedings, 2(1), 1
Streiner, D. L. (2003). Starting at the beginning: an introduction to coefficient alpha and internal
consistency. Journal of personality assessment, 80(1), 99-103.
Tavakol, M., & Dennick, R. (2011). Making sense of Cronbach's alpha. International journal of
medical education, 2, 53.
Thoma, A., Nguyen, L., & Kupsyte, V. (2014). Enterpreneurial network (Doctoral dissertation).
Tiessen, J. H. (1997). Individualism, collectivism, and entrepreneurship: A framework for
international comparative research. Journal of Business Venturing, 12(5), 367-384.
Tsvetkov, V. Y. (2014). Cognitive information models. Life Science Journal, 11(4), 468-471.
University of Virginia. (2011). Effectuation 3 Pager. Retrieved from
http://www.effectuation.org/sites/default/files/documents/effectuation-3-pager.pdf
Upadhyay, Y., Singh, S. K., & Thomas, G. (2007). Do People Differ in their Preferences regarding
Restaurants?—An Exploratory Study. Vision: The Journal of Business Perspective, 11(2), 7-22.
U.S. Immigration and Customs Enforcement (ICE). (2012). What is a STEM Degree? Retrieved May
28, 2017, from http://stemdegreelist.com/
Verbeke, A., & Merchant, H. (Eds.). (2012). Handbook of research on international strategic
management. Edward Elgar Publishing.
Wadhwa, V., Holly, K., Aggarwal, R., & Salkever, A. (2009). Anatomy of an entrepreneur: Family
background and motivation.
Witkin, H. A., Dyk, R. B., Fattuson, H. F., Goodenough, D. R., & Karp, S. A. (1962). Psychological
differentiation: Studies of development.

55
Woetmann, C. Z. (2014). Entrepreneurs usage of effectuation and causation (Doctoral dissertation,
Thesis, Copenhagen Business School).
Wursten, H., & Jacobs, C. (2013). The impact of culture on education. The Hofstede Centre, Itim
International.
Yates, J. F., & de Oliveira, S. (2016). Culture and decision making. Organizational Behavior and
Human Decision Processes, 136, 106-118.
Zaheer, A., Gözübüyük, R., & Milanov, H. (2010). It's the connections: The network perspective in
interorganizational research. The Academy of Management Perspectives, 24(1), 62-77.
Zahra, S. A., Korri, J. S., & Yu, J. (2005). Cognition and international entrepreneurship: implications
for research on international opportunity recognition and exploitation. International business
review, 14(2), 129-146.
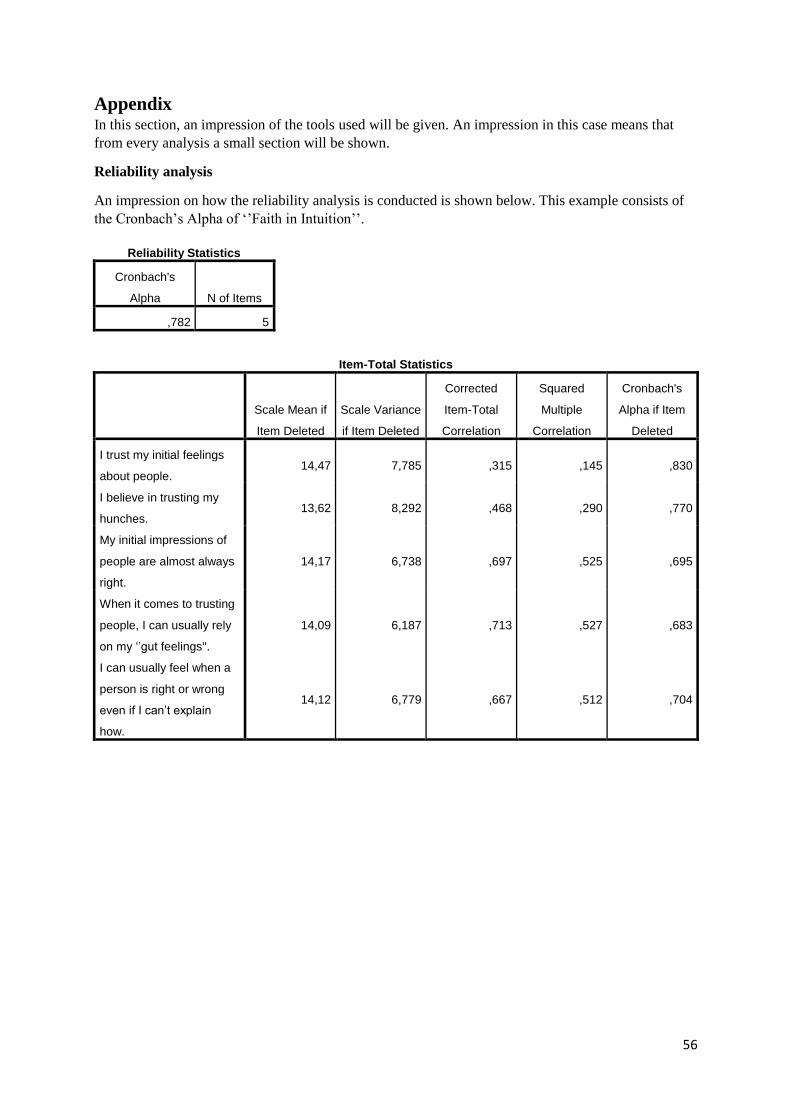
56
Appendix In this section, an impression of the tools used will be given. An impression in this case means that
from every analysis a small section will be shown.
Reliability analysis
An impression on how the reliability analysis is conducted is shown below. This example consists of
the Cronbach’s Alpha of ‘’Faith in Intuition’’.
Reliability Statistics
Cronbach's
Alpha N of Items
,782 5
Item-Total Statistics
Scale Mean if
Item Deleted
Scale Variance
if Item Deleted
Corrected
Item-Total
Correlation
Squared
Multiple
Correlation
Cronbach's
Alpha if Item
Deleted
I trust my initial feelings
about people. 14,47 7,785 ,315 ,145 ,830
I believe in trusting my
hunches. 13,62 8,292 ,468 ,290 ,770
My initial impressions of
people are almost always
right.
14,17 6,738 ,697 ,525 ,695
When it comes to trusting
people, I can usually rely
on my ‘’gut feelings''.
14,09 6,187 ,713 ,527 ,683
I can usually feel when a
person is right or wrong
even if I can’t explain
how.
14,12 6,779 ,667 ,512 ,704
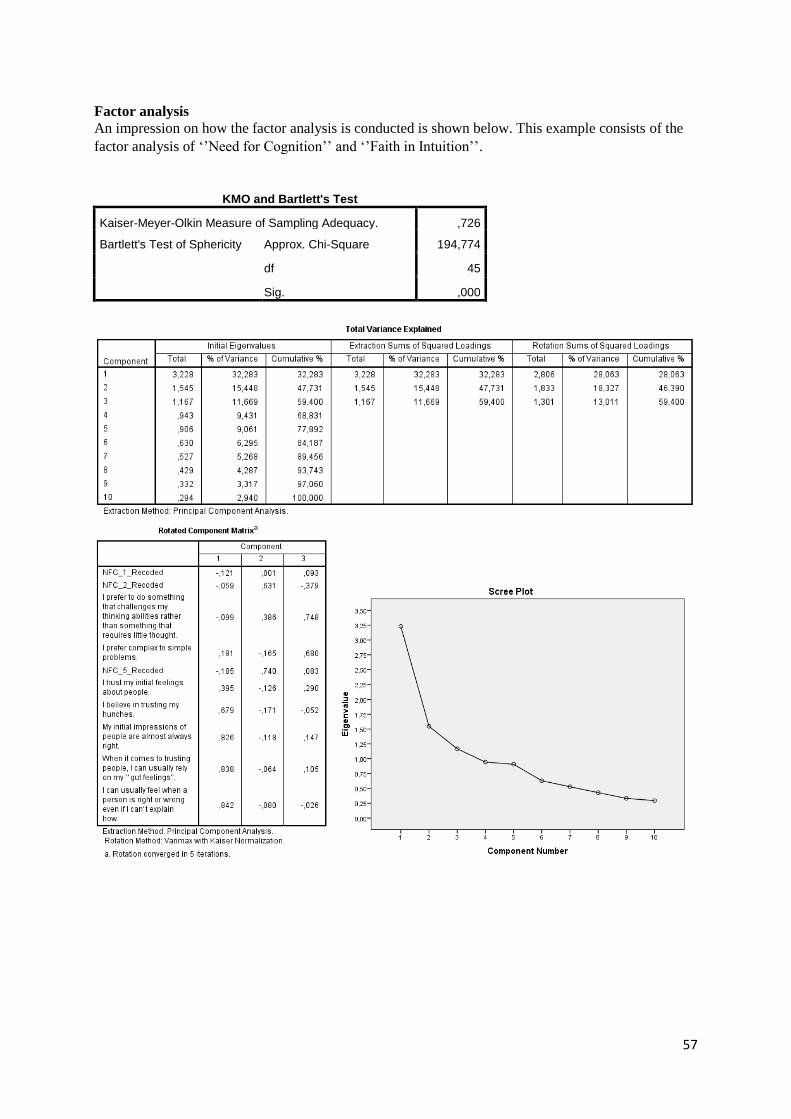
57
Factor analysis
An impression on how the factor analysis is conducted is shown below. This example consists of the
factor analysis of ‘’Need for Cognition’’ and ‘’Faith in Intuition’’.
KMO and Bartlett's Test
Kaiser-Meyer-Olkin Measure of Sampling Adequacy. ,726
Bartlett's Test of Sphericity Approx. Chi-Square 194,774
df 45
Sig. ,000
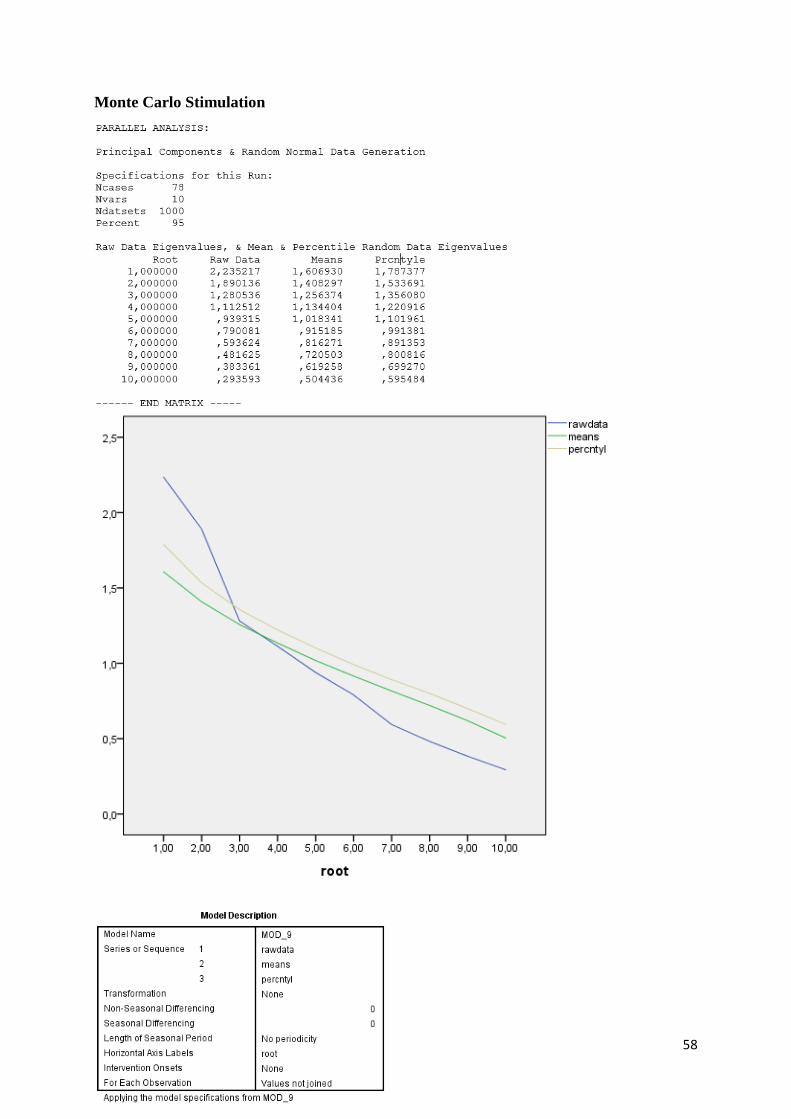
58
Monte Carlo Stimulation
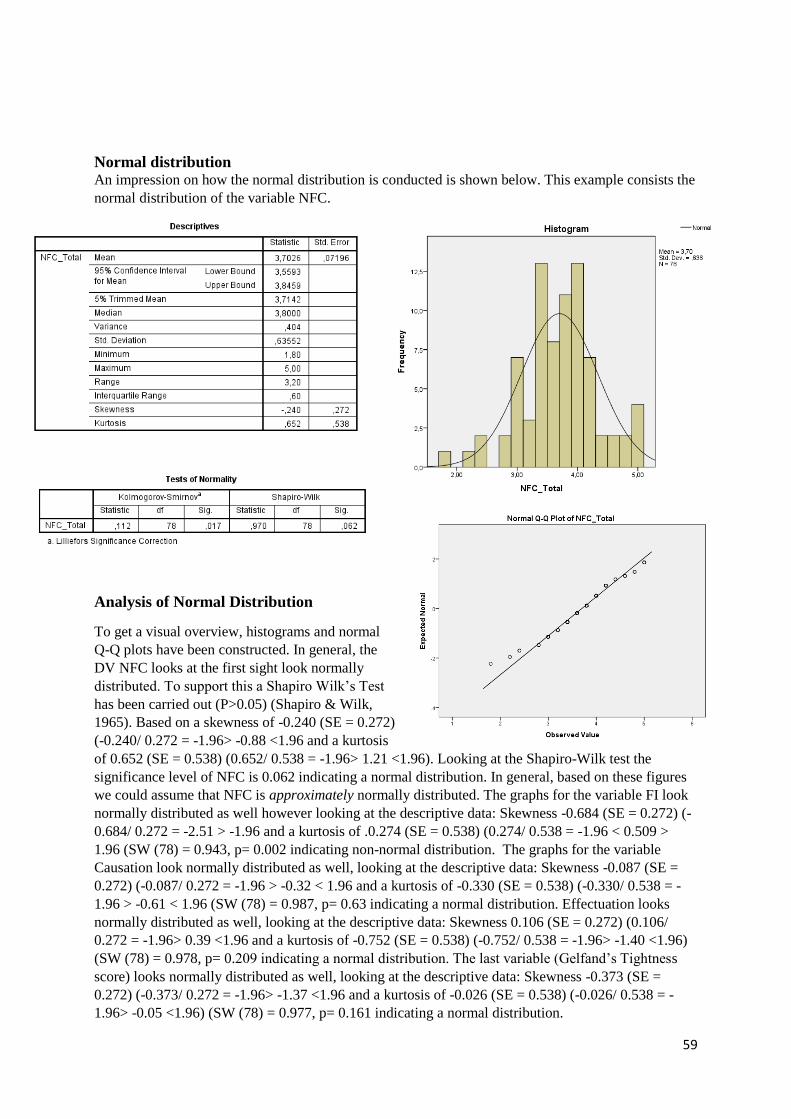
59
Normal distribution An impression on how the normal distribution is conducted is shown below. This example consists the
normal distribution of the variable NFC.
Analysis of Normal Distribution
To get a visual overview, histograms and normal
Q-Q plots have been constructed. In general, the
DV NFC looks at the first sight look normally
distributed. To support this a Shapiro Wilk’s Test
has been carried out (P>0.05) (Shapiro & Wilk,
1965). Based on a skewness of -0.240 (SE = 0.272)
(-0.240/ 0.272 = -1.96> -0.88 <1.96 and a kurtosis
of 0.652 (SE = 0.538) (0.652/ 0.538 = -1.96> 1.21 <1.96). Looking at the Shapiro-Wilk test the
significance level of NFC is 0.062 indicating a normal distribution. In general, based on these figures
we could assume that NFC is approximately normally distributed. The graphs for the variable FI look
normally distributed as well however looking at the descriptive data: Skewness -0.684 (SE = 0.272) (-
0.684/ 0.272 = -2.51 > -1.96 and a kurtosis of .0.274 (SE = 0.538) (0.274/ 0.538 = -1.96 < 0.509 >
1.96 (SW (78) = 0.943, p= 0.002 indicating non-normal distribution. The graphs for the variable
Causation look normally distributed as well, looking at the descriptive data: Skewness -0.087 (SE =
0.272) (-0.087/ 0.272 = -1.96 > -0.32 < 1.96 and a kurtosis of -0.330 (SE = 0.538) (-0.330/ 0.538 = -
1.96 > -0.61 < 1.96 (SW (78) = 0.987, p= 0.63 indicating a normal distribution. Effectuation looks
normally distributed as well, looking at the descriptive data: Skewness 0.106 (SE = 0.272) (0.106/
0.272 = -1.96> 0.39 <1.96 and a kurtosis of -0.752 (SE = 0.538) (-0.752/ 0.538 = -1.96> -1.40 <1.96)
(SW (78) = 0.978, p= 0.209 indicating a normal distribution. The last variable (Gelfand’s Tightness
score) looks normally distributed as well, looking at the descriptive data: Skewness -0.373 (SE =
0.272) (-0.373/ 0.272 = -1.96> -1.37 <1.96 and a kurtosis of -0.026 (SE = 0.538) (-0.026/ 0.538 = -
1.96> -0.05 <1.96) (SW (78) = 0.977, p= 0.161 indicating a normal distribution.
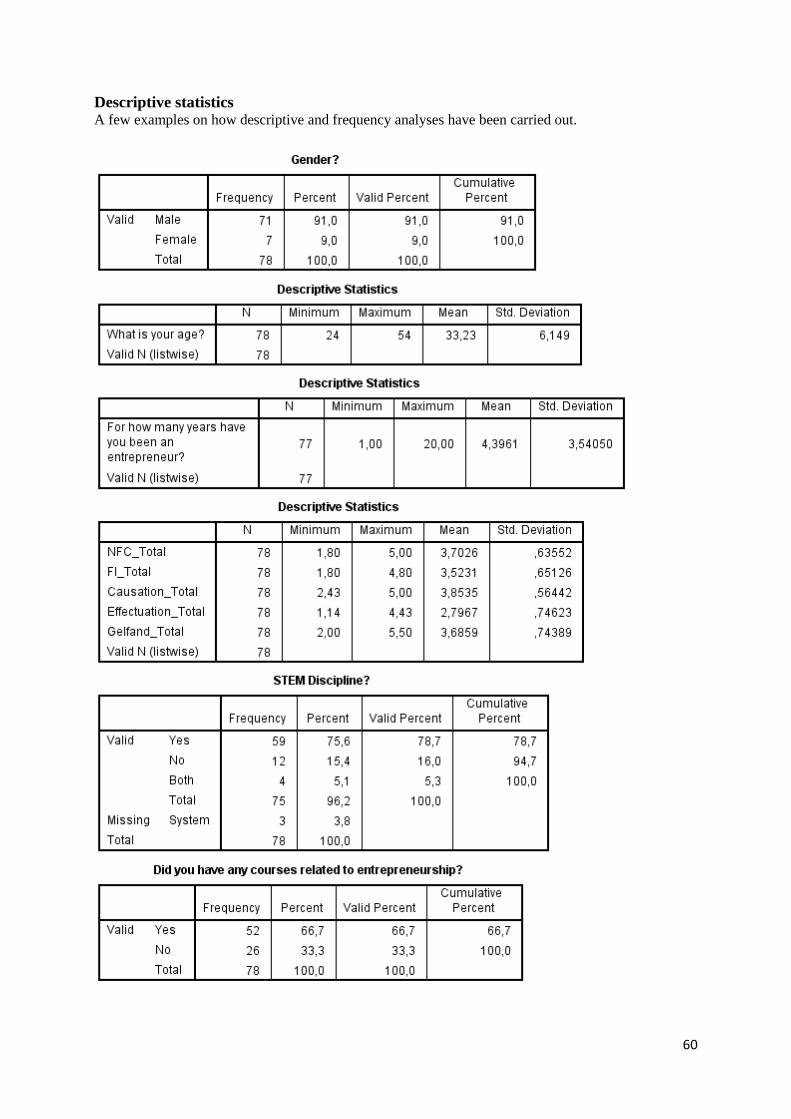
60
Descriptive statistics A few examples on how descriptive and frequency analyses have been carried out.