
The influence of business intelligence components on the .../67531/metadc271912/m2/1/high... ·...
113
APPROVED: Mary C. Jones, Major Professor and Chair of the Department of Information Technology and Decision Sciences Anna Sidorova, Committee Member Victor Prybutok, Committee Member Audhesh Paswan, Committee Member O. Finley Graves, Dean of the College of Business Mark Wardell, Dean of the Toulouse Graduate School THE INFLUENCE OF BUSINESS INTELLIGENCE COMPONENTS ON THE QUALITY OF DECISION MAKING Lucian L. Visinescu Dissertation Prepared for the Degree of DOCTOR OF PHILOSOPHY UNIVERSITY OF NORTH TEXAS May 2013
Transcript of The influence of business intelligence components on the .../67531/metadc271912/m2/1/high... ·...
APPROVED: Mary C. Jones, Major Professor and Chair
of the Department of Information Technology and Decision Sciences
Anna Sidorova, Committee Member Victor Prybutok, Committee Member Audhesh Paswan, Committee Member O. Finley Graves, Dean of the College of
Business Mark Wardell, Dean of the Toulouse
Graduate School
THE INFLUENCE OF BUSINESS INTELLIGENCE COMPONENTS ON THE
QUALITY OF DECISION MAKING
Lucian L. Visinescu
Dissertation Prepared for the Degree of
DOCTOR OF PHILOSOPHY
UNIVERSITY OF NORTH TEXAS
May 2013

Visinescu, Lucian L. The influence of business intelligence components on the
quality of decision making. Doctor of Philosophy (Business Computer Information
Systems), May 2013, 104 pp., 27 tables, 3 figures, references, 113 titles.
Decision makers require the right information at the right time, in the right place
and in the right format so that they can make good decisions. Although business
intelligence (BI) has the potential to improve decision making, there is little empirical
evidence of how well this has been achieved. The purpose of this dissertation is to
examine the quality of decisions made using BI. The research question it addresses is
what are the key antecedents of decision quality for users of business intelligence
systems? The theoretical support for the model is developed based on the literature
review that draws on decision support systems (DSS), group decision support systems
(GDSS), and BI. Grounded on this literature review, the antecedents of decision quality
are operationalized in this dissertation through independent variables such as the
problem space complexity, the level of BI usage, the BI user experience, and
information quality. The dependent variable is operationalized as decision quality and it
captures the self-satisfaction with a decision made by users in a BI environment. The
research model was tested using a survey of BI users whose names were provided by a
marketing company. This research suggests that BI user experience is a more complex
construct than has been initially thought.

Copyright 2013
by
Lucian L. Visinescu
ii

ACKNOWLEDGEMENTS
I would like to thank my dissertation chair, Dr. Mary Jones, for her support and
patience. Without her feedback and advice, I would not be able to complete my
dissertation on a timely fashion. I would like to express my gratitude to the members of
my committee, Dr. Sidorova, Dr. Prybutok, and Dr. Paswan for their support and
valuable comments towards improving my dissertation. I also would like to thank all the
other professors and staff personnel in the Department of Information Technology and
Decision Sciences that I met during my Ph.D. studies. My thanks and gratitude also
goes to my family: my mom, my sister, my aunts and uncles, and my grandparents.
Their unconditional love and prayers helped me through the difficult times, and I am
glad that I could make them proud by being the first to pursue a Ph.D. in the family.
I would like to dedicate my dissertation to my father who passed away shortly
after I defended my dissertation and didn’t have the chance to see me receiving my
degree.
iii
TABLE OF CONTENTS
Page ACKNOWLEDGEMENTS ............................................................................................... iii LIST OF TABLES ............................................................................................................vi LIST OF FIGURES ........................................................................................................ viii CHAPTER 1 INTRODUCTION ........................................................................................ 1 CHAPTER 2 LITERATURE REVIEW ............................................................................. 5
2.1 Decision Quality .............................................................................................. 8
2.2 BI Information Quality / Data Quality ............................................................ 12
2.3 BI User Experience ....................................................................................... 14
2.4 Level of BI Use ............................................................................................. 16
2.5 Problem Space Complexity .......................................................................... 17
2.6 Research Model and Hypotheses ................................................................. 21 CHAPTER 3 METHODOLOGY .................................................................................... 27
3.1 Research Design .......................................................................................... 27
3.2 Survey Administration ................................................................................... 28
3.3 Research Population and Sample ................................................................ 29
3.4 Reliability and Validity Issues ....................................................................... 30
3.5 Instrument Design and Development ........................................................... 33
3.6 Hypotheses Testing ...................................................................................... 35 CHAPTER 4 DATA ANALYSIS AND RESULTS .......................................................... 37
4.1 Response Rate and Non-Response Bias ..................................................... 37
4.2 Treatment of Missing Data and Outliers ....................................................... 42
4.3 Demographics .............................................................................................. 44
4.4 Exploratory Factor Analysis and Internal Consistency .................................. 45
4.5 Ex Post Facto Analyses ................................................................................ 59
4.6 BI User Experience ....................................................................................... 59
4.7 Problem Space Complexity .......................................................................... 61
iv

CHAPTER 5 DISCUSSION AND CONCLUSIONS ...................................................... 64
5.1 Problem Space Complexity and Decision Quality ......................................... 64
5.2 Information Quality and Decision Quality ...................................................... 65
5.3 BI User Experience and Decision Quality ..................................................... 65
5.4 Level of BI Use and Decision Quality ........................................................... 66
5.5 BI User Experience, Information Quality and Decision Quality ..................... 67
5.6 Problem Space Complexity, Information Quality and Decision Quality ......... 68
5.7 Limitations .................................................................................................... 68
5.8 Research Contributions ................................................................................ 69
5.9 Contributions to Practice............................................................................... 71
5.10 Conclusions ................................................................................................ 72 APPENDIX A THE SURVEY INSTRUMENT ............................................................... 74 APPENDIX B INVITATION TO PARTICIPATE IN THE STUDY .................................. 80 APPENDIX C INTER-ITEM CORRELATION ............................................................... 82 APPENDIX D PARAMETERS ESTIMATES WITH VIF ................................................ 88 APPENDIX E RIDGE REGRESSION K’s ESTIMATES ............................................... 90 APPENDIX F RIDGE REGRESSION RESULTS ......................................................... 94 REFERENCES .............................................................................................................. 96
v

LIST OF TABLES
Page
Table 1 Example of Articles Defining Decision Quality .................................................. 8
Table 2 Examples of Theories Related to Decision Quality ......................................... 10
Table 3 Definitions of Problem Space and Problem Space Complexity ....................... 19
Table 4 Operationalization of the Independent and Dependent Variables ................... 34
Table 5 Hypotheses and Statistical Tests .................................................................... 36
Table 6 Independent Samples t-Tests for Non-response Bias ..................................... 39
Table 7 Independent Samples t-Tests for Non-response Bias - Demographics ............ 39
Table 8 Independent Samples t-Tests Pilot Data Set vs. Main Data Set ...................... 41
Table 9 Independent Samples t-Tests Pilot Data Set vs. Main Data Set Demographics ...................................................................................................................................... 42
Table 10 Descriptive Statistics for Independent, Moderator and Dependent Variables 43
Table 11 Descriptive Statistics on Respondents’ Demographics ................................. 44
Table 12 Factor Analysis for Decision Quality ............................................................... 46
Table 13 User Experience with BI Factor Analysis (I) ................................................... 46
Table 14 User Experience with BI Factor Analysis (II) .................................................. 47
Table 15 User Experience with BI Factor Analysis (III) ................................................. 48
Table 16 Problem Space Complexity Factor Analysis (I) .............................................. 49
Table 17 Problem Space Complexity Factor Analysis (II) ............................................. 50
Table 18 Problem Space Complexity Factor Analysis (III) ............................................ 51
Table 19 Problem Space Complexity Factor Analysis (IV) ............................................ 52
Table 20 Information Quality Factor Analysis ................................................................ 52
Table 21 Level of BI Use Factor Analysis ..................................................................... 53
Table 22 Discriminant Validity Assessment ................................................................... 54
vi

Table 23 Tests of Between-Subjects Effects – Dependent Variable: Decision Quality . 55
Table 24 Parameters Estimates – Dependent Variable: Decision Quality ..................... 55
Table 25 Summary of Hypothesis Testing ..................................................................... 56
Table 26 Ex. Post Facto Analysis of BI User Experience – Dependent Variable: Decision Quality ............................................................................................................ 61
Table 27 Ex. Post Facto Analysis of Problem Space Complexity – Dependent Variable: Decision Quality ............................................................................................................ 63
vii

LIST OF FIGURES
Page
Figure 1. Contextual model. ........................................................................................... 7
Figure 2. BI systems and types of problems. ................................................................ 20
Figure 3. Research model for decision quality. ............................................................. 21
viii

CHAPTER 1
INTRODUCTION
The term business intelligence (BI) was first coined in 1989 by Dresner, a
research analyst from Gartner (Watson and Wixom, 2007). The term was widely
embraced by both practitioners and academia. BI has been characterized in research
as part of a larger class of systems that are designed to reduce uncertainty in the
decision making process (Arnott and Pervan, 2005; Clark et al., 2007). This class
includes systems whose underlying premise centers around efficient and effective
support of the decision maker, and it includes traditional decision support systems and
executive information systems (Arnott and Pervan, 2005; Konsynski, 1988). It also
includes systems whose underlying premise centers around the problem situation itself
(Alter, 2004; Oppong et al., 2005). BI is included in this group of systems (Schultze and
Leidner, 2002). BI provides decision makers with data, information, or knowledge to
address decisions about problems specific to the individual decision maker’s needs and
then can be ‘rolled up’ to support broader organizational level decision making (Clark et
al., 2007). It is a combination of data gathering, data storage and knowledge
management that, along with analytical tools, helps decision makers to “improve the
timeliness and quality of the input into the decision process” (Gray, 2006 p. 137).
The quality of decisions has been studied in the field of decision support systems
(DSS) and it spans a profusion of domains from medicine (Helmons et al., 2010) to
computers (Bharati and Chaudhury, 2004), to business (Raghunathan, 1999). Research
has addressed some of the variables that determine the quality of decisions based in a
business intelligence environment (Raghunathan, 1999; Nau 1983; Marshall and de la
1

Harpe 2009). However there are few, if any, studies that attempt to integrate and
evaluate the impact of the use of business intelligence on the quality of decisions made
by decision-makers.
With the advent of BI, organizations started to realize the benefits of using BI
systems (Negash and Gray, 2008). Therefore new tools for data analysis, data
extraction, visualization, and data warehousing were in high demand. The expectation
was that managerial experience enhanced with BI tools would lead to better decision
making. Evidence, however, suggests that BI does not consistently live up to those
expectations (Watson et al., 2006; Solomon, 2005). Research posits a variety of
reasons for BI failures (Watson and Wixom, 2007; Nelson, 2010) yet the focus is largely
either on factors intrinsic to the BI, such as technical and data related issues, or on
factors surrounding the organization in which BI operates, including organizational
readiness or alignment of BI with organizational goals (Watson and Wixom, 2001; 2007;
Nelson, 2005; 2010; McMurchy, 2008).
There is also a good bit of research that focuses on BI success, with an eye
toward defining success either in terms of objective financial or other metrics (Gessner
and Volonino, 2005; Lonnnqvist and Prittimaki, 2006) or in terms of satisfaction with BI
(Davison, 2001). The difficulty and complexity of measuring decision quality has been
extensively discussed in the literature, and decision theory has been explored in the
information technology context. Unfortunately, little or no empirical work addresses
decision quality in the context of management support systems such as BI (Clark et al.,
2007). This dissertation seeks to answer the following research question:
1. What are the key antecedents of decision quality for users of business intelligence systems?
2
2. In what way do these key antecedents influence the decision quality?
3. What are the implications of the influence of the key antecedents of decision quality for academia and practitioners?
On the technological side, BI uses different types of application software
designed to report, analyze, and present data. Types of BI applications that are widely
used include spreadsheets, online analytical processing (OLAP), digital dashboards,
reporting and querying software, decision engineering, data mining, business
performance management, process mining, local information systems, and artificial
intelligence. On the managerial side, BI enables interactive access and transformation
of data to provide users the ability to conduct appropriate analysis related to their
responsibility in the company (Turban et al., 2008). BI draws its origins from reporting
management information systems (MIS), decision support systems (DSS), and
executive information systems (EIS).
This dissertation investigates the influence of BI on decision quality at the
decision maker level of analysis across levels of the organization. The primary focus is
on the factors that affect the quality of decisions made. These factors are elements of BI
that have been identified in the literature as potential key success factors in BI decision
quality. Much of the research that addresses decision quality is found in the decision
support systems (DSS) area (Arnott and Pervan, 2005). Although DSS research
provides a solid foundation on which to further our understanding of BI related decision
quality, it alone is not sufficient. Although BI and DSS can each be classified as part of a
larger category of systems that support decision making called management support
systems (MSS), each takes quite different forms in practice (Clark et al., 2007).
3

The constructs used in this study are defined and operationalized in Chapter 2.
Data are collected from business firms located in the United States. The firms are
randomly selected, and contact information of decision makers are obtained from a
publicly available mailing list from a market research company, MERIT DIRECT
HIGHER GROUND Inc., which maintains a business intelligence network e-mail list that
is a collection of over 89,840 corporate BI users.
This dissertation has implications for both academicians and practitioners. For
academicians, the study may provide value in framing a perspective on BI factors that
influence the quality of decision based on theory and empirical testing. For practitioners,
the study provides insights on what factors to consider enhancing the quality of decision
made using BI tools.
The remaining of the dissertation is organized as follow. In Chapter 2, based on
the literature review the theoretical support for the model is developed and hypotheses
based on the theoretical model are proposed. Chapter 3 provides a discussion of the
methodology used for testing the proposed hypotheses along with the measurements
used for each construct. In Chapter 4, the results of the study are presented. Chapter 5
contains discussions regarding the findings along with limitations of the study, its
implications, and directions for further research.
4

CHAPTER 2
LITERATURE REVIEW
This chapter provides a discussion of prior research that motivates and forms the
foundations for this study. First, it discusses the importance of BI for decision makers at
all levels of the organization. Second, it presents a research model for investigating the
relationship between business intelligence (BI) factors that influence decision quality
based on a literature review that helps the reader to understand the general framework
of this dissertation. Third, it proposes the hypotheses tested in this study.
Decision makers require the right information at the right moment in the right
place and in the right format so that they can make good decisions. This applies to
decisions made at all levels of the organization; the strategic level, the tactical level, and
the operational level (Golfarelli et al., 2004). At the strategic level an organization
establishes and plans its goals and objectives to achieve and keep its competitive
advantage. A BI system should be consistent with and provide support to the business
strategy to enhance the interpretations of weak signs and improve the decision process
for strategic level decision makers (Rouibach and Ould-ali, 2002). The tactical, or
middle, level decisions made by different departments or units within the organization
should also be consistent with organizational strategy. For example, Continental
Airlines’ real-time business intelligence system illustrates the synergy between an
organization’s strategic, operational and tactical decision support (Anderson-Lehman et
al., 2004). In the mid 1990’s Continental Airlines ranked last in performance, customers
satisfaction and ROI among the U.S. airlines. With the nomination of a new CEO, the
company started a restructuring program that culminated with the implementation of a
5
BI real-time data warehouse tool. This enabled Continental’s personnel to make more
efficient decisions and to know their customers better. It enabled them to provide
customized services. For example, the price of tickets was tailored per customer. As a
result the ROI increased over 1000% from 1998 to 2004 (Anderson-Lehman et al.,
2004).
Decision making at the operational level addresses the optimization and
implementation of the processes that are used to accomplish tactical requirements. This
requires coordination and synthesis of large amounts of data from a variety of sources,
including transaction processing systems. Thus, BI can be quite useful in providing
support for operational level decisions. For example, at the operational level,
Continental Airlines used the implementation of a real-time data warehouse to monitor
“on-time performance throughout the day and make operational decisions about
catering, personnel, and gate traffic flow” (Anderson-Lehman et al., 2004, p. 2).
Although BI has the potential to improve decision making, there is little empirical
evidence of how well this has been achieved. The little evidence about BI success or
failure focuses largely on measures of systems success outcomes such as BI benefits,
ROI or user satisfaction (Eckerson W. W., 2003; 2005; Negash, 2004). While this
research is important to informing our collective understanding about BI, it is not
sufficient. There is still conflicting evidence about what constitutes BI success and its
antecedents (Clark et al., 2007).
A key goal of management support systems is to improve the effectiveness of
decision making (Scott et al., 2004). Yet, without a direct measure of this, it is difficult to
determine whether the BI actually meets that goal. For example, an organization may
6

achieve high returns on investment from the implementation of a system, yet still be a
long way from the quality of decisions that it could achieve under a different approach to
managing or using the MSS (Scott et al., 2004). BI systems have grown from decision
support systems (DSS) designed to support managerial activities in an organization
(Power, 2010), therefore there is a logical connection between management support
systems in general and BI. We argue that the quality of decisions made using BI is a
critical component to closing that gap because the decision is the consequent factor
most directly and temporally linked to the BI. Therefore, in this dissertation, we examine
how BI influences the quality of decision making. This chapter provides a discussion of
relevant prior research that is organized around factors that are indicated in the
literature to be antecedents of decision quality in the BI context. The organization
follows the relationships shown in the contextual model in Figure 1. A more detailed
research model is provided later in the chapter after the hypothesis development
discussion.
Figure 1. Contextual model.
Decision Quality
BI FACTORS
• Information/data quality • User experience • Level of BI use • Problem space complexity
7
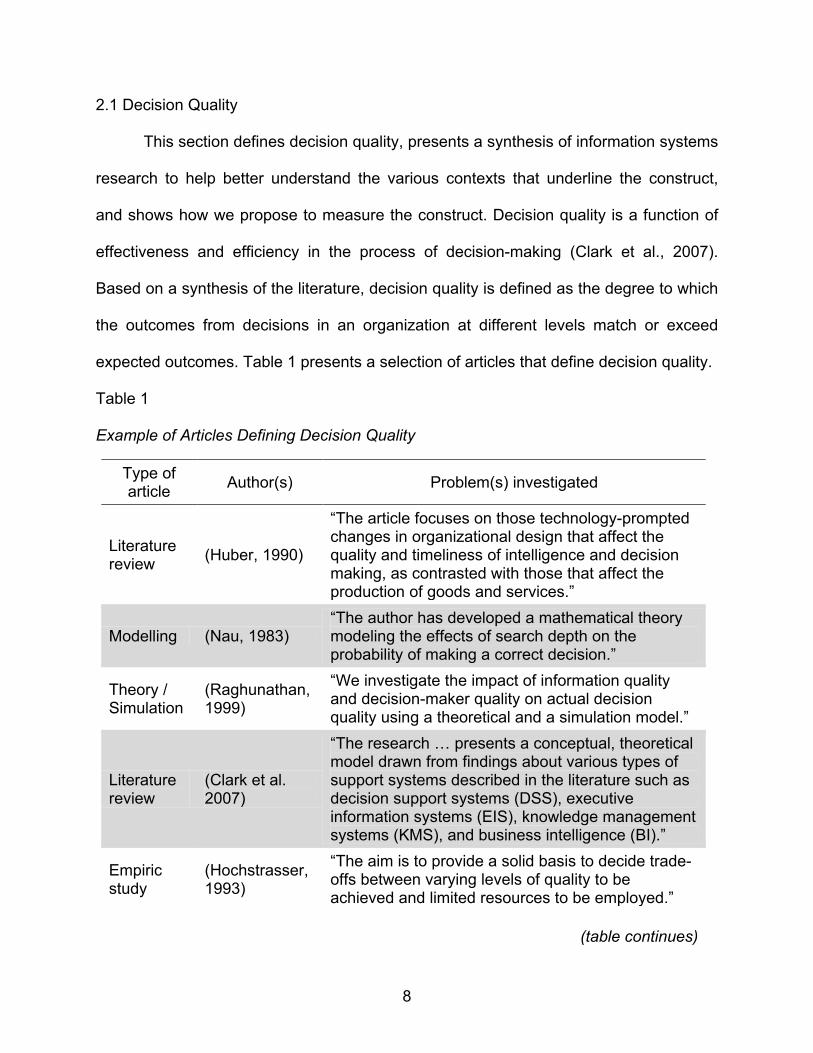
2.1 Decision Quality
This section defines decision quality, presents a synthesis of information systems
research to help better understand the various contexts that underline the construct,
and shows how we propose to measure the construct. Decision quality is a function of
effectiveness and efficiency in the process of decision-making (Clark et al., 2007).
Based on a synthesis of the literature, decision quality is defined as the degree to which
the outcomes from decisions in an organization at different levels match or exceed
expected outcomes. Table 1 presents a selection of articles that define decision quality.
Table 1 Example of Articles Defining Decision Quality
Type of article Author(s) Problem(s) investigated
Literature review (Huber, 1990)
“The article focuses on those technology-prompted changes in organizational design that affect the quality and timeliness of intelligence and decision making, as contrasted with those that affect the production of goods and services.”
Modelling (Nau, 1983) “The author has developed a mathematical theory modeling the effects of search depth on the probability of making a correct decision.”
Theory / Simulation
(Raghunathan, 1999)
“We investigate the impact of information quality and decision-maker quality on actual decision quality using a theoretical and a simulation model.”
Literature review
(Clark et al. 2007)
“The research … presents a conceptual, theoretical model drawn from findings about various types of support systems described in the literature such as decision support systems (DSS), executive information systems (EIS), knowledge management systems (KMS), and business intelligence (BI).”
Empiric study
(Hochstrasser, 1993)
“The aim is to provide a solid basis to decide trade-offs between varying levels of quality to be achieved and limited resources to be employed.”
(table continues)
8

Table 1 (continued).
Type of article Author(s) Problem(s) investigated
Literature review
(Gilmore, 1998)
“The focus…considers quality in management performance, particularly in relation to good management decision making, and resultant marketing activity against a background of organizational variables and environmental change.”
Modelling (Liberatore & Pollack-Johnson, 2009)
“This paper presents a mathematical programming model that allows quality to be explicitly considered in project planning and scheduling, while addressing the trade-offs between quality, time, and cost. A quality function is used to represent the relationships between time, cost, and quality for individual tasks.”
Literature review (Rausch, 2007)
“The paper seeks to explain the need for inclusion of a segment on criteria for decision quality in management and leadership education and in management development programs”
Empirical study
(Carmeli & Schaubroeck, 2006)
“This study examined the role of TMT behavioral integration in explaining the quality of strategic decisions and how these constructs together influenced organizational decline.”
Traditionally, decision quality processes in information technology (IT) were
applied from an accounting perspective, but this perspective was not found effective for
less quantifiable factors, such as better customer relationships or improved marketing
(Hochstrasser, 1993). As a result, several alternative frameworks and models grounded
in different theories emerged in the literature. One of the frameworks takes into
consideration the scarcity of resources in an organization and is centered on an iterative
process composed of quality standards, quality awareness, quality performance
indicators and quality value is suggested as a solution for decision quality
(Hochstrasser, 1993). One of the models that display the impact of information quality
9
and decision-maker quality on decision quality proposes that “the quality of the output
depends on the quality of the inputs and the quality of the process that transforms the
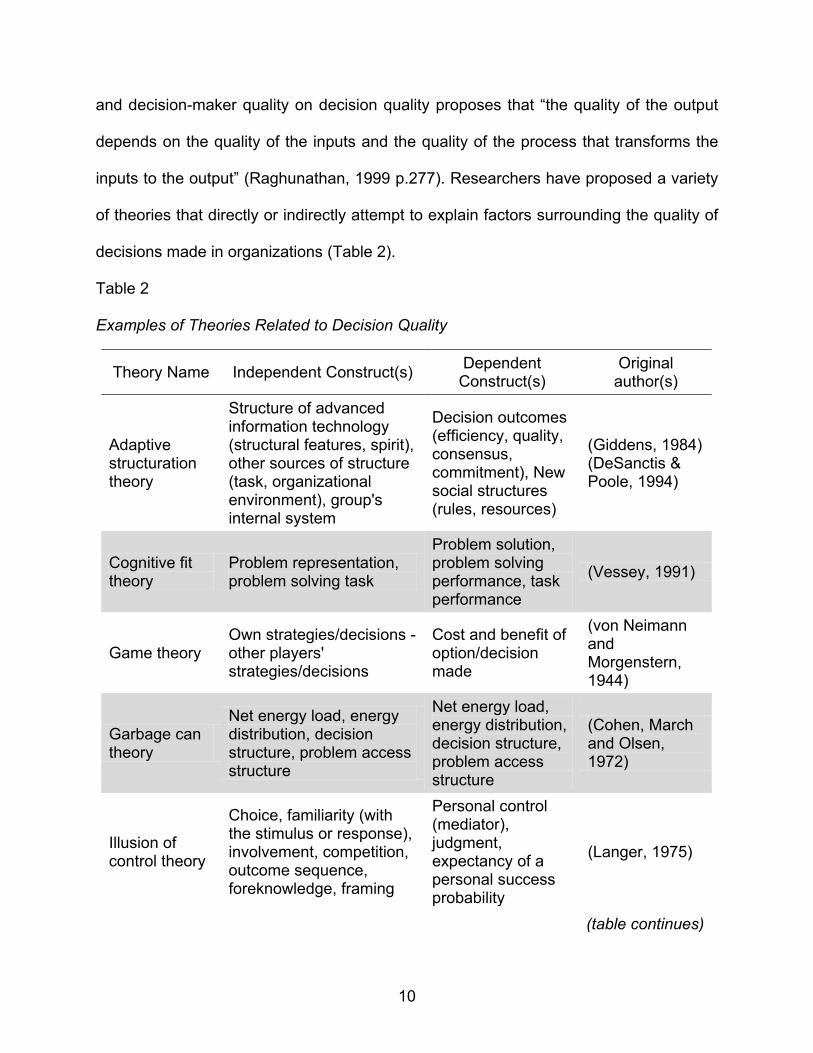
inputs to the output” (Raghunathan, 1999 p.277). Researchers have proposed a variety
of theories that directly or indirectly attempt to explain factors surrounding the quality of
decisions made in organizations (Table 2).
Table 2 Examples of Theories Related to Decision Quality
Theory Name Independent Construct(s) Dependent Construct(s)
Original author(s)
Adaptive structuration theory
Structure of advanced information technology (structural features, spirit), other sources of structure (task, organizational environment), group's internal system
Decision outcomes (efficiency, quality, consensus, commitment), New social structures (rules, resources)
(Giddens, 1984) (DeSanctis & Poole, 1994)
Cognitive fit theory
Problem representation, problem solving task
Problem solution, problem solving performance, task performance
(Vessey, 1991)
Game theory Own strategies/decisions - other players' strategies/decisions
Cost and benefit of option/decision made
(von Neimann and Morgenstern, 1944)
Garbage can theory
Net energy load, energy distribution, decision structure, problem access structure
Net energy load, energy distribution, decision structure, problem access structure
(Cohen, March and Olsen, 1972)
Illusion of control theory
Choice, familiarity (with the stimulus or response), involvement, competition, outcome sequence, foreknowledge, framing
Personal control (mediator), judgment, expectancy of a personal success probability
(Langer, 1975)
(table continues)
10

Table 2 (continued).
Theory Name Independent Construct(s) Dependent Construct(s)
Original author(s)
Information processing theory
External stimulus
Perception, thinking, learning, memory, attention, creativity and reasoning
(Miller, 1956)
Organizational informational processing theory
Information processing needs, information processing capability
Information processing performance
(Galbraith, 1973)
Prospect theory
Sunk cost, risk preference of decision-maker/evaluator, decision domain, project size, presence or absence of an alternative course of action, price hedonic value, psychological determinant of decision maker, social determinants of group surrounding decision maker, project determinants, and structural determinants of environment.
Escalation of commitment to IT projects, software completion time and budgets, technology investment decisions, software project bidding price, information goods pricing, online bidder satisfaction.
(Kahneman and Tversky, 1979)
There are several common themes through all of these theories. One is that all
use some measure of decision or decision maker performance as an indicator of
decision quality. Several use satisfaction or perception as an indicator of acceptable
performance (Galbraith, 1973; Vessey, 1991) while others use success to indicate
acceptable performance (Langer, 1975). One of the approaches in defining decision
quality is the use of experts who are called to identify what constitute a “best” decision
and what constitute the appropriate criteria to achieve a high level of decision quality
11

(Ross, 1974; Jacoby, 1977). Thus, decision quality outcomes are measured using
perceived decision maker satisfaction with the outcome as surrogates for decision
quality. In addition, game theory suggests that strategies and decisions are closely
related to the cost or benefit of these decisions (von Neimann and Morgenstern, 1944).
It is therefore essential to understand the gap between strategies and decisions as the
gap between expectation and performance. Expectation confirmation theory suggests
that expectation, perceived performance, and disconfirmation are closely related to
satisfaction. This facilitates the understanding of our determinant variable by suggesting
the presence of quality decision making in the context of antecedents that “fill the gap”
between expected and resultant outcomes.
Based on a synthesis of the aforementioned research about decision quality, we
propose to conceptualize decision quality as the contention with the outcome resulted
from a decision making process.
2.2 BI Information Quality / Data Quality
In this section we discuss the influence of data and information on the quality of
decisions, and how we conceptualize data quality. Data is commonly defined as the raw
input or output of a process, whereas information is data that has meaning within a
particular context (Kebede, 2010). Business intelligence is often defined to include the
use and analysis of information that enables improved organizational action and
decision making (Burton et al., 2006). Therefore the quality of information that the BI
produces is critical to the quality of decisions made based on that output. The quality of
data underlying a BI is well cited to be critical to the ability of the BI to support decision
12

making (Kebede, 2010; Schulper et al., 2000). Therefore, we address both information
and data quality as antecedents of the quality of decisions made using BI.
Both data and information quality influence the quality of a decision-making
process. Theoretical models and simulation analysis provide support for the impact of
information and data quality on decision quality (Raghunathan, 1999). Information
quality is often evaluated through the dimensions of accuracy, completeness, currency,
and format (Nelson et al., 2005). Information quality is sometimes evaluated as the
quality of the information system output and as a surrogate for the quality of system
performance (DeLone and McLean, 1992).
Throughout the information systems (IS) literature there is evidence that
information quality is subject to a variety of errors. These include the fact that multiple
sources of the same information can produce different values; information produced
using subjective judgment leads to bias, systemic errors in information production can
lead to lost information, and large volumes of stored information make it difficult to
access information in a reasonable time (Strong et al. 1997).
Because information and data are heavily related, it is equally important to
examine the role of data quality in decision making using BI. The impact of poor data
quality may take place at three levels: operational impact (lower customer satisfaction,
increased cost, and lower employee satisfaction), tactical impact (lower data warehouse
reliability and increased organizational mistrust of data), and strategic impact
(compromised ability to align organizational units and diversion of management
attention) (Redman, 1998).
13
Organizations operate in social environments characterized by variety and
dynamism. Dynamic decision environments are characterized by different levels of
granularity, high frequency, large variety of decision tasks, and multiple stakeholders
(Shankaranarayan et al., 2003). The quality of data helps manage the complexity of
decision-making. One explanation of the importance and meaningfulness of data quality
for decision makers is provided by Wang and Strong (1996). Their study provides a set
of measurements and proposes a framework for data quality composed of four
categories. The categories are intrinsic data quality, contextual data quality,
representational data quality, and accessibility data quality.
In this study, we measure data quality as an underlying dimension of information
quality because the value of information is grounded in the quality of the data from
which it is derived (Agmon and Ahituv, 1987). The measures that we use are accuracy
(the degree to which information and data are correct, unambiguous, meaningful,
believable, and consistent), completeness (the degree to which information relevant to
the user population is represented), currency (the degree to which information and data
are up to date or reflect the current state of the world that they represent), and format
(the degree to which information and data are presented in a manner that is
understandable and interpretable to the user) (Nelson et al., 2005).
2.3 BI User Experience
In this section we discuss how user experience with BI influences the quality of
decisions users make with BI, and how we propose to measure this construct. Users
influence the quality of BI in a variety of ways across the life of the system. For
14

example, they may be involved in structuring the data warehouse and in the selection of
specific tools for the benefit of the organization as a whole (Turban et al., 2008,
Golfarelli et al., 2004). The development of systems, such as BI, that support decision
making is an iterative process that relies heavily on user participation (Arnott, 2004;
Clark et al., 2007). Users interact both with system analysts and with the system itself
as the development process unfolds (Keen, 1980). Therefore, is it reasonable to initially
posit that user experience plays a role in the quality of decisions made from a BI
insomuch as the users are integrally involved in BI development and refinement.
Although it is generally thought that greater user involvement in the development
of a system results in greater user satisfaction with the system, there is also evidence
that user involvement does not necessarily lead to improved decision making (Clark et
al., 2007). For example, one study has found that decisions made from a system in
which users were more involved in the development were less accurate than those
where such involvement was limited (Lawrence et al., 2002). Research, however, also
indicates user involvement in development is critical for decision support systems that
require extensive or broad knowledge acquisition (Deslandres and Pierreval, 1997). We
argue that user experience is more germane to understanding decision quality rather
than user involvement in the process. User experience relative to BI usage feeds into
the user’s knowledge base from which he/she makes decisions (Hult, 2003). User
experience is gained through active use of the BI and serves to modify or enhance the
knowledge base that they draw upon when making decisions (Arnott, 2004). As users
aggregate their experiences over time, they become more adept at exploring and
exploiting the information in the BI (Clark et al., 2007). Furthermore, they develop better
15

capabilities to absorb and make use of new knowledge in the BI environment
(Kankanhalli et al., 2005).
There is no agreement on the measurement of user experience and whether the
construct has only an individual or a social dimension; however, research has found that
utility, usability, aesthetics, identification, stimulation, and value represents an approach
for measuring user experience (Law et al., 2007). Other studies suggest that user
experience is comprised of a variety of items including managerial, technical,
educational, attitudinal, cognitive, and personality (Gelderman, 1995). In this
dissertation we are interested in measuring non-psychological dimensions of user
experience. We developed the measurement for user experience based on the
observations presented in Gelderman’s (1995) meta-study that taps the extent to which
users understand a variety of BI systems functionality.
2.4 Level of BI Use
In this section we define and discuss how the level of BI use potentially impact
the quality of decisions as well as how we propose to measure this construct. The level
of BI use is defined as the extent to which users employ and rely on the BI to make
decisions (Clark and Jones, 2008). Although it seems tautological to say that an
antecedent of the quality of decisions made using BI is usage of that BI, the relationship
between usage and decision quality goes much deeper than it appears on the surface.
It is often, erroneously, assumed that initial usage of a system upon implementation is
the extent to which it is actually used as its life progresses (Fichman and Kemerer,
1999).
16

The level of usage that occurs immediately upon rollout cannot be sufficient to
realize the potential of system usage to achieve organizational benefits. In the case of
BI, research indicates that its usage may be limited by misunderstandings about the
types of usage for which it is designed (Clark and Jones, 2008). For example, much of
the vendor supplied BI software is targeted toward more sophisticated users to take
advantage of powerful navigation and analytical tools that are beyond the skills or needs
of the majority of users (Eckerson, 2002; Havestein, 2003). This is consistent with
research that indicates that BI use in many organizations, while not still in its infancy,
has not yet reached the level of maturity that enable innovative and game changing
decision making (Hostmann et al., 2007). Therefore, we posit that the level of BI usage
is a critical antecedent to decision making quality. In this study we adapt usage
measurements from a previous study (Jones et al., 2008) that were used to evaluate
utilization of a large scale organizational information system.
2.5 Problem Space Complexity
The problem space is the context of the problem or situation about which a
decision is made (Clark et al. 2007). Problem space complexity is influenced by a
variety of factors including the number of underlying variables, the interaction among
decision variables, how well the variables can be measured and the degree of
uncertainty surrounding the decision (Watson et al., 2004; Beer, 1966; Clark et al.,
2007). Complexity can rise when the decision maker has less time to make the decision
as well as when the decision must be made with more ‘soft’ data (Barthelemy et al.,
2002). In addition, the cognitive or mental map of the decision maker plays a role in the
17

complexity of the problem space. For example, what might be highly complex for a
person with limited understanding of the problem could be less complex for one who
has a better understanding.
BI is often developed to support dynamic and complex problems across a variety
of users. The factors with which decision makers must grapple in the BI arena are often
outside their control and increasingly involve soft data (Anderson-Lehman et al., 2004;
Gessner and Volonino, 2005). For example, decisions about when to offer what to
customers or about innovativeness in the marketplace require the synthesis of many
variables from a variety of sources. Yet, firms have been effective at using BI to support
these types of highly complex decisions (Gessner and Volonino, 2005). Companies
increasingly rely on BI to help support both backward and forward looking decisions
throughout all levels of the organization. There is, however, evidence that organizations
do not adequately understand the role of the problem space and its complexities and
the decisions for which BI is used (Isik et al., 2010). There is also evidence that this lack
of understanding of the link between problem space complexity and decision quality is
one reason that BI maturity is not progressing as quickly as it might otherwise do
(Hostmann et al., 2007). Therefore, problem space complexity is a critical antecedent of
decision making quality.
Problem space and its complexity was investigated in many disciplines, and it
appears that most of the studies are concerned with how to break down the complexity
or how to make the problem space more understandable to the decision maker. When
creating software, developers often partition a problem space through a structural
modularization of large blocks of software or through the functional modularization of
18
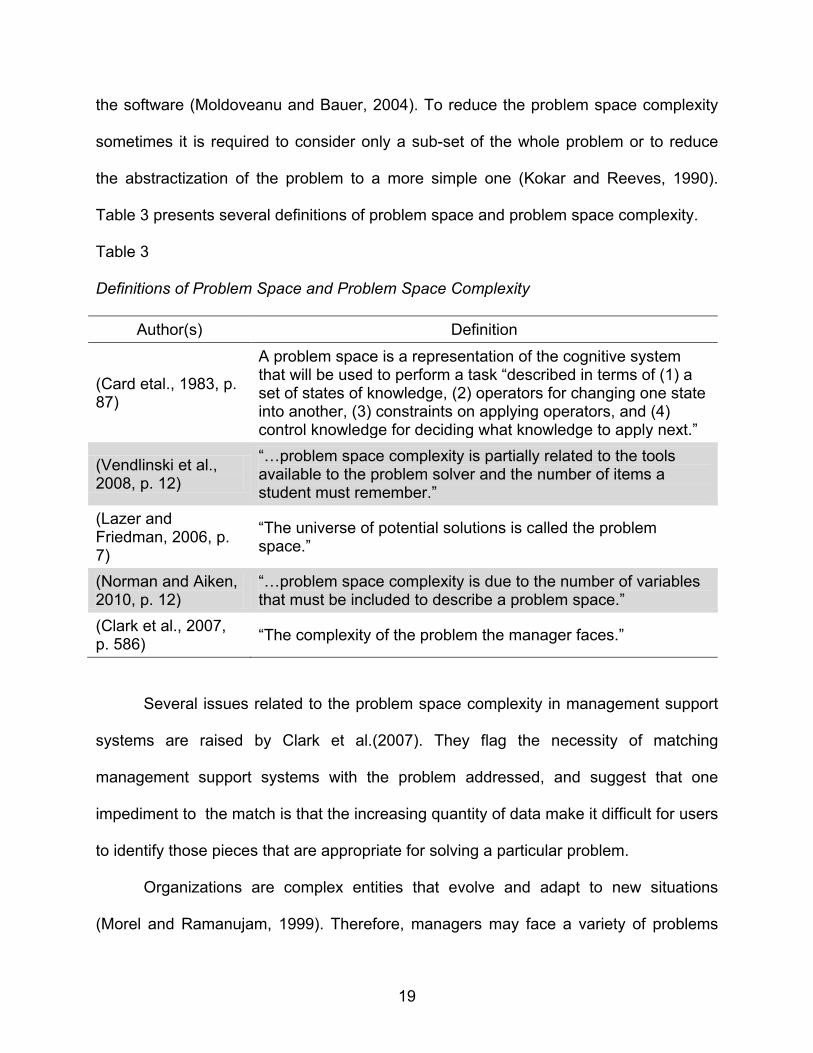
the software (Moldoveanu and Bauer, 2004). To reduce the problem space complexity
sometimes it is required to consider only a sub-set of the whole problem or to reduce
the abstractization of the problem to a more simple one (Kokar and Reeves, 1990).
Table 3 presents several definitions of problem space and problem space complexity.
Table 3
Definitions of Problem Space and Problem Space Complexity
Author(s) Definition
(Card etal., 1983, p. 87)
A problem space is a representation of the cognitive system that will be used to perform a task “described in terms of (1) a set of states of knowledge, (2) operators for changing one state into another, (3) constraints on applying operators, and (4) control knowledge for deciding what knowledge to apply next.”
(Vendlinski et al., 2008, p. 12)
“…problem space complexity is partially related to the tools available to the problem solver and the number of items a student must remember.”
(Lazer and Friedman, 2006, p. 7)
“The universe of potential solutions is called the problem space.”
(Norman and Aiken, 2010, p. 12)
“…problem space complexity is due to the number of variables that must be included to describe a problem space.”
(Clark et al., 2007, p. 586) “The complexity of the problem the manager faces.”
Several issues related to the problem space complexity in management support
systems are raised by Clark et al.(2007). They flag the necessity of matching
management support systems with the problem addressed, and suggest that one
impediment to the match is that the increasing quantity of data make it difficult for users
to identify those pieces that are appropriate for solving a particular problem.
Organizations are complex entities that evolve and adapt to new situations
(Morel and Ramanujam, 1999). Therefore, managers may face a variety of problems
19
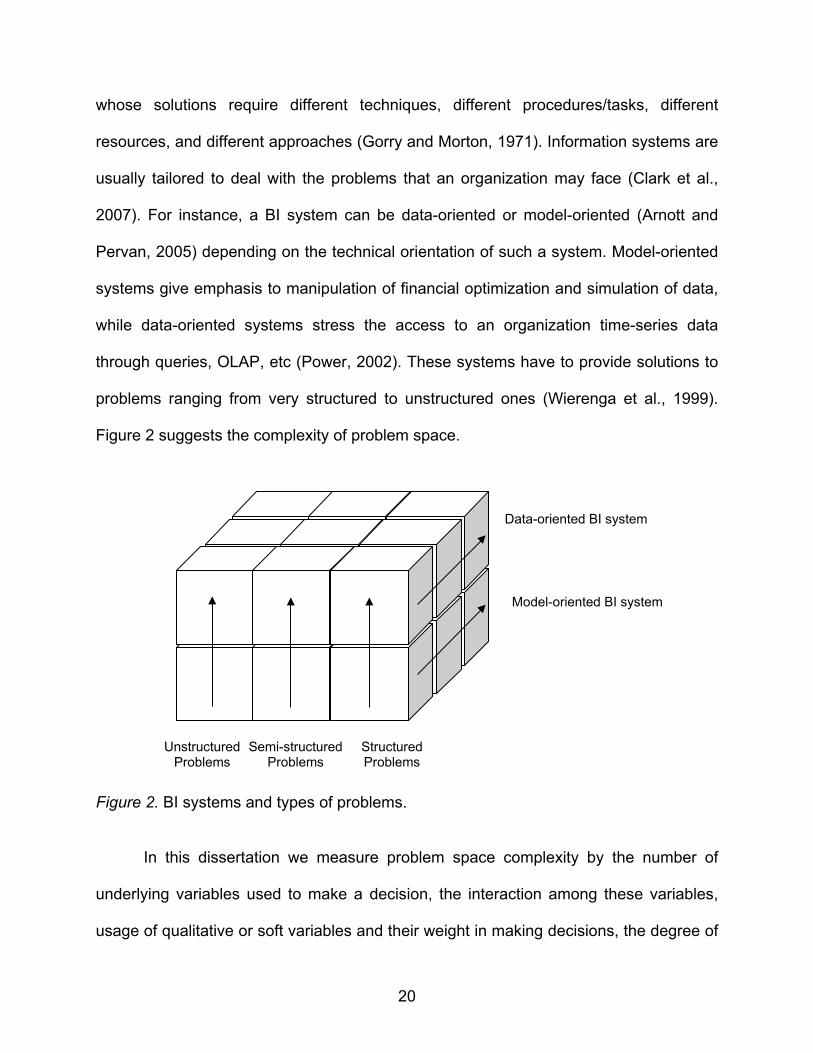
whose solutions require different techniques, different procedures/tasks, different
resources, and different approaches (Gorry and Morton, 1971). Information systems are
usually tailored to deal with the problems that an organization may face (Clark et al.,
2007). For instance, a BI system can be data-oriented or model-oriented (Arnott and
Pervan, 2005) depending on the technical orientation of such a system. Model-oriented
systems give emphasis to manipulation of financial optimization and simulation of data,
while data-oriented systems stress the access to an organization time-series data
through queries, OLAP, etc (Power, 2002). These systems have to provide solutions to
problems ranging from very structured to unstructured ones (Wierenga et al., 1999).
Figure 2 suggests the complexity of problem space.
Figure 2. BI systems and types of problems.
In this dissertation we measure problem space complexity by the number of
underlying variables used to make a decision, the interaction among these variables,
usage of qualitative or soft variables and their weight in making decisions, the degree of
Data-oriented BI system
Model-oriented BI system
Unstructured Problems
Semi-structured Problems
Structured Problems
20
uncertainty surrounding the decision, and the time constraint for making a decision.
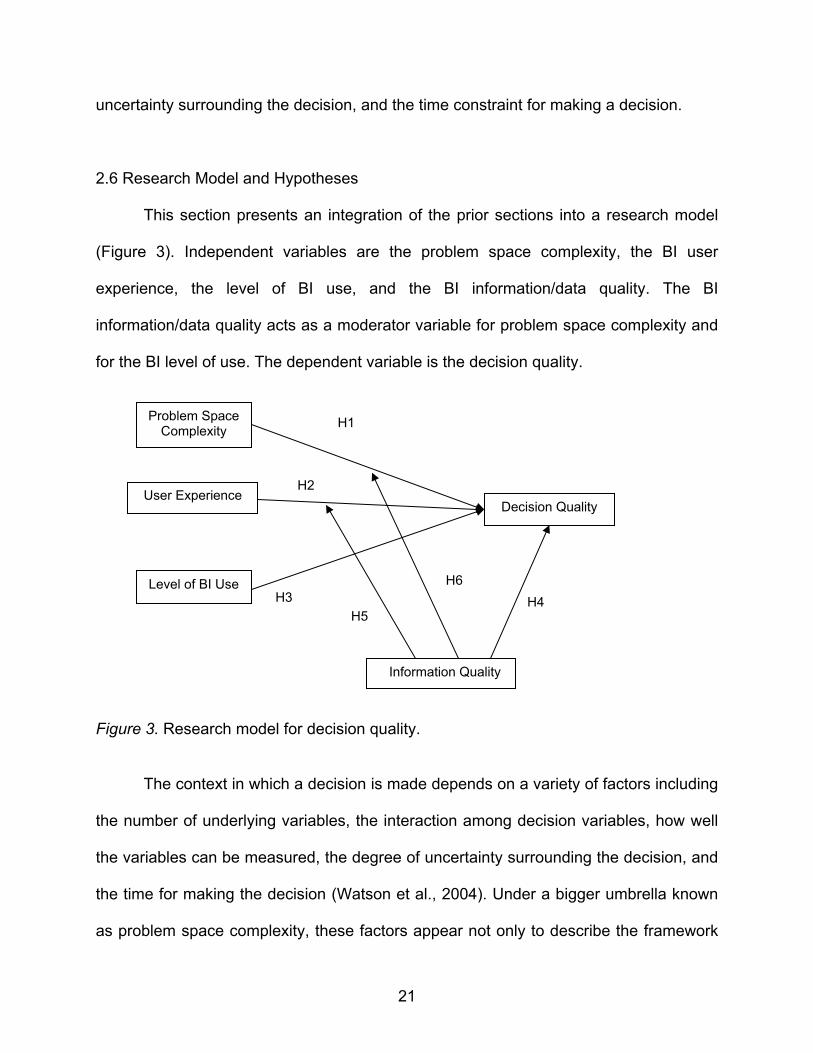
2.6 Research Model and Hypotheses
This section presents an integration of the prior sections into a research model
(Figure 3). Independent variables are the problem space complexity, the BI user
experience, the level of BI use, and the BI information/data quality. The BI
information/data quality acts as a moderator variable for problem space complexity and
for the BI level of use. The dependent variable is the decision quality.
Figure 3. Research model for decision quality.
The context in which a decision is made depends on a variety of factors including
the number of underlying variables, the interaction among decision variables, how well
the variables can be measured, the degree of uncertainty surrounding the decision, and
the time for making the decision (Watson et al., 2004). Under a bigger umbrella known
as problem space complexity, these factors appear not only to describe the framework
Decision Quality User Experience
Problem Space Complexity
Information Quality
H1
H2
H3 H5
Level of BI Use H6 H4
21

for a particular problem, but may also be a part of the problem. Fortunately, BI systems
have been suggested being effective in tackling with these situations (Gessner and
Volonino, 2005). In addition, research has suggested that breaking down a complex
problem into small simpler pieces make easier decision making (Kokar and Reeves,
1990), thus can increase the quality of decision. The common functions of business
intelligence (reporting, online analytics, data mining, complex event processing, etc.)
implemented in existing BI software are design to alleviate the process of business
decision-making.
Research found that people using group decision support systems (GDSS) make
better decisions than groups not using GDSS and that GDSS support improve decision
quality especially when it comes to difficult problems (Gallupe and DeSanctis, 1988).
Comparing to non-GDSS settings, GDSS environments are more effective in solving
complex problem and requires more time for solving low complexity problems than for
high complexity problems, generating higher satisfaction for solving high complexity
problems (Bui and Sivasankaran, 1990). As BI systems have grown out from data-
driven DSS (Power, 2010) research findings in DSS studies as well as in GDSS studies
can extend their results validity to research in BI.
Following the logic used by Gallupe and DeSanctis (1988), this dissertation
posits that more difficult tasks require a more intellectual effort for analyzing
data/information available for a particular decision. The BI user considers many
alternative decisions before making the best decision. Dealing with multiple alternatives
requires not only an increased cognitive load, but also requires the use of all the
available resources in a BI environment. By providing users with tools that help the
22
decision making process, BI systems are expected to increase the quality of decision.
Therefore in the context of BI, we hypothesize:
• H1: The higher problem space complexity, the higher the quality of decision.
User experience with BI tools contributes to the enhancement of their own
knowledge about processes, actions, and decisions. Indeed, beyond user’s satisfaction
involved in the development of a BI system, research has shown that experience gained
through the use of BI improve the decisions that individuals make (Arnott, 2004). In
addition, experienced users have been demonstrated to rely more frequently on existing
data in the systems when making a decision than inexperienced users (Fisher et al.,
2003). Moreover, in accounting research there is evidence that experts have finer
knowledge than novices because experts are more consistent with organizations’
standards. This knowledge gap suggests that experts make better decision than
novices (Bedard, 1991).
Modern BI systems include knowledge management systems (KMS) that
improve the quantitative and qualitative value of the knowledge available to different
categories of decision makers (Cody et al., 2002). However, there is evidence that in
organizational environments in which KMS has a dominant role, novices tend to strictly
adopt the exiting knowledge in the system, and this may lead to poor decisions (Arnold
et al., 2006). Since experience represents practical knowledge derived from direct
observation or participation in different activities, experienced users can undergo less
cognitive efforts while navigating a BI system in search for the appropriate/best
necessary information and tools they need for making decisions. As a result,
experienced users can easily access enhanced information for the decision, and this
23
can lead to a better decision. Therefore, we hypothesize that:
• H2: The quality of decisions made by experienced users is greater than that of inexperienced users.
Research has long supported the idea that the level or extent of use of systems
that support decision making impact the decision making process (Leidner and Elam,
1995). Although there is conflicting evidence about the nature of this relationship
(Srinivasan, 1985), there is evidence that the breadth and depth of usage impacts the
quality of decisions made in the context of BI support (Clark and Jones, 2008).
BI was defined as an umbrella term that describes "concepts and methods to
improve business decision making by using fact-based support systems” or data-driven
DSS (Power, 2010). GDSS settings were found more effective in solving problems than
non-GDSS settings (Bui and Sivasankaran, 1990). Not having a fact-based support
system may be also translated to having such a system and not using it. Therefore,
different degrees of use of any such systems, including BI systems can result in
different degrees of the quality of decisions.
The use of BI systems can lead to the reliance on the information, data, tools and
models provided by the system. This means that the decisions would be more data
driven than emotionally driven. It is expected that BI systems lead to better decisions.
Therefore, we hypothesize that:
• H3: The higher the level of use of the BI system the higher the quality of decision making.
Data that underlie a BI system originate from a variety of sources and must obey
an established format exhibiting qualitative attributes including accuracy, completeness,
and currency (Nelson et al., 2005). Unfortunately, BI information (data with meaning i.e.
24

Kebede 2010) is often subject to errors that impede the quality of decisions made based
upon that data. BI users are therefore exposed to the risk of using inaccurate
information or data that may result in erroneous decisions. Indications of poor
information or data quality have been witnessed having negative influence at
operational, tactical and strategic level decisions (Redman, 1998). Therefore we argue
that information quality as well as data quality may impact the quality of decision
makers. We hypothesize:
• H4: The higher the quality of information in the BI system, the higher the quality of decision.
One reason people use information systems to support decision making is to
improve the quality of the decisions made (Gelderman, 1995). The quality of data
underlying these systems is the key to the ability of a system to facilitate decision
making (Schulper et al., 2000). Even the most experienced users cannot make high
quality decisions based on incorrect or missing data or flawed information. One of the
most powerful aspects of a BI system, however, is its ability to harness and synthesize
vast quantities of data into information (Watson et al., 2004). BI systems help augment
the decisions making process by providing decision makers with data and information in
a way that they are generally unable to do alone. Thus, data and information quality are
necessary antecedents of high quality decisions. Furthermore, we argue that the more
experienced the user, the better able he/she is to use the information provided by the
system to make better decisions. While poor information can directly impede the
decisions made regardless of the experience of the user, we hypothesize that:
• H5: Information quality negatively moderates the relationship between user experience and decision quality.
25

One of the triggers for organizational implementation of management information
systems may be that of solving problems that can help an organization maintain or gain
competitive advantage. The complexity of problems that mangers face (Clark et al.,
2007) has been suggested to be partially related to the tools available to solve the
problems (Vendlinski et al., 2008). An implemented BI system contains tools as well as
information and data stored in the organizational system. As BI is deemed to be shaped
for a specific organization (Clark et al., 2007) information and data existing in the
system may help break down the complexity of a problem thus increasing the likelihood
of decision quality (Barthelemy, et al., 2002).
When faced with complex problems, users tend to use BI systems hoping to find
the necessary help for better decision quality (Cody et al., 2002). However, strictly
adopting the existing knowledge in the system may lead to poor decisions (Arnold et al.,
2006) especially in the presence of incomplete information. Everything else being equal,
one can think that low information quality residing in BI systems negates the benefit that
the entire systems would bring in helping decision makers develop better solutions.
Consequently, information quality can negatively impact the relationship between the
complexity of problem in a BI environment and decision quality resulting from the
solution of the complex problem. In addition, high problem space complexity requires
taking in consideration many variables; therefore the decision is less dependent on only
one variable. As a result, inaccurate information about such variable will have a smaller
negative impact on the decision. Therefore, we hypothesize that:
• H6: Information quality negatively moderates the relationship between problem space complexity and decision quality.
26
CHAPTER 3
METHODOLOGY
This chapter addresses the research design, research methodology used for
testing this dissertation’s hypotheses, including data collection and analysis procedures,
as well as the methods used to develop the research instrument. The chapter also
discusses issues related to the reliability and validity of the instruments used in the
dissertation along with the description of the research population and sample, the
development of the instrument design, and data analysis procedures.
3.1 Research Design
A field study was conducted to collect data and test the model hypotheses. A
survey instrument serves as the method of data collection. Surveys provide the
potential to extract large amounts of information from large populations with accuracy
(Kerlinger and Lee, 2000). Surveys are appropriate to use when the research question
is asking “what” or “why”; when it is not possible to control the variables or the study
cannot be conducted in a controlled environment; and when the topic of study is
occurring now or in the recent past (Pinsonneault and Kraemer, 1993). The study in this
dissertation meets these criteria.
Advantages of surveys are that they allow for collection of data from large groups
of people at a relatively low cost and in short time frame. They also provide straight
forward gathering of nominal, categorical and continuous measures (Kerlinger and Lee,
2000). The survey in this study is web-based. The web-based approach minimizes the
27
cost associated with survey printing and postage, data entry and communication with
the survey respondents (Dillman, 2007).
3.2 Survey Administration
Data are collected from business firms located in the United States. The firms are
randomly selected, and contact information of business intelligence (BI) users is
obtained from a publicly available mailing list from a market research company, which
maintains a Business Intelligence Network e-mail list that is a collection of over 89,840
corporate BI users. From this total we asked the market research company to send the
survey instrument to 5,000 randomly selected BI users with job functions in sales,
marketing, corporate management, accounting, finance, banking, cards, collections,
operations, investment management, portfolio management, mortgage professionals
and compliance. Another source for collecting data was the LinkedIn website. A link to
the survey was placed in the TDWI LinkedIn business intelligence group.
Insufficient response rates may adversely affect the reliability and validity of the
measurement instrument. They can also adversely affect the reliability and
generalizability of the findings. Techniques to improve survey response rates include
follow-up reminders and promises of anonymity (Dillman, 2007). To increase the
response rate of this study the market research company has sent out the survey
instrument two times. The second distribution of the survey instrument occurred three
weeks after the first distribution. Similarly a follow-up message was sent to LinkedIn
business intelligence group members to remind them to participate in this study.
28

Throughout the data collection timeframe, analysis of the data was performed to
identify non-response bias. Results are assessed using t-tests and chi-square tests
(Armstrong and Overton, 1977).
3.3 Research Population and Sample
Because of the complex nature of the constructs, particularly of decision quality, I
deemed that the most informative data would be obtained by surveying BI users in
many organizations. Because my interest is in the influence of BI on decision quality,
use of many organizations allows us to grasp the effect of BI related influences on
decision quality that may occur across organizations or industries. Therefore, a study
including many organizations that use BI is appropriate for this study because it allows
us to generalize the results of this study.
The goal of this study is to assess the influence of BI on decision quality. The
research population consists of decision makers who use BI for strategic, tactical, and
operational decision making. Data are collected from business firms located in the
United States that are randomly selected. Contact information of decision makers are
obtained from two sources: a publicly available mailing list of a market research
company and TDWI business intelligence group in LinkedIn.
When using surveys several issues such as, sample size, statistical significance
level, a priori power analysis, and effect size should be addressed (Kerlinger and Lee,
2000; Cohen, 1988). These all are interconnected (Cohen, 1988). Sample size is
defined as the number of observations included in a sample (Bartlett et al., 2001).
Power is the ability to detect a hypothesized relationship when that relationship exists
29
(Hair et al., 2006). Statistical significance refers to the results that are unlikely to occur
by chance (Chow, 1997). Effect size is the strength of the relationship between two
variables in a population or sample (Hill and Thompson, 2004).
There are three steps when performing an a priori power analysis. First, the
desired power is determined. A recommended minimum power level is .80 (Chin,
1998). Second, the desired level of statistical significance (α) is identified. An α level of
.05 is typical in research (Chin, 1998). The last step is estimating the effect size. A
small effect size (e.g., 0.2) is common for exploratory studies (Cohen, 1988). This
dissertation uses the minimal accepted values for power (0.8), a statistical significance
level of .05 recommended by Chin (1998), and a value of 0.2 for effect size
recommended by Cohen (1988). Therefore, the minimum sample size needed for this
dissertation is 87 respondents. Another approach is the rules of thumb of at least 10
observations per variable, with 20 preferred (Hair et al., 2000). In addition, no fewer
than 50 observations should be used (Hair et al., 2000). Using Hair et al.’s sample size
rules, our 6 variables require a minimum of 60 observations.
3.4 Reliability and Validity Issues
Reliability means “consistency” or “repeatability”. That is, if we measure the same
thing over and over using the same measures, ideally we should get the same result
(Kerlinger and Lee, 2000). Internal consistency is a commonly used indicator of
reliability that assesses how consistently subjects respond to survey items (Cronbach,
1951). Cronbach’s coefficient alpha is a widely used indicator of internal consistency.
30
Measures with a coefficient greater than .80 are typically considered to be internally
reliable (Nunnally and Bernstein, 1994).
Validity addresses whether we are measuring what we think we are measuring
(Kerlinger and Lee, 2000). There are many types of validity: content validity, construct
validity, convergent validity, discriminate validity, and external validity (Kerlinger and
Lee, 2000). Content validity represents how well the measurement represents the
domain of investigation, and is usually determined through subjective assessment by
subject matter experts (Huck, 2004). There are ways to reduce this subjectivity by
adapting/using measurement scales from prior research. In this dissertation, we adapt
previously validated scales where appropriate. We also use BI subject matter experts
from academia and industry to assess content validity.
Construct validity is an assessment of whether the items thought to measure a
construct actually do measure that construct. Construct validity refers to the extent to
which inferences can be made from operationalized constructs to theoretical constructs
(Hair et al., 2006). This represents the strength of the relationship between the
theoretical world and the operationalized world. One step in establishing construct
validity is to establish the unidimensionality of the items used to measure a given
construct. A frequently used methodology to assess unidimensionality is exploratory
factor analysis, particularly when items are new or when there is little previously
validated information about the relationship between the measures and their constructs
(Hair et al., 2006). Exploratory factor analysis is an appropriate step for this dissertation
because I use some items that are newly developed and others that are adapted for this
research context. I use principle component analysis with an orthogonal rotation to
31
assess the independent and dependent variables. Factor loadings show how strongly a
specific item is correlated with its own factor. Thus, each factor’s dimensionality was
examined using its factor loading. According to Hair et al. (1998), factor loadings over
0.3 meet the minimal level, over 0.4 are considered more important, and 0.5 and greater
are practically significant. Factor loadings of an item greater than 0.40 on other factors
are generally interpreted that the item may measure more than one factor, and therefore
violate unidimensionality (Hair et al., 2006).
Two other aspects of construct validity, in addition to dimensionality, are
convergent and discriminate validity. Convergent validity refers to the extent to which a
measure correlates highly with other methods to measure the same construct.
Discriminate validity is the use of different measures to empirically differentiate between
constructs. Discriminant validity addresses the ability to differentiate between objects
being measured (Campbell and Fiske, 1959). One assessment for discriminant validity
is that an item should correlate more highly with other items intended to measure the
same construct than with different items used to measure a different construct
(Campbell and Fiske, 1959). In addition, the correlations among constructs should not
be high.
External validity refers to the generalizability of the findings to other settings,
populations, and times (Hair et al., 2006). When a specific model or construct is applied
to a different environment or tested with different subjects, results should be
comparable to those achieved in the original study. The focus of the study is the impact
on decision making by individuals of various aspects of BI that are common across BI
applications and settings. This sample represents a variety of BI users across settings.
32

Therefore, the findings should be generalizable to the broader population of people who
use BI for decision making support. Furthermore, although this dissertation focuses
specifically on BI, theory suggests that these antecedents of decision quality are shared
by a larger class of systems that support decision making (Clark et al., 2007).
Therefore, the findings should be generalizable to users of a broader class of systems
beyond BI.
3.5 Instrument Design and Development
The design of a questionnaire starts with a list of all items that may be useful for
the purpose of investigation, and the survey questions should obey several rules. For
example, the questions should be brief and simple in construction; the questions should
not have any compound phrases; the questions should be clear using as few adjectives
as possible, and the questions should be structured as positive rather than negative
(Clover and Balsley, 1979). The same authors suggest that the order of questions
should be guided by several conditions. These conditions include the ability to hold the
respondent’s interest, the influence of one question over another, the order of questions
in the survey, and determination of where fatigue may start to impact the quality of
answers.
The wording and content of the survey items can impact the effectiveness of the
survey instrument. There are several techniques to improve the wording and content of
survey items. Among them, questions should be logically ordered (Schuman and
Pressor, 1981), and they should be short and direct (Armstrong and Overton, 1971). In
33

addition, the terms used in each question should be clearly understandable by
respondents (Dillman, 2007).
A two-step process was used to refine the survey items. First, academic experts
in the area of BI reviewed the items. Their knowledge of the subject matter and their
experience as researchers were used to address issues such as ambiguity in the
question items and the order of items. Second, a number of BI users tested the survey
prior to general release. The appropriateness of each question was reviewed and based
upon feedback from the pilot study, appropriate changes were made. The instrument
consists of 3 main sections (Appendix A). The first section collects demographic
information of respondents. The second section measures the dependent variable,
Decision Quality. The third section measures the independent variables; problem space
complexity, data quality, information quality, BI user experience; and, level of BI use.
Table 4 Operationalization of the Independent and Dependent Variables
Construct Names Sources Number
of Items
Reliability Cronbach’s
α
Validity Examined
Directly incorporated or adapted from prior studies
Decision quality Hill et al. (1978) 44 N/A N/A Adapted
Problem space complexity
Clark et al. (2007) 8 N/A N/A Adapted
Information quality Lee et al. (2002) 65 85.2 Yes Adapted
Data quality Pipino et al. (2002) Lee et al. (2002) 65 85.2 Yes Adapted
BI user experience Gelderman (1995) 7 N/A N/A Adapted
Level of BI use Jones et al. (2008) 2 N/A N/A Adapted
34

Decision quality measurement questions were developed based on the decision-
making process proposed by Hill et al. (1978) drawing on (Parasuraman et al., 1988;
Cronin and Taylor, 1994). All the items were measured using a 5 point Likert scale.
The problem space complexity measurement was developed based on Clark et
al. (2007) description of problem space complexity. The items used to measure this
construct are on a 5 point Likert scale.
The information quality construct is measured drawing on Lee et al.'s (2002)
instrument. The questions are adapted and measured using a 5 point Likert scale. The
data quality construct is measured adapting Lee et al.'s (2002) and Pipino et al.'s (2002)
items for information quality to data quality because the author found that information
quality dimensions are similar to data quality dimensions. Again, a 5 point Likert scale
was used. The BI user experience measurement was developed based on Gelderman
(1995) and contains seven items. The level of BI use was adapted from Jones et al.
(2008) and contains three items. Both constructs were measured using a 5 point Likert
scale.
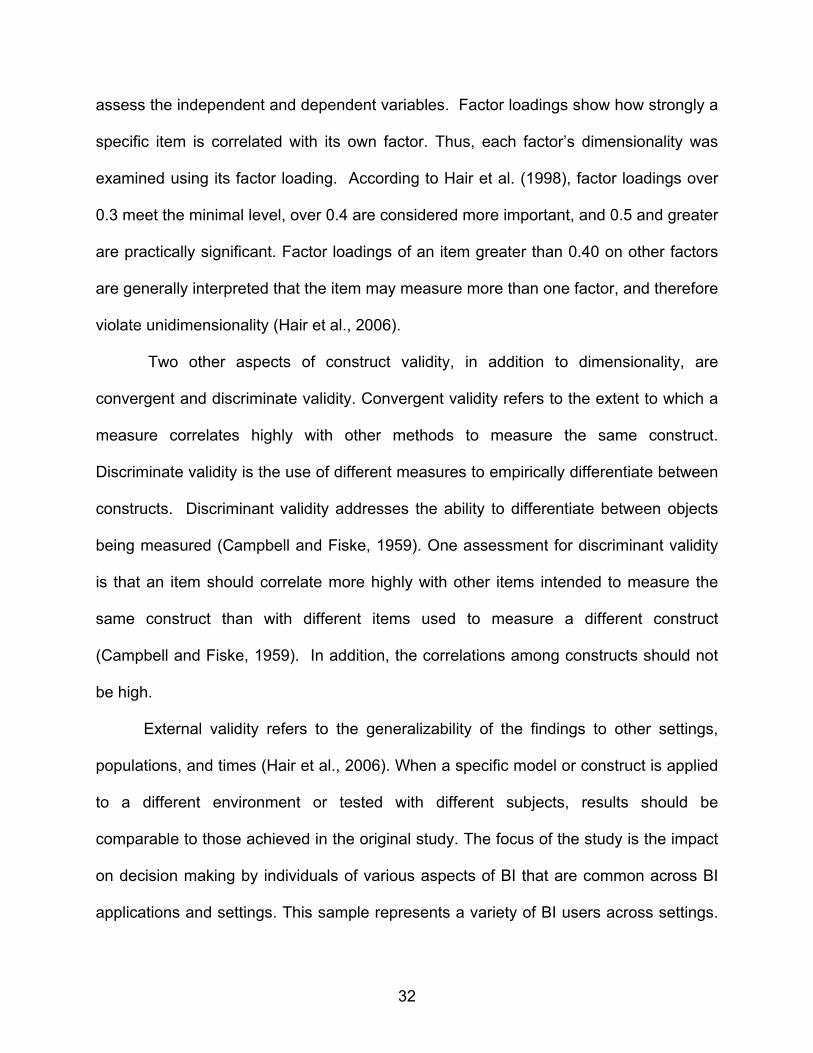
3.6 Hypotheses Testing
The final step in data analysis is to test the research hypotheses. Regression
was conducted to test each hypothesis. Table 5 shows the statistical tests associated
with each hypothesis.
35
Table 5 Hypotheses and Statistical Tests
Hypotheses Statistical Tests
H1: The higher problem space complexity, the higher the quality of decision
Multiple linear regressions Ydq= β0+ β1Xpsc
H2: The quality of decisions made by experienced users is greater than that of inexperienced users.
Multiple linear regressions Ydq= β0+ β1Xux
H3: The higher the level of use of the BI system, the higher the quality of decision making.
Multiple linear regressions Ydq= β0+ β1Xlu
H4: The higher the quality of information in the BI system, the higher the quality of decision.
Multiple linear regressions Ydq= β0+ β1Xiq
H5: Information quality negatively moderates the relationship between user experience and decision quality.
Multiple linear regressions Ydq= β0+ β1Xux + β2Xiq
H6: Information quality negatively moderates the relationship between problem space complexity and decision quality.
Multiple linear regressions Ydq= β0+ β1Xpsc + β2Xiq
Notations: • dq – decision quality • psc – problem space complexity • ux – user experience • lu – level of BI use • iq – information quality • dtq – data quality
36

CHAPTER 4
DATA ANALYSIS AND RESULTS
This chapter describes the data analysis and results. The first section discusses
response rate and analysis of non-response bias. The next section reports the sample
characteristics, followed by a discussion of the validity and reliability of the data and the
survey instrument. Finally, the statistical tests that are performed to test the research
framework and hypotheses are discussed and results of these tests are presented.
4.1 Response Rate and Non-Response Bias
The research population for this dissertation consisted of business intelligence
users who use business intelligence (BI) for strategic, tactical and operational decision
making across a range of organizations and industries. Data were collected from
business firms located in the United States. The firms were randomly selected and
contact information of decision makers were obtained from a publicly available mailing
list from the Merit Direct Higher Ground Inc. market research company and the TDWI
business intelligence group on LinkedIn.
As the first step of the data collection process, a pilot study was conducted. For
this pilot study, the survey was sent out to a North Texas PhD mailing list, which
consists of people who have used or are using BI. Many of these participants have
recently been exposed to BI academic courses. The survey was available for a period of
approximately three weeks. A total of 58 responses were received, out of which 36
were complete and usable.
After purchasing the right to use the e-mail addresses from the marketing
37

company, the survey was administered to 5,000 BI users through one e-mail. A follow-
up e-mail was sent three weeks after the first e-mail was sent. In the same time a link
was uploaded on LinkedIn website for the TDWI business intelligence group. Out of
5,000 professionals from the mailing list and potential 33,652 LinkedIn users, 125
clicked the survey link, but only 61 respondents actually completed the survey. This
corresponds to a response rate lower than 1%. This result is not necessarily surprising
for web-based surveys (Basi, 1999). Reasons for not completing the survey could
include time constraints, dislike of surveys and lack of incentives (Basi, 1999). Of the 61
surveys completed, only 25 responses were fully completed and these were included in
the analysis.
To assess the non-response bias early respondents from the mailing list and
LinkedIn users were compared to late respondents, with respect to dependent,
independent and moderator variables and the demographic variables. With this
approach, it is assumed that subjects who responded less readily are more like those
who did not respond at all (Kanuk & Berenson, 1975). This method has been shown to
be a useful way to assess non-response bias and has been frequently used by IS
researchers (Karahana et al., 1999; Ryan et al., 2002). t-Tests are used under the
assumptions of unequal variance between groups. Lavene’s test was used to determine
whether the assumptions are met. For the variables where the Levene’s test was
significant (BI success, decision type and data sources), the t-values reflect the
assumption of unequal variances between groups.
t-Tests were also performed to see if there were any significant differences in
terms of demographics. Table 7 shows the results of these t-tests. For the variables
38

where the Levene’s test was significant the t-values reflect the assumption of unequal
variances between groups. No significant differences were observed among the
variables.
Table 6
Independent Samples t-Tests for Non-response Bias
Levene's Test for Equality of
Variances t-Test for Equality of Means
F Sig. t df Sig. (2-tailed)
Mean Difference
Std. Error Difference
Dependent Variable
Decision Quality 2.086 .154 .711 50.5 .481 .1333 .1876
Moderator Information Quality 4.7 .034 -.755 41.3 .454 -.1416 .1875
Independent Variables
Level of BI Use 1.151 .288 -1.168 55.2 .248 -.3444 .2948
User Experience .156 .695 -1.658 57.6 .103 -.4850 .2926
Problem Space Complexity
3.677 .060 -.579 49.6 .565 -.1058 .1842
Table 7
Independent Samples t-Tests for Non-response Bias - Demographics
Levene's Test for Equality of Variances
t-Test for Equality of Means
F Sig. t df Sig. (2-tailed)
Mean Differenc
e
Std. Error Difference
Gender 3.008 .091 .894 36.899 .377 .137 .153
Age Group .396 .533 .778 36.993 .441 .405 .521
Years of Education 10.716 .002 -1.558 21.164 .134 -1.855 1.191
Years of Experience .373 .544 -.020 57.522 .984 -.035 1.766
39

The data collected from the pilot group was analyzed to determine if anomalies
or unexpected factor loadings were present. Nothing unexpected was found. Then, this
pilot data set was then compared to the data collected from the e-mail and LinkedIn
participants. t-Tests were used to examine the differences between pilot group of users,
who responded between Sept. 21, 2011 and Sept. 27, 2011, and the rest of the
respondents. This data set was then compared to the pilot data for differences in
demographic, independent, and dependent variables using t-tests and chi-square tests.
The only significant difference between the two groups was for two of the independent
variables, problem space complexity and user experience (Table 6). That means that
the industry respondents worked in greater problem space complexity and had greater
experience with BI is not surprising. This is also reflected in the significant difference in
the demographic variable, years of experience (Table 7). However, our model posits
questions about differences in problem space complexity and user experience.
Therefore, these differences strengthen, rather than detract from combining the data
set.
This data set was then compared to the pilot data for differences in demographic,
independent, and dependent variables using t-tests and chi-square tests. The only
significant difference between the two groups was for two of the independent variables,
problem space complexity and user experience. That the industry respondents worked
in greater problem space complexity and had greater experience with BI is not
surprising. This is also reflected in the significant difference in the demographic variable,
years of experience. However, our model posits questions about differences in problem
space complexity and user experience. Therefore, these differences strengthen, rather
40
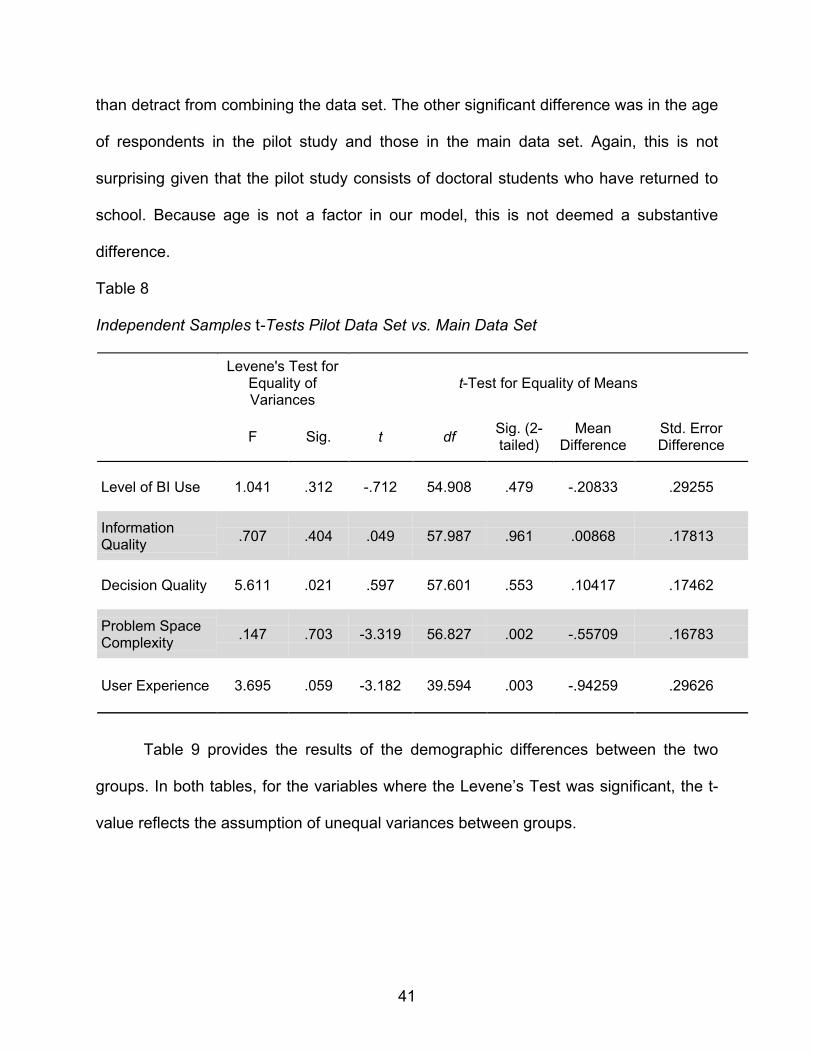
than detract from combining the data set. The other significant difference was in the age
of respondents in the pilot study and those in the main data set. Again, this is not
surprising given that the pilot study consists of doctoral students who have returned to
school. Because age is not a factor in our model, this is not deemed a substantive
difference.
Table 8
Independent Samples t-Tests Pilot Data Set vs. Main Data Set
Levene's Test for Equality of Variances
t-Test for Equality of Means
F Sig. t df Sig. (2-tailed)
Mean Difference
Std. Error Difference
Level of BI Use 1.041 .312 -.712 54.908 .479 -.20833 .29255
Information Quality .707 .404 .049 57.987 .961 .00868 .17813
Decision Quality 5.611 .021 .597 57.601 .553 .10417 .17462
Problem Space Complexity .147 .703 -3.319 56.827 .002 -.55709 .16783
User Experience 3.695 .059 -3.182 39.594 .003 -.94259 .29626
Table 9 provides the results of the demographic differences between the two
groups. In both tables, for the variables where the Levene’s Test was significant, the t-
value reflects the assumption of unequal variances between groups.
41

Table 9
Independent Samples t-Tests Pilot Data Set vs. Main Data Set Demographics
Levene's Test for Equality of Variances t-Test for Equality of Means
F Sig. t df Sig. (2-tailed)
Mean Difference
Std. Error Difference
Gender .000 1.000 .000 29.563 1.000 .000 .160
Age Group 5.577 .024 -3.340 36.889 .002 -1.467 .439
Years of Education 7.448 .010 -.574 27.678 .570 -.575 1.001
Years of Experience 40.535 .000 -4.129 24.000 .000 -7.520 1.821
The significant differences between the pilot group respondents and the
respondents from mailing list and LinkedIn found for age, education and experience are
not surprising because the respondents in the pilot study are PhD students who have
used BI while the second set is a broader range of BI professionals with industrial
experience. However, because respondents from both groups have experience using BI
systems, and because only one question was dropped from the pilot study, the two sets
of data were merged to attain better statistical validity. The sample size is 61, which is
more than the estimated minimum sample size of 60.
4.2 Treatment of Missing Data and Outliers
Missing values were imputed using expectation-maximization imputation
algorithm available in SPSS. The data was then examined for normality. Tests were run
for all independent, moderating and dependent variables to assess skewness and
kurtosis. Skewed distributions have most of the scores being either too high or too low
42

with a small percentage of scores spread out away from the majority. Therefore,
skewed distributions are not symmetrical. Distributions that are more peaked are
considered leptokurtic whereas distributions that are less peaked are considered
platykurtic. Depending on the aim of the analysis a researcher has to examine the
kurtosis and skewness of data. If the values for skewness and kurtosis are highly non-
normal, statistical procedures for non-normal data can be used or data can be
normalized through different procedures (Huck, 2008).
To learn more about the distribution of the data, skewness and kurtosis values
were examined and are presented in Table 10. Skewness values for the dependent,
independent and moderating variables between -3 and +3 and kurtosis values between
-8 and +8, are considered to be within an acceptable range (Kline, 1997; Huck, 2008).
Means, standard deviations and range for each of the items for the dependent and
independent variables are provided in Table 10.
Table 10 Descriptive Statistics for Independent, Moderator and Dependent Variables
Decision Quality
Level of BI Use
BI User Experience
Problem Space
Complexity
Information Quality
n Valid 60 60 60 61 60 Missing 1 1 1 0 1
Mean 4.0417 3.4722 2.5819 3.8951 3.6717 Std. Deviation .72364 1.14535 1.16126 .70295 .72954 Skewness -1.352 -.808 .540 -1.268 -1.332 Std. Error of Skewness .309 .309 .309 .306 .309 Kurtosis 4.335 -.109 -.498 3.582 4.818 Std. Error of Kurtosis .608 .608 .608 .604 .608 Range 4.00 4.00 4.00 4.00 4.00
43

4.3 Demographics
The respondent pool for the survey was made up of 66.7% male and 33.3%
female professionals. All of the respondents had a graduate degree. The descriptive
statistics for the survey respondents are summarized below in Table 11.
Table 11 Descriptive Statistics on Respondents’ Demographics
Demographics Frequency Percent
Gender Male 26 66.7
Female 13 33.3
Age
20-25 0 0 26-31 6 9.8 32-37 12 19.7 38-43 6 9.8 44-49 6 9.8 50-55 6 9.8 56-61 2 3.3 62-67 1 1.6 68-73 0 0
Over 74 0 0
Years of Experience
with BI
Less than 1 year 45 73.8 1- 10 11 18 11-22 7 4.8 23-35 2 3.4
Education Less than 4 years 4 12.9
5-7 26 66.6 8-10 8 20.5
Self-evaluation Experience
with BI Systems
New Entrant to BI 4 10.3 New / Intermediate
user to BI 2 5.1
Intermediate user to BI 7 17.9 Intermediate /
Advanced user to BI 3 7.7
Advanced user to BI 8 20.5
Note. Since there are missing values for some of the questions the percentages in this table do not add to 100%
44

4.4 Exploratory Factor Analysis and Internal Consistency
In this dissertation, the number of factors extracted with exploratory factor
analysis was based on the criterion that the Eigenvalue should be greater than one
(Kaiser, 1960). To extract the factors, principal component analysis with an Equamax
rotation was used. Equamax rotation is an orthogonal rotation that maximizes a
weighted sum of the varimax and quartimax criteria, reflecting a concern for simple
structure within variables (rows) as well as within factors (columns). According to Hair et
al. (1998), factor loadings over 0.3 meet the minimal level, over 0.4 are considered
more important, and over 0.5 large with even greater practical significance. It is also
suggested that the loadings over 0.71 are excellent, over 0.55 good, and over 0.45 are
fair (Tabachnick and Fidell, 2000; Komiak and Benbasat, 2006). The factor analyses
conducted in this study are assessed according to these criteria.
A separate factor analysis was conducted for independent variables, dependent
variables and moderator variables, instead of one factor analysis where all indicators on
multiple factors are analyzed. Factor analyzing all indicators together would result in a
correlation matrix of over 2000 relationships, thus, would not produce meaningful
outcomes (Jones and Beatty, 2001; Gefen and Straub, 2005).
For the dependent variable, decision quality, 4 items were hypothesized to load
on a single factor, and all items loaded on one factor with loadings of 0.859 or higher.
Following the factor analysis, internal consistency of the BI decision quality factor was
examined. Cronbach’s alpha is the most widely used measure to assess the internal
consistency of a scale (Huck, 2004). A Cronbach’s alpha of 0.7 is generally considered
acceptable (Hair et al., 1998). Yet, literature suggests that 0.6 may be accepted for
45
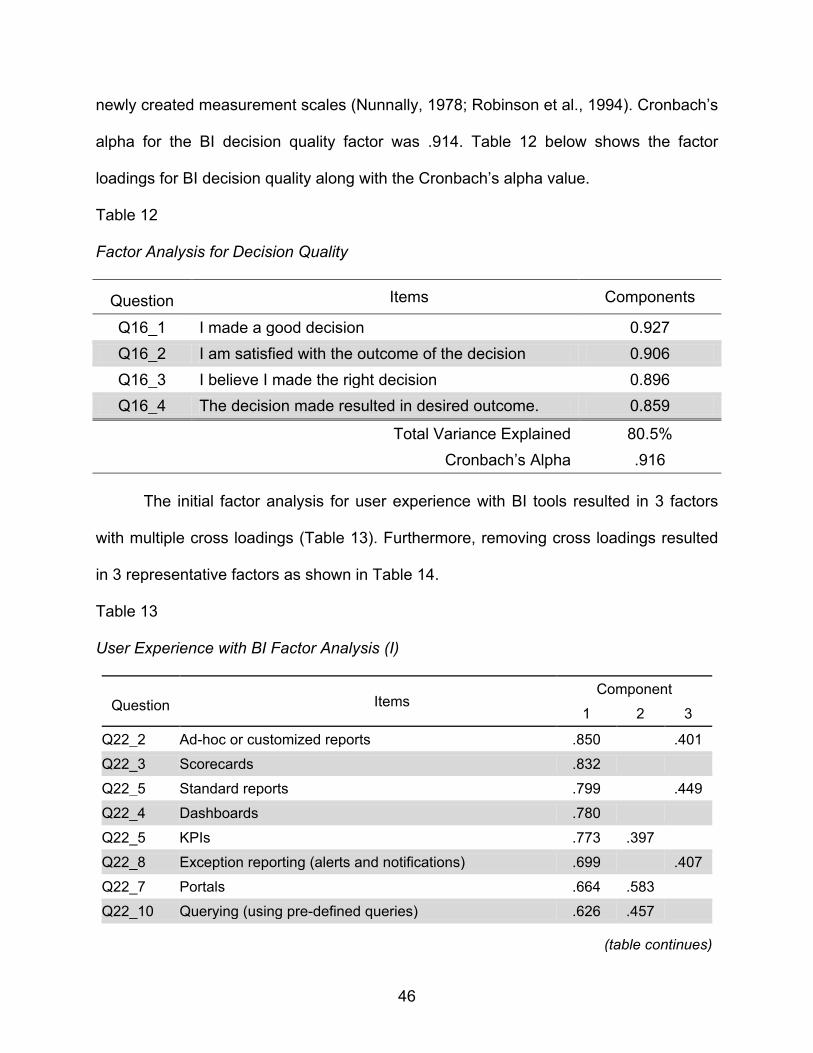
newly created measurement scales (Nunnally, 1978; Robinson et al., 1994). Cronbach’s
alpha for the BI decision quality factor was .914. Table 12 below shows the factor
loadings for BI decision quality along with the Cronbach’s alpha value.
Table 12
Factor Analysis for Decision Quality
Question Items Components
Q16_1 I made a good decision 0.927 Q16_2 I am satisfied with the outcome of the decision 0.906 Q16_3 I believe I made the right decision 0.896 Q16_4 The decision made resulted in desired outcome. 0.859
Total Variance Explained 80.5%
Cronbach’s Alpha .916 The initial factor analysis for user experience with BI tools resulted in 3 factors
with multiple cross loadings (Table 13). Furthermore, removing cross loadings resulted
in 3 representative factors as shown in Table 14.
Table 13
User Experience with BI Factor Analysis (I)
Question Items Component
1 2 3
Q22_2 Ad-hoc or customized reports .850 .401
Q22_3 Scorecards .832
Q22_5 Standard reports .799 .449
Q22_4 Dashboards .780
Q22_5 KPIs .773 .397
Q22_8 Exception reporting (alerts and notifications) .699 .407
Q22_7 Portals .664 .583
Q22_10 Querying (using pre-defined queries) .626 .457
(table continues)
46

Table 13 (continued).
Question Items Component
1 2 3
Q22_16 Workflow tools .510
Q22_19 EAI tools .863
Q22_18 EII tools .847 .404
Q22_17 ETL tools .841
Q22_21 Data marts .720 .405
Q22_9 OLAP (slice and dice) tools .531 .655
Q22_6 Broadcasting tools .503 .650
Q22_20 Data warehouse .506 .628
Q22_11 Query building tools .522 .550
Q22_14 Analytical models .901
Q22_15 Analytical or model building tools .873
Q22_13 Predictive analytics .846
Q22_12 Data mining .725
Table 14
User Experience with BI Factor Analysis (II)
Question Items Component
1 2 3 Q22_4 Dashboards .879 Q22_3 Scorecards .868 Q22_5 KPIs .849 Q22_2 Ad-hoc or customized reports .819 Q22_14 Analytical models .896 Q22_15 Analytical or model building tools .874 Q22_13 Predictive analytics .817 Q22_12 Data mining .713 Q22_19 EAI tools .900 Q22_18 EII tools .871 Q22_17 ETL tools .844 Q22_21 Data marts .699
47

The resulting factors reflect users experience with different BI tools such as
reporting tools, analytical tools and transformation tools. Theory, however, is largely
silent about the impact of the various types of experience (Henschen, 2010). In this
study we are interested in overall BI user experience, thus we next constrained the
items that measure BI user experience to load on only one factor.
The factor analysis for user experience is shown in Table 15. All the items
loaded on only one factor with high loadings. The loadings on this construct are all
larger than .725 representing 63.51% of the variance explained, and the Cronbach’s
Alpha is .947. Thus, constraining to one factor provides a theoretically and statistically
meaningful construct.
Table 15
User Experience with BI Factor Analysis (III)
Question Items Component
1
Q22_21 Data marts .851
Q22_18 EII tools .824
Q22_17 ETL tools .820
Q22_14 Analytical models .819
Q22_13 Predictive analytics .818
Q22_12 Data mining .812
Q22_3 Scorecards .810
Q22_15 Analytical or model building tools .780
Q22_5 KPIs .777
Q22_2 Ad-hoc or customized reports .761
Q22_4 Dashboards .758
Q22_19 EAI tools .725
48

The results from factor analyzing the problem space complexity construct are
presented in the Tables 16, 17, 18. The operationalization of this construct measures
problem space complexity as the number of variables or factors involved in a problem,
the complexity generated by the time available when making decisions, and the
complexity generated by the uncertainty of the outcome. The initial factor analysis
resulted in 3 factors with minimal cross loadings (Table 16).
Table 16
Problem Space Complexity Factor Analysis (I)
Question Items Component
1 2 3
Q15_5 The outcome of the decision depends on the interaction of different factors .901
Q15_6 In making the decision it is important to consider the interaction among various factors .847
Q15_3 When making the decision I have to consider many different factors .822
Q15_4 The decision involve a high degree of interactions among the variables or elements considered .813
Q15_2 The decision involve a large number of variables or elements .716
Q15_15 The decision requires taking into account multiple factors .668
Q15_11 It is difficult to predict the outcome of the decision .808
Q15_10 The decision is associated with high level of uncertainty .785
Q15_9 The decision involve a high level of risk .760
Q15_8 The decision requires "soft" or unstructured data .711
Q15_1 The problems about which I make decisions are generally complex .485 .643
Q15_7 The decision involve variables or elements that are difficult to measure .451
Q15_14 In general, I have very little time to make a decision .873
Q15_12 The decision need to be made quickly .871
Q15_13 I face significant time pressure when making a decision .857
49
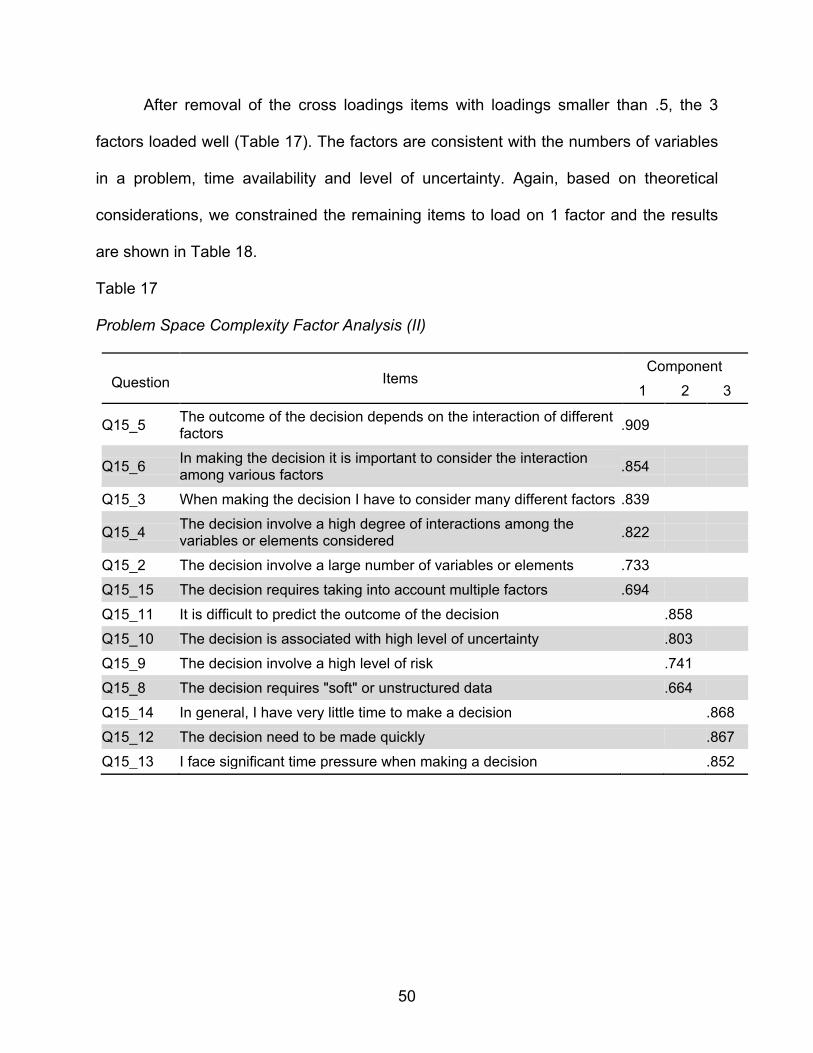
After removal of the cross loadings items with loadings smaller than .5, the 3
factors loaded well (Table 17). The factors are consistent with the numbers of variables
in a problem, time availability and level of uncertainty. Again, based on theoretical
considerations, we constrained the remaining items to load on 1 factor and the results
are shown in Table 18.
Table 17
Problem Space Complexity Factor Analysis (II)
Question Items Component
1 2 3
Q15_5 The outcome of the decision depends on the interaction of different factors .909
Q15_6 In making the decision it is important to consider the interaction among various factors .854
Q15_3 When making the decision I have to consider many different factors .839
Q15_4 The decision involve a high degree of interactions among the variables or elements considered .822
Q15_2 The decision involve a large number of variables or elements .733
Q15_15 The decision requires taking into account multiple factors .694
Q15_11 It is difficult to predict the outcome of the decision .858
Q15_10 The decision is associated with high level of uncertainty .803
Q15_9 The decision involve a high level of risk .741
Q15_8 The decision requires "soft" or unstructured data .664
Q15_14 In general, I have very little time to make a decision .868
Q15_12 The decision need to be made quickly .867
Q15_13 I face significant time pressure when making a decision .852
50
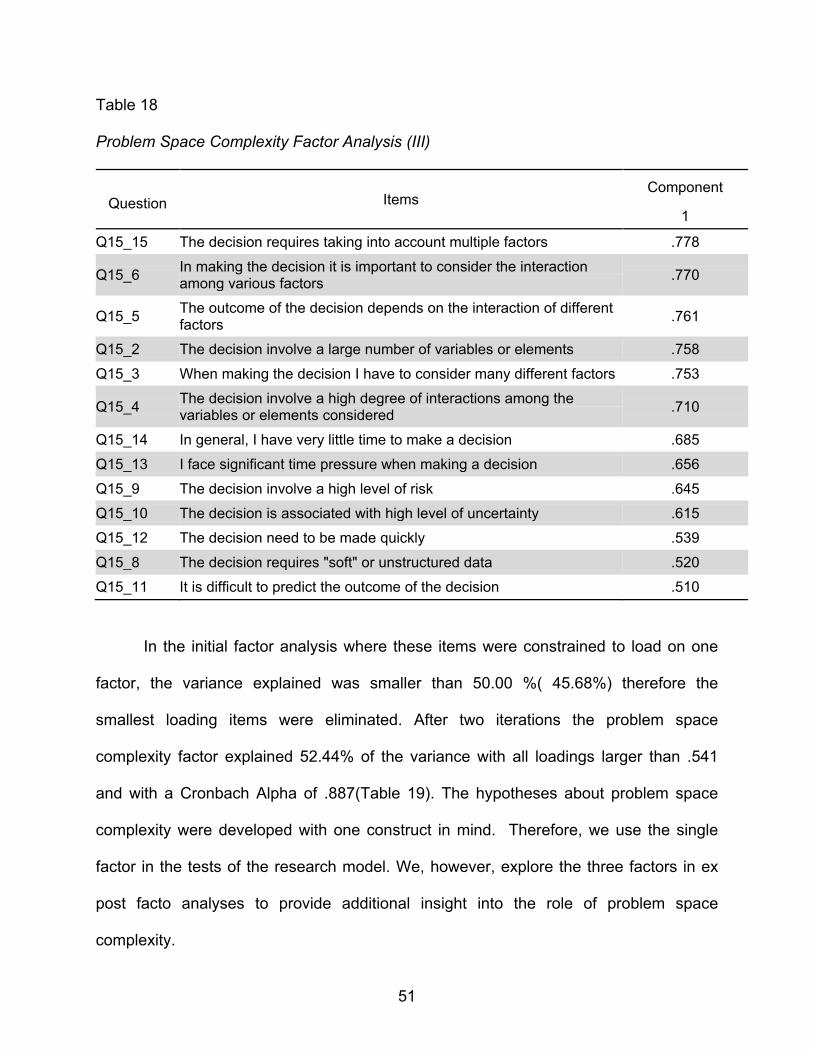
Table 18
Problem Space Complexity Factor Analysis (III)
Question Items Component
1
Q15_15 The decision requires taking into account multiple factors .778
Q15_6 In making the decision it is important to consider the interaction among various factors .770
Q15_5 The outcome of the decision depends on the interaction of different factors .761
Q15_2 The decision involve a large number of variables or elements .758
Q15_3 When making the decision I have to consider many different factors .753
Q15_4 The decision involve a high degree of interactions among the variables or elements considered .710
Q15_14 In general, I have very little time to make a decision .685
Q15_13 I face significant time pressure when making a decision .656
Q15_9 The decision involve a high level of risk .645
Q15_10 The decision is associated with high level of uncertainty .615
Q15_12 The decision need to be made quickly .539
Q15_8 The decision requires "soft" or unstructured data .520
Q15_11 It is difficult to predict the outcome of the decision .510
In the initial factor analysis where these items were constrained to load on one
factor, the variance explained was smaller than 50.00 %( 45.68%) therefore the
smallest loading items were eliminated. After two iterations the problem space
complexity factor explained 52.44% of the variance with all loadings larger than .541
and with a Cronbach Alpha of .887(Table 19). The hypotheses about problem space
complexity were developed with one construct in mind. Therefore, we use the single
factor in the tests of the research model. We, however, explore the three factors in ex
post facto analyses to provide additional insight into the role of problem space
complexity.
51
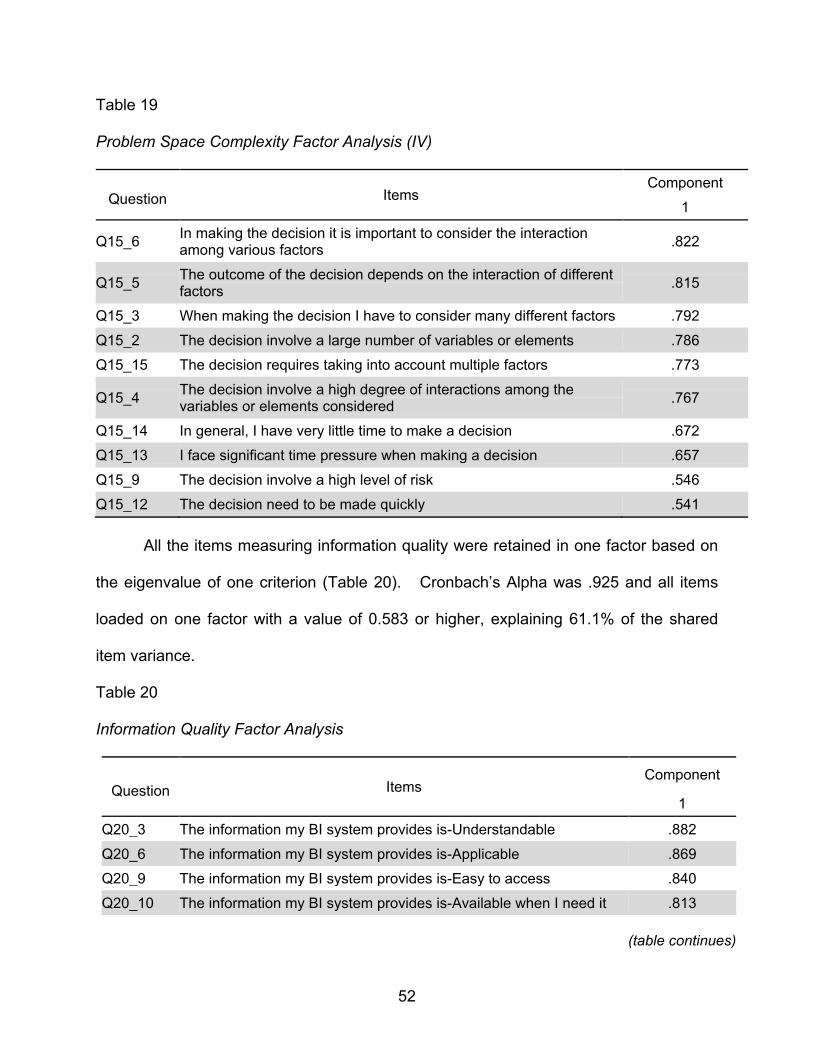
Table 19
Problem Space Complexity Factor Analysis (IV)
Question Items Component
1
Q15_6 In making the decision it is important to consider the interaction among various factors .822
Q15_5 The outcome of the decision depends on the interaction of different factors .815
Q15_3 When making the decision I have to consider many different factors .792
Q15_2 The decision involve a large number of variables or elements .786
Q15_15 The decision requires taking into account multiple factors .773
Q15_4 The decision involve a high degree of interactions among the variables or elements considered .767
Q15_14 In general, I have very little time to make a decision .672
Q15_13 I face significant time pressure when making a decision .657
Q15_9 The decision involve a high level of risk .546
Q15_12 The decision need to be made quickly .541
All the items measuring information quality were retained in one factor based on
the eigenvalue of one criterion (Table 20). Cronbach’s Alpha was .925 and all items
loaded on one factor with a value of 0.583 or higher, explaining 61.1% of the shared
item variance.
Table 20
Information Quality Factor Analysis
Question Items Component
1
Q20_3 The information my BI system provides is-Understandable .882
Q20_6 The information my BI system provides is-Applicable .869
Q20_9 The information my BI system provides is-Easy to access .840
Q20_10 The information my BI system provides is-Available when I need it .813
(table continues)
52

Table 20 (continued).
Question Items Component
1
Q20_1 The information my BI system provides is-Believable .805
Q20_8 The information my BI system provides is-Easy to extract .789
Q20_5 The information my BI system provides is-Covers my needs .774
Q20_2 The information my BI system provides is-Useable .708
Q20_4 The information my BI system provides is-Easy to interpret .707
Q20_7 The information my BI system provides is-Not overwhelming .583
All the items measuring the level of BI usage were also retained (Table 21) in a
single factor based on the eigenvalue of one criteria. The factor had a Cronbach’s alpha
of 0.9026 and all items loaded with a value of 0.880 or higher.
Table 21 Level of BI Use Factor Analysis
Question Items Component
1
Q19_1 I relied highly on BI functionality while making the decision .940
Q19_2 I used various features of BI for making the decision .926
Q19_3 Using BI was critical in making the decision .880
The independent and dependent variables were also assessed for construct
validity through convergent and discriminant validity analysis (Hair et al, 1998; Kerlinger
and Lee, 2000). Discriminant validity is assessed by examining the correlations among
factors using Pearson’s correlation coefficient (Table 22). Convergent validity is
assessed using Pearson’s correlation coefficient among the items (Appendix C).
53
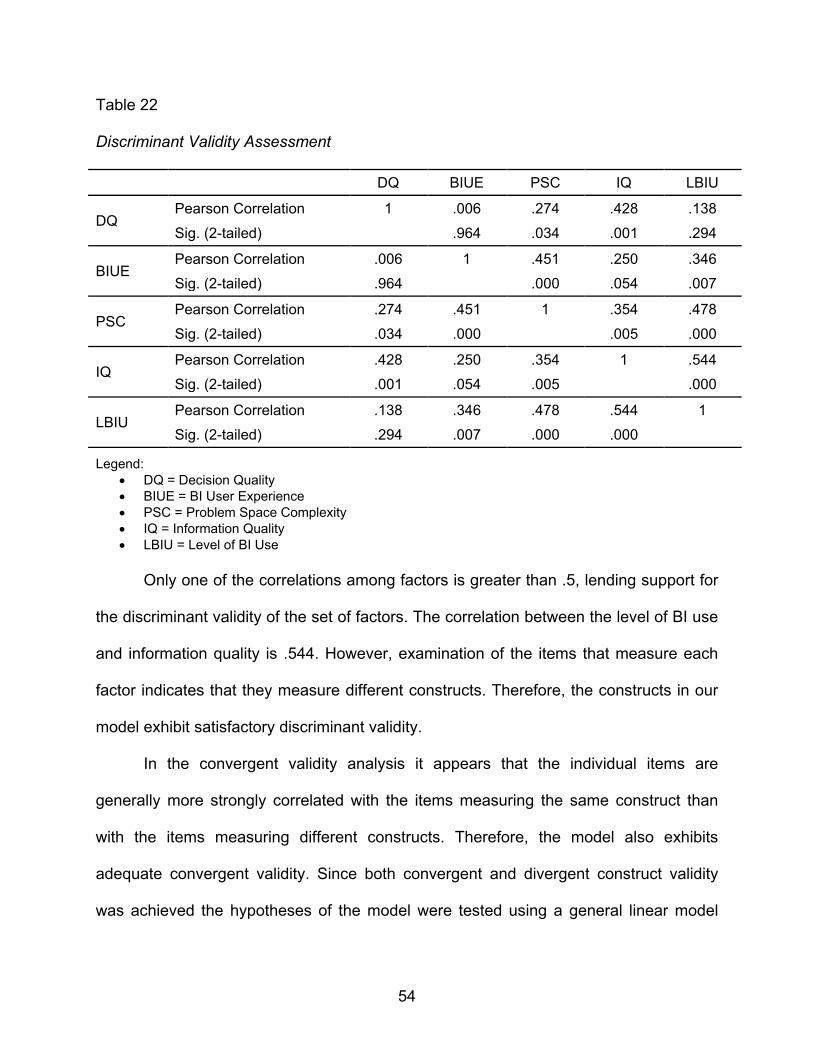
Table 22
Discriminant Validity Assessment
DQ BIUE PSC IQ LBIU
DQ Pearson Correlation 1 .006 .274 .428 .138
Sig. (2-tailed) .964 .034 .001 .294
BIUE Pearson Correlation .006 1 .451 .250 .346
Sig. (2-tailed) .964 .000 .054 .007
PSC Pearson Correlation .274 .451 1 .354 .478
Sig. (2-tailed) .034 .000 .005 .000
IQ Pearson Correlation .428 .250 .354 1 .544
Sig. (2-tailed) .001 .054 .005 .000
LBIU Pearson Correlation .138 .346 .478 .544 1
Sig. (2-tailed) .294 .007 .000 .000
Legend: • DQ = Decision Quality • BIUE = BI User Experience • PSC = Problem Space Complexity • IQ = Information Quality • LBIU = Level of BI Use
Only one of the correlations among factors is greater than .5, lending support for
the discriminant validity of the set of factors. The correlation between the level of BI use
and information quality is .544. However, examination of the items that measure each
factor indicates that they measure different constructs. Therefore, the constructs in our
model exhibit satisfactory discriminant validity.
In the convergent validity analysis it appears that the individual items are
generally more strongly correlated with the items measuring the same construct than
with the items measuring different constructs. Therefore, the model also exhibits
adequate convergent validity. Since both convergent and divergent construct validity
was achieved the hypotheses of the model were tested using a general linear model
54
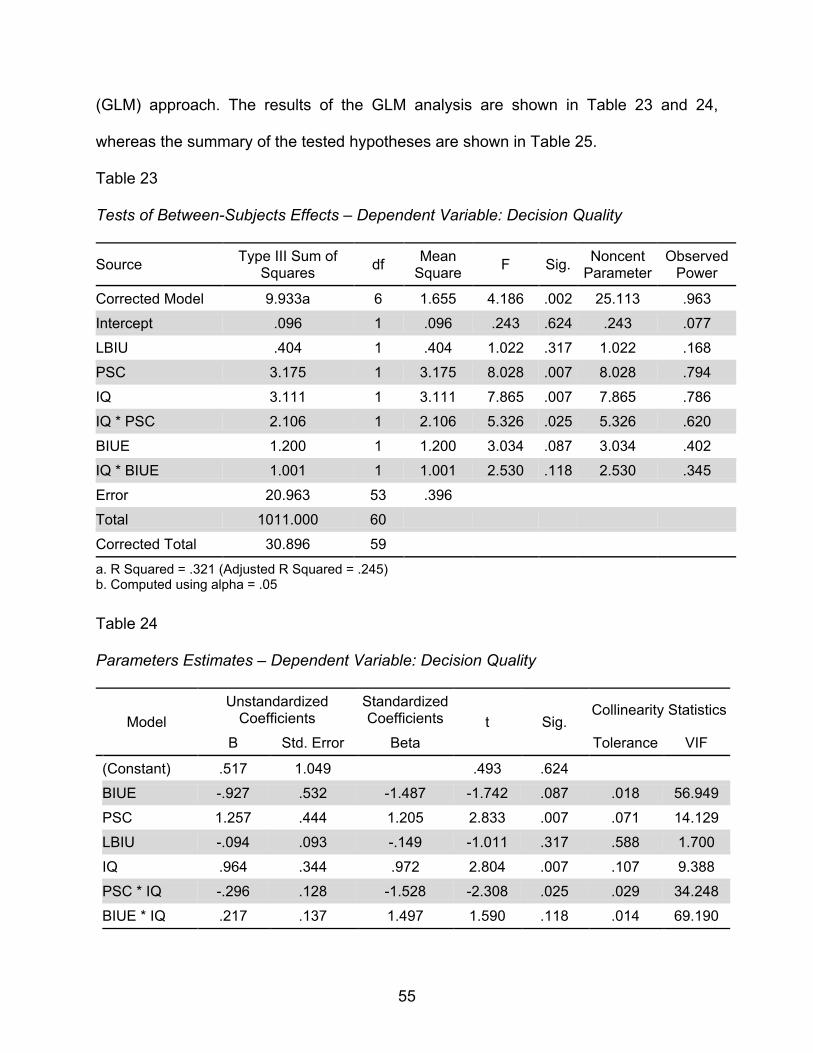
(GLM) approach. The results of the GLM analysis are shown in Table 23 and 24,
whereas the summary of the tested hypotheses are shown in Table 25.
Table 23
Tests of Between-Subjects Effects – Dependent Variable: Decision Quality
Source Type III Sum of Squares df Mean
Square F Sig. Noncent Parameter
Observed Power
Corrected Model 9.933a 6 1.655 4.186 .002 25.113 .963
Intercept .096 1 .096 .243 .624 .243 .077
LBIU .404 1 .404 1.022 .317 1.022 .168
PSC 3.175 1 3.175 8.028 .007 8.028 .794
IQ 3.111 1 3.111 7.865 .007 7.865 .786
IQ * PSC 2.106 1 2.106 5.326 .025 5.326 .620
BIUE 1.200 1 1.200 3.034 .087 3.034 .402
IQ * BIUE 1.001 1 1.001 2.530 .118 2.530 .345
Error 20.963 53 .396
Total 1011.000 60
Corrected Total 30.896 59
a. R Squared = .321 (Adjusted R Squared = .245) b. Computed using alpha = .05 Table 24
Parameters Estimates – Dependent Variable: Decision Quality
Model Unstandardized
Coefficients Standardized Coefficients t Sig.
Collinearity Statistics
B Std. Error Beta Tolerance VIF
(Constant) .517 1.049 .493 .624
BIUE -.927 .532 -1.487 -1.742 .087 .018 56.949
PSC 1.257 .444 1.205 2.833 .007 .071 14.129
LBIU -.094 .093 -.149 -1.011 .317 .588 1.700
IQ .964 .344 .972 2.804 .007 .107 9.388
PSC * IQ -.296 .128 -1.528 -2.308 .025 .029 34.248
BIUE * IQ .217 .137 1.497 1.590 .118 .014 69.190
55

Table 25
Summary of Hypothesis Testing
Hypothesis Results
H1: The higher problem space complexity, the higher the quality of decision Supported**
H2: The quality of decisions made by experienced users is greater than that of inexperienced users. Not Supported
H3: The higher the level of use of the BI system, the higher the quality of decision making. Not Supported
H4: The higher the quality of information in the BI system, the higher the quality of decision. Supported**
H5: Information quality negatively moderates the relationship between user experience and decision quality. Not Supported
H6: Information quality negatively moderates the relationship between problem space complexity and decision quality. Supported**
*Significant at the p = 0.1 level; **Significant at the p = 0.05 level; ***Significant at the p = 0.01 level Three of the six hypotheses were supported (Table 25). These were H1, H4 and
H6. Hypotheses 2, 3, and 5 were not supported. Hypothesis 1 posits that the higher is
the problem space complexity, the higher the quality of the decision. This result is
consistent with prior research for GDSS (Gallupe and DeSanctis, 1988). Thus, the
results of Gallupe and DeSanctis(1988) can be extended to the BI systems, the
confirmation of this hypothesis lending support for the idea that BI does make a positive
difference in decision making in highly complex situations.
Hypothesis 4 posits a direct relationship between information quality and decision
quality. It is also supported, therefore, the higher the information quality, the higher the
decision quality. Previous studies investigating decision support systems argue that
decision quality may improve when information quality improves depending on the
decision-maker quality (Raghunathan, 1999). Our supported hypothesis illustrates that
56

the relationship between information quality and decision quality is further supported in
BI studies.
Hypothesis 6 posits that information quality moderates the relationship between
problem space complexity and decision quality. The significant finding here is consistent
with prior research that points to the importance of information quality in BI (Vakkari,
2001; Bystron and Jarvelin, 1995). The finding, however, indicates that the information
quality lessens the impact of problem space complexity on decision quality. One
possible explanation is that higher information quality lessens the complexity of the
problem space. Our measure of the problem space complexity factor is dominated by
items that tap complexity due to the number and relationship among variables, or
information, in the problem space. Thus, the greater the quality of the information the
less impact problem space complexity has. We further explore problem space
complexity in the ex post facto analysis section to gain additional insight into this largely
unexplored relationship.
Three of the hypotheses were unsupported. Findings indicate that decision
quality is not significantly related to BI user experience (H2) or the levels of BI use (H3).
Findings also indicate that information quality does not significantly moderate the
relationship between BI user experience and decision quality (H5). One possible
explanation for the findings about user experience (H2 and H5) is that the majority of
our users indicate that they have used BI for a similar number of years (Table 4.6).
Thus, there may not have been enough variability in the BI user experience to detect a
difference. Another possible explanation is that when we forced the construct to one
factor, we may have lost explanatory power. Therefore, we further explore different
57
dimensions of BI user experience in the ex post facto analysis section. With regard to
level of BI use, our measure taps the extent to which the users relied on BI for making
their decision. One possible explanation for the lack of significant relationship between
this and decision quality is that there was not enough variability in the level of BI use
construct to detect a difference.
Another explanation for the lack of significance, however, may be the presence
of multicollinearity in the data. The variance inflation factor (VIF) was relatively high for
three of the hypothesis tests, so we performed a ridge regression in order to evaluate
the impact of collinearity on our regression results and establish how our model might
be affected (McDonald, 2009). In SPSS the package for running ridge regression is not
loaded in the main menu by default. One has to create a new syntax and include the
following commands:
INCLUDE 'C: \Program Files\IBM\SPSS\..........\Ridge regression.sps.
RIDGEREG DEP=DQ /ENTER = LBIU PSC IQ PSC_IQ BIUJ_IQ/
Initially, the ridge regression is performed to find the value of the coefficient K
that best suits the regression model. The results of the initial ridge regression for our
model are shown in Appendix E. Because there are no established or absolute cutting
values for selecting the value for K, it is suggested that the selected value should not
lead to a radical change in the model (McDonald, 2009; Morris, 2012). For k =.01 the
VIFs have decreased considerably (Appendix F). The overall regression model shows
that newly obtained coefficients are very close to the initial ones and the penalty for the
R-squared is only .03. This demonstrates that our model is robust even after the
controlling for variance inflation factors. Therefore, multicollinearity was likely not a
driving force in the findings.
58

4.5 Ex Post Facto Analyses
In this section, we further explore possible relationships among the constructs.
Specifically, we examine the possible roles of the three dimensions of problem space
complexity and the three dimensions of BI user experience.
4.6 BI User Experience
Recall that the items to measure BI user experience initially loaded on three
distinct factors in the exploratory factor analysis (Tables 13 and 14). The three factors
were related to experience with reporting tools, analytical tools, and transformational
tools. Reporting tools included dashboards, scorecards, KPI, and other reports.
Analytical tools included analytical models and model building tools, predictive analytics,
and data mining tools. Transformational tools included extract, transform, and load
(ETL) tools, enterprise application integration (EAI) tools, and enterprise information
integration (EII) tools, as well as building data marts. There is little research that
examines the role of these different types of BI user experience, and none that we know
of that examines the relationship of these with decision quality. Therefore, an
exploratory assessment can help better inform our collective understanding of these
important factors as we frame future research.
Findings indicate that decision quality is significantly related to BI user
experience with reporting and analytical tools at α = .10, but not with transformational
tools (Table 24). This suggests that examining BI user experience with specific
categories of tools may be more informative than a more generic category of
experience. One explanation for the lack of significance between experience with
59
transformational tools and decision quality is the nature of these tools. The other two
categories of tools are more ‘front end’ or directly related to gathering information in a
decision process. Transformational tools are more related to the ‘back end’ or readying
of data to be used by the other two tools. Thus, they are not as directly tied to decision
making.
Interestingly, there is an inverse relationship between reporting tools experience
and decision quality. One possible explanation is that as people rely more heavily on
dashboards, KPIs, and other reports, they may begin to make decisions based on the
data provided without substantively, or proactively, processing the information.
Research is needed to examine how people use these tools. For example, do they
passively absorb the data or do they actively use the tools to dig deeper into what the
initial reports show? In the former case, the reporting tools may simply be one more
layer in the decision process, and therefore do not significantly impact the quality of
decisions directly. Another explanation may be that the information provided by the
reporting tools isn’t sufficient to support high quality decisions.
Findings indicate that experience with analytical tools is significantly and
positively related to decision quality. This suggests that as people delve more deeply
into the data provided by the BI, the better the quality of the decisions they make.
Although this seems tautological at first, when considered in conjunction with the
findings about reporting tools, a deeper perspective emerges. This perspective
suggests that the type of experience users have with BI may be critical in terms of
decision quality. Reporting tool usage alone is not sufficient to increase decision quality,
even in the presence of high information quality. Rather, users who gain experience
60
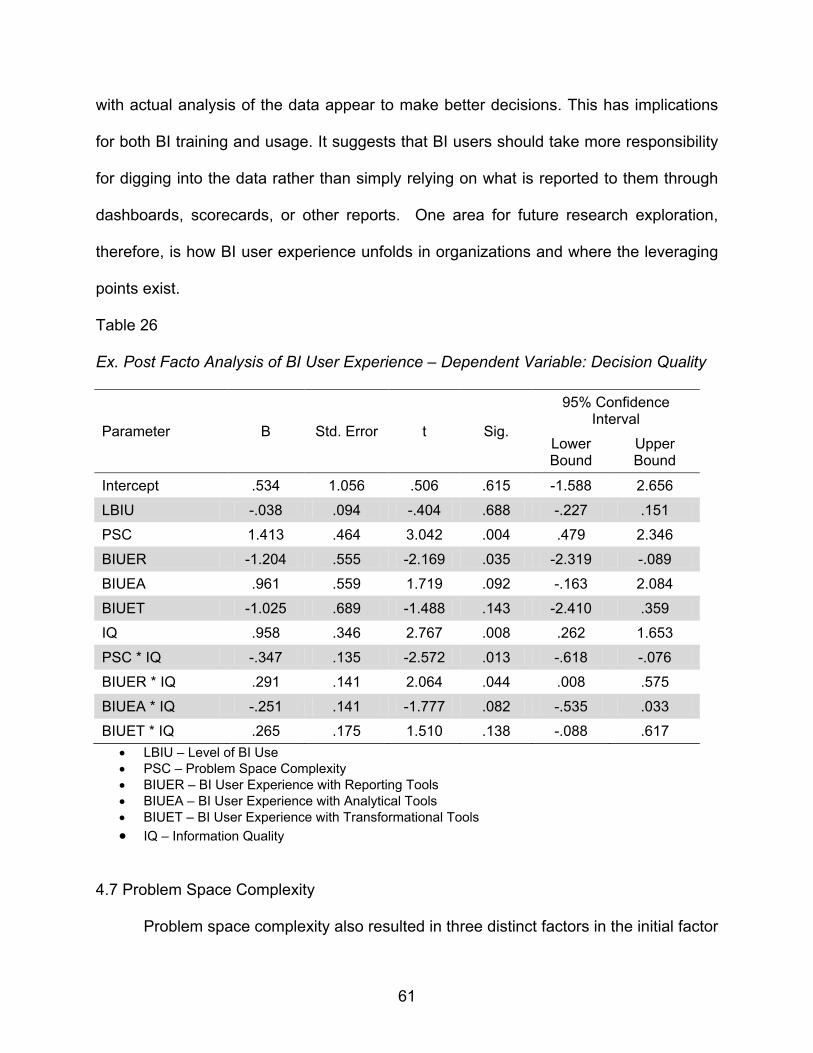
with actual analysis of the data appear to make better decisions. This has implications
for both BI training and usage. It suggests that BI users should take more responsibility
for digging into the data rather than simply relying on what is reported to them through
dashboards, scorecards, or other reports. One area for future research exploration,
therefore, is how BI user experience unfolds in organizations and where the leveraging
points exist.
Table 26
Ex. Post Facto Analysis of BI User Experience – Dependent Variable: Decision Quality
Parameter B Std. Error t Sig.
95% Confidence Interval
Lower Bound
Upper Bound
Intercept .534 1.056 .506 .615 -1.588 2.656
LBIU -.038 .094 -.404 .688 -.227 .151
PSC 1.413 .464 3.042 .004 .479 2.346
BIUER -1.204 .555 -2.169 .035 -2.319 -.089
BIUEA .961 .559 1.719 .092 -.163 2.084
BIUET -1.025 .689 -1.488 .143 -2.410 .359
IQ .958 .346 2.767 .008 .262 1.653
PSC * IQ -.347 .135 -2.572 .013 -.618 -.076
BIUER * IQ .291 .141 2.064 .044 .008 .575
BIUEA * IQ -.251 .141 -1.777 .082 -.535 .033
BIUET * IQ .265 .175 1.510 .138 -.088 .617 • LBIU – Level of BI Use • PSC – Problem Space Complexity • BIUER – BI User Experience with Reporting Tools • BIUEA – BI User Experience with Analytical Tools • BIUET – BI User Experience with Transformational Tools • IQ – Information Quality
4.7 Problem Space Complexity
Problem space complexity also resulted in three distinct factors in the initial factor
61

analysis (Tables 16, 17, 18). These were related to complexity that arises from the
number of variables in a problem, the time available for a decision, and the level of
uncertainty in the problem. The ex post facto results of including all three in the model
are provided in Table 18. Findings indicate that decision quality is significantly related to
problem space variable complexity and problem space uncertainty complexity at α =
.10, but not with problem space time availability complexity. This suggests that BI can
help in improving decision quality in situations where there are a greater number of
variables or interactions among variables and where there is greater uncertainty, but not
necessary compensate for the time constraint This is consistent with the finding in the
main analysis that problem space complexity is positively related to decision quality. It,
however, helps us better understand the specific aspects of complexity for which a BI
may best be used. There is little or no research that addresses problem space
complexity in the BI area at all and even less that addresses how it impacts decision
quality (Clark, et al., 2007; Clark and Jones, 2008). By better understanding the space
in which a BI is used and how that impacts the decision quality, we may better
understand how to develop more effective and useful BI tools. These ex post facto
findings help inform our collective understanding of BI usefulness in decision making
and how we might better frame research surrounding the topic.
To test the potential existence of common method bias in this study, the
Harmon’s one-factor test is performed by reviewing the unrotated solution of the
principle components factor analysis. A single factor or the first factor explaining more
variance than all the other factors is indicative of common method bias (Podsakoff and
Organ, 1986). Harmon’s one-factor test identified 14 factors, none of which was
62

dominant. The first extracted factor explained 32.9% of the entire variance. This
indicates that common method bias is not present. In addition, we inspected the
correlations among our variables. Bagozzi et al. (1991) suggest that values greater than
.90 among variables indicate the presence of common method bias. None of ours fall
into this category. This, along with the results of Harmon’s one-factor test suggests that
there is no common method bias in this study.
Table 27 Ex. Post Facto Analysis of Problem Space Complexity – Dependent Variable: Decision Quality
Parameter B Std. Error t Sig. 95% Confidence Interval
Lower Bound Upper Bound
Intercept -.433 1.033 -.419 .677 -2.502 1.636
LBIU -.051 .087 -.587 .560 -.225 .123
PSCF .885 .512 1.729 .089 -.141 1.911
PSCU 1.320 .489 2.701 .009 .341 2.300
PSCT -.919 .701 -1.310 .195 -2.324 .486
IQ 1.183 .325 3.643 .001 .532 1.833
BIU -.732 .501 -1.461 .150 -1.737 .272
PSCF * IQ -.218 .137 -1.591 .117 -.493 .056
PSCU * IQ -.347 .131 -2.655 .010 -.609 -.085
PSCT * IQ .247 .182 1.356 .181 -.118 .612
IQ * BIU .179 .130 1.377 .174 -.081 .439 • LBIU – Level of BI Use • PSCF – Problem Space Complexity number/interactions of factors/variables in a problem • PSCU – Problem Space Complexity degree of uncertainty in a problem • PSCT – Problem Space Complexity time available for the decision • BIUE – BI User Experience • IQ – Information Quality
63

CHAPTER 5
DISCUSSION AND CONCLUSIONS
This dissertation investigates the relationship between various business
intelligence (BI) system components and the quality of decisions made by people who
use BI. This chapter presents a discussion of the findings, limitations, contributions to
research, contributions to practice, and future research directions. A framework for
examining relationships between BI components and decision quality was proposed and
tested using a population of BI users. This framework proposes how the quality of
decisions made using BI is influenced by problem space complexity, the level of BI use,
BI user experience, and information quality.
5.1 Problem Space Complexity and Decision Quality
Problem space complexity is defined as the problem or situation about which a
decision is made (Clark et al., 2007) and is characterized by a variety of factors
including the number of underlying variables, the degree of uncertainty surrounding the
decision (Watson et al., 2004; Beer, 1966; Clark et al., 2007), and the amount of time at
hand to make the decision (Barthelemy et al., 2002). In this study it is posited that
higher problem space complexity is associated with higher quality decisions (Hypothesis
1). This hypothesis was supported lending support for the idea that decisions made
using BI in a highly complex problem space benefit more from BI (Table 25).
Recall from Chapter 4, that three dimensions of problem space complexity
emerged. Those were related to the number of variables and uncertainty in the problem
space and the time available for making the decision. In the ex post facto analysis,
64

findings suggested that problem space complexity was most strongly related to decision
quality when there were larger numbers of variables involved in the decision and greater
uncertainty. These points to an area where further research is needed to more closely
examine these relationships and the impact of using BI in a highly complex problem
space.
5.2 Information Quality and Decision Quality
Hypothesis 6 posits that information quality positively influences decision quality.
This direct relationship was supported which suggests that high quality information
leads to higher quality decisions. Thus, the quality of information in a BI is critical to the
quality of decisions made based on it.
While this is not surprising, it does lend further support to the research that
suggests that information quality is an antecedent of decision quality (Raghunathan,
1999; DeLone and McLean, 1992).
5.3 BI User Experience and Decision Quality
Hypothesis 2 posits that the quality of decisions made by experienced BI users is
greater than that of inexperienced BI users. This relationship was not supported. One
possible explanation for this may be that BI compensates for the differences in
experience (Gallupe and DeSanctis, 1988). Another possible explanation is that
experienced users may rely more heavily on their intuition or may second guess the
results of the BI (Burke and Miller, 1999). Still another possible explanation may be
found in the demographics data of these respondents. They are quite similar in terms of
65

experience. Therefore, there may simply not be sufficient variability to detect
substantive differences.
Recall, however, from Chapter 4 that three dimensions of user experience
emerged. They were experience related to reporting tools, analytical tools, and
transformations tools. Ex post facto analyses revealed that experience with reporting
tools and analytical tools were each statistically significantly related to decision quality.
Yet, the higher the experience with reporting tools, the lower the decision quality.
Findings also suggested that higher information quality positively moderated this
relationship. These findings, taken together, suggest that the type of experience user
have with BI may play a greater role in decision quality than originally posited. Thus,
further research is needed to examine these relationships with more granularity.
5.4 Level of BI Use and Decision Quality
The level of BI use was defined as the extent to which users employ and rely on
the BI to make decisions (Clark and Jones, 2008). Hypothesis 3 suggests that the
higher the level of use of the BI system, the higher the quality of decision making.
This hypothesis was not supported. One possible explanation may be that simply
using a BI does not translate to better decision making (Gallupe and DeSanctis, 1988).
There is conflicting evidence in the literature related to this relationship (Srinivasan,
1985). Our measures of the level of BI use tapped respondent perceptions of the extent
to which they relied on BI and made use of various BI features for decision making.
Thus, another possible explanation for the lack of a relationship with decision quality is
that users may have perceived their level of use to be greater than it actually was. More
66

objective measures of use might yield different results. This, however, suggests the
question of how much users rely on their BI and its functionality for decision making.
Research suggests that usage often does not go beyond that achieved in the initial
rollout of the system (Fichman and Kemerer, 1999).
Research indicates that BI use in many organizations, while not still in its infancy,
has not yet reached the level of maturity that enables innovative and game changing
decision making (Hostmann et al., 2007). Therefore, an area for future research is to
more closely examine the extent to which users do rely on (use) BI and its functionality
for decision making. If organizations are unable to attain a sufficient level of BI use, then
decision quality may be limited.
Another explanation can be that people use the system when they see it helpful
and do not use it for decisions where it would be of no help. Therefore, they assess the
system-decision fit, and only use the system in high-fit situations. Naturally, non-using
the system in low-fit situations would not result in poorer performance because of the
nature of decisions.
5.5 BI User Experience, Information Quality and Decision Quality
Hypothesis 5 which posits that the information quality negatively moderates the
relationship between the BI user experience and the decision quality was not supported.
One possible explanation is that in the presence of the same level of information quality,
the potential relative advantage of the BI experienced users in comparison to the
inexperienced users is reduced. Another explanation is that the experience levels were
67

relatively homogeneous with respect to the effect and that sufficient variability in
experience levels would result in a difference.
5.6 Problem Space Complexity, Information Quality and Decision Quality
Hypothesis 6 suggests that information quality negatively moderates the
relationship between problem space complexity and decision quality. This hypothesis
was supported suggesting that the interaction between problem space complexity and
information quality is significant (Table 24). Somewhat counter intuitively, the findings
indicate that while information quality moderates this relationship, it does so in the
opposite direction from that expected. Findings for H6 suggest that the relationship
between problem space complexity and decision quality is weakened in the presence of
higher levels of information quality. Thus, in situations where BI provides higher quality
information, high, problem space complexity has less impact on decision quality. One
possible explanation is that strictly relying on information existent in the systems can
lead to poor decisions (Arnold et al., 2006).
Furthermore, findings revealed specifically that information quality negatively
moderated the complexity related to uncertainty. Thus, one possible explanation for the
relationship found in the test of Hypothesis 6 is that higher levels of information quality
help reduce the uncertainty in the problem space. Where users can better rely on the
data, there may be less perceived uncertainty.
5.7 Limitations
In terms of internal and external validity, this study is subject to several
68

limitations. First, the survey may be susceptible to sampling error because the
respondents may not reflect the population (Braverman, 1996). Even though the
respondents are from a large geographic area, they are all from North America, or work
for North American organizations. Thus, the results of this study should be generalized
to other areas of the world with caution. Another limitation is the sample size. Although
we attained just above the minimum number of responses required for sufficient power
and effect, a larger sample size would have allowed us greater statistical and external
validity.
Another limitation is the possibility of common method bias which is common
when a single method (i.e., our electronic survey) is used to collect the data. Common
method variance occurs when respondent biases constitute a systematic error. This is
common when using survey responses from a single source because that single source
(respondent) can only provide one perspective. Thus, there might be spurious
correlation (Bagozzi, 1980). However, the assessment of common method bias through
Bagozzi (1980) and Podsakoff and Organ (1986) shows that no common method bias is
present in this study.
5.8 Research Contributions
The present study adds to the body of knowledge in the BI field in several ways.
First, it proposes an extension of the current research in BI and suggests a
parsimonious model for explaining the relationship between BI components such as
problem space complexity, level of BI use, BI user experience, and information quality
on the decision quality. No study so far investigated the influence of aforementioned
69

variables on decision quality in the context of BI. The few exiting studies adopt a narrow
perspective investigating only disconnected parts of the model proposed and tested
here (Gallupe and DeSanctis, 1988; Arnold et al., 2006; Shim, et al., 2002). Based on
the existing IS theories, this study is a bridge that connects existing findings in the field
of management information systems such as DSS and ERP to BI systems. For instance
existing research provides a theoretical perspective on the management support
systems framework, but do not test hypotheses in a BI context (Clark et al., 2007).
Other studies (Bui and Sivasankaran, 1990; Bharati and Chaudhury, 2004) suggest a
correlation between complexity of a problem and decision quality or between
information quality and decision-making satisfaction, but do not project their findings to
a BI context, even though the concept of BI was introduced in 1989. Other studies, such
as the one of (Watson and Wixom, 2007; Eckerson W. , 2003) provide successful
practitioners stories with BI, but do not offer a rigorous scientifically support for the
indicators that lead to such successful stories.
Second, it extends prior empirical research to include problem space complexity
and to address decision quality in the BI context. This study also provides a theoretical
framework from which future research of BI systems can grow. Future studies, can test
the same model having decision quality measured as a gap between expectations and
confirmations related to decision quality as suggested by SERVQUAL research.
(Parasuraman et al., 1988). Another direction of research is conducting an experiment
for the purpose of testing the causal relationship between the variables used in this
study. Such approach might confirm the results of this cross-sectional study.
70

Another contribution of this study is the operationalization and testing of the
problem space complexity dimensions and the exploratory assessment of the BI user
experience dimensions. Problem space complexity was little studied in the context of BI
systems, and the existing IS literature defines it as a one-dimensional construct. Recall
that problem space complexity was defined as being influenced by a variety of factors
including the number of underlying variables, the interaction among decision variables,
how well the variables can be measured and the degree of uncertainty surrounding the
decision (Watson et al., 2004; Beer, 1966; Clark et al., 2007) as well as the time to
make the decision and the ‘soft’ data surrounding the problem (Barthelemy, et al.,
2002). The ex post facto analysis indicates that problem space complexity can be
empirically measured using the three dimensions confirmed in this study. The same ex
post facto analysis shows that BI user experience is a more complex construct
underlined by other sub-dimensions, and each of these dimensions may play a different
role in decision quality. These findings provide a direction for future research to provide
deeper, more meaningful contributions in our collective understanding of how BI serves
to improve the quality of decision making. Future studies to confirm the findings in this
study are needed for achieving a convergence of the results. For instance, it is
necessary to verify the problem space complexity dimensions in other settings, or
different BI systems. Similarly, future studies can clarify if BI user experience
dimensions are equally important or not in describing BI user experience.
5.9 Contributions to Practice
This study contributes to practice in several ways. First, the study assesses the
71

role in decision quality that various BI components such as problem space complexity,
BI user experience, level of BI use, and information quality play. Findings indicate ways
in which these components impact the quality of decisions made using BI and point to
areas where managers may look to direct resources in their efforts to improve the
effectiveness of BI usage. For example, findings indicate that usage alone does not
result in higher decision quality. Findings also suggest that experience with some BI
tools may provide a greater impact than others. As such, greater experience with
analytical tools may have a greater impact on decision quality than that gained with
reporting tools. And while information quality is certainly important, findings point to its
interaction or moderating effects on the relationship between decision quality and both
problem space complexity and user experiences.
5.10 Conclusions
This study sheds light on an under investigated problem concerning the quality of
decisions made using BI systems. For example it is shown that problem space
complexity influence the quality of decisions in a BI environment. In addition, information
quality moderates the relationship between the BI user experience, problem space
complexity and decision quality. Moreover, this study showed support that BI user
experience is a more complex construct than was initially posited. As such, when
investigating BI user experience researchers need to be aware about the fact that BI
user experience can be measured through user experience with transformation,
analytical and reporting tools.
72

The ex-post facto analysis in this study also showed that problem space
complexity can be captured through the three sub-dimensions operationalized in this
study (number of variables in a problem, the time available for a decision, and the level
of uncertainty in the problem) plays a more important role in influencing the quality of
managerial decision.
Since the research model can be perceived as an initial nomological net for
decision quality within BI systems, it can constitute a starting point for investigation of
other components that may become part of this nomological net, depending on the level
of the granularity of such analysis. For instance, perceived BI benefits, is such a
candidate construct that may help at explaining the propensity to use BI systems.
This dissertation provides a research model for analyzing the relationship of BI
components such as problem space complexity, BI user experience, level of BI use, and
information quality with decision quality. To test the hypotheses of this study, an online
survey was conducted with BI users. The hypotheses tested in this model provide
valuable insights for both researchers and practitioners.
73

APPENDIX A
THE SURVEY INSTRUMENT
74
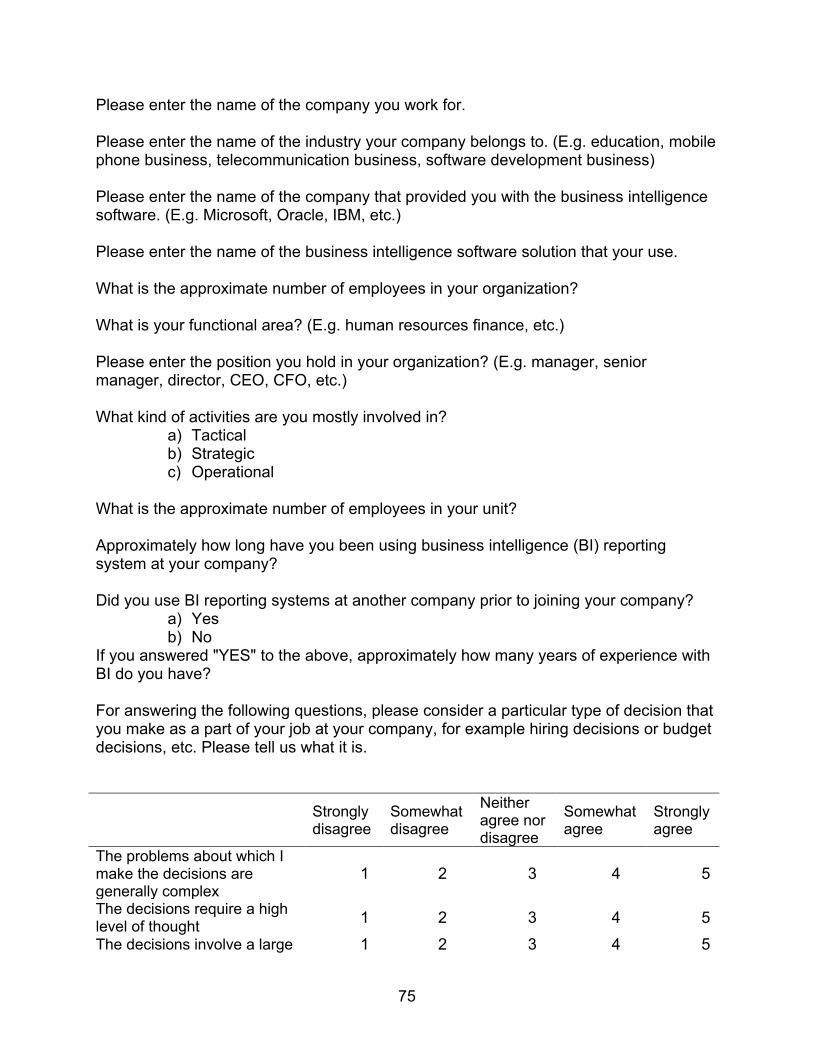
Please enter the name of the company you work for. Please enter the name of the industry your company belongs to. (E.g. education, mobile phone business, telecommunication business, software development business) Please enter the name of the company that provided you with the business intelligence software. (E.g. Microsoft, Oracle, IBM, etc.) Please enter the name of the business intelligence software solution that your use. What is the approximate number of employees in your organization? What is your functional area? (E.g. human resources finance, etc.) Please enter the position you hold in your organization? (E.g. manager, senior manager, director, CEO, CFO, etc.) What kind of activities are you mostly involved in?
a) Tactical b) Strategic c) Operational
What is the approximate number of employees in your unit? Approximately how long have you been using business intelligence (BI) reporting system at your company? Did you use BI reporting systems at another company prior to joining your company?
a) Yes b) No
If you answered "YES" to the above, approximately how many years of experience with BI do you have?
For answering the following questions, please consider a particular type of decision that you make as a part of your job at your company, for example hiring decisions or budget decisions, etc. Please tell us what it is.
Strongly disagree
Somewhat disagree
Neither agree nor disagree
Somewhat agree
Strongly agree
The problems about which I make the decisions are generally complex
1 2 3 4 5
The decisions require a high level of thought 1 2 3 4 5
The decisions involve a large 1 2 3 4 5
75

number of variables or elements The decisions require taking into account multiple factors 1 2 3 4 5 When making the decision I have to consider many different factors
1 2 3 4 5
The decisions involve a high degree of interaction among the variables or elements
1 2 3 4 5
The outcome of the decisions depends on the interaction of different factors
1 2 3 4 5
In making the decision it is important to consider the interaction among various factors
1 2 3 4 5
The decisions involve variables or elements that are difficult to measure
1 2 3 4 5
The decisions require ‘soft’ or unstructured data 1 2 3 4 5 The decisions involve a high level of risk 1 2 3 4 5 The decisions are associated with high levels of uncertainty 1 2 3 4 5 It is difficult to predict the outcome of the decisions 1 2 3 4 5 The decisions need to be made quickly 1 2 3 4 5 I face significant time pressure when making decisions
1 2 3 4 5
I have very little time to make the decisions 1 2 3 4 5
Regarding this specific decision
Strongly disagree
Somewhat disagree
Neither agree nor disagree
Somewhat agree
Strongly agree
I am satisfied with the outcomes of this decision 1 2 3 4 5
I believe I made good decision 1 2 3 4 5
In retrospect I believe I made the right decision 1 2 3 4 5
76

The decision that I made resulted in the desired outcome
1 2 3 4 5
Approximately how many years at your company have you been making this type of decision? Approximately how many years total have you been making this type of decision? Please answer the following questions about your use of your BI system at your company.
The information my BI system provides is
Please answer the following questions about your experience with implementation
Strongly disagree
Somewhat disagree
Neither agree nor disagree
Somewhat agree
Strongly agree
I relied highly on BI functionality while making the decision
1 2 3 4 5
I used various features of BI for making the decision 1 2 3 4 5
Using BI was critical in making the decision 1 2 3 4 5
The information the BI provides is:
Strongly disagree
Somewhat disagree
Neither agree nor disagree
Somewhat agree
Strongly agree
Believable 1 2 3 4 5 Useable 1 2 3 4 5 Understandable 1 2 3 4 5 Easy to interpret 1 2 3 4 5 Covers my needs 1 2 3 4 5 Appropriate 1 2 3 4 5 Applicable 1 2 3 4 5 Not overwhelming 1 2 3 4 5 Easy to extract or access 1 2 3 4 5 Available when I need it 1 2 3 4 5
Not at all
To very little extent
To some extent
To a fairly large extent
Extensively
I was involved with BI implementation at my company
1 2 3 4 5
77
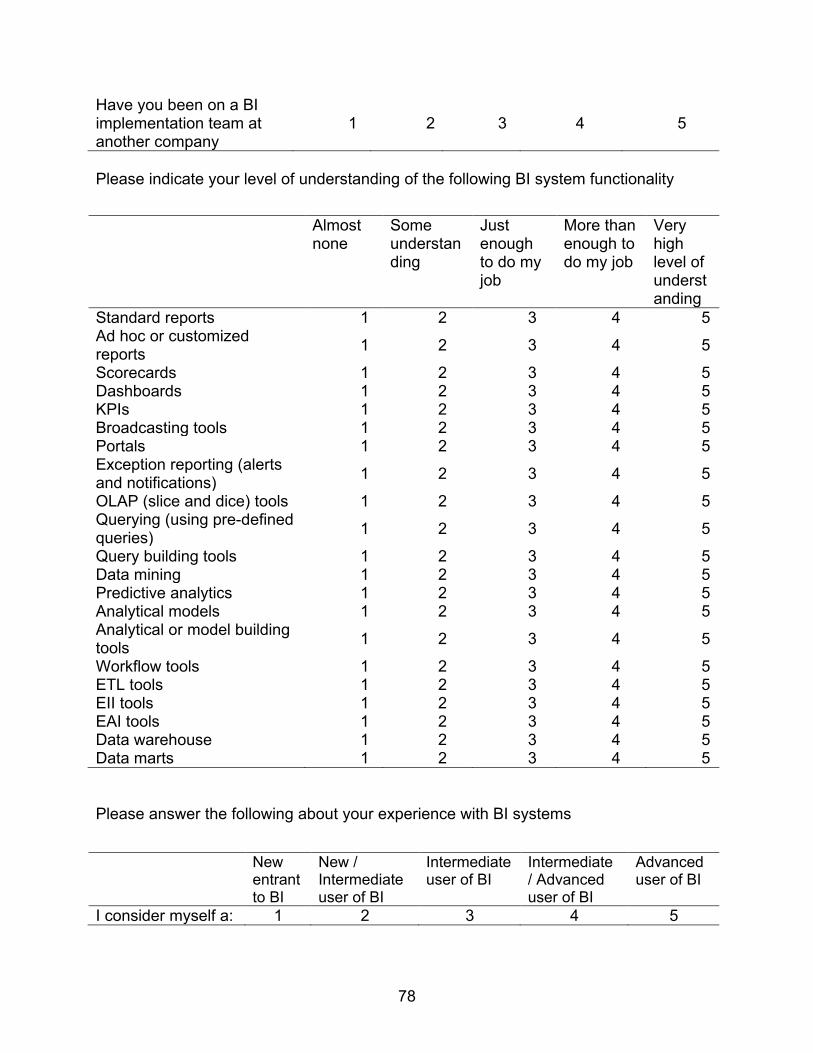
Please indicate your level of understanding of the following BI system functionality
Please answer the following about your experience with BI systems
Have you been on a BI implementation team at another company
1 2 3 4 5
Almost none
Some understanding
Just enough to do my job
More than enough to do my job
Very high level of understanding
Standard reports 1 2 3 4 5 Ad hoc or customized reports 1 2 3 4 5
Scorecards 1 2 3 4 5 Dashboards 1 2 3 4 5 KPIs 1 2 3 4 5 Broadcasting tools 1 2 3 4 5 Portals 1 2 3 4 5 Exception reporting (alerts and notifications) 1 2 3 4 5
OLAP (slice and dice) tools 1 2 3 4 5 Querying (using pre-defined queries) 1 2 3 4 5
Query building tools 1 2 3 4 5 Data mining 1 2 3 4 5 Predictive analytics 1 2 3 4 5 Analytical models 1 2 3 4 5 Analytical or model building tools 1 2 3 4 5
Workflow tools 1 2 3 4 5 ETL tools 1 2 3 4 5 EII tools 1 2 3 4 5 EAI tools 1 2 3 4 5 Data warehouse 1 2 3 4 5 Data marts 1 2 3 4 5
New entrant to BI
New / Intermediate user of BI
Intermediate user of BI
Intermediate / Advanced user of BI
Advanced user of BI
I consider myself a: 1 2 3 4 5
78
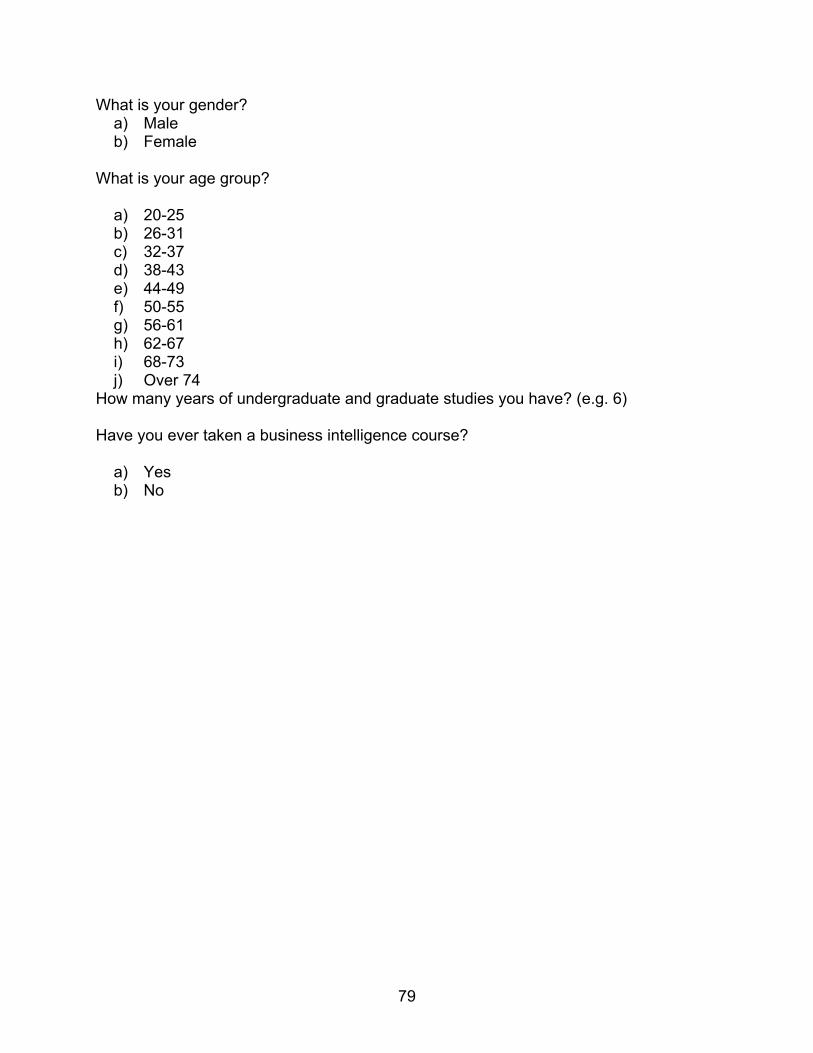
What is your gender? a) Male b) Female
What is your age group?
a) 20-25 b) 26-31 c) 32-37 d) 38-43 e) 44-49 f) 50-55 g) 56-61 h) 62-67 i) 68-73 j) Over 74
How many years of undergraduate and graduate studies you have? (e.g. 6)
Have you ever taken a business intelligence course?
a) Yes b) No
79

APPENDIX B
INVITATION TO PARTICIPATE IN THE STUDY
80
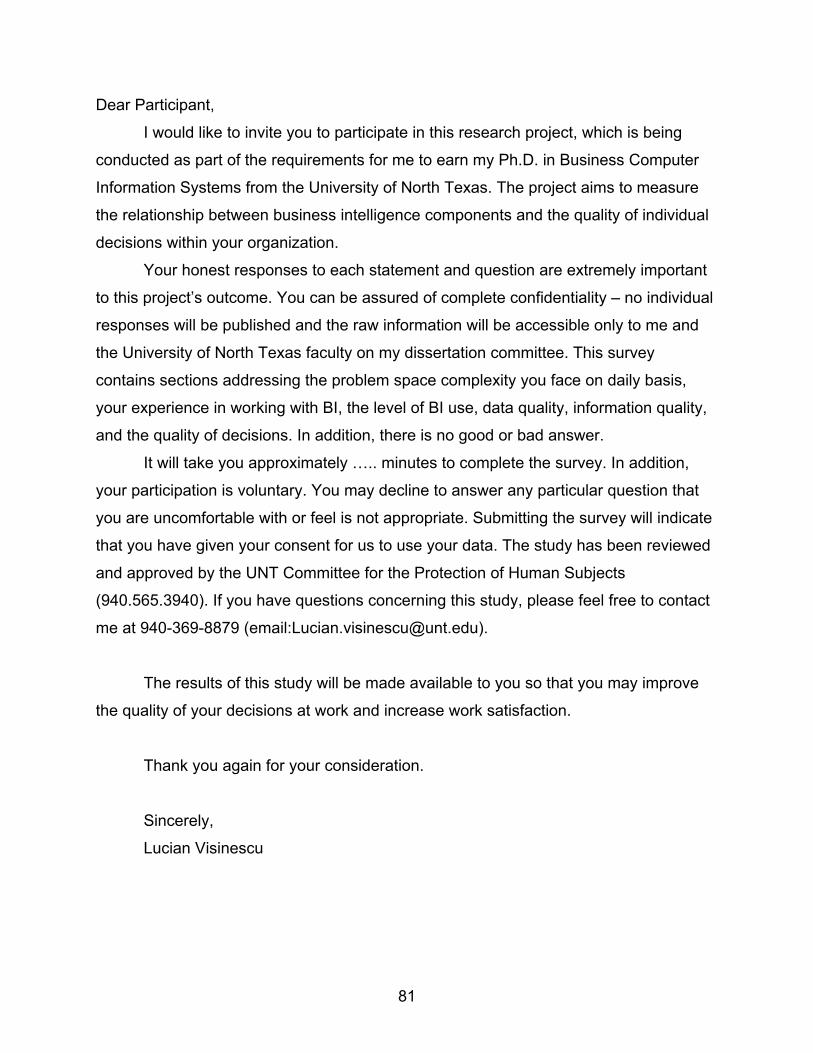
Dear Participant,
I would like to invite you to participate in this research project, which is being
conducted as part of the requirements for me to earn my Ph.D. in Business Computer
Information Systems from the University of North Texas. The project aims to measure
the relationship between business intelligence components and the quality of individual
decisions within your organization.
Your honest responses to each statement and question are extremely important
to this project’s outcome. You can be assured of complete confidentiality – no individual
responses will be published and the raw information will be accessible only to me and
the University of North Texas faculty on my dissertation committee. This survey
contains sections addressing the problem space complexity you face on daily basis,
your experience in working with BI, the level of BI use, data quality, information quality,
and the quality of decisions. In addition, there is no good or bad answer.
It will take you approximately ….. minutes to complete the survey. In addition,
your participation is voluntary. You may decline to answer any particular question that
you are uncomfortable with or feel is not appropriate. Submitting the survey will indicate
that you have given your consent for us to use your data. The study has been reviewed
and approved by the UNT Committee for the Protection of Human Subjects
(940.565.3940). If you have questions concerning this study, please feel free to contact
me at 940-369-8879 (email:[email protected]).
The results of this study will be made available to you so that you may improve
the quality of your decisions at work and increase work satisfaction.
Thank you again for your consideration.
Sincerely,
Lucian Visinescu
81

APPENDIX C
INTER-ITEM CORRELATION
82
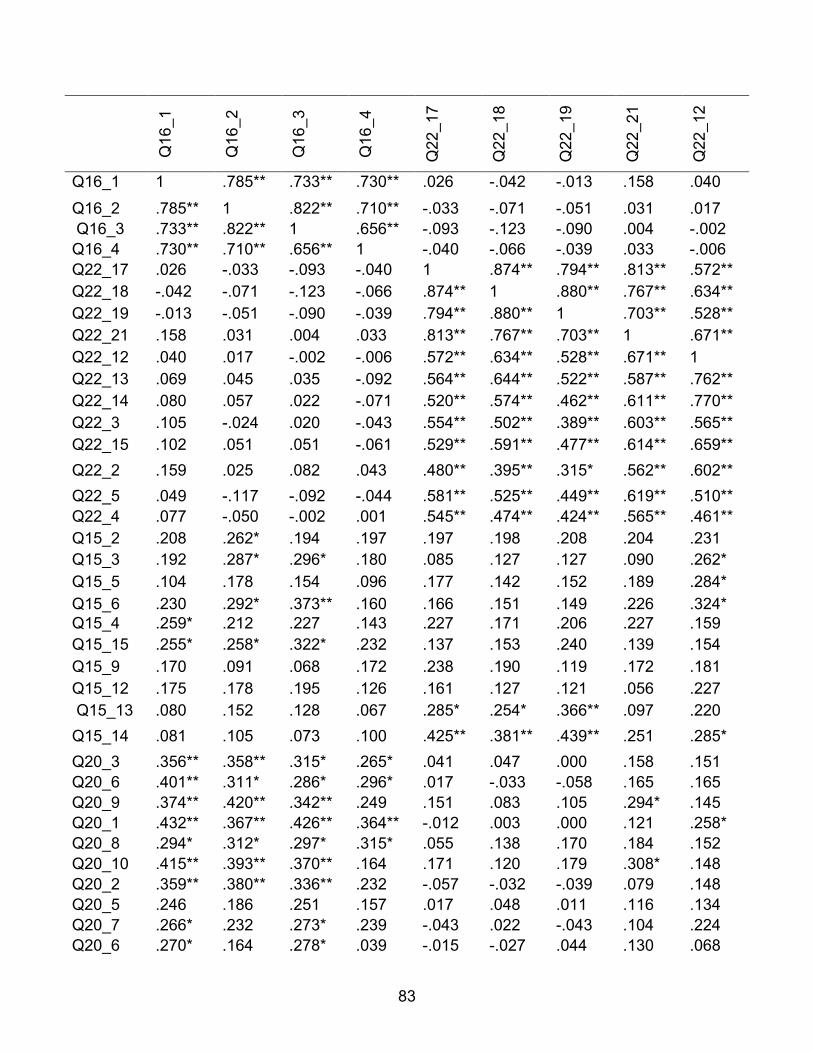
Q16
_1
Q16
_2
Q16
_3
Q16
_4
Q22
_17
Q22
_18
Q22
_19
Q22
_21
Q22
_12
Q16_1 1 .785** .733** .730** .026 -.042 -.013 .158 .040
Q16_2 .785** 1 .822** .710** -.033 -.071 -.051 .031 .017 Q16_3 .733** .822** 1 .656** -.093 -.123 -.090 .004 -.002 Q16_4 .730** .710** .656** 1 -.040 -.066 -.039 .033 -.006 Q22_17 .026 -.033 -.093 -.040 1 .874** .794** .813** .572** Q22_18 -.042 -.071 -.123 -.066 .874** 1 .880** .767** .634** Q22_19 -.013 -.051 -.090 -.039 .794** .880** 1 .703** .528** Q22_21 .158 .031 .004 .033 .813** .767** .703** 1 .671** Q22_12 .040 .017 -.002 -.006 .572** .634** .528** .671** 1 Q22_13 .069 .045 .035 -.092 .564** .644** .522** .587** .762** Q22_14 .080 .057 .022 -.071 .520** .574** .462** .611** .770** Q22_3 .105 -.024 .020 -.043 .554** .502** .389** .603** .565** Q22_15 .102 .051 .051 -.061 .529** .591** .477** .614** .659** Q22_2 .159 .025 .082 .043 .480** .395** .315* .562** .602** Q22_5 .049 -.117 -.092 -.044 .581** .525** .449** .619** .510** Q22_4 .077 -.050 -.002 .001 .545** .474** .424** .565** .461** Q15_2 .208 .262* .194 .197 .197 .198 .208 .204 .231 Q15_3 .192 .287* .296* .180 .085 .127 .127 .090 .262* Q15_5 .104 .178 .154 .096 .177 .142 .152 .189 .284* Q15_6 .230 .292* .373** .160 .166 .151 .149 .226 .324* Q15_4 .259* .212 .227 .143 .227 .171 .206 .227 .159 Q15_15 .255* .258* .322* .232 .137 .153 .240 .139 .154 Q15_9 .170 .091 .068 .172 .238 .190 .119 .172 .181 Q15_12 .175 .178 .195 .126 .161 .127 .121 .056 .227 Q15_13 .080 .152 .128 .067 .285* .254* .366** .097 .220 Q15_14 .081 .105 .073 .100 .425** .381** .439** .251 .285* Q20_3 .356** .358** .315* .265* .041 .047 .000 .158 .151 Q20_6 .401** .311* .286* .296* .017 -.033 -.058 .165 .165 Q20_9 .374** .420** .342** .249 .151 .083 .105 .294* .145 Q20_1 .432** .367** .426** .364** -.012 .003 .000 .121 .258* Q20_8 .294* .312* .297* .315* .055 .138 .170 .184 .152 Q20_10 .415** .393** .370** .164 .171 .120 .179 .308* .148 Q20_2 .359** .380** .336** .232 -.057 -.032 -.039 .079 .148 Q20_5 .246 .186 .251 .157 .017 .048 .011 .116 .134 Q20_7 .266* .232 .273* .239 -.043 .022 -.043 .104 .224 Q20_6 .270* .164 .278* .039 -.015 -.027 .044 .130 .068
83
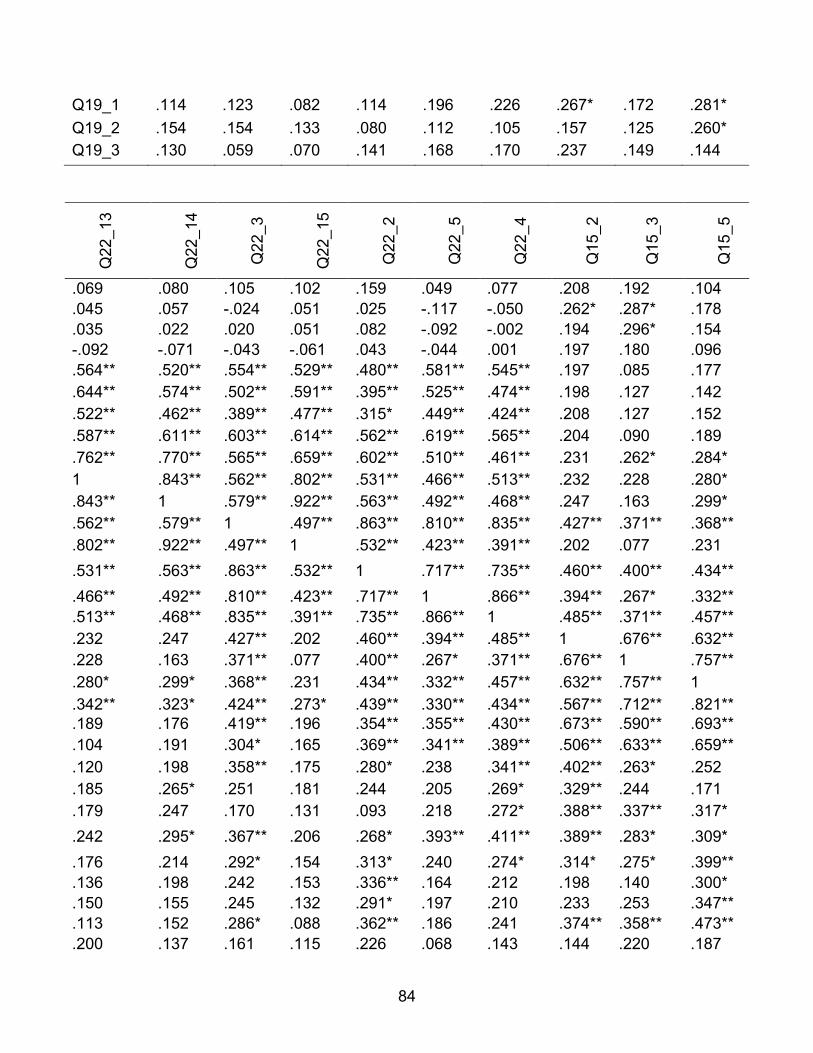
Q19_1 .114 .123 .082 .114 .196 .226 .267* .172 .281* Q19_2 .154 .154 .133 .080 .112 .105 .157 .125 .260* Q19_3 .130 .059 .070 .141 .168 .170 .237 .149 .144
Q22
_13
Q22
_14
Q22
_3
Q22
_15
Q22
_2
Q22
_5
Q22
_4
Q15
_2
Q15
_3
Q15
_5
.069 .080 .105 .102 .159 .049 .077 .208 .192 .104
.045 .057 -.024 .051 .025 -.117 -.050 .262* .287* .178
.035 .022 .020 .051 .082 -.092 -.002 .194 .296* .154 -.092 -.071 -.043 -.061 .043 -.044 .001 .197 .180 .096 .564** .520** .554** .529** .480** .581** .545** .197 .085 .177 .644** .574** .502** .591** .395** .525** .474** .198 .127 .142 .522** .462** .389** .477** .315* .449** .424** .208 .127 .152 .587** .611** .603** .614** .562** .619** .565** .204 .090 .189 .762** .770** .565** .659** .602** .510** .461** .231 .262* .284* 1 .843** .562** .802** .531** .466** .513** .232 .228 .280* .843** 1 .579** .922** .563** .492** .468** .247 .163 .299* .562** .579** 1 .497** .863** .810** .835** .427** .371** .368** .802** .922** .497** 1 .532** .423** .391** .202 .077 .231 .531** .563** .863** .532** 1 .717** .735** .460** .400** .434** .466** .492** .810** .423** .717** 1 .866** .394** .267* .332** .513** .468** .835** .391** .735** .866** 1 .485** .371** .457** .232 .247 .427** .202 .460** .394** .485** 1 .676** .632** .228 .163 .371** .077 .400** .267* .371** .676** 1 .757** .280* .299* .368** .231 .434** .332** .457** .632** .757** 1 .342** .323* .424** .273* .439** .330** .434** .567** .712** .821** .189 .176 .419** .196 .354** .355** .430** .673** .590** .693** .104 .191 .304* .165 .369** .341** .389** .506** .633** .659** .120 .198 .358** .175 .280* .238 .341** .402** .263* .252 .185 .265* .251 .181 .244 .205 .269* .329** .244 .171 .179 .247 .170 .131 .093 .218 .272* .388** .337** .317* .242 .295* .367** .206 .268* .393** .411** .389** .283* .309* .176 .214 .292* .154 .313* .240 .274* .314* .275* .399** .136 .198 .242 .153 .336** .164 .212 .198 .140 .300* .150 .155 .245 .132 .291* .197 .210 .233 .253 .347** .113 .152 .286* .088 .362** .186 .241 .374** .358** .473** .200 .137 .161 .115 .226 .068 .143 .144 .220 .187
84
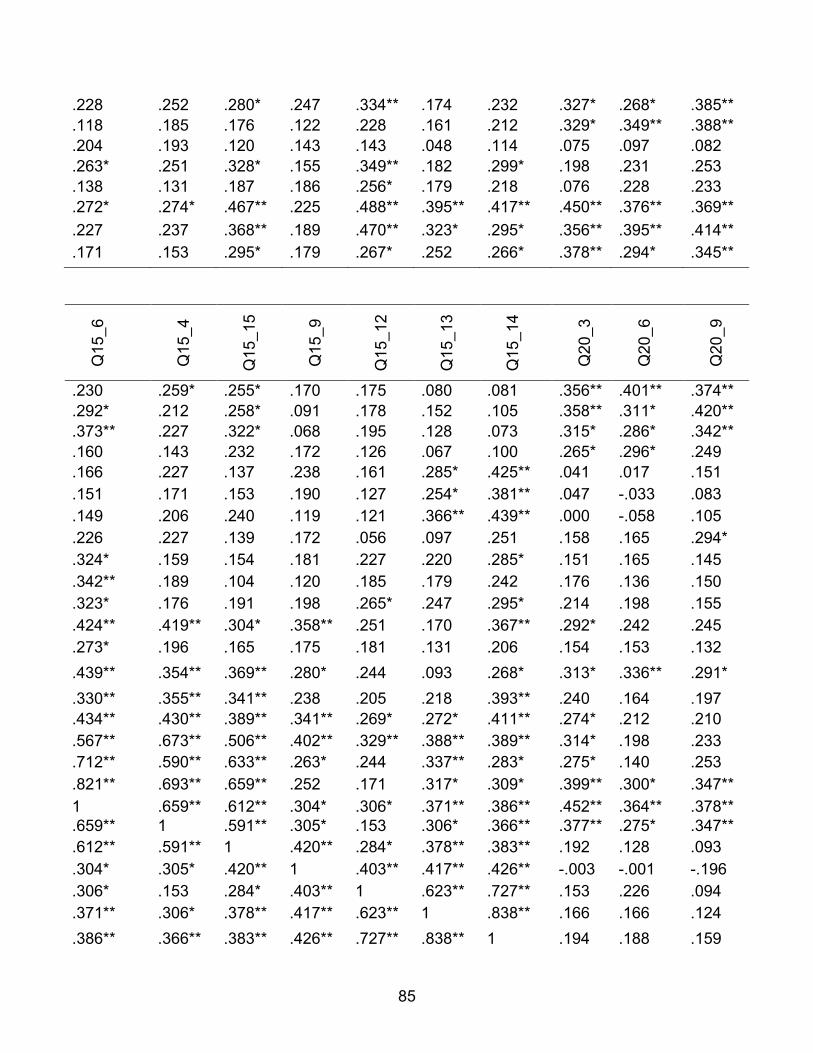
.228 .252 .280* .247 .334** .174 .232 .327* .268* .385**
.118 .185 .176 .122 .228 .161 .212 .329* .349** .388**
.204 .193 .120 .143 .143 .048 .114 .075 .097 .082
.263* .251 .328* .155 .349** .182 .299* .198 .231 .253
.138 .131 .187 .186 .256* .179 .218 .076 .228 .233
.272* .274* .467** .225 .488** .395** .417** .450** .376** .369**
.227 .237 .368** .189 .470** .323* .295* .356** .395** .414**
.171 .153 .295* .179 .267* .252 .266* .378** .294* .345**
Q15
_6
Q15
_4
Q15
_15
Q15
_9
Q15
_12
Q15
_13
Q15
_14
Q20
_3
Q20
_6
Q20
_9
.230 .259* .255* .170 .175 .080 .081 .356** .401** .374**
.292* .212 .258* .091 .178 .152 .105 .358** .311* .420**
.373** .227 .322* .068 .195 .128 .073 .315* .286* .342**
.160 .143 .232 .172 .126 .067 .100 .265* .296* .249
.166 .227 .137 .238 .161 .285* .425** .041 .017 .151
.151 .171 .153 .190 .127 .254* .381** .047 -.033 .083
.149 .206 .240 .119 .121 .366** .439** .000 -.058 .105
.226 .227 .139 .172 .056 .097 .251 .158 .165 .294*
.324* .159 .154 .181 .227 .220 .285* .151 .165 .145
.342** .189 .104 .120 .185 .179 .242 .176 .136 .150
.323* .176 .191 .198 .265* .247 .295* .214 .198 .155
.424** .419** .304* .358** .251 .170 .367** .292* .242 .245
.273* .196 .165 .175 .181 .131 .206 .154 .153 .132
.439** .354** .369** .280* .244 .093 .268* .313* .336** .291*
.330** .355** .341** .238 .205 .218 .393** .240 .164 .197
.434** .430** .389** .341** .269* .272* .411** .274* .212 .210
.567** .673** .506** .402** .329** .388** .389** .314* .198 .233
.712** .590** .633** .263* .244 .337** .283* .275* .140 .253
.821** .693** .659** .252 .171 .317* .309* .399** .300* .347** 1 .659** .612** .304* .306* .371** .386** .452** .364** .378** .659** 1 .591** .305* .153 .306* .366** .377** .275* .347** .612** .591** 1 .420** .284* .378** .383** .192 .128 .093 .304* .305* .420** 1 .403** .417** .426** -.003 -.001 -.196 .306* .153 .284* .403** 1 .623** .727** .153 .226 .094 .371** .306* .378** .417** .623** 1 .838** .166 .166 .124 .386** .366** .383** .426** .727** .838** 1 .194 .188 .159
85
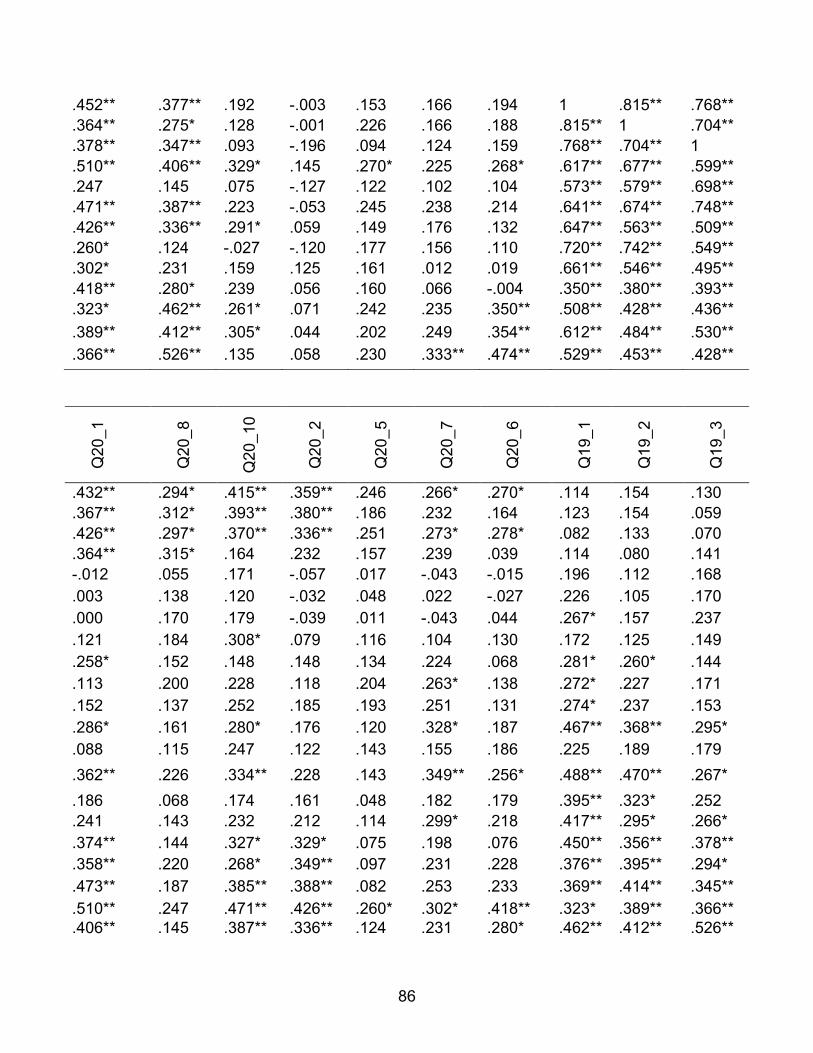
.452** .377** .192 -.003 .153 .166 .194 1 .815** .768**
.364** .275* .128 -.001 .226 .166 .188 .815** 1 .704**
.378** .347** .093 -.196 .094 .124 .159 .768** .704** 1
.510** .406** .329* .145 .270* .225 .268* .617** .677** .599**
.247 .145 .075 -.127 .122 .102 .104 .573** .579** .698**
.471** .387** .223 -.053 .245 .238 .214 .641** .674** .748**
.426** .336** .291* .059 .149 .176 .132 .647** .563** .509**
.260* .124 -.027 -.120 .177 .156 .110 .720** .742** .549**
.302* .231 .159 .125 .161 .012 .019 .661** .546** .495**
.418** .280* .239 .056 .160 .066 -.004 .350** .380** .393**
.323* .462** .261* .071 .242 .235 .350** .508** .428** .436**
.389** .412** .305* .044 .202 .249 .354** .612** .484** .530**
.366** .526** .135 .058 .230 .333** .474** .529** .453** .428**
Q20
_1
Q20
_8
Q20
_10
Q20
_2
Q20
_5
Q20
_7
Q20
_6
Q19
_1
Q19
_2
Q19
_3
.432** .294* .415** .359** .246 .266* .270* .114 .154 .130
.367** .312* .393** .380** .186 .232 .164 .123 .154 .059
.426** .297* .370** .336** .251 .273* .278* .082 .133 .070
.364** .315* .164 .232 .157 .239 .039 .114 .080 .141 -.012 .055 .171 -.057 .017 -.043 -.015 .196 .112 .168 .003 .138 .120 -.032 .048 .022 -.027 .226 .105 .170 .000 .170 .179 -.039 .011 -.043 .044 .267* .157 .237 .121 .184 .308* .079 .116 .104 .130 .172 .125 .149 .258* .152 .148 .148 .134 .224 .068 .281* .260* .144 .113 .200 .228 .118 .204 .263* .138 .272* .227 .171 .152 .137 .252 .185 .193 .251 .131 .274* .237 .153 .286* .161 .280* .176 .120 .328* .187 .467** .368** .295* .088 .115 .247 .122 .143 .155 .186 .225 .189 .179 .362** .226 .334** .228 .143 .349** .256* .488** .470** .267* .186 .068 .174 .161 .048 .182 .179 .395** .323* .252 .241 .143 .232 .212 .114 .299* .218 .417** .295* .266* .374** .144 .327* .329* .075 .198 .076 .450** .356** .378** .358** .220 .268* .349** .097 .231 .228 .376** .395** .294* .473** .187 .385** .388** .082 .253 .233 .369** .414** .345** .510** .247 .471** .426** .260* .302* .418** .323* .389** .366** .406** .145 .387** .336** .124 .231 .280* .462** .412** .526**
86
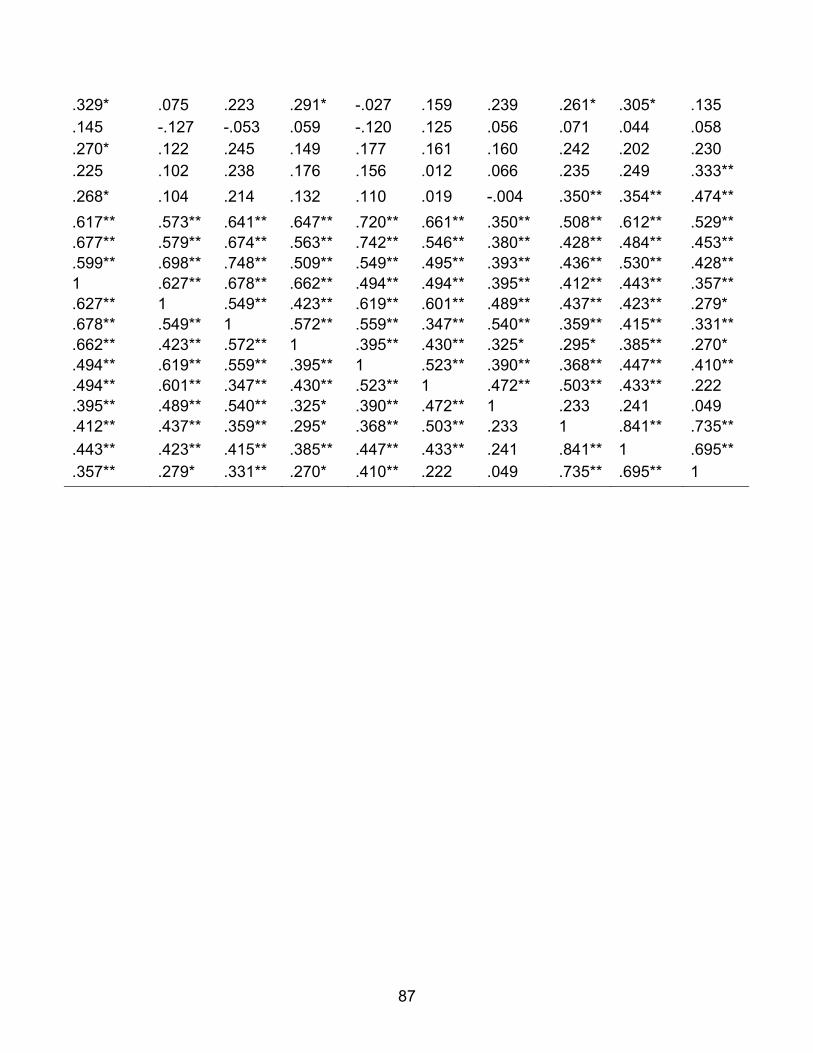
.329* .075 .223 .291* -.027 .159 .239 .261* .305* .135
.145 -.127 -.053 .059 -.120 .125 .056 .071 .044 .058
.270* .122 .245 .149 .177 .161 .160 .242 .202 .230
.225 .102 .238 .176 .156 .012 .066 .235 .249 .333**
.268* .104 .214 .132 .110 .019 -.004 .350** .354** .474**
.617** .573** .641** .647** .720** .661** .350** .508** .612** .529**
.677** .579** .674** .563** .742** .546** .380** .428** .484** .453**
.599** .698** .748** .509** .549** .495** .393** .436** .530** .428** 1 .627** .678** .662** .494** .494** .395** .412** .443** .357** .627** 1 .549** .423** .619** .601** .489** .437** .423** .279* .678** .549** 1 .572** .559** .347** .540** .359** .415** .331** .662** .423** .572** 1 .395** .430** .325* .295* .385** .270* .494** .619** .559** .395** 1 .523** .390** .368** .447** .410** .494** .601** .347** .430** .523** 1 .472** .503** .433** .222 .395** .489** .540** .325* .390** .472** 1 .233 .241 .049 .412** .437** .359** .295* .368** .503** .233 1 .841** .735** .443** .423** .415** .385** .447** .433** .241 .841** 1 .695** .357** .279* .331** .270* .410** .222 .049 .735** .695** 1
87

APPENDIX D
PARAMETERS ESTIMATES WITH VIF
88
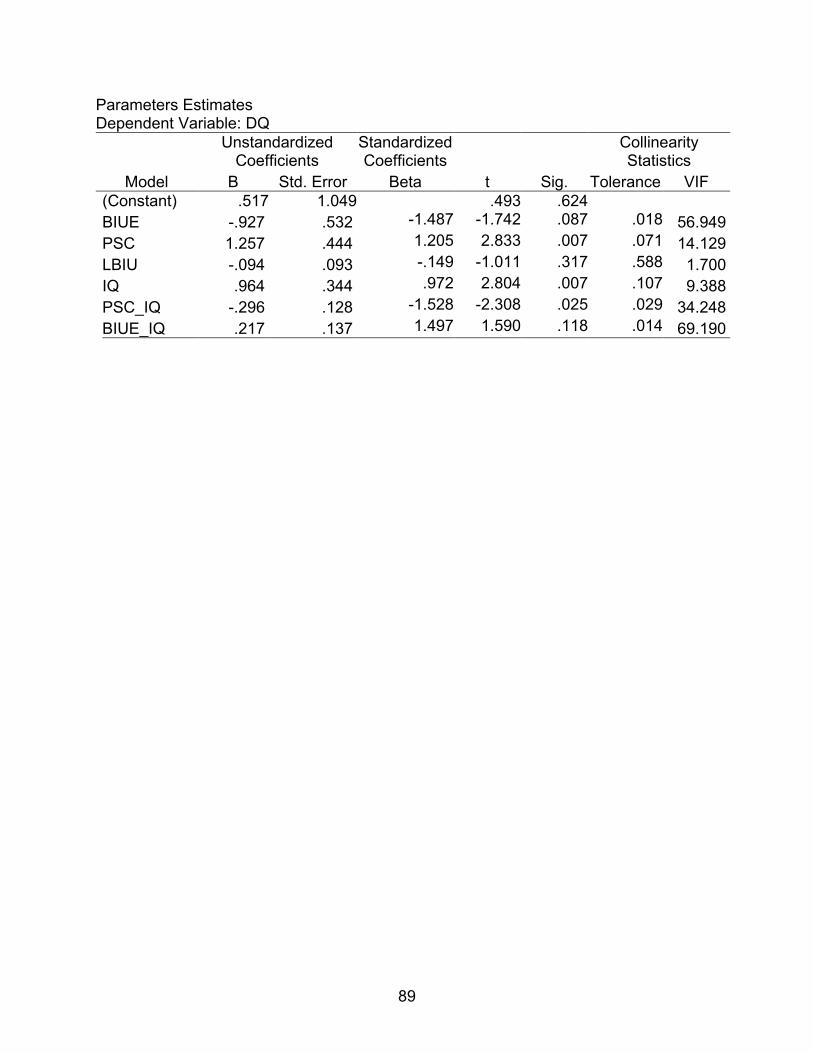
Parameters Estimates Dependent Variable: DQ
Model
Unstandardized Coefficients
Standardized Coefficients
t Sig.
Collinearity Statistics
B Std. Error Beta Tolerance VIF (Constant) .517 1.049 .493 .624 BIUE -.927 .532 -1.487 -1.742 .087 .018 56.949 PSC 1.257 .444 1.205 2.833 .007 .071 14.129 LBIU -.094 .093 -.149 -1.011 .317 .588 1.700 IQ .964 .344 .972 2.804 .007 .107 9.388 PSC_IQ -.296 .128 -1.528 -2.308 .025 .029 34.248 BIUE_IQ .217 .137 1.497 1.590 .118 .014 69.190
89

APPENDIX E
RIDGE REGRESSION K’s ESTIMATES
90

R-SQUARE AND BETA COEFFICIENTS FOR ESTIMATED VALUES OF K K RSQ LBIU PSCJ IQJ BIUEJ PSCJ_IQJ BIUJ_IQJ
0.00 0.32 -0.15 1.21 0.97 -1.49 -1.53 1.50 0.05 0.27 -0.15 0.35 0.53 -0.20 -0.18 0.06 0.10 0.25 -0.13 0.24 0.42 -0.15 -0.02 0.01 0.15 0.24 -0.12 0.20 0.37 -0.13 0.04 0.00 0.20 0.23 -0.10 0.17 0.33 -0.12 0.07 -0.01 0.25 0.23 -0.09 0.16 0.31 -0.11 0.09 -0.01 0.30 0.22 -0.08 0.14 0.29 -0.10 0.10 -0.01 0.35 0.22 -0.07 0.14 0.27 -0.10 0.10 -0.01 0.40 0.22 -0.07 0.13 0.26 -0.09 0.11 -0.01 0.45 0.21 -0.06 0.12 0.25 -0.09 0.11 -0.01 0.50 0.21 -0.05 0.12 0.24 -0.08 0.11 -0.01 0.55 0.21 -0.05 0.11 0.23 -0.08 0.11 -0.01 0.60 0.20 -0.04 0.11 0.22 -0.07 0.11 -0.01 0.65 0.20 -0.04 0.10 0.21 -0.07 0.11 -0.01 0.70 0.20 -0.04 0.10 0.20 -0.07 0.11 -0.01 0.75 0.19 -0.03 0.10 0.20 -0.07 0.11 -0.01 0.80 0.19 -0.03 0.09 0.19 -0.06 0.11 -0.01 0.85 0.19 -0.03 0.09 0.19 -0.06 0.10 -0.01 0.90 0.19 -0.02 0.09 0.18 -0.06 0.10 -0.01 0.95 0.18 -0.02 0.09 0.18 -0.06 0.10 0.00 1.00 0.18 -0.02 0.09 0.17 -0.05 0.10 0.00
91
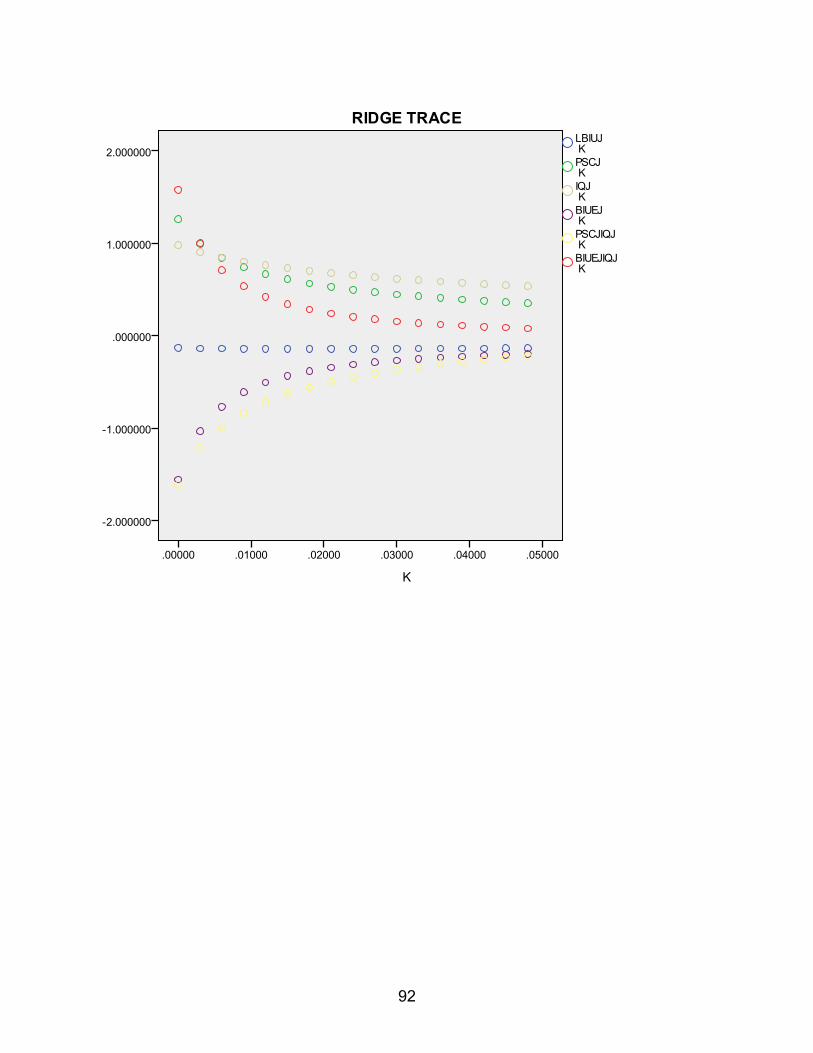
92

93

APPENDIX F
RIDGE REGRESSION RESULTS
94
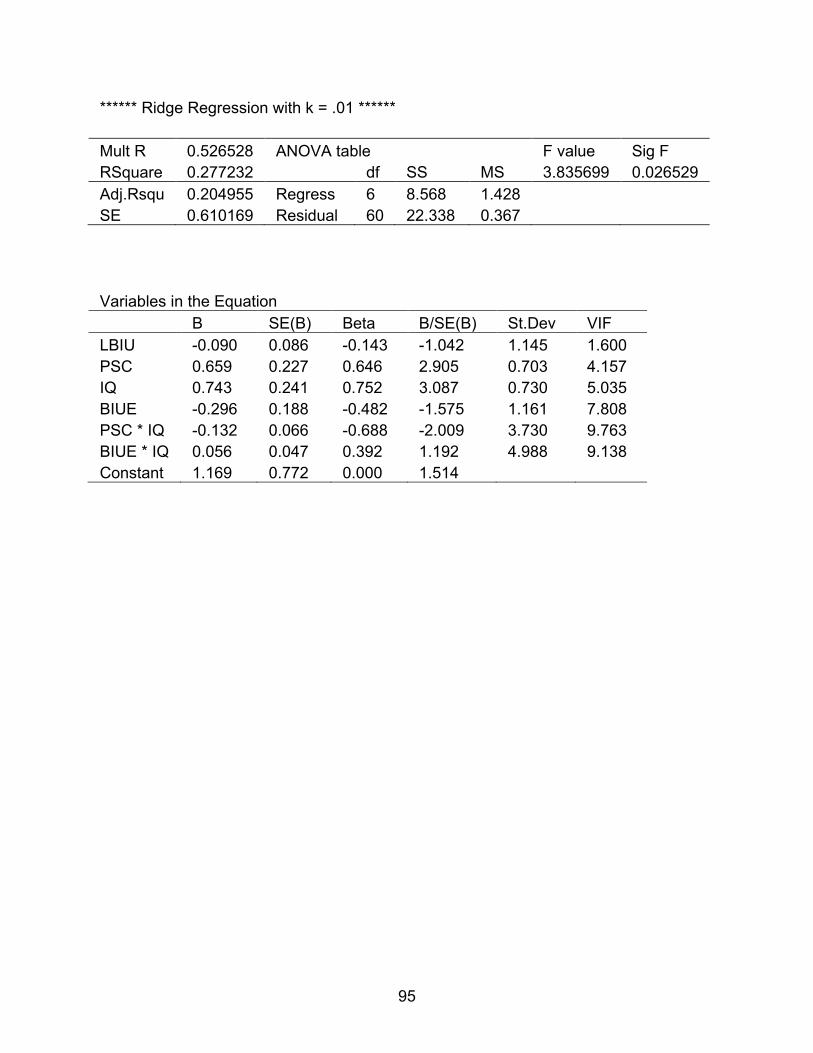
****** Ridge Regression with k = .01 ****** Mult R 0.526528 ANOVA table F value Sig F RSquare 0.277232 df SS MS 3.835699 0.026529 Adj.Rsqu 0.204955 Regress 6 8.568 1.428 SE 0.610169 Residual 60 22.338 0.367 Variables in the Equation B SE(B) Beta B/SE(B) St.Dev VIF LBIU -0.090 0.086 -0.143 -1.042 1.145 1.600 PSC 0.659 0.227 0.646 2.905 0.703 4.157 IQ 0.743 0.241 0.752 3.087 0.730 5.035 BIUE -0.296 0.188 -0.482 -1.575 1.161 7.808 PSC * IQ -0.132 0.066 -0.688 -2.009 3.730 9.763 BIUE * IQ 0.056 0.047 0.392 1.192 4.988 9.138 Constant 1.169 0.772 0.000 1.514
95
REFERENCES
Agmon, N., and Ahituv, N. (1987). Assessing Data Reliability in an Information System. Journal of Management Information Systems, 34-44.
Anderson-Lehman, R., Watson, H. J., Wixom, B. H., and Hoffer, J. A. (2004). Continental Airlines Flies High with Real-Time Business Intelligence. MIS Quarterly, 3-33.
Anthony, R. N. (1965). Planning and control systems: A framework for analysis. Boston: Harvard University .
Arnott, D., and Pervan, G. (2005). A critical analysis of decission support systems research. Journal Of Information Technology, 67-87.
Bartlett, J. E., Kotrlik, J. W., and Higgins, C. (2001). Organizational research: Determining appropriate sample size for survey research. Information Technology, Learning and Performance Journal, 19(1), 43-50.
Basi, R. K. (1999). WWW response rates to socio-demographic items. Journal of the Market Research Society, 41(4), 43-50.
Bharati, P., and Chaudhury, A. (2004). An Empirical Investigation of Decision-Making Satisfaction in Web-Based Decision Support Systems. Decision Support Systems, 187-197.
Buchanan, L., and O'Connell, A. (2006). A Brief History of Decision making. Harvard Business Review, 1-8.
Bullen, G., and Sacks, L. (2003). Towards new Modes of Decision Making - Complexity and Human Factors. Complexity and Human Factors(1a), 1-5.
Burke, L. A., and Miller, M. K. (1999). Taking the Mystery out of Intuitive Decision Making. Academy of Mangement Academy, 13(4), 91-99.
Bystrom, K., and Jarvelin, K. (1995). Task Complexity Affects Information Seeking and Use. Information Processing and Management, 31(2), 191-213.
Campbell, D. T., and Fiske, D. W. (1959). Convergent and Discriminant Validation by the Multitrait-multimethod matrix. Psychological Bulletin, 54, 297-312.
Carmeli, A., and Schaubroeck, J. (2006). Top management team behavioral integration, decision quality, and organizational decline. The Leadership Quarterly, 441-453.
Chow, S. L. (1997). Statistical Significance: Rationale, Validity and Utility (Volume 1 of series Introducing Statistical Methods). SAGE Publications Ltd.
96
Clark, T. D., and Jones, M. C. (2008). An Experimental Analysis of the Dynamic Structure and Behavior of Management Support Systems. Systems Dynamics Review, 24(2), 215-245.
Clark, T. D., Jones, M. C., and Armstrong, C. P. (2007). The Dynamic Structure of Management Support Systems: Theory Development, Research Focus, and Direction. MIS Quarterly, 579-615.
Clover, T. V., and Balsley, L. H. (1979). Business Research Methods. Columbus: Grid Publishing.
Cody, W. F., Kreulen, J. T., Krishna, V., and Spangler, W. S. (2002). The Integration of Business Intelligence and Knowledge Management. IBM Systems Journal, 697-713.
Cohen, J. (1988). Statistical power analysis for the behavioral sciences . New Jersey: Lawrence Erlbaum Associates, Inc.
Cohen, J., Cohen, P., and Aiken, L. S. (2003). Applied Multiple Regression/Correlation Analysis for the Behavioral Sciences (3rd edition). Mahwah, NY: Lawrence Earlbaum Associates.
Cronbach, L. J. (1951). Coefficient Alpha and the Internal Structure of Tests. Psychometrika, 16, 297-334.
Cronin, J. J., and Taylor, S. A. (1994). SERVPERF versus SERVQUAL: Reconciling Performance-Based and Perceptions-Minus-Expectations Measurement of Service Quality. The Journal of Marketing, 58(1), 125-131.
DeLone, W. H., and McLean, E. R. (1992). Information Systems Success: The Quest for the Dependent Variable. Information Systems Research, 60-95.
DeLone, W. H., and McLean, E. R. (1992). Information Systems Success: The Quest for the Dependent Variable. Information Systems Research, 60-95.
DeLone, W. H., and McLean, E. R. (2002). Information Systems Success Revisited. Proceedings of the 35th Hawaii International Conference on System Sciences, 238-249.
DeLone, W. H., and McLean, E. R. (2003). he DeLone and McLean Model of Information Systems Success: A Ten-Year Update. Journal of Management Information Systems, 9-30.
Dillman, D. A. (2007). Mail and INternet Surveys: The Tailored Design (Second edition). New York: John Wiley and Sons.
Doherty, G. D. (2008). On quality in education. Quality Assurance in Education, 255-265.
97

Eckerson, W. (2003, August 5). Smart Companies in the 21st Century: The Secrets of Creating Successful Business Intelligence Solutions. Retrieved February 7, 2011, from http://cstl-hcb.semo.edu: http://cstl-hcb.semo.edu/eom/mi430/protected/assignments/smartcompanies.pdf
Eckerson, W. W. (2005). The Keys to Enterprise Business Intelligence: Critical Success Factors. TDWI Monograph Series.
Fornell, C., and Larcker, D. F. (1981). Structural Equations Models with Unobservable Variables and Measurent Error: Algebra and Statistics. Jpurnal of Marketing Research, 18, 39-50.
Gefen, D., and Straub, D. (2005). A Practical Guide to Factorial Validity Using PLS Graph: Tutorial and Annotated Example. Communications of the AIS, 16, 91-109.
Gelderman, M. (1995). Factors Affecting the Success of Management Support Systems. AAA IS/MAS - Forum, 1-25.
Gibson, M., Arnott, D., and Jagielska, J. (2004). Evaluating the Intangible Benefits of Business Intelligence: Review and Research Agenda. DSS Conference Proceedings, 295-305.
Gilmore, A. (1998). Quality in management decision making within a changing context. Journal of Management Development, 106-120.
Golfarelli, M., Rizzi, S., and Cella, I. (2004). Beyond Data Warehousing: What's Next in Business Intelligence. ACM Digital Library - Conference on Information and Knowledge Management, 1-6.
Gorry, G. A., and Morton, S. (1971). A Framework for Management Information Systems. Sloan Management Review, 55-72.
Heath, C., and Gonzalez, R. (1995). Interactions with Others Increases Decision Confidence but Not Decision Quality: Evidence against Information Collection Views of Interactive Decision Making. Organizational Behavior and Human Decision Processes, 305-326.
Heise, D. R., and Bohrnstedt, G. W. (1970). Validity, invalidity, and reliability. In E.F. Borgatta and G.W. Bohrnstedt(Eds.) Sociological methodology. San Francisco: Jossey-Bass.
Helmons, P. J., Grouls, R. J., Roos, A. N., Bindels, A. J., Wessels-Basten, S. J., Ackerman, E. W., and Korsten, E. H. (2010). Using a Clinical Decision Support System to Determine the Quality of Antimicrobial Dosing in Intensive Care Patients with Renal Insufficiency. BMJ Quality and Safety, 22-26.
98

Henschen, D. (2010, January 4). Analytics at Work: QandA with Tom Davenport. Retrieved April 30, 2012, from InformationWeek Software: http://www.informationweek.com/news/software/bi/222200096
Herschel, R. T., and Jones, N. E. (2005). Knowledge Management and Business Intelligence: the Importance of the Integration. Journal of Knowledge Management, 45-55.
Hill, C. R., and Thompson, B. (2004). Computing and interpreting effect sizes. Smart, J.C. (Ed.), Higher Education: Handbook of Theory and Research, 19, 175-196.
Hochstrasser, B. (1993). QUALITY ENGINEERING (QE): A New Framework applied to Justifying and Prioritising IT Investments. Journal of Information Systems, 211-234.
Hostmann, B., Herschel, G., and Rayner, N. (2007). The Evolution of Business Intelligence: The Four Worlds. Stamford: Gartner Research.
Huber, G. P. (1990). A Theory of the Effects of Advanced Information Technologies on Organizational Design, Intelligence, and Decision Making. The Academy of Management Review, 47-71.
Huck, W. S. (2008). Reading Statistics and Research. Boston: Pearson Education.
Isik, O. (2009). Business Intelligence Success: An Empirical Evaluation of the Role of BI Capabilities and Organization's Decision Environment. Americas Conference on Information Systems, 1-3.
Ives, B., and Olson, M. H. (1984). User Involvement and MIS Success: A review of Research. Management Science, 586-603.
James, T. H. (2001). Business Intelligence - Why? eAI Journal, 47-49.
Jones, M. C., and Beatty, R. C. (2001). User satisfaction with EDI: an empirical investigation. Information Resources Management Journal, 14(2), 17.
Jones, M. C., Zmud, R. W., and Clark Jr, T. D. (2008). ERP in Practice: A Snapshot of Post_installation Perception and Behaviors. Communications of the Association for Information Systems, 23(1), 437-462.
Juran, J. M. (1989). Juran on Leadership for Quality. New York: Simon and Schuster.
Kaiser, H. F. (1960). The Application of Electronic Computers to Factor Analysis. Educational and Psychological Measurement, 20, 141-151.
Kanuk, L., and Berenson, C. (1975). Mail Survey and Response Rates: A Literature Review. Journal of Marketing Research, 12, 440-453.
99
Karahana, E., Straub, D. W., and Chervany, N. L. (1999). Information Technology Adoption Across Time: A Cross-sectional Comparion of Pre-adoption and Post-adoption Beliefs. MIS Quarterly, 23(2), 183-213.
Kebede, G. (2010). Knowledge management: An Information Science Perspective. International Journal of Information Management, 416-424.
Kerlinger, F. N., and Lee, H. B. (2000). Foundations of Behavioral Research (4th ed.). New York: Thomson Learning.
Kline, R. B. (1997). Principles and Practice of Structural Equation Modeling. New York: Guilford Press.
Law, E., Vermeeren, A., Hassenzahl, M., and Blythe, M. (2007). Towards a UX Manisfesto. COST294-MAUSE affiliated workshop, 1-83.
Lewis, A., Abramson, D., and Simpson, R. (1997). Parallel non-linear optimization: towards the design of a decision support system for air quality management. Proceedings of the 1997 ACM/IEEE conference on Supercomputing, 12.
Liberatore, M. J., and Pollack-Johnson, B. (2009). Quality, Time, and Cost Tradeoffs in Project Management Decision Making. PICMET 2009 Proceedings (pp. 1323-1329). Portland: PICMET.
Madapusi , A. (2008). ERP Information Quality and Information Presentation Effects on Decision Making. Industrial Management Data Systems(940), 628-633.
March, S. T., and Hevner, A. R. (2007). Integrated Decision Support Systems: A Data Warehousing Perspective. Decision Support Systems, 1031-1043.
Marshall, L., and de la Harpe, R. (2009). Decision making in the Context of Business Intelligence and Data Quality. South African Journal of Information Management, 1-15.
McDonald, G. C. (2009). Ridge regression. Wiley Interdisciplinary Reviews: Computational Statistics, 1(1), 93-100.
Miller, D. (2008, December 3). Six Sigma Business Intelligence: Why Measure BI Quality? Retrieved February 10, 2011, from www.itbusinessedge.com: http://www.itbusinessedge.com/cm/community/features/guestopinions/blog/six-sigma-business-intelligence-why-measure-bi-quality/?cs=23185
Miller, D. (2009, Janury 20). Six Sigma Business Intelligence: Defining BI Quality. Retrieved February 10, 2011, from www.itbusinessedge.com: http://www.itbusinessedge.com/cm/community/features/guestopinions/blog/six-sigma-business-intelligence-defining-bi-quality/?cs=23236
100
Morris, J. D. (2012, May 15). sta_7114_labs.htm. Retrieved May 15, 2012, from Florida Atlantic University College of Education: http://www.coe.fau.edu/faculty/morris/STA7114%20Files/Lab%203/Instructions/ridge_regression.htm#The%20Multicolinearity%20Situation
Moss, L. T., and Atre, S. (2003). Business Intelligence roadmap: the complete project lifecycle for decision-support applications. Boston: Addison-Wesley Professional.
Mullen, B., Anthony, T., Salas, E., and Driskell, J. E. (1994). Group Cohesiveness and Quality of Decision Making: An Integration of Test of the Groupthink Hypothesis. Small group research, 189-204.
Nau, D. S. (1983). Decision Quality as a Function of Search Depth on game Trees. Journal of Association for Computing Machinery, 687-708.
Negash, S., and Gray, P. (2008). Business Intelligence. Hanbook of Decicion Support Systems 2, 175-193.
Nelson, G. S. (2010). Business Intelligence 2.0: Are we there yet? SAS Global Forum, Paper 040.
Nelson, R. R., Todd, P. A., and Wixom, B. H. (2005). Antecedents of Information and System Quality: An Empirical Examination Within the Context of data Warehousing. Journal of Management Information Systems, 199-235.
Nunnally, J. C., and Bernstein, I. H. (1994). Psychometric Theory. New York: McGraw-Hill.
Ocampo, M. A. (2007). Overcoming the Barriers of Business Intelligence. Hopkinton - Massachusetts: EMC Corporation.
Orlikowsky, W. J., and Iacono, S. C. (2001). Desperately Seeking the "IT" in IT Research: A Call to Theorizing the IT Artifact. Information Systems Research, 121-134.
Parasuraman, A., Zeithaml, V. A., and Berry, L. L. (1988). SERVQUAL: Multiple-Item Scale for measuring Consumer Perceptions of Service Quality. Journal of Retailing, 12-40.
Power, D. (2010, 02 7). A Brief History of Decision Support Systems. Retrieved from DSSResources.COM: http://DSSResources.COM/history/dsshistory.html
Priem, R. L., Harrison, D. A., and Muir, N. K. (1995). Structured Conflict and Consensus Outcomes in Group Decisions Making. Journal of Management, 21(4), 691-710.
Quinn, K. R. (2007, June 14). Worst Practices in Business Intelligence - White Paper. Information Builders, pp. 1-19.
101

Raghunathan, S. (1999). Impact of information quality and decision-maker quality on decision quality: a theoretical model and simulation analysis. Decision Support Systems, 275-286.
Raghunathan, S. (1999). Impact of information quality and decision-maker quality on decision quality: a theoretical model and simulation analysis. Decision Support Systems, 275-286.
Raghunathan, S. (1999). Impact of Information Quality and Decision-Maker Quality on Decision Quality: A Theoretical Model and Simulation Analysis. Decision Support Systems, 26(4), 275-286.
Rausch, E. (2007). The critical need for coverage of quality decision making in professional and management education. Journal of Enterprise Information Management, 9-13.
Redman, T. C. (1998). The impact of poor data qualityon the typical enterprise. Communications of the ACM, 79-82.
Rouibach, K., and Ould-ali, S. (2002). Puzzle: A Concept and Prototype for Linking Business Intelligence to Business Strategy. Journal of Strategic Information Systems, 133-152.
Ryan, S. D., Harrison, D. W., and Schkade, L. L. (2002). Information-Technology Investment Decisions: When Do Costs and Benefits in the Social SubsystemMatter? Journal of Management Information Systems, 19(2), 85-127.
Scott, J., Globe, A., and Schiffer, K. (2004). Jungles and Gardens: The Evolution of Knowledge Management at J.D.Edwards. MIS Quarterly Executive, 37-52.
Sculpher, M., Fenwick, E., and Claxton, K. (2000). Assessing Quality in Decision Analytic Cost_effectiveness Models. Pharmacoeconomics, 461-477.
Shankaranarayan, G., Ziad, M., and Wang, R. Y. (2003). Managing Data Quality in Dynamic Environments: An Information Product Approach. Journal of Database Management, 14-32.
Shim, J. P., Warkentin, M., Courney, J. F., Power, D. J., Sharda, R., and Carlsson, C. (2002). Past, present, and future of decision support technology. Decision Support Systems, 111 –126.
Simon, H. A. (1960). The new Science of Management. New York: Harper and Row.
Simon, H. A. (1979). Rational Decision Making in Business Organizations. The American Economic Review, 493-513.
Simons, P. (2008). Business Intelligence. Financial Management, 44-47.
102

Strong, D. M., Lee, Y. W., and Wang, R. Y. (1997). 10 Potholes in the Road to Information Quality. IEEE Computer, 38-46.
Todd, P., and Benbasat, I. (1992). The Use of Information in Decision Making: An Experimental Investigation of the Impact of Computer-Based Decision Aids. MIS Quarterly, 373-393.
Turban, E., Sharda, R., Aroson, J. E., and King, D. (2008). Business Intelligence: A Managerial Approach. New Jersey: Pearson Education.
Usher, M., Russo, Z., Weyers, M., Brauner, R., and Zakay, D. (2011). The Impact of the Mode of Thought in Complex Decisions: Intuitive Decisions are Better. Frontiers in Psychology, 2(37), 1-13.
Vakkari, P. (2001). Integrating Studies on Information Seeking and Retrieval. Information Processing and Management, 35(6), 819-837.
Venkatesh, V., Morris, M., Davis, G., and Davis, F. (2003). User acceptance of information technology: Toward a unified view. MIS Quarterly, 425-478.
Vesset, D. (2009, June 5). Worldwide Business Intelligence Tools 2009 Vendor Shares. Retrieved February 7, 2011, from www.sas.com: http://www.sas.com/news/analysts/IDC-BITools09VendorShares.pdf
Vesset, D., and McDonough, B. (2007, August 12). Worldwide Business Intelligence Tools 2006 Vendor Share. Retrieved February 7, 2010, from www.enterprise-dashboard.com: http://www.enterprise-dashboard.com/2007/09/06/top-5-business-intelligence-tool-vendors-2007/
Wade, M., and Hulland, J. (2004). Review: The Resource-Based View and Information Systems Research: Review, Extension, and Suggestions for Future Research. MIS Quarterly, 107-142.
Wang, R. Y., and Strong, D. M. (1996). Beyond Accuracy: What Data Quality Means to Data Consumers. Journal of Management Information Systems, 5-34.
Wang, R. Y., Storey, V. C., and Firth, C. P. (1995). A Framework for Analysis of data Quality Research. IEEE Transactions on Knowledge and Data Engineering, 623-640.
Watson, H. J., and Wixom, B. H. (2007). The Current State of Business Intelligence. IT Systems Perspectives, 96-99.
Williams, S., and Williams, N. (2007). The Profit Impact of Business Intelligence. San Francisco: Morgan Kaufman Publishers.
Wixom, B. H., and Todd, P. A. (2005). A theoretical Integration of User Satisfaction and Technology Acceptance. Information Systems Research, 85-102.
103
Wixom, B. H., Watson, H. J., Reynolds, A. M., and Hoffer, J. A. (2008). Continental Airlines Continues to Soar with Business Intelligence. Information Systems Management, 2-18.
Yeoh, W., and Koronios, A. (2010). Critical Success Factors for Business Intelligence Systems. Journal of Computer Information Systems, 23-32.
Zmud, R. W. (1979). Individual differences and MIS success: A Review of the Empirical Literature. Mangement Science, 966-979.
104