The Indoor Environment in Green and Non-green Homes Kanistha Chatterjee University of Cincinnati May...
23
The Indoor Environment in Green and Non-green Homes Kanistha Chatterjee University of Cincinnati May 29, 2014
-
Upload
ashlee-daw -
Category
Documents
-
view
215 -
download
2
Transcript of The Indoor Environment in Green and Non-green Homes Kanistha Chatterjee University of Cincinnati May...
The Indoor Environment in Green and Non-green Homes
Kanistha Chatterjee
University of Cincinnati
May 29, 2014

Presentation Outline
• Background and Motivation− Cincinnati Green Housing Study
• Experimental Design− Sampling Methodology− Sample Analysis
• Preliminary Results

Background
• Villages at Roll Hill has undergone a $36M rehabilitation (Wallick Companies).
− Department of Housing and Urban Development− City of Cincinnati− Fay Limited Partnership
• Largest green renovation of an affordable housing community in the nation to-date
− Developers are seeking Silver LEED certification

Green Building Renovations
• Window and door replacement (energy efficient)• New roofing and whole house insulation• New low volatile organic compound (VOC) carpets, tile,
cabinets, countertops, and paint• Energy efficient central heating/cooling systems• New bathroom exhaust fan• Integrated pest management plan• New low flow toilets• New energy efficient lighting and bulbs• Designated parking for low emission vehicles

Motivation
• Exposures and conditions in the home that are known or thought to exacerbate respiratory conditions:
– Moisture– Poor heating and ventilation– Environmental tobacco smoke– Carpeting– Pet allergens– Mouse allergens
• Explore the potential of promoting healthy homes principles
− Target one of the most sensitive populations: low-income children with asthma.
– Dust mites– Cockroach allergens– Microbial contamination– Pesticides– Nitrogen dioxide (NO)– Combinations of the above

Experimental Design
51 units in low-income housing complexes*** all with an asthmatic child (ages 7-12) ***
25 control homes 26 green homes
• Environmental Measurements– Temperature– Relative humidity
– Particulate matter (PM2.5)
– Volatile organic compounds (VOCs)– Air exchange rate (AER)– Pesticides– Allergens– Fungi (ergosterol, ERMI, Illumina)– Bacteria (454 Pyrosequencing)
• Health-related Measurements– Blood– Urine– Lung Function Test– Exhaled Nitric Oxide– Respiratory Symptoms– Cold/Flu Assessment

Experimental Design
Rehabilitation
6 mo. 12 mo.Baseline T=0 mo.
Green Homes
Control Homes

Increased Microbial
Growth with Higher RH
Integrated Pest Management
Low VOC Materials
Insulation
Ventilation
Decreased Pests
Decreased Indoor Chemicals
Less Respiratory Tract
Inflammation
Decrease Asthma
Morbidity
Green Housing Guidelines Hypothesized Outcomes
Increased Microbial Diversity
Working Hypotheses

Specific Aims
1. Assess indoor environmental quality (IEQ) of green buildings by measuring the temperature, relative humidity, air exchange rates (AER), and the concentrations of volatile organic compounds (VOCs), ergosterol, PM 2.5, pesticides and allergens.
The main research questions behind this aim are: i) What impact do these renovation strategies have on the indoor air quality of green-renovated homes?ii) Is there any difference in the indoor air quality of green-renovated vs. non-green homes?

Specific Aims
2. Determine the difference in the fungal richness and diversity of dust collected from green-renovated and non-renovated (control) homes, using Environmental Relative Moldiness Index (ERMI), 454 Pyrosequencing and Illumina MiSeq.
The main goals behind this aim are: i) To determine the difference in moldiness and fungal diversity of dust collected from green and non-green homes, using pyrosequencing.
ii) Compare fungal diversity in environmental samples collected from living room floor, child’s bed and air.

Specific Aim 1 (IEQ)

Hulin et al. Respiratory health and indoor air pollutants based on quantitative exposure assessments. Eur Respir J. 2012;40:1033-1045.
• Indoor air pollution is a complex mixture– Penetration of outdoor air– Indoor pollutants
• Combustion products (Carbon Monoxide (CO), Carbon Dioxide (CO2), Polycyclic Aromatic Hydrocarbons (PAHs))
• Bioaerosols, allergens, molds, endotoxin
Source of Indoor Air Pollutants

Indoor Air Pollutants and Health Effects
Hulin et al. Respiratory health and indoor air pollutants based on quantitative exposure assessments. Eur Respir J. 2012;40:1033-1045.

Environmental Measurements• Dust sampling
– Allergens (dust mite, cockroach, cat, mouse)– Fungi (ERMI, Illumina)– Bacteria (454 Pyrosequencing)– Pesticides– Ergosterol
• VOCs– Passive diffusion dosimeters
• Temperature and relative humidity– HOBO® continuous data logger
• Air exchange rate– Perfluorinated methylcyclohexane (PMCH)
• Particulate matter– PM2.5 mass concentration– Black carbon mass concentration– Particle number concentration
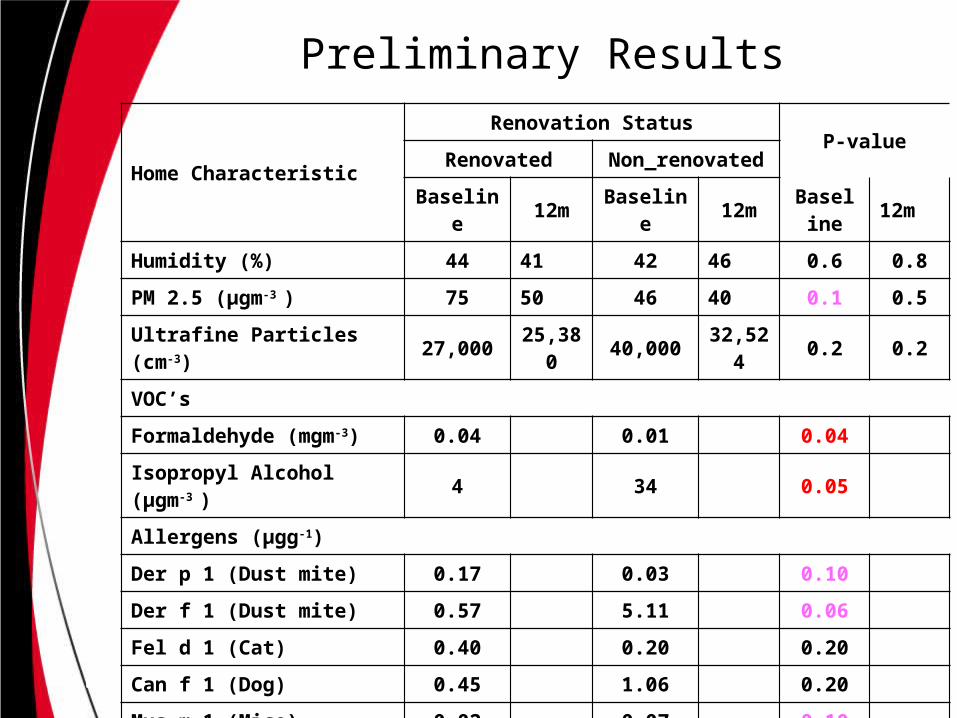
Preliminary Results
Home Characteristic
Renovation StatusP-value
Renovated Non_renovatedBaselin
e 12mBaseline 12m Baseline 12m
Humidity (%) 44 41 42 46 0.6 0.8
PM 2.5 (μgm-3 ) 75 50 46 40 0.1 0.5
Ultrafine Particles (cm-3) 27,000 25,380 40,000 32,524 0.2 0.2
VOC’s
Formaldehyde (mgm-3) 0.04 0.01 0.04
Isopropyl Alcohol (μgm-3 ) 4 34 0.05
Allergens (μgg-1)
Der p 1 (Dust mite) 0.17 0.03 0.10
Der f 1 (Dust mite) 0.57 5.11 0.06
Fel d 1 (Cat) 0.40 0.20 0.20
Can f 1 (Dog) 0.45 1.06 0.20
Mus m 1 (Mice) 0.02 0.07 0.10
Bla g 2 (Cockroach) 0.20 0.70 0.06

Specific Aim 2 (ERMI)

Floor Dust Sampling
1 m
1 m
1 m
1 m
2 m2 at a rate of 2 min/m2

Floor Dust Sampling
Total surface at a rate of 1 min/m2
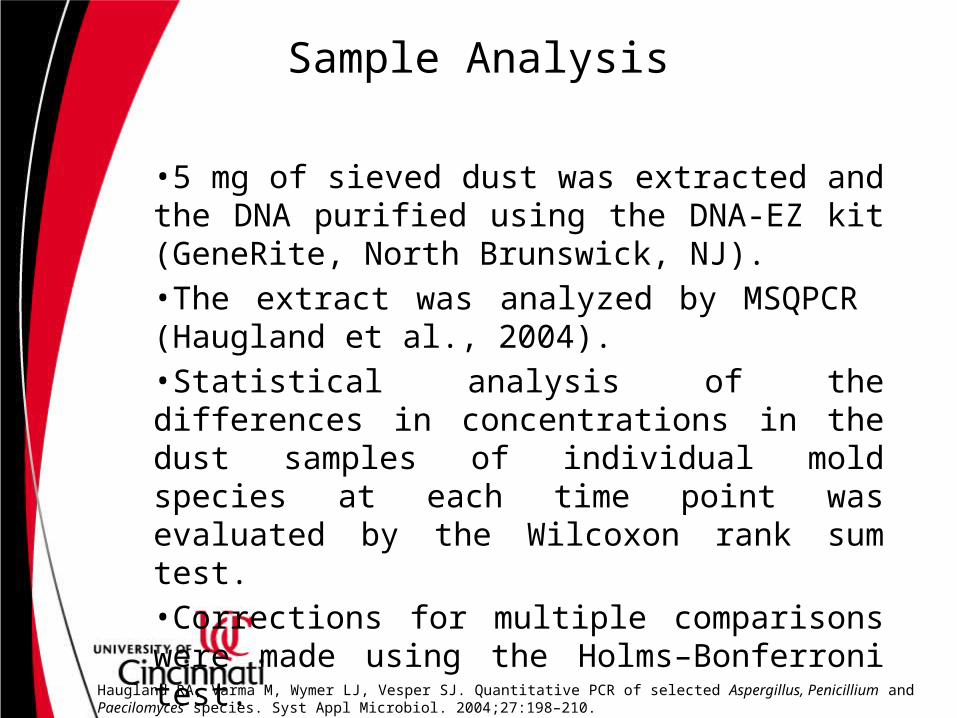
Sample Analysis
•5 mg of sieved dust was extracted and the DNA purified using the DNA-EZ kit (GeneRite, North Brunswick, NJ).•The extract was analyzed by MSQPCR (Haugland et al., 2004). •Statistical analysis of the differences in concentrations in the dust samples of individual mold species at each time point was evaluated by the Wilcoxon rank sum test. •Corrections for multiple comparisons were made using the Holms–Bonferroni test.
Haugland RA, Varma M, Wymer LJ, Vesper SJ. Quantitative PCR of selected Aspergillus, Penicillium and Paecilomyces species. Syst Appl Microbiol. 2004;27:198–210.

ERMI Patterns over 12 Months
Pre 0 6 12
-2.00
-1.00
0.00
1.00
2.00
3.00
4.00
5.00
6.00
7.00
8.00
RenovatedNon-RenovatedE
RM
I *
*

Conclusions
• The baseline data immediately after renovation shows conflicting trends between green-renovated and standard-renovated apartment homes for different indoor pollutants.

Acknowledgments
• Department of Environmental Health (UC)– Tiina Reponen, PhD– Sergey Grinshpun, PhD– Patrick Ryan, PhD– Eric Kettleson, PhD– Reshmi Indugula– Christopher Schaffer
• National Center for Environmental Health, CDC– Ginger Chew, ScD– Mary Jean Brown, ScD RN
• Environmental Protection Agency– Stephen Vesper, PhD
• U.S. Department of Housing and Urban Development– Peter Ashley, DrPH

Funding
• U.S. Department of Housing and Urban Development• CDC Green Housing Study (5UO1EH000990) • US EPA