The IMTC Project Partners Project Elements
65
IMTC Border Freight Operations Study Compilation of Products Whatcom Council of Governments November 2017 The IMTC The International Mobility & Trade Corridor Program (IMTC), led by the Whatcom Council of Governments (WCOG), is a U.S.-Canadian coalition of government and business entities that identifies and promotes improvements to mobility and security for the four border crossings that connect Whatcom County, Washington State and the Lower Mainland of British Columbia. Together, these four crossings are called the Cascade Gateway. Project Partners In 2015 WCOG received research funding from the U.S. Federal Highway Administration (FHWA) and match funding from the B.C. Ministry of Transportation and Infrastructure (BC MoTI), Transport Canada (TC), and the Border Policy Research Institute (BPRI) at Western Washington University (WWU) to complete the IMTC Border Freight Operations Study (BFO) data collection and analysis of international freight movements in the Cascade Gateway. The estimated project cost was $150,000. Though not funding partners for the study, U.S. Customs and Border Protection (US CBP) and Canada Border Services Agency (CBSA) contributed invaluable staff hours to help plan the study and facilitate field work at each Cascade Gateway port-of-entry (POE). Project Elements The original BFO scope of work included: planning and implementing a field data collection effort at the three main commercial POEs in the Cascade Gateway; conducting a regional cross-border carrier firm survey; availing a database of BFO field data to partner agencies. The scope of work was extended in 2017 to include further analyses on origin-destination patterns, time-and-motion patterns, and changing commercial vehicle routing through the Cascade Gateway. At the request of partner agencies, WCOG also provided more detailed analyses on dangerous goods movements and the effects of ending cash payments of inspection user-fees at U.S. POEs in the Cascade Gateway. This compilation includes the following BFO documents: D1. IMTC Border Freight Operations Data Collection Report ................................................................[Page 2] D2. Technical Memo: Dangerous Goods Movement through the Cascade Gateway ........................[Page 31] D3. Technical Memo: Commercial Inspection Analysis: Ending Cash Collections at U.S. CBP Ports-of- Entry ...............................................................................................................................................................[Page 41] D4. Cascade Gateway Commercial Carrier Interviews ..........................................................................[Page 49] D5. Pacific Highway Commercial Vehicle Arrival Time Trends ..........................................................[Page 54] D6. Lynden-Aldergrove Commercial Vehicle Routing Analysis ..........................................................[Page 57] Appendix A1. Cascade Gateway Carrier Questionnaire............................................................................................[Page 61]
Transcript of The IMTC Project Partners Project Elements

IMTC Border Freight Operations Study Compilation of Products Whatcom Council of Governments November 2017
The IMTC The International Mobility & Trade Corridor Program (IMTC), led by the Whatcom Council of Governments (WCOG), is a U.S.-Canadian coalition of government and business entities that identifies and promotes improvements to mobility and security for the four border crossings that connect Whatcom County, Washington State and the Lower Mainland of British Columbia. Together, these four crossings are called the Cascade Gateway.
Project Partners In 2015 WCOG received research funding from the U.S. Federal Highway Administration (FHWA) and match funding from the B.C. Ministry of Transportation and Infrastructure (BC MoTI), Transport Canada (TC), and the Border Policy Research Institute (BPRI) at Western Washington University (WWU) to complete the IMTC Border Freight Operations Study (BFO) data collection and analysis of international freight movements in the Cascade Gateway. The estimated project cost was $150,000. Though not funding partners for the study, U.S. Customs and Border Protection (US CBP) and Canada Border Services Agency (CBSA) contributed invaluable staff hours to help plan the study and facilitate field work at each Cascade Gateway port-of-entry (POE).
Project Elements The original BFO scope of work included: planning and implementing a field data collection effort at the three main commercial POEs in the Cascade Gateway; conducting a regional cross-border carrier firm survey; availing a database of BFO field data to partner agencies. The scope of work was extended in 2017 to include further analyses on origin-destination patterns, time-and-motion patterns, and changing commercial vehicle routing through the Cascade Gateway. At the request of partner agencies, WCOG also provided more detailed analyses on dangerous goods movements and the effects of ending cash payments of inspection user-fees at U.S. POEs in the Cascade Gateway. This compilation includes the following BFO documents:
D1. IMTC Border Freight Operations Data Collection Report ................................................................[Page 2] D2. Technical Memo: Dangerous Goods Movement through the Cascade Gateway ........................[Page 31] D3. Technical Memo: Commercial Inspection Analysis: Ending Cash Collections at U.S. CBP Ports-of-Entry ...............................................................................................................................................................[Page 41] D4. Cascade Gateway Commercial Carrier Interviews ..........................................................................[Page 49] D5. Pacific Highway Commercial Vehicle Arrival Time Trends ..........................................................[Page 54] D6. Lynden-Aldergrove Commercial Vehicle Routing Analysis ..........................................................[Page 57]
Appendix A1. Cascade Gateway Carrier Questionnaire............................................................................................[Page 61]

IMTC INTERNATIONAL MOBILITY & TRADE CORRIDOR PROGRAM
2015/16 IMTC Border Freight Operations Study Data Collection Report
February 2017
[Page 2]
2015/16 IMTC Border Freight Operations Study Data Collection Report
Prepared by the Whatcom Council of Governments for the IMTC Program [ 2 ]
This page is intentionally blank.
[Page 3]

2015/16 IMTC Border Freight Operations Study Data Collection Report
Prepared by the Whatcom Council of Governments for the IMTC Program [ 3 ]
TABLE OF CONTENTS TABLE OF CONTENTS ................................................................................................................................ 3 INTRODUCTION .......................................................................................................................................... 5 THE INTERNATIONAL MOBILITY AND TRADE CORRIDOR PROGRAM ................................................. 5 COMPONENTS OF THE BORDER FREIGHT OPERATIONS STUDY ....................................................... 5
Field Data Collection ................................................................................................................................. 6 Carrier Company Interviews ...................................................................................................................... 6
Dangerous Goods ..................................................................................................................................... 6 PAST COMMERCIAL VEHICLE STUDIES .................................................................................................. 7 GEOGRAPHY ............................................................................................................................................... 8 FUNDING ...................................................................................................................................................... 8 PROJECT MEMBERS .................................................................................................................................. 9 DATA COLLECTION SCHEDULE ................................................................................................................ 9 DATA COLLECTION METHODOLOGY ....................................................................................................... 9
2016 Data Collection ................................................................................................................................. 9 Pacific Highway Crew Positions and Data Fields ................................................................................ 11 Lynden-Aldergrove and Sumas-Abbotsford/Huntingdon Crew Positions and Data Fields ................. 12
2015 Data Collection ............................................................................................................................... 13 RECORDS COLLECTED ............................................................................................................................ 13
2016 Data Collection Records ............................................................................................................. 13
2015 Data Collection Records ............................................................................................................. 13 CASCADE GATEWAY FREIGHT TRAFFIC ............................................................................................... 14
Commercial Vehicle Volume by Port and Direction, 1995-2016 ......................................................... 14 FAST LANE USAGE ................................................................................................................................... 15
Pacific Highway Share of Lane Type Usage (June) ............................................................................ 15 VEHICLE CLASSIFICATION ...................................................................................................................... 16
Pacific Highway (June 2016) ............................................................................................................... 16 Lynden-Aldergrove (July 2016) ............................................................................................................ 16 Sumas-Abbotsford/Huntingdon (July 2016) ......................................................................................... 17
WAIT TIMES - STANDARD LANES ........................................................................................................... 17 Wait Times (minutes) by Port and Direction, Standard lanes (June/July 2016) .................................. 17 Wait Time Distribution by Direction, All Ports and Standard lanes (June/July 2016) .......................... 18
Wait Time Profiles ................................................................................................................................... 18
Standard Lane Wait-Times during Survey Periods (2016) .................................................................. 19 Pacific Highway Standard Wait-Time Observation Comparison (2016 & 2012) ................................. 19
[Page 4]

2015/16 IMTC Border Freight Operations Study Data Collection Report
Prepared by the Whatcom Council of Governments for the IMTC Program [ 4 ]
WAIT TIMES VS QUEUE LENGTHS ......................................................................................................... 20 Pacific Highway (June 2016) ............................................................................................................... 21 Lynden-Aldergrove (July 2016) ............................................................................................................ 21 Sumas-Abbotsford/Huntingdon (July 2016) ......................................................................................... 22
WAIT TIMES - FAST LANES ...................................................................................................................... 22 Wait Time Distribution by Direction, Pacific Highway FAST lanes (June 2016) .................................. 22
INSPECTION TIMES .................................................................................................................................. 23
Inspection Time Distribution by Direction, All Ports and Standard lanes (2016) ................................. 23 ORIGINS AND DESTINATIONS ................................................................................................................. 24
Origin-Destination Pairs by Port .............................................................................................................. 24 Pacific Highway .................................................................................................................................... 25 Lynden-Aldergrove ............................................................................................................................... 26 Sumas-Abbotsford/Huntingdon ............................................................................................................ 27
COMMODITIES .......................................................................................................................................... 28 Commerical Vehicle Movements by Primary Commodity Reported (June 2016) ............................... 28
CARRIER TRENDS .................................................................................................................................... 29 Carrier Companies Comprising 50 percent of Crossing Instances (June 2016) ................................. 29
FOR MORE INFORMATION ....................................................................................................................... 29
[Page 5]

2015/16 IMTC Border Freight Operations Study Data Collection Report
Prepared by the Whatcom Council of Governments for the IMTC Program [ 5 ]
INTRODUCTION The 2015/16 IMTC Border Freight Operations [BFO] study is a binationally coordinated data collection effort to assess the current state of commercial vehicle and goods movement through the Cascade Gateway – five land-border ports-of-entry connecting Western Washington State and Lower Mainland British Columbia. The primary data collection was performed in the summer seasons of 2015 and 2016. This report details the organization of the project and high level analysis of the collected data. Along with this report, a project database is the primary product of the effort and provides for ongoing near-term analyses. Other products from this study include a technical memo outlining field observations of the movement of dangerous goods and an industry-perspective report summarizing important border-related topics discussed in interviews with commercial carrier companies in the Cascade Gateway.
THE INTERNATIONAL MOBILITY AND TRADE CORRIDOR PROGRAM The International Mobility and Trade Corridor Program [IMTC] is a voluntary, binational, regional coalition of government, business interests, and non-governmental entities established to support the improvement of safety, mobility, and security for the Cascade Gateway. The goals of the IMTC are to:
G1. Coordinate planning
G2. Improve regional, cross-border trade and transportation data
G3. Support infrastructure improvements
G4. Support coordinated implementation of U.S. and Canadian border policy
G5. Improve operations
Since 1997, IMTC participants on both sides of the border have together funded projects totaling nearly $40 million (USD) for Cascade Gateway initiatives.
The IMTC is administered by the Whatcom Council of Governments [WCOG], northwest Washington’s border-area metropolitan planning organization [MPO] located in Bellingham, Washington.
IMTC border master planning peer exchange - June 8, 2016
COMPONENTS OF THE BORDER FREIGHT OPERATIONS STUDY The project was co-managed by WCOG and the Border Policy Research Institute [BPRI] at Western Washington University [WWU]. Additionally, U.S. Customs and Border Protection [U.S. CBP] and Canada Border Services Agency [CBSA] were involved in the planning and execution of the data collection efforts.
[Page 6]

2015/16 IMTC Border Freight Operations Study Data Collection Report
Prepared by the Whatcom Council of Governments for the IMTC Program [ 6 ]
Field Data Collection In June and July of 2016, a field crew of eight undergraduate research assistants from WWU observed freight movements at three Cascade Gateway commercial border crossings: Pacific Highway, Lynden-Aldergrove, and Sumas-Abbotsford/Huntingdon. At each crossing, crewmembers used touch-screen tablets to collect data at various locations throughout the border arrival and queuing process, such as at end of the standard and FAST-lane queues, adjacent to primary inspection booths, and in primary inspection booths at U.S. CBP facilities.
Crewmembers recorded the time of arrival of commercial vehicles at border queue-end, the time of arrival and departure at primary inspection booths, vehicle types, carrier company information, dangerous goods placard information, commodity information, the origins and destinations of vehicles, and other data points. These data enabled the computation of queue wait and inspection times, determination of origin-destinations flows, categorization of commodities, and many other follow-on analyses.
Due to project funding sources, the July 2015 data collection was a limited scope, preliminary effort. A crew of two WWU students observed freight movements at the Pacific Highway and northbound Abbotsford/Huntingdon commercial crossings1. Data collection fields included FAST lane versus standard lane usage, vehicle types, carrier company information, and dangerous goods placard numbers. Because the 2015 data were collected in the same time of year and only one year prior to the 2016 data, the two datasets are combined for certain analyses.
Carrier Company Interviews Carrier company information and observed cross-border frequency of carriers supported an additional BFO scope of work: a set of carrier company interviews aimed at gathering direct industry perspectives on border related issues and regional freight strategies. Management of carrier companies observed crossing through the Cascade Gateway most frequently were contacted and interviewed by WCOG staff following the 2015 data collection effort.
Dangerous Goods An in-depth analysis of the movement of dangerous goods has been compiled as a supporting technical memo to this report. Field crewmembers noted any dangerous goods placards on commercial vehicle loads, recording the associated hazard classification and U.N. numbers. These data, combined with origin-destination analyses, support better visualization of the truck-borne circulation of dangerous goods through the Cascade Gateway.
1 Due to the Aldergrove commercial facility being under construction during the 2015 field work, Lynden-Aldergrove was not visited until the 2016 portion of the project.
[Page 7]

2015/16 IMTC Border Freight Operations Study Data Collection Report
Prepared by the Whatcom Council of Governments for the IMTC Program [ 7 ]
PAST COMMERCIAL VEHICLE STUDIES The IMTC has looked to refresh data on the movement of commercial vehicles in the Cascade Gateway about every five years since 2000. Similar commercial vehicle operations studies [CVOs] were conducted in 2000 and 2009. Improvements made to infrastructure and operations in the border environment after a preceding survey were also assessed.
Since the 2009 CVO study, a number of improvements have been made to the Cascade Gateway commercial crossings, the connecting transportation network, and to technology in general. These, among of other improvements, include:
• A new automated commercial vehicle staging area at Pacific Highway southbound • The rerouting of the commercial approach at Pacific Highway northbound • The adoption of paperless e-manifests • Improvements to State Route 539 leading to the CBSA Aldergrove commercial facility • A completely rebuilt CBSA commercial facility at Aldergrove
Project Manager Hugh Conroy managing data collection in 2009
[Page 8]

2015/16 IMTC Border Freight Operations Study Data Collection Report
Prepared by the Whatcom Council of Governments for the IMTC Program [ 8 ]
GEOGRAPHY The survey was conducted at three Cascade Gateway commercial ports-of-entry for both directions of traffic:
Pacific Highway (Interstate 5/State Route 543 & B.C. Highway 15)
Lynden-Aldergrove (State Route 539 & B.C. Highway 13)
Sumas-Abbotsford/Huntingdon (State Route 9 & B.C. Highway 11)
The Cascade Gateway ports-of-entry
FUNDING The 2015/16 BFO was funded 80 percent through a grant from the U.S. Federal Highway Administration [FHWA]. The required 20 percent match for the grant was provided by B.C Ministry of Transportation and Infrastructure [BC MoTI], Transport Canada, BPRI, and WCOG.
Though not funding partners for the project, U.S. CBP and CBSA contributed invaluable staff hours to help plan the project and facilitate the work of the field crew in and around the ports-of-entry.
[Page 9]

2015/16 IMTC Border Freight Operations Study Data Collection Report
Prepared by the Whatcom Council of Governments for the IMTC Program [ 9 ]
PROJECT MEMBERS • Field Research Assistants: 2 WWU students in 2015, 8 WWU students in 2016 • Field Supervisors: Danny Edgel (BPRI), Jaymes McClain (WCOG) • Project Managers: Jaymes McClain, Hugh Conroy (WCOG), Melissa Fanucci (WCOG), Laurie
Trautman (BPRI) • Inspection agency assistance – special thanks to: Ronald McMillan (U.S. CBP), Dan Bubas (CBSA),
Phillip Stanford (U.S. CBP), Bernie Pitura (CBSA), Jose Rene Ortega (U.S. CBP), Ryan Vanderstar (CBSA)
• Post-processing: Danny Edgel, Jaymes McClain
DATA COLLECTION SCHEDULE 2016
PORT-OF-ENTRY DIRECTION SURVEY DAYS TIME
Pacific Highway Southbound M-Th, June 20-23
8:00am – 11:30pm & 12:00pm – 3:00pm
Pacific Highway Northbound M-Th, June 27-30
Lynden-Aldergrove Northbound & Southbound T-F, July 5-8
Sumas-Abb./Hunt. Northbound & Southbound M-Th, July 11-14
2015 PORT-OF-ENTRY DIRECTION SURVEY DAYS TIME
Pacific Highway Southbound M-Th, July 6-9
8:00am - 4:00pm Pacific Highway Northbound M-Th, July 13-16
Abbotsford/Hunt. Southbound M-Th, July 20-23
DATA COLLECTION METHODOLOGY 2016 Data Collection For the 2016 field work, the field crew worked at three sequential positions at each port-of-entry. Each position recorded the license plate of the commercial vehicle that was being observed so that the different positions’ observations of the same vehicle could be linked together in the database. This allowed for border wait-time and queue length calculations as well as a more comprehensive profile for each commercial vehicle crossing the border.
The queue-end position monitored the arrival of commercial vehicles at the end of the border lineup. The crewmember timestamped the moment a vehicle stopped at queue end. At the Pacific Highway crossing, a position monitored the FAST lane queue separately from the standard queue.
Near the primary inspection booths, a crewmember recorded observable vehicle information. This included the license plate state or province of the vehicle, the type of vehicle (chosen from a predefined picklist), the name of the carrier company on the side of the tractor (when given), and the dangerous goods placard hazard classification and U.N. numbers (if present). For northbound surveying, the time of vehicle arrival at primary inspection and the time of inspection end were also recorded at this position.
Crewmembers were positioned in the primary inspection booth(s) during southbound data collection in order to record more detailed information about each commercial vehicle. With help from U.S. CBP
[Page 10]

2015/16 IMTC Border Freight Operations Study Data Collection Report
Prepared by the Whatcom Council of Governments for the IMTC Program [ 10 ]
officers, they recorded the empty/loaded status of the vehicle, the origin and destination of the vehicle’s current trip, the main commodity that was currently being hauled (or, if empty, the main commodity that was dropped off or was going to be picked up), whether the vehicle was providing a less-than-loaded [LTL] service, whether a cash transaction occurred between driver and inspector, and the time of vehicle arrival at primary inspection and the time of inspection end. For northbound, the “primary inspection” data fields were collected outside of the booths directly from drivers, either when they were waiting in queue (at Pacific Highway and Abbotsford/Huntingdon) or after they had left inspection (at Aldergrove). The “cash transaction” data point was not recorded (since this does not occur at CBSA commercial crossings) and the timestamps for inspection start and end were recorded from another position, as previously described.
At Pacific Highway, surveyors recorded trusted trader status of drivers, companies, and goods when able. This included whether or not the driver possessed a FAST card, if the carrier company was enrolled in the Customs-Trade Partnership Against Terrorism program [C-TPAT] or the Customs Self Assessment/Partners in Protection programs [CSA/PIP], and if the goods/importer were C-TPAT or CSA/PIP approved.
A field crewmember records the license plate of a truck
It should be noted that every survey day the crew took a break from 11:30 am to 12:00 pm. No data was collected during this break. Staggered crewmember breaks throughout the day would have created multiple instances of vehicles being missed as survey positions were temporarily understaffed and crewmembers swapped positions. With everyone taking a break in one half-hour increment, the data collected before and after the break are more reliable and only one clear gap in data collection exists versus a longer period of unknown data gaps.
[Page 11]

2015/16 IMTC Border Freight Operations Study Data Collection Report
Prepared by the Whatcom Council of Governments for the IMTC Program [ 11 ]
Pacific Highway Crew Positions and Data Fields
Northbound
Southbound
Standard Queue End • Time of queue-end arrival
FAST Lane Queue End • Time of queue-end arrival
Vehicle Information • License plate state/province • Vehicle classification • Carrier company name • Dangerous goods placard info • Time of inspection booth arrival • Time of primary inspection completion
Driver Interview • Empty/loaded cargo status • Origin of current trip • Destination of current trip • Main commodity (or, if empty, what was
dropped off or what will be picked up) • Less-than-truckload (LTL) status
Standard Queue End • Time of queue-end arrival
FAST Lane Queue End • Time of queue-end arrival
Vehicle Information • License plate state/province • Vehicle classification • Carrier company name • Dangerous goods placard info
Primary Inspection • Time of inspection booth arrival • Empty/loaded cargo status • Origin of current trip • Destination of current trip • Main commodity (or, if empty, what was
dropped off or what will be picked up) • Less-than-truckload (LTL) status • Cash transaction observation • Time of primary inspection completion
[Page 12]

2015/16 IMTC Border Freight Operations Study Data Collection Report
Prepared by the Whatcom Council of Governments for the IMTC Program [ 12 ]
Lynden-Aldergrove and Sumas-Abbotsford/Huntingdon Crew Positions and Data Fields
Northbound
Southbound
Queue End • Time of queue-end arrival
Vehicle Information • License plate state/province • Vehicle classification • Carrier company name • Dangerous goods placard info • Time of inspection booth arrival • Time of primary inspection completion
Driver Interview • Empty/loaded cargo status • Origin of current trip • Destination of current trip • Main commodity (or, if empty, what was
dropped off or what will be picked up) • Less-than-truckload (LTL) status
Queue End • Time of queue-end arrival
Vehicle Information • License plate state/province • Vehicle classification • Carrier company name • Dangerous goods placard info
Primary Inspection • Time of inspection booth arrival • Empty/loaded cargo status • Origin of current trip • Destination of current trip • Main commodity (or, if empty, what was
dropped off or what will be picked up) • Less-than-truckload (LTL) status • Cash transaction observation • Time of primary inspection completion
[Page 13]

2015/16 IMTC Border Freight Operations Study Data Collection Report
Prepared by the Whatcom Council of Governments for the IMTC Program [ 13 ]
2015 Data Collection As previously described, the 2015 data collection field outing was a smaller endeavor than its 2016 successor. Two field crewmembers collected data solely at one position at each crossing they visited (northbound and southbound Pacific Highway and northbound Abbotsford/Huntingdon). The crewmembers were located at the “vehicle information” positions shown in the previous port graphics. Because of the size of the crew, only readily observable information was captured. The 2015 data fields include:
• License Plate number • FAST lane vs standard lane usage • Vehicle classification • Dangerous goods placard information • Carrier company name • Carrier company location (if also written on vehicle) • Empty/loaded cargo status (if observable)
Though the crew was composed of only two research assistants, nearly 5,000 records were collected in the three weeks of field work.
RECORDS COLLECTED The following tables show the number of commercial vehicle profiles that were constructed from the three data collection positions. The 2016 field crew collected 5,577 total vehicle records in the four weeks of data collection. In the three-week effort in 2015, 4,953 records were collected.
The 2016 field crew collected only 11 percent more records than the preceding year’s crew despite being comprised of six more research assistants and spending one more week in the field. This is due to the organization of the two data collection efforts. In 2015, the field crew spent an hour longer each day in field than the following year, and each vehicle profile consisted of one data collection position’s record. The 2016 crew, though larger, was spread out to multiple positions, each position recording vehicles whose full border-crossing profile (from queue-end to end of inspection) was later linked together in the database to create the total number of records shown in the table.
2016 Data Collection Records PORT-OF-ENTRY SOUTHBOUND NORTHBOUND
Pacific Highway 1613 1661 3274 Lynden-Aldergrove 520 253 773 Sumas-Abbotsford/Huntingdon 874 656 1530
3007 2570 5577
2015 Data Collection Records PORT-OF-ENTRY SOUTHBOUND NORTHBOUND
Pacific Highway 1968 2092 4060 Abbotsford/Huntingdon - 893 893
1968 2985 4953
[Page 14]

2015/16 IMTC Border Freight Operations Study Data Collection Report
Prepared by the Whatcom Council of Governments for the IMTC Program [ 14 ]
CASCADE GATEWAY FREIGHT TRAFFIC Commercial traffic through the Cascade Gateway predominantly travels through the Pacific Highway ports-of-entry, which have processed 72 percent of the traffic over the past twenty years. In 2015 there were about 65,000 commercial vehicle crossings total through Pacific Highway per month, averaging 71 percent of the total per month traffic traveling through the three primary commercial crossings. At Lynden-Aldergrove there were about 4,800 recorded commercial vehicle crossings per month for 2015, accounting for over 5 percent of all Cascade Gateway traffic. At Sumas-Abbotsford/Huntingdon, the 22,000 monthly crossings in 2015 made up nearly 24 percent of all traffic. The graph below shows absolute volume breakouts by port and direction for Cascade Gateway commercial traffic over the past two decades.
Monthly Commercial Vehicle Volume by Port and Direction, 1995-2016
Sources: U.S. Bureau of Transportation Statistics and Statistics Canada
0
10
20
30
40
50
60
1995
1996
1997
1998
2000
2001
2002
2003
2005
2006
2007
2008
2010
2011
2012
2013
2015
Com
mer
cial V
ehicl
esTh
ousa
nds
Year
Pacific Highway SouthboundPacific Highway NorthboundLynden SouthboundAldergrove NorthboundSumas SouthboundAbbotsford/Huntingdon Northbound
[Page 15]

2015/16 IMTC Border Freight Operations Study Data Collection Report
Prepared by the Whatcom Council of Governments for the IMTC Program [ 15 ]
FAST LANE USAGE In the Cascade Gateway, FAST lanes are only located at the U.S. CBP and CBSA Pacific Highway commercial ports-of-entry. As part of the joint U.S.-Canada FAST program, compliant commercial vehicles can use the FAST approach lanes to bypass standard queue lanes, similar to the NEXUS program for passenger vehicles. To be compliant for the FAST programs, a driver must possess a FAST card (recognized by both countries) and the carrier company and goods or importer must be compliant with trusted traders program(s) administered by the country that the vehicle is entering.
There are two commercial approach lanes northbound at Pacific Highway – one for FAST compliant commercial traffic and one for standard traffic. As of 2016, the FAST lane leads to a dedicated FAST booth (one third of CBSA’s commercial inspection booths), although empty trucks are also allowed to use the FAST lane. Southbound, the FAST lane begins in the truck staging area just south of 2nd Ave off of B.C. Highway 15. FAST compliant traffic must wait with all other traffic north of 2nd Ave, however once in the staging area FAST vehicles are given priority from automated signals to enter the final approach lanes to the three U.S. CBP inspection booths.
Pacific Highway Share of Lane Type Usage (June)
A small portion of the southbound staging area infrastructure at Pacific Highway is dedicated for FAST traffic (one staging lane of twelve total lanes). During the June data collection, nearly a quarter of southbound commercial traffic was observed using the FAST lane – a higher rate than observed in earlier years. It should be noted, however, that there is little to no enforcement in the staging area, meaning it is hard to determine how many vehicles using the FAST lane are actually FAST program compliant.
The share of commercial traffic using the FAST lane northbound is about half of the southbound share, yet a greater share of the primary inspection infrastructure is currently dedicated for FAST.2
2 CBSA is working with WSDOT on implementing a FAST-first signal at the Pacific Highway northbound commercial port of entry in early 2017. This would open up all three primary inspection booths to all commercial vehicles, with priority given to FAST lane traffic.
88% 87%75% 76%
12% 13%25% 24%
2015 2016 2015 2016
Northbound Southbound
Standard FAST
[Page 16]
2015/16 IMTC Border Freight Operations Study Data Collection Report
Prepared by the Whatcom Council of Governments for the IMTC Program [ 16 ]
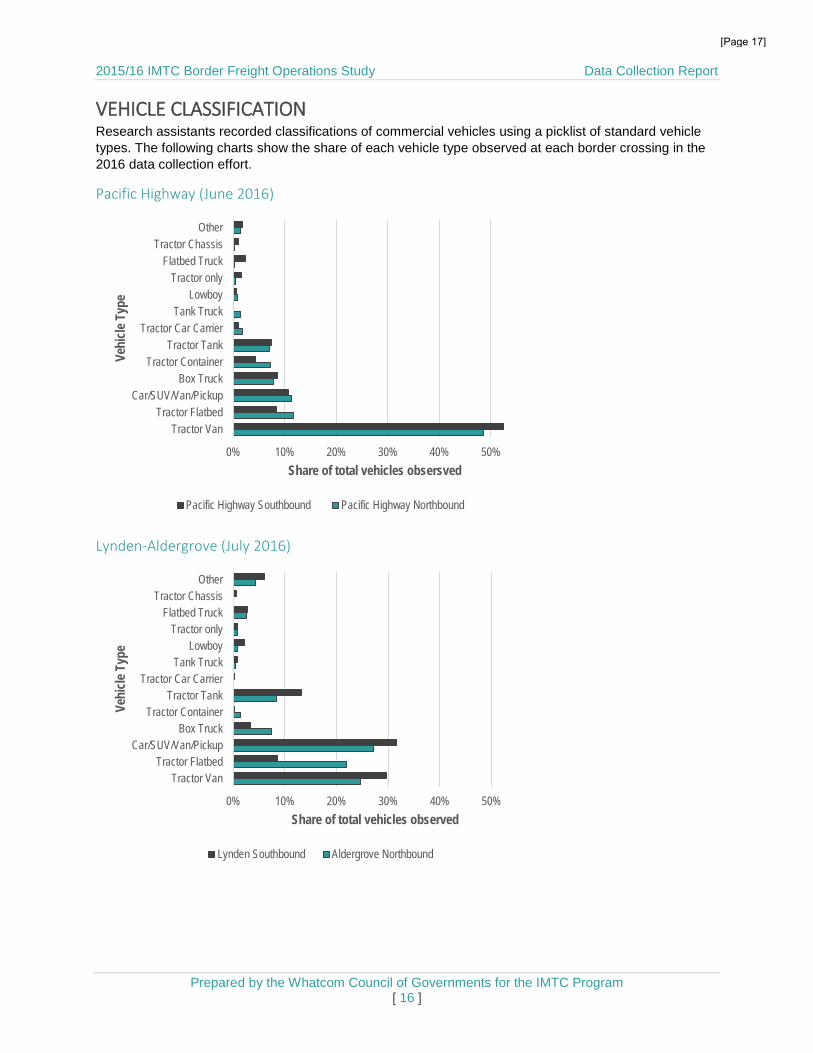
VEHICLE CLASSIFICATION Research assistants recorded classifications of commercial vehicles using a picklist of standard vehicle types. The following charts show the share of each vehicle type observed at each border crossing in the 2016 data collection effort.
Pacific Highway (June 2016)
Lynden-Aldergrove (July 2016)
0% 10% 20% 30% 40% 50%
Tractor VanTractor Flatbed
Car/SUV/Van/PickupBox Truck
Tractor ContainerTractor Tank
Tractor Car CarrierTank Truck
LowboyTractor only
Flatbed TruckTractor Chassis
Other
Share of total vehicles obsersved
Vehi
cle T
ype
Pacific Highway Southbound Pacific Highway Northbound
0% 10% 20% 30% 40% 50%
Tractor VanTractor Flatbed
Car/SUV/Van/PickupBox Truck
Tractor ContainerTractor Tank
Tractor Car CarrierTank Truck
LowboyTractor only
Flatbed TruckTractor Chassis
Other
Share of total vehicles observed
Vehi
cle T
ype
Lynden Southbound Aldergrove Northbound
[Page 17]

2015/16 IMTC Border Freight Operations Study Data Collection Report
Prepared by the Whatcom Council of Governments for the IMTC Program [ 17 ]
Sumas-Abbotsford/Huntingdon (July 2016)
WAIT TIMES - STANDARD LANES During the 2016 field work, as each commercial vehicle made its way through the border, research assistants recorded the time, or timestamped, when each vehicle initially stopped at the end of the border queue and when they stopped at a primary inspection booth. The two timestamps were used to calculate the border wait-time of a specific vehicle. The table below shows the average wait-time of commercial vehicles for each port and direction during the data collection window of about 8 am to 3 pm on weekdays. A median value is also presented, omitting any extreme outlying values.
Wait Times (minutes) by Port and Direction, Standard lanes (June/July 2016)
PACIFIC HIGHWAY
LYNDEN-ALDERGROVE SUMAS-ABB./HUNT. ALL PORTS
NB SB NB SB NB SB NB SB Average 8.1 22.5 0.8 10.4 5.3 10.5 6.5 15.8 Median 5.0 18.9 0.3 3.9 2.4 9.5 3.4 11.6
n 1126 753 200 416 574 546 1900 1715
0% 10% 20% 30% 40% 50%
Tractor VanTractor Flatbed
Car/SUV/Van/PickupBox Truck
Tractor ContainerTractor Tank
Tractor Car CarrierTank Truck
LowboyTractor only
Flatbed TruckTractor Chassis
Other
Share of total vehicles observed
Vehi
cle T
ype
Sumas Southbound Abbotsford/Huntingdon Northbound
[Page 18]

2015/16 IMTC Border Freight Operations Study Data Collection Report
Prepared by the Whatcom Council of Governments for the IMTC Program [ 18 ]
The histogram below plots the distribution of wait-times for all ports during the survey period, broken out by northbound and southbound travel.
Wait Time Distribution by Direction, All Ports and Standard lanes (June/July 2016)
Research assistants timestamping trucks at Pacific Highway
Wait Time Profiles Throughout each survey day there was consistent enough timestamping of commercial vehicles at queue-end and at primary inspection arrival that it was possible to build commercial vehicle border wait-time profiles for an average survey day. As previously explained, the field crew took a lunch break from 11:30 am to 12:00 pm each day, and no data was collected during this time.
The following chart shows the average standard lane wait-time (not including inspection) of commercial vehicles for the four days of surveying at each port, broken out in fifteen minute increments.
0%
5%
10%
15%
20%
25%
30%
35%
40%
45%
50%3 6 9 12 15 18 21 24 27 30 33 36 39 42 45
> 45
Shar
e of T
otal
Wait
Tim
es
Queue Wait Time (minutes)
Southbound Northbound
[Page 19]

2015/16 IMTC Border Freight Operations Study Data Collection Report
Prepared by the Whatcom Council of Governments for the IMTC Program [ 19 ]
Standard Lane Wait-Times during Survey Periods (2016)
Pacific Highway Standard Wait-Time Observation Comparison (2016 & 2012)
Additional data source: Cascade Gateway Border Data Warehouse
0
10
20
30
40
50
Wai
t-Ti
me
(min
utes
)
Pacific Highway Southbound 6/20-6/23 Pacific Highway Northbound 6/27-6/30
Lynden Southbound 7/5-7/8 Aldergrove Northbound 7/5-7/8
Sumas Southbound 7/11-7/14 Abbotsford/Huntingdon Northbound 7/11-7/14
0
10
20
30
40
50
Wai
t-Ti
me
(min
utes
)
SB Wait-Time - 2016 BFO Observations NB Wait-Time - 2016 BFO Observations
SB Wait-Time - 2016 Loop Detector Estimates NB Wait-Time - 2016 Loop Detector Estimates
SB Wait-Time - 2012 Loop Detector Estimates NB Wait-Time - 2012 Loop Detector Estimates
Sur
vey
crew
bre
ak 1
1:30
- 12
[Page 20]

2015/16 IMTC Border Freight Operations Study Data Collection Report
Prepared by the Whatcom Council of Governments for the IMTC Program [ 20 ]
The previous chart compares the wait-times calculated from the 2016 BFO field observations with wait-time estimates from the Cascade Gateway Border Data Warehouse. The Warehouse archives data from loop detectors in the border approach roadways. The loops detect the passage of vehicles, and through algorithms established by the Washington State Department of Transportation [WSDOT] and BC MoTI estimate vehicle volumes and border wait-times in five minute increments.
Looking at the same four-day period in June 2016, the wait-time estimates from the Warehouse match the survey calculations very well at northbound Pacific Highway. In the opposite direction, the profiles follow a similar trend save for a spike just after 11 am in the survey calculations. This discrepancy could be caused by a number of factors. At Pacific Highway southbound, the commercial vehicle queue is dispersed into a large truck staging area just before the inspection booths. Commercial vehicles are both organized into staging area queue lanes and are released from the staging area by an automated system of loop detectors and signals with little active enforcement. Drivers can also park and visit the duty free store, which occurs between the survey positions whose timestamps are used for wait-time calculations.
Also included in the chart are Warehouse wait-time estimates from June 2012. With annual truck volumes at Pacific Highway up by nearly 9 percent3 from 2012 to 2015, the estimated wait-times southbound are noticeably higher in 2016 than from four years prior – about 2.4 times4 higher during this time of year. Northbound wait-times are similar in 2016 as they were in 2012.
WAIT TIMES VS QUEUE LENGTHS By having dedicated data collection positions at both the end of the queue and near the inspection booths, virtually all commercial vehicles were observed while positions were staffed. This allows for queue lengths to be calculated for any point during the field work time periods. Queue lengths were calculated by counting the number of vehicles that had entered the standard lane queue prior to a specific vehicle (as observed at the queue-end position) but had not yet exited the queue for inspection (as observed at the inspection booth positions).
Trucks line up at the U.S. CBP Lynden (left) and the CBSA Pacific Highway (right) commercial facilities
3 From the U.S. Bureau of Transportation Statistics, 348,955 commercial vehicles crossed southbound at Pacific Highway in 2012 and 378,747 crossed in 2015 – an increase of 8.54 percent. 4 Using a similar time period as the BFO data collection (0800 to 1500, Monday to Thursday of the last full week of June), average wait-time estimates from the Cascade Gateway Border Data Warehouse were 7.8 minutes in 2012 and 18.5 minutes in 2016 – an increase multiple of 2.37.
[Page 21]

2015/16 IMTC Border Freight Operations Study Data Collection Report
Prepared by the Whatcom Council of Governments for the IMTC Program [ 21 ]
In the following charts, standard border wait-times are plotted next to standard lane queue lengths, both averaged in fifteen minute intervals. This comparison shows the variation in port clearance rates. The lower the wait-time-to-queue-length ratio, the higher the processing rate of vehicles.
Pacific Highway (June 2016)
Lynden-Aldergrove (July 2016)
0
10
20
30
40
50
0
10
20
30
40
50
Queu
e Len
gth
(# o
f veh
icles
)
Wait
Tim
e (m
inut
es)
Average SB Queue Length Average NB Queue Length
Average SB Wait-Time Average NB Wait-Time
0
10
20
30
40
50
0
10
20
30
40
50
Queu
e Len
gth
(# o
f veh
icles
)
Wait
Tim
e (m
inut
es)
Average SB Queue Length Average NB Queue Length
Average SB Wait-Time Average NB Wait-Time
[Page 22]

2015/16 IMTC Border Freight Operations Study Data Collection Report
Prepared by the Whatcom Council of Governments for the IMTC Program [ 22 ]
Sumas-Abbotsford/Huntingdon (July 2016)
WAIT TIMES - FAST LANES Wait Time Distribution by Direction, Pacific Highway FAST lanes (June 2016)
The relationship between north- and southbound FAST lane wait-times is similar to that of standard wait-times. Northbound they are shorter and less variable than southbound, with nearly 80 percent of individual commercial vehicle wait-times under one minute. Meanwhile, 80 percent of individual southbound wait-times are over five minutes, with an average of nearly 10 minutes. This is likely due to the southbound FAST lane infrastructure, where, as noted earlier, the dedicated lane starts south of the intersection of 2nd Avenue and B.C. Highway 15. North of the intersection, FAST lane eligible vehicles
0
10
20
30
40
50
0
10
20
30
40
50
Queu
e Len
gth
(veh
icles
)
Wait
Tim
e (m
inut
es)
Average of Southbound Queue Average of Northbound Queue
Average of Southbound Wait Average of Northbound Wait
0%
10%
20%
30%
40%
50%
60%
70%
80%
90%
1 2 3 4 5 6 7 8 9 10 11 12 13 14 15 16 17 18 19 20 21 22 23 24 25 26 27 28 29 30>
30
Shar
e of a
ll Wait
TIm
e rec
ords
Queue Wait Time (minutes)
Southbound Northbound
[Page 23]

2015/16 IMTC Border Freight Operations Study Data Collection Report
Prepared by the Whatcom Council of Governments for the IMTC Program [ 23 ]
must wait in one general lineup with all standard vehicles on Highway 15. Northbound FAST vehicles enter a FAST lane leading up to a dedicated FAST inspection booth.
Trucks wait for inspection at the CBSA Pacific Highway commercial facility
INSPECTION TIMES Inspection times in general are more consistent across directions of travel and ports-of-entry than wait-times. However, inspection times, similar to previously discussed queue wait-times, are more variable for southbound travel than for northbound travel. Southbound inspections also take ten seconds longer on average than northbound inspections. This is true also for FAST inspection times, with median inspection times for northbound and southbound vehicles at 29 and 51 seconds, respectively.
Inspection Time Distribution by Direction, All Ports and Standard lanes (2016)
0.0%
2.5%
5.0%
7.5%
10.0%
12.5%
0 10 20 30 40 50 60 70 80 90 100
110
120
130
140
150
160
170
180
190
>=20
0
Shar
e of a
ll Ins
pect
ion
Tim
e rec
ords
Standard Inspection Time (seconds)
Southbound Northbound
[Page 24]
2015/16 IMTC Border Freight Operations Study Data Collection Report
Prepared by the Whatcom Council of Governments for the IMTC Program [ 24 ]
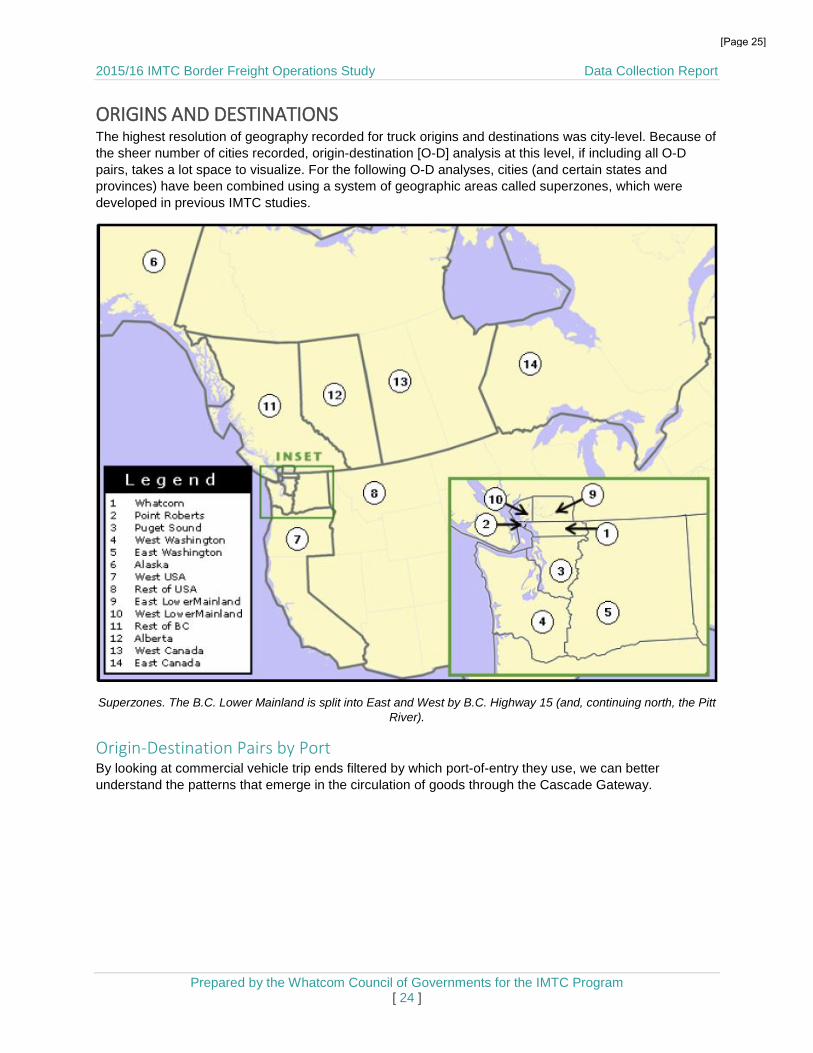
ORIGINS AND DESTINATIONS The highest resolution of geography recorded for truck origins and destinations was city-level. Because of the sheer number of cities recorded, origin-destination [O-D] analysis at this level, if including all O-D pairs, takes a lot space to visualize. For the following O-D analyses, cities (and certain states and provinces) have been combined using a system of geographic areas called superzones, which were developed in previous IMTC studies.
Superzones. The B.C. Lower Mainland is split into East and West by B.C. Highway 15 (and, continuing north, the Pitt River).
Origin-Destination Pairs by Port By looking at commercial vehicle trip ends filtered by which port-of-entry they use, we can better understand the patterns that emerge in the circulation of goods through the Cascade Gateway.
[Page 25]

2015/16 IMTC Border Freight Operations Study Data Collection Report
Prepared by the Whatcom Council of Governments for the IMTC Program [ 25 ]
Pacific Highway
The Pacific Highway crossing connects the I-5 corridor in Washington with B.C. Highway 99 and the Trans-Canada Highway (by way of B.C. Highway 15). The majority of trips passing through this port in either direction are going to and from Puget Sound and Western Lower Mainland, which contain the Seattle and Vancouver metro areas, respectively. However, trip-ends in the U.S. are more diverse– a noticeable share of trips to and from Whatcom County and the Western U.S. (Oregon and California) also have trip-ends in the Western Lower Mainland.
Alaska AlbertaEastern Canada
Eastern Lower
Mainland
Point Roberts
Rest of BCWestern
Lower Mainland
Eastern Washington 0.1% 1.3% 1.4%Puget Sound 0.5% 0.2% 2.5% 0.5% 0.7% 36.5% 40.8%Rest of USA 0.1% 0.8% 0.5% 5.0% 6.4%Western USA < 0.1% 2.3% < 0.1% 0.3% 11.5% 14.2%Western Washington 0.2% 0.6% < 0.1% 3.5% 4.4%Whatcom County 0.1% 2.9% 1.6% 0.7% 27.5% 32.8%
< 0.1% 0.9% 0.2% 9.1% 2.2% 2.3% 85.2% 100.0%
ORI
GIN
DESTINATION
Total
Total
PACIFIC HIGHWAY NORTHBOUND
Eastern Washington
Puget Sound
Rest of USAWestern
USAWestern
WashingtonWhatcom
CountyAlaska 0.1% < 0.1% 0.2%Alberta 0.1% 0.1% 0.4% 0.1% 0.1% 1.0%Eastern Canada 0.3% < 0.1% 0.5% 0.1% 1.0%Eastern Lower Mainland 0.4% 2.8% 0.5% 2.7% 0.4% 1.7% 8.4%Point Roberts 0.3% 0.4% 0.7%Rest of BC 0.2% 0.5% 0.1% 0.4% 0.7% 1.9%Western Canada 0.1% 0.1% < 0.1% 0.4%Western Lower Mainland 3.3% 32.7% 5.6% 14.7% 3.1% 26.8% 86.2%
4.3% 36.8% 6.3% 18.9% 3.7% 30.1% 100.0%
PACIFIC HIGHWAY SOUTHBOUND
ORI
GIN
DESTINATION
Total
Total
[Page 26]

2015/16 IMTC Border Freight Operations Study Data Collection Report
Prepared by the Whatcom Council of Governments for the IMTC Program [ 26 ]
Lynden-Aldergrove
Though it is about 11 miles east of Pacific Highway, Aldergrove sees a strong share of commercial trips northbound to the Western Lower Mainland. The majority of these trips are coming from within Whatcom County. There is no state route in northern Whatcom County that connects I-5 and SR 539, the approach highways to the Pacific Highway and Aldergrove crossings, respectively.
Southbound, an even larger share of Western Lower Mainland trips passes through Lynden. The Lynden commercial port is permit-only, meaning only industry within a limited geographic vicinity to the port are permitted to cross southbound. However, empty loads are also permitted southbound. Nearly 70 percent5 of the trips southbound through Lynden that originated in the Western Lower Maintain were observed to be empty – a high share that could indicate congestion avoidance at the closer, busier Pacific Highway crossing.
5 Of the 212 commercial vehicle trips passing through the southbound Lynden commercial port of entry and observed originating in Western Lower Mainland, 148 (or 69.8%) were recorded having an empty load.
AlbertaEastern Canada
Eastern Lower
Mainland
Point Roberts
Rest of BCWestern
Lower Mainland
Eastern Washington 0.4% 0.4% 0.9%Puget Sound 0.4% 22.4% 0.9% 6.0% 29.7%Rest of USA 0.4% 0.4%Western USA 0.4% 5.2% 2.6% 8.2%Western Washington 3.0% 0.9% 3.9%Whatcom County 39.7% 0.4% 16.8% 56.9%
0.4% 0.4% 71.1% 0.4% 0.9% 26.7% 100.0%
ALDERGROVE NORTHBOUND
ORI
GIN
DESTINATION
Total
Total
Eastern Washington
Puget Sound
Rest of USAWestern
USAWestern
WashingtonWhatcom
CountyAlaska 0.4% 0.4%Alberta 0.2% 0.2% 0.2% 0.6%Eastern Lower Mainland 3.0% 14.2% 0.2% 4.0% 2.3% 27.8% 51.5%Point Roberts 0.4% 0.4%Rest of BC 0.2% 0.2% 0.4% 0.2% 0.8% 1.9%Western Canada 0.2% 0.2%Western Lower Mainland 2.1% 11.7% 1.1% 4.4% 1.1% 24.6% 44.9%
5.5% 26.1% 1.5% 9.3% 3.6% 54.0% 100.0%
DESTINATION
ORI
GIN
LYNDEN SOUTHBOUND
Total
Total
[Page 27]

2015/16 IMTC Border Freight Operations Study Data Collection Report
Prepared by the Whatcom Council of Governments for the IMTC Program [ 27 ]
Sumas-Abbotsford/Huntingdon
The Sumas-Abbotsford/Huntingdon ports-of-entry primarily serve industry with an Eastern Lower Mainland or Whatcom County connection, as the data above shows. Of note is the share of commercial crossings with trip-ends being those two superzones, where trips southbound through Sumas are almost 10 percentage points less than northbound through Abbotsford-Huntingdon. This indicates a wider geographic range of carriers crossing southbound than northbound, caused in part by the permit limitation at Lynden southbound.
Alaska AlbertaEastern Canada
Eastern Lower
MainlandRest of BC
Western Lower
MainlandEastern Washington 1.3% 0.2% 1.5%Mexico 0.2% 0.2%Puget Sound 0.2% 0.8% 0.2% 18.0% 4.0% 2.5% 25.8%Rest of USA 2.9% 0.8% 0.5% 4.2%Western USA 2.4% 0.3% 1.0% 3.7%Western Washington 3.0% 0.3% 0.2% 3.5%Whatcom County 0.2% 0.7% 0.2% 46.5% 1.3% 12.1% 61.0%
0.3% 1.5% 0.3% 74.4% 6.9% 16.5% 100.0%
ABBOTSFORD-HUNTINGDON NORTHBOUND
ORI
GIN
DESTINATION
Total
Total
Eastern Washington
Puget Sound
Rest of USAWestern
USAWestern
WashingtonWhatcom
CountyAlaska 0.9% 0.1% 1.0%Alberta 1.0% 0.9% 0.4% 2.2%Eastern Canada 0.4% 0.4% 0.2% 0.1% 1.1%Eastern Lower Mainland 2.5% 12.4% 3.1% 6.6% 1.7% 37.8% 64.1%Rest of BC 0.2% 2.6% 0.5% 1.5% 0.4% 3.6% 8.8%Western Lower Mainland 0.9% 4.2% 1.7% 2.6% 0.2% 13.0% 22.7%
4.0% 21.5% 5.3% 11.9% 2.4% 55.0% 100.0%
ORI
GIN
DESTINATION
Total
TotalSUMAS SOUTHBOUND
[Page 28]

2015/16 IMTC Border Freight Operations Study Data Collection Report
Prepared by the Whatcom Council of Governments for the IMTC Program [ 28 ]
COMMODITIES The number of records per commodity type represents the number of commercial vehicles that reported hauling that commodity – or, if the vehicle was currently empty, the main commodity that was last hauled across the border or was about to picked up and brought back. This is not an indication of weight for value, but a summarization of the flow of commercial vehicles through the Cascade Gateway by commodity type.
Commercial Vehicle Movements by Primary Commodity Reported (June 2016)
Looking at the Cascade Gateway altogether, the goods traveling north are more diversified than south. Wood commodities, like rough wood (logs and wood for fuel) and wood products (lumber and other
0% 5% 10% 15%
Live AnimalsGrain
AgricultureAnimal Food
MeatBakery
Other FoodAlcohol
Building StoneSand
GravelMinerals
Crude OilGasolineFuel Oils
Coal/Petroleum ProductsBasic ChemicalsPharmaceuticals
FertilizersChemical Products
Plastic/RubberRough Wood
Wood ProductsNewsprint/PaperPaper Products
Printed MaterialsTextiles
Mineral ProductsBase Metal
Metal ProductsMachineryElectronics
Motor VehiclesTransportation
Precision InstrumentsFurniture
Manufactured GoodsWaste/Scrap
Mixed FreightMail
Share of Truck Movements
Com
mod
ity T
ype
SouthboundNorthbound
[Page 29]

2015/16 IMTC Border Freight Operations Study Data Collection Report
Prepared by the Whatcom Council of Governments for the IMTC Program [ 29 ]
finished wood products), make up the largest percentage of instances of goods coming into the U.S., with automobiles (and automobile parts) also making up a large share. The largest share of commercial vehicle movements into Canada are imports of automobiles and agricultural products (excluding animal feed and grains).
CARRIER TRENDS By recording the names of carrier companies crossing the border, we can get a better sense of the distribution of companies in the trucking industry operating in the Cascade Gateway. Those carrier companies observed crossing most frequently are of particular interest – an additional element of BFO is reaching out to the management of these companies and gathering their feedback on a range of border related topics commonly discussed at IMTC meetings. Their feedback helps inform core IMTC agencies by providing unique industry perspectives on both known and previously unnoticed border-related issues.
Carrier Companies Comprising 50 percent of Crossing Instances (June 2016)
PORT DIRECTION CARRIERS OBSERVED
NO. OF CARRIERS
COMPRISING 50% OF
CROSSINGS
SHARE OF CARRIERS
COMPRISING 50% OF
CROSSINGS Pacific Highway Northbound 485 61 12.6% Pacific Highway Southbound 486 68 14.0% Lynden/Aldergrove Northbound 79 17 21.5% Lynden/Aldergrove Southbound 142 23 16.2% Sumas/Huntingdon Northbound 193 25 13.0% Sumas/Huntingdon Southbound 251 39 15.5%
The above table gives an indication as to the distribution of carrier companies crossing at each port-of-entry. For instance, from the field observations in June of 2016, as few as 17 individual carrier companies accounted for half of all trips crossing north through the Lynden commercial crossing.
FOR MORE INFORMATION Please direct any questions or comments regarding the 2015/16 IMTC Border Freight Operations Study to the following project managers:
Jaymes McClain Planner I Whatcom Council of Governments (360) 685-8391 [email protected]
Melissa Fanucci, AICP Principal Planner Whatcom Council of Governments (360) 685-8388 [email protected]
Hugh Conroy Director of Planning Whatcom Council of Governments
(360) 685-8384 [email protected]
[Page 30]

www.theimtc.com ● [email protected] ● (360) 685-8385
2015/16 Border Freight Operations Study Technical Memo
Dangerous Goods Movement through the Cascade Gateway
Background In summer 2016, undergraduate research assistants from Western Washington University [WWU] observed freight movements at the three main Cascade Gateway land-border commercial crossings – Pacific Highway, Lynden-Aldergrove, and Sumas-Abbotsford/Huntingdon – as part of the IMTC Border Freight Operations study. At each crossing, the field crew used touch-screen tablets to record a multitude of data points, including: border wait-times, vehicle types, commodity information, empty/loaded statuses, and origin/destination information. The summer 2015 data collection was a limited scope, preliminary effort, where freight movements were observed at Pacific Highway and the Abbotsford/Huntingdon commercial crossings. Both data collections efforts included observations of dangerous goods placards – the focus of this technical memo.
Cascade Gateway Commercial Ports-of-Entry Pacific Highway – Interstate 5/State Route 543 & B.C. Highway 15 Lynden-Aldergrove – State Route 539 & B.C. Highway 13 Sumas-Abbotsford/Huntingdon – State Route 9 & B.C. Highway 11
IMTC INTERNATIONAL MOBILITY & TRADE CORRIDOR PROGRAM
[Page 31]

2015/16 IMTC Border Freight Operations Study ● Dangerous Goods Technical Memo
www.theimtc.com ● [email protected] ● (360) 685-8385
Page | 2
Cascade Gateway Freight Traffic Commercial traffic through the Cascade Gateway predominantly travels through the Pacific Highway ports-of-entry, which have processed 72 percent of the traffic over the past twenty years. In 2015 there were about 65,000 commercial vehicle crossings total through Pacific Highway per month, averaging 71 percent of the total per month traffic traveling through the three primary commercial crossings. At Lynden-Aldergrove there were about 4,800 recorded commercial vehicle crossings per month for 2015, accounting for over 5 percent of all Cascade Gateway traffic. At Sumas-Abbotsford/Huntingdon, the 22,000 monthly crossings in 2015 made up nearly 24 percent of all traffic. The graph below shows absolute volume breakouts by port and direction for Cascade Gateway commercial traffic over the past two decades.
Monthly Commercial Vehicle Volume by Port and Direction, 1995-2016
Sources: U.S. Bureau of Transportation Statistics and Statistics Canada
0
10
20
30
40
50
60
1995
1996
1997
1998
2000
2001
2002
2003
2005
2006
2007
2008
2010
2011
2012
2013
2015
Com
mer
cial V
ehicl
esTh
ousa
nds
Year
Pacific Highway SouthboundPacific Highway NorthboundLynden SouthboundAldergrove NorthboundSumas SouthboundAbbotsford/Huntingdon Northbound
[Page 32]

2015/16 IMTC Border Freight Operations Study ● Dangerous Goods Technical Memo
www.theimtc.com ● [email protected] ● (360) 685-8385
Page | 3
Data Collection Time Frame
2016 PORT-OF-ENTRY DIRECTION SURVEY DAYS TIME
Pacific Highway Southbound M-Th, June 20-23
8:00am – 11:30pm & 12:00pm – 3:00pm
Pacific Highway Northbound M-Th, June 27-30
Lynden-Aldergrove Northbound & Southbound T-F, July 5-8
Sumas-Abb./Hunt. Northbound & Southbound M-Th, July 11-14
2015 PORT-OF-ENTRY DIRECTION SURVEY DAYS TIME
Pacific Highway Southbound M-Th, July 6-9
8:00am - 4:00pm Pacific Highway Northbound M-Th, July 13-16
Abbotsford/Hunt. Southbound M-Th, July 20-23
Records Collected
2016 PORT-OF-ENTRY SOUTHBOUND NORTHBOUND Pacific Highway 1613 1661 3274
Lynden-Aldergrove 520 253 773
Sumas-Abbotsford/Huntingdon 874 656 1530
3007 2570 5577
2015 PORT-OF-ENTRY SOUTHBOUND NORTHBOUND Pacific Highway 1968 2092 4060
Abbotsford/Huntingdon - 893 893
1968 2985 4953
Data Recorded Field crews were trained to recognize dangerous goods placards attached to the loads of commercial vehicles. For each commercial vehicle that carried a placard, crew recorded the hazard classification number and U.N. number (if presented) shown on the placard.
[Page 33]

2015/16 IMTC Border Freight Operations Study ● Dangerous Goods Technical Memo
www.theimtc.com ● [email protected] ● (360) 685-8385
Page | 4
1203
As per the 2012 Emergency Response Guidebook developed by the U.S. Department of Transportation and Transport Canada, there are nine hazard classifications:
1. Explosives 2. Gases 3. Flammable liquids (and combustible liquids) 4. Flammable solids; spontaneously combustible materials; and dangerous when wet
materials/water-reactive substances 5. Oxidizing substances and organic peroxides 6. Toxic/poisonous substances and infectious substances 7. Radioactive materials 8. Corrosive substances 9. Miscellaneous hazardous materials/products, substances, or organisms
The four-digit U.N. number shown on a placard identifies the specific hazardous material being hauled.
A dangerous goods placard. The hazard class is (3) Flammable liquid, and the U.N. number 1203 identifies the material being hauled is gasoline or gasohol.
Dangerous Goods Movements by Border Crossing By breaking out dangerous goods placard observations by port and direction of traffic, we can get a better sense of any patterns present in the circulation of hazardous materials through Cascade Gateway commercial ports-of-entry.
During the 2016 field data collection, through discussion with drivers it was recorded which commercial vehicles were laden and which were currently empty, or not hauling any goods. This lets us know which truck trips actually contained hazardous materials.
[Page 34]

2015/16 IMTC Border Freight Operations Study ● Dangerous Goods Technical Memo
www.theimtc.com ● [email protected] ● (360) 685-8385
Page | 5
Loaded dangerous goods movements by port and direction (2016)
Data source: IMTC Border Freight Operations data collection – June 20-July 14, 2016; Mon-Thur 0800-1500
Nearly 80 percent of the dangerous goods observed crossing through the Cascade Gateway commercial ports were traveling north. The majority of these goods were flammable liquids crossing through Pacific Highway, mainly aviation fuel as U.N. numbers indicate. The second most common dangerous goods category was corrosive substances. Of the 18.5 percent of materials in this category, 40 percent were sodium hydroxide solution, all heading south through Pacific Highway.
Also of note is the number of miscellaneous hazardous materials being hauled north through Abbotsford-Huntingdon. U.N. numbers and commodity information show this being mostly hazardous waste.
Empty dangerous goods container movements by port and direction (2016)
Data source: IMTC Border Freight Operations data collection – June 20-July 14, 2016; Mon-Thur 0800-1500
PACIFIC H
IGHW
AY
NORTHBOUND
PACIFIC H
IGHW
AY
SOUTH
BOUND
ALDER
GROVE
NORTHBOUND
LYNDEN
SOUTH
BOUND
ABB-HUNT
NORTHBOUND
SUM
AS
S0UTH
BOUND
Totals b
y
Classifi
cation
Observed Hazard Classifictions# of placards observed 3 4 3 10
% of total placards at POE 50.0% 8.0% 10.7% 11.4%43 23 1 67
86.0% 82.1% 25.0% 76.1%3 3 2 8
50.0% 6.0% 7.1% 9.1%3 3
75.0% 3.4%Observed Dangerous Goods Placards 6 50 0 28 0 4 88
8 Corriosive substances
9 Miscellaneous
2 Gases
3 Flammable Liquids
PACIFIC H
IGHW
AY
NORTHBOUND
PACIFIC H
IGHW
AY
SOUTH
BOUND
ALDER
GROVE
NORTHBOUND
LYNDEN
SOUTH
BOUND
ABB-HUNT
NORTHBOUND
SUM
AS
S0UTH
BOUND
Totals b
y
Classifi
cation
Observed Hazard Classifictions# of placards observed 8 2 1 11
% of total placards at POE 12.3% 10.0% 4.8% 10.2%51 4 2 57
78.5% 20.0% 100.0% 52.8%1 1
5.0% 0.9%1 1
4.8% 0.9%6 12 2 20
9.2% 60.0% 9.5% 18.5%1 17 18
5.0% 81.0% 16.7%Observed Intances of Dangerous Goods 65 20 0 2 21 0 108
Observed Trucks 1661 1613 253 520 656 874 5577% of Trucks hauling Dangerous Goods 3.9% 1.2% 0.0% 0.4% 3.2% 0.0% 1.9%
7 Radioactive materials
8 Corriosive substances
9 Miscellaneous
2 Gases
3 Flammable Liquids
5Oxidizing substances and Organic peroxides
[Page 35]

2015/16 IMTC Border Freight Operations Study ● Dangerous Goods Technical Memo
www.theimtc.com ● [email protected] ● (360) 685-8385
Page | 6
Of the empty placarded-commercial vehicles, over three quarters of the placards were for flammable liquid. These were overwhelmingly empty aviation fuel tankers. All were being transported southbound – most through Pacific Highway, but a large share through Lynden as well. Although Lynden is a permit-only commercial port of entry (only industry within a limited geographic vicinity to the port are permitted to cross southbound) empty commercial vehicles can also cross. Over 26 percent of the empty aviation fuel tankers traveling southbound were traveling through Lynden.
During the 2015 data collection, data points such as empty/loaded statuses, vehicle origins and destinations, and commodity information were not ascertained. However, many dangerous goods placards were observed.
Loaded and empty dangerous goods container movements by port and direction (2015)
Data source: IMTC Border Freight Operations data collection – June 20-July 16, 2015; Mon-Thur 0800-1600
The movement of gases appears to have been more prominent during the 2015 data collection than the 2016 effort. The U.N. numbers indicate that of these gas shipments, 48 percent were refrigerated liquid carbon dioxide and 17 percent were refrigerated liquid oxygen.
Of the corrosive substance placards observed, 48 percent were sodium hydroxide solution.
The share of containers hauling aviation fuel, empty or loaded, is almost exactly the same in 2015 as in 2016 – about 49 percent of all placarded commercial vehicles.
PACIFIC H
IGHW
AY
NORTHBOUND
PACIFIC H
IGHW
AY
SOUTH
BOUND
ABB-HUNT
NORTHBOUND
Totals b
y
Classifi
cation
Observed Hazard Placard Classifictions# of placards observed 28 25 1 54
% of total placards at POE 19.2% 19.8% 5.9% 18.7%92 79 2 173
63.0% 62.7% 11.8% 59.9%2 2
1.4% 0.7%1 1
0.7% 0.3%21 21 2 44
14.4% 16.7% 11.8% 15.2%2 1 12 15
1.4% 0.8% 70.6% 5.2%Observed Dangerous Goods Placards 146 126 17 289
Total Observed Trucks 2092 1968 893 4953% of Trucks w/ Dang. Goods Placards 7.0% 6.4% 1.9% 5.8%
6 Toxic/poisonous substances
8 Corriosive substances
9 Miscellaneous
2 Gases
3 Flammable Liquids
5Oxidizing substances and Organic peroxides
[Page 36]

2015/16 IMTC Border Freight Operations Study ● Dangerous Goods Technical Memo
www.theimtc.com ● [email protected] ● (360) 685-8385
Page | 7
Dangerous Goods Origins and Destinations By combining recorded trip origins and destinations with the direction of travel of laden and empty placarded-vehicles from the 2016 data collection effort, we can better visualize the circulation of hazardous material movements within and through the Cascade Gateway region. For better organization, city-level origin and destination data is combined into geographic regions called superzones.
Counts of dangerous goods movements by origin-destination superzone pair (2016)
Data source: IMTC Border Freight Operations data collection – June 20-July 14, 2016; Mon-Thur 0800-1500
We can better pinpoint where these movements are occurring by looking at the city-level data collected from drivers for those hazardous materials observed being shipped most often through the Cascade Gateway.
Cargo O
rigin
Cargo D
estin
ation
Gases
Flammab
le Liqu
ids
Oxidizin
g substa
nces a
nd
Organic p
eroxid
es
Radioac
tive m
ateria
ls
Corrosiv
e substa
nces
Misc
ellaneou
s
% of Total
Placard
s
Observe
d
2 3 5 7 8 9Eastern Washington Western Lower Mainland 3 1.7%Puget Sound Eastern Canada 1 0.6%Puget Sound Eastern Lower Mainland 3 1 6 5.8%Puget Sound Point Roberts 5 2.9%Puget Sound Rest of BC 9 5.2%Puget Sound Western Lower Mainland 4 2 3 1 5.8%Western USA Eastern Lower Mainland 1 0.6%Western USA Rest of BC 1 0.6%Western USA Western Lower Mainland 2 1 1.7%Western Washington Eastern Lower Mainland 1 0.6%Western Washington Western Lower Mainland 1 0.6%Whatcom County Eastern Lower Mainland 4 12 9.3%Whatcom County Point Roberts 1 2 1.7%Whatcom County Rest of BC 1 0.6%Whatcom County Western Lower Mainland 1 83 48.8%Eastern Lower Mainland Puget Sound 1 0.6%Eastern Lower Mainland Whatcom County 1 0.6%Western Lower Mainland Puget Sound 1 4 1 3.5%Western Lower Mainland Western USA 1 0.6%Western Lower Mainland Western Washington 1 0.6%Western Lower Mainland Whatcom County 4 3 6 7.6%
Superzone Definition Superzone DefinitionWhatcom County Whatcom County Eastern Lower Mainland BC lower mainland valley east of BC Hwy 15Point Roberts Point Roberts Western Lower Mainland BC lower mainland valley west of BC Hwy 15Puget Sound Skagit County to King County, plus Tacoma area Rest of BC BC outside of lower mainland (Vanouver Island, all of the rest of BC)Western Washington Olympic Peninsula and southwestern Washington Alberta AlbertaEastern Washington East of Puget Sound counties Western Canada Saskatchewan, Manitoba, Northwest Territories, Yukon Territory, NanavutAlaska Alaska Eastern Canada East of ManitobaWestern USA Oregon and CaliforniaRest of USA East of Washington, Oregon, and California
Cana
da
Uni
ted
Stat
es
[Page 37]

2015/16 IMTC Border Freight Operations Study ● Dangerous Goods Technical Memo
www.theimtc.com ● [email protected] ● (360) 685-8385
Page | 8
Whatcom County to Western Lower Mainland
The most significant movement of dangerous goods is between Whatcom County, WA and the BC Western Lower Mainland. This movement is made up almost entirely of flammable liquids. Nearly half of the flammable liquid movements between these superzones begin in the Ferndale/Cherry Point area and end in the Vancouver, BC/Airport area. Because over 92 percent of the flammable liquids being moved between these areas is aviation fuel, it can be surmised that this origin-destination movement represents the BP Cherry Point Refinery-Vancouver International Airport [YVR] fuel connection.
Whatcom County to Eastern Lower Mainland
There is also a noticeable number of flammable liquid movements from Whatcom County, WA to the B.C. Eastern Lower Mainland, though much less than to the western region. All shipments were coming from the Ferndale/Cherry Point area and headed to Langley, BC. The flammable liquids were aviation fuel, and the gases were propane.
Puget Sound to Rest of BC
Only miscellaneous dangerous goods were observed in commercial movements from Washington’s Puget Sound to British Columbia outside of the Lower Mainland (Rest of BC). At the city level, these were shipments from Anacortes, WA and Everett, WA solely to Princeton, BC, all of it hazardous waste.
Puget Sound to Eastern Lower Mainland
Haz. Mat. Origin Destination # Share of MovementsBlaine, WA Vancouver, BC/Airport 13 16%Blaine, WA Richmond, BC 9 11%Blaine, WA Surrey, BC 6 8%Blaine, WA Burnaby, BC 1 1%Ferndale/Cherry Point Vancouver, BC/Airport 39 49%Ferndale/Cherry Point Richmond, BC 5 6%Ferndale/Cherry Point Surrey, BC 3 4%Lynden, WA Vancouver, BC 2 3%Lynden, WA Surrey, BC 1 1%
FlammableLiquids
Haz. Mat. Origin Destination # Share of MovementsGases Ferndale/Cherry Point Langley, BC 4 25%Flammable Liquids Ferndale/Cherry Point Langley, BC 12 75%
Haz. Mat. Origin Destination # Share of MovementsAnacortes, WA Princeton, BC 5 56%Everett, WA Princeton, BC 4 44%
Miscellaneous
Haz. Mat. Origin Destination # Share of MovementsArlington, WA Chilliwack, BC 4 67%Everett, WA Chilliwack, BC 1 17%Anacortes, WA Abbotsford, BC 1 17%
Miscellaneous
[Page 38]
2015/16 IMTC Border Freight Operations Study ● Dangerous Goods Technical Memo
www.theimtc.com ● [email protected] ● (360) 685-8385
Page | 9
Miscellaneous dangerous goods moving from Puget Sound to the BC Eastern Lower Mainland were mostly destined for Chilliwack, BC. Elevated temperature liquids were observed coming from Arlington, WA, (asphalt) and Everett, WA, (tar). One shipment of hazardous waste was observed moving from Anacortes, WA to Abbotsford, BC.
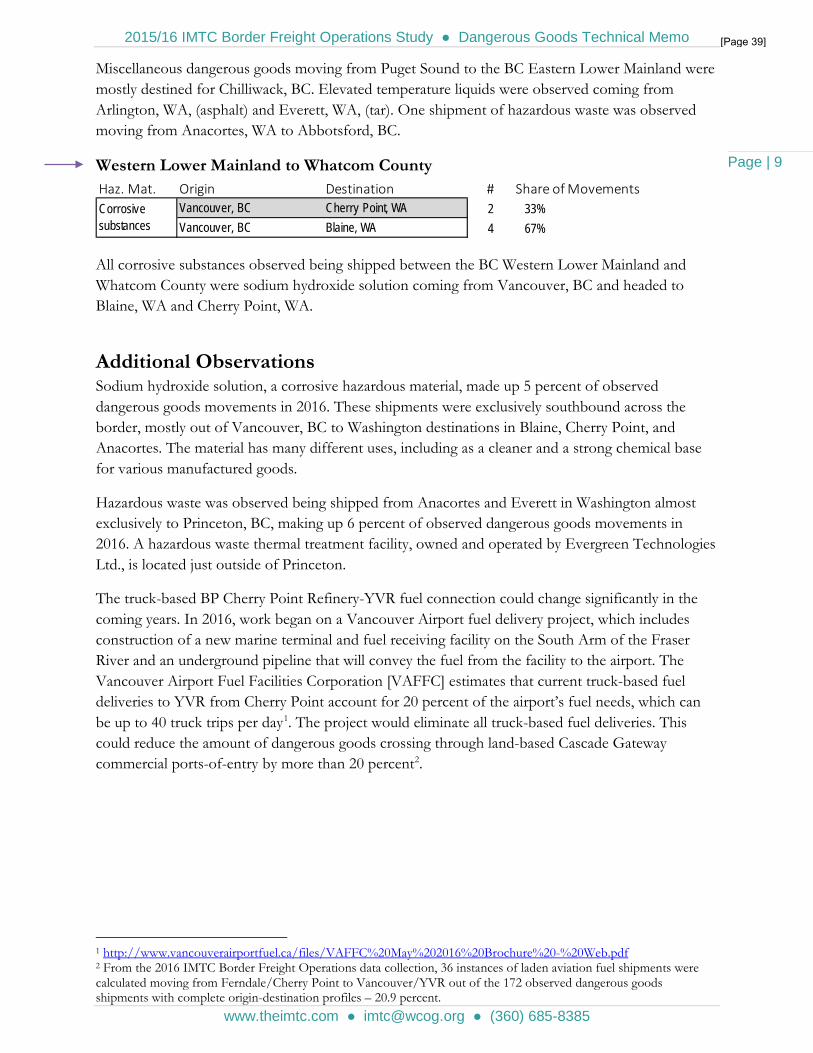
Western Lower Mainland to Whatcom County
All corrosive substances observed being shipped between the BC Western Lower Mainland and Whatcom County were sodium hydroxide solution coming from Vancouver, BC and headed to Blaine, WA and Cherry Point, WA.
Additional Observations Sodium hydroxide solution, a corrosive hazardous material, made up 5 percent of observed dangerous goods movements in 2016. These shipments were exclusively southbound across the border, mostly out of Vancouver, BC to Washington destinations in Blaine, Cherry Point, and Anacortes. The material has many different uses, including as a cleaner and a strong chemical base for various manufactured goods.
Hazardous waste was observed being shipped from Anacortes and Everett in Washington almost exclusively to Princeton, BC, making up 6 percent of observed dangerous goods movements in 2016. A hazardous waste thermal treatment facility, owned and operated by Evergreen Technologies Ltd., is located just outside of Princeton.
The truck-based BP Cherry Point Refinery-YVR fuel connection could change significantly in the coming years. In 2016, work began on a Vancouver Airport fuel delivery project, which includes construction of a new marine terminal and fuel receiving facility on the South Arm of the Fraser River and an underground pipeline that will convey the fuel from the facility to the airport. The Vancouver Airport Fuel Facilities Corporation [VAFFC] estimates that current truck-based fuel deliveries to YVR from Cherry Point account for 20 percent of the airport’s fuel needs, which can be up to 40 truck trips per day1. The project would eliminate all truck-based fuel deliveries. This could reduce the amount of dangerous goods crossing through land-based Cascade Gateway commercial ports-of-entry by more than 20 percent2.
1 http://www.vancouverairportfuel.ca/files/VAFFC%20May%202016%20Brochure%20-%20Web.pdf 2 From the 2016 IMTC Border Freight Operations data collection, 36 instances of laden aviation fuel shipments were calculated moving from Ferndale/Cherry Point to Vancouver/YVR out of the 172 observed dangerous goods shipments with complete origin-destination profiles – 20.9 percent.
Haz. Mat. Origin Destination # Share of MovementsVancouver, BC Cherry Point, WA 2 33%Vancouver, BC Blaine, WA 4 67%
Corrosive substances
[Page 39]

2015/16 IMTC Border Freight Operations Study ● Dangerous Goods Technical Memo
www.theimtc.com ● [email protected] ● (360) 685-8385
Page | 10
For more information Please direct any questions or comments regarding this dangerous goods technical memo or the 2015/16 IMTC Border Freight Operations Study to:
Jaymes McClain Planner I Whatcom Council of Governments (360) 685-8391 [email protected]
[Page 40]

2016 IMTC Border Freight Operations Study Technical Memo
Commercial Inspection Analysis: Ending Cash Collections at U.S. CBP Ports-of-Entry Whatcom Council of Governments August 2017
Introduction U.S. Customs and Border Protection (U.S. CBP) requires a user fee for commercial vehicles crossing the border into the Unites States to offset border inspection costs. The fee can be paid annually, priced at $401.67 per vehicle. During commercial inspection, a transponder attached to the vehicle transmits information about whether the fee has been paid. For commercial crossers who do not purchase the annual transponder, U.S. CBP charges the fee as $13.05 per vehicle per crossing instance. Carriers can pay this per-crossing fee ahead of time through U.S. CBP’s Decal and Transponder Online Procurement System (DTOPS) or in-person at the border inspection booth. Paying with paper currency and coin adds time to each inspection and also requires U.S. CBP inspectors to manage a cash till, which must be balanced after each hourly shift change. U.S. CBP is currently in the process of phasing out the cash-payment.
This technical memo focuses on the at-booth collection cash at U.S. CBP commercial land ports-of-entry (POE) in the Cascade Gateway. Using data collected through the 2016 IMTC Border Freight Operations Study, this memo analyzes how the discontinuation of at-booth cash collections is likely to affect commercial inspection durations and border wait-times in the Cascade Gateway.
2016 Data Collection Review In summer 2016, the Whatcom Council of Governments (WCOG) partnered with the Border Policy Research Institute (BPRI) and conducted data collection field efforts at commercial land border POEs in the Cascade Gateway as part of the IMTC Border Freight Operations Study (BFO). WCOG and BPRI staff hired student research assistants from Western Washington University (WWU) to collect commercial vehicle and border performance data. Data from a preliminary 2015 BFO data collection effort was not used for analysis in this report.
[Page 41]

2016 IMTC BORDER FREIGHT OPERATIONS STUDY ▪ CASH COLLECTION ANALYSIS TECHNICAL MEMO
Page
2
Timeframe Data collection for the 2016 BFO occurred Mondays through Thursdays from morning to late afternoon in late June and early July. Each commercial POE in the Cascade Gateway was visited, with both directions of traffic observed.
DATES OF DATA COLLECTION
PORT OF ENTRY DIRECTION SURVEY DAYS TIME
Pacific Highway Southbound M-Th, June 20-23
8:00am – 11:30pm & 12:00pm – 3:00pm
Pacific Highway Northbound M-Th, June 27-30
Lynden-Aldergrove Northbound & Southbound T-F, July 5-8
Sumas-Abb./Hunt. Northbound & Southbound M-Th, July 11-14
Data collected Data from the various observation points were combined to create profiles of individual vehicles as they made their way through the border inspection process. Data points include:
• Vehicle classification types • Carrier company information • Dangerous goods information • Vehicle origin and destination • On-board commodity information • Queue wait-time • Inspection duration • Cash collection at inspection, Y/N (southbound into U.S.)
Data review During the 2016 data collection timeframe, 5,557 observations of commercial vehicles were recorded crossing the border in the Cascade Gateway.
NUMBER OF COMMERCIAL VEHICLES OBSERVED
PORT OF ENTRY SOUTHBOUND NORTHBOUND TOTAL
Pacific Highway 1613 1661 3274
Lynden-Aldergrove 520 253 773
Sumas-Abb./Hunt. 874 656 1530
TOTAL 3007 2570 5577
[Page 42]

2016 IMTC BORDER FREIGHT OPERATIONS STUDY ▪ CASH COLLECTION ANALYSIS TECHNICAL MEMO
Page
3
Inspections Involving Cash Collection At U.S. CBP POEs, student research assistants were stationed at commercial inspection booths, allowing them to record whether vehicles paid their user fees in cash or not. These observations can be combined with other data points collected in the field to assess patterns in user fee cash collections and estimate the effects on cross-border wait-times when cash collections are eliminated.
CASH COLLECTION RATES BY PORT OF ENTRY
Pacific Highway saw the greatest percentage of inspections involving cash collection, twice the rate of the Sumas POE. User fees paid via cash taper at U.S. CBP POEs from west to east.
Inspection Durations AVERAGE PRIMARY INSPECTION DURATIONS, CASH COLLECTION VS NO CASH COLLECTION, BY PORT
(MINUTES)
PORT OF ENTRY NO CASH
COLLECTION CASH
COLLECTION
CASH COLLECTION % INCREASE
Pacific Highway 1.4 2.3 66 %
Lynden 1.3 1.9 53 %
Sumas 0.7 1.4 95 %
All Ports 1.2 2.1 81 %
The added time during commercial inspections to collect cash for the user fee payment is significant. Inspections at the Pacific Highway POE, which was observed having the highest rate of cash collection in the Cascade Gateway, take 66 percent longer on average when cash transactions occur.
PORT OF ENTRY
CASH COLLECTIONS
OBSERVED
TOTAL INSPECTIONS
OBSERVED
CASH COLLECTION
RATE
Pacific Highway 259 1613 16 %
Lynden 54 520 10 %
Sumas 69 874 8 %
TOTAL 382 3007 13 %
[Page 43]

2016 IMTC BORDER FREIGHT OPERATIONS STUDY ▪ CASH COLLECTION ANALYSIS TECHNICAL MEMO
Page
4
Country of origin CASH COLLECTION RATES BY COMMERCIAL VEHICLE COUNTRY OF ORIGIN
COUNTRY OF ORIGIN
CASH COLLECTIONS
OBSERVED
TOTAL INSPECTIONS
OBSERVED
CASH COLLECTION
RATE
Canada 195 1915 10%
US 126 865 15%
The bulk of commercial truck crossings are made by Canadian carrier companies – nearly 70 percent. However, U.S. carriers pay user fees via cash at a higher rate.
Vehicle types CASH COLLECTION RATES BY COMMERCIAL VEHICLE CLASSIFICATION TYPE
VEHICLE TYPE
CASH COLLECTIONS
OBSERVED
TOTAL INSPECTIONS
OBSERVED
CASH COLLECTION
RATE
Car/SUV/Van/Pickup 142 400 36%
Lowboy 7 28 25%
Tractor + Car Carrier 4 18 22%
Box Truck 31 168 18%
Tractor + Chassis 2 17 12%
Flatbed Truck 6 58 10%
Tractor only 3 32 9%
Tractor + Tank 16 204 8%
Tractor + Van 74 1128 7%
Tractor + Flatbed 17 386 4%
Tractor + Intermodal 1 85 1%
Tank Truck 0 5 0%
Other 79 478 17%
Higher cash collection rates seem to be associated with atypical commercial vehicle types. Over one-third of individual passenger vehicles (“Car/SUV/Van/Pickup”) paid via cash. The most commonly observed commercial vehicle types crossing through the Cascade Gateway POEs (tractors with van- or flatbed trailers) had some of the lowest cash collection rates.
[Page 44]

2016 IMTC BORDER FREIGHT OPERATIONS STUDY ▪ CASH COLLECTION ANALYSIS TECHNICAL MEMO
Page
5
Commodities CASH COLLECTION RATES BY TOP 15 MOST OBSERVED COMMODITY CATEGORIES
SCTG CODE DESCRIPTION
CASH COLLECTIONS
OBSERVED
TOTAL INSPECTIONS
OBSERVED
CASH COLLECTION
RATE
40 Manufactured Goods
30 70 42.9%
36 Motor Vehicles 108 267 40.4%
34 Machinery 16 67 23.9%
33 Metal Products 14 75 18.7%
24 Plastic/Rubber 13 111 11.7%
3 Agriculture 20 198 10.1%
31 Mineral Products 13 150 8.7%
4 Animal Food 5 67 7.5%
7 Other Food 8 109 7.3%
44 Mail 5 69 7.2%
26 Wood Products 14 232 6.0%
17 Gasoline 2 71 2.8%
25 Rough Wood 6 247 2.4%
28 Paper Products 2 90 2.2%
41 Waste/Scrap 2 103 1.9%
Motor vehicles were not only the most observed commodity being imported in the U.S. during the data collection, they were also associated with one of the highest cash collection rates among the most commonly observed commodities at a rate of over 40 percent.
Analysis: Ending Cash Collection at Primary Inspection
Total inspection time savings estimate Multiplying the average inspection times observed during the 2016 BFO data collection with the amount of records (individual vehicle profiles) collected produces an estimate for total inspection duration – that is, every commercial vehicle’s primary inspection duration added together. This product can only be computed for the days and times that there is data for and so would not be useful on its own. However, it can be used as a general estimate of the effects of eliminating cash collection from primary inspection.
[Page 45]
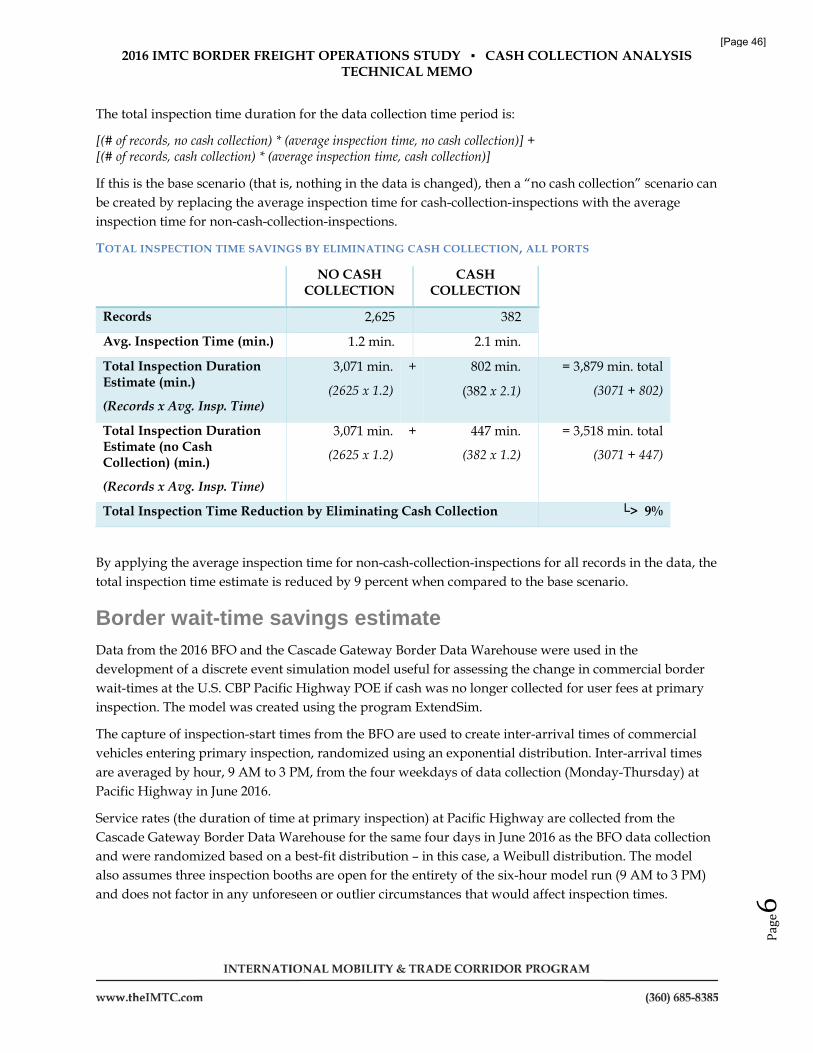
2016 IMTC BORDER FREIGHT OPERATIONS STUDY ▪ CASH COLLECTION ANALYSIS TECHNICAL MEMO
Page
6
The total inspection time duration for the data collection time period is:
[(# of records, no cash collection) * (average inspection time, no cash collection)] + [(# of records, cash collection) * (average inspection time, cash collection)]
If this is the base scenario (that is, nothing in the data is changed), then a “no cash collection” scenario can be created by replacing the average inspection time for cash-collection-inspections with the average inspection time for non-cash-collection-inspections.
TOTAL INSPECTION TIME SAVINGS BY ELIMINATING CASH COLLECTION, ALL PORTS
NO CASH COLLECTION
CASH COLLECTION
Records 2,625 382
Avg. Inspection Time (min.) 1.2 min. 2.1 min.
Total Inspection Duration Estimate (min.)
(Records x Avg. Insp. Time)
3,071 min.
(2625 x 1.2)
+ 802 min.
(382 x 2.1)
= 3,879 min. total
(3071 + 802)
Total Inspection Duration Estimate (no Cash Collection) (min.)
(Records x Avg. Insp. Time)
3,071 min.
(2625 x 1.2)
+ 447 min.
(382 x 1.2)
= 3,518 min. total
(3071 + 447)
Total Inspection Time Reduction by Eliminating Cash Collection └> 9%
By applying the average inspection time for non-cash-collection-inspections for all records in the data, the total inspection time estimate is reduced by 9 percent when compared to the base scenario.
Border wait-time savings estimate Data from the 2016 BFO and the Cascade Gateway Border Data Warehouse were used in the development of a discrete event simulation model useful for assessing the change in commercial border wait-times at the U.S. CBP Pacific Highway POE if cash was no longer collected for user fees at primary inspection. The model was created using the program ExtendSim.
The capture of inspection-start times from the BFO are used to create inter-arrival times of commercial vehicles entering primary inspection, randomized using an exponential distribution. Inter-arrival times are averaged by hour, 9 AM to 3 PM, from the four weekdays of data collection (Monday-Thursday) at Pacific Highway in June 2016.
Service rates (the duration of time at primary inspection) at Pacific Highway are collected from the Cascade Gateway Border Data Warehouse for the same four days in June 2016 as the BFO data collection and were randomized based on a best-fit distribution – in this case, a Weibull distribution. The model also assumes three inspection booths are open for the entirety of the six-hour model run (9 AM to 3 PM) and does not factor in any unforeseen or outlier circumstances that would affect inspection times.
[Page 46]

2016 IMTC BORDER FREIGHT OPERATIONS STUDY ▪ CASH COLLECTION ANALYSIS TECHNICAL MEMO
Page
7
The “base” scenario is a re-creation of primary inspections as they might have occurred during those four days in June 2016 based on the available arrival and inspection duration data. The “no cash collection” scenario uses the same inter-arrival times as the base scenario but uses adjusted service rates. From the BFO Pacific Highway data collection it was observed that cash collections occurred 16 percent of the time at primary inspection, and those inspections took on average 66 percent longer. The no cash collection scenario randomly selects 16 percent of inspections in the model and reduces them by the percent decrease in inspection duration from cash collection inspections to non-cash collection inspections – a 40 percent reduction.
Model configuration in ExtendSim
The model records the average amount of time commercial vehicles spend waiting in a line for primary inspection. This mean delay represents the border wait-time. Both scenarios were run several hundred times to ensure that the relative error in the mean delay confidence interval (that is, how unsure the model is of repeatable results) was kept very low.
[Page 47]

2016 IMTC BORDER FREIGHT OPERATIONS STUDY ▪ CASH COLLECTION ANALYSIS TECHNICAL MEMO
Page
8
SCENARIO SIMULATION MODEL MEAN DELAY RESULTS, PACIFIC HIGHWAY POE
The mean delay times for commercial vehicles waiting in line for primary inspection were 54.4 minutes and 44.7 minutes for the base and no cash collection scenarios, respectively. This output represents an estimated 18 percent reduction in commercial border wait-times at Pacific Highway POE when cash is not collected at primary inspection.
Additional Information For addition information on the 2016 Border Freight Operations Study, visit www.theIMTC.com or download the data collection report. Direct comments and questions to following project managers:
JAYMES MCCLAIN Planner I Whatcom Council of Governments (360) 685-8391 [email protected]
MELISSA FANUCCI, AICP Principal Planner Whatcom Council of Governments (360) 685-8388 [email protected]
HUGH CONROY Director of Planning Whatcom Council of Governments (360) 685-8384 [email protected]
BASE
SCENARIO
NO CASH COLLECTION
SCENARIO
Mean Delay (min.) 54.43 44.68 18% reduction
Variance (min.) 85.89 94.78
Standard Deviation (min.) 9.27 9.74
Number of Runs 514 839
Confidence Interval +/- (95% CI) (min.)
0.8 0.66
Relative CI error 0.0148 0.0148
[Page 48]

IMTC Border Freight Operations Study
Cascade Gateway Commercial Carrier Interviews Whatcom Council of Governments November 2017
Introduction The IMTC program, a U.S.-Canadian coalition of government and business entities that identifies and promotes improvements to mobility and security in the Cascade Gateway, has sustained interest in understanding border policy and infrastructure impacts on commercial carrier companies that frequently use the three commercial border crossings in the Cascade Gateway – Pacific Highway, Lynden-Aldergrove, and Sumas-Abbotsford-Huntingdon.
As an element of the IMTC Border Freight Operations Study, the Whatcom Council of Governments (WCOG) interviewed 12 carrier companies that operate in the Cascade Gateway and gathered feedback on a number of border-related topics.
For the privacy of individual carrier companies, raw feedback regarding operations and subjective opinions will not be attributed. There are several themes shared by multiple carrier companies which will be further expanded upon in this document.
Participating Carrier Companies In 2015 and 2016 WCOG and the Border Policy Research Institute (BPRI) at Western Washington University (WWU) organized the observation of freight movements at each Cascade Gateway commercial port-of-entry (POE). Researchers recorded, among other data points, the carrier names of vehicles crossing the border. From a compiled list of carriers, WCOG reached out by phone and email to the most frequently observed crossers.
WCOG and BPRI staff arranged half-hour interviews at each responding carrier company’s office with an administrative representative and gathered their feedback on select border-related topics.
The carrier companies that participated in an interview are presented in the table below. The percentage of border-crossing trips made by these carrier companies relative to all trips observed during the 2015 and 2016 field data collection efforts is also presented.
[Page 49]

CASCADE GATEWAY COMMERCIAL CARRIER SURVEY ▪ IMTC BORDER FREIGHT OPERATIONS STUDY
Page
2
CARRIER COMPANIES INTERVIEWED BY WCOG AND BPRI
Carrier Company Interview Date Office Location Percent of all trip observations
TC Trans 10/8/2015 U.S. 0.91%
Lotus Terminals 10/8/2015 Canada 0.73%
Ludtke Pacific Trucking 12/1/2015 U.S. 0.11%
Cement Distributors Inc. 1/4/2016 Canada 1.20%
Berry & Smith Trucking 2/9/2016 Canada 0.75%
International Parcel Service 2/16/2016 Canada 0.66%
Harlens Trucking 3/15/2016 Canada 0.62%
R S Gill Express 3/15/2016 Canada 0.62%
Cowden Gravel and Ready Mix 6/8/2017 U.S. 0.43%
NW Shippers 7/11/2017 U.S. 0.35%
Bronco Transportation Services 8/29/2017 Canada 0.59%
G.A.S. Enterprises Ltd. 8/30/2017 Canada 0.52%
Total: 7.48%
Questions Asked The questions that carrier representatives were asked during the interview revolved around the following key themes:
• Overview of company profile and history • Status with trusted trader programs • Characterization of business • Geographic range of business • Routing tendencies • Feedback about border-region investments • Feedback about border-region infrastructure and policy changes • Industry technologies being used
Carrier Interview Themes Each carrier company brought to the table their own specific experiences operating in the Cascade Gateway border environment. Though most of the issues discussed were unique to each carrier’s sphere of operations, there were common themes brought up by multiple carriers.
[Page 50]

CASCADE GATEWAY COMMERCIAL CARRIER SURVEY ▪ IMTC BORDER FREIGHT OPERATIONS STUDY
Page
3
Issues with the US CBP ACE system The most common issue, brought up by 5 of the 12 carrier companies, dealt with their interactions with the U.S. Customs and Border Protection’s (US CBP) Automated Commercial Environment (ACE). The ACE system is an online forms submittal system shippers and brokers use to report import entries. Carriers also interact with the ACE system and often provide entry and manifest support for customers.
Though not a top issue for any one carrier interviewed, common complaints surrounded the interface of the ACE system – its lack of auto-filling repeated data elements and general non user-friendliness. Carrier representatives noted that for a workload that often requires making numerous submittals to ACE per day, little issues can add up.
No fallback system for ACE or ACI Like the U.S. ACE system, Canada Border Services Agency’s (CBSA) Advance Commercial Information (ACI) system is the online system carrier companies must use to submit cargo manifests to CBSA before arriving at the border.
Several carrier companies recounted their drivers being delayed at the border when one of the systems experienced technical problems. Both systems are electronic, and there are no hardcopy backup systems for commercial vehicles to use in their place. Vehicles must wait in the border lineup until technical problems are cleared up, which can be detrimental to delivery timetables, carriers noted.
Desire for Lynden and Aldergrove POEs to expand operating hours Interviewers discussed with each carrier representative the new infrastructure and removal of permit requirements at the CBSA Aldergrove POE. Several carriers were unaware of the lifted permit restrictions that allow all commercial vehicles to cross northbound through Aldergrove. US CBP’s adjacent southbound POE at Lynden still requires permits. Permits are typically given to carriers serving the nearby region, though empty vehicles do not require a permit.
There was much interest in the new Aldergrove facilities from the interviewed carriers. However, several noted that the limited hours of operation for both Aldergrove and Lynden (8 a.m. to 12 a.m.) did not fit with their frequent needs to cross earlier in the morning.
FAST lane extension southbound into Pacific Highway POE In talks revolving around congestion at the border, most carriers appeared to have their own mitigation strategies, such as crossing at off-peak times or crossing at specific POEs during times they have observed to be less busy. For the FAST lanes users that were interviewed, a common problem was congestion at the southbound Pacific Highway POE preventing access to the FAST lane.
At US CBP’s Pacific Highway POE, the truck staging area (from where vehicles are green-lighted to approach primary inspection) is accessed by a two lane truck route that connects to Highway 15 by way of 2 Ave. The dedicated FAST lane approach accounts for one of the two truck route lanes. Southbound commercial vehicle lineups build on the truck route and, if long enough, continue to build on Highway
[Page 51]

CASCADE GATEWAY COMMERCIAL CARRIER SURVEY ▪ IMTC BORDER FREIGHT OPERATIONS STUDY
Page
4
15, leaving 2 Ave open for local access. When commercial vehicles are backed up to Highway 15, FAST eligible vehicles must wait until 2 Ave to use the dedicated approach.
Interviewed carriers expressed a desire for extending a dedicated FAST lane along Highway 15 or having better access to the truck route entrance for FAST lane eligible vehicles.
Additional Comments In discussing the geographic ranges of deliveries, carriers who transported goods into and out of Seattle commented on the congestion in the city, especially to the marine terminals. Some equated the congestion as being on par with the border and noted that they schedule trips to miss peak congestion on Seattle freight routes.
There were some concerns about the new Electronic Logging Device (ELD) rule mandated by the U.S. Department of Transportation (USDOT) and supported by Transport Canada. Commercial drivers in the U.S. (whether of U.S. or out-of-country origin) now must have their driving hours tracked electronically rather than on paper logs in an effort to improve safety and compliance. For Canadian cross-border carriers, the concern is that border delays could prevent drivers from getting home if they are bumping up against their allotted hours of operation. Where paper logbooks may have provided some flexibility, more drivers may have to park and sleep on the U.S. side of the border.
All carriers interviewed no longer pay the inspection fees at US CBP POEs by cash. Each carrier uses the Decal/Transponder Online Procurement System (DTOPS) – 11 using transponders and 1 using decals. This removes the cash exchange process from inspection, reducing inspection times. US CBP is currently phasing out cash payments at inspection booths.
While several carrier companies pointed out specific border infrastructure preferences relative to their own operations, there was general satisfaction with border crossings and the border region transportation network. Several carrier representatives gave positive comments on the southbound Pacific Highway truck staging area, and most indicated an understanding of the many variables that contribute to border congestion.
When asked about any plans to potentially expand operations, almost all carriers noted that their business was steady. Expansion plans that were discussed were conservative and incremental. No carrier interviewed expressed a negative outlook for their business or cross-border commerce in general.
[Page 52]

CASCADE GATEWAY COMMERCIAL CARRIER SURVEY ▪ IMTC BORDER FREIGHT OPERATIONS STUDY
Page
5
For More Information For addition information on the IMTC Border Freight Operations Study, visit www.theIMTC.com or download the data collection report. Direct comments and questions to following project managers:
JAYMES MCCLAIN Planner I Whatcom Council of Governments (360) 685-8391 [email protected]
MELISSA FANUCCI, AICP Principal Planner Whatcom Council of Governments (360) 685-8388 [email protected]
HUGH CONROY Director of Planning Whatcom Council of Governments (360) 685-8384 [email protected]
[Page 53]

IMTC Border Freight Operations Study
Pacific Highway Commercial Vehicle Arrival Time Trends Whatcom Council of Governments September 2017
This analysis was performed in response to border-agencies’ sense that commercial carrier companies were choosing different times to make their cross-border trips – not only as a strategy to avoid peak congestion at the border but perhaps even more to avoid peak congestion in the urban centers of Seattle and Vancouver.
To answer this question, commercial vehicle count data was queried from the Cascade Gateway Border Data Warehouse – specifically count data from the furthest back loop detector in the approach lanes – a count location that can also be considered an arrival rate.
Data was queried by calendar quarter for 2013, 2015, and 2017. Within each quarter, hourly commercial vehicle arrival counts were averaged by day of week.
The charts below are arranged so that years can be compared across calendar quarters.
Data note While the loop detectors installed for the border wait-time system provide a complete time series of counts from a location that can be more appropriately used as an arrival rate, loop detectors are known to undercount vehicles – especially in locations where vehicles are moving slowly and close together. Thus, each quarter’s total vehicle count from the loop data is shown as an annotation to the chart in green and the same quarter’s monthly count data from the inspection agency is shown in blue. Clearly the loops are missing a lot of commercial vehicles. However, for this analysis, it is assumed that the relative portrayal of arrival rates over time is still informative and a valid basis for comparison.
Northbound charts for the first and second quarter of 2015 show an overall increase in volume observed. This turns out to be a time when loop detectors were being replaced as part of a repaving project, so some unknown influence is expected to be at play here. The patterns of hourly distributions do not seem any more questionable though.
Conclusions Overall there do not seem to be any noticeable, sustained shifts in border arrival times of commercial vehicles in either direction. Some examples of quarter to quarter changes are:
• Northbound Q2 2015 to Q2 2017: Variation in weekday volumes seem to increase. • Southbound Q1 2015 to Q1 2017: Midday weekend volumes push up into levels more typical of
weekday volumes. • Southbound Q2 2015 to Q2 2017: More midday weekday volume except for Friday which was as
high in 2015 (less of a saddle). Also, as observed above for Q1s, there is more weekend midday volume in Q2 2017.
• Southbound Q3 2013 to Q3 2015: Weekend volume down a little – more so Sunday.
[Page 54]
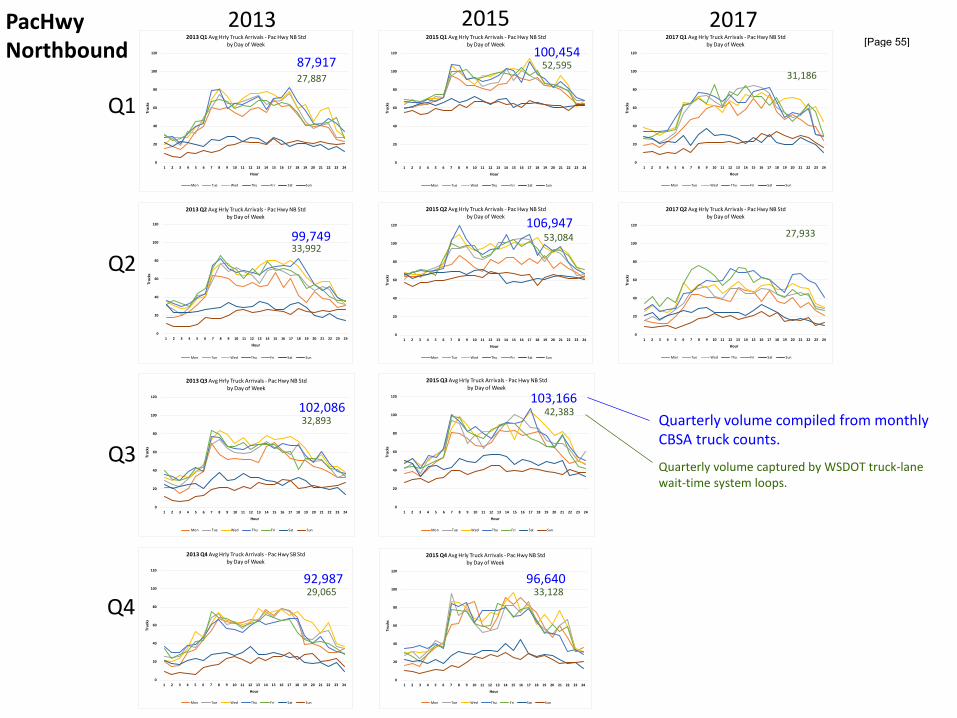
0
20
40
60
80
100
120
1 2 3 4 5 6 7 8 9 10 11 12 13 14 15 16 17 18 19 20 21 22 23 24
Truc
ks
Hour
2015 Q4 Avg Hrly Truck Arrivals - Pac Hwy NB Stdby Day of Week
Mon Tue Wed Thu Fri Sat Sun
0
20
40
60
80
100
120
1 2 3 4 5 6 7 8 9 10 11 12 13 14 15 16 17 18 19 20 21 22 23 24
Truc
ks
Hour
2015 Q3 Avg Hrly Truck Arrivals - Pac Hwy NB Stdby Day of Week
Mon Tue Wed Thu Fri Sat Sun
0
20
40
60
80
100
120
1 2 3 4 5 6 7 8 9 10 11 12 13 14 15 16 17 18 19 20 21 22 23 24
Truc
ks
Hour
2015 Q2 Avg Hrly Truck Arrivals - Pac Hwy NB Stdby Day of Week
Mon Tue Wed Thu Fri Sat Sun
0
20
40
60
80
100
120
1 2 3 4 5 6 7 8 9 10 11 12 13 14 15 16 17 18 19 20 21 22 23 24
Truc
ks
Hour
2015 Q1 Avg Hrly Truck Arrivals - Pac Hwy NB Stdby Day of Week
Mon Tue Wed Thu Fri Sat Sun
0
20
40
60
80
100
120
1 2 3 4 5 6 7 8 9 10 11 12 13 14 15 16 17 18 19 20 21 22 23 24
Truc
ks
Hour
2013 Q4 Avg Hrly Truck Arrivals - Pac Hwy SB Stdby Day of Week
Mon Tue Wed Thu Fri Sat Sun
0
20
40
60
80
100
120
1 2 3 4 5 6 7 8 9 10 11 12 13 14 15 16 17 18 19 20 21 22 23 24
Truc
ks
Hour
2013 Q3 Avg Hrly Truck Arrivals - Pac Hwy NB Stdby Day of Week
Mon Tue Wed Thu Fri Sat Sun
0
20
40
60
80
100
120
1 2 3 4 5 6 7 8 9 10 11 12 13 14 15 16 17 18 19 20 21 22 23 24
Truc
ks
Hour
2013 Q2 Avg Hrly Truck Arrivals - Pac Hwy NB Stdby Day of Week
Mon Tue Wed Thu Fri Sat Sun
0
20
40
60
80
100
120
1 2 3 4 5 6 7 8 9 10 11 12 13 14 15 16 17 18 19 20 21 22 23 24
Truc
ks
Hour
2013 Q1 Avg Hrly Truck Arrivals - Pac Hwy NB Stdby Day of Week
Mon Tue Wed Thu Fri Sat Sun
87,917
99,749
102,086
92,987
100,454
106,947
103,166
96,640
2013 2015 2017
Q1
Q2
Q3
Q4
0
20
40
60
80
100
120
1 2 3 4 5 6 7 8 9 10 11 12 13 14 15 16 17 18 19 20 21 22 23 24
Truc
ks
Hour
2017 Q1 Avg Hrly Truck Arrivals - Pac Hwy NB Stdby Day of Week
Mon Tue Wed Thu Fri Sat Sun
0
20
40
60
80
100
120
1 2 3 4 5 6 7 8 9 10 11 12 13 14 15 16 17 18 19 20 21 22 23 24
Truc
ks
Hour
2017 Q2 Avg Hrly Truck Arrivals - Pac Hwy NB Stdby Day of Week
Mon Tue Wed Thu Fri Sat Sun
PacHwyNorthbound
27,887
33,992
32,893
29,065
52,595
53,084
42,383
33,128
31,186
27,933
Quarterly volume compiled from monthlyCBSA truck counts.
Quarterly volume captured by WSDOT truck-lanewait-time system loops.
[Page 55]

2013 2015 2017
Q1
Q2
Q3
Q4
PacHwySouthbound
0
20
40
60
80
100
120
1 2 3 4 5 6 7 8 9 10 11 12 13 14 15 16 17 18 19 20 21 22 23 24
Truc
ks
Hour
2013 Q1 Avg Hrly Truck Arrivals - Pac Hwy SB Stdby Day of Week
Mon Tue Wed Thu Fri Sat Sun
0
20
40
60
80
100
120
1 2 3 4 5 6 7 8 9 10 11 12 13 14 15 16 17 18 19 20 21 22 23 24
Truc
ks
Hour
2013 Q2 Avg Hrly Truck Arrivals - Pac Hwy SB Stdby Day of Week
Mon Tue Wed Thu Fri Sat Sun
0
20
40
60
80
100
120
1 2 3 4 5 6 7 8 9 10 11 12 13 14 15 16 17 18 19 20 21 22 23 24
Truc
ks
Hour
2013 Q3 Avg Hrly Truck Arrivals - Pac Hwy SB Stdby Day of Week
Mon Tue Wed Thu Fri Sat Sun
0
20
40
60
80
100
120
1 2 3 4 5 6 7 8 9 10 11 12 13 14 15 16 17 18 19 20 21 22 23 24
Truc
ks
Hour
2013 Q4 Avg Hrly Truck Arrivals - Pac Hwy SB Stdby Day of Week
Mon Tue Wed Thu Fri Sat Sun
0
20
40
60
80
100
120
1 2 3 4 5 6 7 8 9 10 11 12 13 14 15 16 17 18 19 20 21 22 23 24
Truc
ks
Hour
2015 Q1 Avg Hrly Truck Arrivals - Pac Hwy SB Stdby Day of Week
Mon Tue Wed Thu Fri Sat Sun
0
20
40
60
80
100
120
1 2 3 4 5 6 7 8 9 10 11 12 13 14 15 16 17 18 19 20 21 22 23 24
Truc
ks
Hour
2015 Q2 Avg Hrly Truck Arrivals - Pac Hwy SB Stdby Day of Week
Mon Tue Wed Thu Fri Sat Sun
0
20
40
60
80
100
120
1 2 3 4 5 6 7 8 9 10 11 12 13 14 15 16 17 18 19 20 21 22 23 24
Truc
ks
Hour
2015 Q3 Avg Hrly Truck Arrivals - Pac Hwy SB Stdby Day of Week
Mon Tue Wed Thu Fri Sat Sun
0
20
40
60
80
100
120
1 2 3 4 5 6 7 8 9 10 11 12 13 14 15 16 17 18 19 20 21 22 23 24
Truc
ks
Hour
2015 Q4 Avg Hrly Truck Arrivals - Pac Hwy SB Stdby Day of Week
Mon Tue Wed Thu Fri Sat Sun
0
20
40
60
80
100
120
1 2 3 4 5 6 7 8 9 10 11 12 13 14 15 16 17 18 19 20 21 22 23 24
Truc
ks
Hour
2017 Q1 Avg Hrly Truck Arrivals - Pac Hwy SB Stdby Day of Week
Mon Tue Wed Thu Fri Sat Sun
0
20
40
60
80
100
120
1 2 3 4 5 6 7 8 9 10 11 12 13 14 15 16 17 18 19 20 21 22 23 24
Truc
ks
Hour
2017 Q2 Avg Hrly Truck Arrivals - Pac Hwy SB Stdby Day of Week
Mon Tue Wed Thu Fri Sat Sun
93,575
100,461
95,812
88,899
85,510
90,969
90,234
85,270
88,718
36,535
41,341
40,645
36,187
32,856
44,755
42,116
40,237
39,948
49,605
Quarterly volume compiled from monthlyCBP truck counts.
Quarterly volume captured by BCMoTI truck-lanewait-time system loops.
[Page 56]

IMTC Border Freight Operations Study
Lynden-Aldergrove Routing Analysis Whatcom Council of Governments September 2017
Data summarized in the following charts are sourced from U.S. Customs and Border Protection (US CBP) and Canada Border Services Agency (CBSA) (for 2016 volume data) and the 2016 IMTC Border Freight Operations study (BFO) data collection effort (for origin and destination data).
This analysis was completed in response to interest in monitoring the extent to which the recently expanded CBSA port-of-entry (POE) at Aldergove may be attracting commercial vehicles for which the most direct route would go through the Pacific Highway POE but were diverting to Aldergrove (or Lynden for U.S. bound trips) to avoid longer wait times at Pacific Highway. To investigate this question WCOG used origin and destination (O-D) data collected from truck drivers as part of the BFO study.
Overall Cascade Gateway commercial vehicle trip distribution As seen in the chart below, the Pacific Highway POE serves the majority of regional cross-border commercial vehicle trips. Aldergrove-Lynden serves the smallest share currently but this share is expected to grow as population and commercial development continues eastward in Lower Mainland B.C. It’s also important to point out that of the three commercial ports, Aldergrove-Lynden is the only one not open 24 hours. It is open from 8:00 AM to 12:00 AM.
Volume and share of commercial vehicles by POE in the Cascade Gateway, 2016
From US CBP and CBSA
0
50,000
100,000
150,000
200,000
250,000
300,000
350,000
400,000
Pac Hwy Aldergrove-Lynden AbbHnt-Sumas
2016 Cascade Gateway Truck Counts
Northbound
Southbound
72% 64% 7% 8% 21% 28%
With % of directional total
[Page 57]

IMTC BORDER FREIGHT OPERATIONS STUDY ▪ LYNDEN-ALDERGROVE ROUTING ANALYSIS
Overall origin destination matrices As part of BFO data post-processing, driver-reported city-level O-D data was aggregated by superzones. The O-D matrices for Lynden-Aldergrove northbound and southbound crossings are below. The superzone trip percentages are sufficient for estimating the shares of commercial vehicles for which Lynden-Aldergrove is the most direct route between origin and destination or not.
Lynden POE and Aldergrove POE share of commercial vehicle trips by origin and destination superzone
From the 2015/16 IMTC Border Freight Operations Study Data Collection Report
[Page 58]

IMTC BORDER FREIGHT OPERATIONS STUDY ▪ LYNDEN-ALDERGROVE ROUTING ANALYSIS
Northbound diversions estimate The annotated northbound Aldergrove O-D matrix below helps illustrate the analysis.
Northbound (Canada bound) commercial vehicles destined for Eastern Lower Mainland (circled in blue) would be logically best served by the more easterly Aldergrove crossing. So, an estimated 71 percent of trips are on the shortest path.
Next, northbound commercial vehicles destined for Western Lower Mainland (circled in red), depending on where they originated, could be on a diversionary route. Using city-level origin data, the table below the O-D matrix separates out commercial vehicles that originated from locations closer to the Aldergrove POE than to the Pacific Highway POE – trips for which the Aldergrove POE could still be the shortest route. This last step estimates that the most direct route for 55 percent of West Lower Mainland destined trips would have been via Pacific Highway. Overall, an estimated 15 percent of northbound commercial vehicles at Aldergrove are likely avoiding congestion at Pacific Highway.
Aldergrove POE origin and destination routing analysis
From the 2015/16 IMTC Border Freight Operations Study Data Collection Report
[Page 59]

IMTC BORDER FREIGHT OPERATIONS STUDY ▪ LYNDEN-ALDERGROVE ROUTING ANALYSIS
Southbound diversions estimate As for southbound, an annotated matrix and table are shown below.
Southbound (U.S. bound) commercial vehicles originating from Eastern Lower Mainland (circled in blue) would be logically best served by the more easterly Aldergrove crossing. So, an estimated 51.5 percent of trips are on the shortest path.
Next, southbound commercial vehicles originating from Western Lower Mainland (circled in red), depending on where they are destined for, could be on a diversionary route. Using city-level origin data, the table below the O-D matrix separates out commercial vehicles that are destined for locations closer to the Lynden POE than to the Pacific Highway POE – trips for which the Lynden POE could still be the shortest route. This last step estimates that the most direct route for 67 percent of trips originating in West Lower Mainland would have been via Pacific Highway. Overall, an estimated 30 percent of southbound commercial vehicles at Lynden are likely avoiding congestion at Pacific Highway.
Lynden POE origin and destination routing analysis
From the 2015/16 IMTC Border Freight Operations Study Data Collection Report
[Page 60]
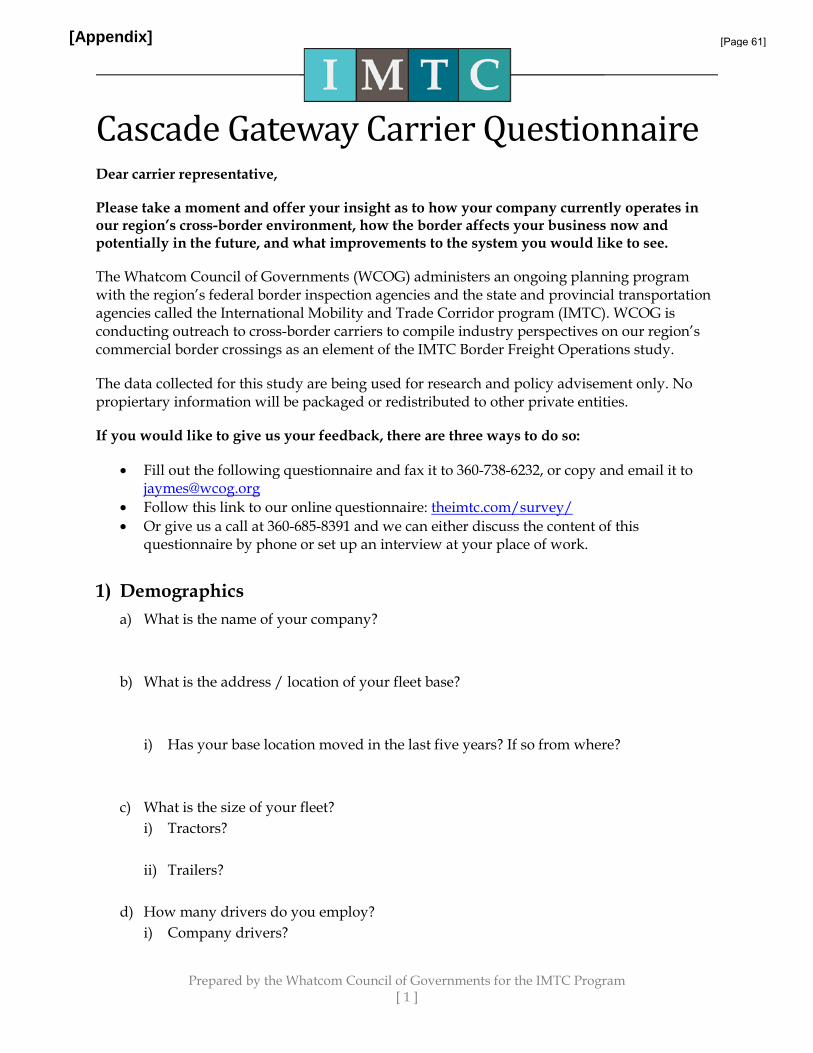
Prepared by the Whatcom Council of Governments for the IMTC Program [ 1 ]
Cascade Gateway Carrier Questionnaire Dear carrier representative,
Please take a moment and offer your insight as to how your company currently operates in our region’s cross-border environment, how the border affects your business now and potentially in the future, and what improvements to the system you would like to see.
The Whatcom Council of Governments (WCOG) administers an ongoing planning program with the region’s federal border inspection agencies and the state and provincial transportation agencies called the International Mobility and Trade Corridor program (IMTC). WCOG is conducting outreach to cross-border carriers to compile industry perspectives on our region’s commercial border crossings as an element of the IMTC Border Freight Operations study.
The data collected for this study are being used for research and policy advisement only. No propiertary information will be packaged or redistributed to other private entities.
If you would like to give us your feedback, there are three ways to do so:
• Fill out the following questionnaire and fax it to 360-738-6232, or copy and email it to [email protected]
• Follow this link to our online questionnaire: theimtc.com/survey/ • Or give us a call at 360-685-8391 and we can either discuss the content of this
questionnaire by phone or set up an interview at your place of work.
1) Demographics a) What is the name of your company?
b) What is the address / location of your fleet base? i) Has your base location moved in the last five years? If so from where?
c) What is the size of your fleet? i) Tractors?
ii) Trailers?
d) How many drivers do you employ? i) Company drivers?
[Appendix] [Page 61]

Prepared by the Whatcom Council of Governments for the IMTC Program [ 2 ]
ii) Owner-operators?
e) How long has your company been in business / under current management team?
f) Is your company a member of any trusted trader programs? i) C-T PAT
ii) PIP
iii) CSA
iv) If enrolled in trusted trader programs, what share of your current customers
(importers) are enrolled in C-T PAT or CSA?
v) What percentage of your company’s drivers have FAST cards?
g) Characterization of business
i) What type(s) of vehicle do you use for hauling goods (including trailer types)?
ii) What kind of commodities does your company haul?
iii) Do your trucks connect to any other modes? For example, do you interface with
marine terminals, rail yards, or air freight?
[Page 62]

Prepared by the Whatcom Council of Governments for the IMTC Program [ 3 ]
2) Current cross-border activity a) Which commercial vehicle crossings does your company use?
i) Northbound?
ii) Southbound?
b) Are your trucks empty when crossing a certain direction?
i) Estimated percent of trips loaded into Canada?
ii) Estimated percent of trips loaded into the U.S.?
c) What percentage of your loaded cross-border trips are less-than-truckload (LTL)?
d) Where are the primary locations of your customers / load locations? i) In Canada?
ii) In the U.S.?
e) Where are the primary locations of your deliveries? i) In Canada?
ii) In the U.S.?
[Page 63]

Prepared by the Whatcom Council of Governments for the IMTC Program [ 4 ]
f) Have customer or delivery locations changed over the last five-ten years? If so, from where to where?
g) What has changed with the transportation network and border operations, for good or bad, over the same time?
3) What are the priority improvements that could be made to cross-border transportation infrastructure or operations today?
4) What are upcoming changes or future trends that you think upcoming public investments need to be responding to?
a) How has/how will expanded commercial processing capacity at Aldergrove affect your business / trip routing and choice of border crossing?
[Page 64]

Prepared by the Whatcom Council of Governments for the IMTC Program [ 5 ]
b) Are the crossing locations your company uses a choice of the dispatcher/driver or
dictated by the broker (when loaded)?
c) The U.S. and Canada are considering decoupling elements of trusted trader programs. Will that affect your decisions to participate or change the way you currently use the programs?
d) Does your company have any expansion plans in the near term? E.g. fleet, geography, etc.
5) Technology a) On cross-border trips into the U.S., does your company pay fees via transponder or cash
payments per trip?
b) Does your company use GPS fleet management in all its vehicles?
c) Do your trucks have emissions control technologies? Are they standard with the truck, or are they company-implemented?
d) Are there technologies you’ve adopted or are planning to that offer cross-border efficiencies (and might represent an emerging trend that should be considered)?
Thank you for your participation! If you would like to know more about the IMTC, the Border Freight Operations study, or have questions about this questionnaire, please contact:
JAYMES MCCLAIN Whatcom Council of Governments (360) 685-8391 [email protected]
[Page 65]