The importance of product reformulation versus consumer ...
37
The importance of product reformulation versus consumer choice in improving diet quality IFS Working Paper W14/15 Rachel Griffith Martin O’Connell Kate Smith
Transcript of The importance of product reformulation versus consumer ...
The importance of product reformulation versus consumer choice in improving diet quality
IFS Working Paper W14/15
Rachel Griffith Martin O’Connell Kate Smith

The Institute for Fiscal Studies (IFS) is an independent research institute whose remit is to carry out
rigorous economic research into public policy and to disseminate the findings of this research. IFS
receives generous support from the Economic and Social Research Council, in particular via the ESRC
Centre for the Microeconomic Analysis of Public Policy (CPP). The content of our working papers is
the work of their authors and does not necessarily represent the views of IFS research staff or
affiliates.

The importance of product reformulation versus
consumer choice in improving diet quality
Rachel Griffith, Martin O’Connell and Kate Smith∗
July 23, 2014
Abstract
Improving diet quality has been a major target of public health policy. Governments
have encouraged consumers to make healthier food choices and firms to reformulate
food products. Evaluation of such policies has focused on the impact on consumer
behaviour; firm behaviour has been less well studied. We study the recent decline in
dietary salt intake in the UK, and show that it was entirely attributable to product
reformulation by firms; a contemporaneous information campaign had little impact,
consumer switching between products in fact worked in the opposite direction and led
to a slight increase in the salt intensity of groceries purchased. These findings point to
the important role that firms can play in achieving public policy goals.
Keywords: nutrition, reformulation, regulation, salt reductionJEL classification: D1, D2, I1, L5Acknowledgements: The authors gratefully acknowledge financial support from theEuropean Research Council (ERC) under ERC-2009-AdG grant agreement number249529, and the Economic and Social Research Council (ESRC) under the Centre forthe Microeconomic Analysis of Public Policy (CPP), grant number RES-544-28-0001,and under the Open Research Area (ORA) grant number ES/I012222/1.
∗Griffith is at the Institute for Fiscal Studies and University of Manchester, O’Connell is at the Institute forFiscal Studies and University College London and Smith is at the Institute for Fiscal Studies and UniversityCollege London. Correspondence: [email protected], martin [email protected] and kate [email protected].
1

1 Introduction
There is widespread concern in the developed world about the increased prevalence of health
conditions linked to poor diet. Many governments have introduced policies that aim to
improve diet quality, yet little is known about the relative effectiveness of these different
policies (Gortmaker et al. (2011)). Two popular forms of intervention are information cam-
paigns targeted at consumers, and policies that encourage voluntary product reformulation
by firms.
In this paper we directly compare the effectiveness of these two policies in a specific
setting. In 2005 the UK government introduced an information campaign, which aimed at
raising awareness of the consequences of high salt consumption, and they also encouraged
the food industry to voluntarily reformulate food products to reduce their salt content.
Subsequent to these two policies we have seen substantial reductions in salt intake. Previous
work has attributed this reduction to the information campaign (Shankar et al. (2013) and
Food Standards Agency (2010)); however, that work did not account for the concurrent
reformulation policy. We provide the first evidence on the relative impact of targeting
consumer choice through information provision versus encouraging voluntary reformulation.
We show that the actions of firms were crucial in driving changes in the average salt content
of British groceries; studies that neglect them incorrectly measure the impact of public health
campaigns. Using longitudinal data on the contents of the grocery baskets of a nationally
representative sample of households we show that the average salt content fell by 5.1%, from
0.370g in 2005 to 0.351g in 2011. This decline was entirely due to the reformulation of
food products by manufacturers. Reformulation of processed food and grains (bread and
breakfast cereals) together contributed over three-quarters of the decline.
Consumer information campaigns have been used in many countries to promote fruit and
vegetable consumption (Stables et al. (2002)), reduce saturated fat and alcohol consumption
2

(Department of Health (2008)) and encourage the switch to less fatty milk (Reger et al.
(1999)). Voluntary regulations have been used to improve the nutritional quality of children’s
breakfast cereals in the US (Zhu et al. (2012)), to reduce the portion size of beverages and
food in US schools, and to encourage food labelling (Sharma et al. (2010)). Policies that
aim to reduce salt intake have been used by governments around the world. The European
Union has targeted a 16% reduction in the salt levels of processed foods, while the UK and
US governments have set targets for the salt level of specific food categories. Similar salt
reduction initiatives have been implemented in 31 countries (Webster et al. (2011)).
The reduction in dietary salt intake in the UK has been documented in a number of
studies that use 24-hour urinary sodium tests, reported in the Health Survey for England.
Figure 1.1 uses these data to show the distribution of salt intake per person per day in
2005 and 2010. Mean intake fell and there was a statistically significant shift to the left in
the entire distribution; in 2005 around 65% of individuals were above the UK government’s
target of 6g of salt per person per day, by 2010 this had fallen to 60%. The bottom part of
the figure shows that the largest difference in the distributions arises in the region just above
the 6g targeted intake. In this paper we are interested in how much of this reduction is due
to consumers switching to lower salt products and how much is due to firms reformulating
food products to reduce the salt content; we show that it is entirely due to the latter effect.
3

Figure 1.1: Dietary salt intake
0.2
.4.6
.81
Cum
ulat
ive
dens
ity
0 5 6 10 15 20
2005
2010.1
.05
0D
iffer
ence
0 5 6 10 15 20Salt intake (g per person per day)
Difference
95% confidence interval
Notes: Dietary salt intake is measured using 24-hour urinary sodium tests for 4,468 individuals in 2005 and
4,718 individuals in 2010. The empirical CDF is constructed using K=10 test points. The 95% confidence
interval around the difference is constructed using bootstrapping techniques (50 replications). The critical
value used to construct the confidence interval are from the Studentised maximum modulus (SMM) distribu-
tion with K and infinite degrees of freedom where K=10 is the number of test points. We truncate the graph
at 20g; 2.5% of individuals recorded salt levels higher than 20g per day.
Our work is related to a number of literatures. There has been much research into the role
of information provision in changing consumer behaviour. Governments have traditionally
favoured information campaigns, because they are relatively inexpensive, directly target the
perceived market failure, and they leave choice in the hands of individuals. This type of policy
is predicated on the idea that consumers will make healthy food choices, but they simply
lack the necessary information to do so. Some studies have found that nutrition labeling has
a moderate impact on calorie purchases (see, inter alia, Bassett et al. (2008), Bollinger et al.
4
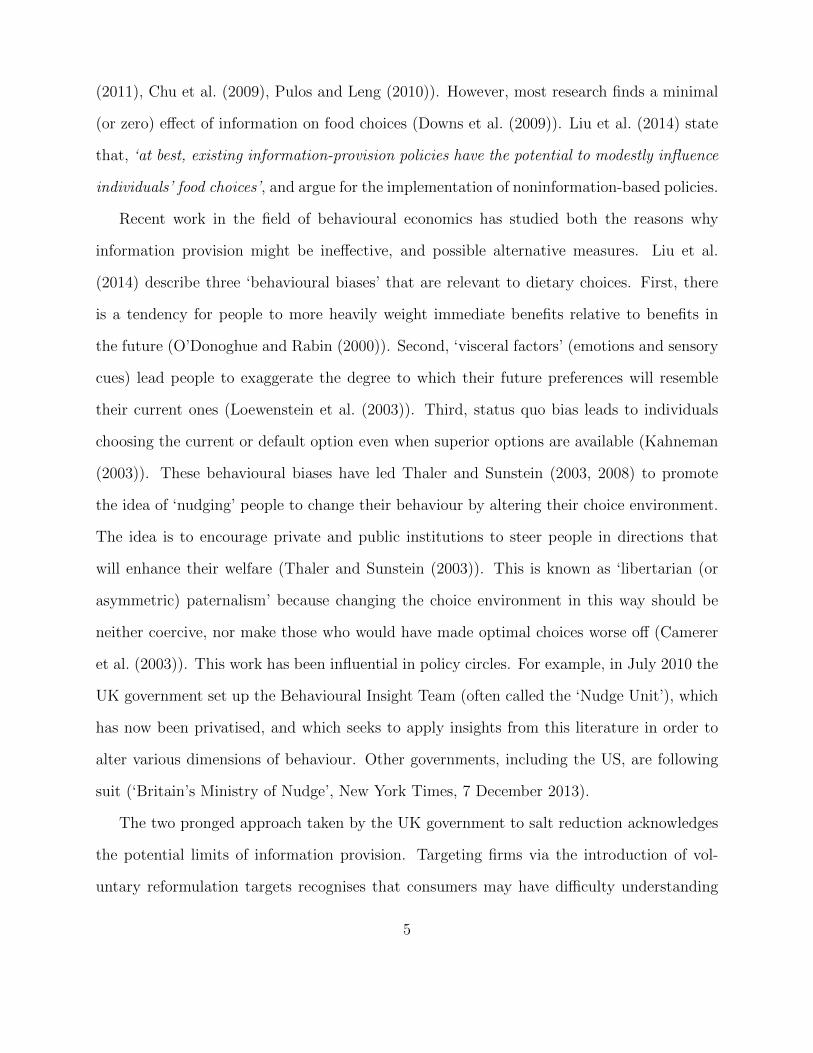
(2011), Chu et al. (2009), Pulos and Leng (2010)). However, most research finds a minimal
(or zero) effect of information on food choices (Downs et al. (2009)). Liu et al. (2014) state
that, ‘at best, existing information-provision policies have the potential to modestly influence
individuals’ food choices’, and argue for the implementation of noninformation-based policies.
Recent work in the field of behavioural economics has studied both the reasons why
information provision might be ineffective, and possible alternative measures. Liu et al.
(2014) describe three ‘behavioural biases’ that are relevant to dietary choices. First, there
is a tendency for people to more heavily weight immediate benefits relative to benefits in
the future (O’Donoghue and Rabin (2000)). Second, ‘visceral factors’ (emotions and sensory
cues) lead people to exaggerate the degree to which their future preferences will resemble
their current ones (Loewenstein et al. (2003)). Third, status quo bias leads to individuals
choosing the current or default option even when superior options are available (Kahneman
(2003)). These behavioural biases have led Thaler and Sunstein (2003, 2008) to promote
the idea of ‘nudging’ people to change their behaviour by altering their choice environment.
The idea is to encourage private and public institutions to steer people in directions that
will enhance their welfare (Thaler and Sunstein (2003)). This is known as ‘libertarian (or
asymmetric) paternalism’ because changing the choice environment in this way should be
neither coercive, nor make those who would have made optimal choices worse off (Camerer
et al. (2003)). This work has been influential in policy circles. For example, in July 2010 the
UK government set up the Behavioural Insight Team (often called the ‘Nudge Unit’), which
has now been privatised, and which seeks to apply insights from this literature in order to
alter various dimensions of behaviour. Other governments, including the US, are following
suit (‘Britain’s Ministry of Nudge’, New York Times, 7 December 2013).
The two pronged approach taken by the UK government to salt reduction acknowledges
the potential limits of information provision. Targeting firms via the introduction of vol-
untary reformulation targets recognises that consumers may have difficulty understanding
5

nutrition information and may lack the motivation to make use of it. As a result, reformu-
lation allows for the possibility of changing the salt intake of people who may be the most
reluctant to changing their behaviour in response to more information. Our results provide
evidence that this is the case. Households in the lowest socioeconomic groups purchase the
most salt (per person). We show that the salt intensity of the grocery purchases of house-
holds in this group declined, but that this was entirely attributable to product reformulation.
In fact, the products that these households chose to put in their shopping basket were more
salt intensive than the average, and so acted to increase the saltiness of their groceries.
Also relevant to our work is the literature that studies the role of regulation (see, inter
alia, Stigler (1961), Becker (1983)). Maxwell et al. (2000) extend this work by modeling
self -regulation, and find that an increased threat of government regulation induces firms
to voluntarily reduce their pollution emissions. They also find that if voluntary regulation
occurs, it represents a Pareto improvement over the status quo. Glazer and McMillan (1992)
show that the threat of price regulation may induce a monopolist to price below the un-
regulated monopoly level, while Braeutigam and Quirk (1984) analyse models in which a
regulated firm voluntarily reduces its price to avoid a rate review that would cut rates even
further. However, Sharma et al. (2010) argue that the track record of self-regulation is highly
variable across different industries. Our work suggests that in the food industry voluntary
regulation backed by an implicit threat of mandatory intervention may be an effective way
of achieving dietary improvements.
The rest of the paper is structured as follows: Section 2 describes the salt reduction
programme implemented in the UK. Section 3 sets out how we separate the effects of product
reformulation from consumer switching and describes the data we use. Section 4 presents
our results, and a final section summarises and concludes.
6

2 UK Policy Reforms
In 2003 the UK government set a target of reducing the average salt intake of adults to 6g
per day, following the recommendation by the Scientific Committee on Nutrition (Scientific
Advisory Committee on Nutrition (2003)). The World Health Organisation recommends
a target of 5g per adult per day, and He and MacGregor (2003) argue that 3g per adult
per day would be an ideal target. Similar targets have been adopted in other countries,
including targets of 8g per day in the US and 6g per day in France. At the time of adoption
the average adult daily salt intake in the UK was 9.5g (Food Standards Agency (2009)).
The UK government’s strategy for achieving the target comprised two components. The
government encouraged voluntary product reformulation by the food industry to reduce the
salt content of the food products they offered, and simultaneously ran a consumer awareness
campaign that highlighted the negative health risks associated with high salt intake.
Voluntary product reformulation was encouraged by the UK Food Standards Agency
(FSA), which set target levels for specific groups of food products (e.g. bread, bacon, sand-
wiches, ketchup, breakfast cereal). The FSA initially focused on food products bought for
consumption at home, as this is the source of the majority of dietary salt (Food Standards
Agency (2008)). Since 2008, the FSA has worked with the catering industry to secure volun-
tary commitments on healthier catering generally, but it only introduced specific salt targets
in 2013 (Food Standards Agency (2013)).
The first set of targets were published in 2006, with the aim that firms work towards
complying with them by 2010 (Food Standards Agency (2009)). A revised set of targets was
published in 2009 (with a compliance date of 2010-2012), and a second set of revised targets
were published in 2014 with the idea that firms will work towards meeting them by the end
of 2017. The targets are voluntary. There was no explicitly stated punishment to be applied
7

to firms who failed to comply, although there was an implicit threat that failure to comply
might run the risk of the government introducing mandatory targets.1
The targets came in two forms - either an average salt content was set for a food group
(e.g. bread), or a maximum salt content was set for any individual product in that food
group. The FSA preferred to set maximum targets, but after consultation with major
food manufacturers and retailers, it agreed to use average targets for some food groups (for
which it was argued that technological constraints meant that getting all products below a
maximum was infeasible). Processed food was specifically targeted; this group contributes
the most salt to people’s diets, and the manufacturing process offers the scope to reduce the
salt intensity through reformulation. The FSA also funded research in partnership with the
industry to better understand the best ways to reduce the salt content of certain products,
for example bread and meat.
Concurrent with the reformulation efforts, the government ran a public awareness cam-
paign. This was designed to highlight the potential consequences of high salt intake and give
guidance to consumers on how to lower their salt intake. The campaign ran between October
2004 and October 2009 and was targeted at women aged between 35 and 65. Although men
are more likely to suffer from heart disease and stroke (two of the main consequences of
eating too much salt), the FSA considered women of this age to be the ‘gatekeepers’ with
regard to buying and preparing food. A range of media was used to deliver the message,
including radio, TV and press advertising, as well as news coverage (Food Standards Agency
(2010)). The FSA also worked with the supermarkets; for example, Asda and the Co-op
broadcast FSA radio advertisements in-store. In addition, during this period some super-
markets and manufacturers introduced front-of-pack labeling that indicated the salt content
of food products.
1A policy muted by the opposition Labour party, see http://www.bbc.co.uk/news/health-20914685.
8

The FSA has undertaken its own evaluation of its efforts to reduce salt intake (Food
Standards Agency (2008)). Its fieldwork found that the average amount of salt in branded
pre-packed sliced bread, soups and cooking sauces was reduced by around a third, with
reductions of around 43% in branded breakfast cereals. Many of the large firms made
significant reductions in the salt content of their products: for example, Unilever reduced
salt in its pot noodle range by 50% and PepsiCo reduced salt across its snacks and crisps
range by up to 55%. The FSA have also emphasised the apparent success of the information
campaign (Food Standards Agency (2010)). After the third stage of the campaign (in 2008),
their evaluation suggested that (i) the number of consumers cutting down on salt increased
by as much as one-third, (ii) there was a ten-fold increase in awareness of the 6g-a-day
message and (iii) the number of consumers trying to cut down on salt by checking labels
doubled since the beginning of the campaign.
We assess the impact of both the voluntary product reformulations and consumer substi-
tution across products on the saltiness of grocery purchases. Our results suggest there was
little substitution by consumers towards lower salt products; rather the reduction in dietary
salt was driven by reformulation of products.
3 Method and Data
3.1 Method
We are interested in studying the relative effect of policies that encourage product refor-
mulation by firms versus those aimed at informing consumers of the dangers of high salt
intake. To do this we decompose the change in the salt intensity of the groceries purchased
by households between 2005 and 2011 into the part due to reformulation of existing products,
9

the part due the introduction and discontinuation of products and the part attributable to
consumer switching across products.2
Let St denote the salt intensity (grams of salt per 100 grams) of groceries purchased in
year t; this is given by:
St =∑i
witsit (3.1)
where i indexes individual food products (e.g. Kellogg’s Cornflakes), wit denotes the quantity
share of all grocery purchases accounted for by product i and sit denotes the salt content
(grams per 100 grams) of product i.
We partition the set of products into three groups: ‘introduced products’, denoted by the
set N , are products that are purchased in the current year but not previously ever purchased,
‘discontinued products’, denoted by the set X, are products purchased in previous years but
not purchased in the current or any future year, and ‘continuous products’, denoted by C,
are products purchased in a previous and the current year. Define the change in the salt
intensity of groceries as ∆St ≡ St − St−1.
The decomposition is given by:
∆St =∑i∈C
wit−1∆sit︸ ︷︷ ︸Reformulation
+∑i∈N
wit(sit − St−1) −∑i∈X
wit−1(sit−1 − St−1)︸ ︷︷ ︸Net product introduction
+∑i∈C
(sit−1 − St−1)∆wit +∑i∈C
∆sit∆wit︸ ︷︷ ︸Switching by consumers
(3.2)
The first term(∑
i∈C wit−1∆sit)
represents the contribution of reformulation of continuing
products. It is the weighted average change in the salt content of continuing products, where
the weights are given by period t−1 market shares. The second term(∑
i∈N wit(sit − St−1))
2We use a decomposition that is of the same form as that used by Foster et al. (2001) when analysingfirm productivity growth.
10

captures the impact of new products. If the salt content of a new product is less than
the average salt intensity of grocery purchases in the previous period then it contributes
negatively, reducing overall salt intensity. Conversely, if the salt content is higher than the
average salt intensity in the previous period, the new product acts to increase overall salt
intensity. The third term(−∑
i∈X wit−1(sit−1 − St−1))
captures the effect of discontinued
products. A discontinued product will act to reduce/raise average salt intensity if its salt
content exceeds/is less than the average grocery salt intensity in the previous period.
The fourth and fifth terms reflect switching by consumers. The fourth term(∑
i∈C
(sit−1 − St−1)∆wit
)captures consumers switching between continuing products. It is the
weighted average of the change in the market share of continuing products, where the weights
are given by the deviation of the product’s salt content from the mean salt intensity of grocery
purchases in the previous period. If consumers shift toward products that have higher salt
intensity than the mean, then this will act to raise overall salt intensity of the grocery basket.
Conversely, if consumers shift towards products that have lower salt intensity than the mean,
then this will act to reduce the overall salt intensity of the grocery basket. The final term(∑i∈C ∆sit∆wit
)captures the covariance of changes in the salt content and the quantity
shares of continuing products; if consumers shift towards products that are reformulated to
have less salt, this term will be negative.
We are also interested in whether the importance of changes in the product offering
varies across food groups. To assess this we further break down the terms in equation (3.2)
that capture changes in product offering. For instance, we can split the reformulation term
in equation (3.2) by food group. Let k = 1, . . . , K, index a set of mutually exclusive and
exhaustive food groups, and Ck denote the set of continuing products within group k. We
11

can write the reformulation term for each of the k food groups as:
Rk =∑i∈Ck
wit−1∆sit (3.3)
3.2 Data
We use detailed data from the Kantar Worldpanel on food purchases made by a large repre-
sentative sample of British households for consumption at home over the period 2005-2011.
The majority of dietary salt that households purchase comes from food consumed inside the
home (i.e. excluding takeaways and restaurant meals) – the share of salt from these foods
remained fairly constant at around 87% over the 2005-2011 period.3 Our sample includes
between 15,000 and 25,000 households at any point in time; individual households remain
in the sample for 3.3 years on average. Households are recruited into the panel via stratified
sampling and they record spending on all grocery purchases via an electronic hand held
scanner in the home. They also upload their till receipts to Kantar. The data are at the
individual product (barcode or UPC) level and include details of the salt content of each
product.
Several papers have compared data collected in this way with other data sources. Einav
et al. (2008) find that the overall accuracy for the Nielsen Homescan data (US data collected
in a similar way) is in line with other commonly used (government-collected) economic
datasets. Zhen et al. (2009) compare the Nielsen Homescan panel to the US Bureau of
Labor Statistic’s Consumer Expenditure Diary Survey and find that many differences in
reported expenditures across the two datasets can be explained by differences in household
demographics. Leicester and Oldfield (2009) and Griffith and O’Connell (2009) provide a
detailed description and analysis of the Kantar data for Great Britain and find similar results.
3Calculated using the Living Costs and Food Survey 2005-2011.
12

The richness of the information available in these data means that it is becoming more
widely used for research into food purchasing and nutrition (e.g. Aguiar and Hurst (2007),
Etile (2008), Griffith et al. (2013)). For instance, Harding and Lovenheim (2014) use Nielsen
Homescan data to simulate the effect of taxes on a range of food groups and nutrients.
Pechey et al. (2013) use the Kantar data to analyse the variation across households from
different socioeconomic groups in the decisions to purchase (or not) healthy food; they show
that higher socioeconomic status is associated with lower purchases of sodium.
Research has shown that these data accurately capture variation in spending patterns,
but that it is important to exclude periods during which households were on holiday or not
recording purchases for other reasons (see Griffith and O’Connell (2009)). There is also
evidence that scanning panels are not always representative of some parts of the popula-
tion. Lusk and Brooks (2011) compare the characteristics of participants in two household
scanning panels to a random sample of the US population. They find that demographics of
the random sample more closely match the census bureau data than the household scanning
panels. It is therefore important to adjust for under-sampling of a few specific known house-
hold types (e.g. single young men) using weights that bring the sample profile in line with
the British population. We use these weights in the analysis below.
Our data include details of the salt content of each individual food product. This infor-
mation is collected by Kantar from the nutritional labeling on the back of products. The
information is updated over time allowing us to observe changes in salt content due to prod-
uct reformulation. For products that do not have nutritional labels (e.g. apples) Kantar use
nutrient values from McCance and Widdowson (2014) and for some infrequently purchased
products Kantar impute nutritional values from other similar products. The extent of im-
puted nutritional values has decreased over time as Kantar have improved the data. This
creates a potential problem for us if the transition from an imputed value to a real value
makes it look like a product has been reformulated, when in fact the change is simply due to
13

improved measurement. This affects fewer than 9% of transactions; however, to avoid this
affecting our results, for these products we assume that the product has not been reformu-
lated and we use the real value (from the later period) in all periods. If anything this will
lead to an underestimate of the reformulation effect.
In order the make the data comparable across households of different size and demo-
graphic composition we create an ‘equivalised’ measure of salt purchased. This is the actual
quantity of salt purchased by the household divided by an ‘equivalence factor’ that is based
on the age of household members. The equivalence factor is equal to the sum of the tar-
get average intake of salt for each household member, published by the Scientific Advisory
Committee on Nutrition (2003),4 divided by the target average intake for one adult. The
target average intakes at different ages are: 1g for infants below 1; 2g for children aged 1-3;
3g for children aged 4-6; 5g for children aged 7-10; 6g for individuals aged over 11. So, for
example, if a household consists of one adult, the equivalence factor would be 6/6 = 1. If a
second household consists of two adults plus one child aged 5 the equivalence factor would
be (6 + 6 + 3)/6 = 2.5. If the first household purchases 6g of salt, and the second 15g of salt,
then both households would have equivalised salt purchases of 6g, i.e. the target average
intake.
Figure 3.1 uses the Kantar data to replicate Figure 1.1 to show that the change in salt
purchased in food closely mirrors the 24-hour urinary sodium tests. The distribution of
salt purchased per adult equivalent per day shifts leftwards from 2005 to 2010, and then
again from 2010 to 2011. The shifts are statistically different from zero at all points of the
distribution. In 2005 46% of households were above the government’s 6g target based only
on the food that they purchased for home consumption alone. By 2010 this had fallen to
42%, and by 2011 it had fallen further to just over 34%.
4The average salt intake target recommended for each age group does not represent an optimal or idealconsumption level, but an achievable population goal.
14

Figure 3.1: Salt purchased per adult equivalent per day
0.2
.4.6
.81
Cum
ulat
ive
dens
ity
0 5 6 10 15 20
2005
2010
2011
0.0
5.1
Diff
eren
ce
0 5 6 10 15 20
Difference 2005 to 2010
95% confidence interval
0.0
5.1
Diff
eren
ce
0 5 6 10 15 20Salt intake (g per adult eq. per day)
Difference 2010 to 2011
95% confidence interval
Notes: The distribution is plotted for 16,664 households in 2005, 24,802 households in 2010 and 28,767 in
2011. Salt purchases per adult equivalent per day is total salt purchased by a household in a month divided
by number of days in the month and the household’s equivalence factor (described in the text). The CDF
is constructed using household weights to bring the sample profile in line with the British population. The
empirical CDF is constructed using K=10 test points. The 95% confidence interval around the difference
is constructed using bootstrapping techniques (50 replications). The critical value used to construct the
confidence interval are from the Studentised maximum modulus (SMM) distribution with K and infinite
degrees of freedom where K=10 is the number of test points. We truncate the graph at 20g; less than 1% of
households report buying in excess of 20g of salt per adult equivalent per day on average.
We include table salt in the amount of salt purchased per adult equivalent per day in
Figure 3.1 and Table 3.1, but not in the decomposition of the change in salt intensity of
groceries; table salt was not targeted by the FSA campaign. Table salt accounts for 17.3%
15

of total salt purchased in 2005 and 17.8% in 2011. There are high and low sodium table
salts, but the share of low sodium salt has remained small at around 0.1%.
Table 3.1 reports the mean quantity of salt in the grocery baskets purchased by British
households in 2005 and 2011, by socioeconomic group. We measure households’ socioeco-
nomic status using a classification based on the National Readership Survey social grade.5
This is the standard socioeconomic classification used by market researchers. The FSA tar-
geted their information campaign at women in socioeconomic groups C1, C2 and D. In both
2005 and 2011 there is a socioeconomic gradient in salt; households from higher socioeco-
nomic groups purchase significantly less salt than households in lower groups. For all groups
there was a statistically significant decline in the mean quantity of salt purchased. The size
of the decline in salt purchases is largest for households from socioeconomic group D & E
and smallest for households from groups A & B.
5This is based on the occupation of the main income earner, see http://www.nrs.co.uk/nrs-print/lifestyle-and-classification-data/social-grade/ for details.
16
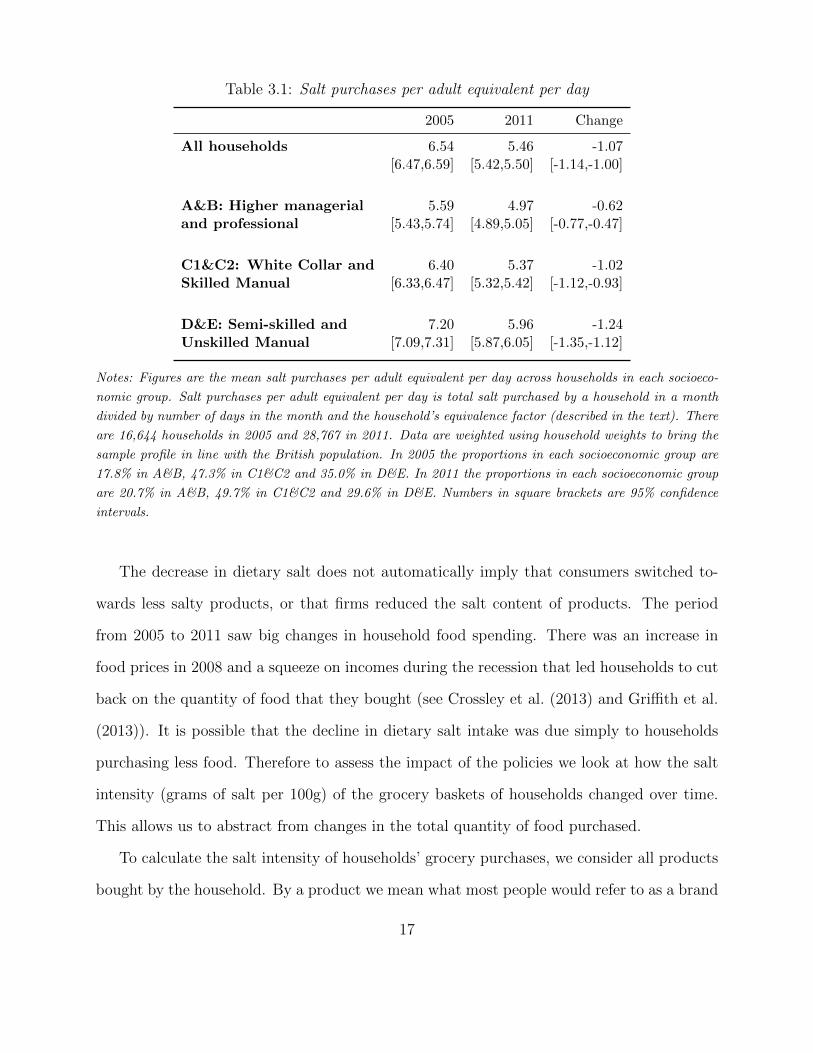
Table 3.1: Salt purchases per adult equivalent per day
2005 2011 Change
All households 6.54 5.46 -1.07[6.47,6.59] [5.42,5.50] [-1.14,-1.00]
A&B: Higher managerial 5.59 4.97 -0.62and professional [5.43,5.74] [4.89,5.05] [-0.77,-0.47]
C1&C2: White Collar and 6.40 5.37 -1.02Skilled Manual [6.33,6.47] [5.32,5.42] [-1.12,-0.93]
D&E: Semi-skilled and 7.20 5.96 -1.24Unskilled Manual [7.09,7.31] [5.87,6.05] [-1.35,-1.12]
Notes: Figures are the mean salt purchases per adult equivalent per day across households in each socioeco-
nomic group. Salt purchases per adult equivalent per day is total salt purchased by a household in a month
divided by number of days in the month and the household’s equivalence factor (described in the text). There
are 16,644 households in 2005 and 28,767 in 2011. Data are weighted using household weights to bring the
sample profile in line with the British population. In 2005 the proportions in each socioeconomic group are
17.8% in A&B, 47.3% in C1&C2 and 35.0% in D&E. In 2011 the proportions in each socioeconomic group
are 20.7% in A&B, 49.7% in C1&C2 and 29.6% in D&E. Numbers in square brackets are 95% confidence
intervals.
The decrease in dietary salt does not automatically imply that consumers switched to-
wards less salty products, or that firms reduced the salt content of products. The period
from 2005 to 2011 saw big changes in household food spending. There was an increase in
food prices in 2008 and a squeeze on incomes during the recession that led households to cut
back on the quantity of food that they bought (see Crossley et al. (2013) and Griffith et al.
(2013)). It is possible that the decline in dietary salt intake was due simply to households
purchasing less food. Therefore to assess the impact of the policies we look at how the salt
intensity (grams of salt per 100g) of the grocery baskets of households changed over time.
This allows us to abstract from changes in the total quantity of food purchased.
To calculate the salt intensity of households’ grocery purchases, we consider all products
bought by the household. By a product we mean what most people would refer to as a brand
17

(for example, we consider Kellogg’s Cornflakes to be a single product; we do not distinguish
a 500g from a 750g package, since they have the same salt content). We classify products
as either ‘introduced’, ‘discontinued’ or ’continuous’, as described in Section 3.1. The first
panel of Table 3.2 shows the number of products in each group in each year. Over two thirds
of products are classified as ‘continuous’ in each year, with the remaining third classified as
either introduced and discontinued. We use information on the salt content of products and
how frequently they were purchased to measure the salt intensity of the average shopping
basket in each year. We calculate the effect of reformulation across all products, by six
aggregated food groups and then by 84 disaggregate food groups. The subsequent panels
of Table 3.2 show the number of continuous, introduced and discontinued products in each
aggregate food group. Processed foods represent the largest number of products, accounting
for around half of all products purchased.
18

Table 3.2: Number of products in each year
2005 2006 2007 2008 2009 2010 2011
All products 47,955 59,005 63,404 65,718 66,506 67,031 67,529Continuous 47,955 40,222 43,061 46,061 46,263 45,450 43,746Introduced 0 11,050 12,348 10,627 10,235 11,124 12,561Discontinued 0 7,733 7,995 9,030 10,008 10,457 11,222
Fruit and veg 5,345 6,388 6,842 7,236 7,399 7,309 6,990Continuous 5,345 4,637 4,989 5,304 5,378 5,268 5,073Introduced 0 1,043 1,177 1,102 1,042 948 940Discontinued 0 708 676 830 979 1,093 977
Grains 3,315 3,931 4,085 4,206 4,315 4,315 4,284Continuous 3,315 2,845 3,055 3,241 3,252 3,238 3,046Introduced 0 616 641 528 567 534 606Discontinued 0 470 389 437 496 543 632
Dairy products 3,862 4,611 4,920 5,131 5,144 5,004 4,909Continuous 3,862 3,357 3,552 3,748 3,757 3,619 3,445Introduced 0 749 838 770 667 636 785Discontinued 0 505 530 613 720 749 679
Meat 5,888 7,057 7,703 8,163 8,390 8,507 8,534Continuous 5,888 5,163 5,563 5,970 6,107 6,109 5,671Introduced 0 1,169 1,399 1,251 1,219 1,254 1,387Discontinued 0 725 741 942 1,064 1,144 1,476
Processed food 25,174 31,805 34,118 34,978 35,025 35,102 35,842Continuous 25,174 20,338 21,745 23,286 23,152 22,655 21,730Introduced 0 6,631 7,253 6,132 5,813 6,439 7,566Discontinued 0 4,836 5,120 5,560 6,060 6,008 6,546
Drinks 4,371 5,213 5,736 6,004 6,233 6,794 6,970Continuous 4,371 3,882 4,157 4,512 4,617 4,561 4,781Introduced 0 842 1,040 844 927 1,313 1,277Discontinued 0 489 539 648 689 920 912
Notes: In each panel the first row shows the total number of products. Continuous products are purchased in
current year and a previous year; introduced products are purchased in current year but not in any previous
year; discontinued products are purchased in the previous year but no future years.
Table 3.3 shows the food groups from which households obtained salt. Processed food
contributed the most to households’ total salt purchases, both because it has a large quantity
share and is relatively salt intensive. Many of the food groups targeted by the FSA for
19

reformulation fall into this group; for example, ready meals, soups, pizzas, crisps, snacks,
cakes, pasta sauces and condiments were all targeted. The most salt intense food group in
both 2005 and 2011 was meat. This is primarily due to bacon and sausages, both of which
are high in salt. These meat products were targeted for reformulation by the FSA, although
it acknowledged the technological difficulties involved in achieving this target (for example,
it is difficult to attain an even dispersal of salt in bacon). The food group grains (which
includes bread, breakfast cereals, bakery goods, pasta, rice) was also high in salt.
The table also shows the breakdown by socioeconomic group. Households from higher
socioeconomic groups buy food that is less salty, on average, than households from the lower
socioeconomic groups – the average salt intensity of groceries bought by households in groups
A & B is over 8% lower than for households in groups D & E. All socioeconomic groups saw
a decline in the average salt intensity of their shopping baskets; however, the size of this fall
was similar in magnitude for each group at just under 0.02g per 100g. In terms of the sources
of dietary salt, the patterns are similar across the socioeconomic group, although there are
some differences. Households from lower socioeconomic groups get a slightly larger share of
their salt from processed food. However, this is because they purchase more processed food
rather than because the processed food that they do buy is higher in salt. Households from
socioeconomic groups D & E buy meat that is higher in salt than households in groups A &
B; they also purchase saltier grains.
20

Table 3.3: Sources of dietary salt
% total Salt intensitysalt (g per 100g)
All households 2005 2011 Diff. 2005 2011 Diff.
Fruit and veg 2.8 2.4 -0.4 0.038 0.033 -0.006Grains 17.6 16.0 -1.6 0.877 0.717 -0.160Dairy, cheese and fats 19.0 19.9 0.9 0.344 0.332 -0.012Meat 23.1 23.4 0.3 0.985 0.983 -0.002Processed food 36.2 36.8 0.6 0.760 0.706 -0.054Drinks 1.2 1.6 0.3 0.024 0.028 0.004
Total 100 100 – 0.370 0.351 0.019
Socioeconomic groups A & B
Fruit and veg 3.0 2.7 -0.3 0.034 0.032 -0.002Grains 17.6 15.9 -1.7 0.815 0.671 -0.144Dairy products 20.3 21.0 0.7 0.347 0.331 -0.016Meat 23.0 22.9 -0.1 0.953 0.951 -0.001Processed food 35.0 36.0 1.0 0.776 0.713 -0.063Drinks 1.2 1.5 0.4 0.023 0.028 0.004
Total 100 100 – 0.350 0.332 -0.017
Socioeconomic groups C1 & C2
Fruit and veg 2.7 2.3 -0.4 0.038 0.033 -0.005Grains 17.4 15.9 -1.5 0.877 0.714 -0.163Dairy products 18.8 19.8 0.9 0.348 0.334 -0.014Meat 22.8 23.4 0.6 0.985 0.982 -0.003Processed food 36.9 37.0 0.1 0.778 0.714 -0.064Drinks 1.3 1.6 0.3 0.024 0.028 0.004
Total 100 100 0 0.370 0.351 -0.019
Socioeconomic groups D & E
Fruit and veg 2.8 2.2 -0.6 0.041 0.033 -0.008Grains 18.0 16.3 -1.7 0.908 0.758 -0.150Dairy products 18.8 19.5 0.7 0.336 0.327 -0.009Meat 23.5 23.6 0.1 1.001 1.006 0.006Processed food 35.7 36.9 1.2 0.734 0.693 -0.041Drinks 1.2 1.5 0.3 0.026 0.029 0.003
Total 100 100 – 0.380 0.362 -0.017
Notes: Figures are share of total salt purchased from food brought into the home in each year, and quantity-
weighted average salt intensity of each food group in each year, measured in g per 100g.
21

4 Results
In 2005 the salt intensity of the average shopping basket was 0.370g per 100g; by 2011 it
had fallen by 0.019g (5.1%) to 0.351g. We use equation (3.2) to decompose this change into
the parts due to product reformulation, net product introduction by firms and consumer
switching between products.
Table 4.1 reports these effects. The first two rows report the total change in salt inten-
sity; we report both the cumulative effects and, below in italics, the year-on-year changes.
The following rows show the decomposition results. Product reformulation was responsible
for the entire decline in salt intensity between 2005 and 2011. The importance of reformu-
lation steadily increased over time. The net effect of the introduction and discontinuation
of products is positive overall and positive in all but two years. This was mainly driven by
the introduction of new products that had a slightly higher salt content than existing ones.
Overall, this effect is smaller in magnitude (about one-tenth the size) than reformulation.
The cumulative effect of consumer switching was to increase the average salt intensity of
the shopping basket over the period 2005 to 2011. In several years consumers did switch to
lower salt products, but only by a small amount. If consumers had not switched to saltier
products (i.e. the consumer switching term was zero), then the effect of reformulation and
net product introduction would have been to reduce the average salt intensity of grocery
purchases by 6.5% (compared to the 5.1% that actually occurred).
22
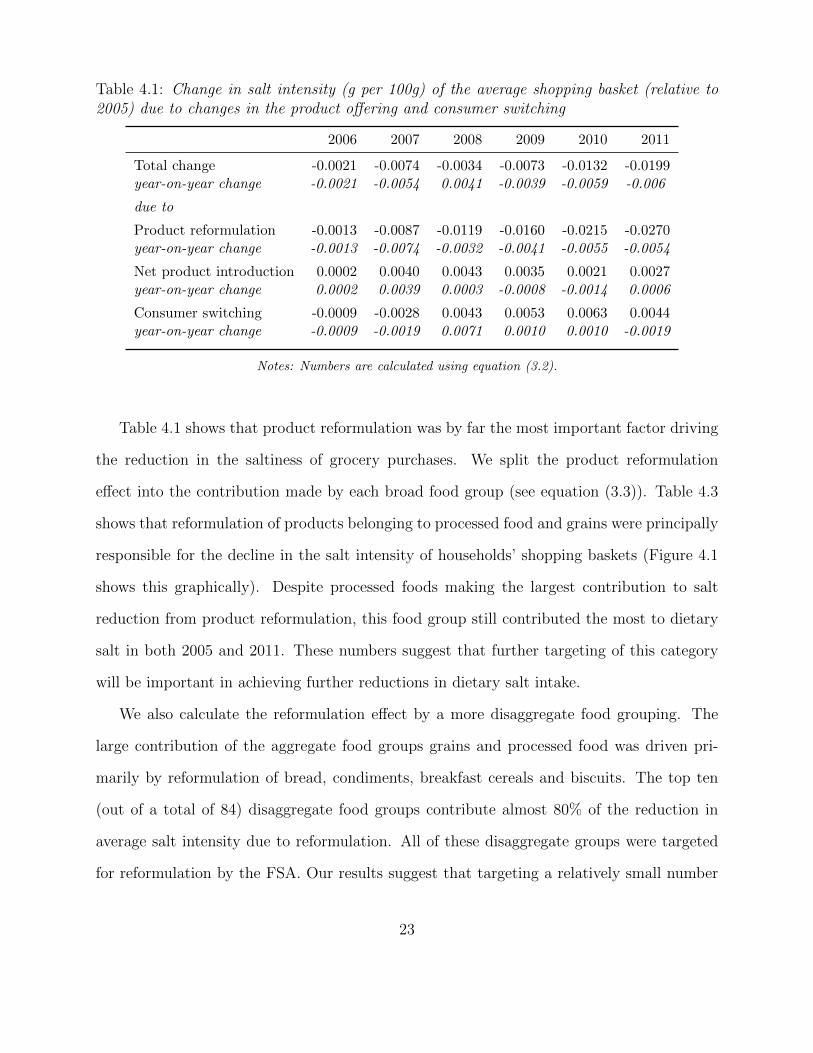
Table 4.1: Change in salt intensity (g per 100g) of the average shopping basket (relative to2005) due to changes in the product offering and consumer switching
2006 2007 2008 2009 2010 2011
Total change -0.0021 -0.0074 -0.0034 -0.0073 -0.0132 -0.0199year-on-year change -0.0021 -0.0054 0.0041 -0.0039 -0.0059 -0.006
due to
Product reformulation -0.0013 -0.0087 -0.0119 -0.0160 -0.0215 -0.0270year-on-year change -0.0013 -0.0074 -0.0032 -0.0041 -0.0055 -0.0054
Net product introduction 0.0002 0.0040 0.0043 0.0035 0.0021 0.0027year-on-year change 0.0002 0.0039 0.0003 -0.0008 -0.0014 0.0006
Consumer switching -0.0009 -0.0028 0.0043 0.0053 0.0063 0.0044year-on-year change -0.0009 -0.0019 0.0071 0.0010 0.0010 -0.0019
Notes: Numbers are calculated using equation (3.2).
Table 4.1 shows that product reformulation was by far the most important factor driving
the reduction in the saltiness of grocery purchases. We split the product reformulation
effect into the contribution made by each broad food group (see equation (3.3)). Table 4.3
shows that reformulation of products belonging to processed food and grains were principally
responsible for the decline in the salt intensity of households’ shopping baskets (Figure 4.1
shows this graphically). Despite processed foods making the largest contribution to salt
reduction from product reformulation, this food group still contributed the most to dietary
salt in both 2005 and 2011. These numbers suggest that further targeting of this category
will be important in achieving further reductions in dietary salt intake.
We also calculate the reformulation effect by a more disaggregate food grouping. The
large contribution of the aggregate food groups grains and processed food was driven pri-
marily by reformulation of bread, condiments, breakfast cereals and biscuits. The top ten
(out of a total of 84) disaggregate food groups contribute almost 80% of the reduction in
average salt intensity due to reformulation. All of these disaggregate groups were targeted
for reformulation by the FSA. Our results suggest that targeting a relatively small number
23

Table 4.2: Change in salt intensity (g per 100g) of the average shopping basket (relative to2005) due to product reformulation, by food group
(1) (2)Product reformulation Share of total effect (%)
Fruit and veg -0.0023 8.5Grains -0.0099 36.7Dairy, cheese and fats -0.0016 5.9Meat -0.0016 5.9Processed food -0.0113 41.9Drinks -0.0002 0.0
Total -0.0270 100.0
Notes: Numbers are calculated using equation (3.3). Column (1) shows the cumulative effect of product
reformulation over the period 2005-2011. Column (2) shows the share that each food group contributes to
the total effect of product reformulation (shown in the final row).
Figure 4.1: Product reformulation effect, by food group
-.03
-.02
-.01
0C
umul
ativ
e ch
ange
in s
alt i
nten
sity
due
to r
efor
mul
atio
n
2006 2007 2008 2009 2010 2011
Fruit and veg Grains Dairy products
Meat Processed food Drinks
Notes: Numbers are calculated using equation (3.3). The effect in each year is cumulative and relative to
2005.
of products can lead to a significant change in the nutritional composition of households’
shopping baskets.
24

Table 4.3: Change in salt intensity (g per 100g) of the average shopping basket (relative to2005) due to product reformulation, top ten disaggregate food groups
Aggregate food group Disaggregate food group Reformulation effect
Grains Bread -0.00487Processed food Condiments -0.00373Grains Breakfast cereal -0.00339Processed food Biscuits -0.00190Processed food Pastry and pies -0.00159Fruit and vegetables Canned vegetables -0.00155Grains Whole grains -0.00140Processed food Snacks -0.00123Processed food Ready meals -0.00098Meat Other meat (offal, stuffing, canned meat etc.) -0.00086. . . . . .
Total reformulation effect of these food groups -0.0215Total reformulation effect of all food groups -0.0270
Notes: Numbers are calculated using equation (3.3). The food groups listed are the ten that have the largest
product reformulation effects. The numbers shown are the cumulative effect of product reformulation over
the period 2005-2011.
In Section 3.2 we showed that there was a strong socioeconomic gradient in total salt
purchased, with households from higher socioeconomic groups purchasing less salt per adult
equivalent, on average, than households from lower socioeconomic groups. In Table 4.4 we
repeat the decomposition of changes in the salt intensity of grocery purchases separately by
socioeconomic groups.
The average salt intensity of households’ grocery baskets declined for all socioeconomic
groups, but the decline was slightly bigger for households in socioeconomic groups A & B and
C1 & C2 than for households in groups D & E. The impact of reformulation was larger for
groups C1 & C2 and D & E compared to households in groups A & B; this is partly because
households from the lower socioeconomic groups bought a larger share of their groceries from
processed food and therefore were more affected by the reformulation of products within this
group. However, the effect of consumer switching, to some extent, offset the decline in salt
25

intensity due to product reformulation. Households in the lowest socioeconomic groups (D &
E) substituted the most towards saltier food products, and, although the effects of switching
were still small in magnitude relative to reformulation, it almost entirely cancels out the
larger effect of product reformulation that these households experienced.
These results highlight one of the advantages of targeting product reformulation compared
with a public information campaign: reformulation has the potential to affect all consumers,
while the provision of information is likely to affect different groups of households to varying
degrees (if at all). In particular, reformulation is an effective way of changing the diets of
individuals who may be unable or unwilling to process the information provided to them. It
may also be that these are the individuals that policymakers are most interested in targeting.
For example, households from socioeconomic group D & E purchased the most salt per
person, and also purchased more of their groceries as processed food, relative to households
in the higher socioeconomic groups. We have shown that the reformulation of processed food
was an important contributor to the decline in salt intensity of grocery baskets. This means
that, although households from the lowest socioeconomic groups were more likely to switch
towards food products higher in salt, the much greater effect of reformulation nonetheless
reduced the average salt intensity of their shopping basket.
26

Table 4.4: Change in salt intensity (g per 100g) of the average shopping basket (relative to2005) due to changes in the product offering and consumer switching, by socioeconomic group
2006 2007 2008 2009 2010 2011
Socioeconomic groups A & B
Total change -0.0000 -0.0043 0.0020 -0.0029 -0.0101 -0.0174year-on-year change -0.0000 -0.0043 0.0063 -0.0048 -0.0072 -0.0074
due to
Product reformulation -0.0012 -0.0095 -0.0115 -0.0159 -0.0204 -0.0256year-on-year change -0.0012 -0.0083 -0.0020 -0.0045 -0.0045 -0.0052
Net product introduction 0.0000 0.0034 0.0040 0.0033 0.0019 0.0019year-on-year change 0.0000 0.0034 0.0006 -0.0007 -0.0014 -0.0001
Consumer switching 0.0012 0.0018 0.0094 0.0098 0.0084 0.0065year-on-year change 0.0012 0.0006 0.0077 0.0003 -0.0013 -0.0019
Socioeconomic groups C1 & C2
Total change -0.0017 -0.0069 -0.0039 -0.0085 -0.0136 -0.0195year-on-year change -0.0017 -0.0051 0.0030 -0.0046 -0.0051 -0.0058
due to
Product reformulation -0.0014 -0.0086 -0.0119 -0.0160 -0.0216 -0.0272year-on-year change -0.0014 -0.0073 -0.0033 -0.0041 -0.0056 -0.0055
Net product introduction 0.0004 0.0042 0.0045 0.0038 0.0024 0.0034year-on-year change 0.0004 0.0038 0.0003 -0.0007 -0.0014 0.0010
Consumer switching -0.0007 -0.0025 0.0035 0.0037 0.0056 0.0045year-on-year change -0.0007 -0.0017 0.0060 0.0002 0.0019 -0.0012
Socioeconomic groups D & E
Total change -0.0028 -0.0082 -0.0031 -0.0041 -0.0100 -0.0171year-on-year change -0.0028 -0.0055 0.0051 -0.0011 -0.0059 -0.0071
due to
Product reformulation -0.0012 -0.0083 -0.0122 -0.0160 -0.0221 -0.0275year-on-year change -0.0012 -0.0072 -0.0039 -0.0038 -0.0062 -0.0054
Net product introduction -0.0000 0.0042 0.0042 0.0032 0.0018 0.0025year-on-year change -0.0000 0.0042 0.0000 -0.0010 -0.0014 0.0008
Consumer switching -0.0016 -0.0041 0.0049 0.0086 0.0104 0.0079year-on-year change -0.0016 -0.0026 0.0090 0.0038 0.0017 -0.0025
Notes: Numbers are calculated using equation (3.2) applied separately by socioeconomic group.
27

5 Summary and conclusions
The UK government’s salt reduction programme combined an information campaign, de-
signed to encourage consumers to switch to lower salt products, with voluntary reformulation
targets, aimed at getting manufacturers to reduce the salt content of food products. Our re-
sults suggest that this strategy has been at least partially successful in reducing dietary salt
intake through reducing the salt intensity of households’ grocery baskets. Product reformu-
lation is responsible for the decline. There is little evidence that the information campaign
had any impact; although it is possible that in the absence of the information campaign
individuals may have switched more strongly to salty foods. It is also possible that product
reformulation itself could have driven some households to switch towards saltier products,
because they like the taste of salt. An important direction for future work will be to explore
how individuals’ tastes for salt have changed over this period.
The reduction in the purchase and intake of salt could result in important gains in public
health, due to a reduction in cardiovascular disease (CVD), and the prevalence of other health
conditions (e.g. He and MacGregor (2008), Bibbins-Domingo et al. (2010)). However, there
is a strand of the medical literature that raises questions about the magnitude of these health
benefits, and suggests that they could potentially be offset by the positive effects that sodium
has on other aspects of health (e.g. Alderman et al. (1998), Alderman (2010), Taylor et al.
(2011)). Despite the recent marked decline in salt intake, in 2010 60% of people were still
consuming more salt than the government’s targeted population salt intake of 6g per person
per day. Therefore the government still has a long way to go to reach its goal.
Our findings suggest that voluntary regulation is an effective way of changing the intake
of a targeted nutrient. It has the potential to change the diets of individuals who might
be resistant to changing their behaviour. The partial success of the salt strategy suggests
28

that a similar approach to reducing the intake of other nutrients that might be consumed in
excess, such as sugar and saturated fat, has the potential to be effective.
29

References
Aguiar, M. and E. Hurst (2007). Life-cycle prices and production. American Economic
Review , 1533–1559.
Alderman, M. H. (2010). Reducing Dietary Sodium. JAMA: the journal of the American
Medical Association 303 (5), 448–449.
Alderman, M. H., H. Cohen, and S. Madhavan (1998). Dietary sodium intake and mortality:
the National Health and Nutrition Examination Survey (NHANES I). Lancet 351 (9105),
781–785.
Bassett, M. T., T. Dumanovsky, C. Huang, L. D. Silver, C. Young, C. Nonas, T. D. Matte,
S. Chideya, and T. R. Frieden (2008). Purchasing behavior and calorie information at
fast-food chains in New York City, 2007. American Journal of Public Health 98 (8), 1457.
Becker, G. S. (1983). A theory of competition among pressure groups for political influence.
Quarterly Journal of Economics , 371–400.
Bibbins-Domingo, K., G. M. Chertow, P. G. Coxson, A. E. Moran, J. M. Lightwood, M. J.
Pletcher, and L. Goldman (2010). Reductions in cardiovascular disease projected from
modest reductions in dietary salt. The New England Journal of Medicine 362 (7), 590.
Bollinger, B., P. Leslie, and A. Sorensen (2011). Calorie posting in chain restaurants. Amer-
ican Economic Journal: Economic Policy , 91–128.
Braeutigam, R. R. and J. P. Quirk (1984). Demand uncertainty and the regulated firm.
International Economic Review , 45–60.
30

Camerer, C., S. Issacharoff, G. Loewenstein, T. O’Donoghue, and M. Rabin (2003). Regula-
tion for conservatives: Behavioral economics and the case for “asymmetric paternalism”.
University of Pennsylvania Law Review , 1211–1254.
Chu, Y. H., E. A. Frongillo, S. J. Jones, and G. L. Kaye (2009). Improving patrons’ meal
selections through the use of point-of-selection nutrition labels. American Journal of Public
Health 99 (11), 2001.
Crossley, T. F., H. Low, and C. O’Dea (2013). Household consumption through recent
recessions. Fiscal Studies 34 (2), 203–229.
Department of Health (2008). Help stop childhood obesity before it starts. http://www.nhs.
uk/Change4Life/supporter-resources/downloads/Help stop childhood obesity.pdf.
Downs, J. S., G. Loewenstein, and J. Wisdom (2009). Strategies for promoting healthier
food choices. The American Economic Review , 159–164.
Einav, L., E. Leibtag, and A. Nevo (2008). On the accuracy of Nielsen Homescan data.
USDA, Economic Research Service.
Etile, F. (2008). Food price policies and the distribution of body mass index: Theory and
empirical evidence from france. Available at SSRN 1287094 .
Food Standards Agency (2008). Impact Assessment of the Revised Salt Reduction Targets.
Food Standards Agency (2009). Salt reduction initiatives. http://www.food.gov.uk/
multimedia/pdfs/saltreductioninitiatives.pdf.
Food Standards Agency (2010). Salt Campaign: Phase 4 Overview.
Food Standards Agency (2013). Salt strategy beyond 2012. https://responsibilitydeal.dh.
gov.uk/wp-content/uploads/2013/03/Salt-Strategy-Beyond-2012.pdf.
31

Foster, L., J. C. Haltiwanger, and C. J. Krizan (2001). Aggregate productivity growth.
Lessons from microeconomic evidence. New developments in productivity analysis , 303–
372.
Glazer, A. and H. McMillan (1992). Pricing by the firm under regulatory threat. Quarterly
Journal of Economics , 1089–1099.
Gortmaker, S., B. Swinburn, D. Levy, R. Carter, P. Mabry, D. Finegood, T. Huang,
T. Marsh, and M. Moodie (2011). Changing the future of obesity: science, policy and
action. Lancet 378, 838–847.
Griffith, R. and M. O’Connell (2009). The Use of Scanner Data for Research into Nutrition.
Fiscal Studies 30, 339–365.
Griffith, R., M. O’Connell, and K. Smith (2013). Food expenditure and nutritional quality
over the great recession. IFS Briefing Note (143).
Harding, M. and M. Lovenheim (2014). The effect of prices on nutrition: comparing the
impact of product-and nutrient-specific taxes. National Bureau of Economic Research.
He, F. J. and G. A. MacGregor (2003). How far should salt intake be reduced? Hypertension.
He, F. J. and G. A. MacGregor (2008). A comprehensive review on salt and health and
current experience of worldwide salt reduction programmes. Journal of Human Hyperten-
sion 23 (6), 363–384.
Kahneman, D. (2003). Maps of bounded rationality: Psychology for behavioral economics.
American Economic Review , 1449–1475.
Leicester, A. and Z. Oldfield (2009). An analysis of consumer panel data. IFS Working
Papers (W09/09).
32

Liu, P. J., J. Wisdom, C. A. Roberto, L. J. Liu, and P. A. Ubel (2014). Using behavioral
economics to design more effective food policies to address obesity. Applied Economic
Perspectives and Policy 36 (1), 6–24.
Loewenstein, G., T. O’Donoghue, and M. Rabin (2003). Projection bias in predicting future
utility. Quarterly Journal of Economics , 1209–1248.
Lusk, J. L. and K. Brooks (2011). Who participates in household scanning panels? American
Journal of Agricultural Economics 93 (1), 226–240.
Maxwell, J. W., T. P. Lyon, and S. C. Hackett (2000). Self-regulation and social welfare: The
political economy of corporate environmentalism. Journal of Law and Economics 43 (2),
583–618.
McCance, R. A. and E. M. Widdowson (2014). McCance and Widdowson’s the Composition
of Foods: Seventh Summary Edition. Royal Society of Chemistry.
O’Donoghue, T. and M. Rabin (2000). The economics of immediate gratification. Journal
of Behavioral Decision Making 13 (2), 233–250.
Pechey, R., S. A. Jebb, M. P. Kelly, E. Almiron-Roig, S. Conde, R. Nakamura, I. Shemilt,
M. Suhrcke, and T. M. Marteau (2013). Socioeconomic differences in purchases of more
vs. less healthy foods and beverages: Analysis of over 25,000 british households in 2010.
Social Science & Medicine 92, 22–26.
Pulos, E. and K. Leng (2010). Evaluation of a voluntary menu-labeling program in full-
service restaurants. American Journal of Public Health 100 (6), 1035–1039.
Reger, B., M. G. Wootan, and S. Booth-Butterfield (1999). Using mass media to promote
healthy eating: a community-based demonstration project. Preventive Medicine 29 (5),
414–421.
33

Scientific Advisory Committee on Nutrition (2003). Salt and Health.
Shankar, B., J. Brambila-Macias, B. Traill, M. Mazzocchi, and S. Capacci (2013). An
evaluation of the UK Food Standards Agency’s salt campaign. Health Econ. 22 (2), 243–
250.
Sharma, L. L., S. P. Teret, and K. D. Brownell (2010). The food industry and self-regulation:
standards to promote success and to avoid public health failures. American Journal of
Public Health.
Stables, G., A. Subar, B. Patterson, K. Dodd, J. Heimendinger, M. V. Duyn, and L. Nebeling
(2002). Changes in vegetables nad fruit consmption and awareness among us adults: results
of the 1991 and 1997 5 a day for better health program surveys. Journal of the American
Dietetic Association 102, 809–817.
Stigler, G. J. (1961). The economics of information. Journal of Political Economy 69 (3),
213–225.
Taylor, R. S., K. E. Ashton, T. Moxham, L. Hooper, and S. Ebrahim (2011). Reduced
dietary salt for the prevention of cardiovascular disease: a meta-analysis of randomized
controlled trials (Cochrane Review). American Journal of Hypertension 24 (8), 843–853.
Thaler, R. H. and C. R. Sunstein (2003). Libertarian paternalism. American Economic
Review , 175–179.
Thaler, R. H. and C. R. Sunstein (2008). Nudge: Improving decisions about health, wealth,
and happiness. Yale University Press.
Webster, J. L., E. K. Dunford, C. Hawkes, and B. C. Neal (2011). Salt reduction initiatives
around the world. Journal of Hypertension 29 (6), 1043–1050.
34

Zhen, C., J. L. Taylor, M. K. Muth, and E. Leibtag (2009). Understanding differences
in self-reported expenditures between household scanner data and diary survey data: A
comparison of homescan and consumer expenditure survey. Review of Agricultural Eco-
nomics 31 (3), 470–492.
Zhu, C., R. Huang, and M. Cohen (2012). Product reformulation and advertising abeyance:
Using voluntary marketing initiatives to reduce childhood obesity. University of Connecti-
cut mimeo.
35