THE IMPORTANCE CONTINUOUS...
36
UNIVERSITY OF CALIFORNIA COLLEGE OF AGRICULTURE AGRICULTURAL EXPERIMENT STATION BERKELEY, CALIFORNIA THE IMPORTANCE OF CONTINUOUS GROWTH IN BEEF CATTLE H. R. GUILBERT, G. H. HART, K. A. WAGNON, and H. GOSS Supplemental feeding on San Joaquin Experimental Range. BULLETIN 688 September, 1944 UNIVERSITY OF CALIFORNIA BERKELEY, CALIFORNIA
Transcript of THE IMPORTANCE CONTINUOUS...
UNIVERSITY OF CALIFORNIA COLLEGE OF AGRICULTUREAGRICULTURAL EXPERIMENT STATION
BERKELEY, CALIFORNIA
THE IMPORTANCEOF CONTINUOUS GROWTH
IN BEEF CATTLEH. R. GUILBERT, G. H. HART, K. A. WAGNON, and H. GOSS
Supplemental feeding on San Joaquin Experimental Range.
BULLETIN 688
September, 1944
UNIVERSITY OF CALIFORNIA BERKELEY, CALIFORNIA
CONTENTSPAGE
Introduction 3
Eeview of literature 4
Experimental procedure 6
Eange area and forage 7
Animals used 9
Weights 9
Measurements 9
Photographs 10
Feeding 10
Marketing, slaughter, and carcass studies 12
Results 12
Discussion 26
General considerations 26
Growth and development 29
Carcass differences 29
Summary and conclusions 32
Literature cited 35
THE IMPORTANCE OF CONTINUOUS GROWTHIN BEEF CATTLE 2
H. R. GUILBEET,3 G. H. HART,4 K. A. WAGNON,5 and H. GOSS6
INTRODUCTIONAccording to a recent study (Guilbert, Fluharty, and Shepard, 1943 ),
7 72
per cent of California's 1942 beef production was derived from range forage,
field cleanup, and the hay production that is an integral part of the range-
cattle business. Beef cattle utilize and convert into human food the forage pro-
duction from an estimated 40 million acres of range lands, amounting to 40
per cent of the land area of the state.
A major problem, therefore, confronting beef-cattle producers is how best
to utilize the natural vegetation. The fallacy of expanding animal numbersbeyond feed supply has become generally recognized because of the difficult
problems arising from the war emergency.
The indices to guide operators are the pounds of beef produced per acre,
per animal unit, and per man hour, with due consideration for the condition
of the range and the well-being of the cattle. As suggested earlier (Wagnon,Guilbert, and Hart, 1942), the concept of maximum forage utilization com-
patible with maximum production per animal unit might be widely applied in
defining the proper rates of stocking from both economic and ecological
standpoints.
Efficient meat production and efficient use of range feed involve supple-
mental feeds. These are supplied during the dry season to furnish specific
essential nutrients that become deficient in the natural vegetation. Thus a
plane of nutrition may be attained that will promote continuous growth anddevelopment—a consideration especially important in young animals at the
time when the growth rate is potentially greatest and when live-weight gains
are most economical. These principles apply to animals that will be finished
on the range and to those that will be sold as feeders for feed-lot fattening.
They also apply to breeding herds maintained for high percentage calf crop,
adequate milk supply, and heavier weights of calves at weaning time.
If beef ranches are not producing 80 to 85 per cent calf crops, 450- to 500-
pound calves at weaning, and 800- to 850-pound steers at yearling age, pro-
duction efficiency can usually be improved by changes in management andfeeding practices.
The data presented cover paired animals fed approximately equal quantities
of supplemental feed and carried to approximately equal finish, but fed at
1 Eeceived for publication March 23, 1944.2 This report is part of a project on range livestock management in the granite area of the
Sierra foothills. Cooperators in the project are the California Forest and Range ExperimentStation, U. S. Forest Service, and the Division of Animal Husbandry, College of Agriculture,University of California.
3 Associate Professor of Animal Husbandry and Associate Animal Husbandman in theExperiment Station.
4 Professor of Animal Husbandry and Animal Husbandman in the Experiment Station.5 Assistant in Animal Husbandry.8 Professor of Animal Husbandry and Animal Husbandman in the Experiment Station.7 See "Literature Cited" for complete data on citations, which are referred to in the text
by author and date of publication. r o -i
4 University of California—Experiment Station
different times so that the growth curves are widely different. The results
show strikingly how one can meet problems of production efficiency eco-
nomically by using supplemental feeds in limited quantities when they are
most needed and best utilized by the animals.
REVIEW OF LITERATURE
Space would not permit complete citation of work having a bearing on the
present experiment. All experiments on nutrition and production show that
with animals, as with machines, factories, or other working units, production
is most efficient when operation is proceeding at a rate that approaches full
capacity. In the dairy cow or the meat animal, the feed requirement for bodymaintenance and temperature regulation represents a large part of total feed
use. The greater the rate of production (within certain limits) that can be
obtained by liberal feeding, the greater is the efficiency from the standpoint
of pounds of feed required per pound of resulting product. This may be re-
ferred to as biological efficiency. Economic efficiency depends upon relative
costs of different phases of production—for example, cost of summer gain on
range compared with winter gain on hay or concentrate supplements. These
considerations modify the degree of approach to the ideal that may be madeunder any specific situation. Maintenance for short periods may, in some cases,
be justified (Black, Quesenberry, and Baker, 1939) . In general, however, very
close correlation is found between biological efficiency and economic efficiency
as represented by returns in dollars and cents, especially when one takes the
broader viewpoint of the lifetime history and performance of the animals.
An extensive fundamental study on the effect of nutritional plane and age
on efficiency of feed utilization, development, and composition of the bodyand the carcass was outlined by Waters and carried out by Trowbridge,
Moulton, and Haigh (1915, 1918, 1919; Moulton, Trowbridge, and Haigh,
1921, 1922a, 1922&). In this work at the Missouri Agricultural ExperimentStation, higher planes of nutrition proved to be more efficient from the stand-
point of energy recovery and of the recovery of edible meat ; undernutrition,
resulting in a slow rate of gain, affected the height growth least, the length
growth and width at hips to a greater extent ; hindquarter development wasretarded more than forequarter by undernutrition and stimulated most by a
high plane of nutrition. Marked differences, of course, developed in percent-
age of bone, fat, and lean in the carcasses as a result of different planes of
nutrition. Some animals were continued on experiment over a period of three
to four years. In these experiments the ration was composed of alfalfa hay,
grain, and linseed meal and presumably was nutritionally complete. Thetotal daily allowance, however, was varied to secure the different growth rates
desired.
Watson (1943) at University College, London, seeking information basic
to wartime food-production policy in England, evaluated the Missouri data
thoroughly. He desired to establish the mathematical relations of nutritional
plane, age, and weight to efficiency of production. His analysis further em-
phasizes the physiological efficiency of high nutritional planes. Doubling the
food intake over maintenance was shown to increase efficiency 4.8 times. Ac-
cording to Watson's calculations, full-feeding to a weight of 840 pounds live
[Bul. 688] Importance of Continuous Growth in Beef Cattle
weight with a carcass fat content of about 22 per cent and a carcass yield of
60 per cent gave highest efficiency if protein return was the sole consideration.
Considered on an energy basis alone, a live weight of 1,700 pounds, together
with 35 per cent fat in the carcass and a yield of 64 per cent, was most efficient.
If both fat and protein were considered in relation to the value indicated bypopular preference, then 1,150-pound animals dressing out about 59 per cent
had highest efficiency—a weight and yield consistent with common market
practice.
Hammond and his co-workers at Cambridge University, England, have
attacked in the broadest and most basic manner the problem of efficient pro-
duction of high-quality carcasses. These workers have covered both wild anddomestic species in studies of growth and development. They particularly
200
1 L_J I I I
300c/oc/sA///
0/r//i 4 0/2/6 20 24 28 32 36 40
Age - n/eeAs
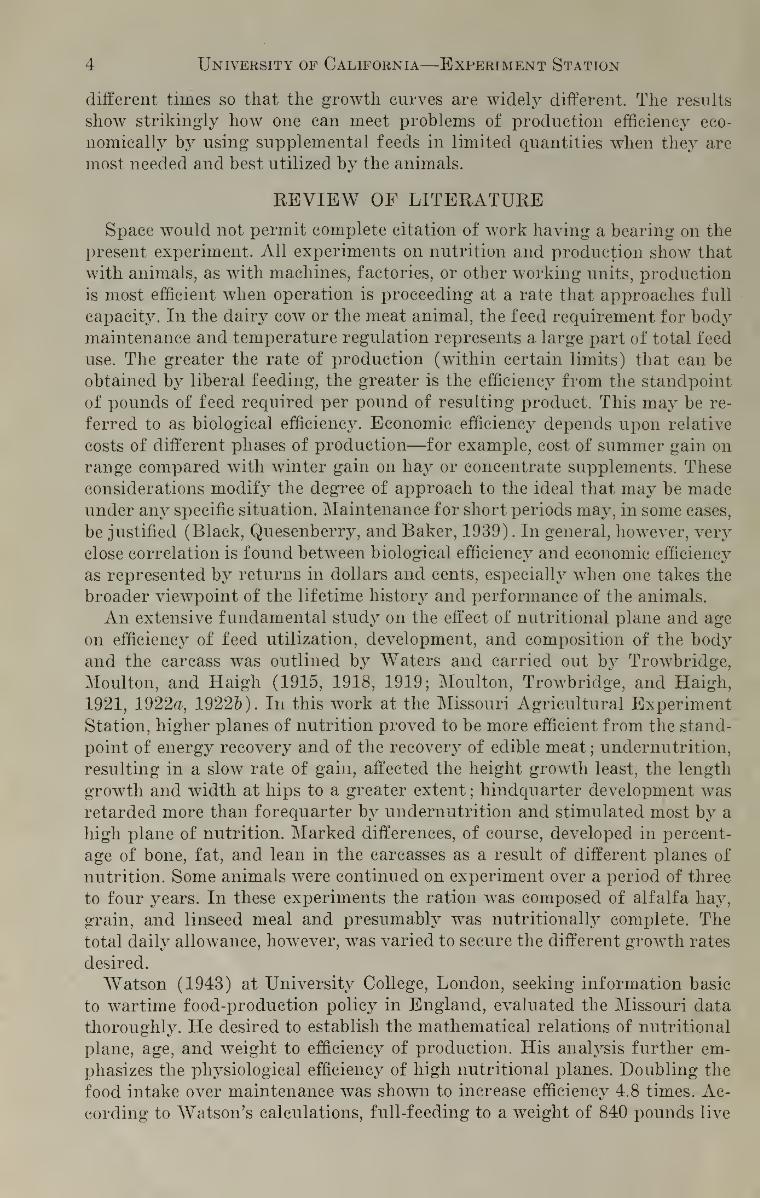
Fig. 1.—Plan of McMeekan's (1940-1941) experiment with swine.
considered, for various parts of the body, the differential growth rates that
occur between birth and maturity and result in the difference in body shape
of young and adults. Hammond's many years of carcass measurements at the
Smithfield Show in London have been coupled with studies of British breeding
data. His lifetime investigations of the physiology of reproduction and growth,
in which he has followed in the footsteps of two distinguished predecessors,
Marshall and Heape, make the Cambridge group the chief center of thoughtin these subjects.
McMeekan's (1940-1941) recent classic work with swine, in Hammond'slaboratory, substantiated and extended the previous work of Verges (1936)
with sheep, showing how variations in shape of the growth curve affect the
relative development of parts and the composition of the carcass. This workdemonstrated that (within limits) one could obtain the desired carcass charac-
teristics either by imposing a nutritional environment in the necessary direc-
tion or by changing the strain or breed to an earlier- or later-maturing type.
Figure 1 illustrates the plan of McMeekan's experiments with swine. Litter
mates from an inbred strain were selected to minimize genetic variation in
the experimental animals. One group, designated as "high-high," was kept
6 University of California—Experiment Station
on a high plane of nutrition until the animals reached a slaughter weight of
200 pounds at 180 days of age. A second group, designated as "low-low," wascontinued on a limited ration and attained 200 pounds weight in 300 days. Theplane of nutrition of the other two groups, high-low and low-high, was so
regulated that they both reached 200 pounds at 240 days of age, but by differ-
ent routes. Table 1 shows the differences in carcass composition. The high-high
group made the best butcher hogs ; the high-low the best bacon carcasses. Thelow-high group, though it weighed as much at the same age as the litter matesin the high-low group, had an excessive amount of fat in relation to develop-
ment of muscle. This group had the characteristics of an early-maturing lard
type, as compared with the bacon type in the high-low group. The group kept
TABLE 1
Variation in Percentage Composition of Carcass Depending
on the Shape of the Growth Curve
(McMeekan, 1940-1941)
Group
High-high
Low-low .
.
High-low.
Low-high
.
Live weight,pounds
200
200
200
200
Percentage composition of carcass
Bone
11
12
11
10
Muscle
40
49
45
36
Fat
38
27
33
44
on a low plane of nutrition were long and lean of body; had too high a propor-
tion of legs, head, and neck; showed poor development of loin and hind-
quarter; and yielded carcasses deficient in fat, Detailed study of the per-
centage increase in individual bones, muscles, and fat tissue throughout the
body demonstrated that in undernutrition the length growth of bones takes
priority, for nutrients available, over thickness growth; early-maturing parts
(long bones, head, neck, and forequarter) over late-maturing parts such as
loin and hindquarter ; muscle growth over fat deposition. At 16 weeks of age,
for example, the weight of the loin in the high-plane pigs was 450 per cent that
in the low plane, and the head was 209 per cent. Similarly the weight of the
fat in the high-plane pigs was 1007 per cent that of the low plane, while bone
was only 224 per cent. Thus those tissues and parts that develop later in life
(such as loin and fat) are stimulated by a rapid rise in the weight-growth
curve, whereas the proportion of earlier-maturing parts (such as head andbone) is accentuated by a slow rise of the weight curve.
EXPERIMENTAL PROCEDUREThe Missouri experiments were involved with variations in plane of nutri-
tion, each plane remaining more or less constant for definite periods. In
McMeekan's work, final weight was the constant factor. The present experi-
ment was an attempt to follow, with modifications, the pattern of McMeekan'shigh-high and low-high groups under the environmental conditions of the
San Joaquin Experimental Range. This experiment differed in that the high
group was fed for continuous but not maximum gain, time was equal for both
[BrL. 688] Importance of Continuous Growth in Beef Cattle 7
groups, and approximately equal fatness was attained at different average
final weights. Since desirable market weight is less sharply defined for cattle
than for swine and sheep, perhaps equality of finish may be a more practical
constant to require in some types of cattle experiments.
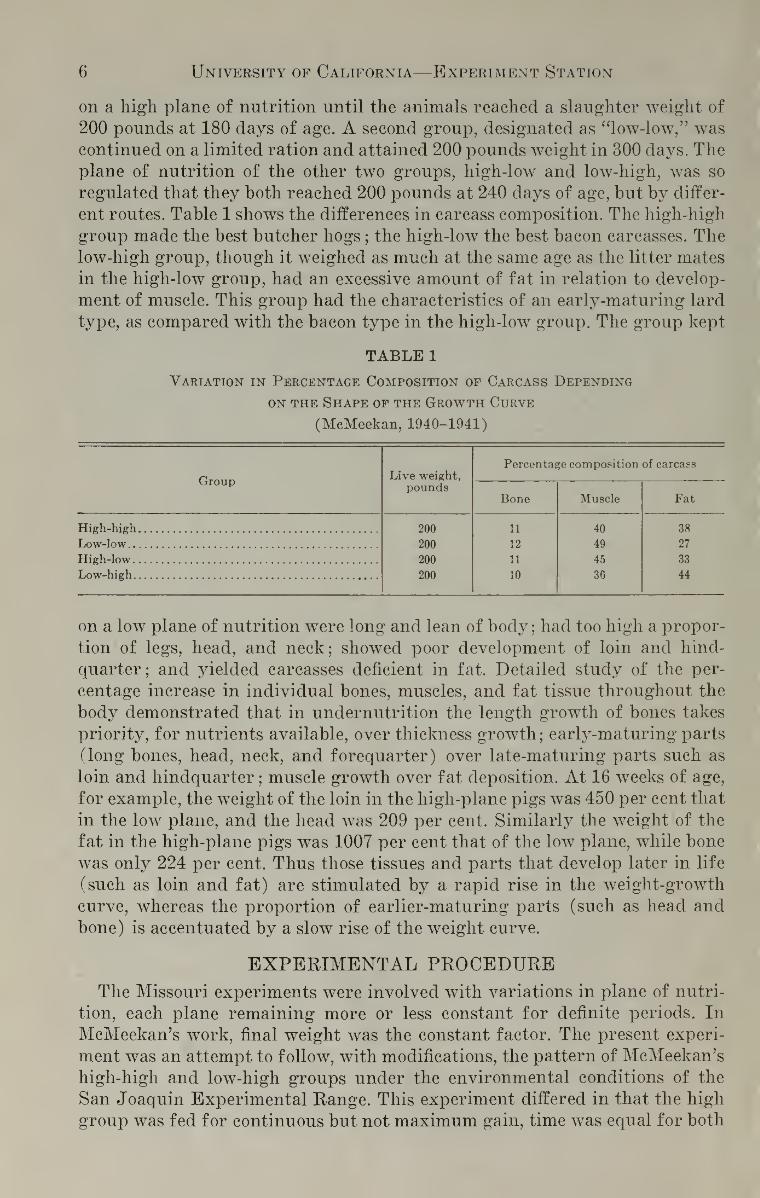
Range Area and Forage.—The San Joaquin Experimental Range is located
in the so-called granite area of the Sierra Nevada foothills at an elevation of
1,000 to 1,500 feet. The area is characterized by scattered oak and Digger pine
trees and brush, with a ground cover consisting largely of annual grasses and
herbs. The soil, derived from decomposed granite, is shallow except in swales,
100
90
60
70
K 60
<o 50
it' 40-
30
20
10
^GREEN FORAGE
I
\
V \
4-'I
/
I
J
.o e<
\
I
I
| T.O.N. IN
> 1 DRY MATTERc«- L,o—o^.. —- o— o -~e_ <j_ o— c— °'
DIGESTIBLEPROTEIN
j*/
JAN. FEB. MAR. APR. MAY JUNE JULY AUG. 6ER OCT. NOV. DECFig. 2.—Typical seasonal changes in total digestible nutrients and digestible protein in
dry matter of the forage as grazed on the San Joaquin Experimental Bange, together withan estimate of percentage of green forage consumed.
which constitute a small part of the total area. Rock outcroppings are numer-ous. The area, the environmental conditions, the forage, and the organization
of investigational work are described in detail by Hutchison and Kotok (1942)
.
The annual grasses and herbs germinate quickly after the first rains, usually
in November. Because of low temperature, growth is slow until February.
A short period of rapid forage development in March and April is followed bymaturing and drying in May and June. The time of forage drying depends on
late spring rains and varies from year to year. Swale areas normally remain
green into June, and nearly all the forage is completely dry by the first of
July. Small quantities of Spanish clover or other late-growing species remaingreen for a longer period, but are quickly utilized by grazing.
Figure 2 illustrates the typical seasonal changes in the range forage. Thecurves are based upon chemical analyses of forage samples composited over
8 University of California—Experiment Station
2-week periods throughout the year and collected, to represent actual grazing,
by following the cattle. Digestibility is based upon digestion trials with similar
green forage, together with digestion trials on samples of the dry grass,
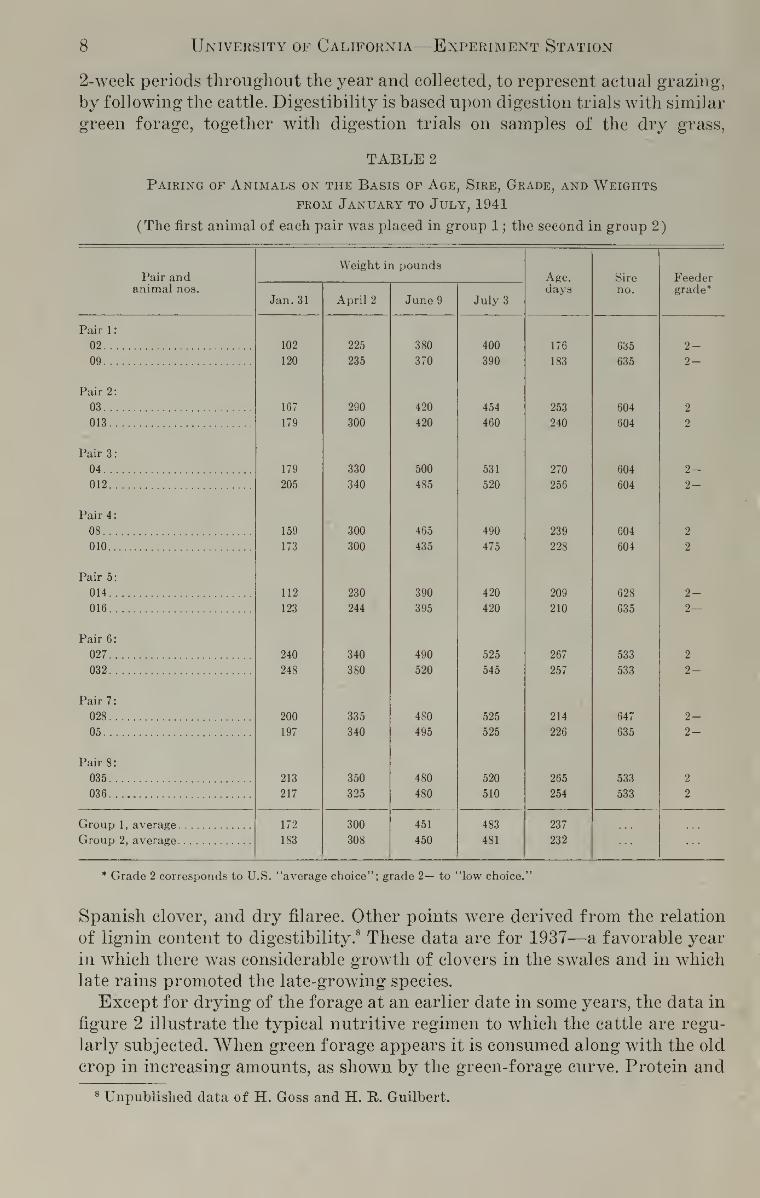
TABLE 2
Pairing of Animals on the Basis of Age, Sire, Grade, and Weightsfrom January to July, 1941
(The first animal of each pair was placed in group 1 ; the second in group 2)
Pair andWeight in pounds
Age,days
Sire
no.Feeder
animal nos.Jan. 31 April 2 June 9 July 3
grade*
Pair 1 :
02 102
120
225
235
380
370
400
390
176
183
635
635
2-09 2—
Pair 2:
03 167
179
290
300
420
420
454
460
253
240
604
604
2
013 2
Pair 3:
04 179
205
330
340
500
485
531
520
270
256
604
604
2-012 2-
Pair 4:
08 159 300 465 490 239 604 2
010 173 300 435 475 228 604 2
Pair 5:
014 112
123
230
244
390
395
420
420
209
210
628
635
2-016 2—
Pair 6:
027 240 340 490 525 267 533 2
032 248 380 520 545 257 533 2-
Pair 7:
028 200
197
335
340
480
495
525
525
214
226
647
635
2-05 2-
Pair 8:
035 213 350 480 520 265 533 2
036 217 325 480 510 254 533 2
Group 1, average 172 300 451 483 237
Group 2, average 183 308 450 481 232
* Grade 2 corresponds to U.S. "average choice"; grade 2— to "low choice."
Spanish clover, and dry filaree. Other points were derived from the relation
of lignin content to digestibility.8 These data are for 1937—a favorable year
in which there was considerable growth of clovers in the swales and in whichlate rains promoted the late-growing species.
Except for drying of the forage at an earlier date in some years, the data in
figure 2 illustrate the typical nutritive regimen to which the cattle are regu-
larly subjected. When green forage appears it is consumed along with the old
crop in increasing amounts, as shown by the green-forage curve. Protein and
8 Unpublished data of H. Goss and H. It. Guilbert.
[Bul. 688] Importance of Continuous Growth in Beef Cattle 9
total digestible nutrients reach a peak at the height of the growing season and
decline as the forage matures. The young green forage alone is more highly
digestible than the curves indicate. The trend is modified by the amount of old
forage taken with the new. Digestible protein, based on correction of apparent
digestibility for metabolic nitrogen (Guilbert and Goss, 1944), declines to
between 1 and 2 per cent. The slight rise in August was caused by selective
grazing by the animals, which were transferred to the previously ungrazed
dry forage containing some of the late-growing green plants and dried
legumes.
As shown by Wagnon, Guilbert, and Hart (1942), phosphorus declines with
the protein to levels of 0.10 to 0.20 per cent of the dry matter. The protein
deficiency during the years thus far studied has apparently been more acute
than the phosphorus, since no clinical symptoms of phosphorus deficiency such
as significantly lowered blood phosphate have been noted in unsupplemented
animals. Calcium content of the herbage is adequate throughout the year. Thetotal digestible nutrients in the dry forage before it is leached by autumnrains are sufficient to permit slow weight gain when protein deficiency is al-
leviated by protein concentrates that also supply sufficient phosphorus. Pre-
viously obtained data (Wagnon, Guilbert, and Hart, 1942) had shown that
without supplements all classes of cattle lost weight soon after the first of
July, regardless of the abundance of feed.
Animals Used.—Sixteen steer calves were selected at weaning time (July 1,
1941) from the Hereford herd on the Experimental Range. They were divided
into eight pairs matched as closely as possible for age, weight, consistency of
previous gains, sire, grade, and body measurements. Table 2 shows weights,
age, sire, and grade of each pair.
The sire was the same for paired animals, except that in pairs 5 and 7 the
sires were half brothers of comparable grade and quality.
Weights.—Because of the general impracticability of taking three con-
secutive daily weights under pasture and range conditions, a single weight
was taken at intervals of 25 to 35 days. The initial weight was recorded soon
after separation of the calves from their mothers. For subsequent weighing,
including May 11, 1942, the animals were driven from near-by pastures to
the corrals and weighed full between 8 :00 and 9 :00 a.m. On and after June 12,
weights were taken between 6 :00 and 7 :00 a.m. after the animals had stood
about 12 hours in a corral without feed or water.
In earlier studies,9
fill (determined by the amount of shrink in 12 hours)
increased with forage development to a maximum in May or June, but de-
clined thereafter as the feed dried, became nutritionally deficient, and wasrendered relatively unpalatable. Thus gains were exaggerated in the period of
increasing fill and minimized (or the losses exaggerated) in the period of de-
creasing fill. Shrunk weights reduced this systematic error and gave a truer
picture of body-weight changes.
Measurements.—At each weighing time the following measurements weretaken : height at withers, height at hook bones, heart girth, horizontal length
from point of shoulder to a line dropped vertically from the pinbones, length
of head at the eye level, and round measurement. This last measurement, pro-
9 Unpublished data of K. A. Wagnon and H. R. Guilbert.
10 University of California—Experiment Station
posed by Gregory (1933), extends horizontally from the point of the stifle
(patella) on one side around the thighs to the point of the stifle on the opposite
side. The animals were measured in a squeeze-type chute. They soon became
gentle (with one exception, no. 012) ; little difficulty was encountered in secur-
ing normal stance and satisfactory measurements. Previous culling of the wild
cows, together with careful handling of the cattle, had resulted in a remark-
ably tractable herd.
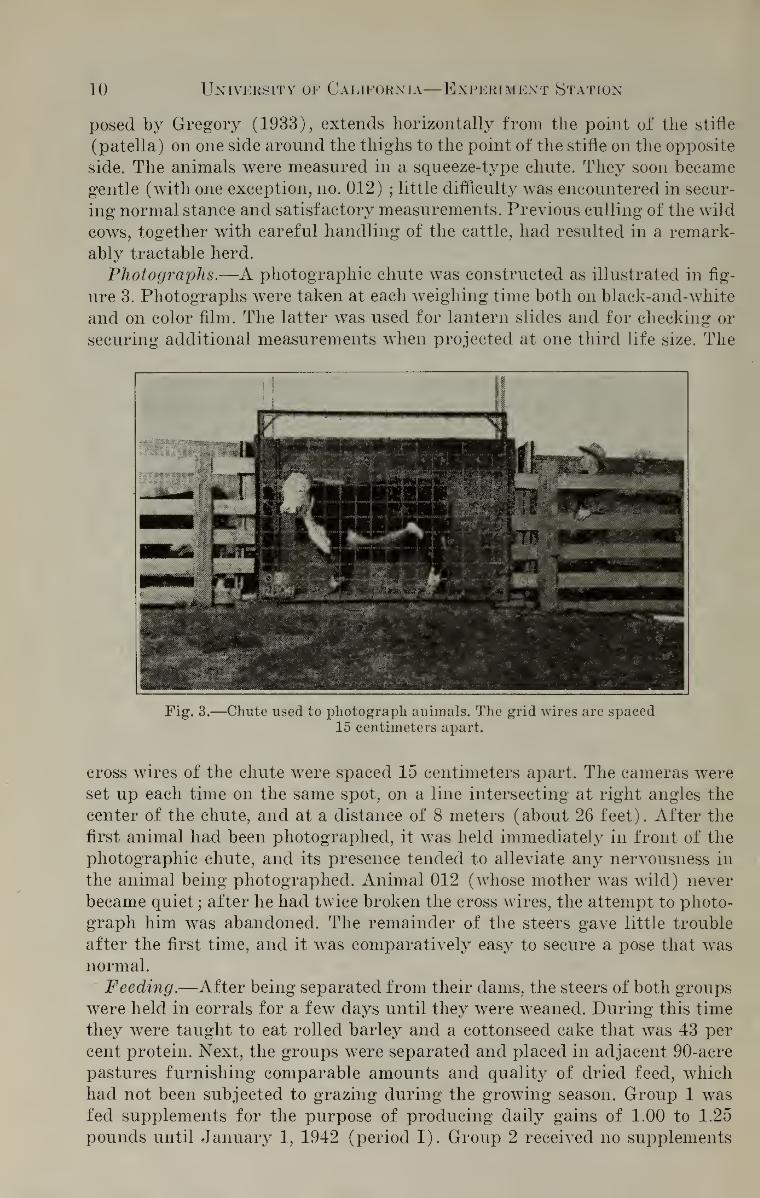
Photographs.—A photographic chute was constructed as illustrated in fig-
ure 3. Photographs were taken at each weighing time both on black-and-white
and on color film. The latter was used for lantern slides and for checking or
securing additional measurements when projected at one third life size. The
Fig. 3.—Chute used to photograph animals. The grid wires are spaced15 centimeters apart.
cross wires of the chute were spaced 15 centimeters apart. The cameras wereset up each time on the same spot, on a line intersecting at right angles the
center of the chute, and at a distance of 8 meters (about 26 feet). After the
first animal had been photographed, it was held immediately in front of the
photographic chute, and its presence tended to alleviate any nervousness in
the animal being photographed. Animal 012 (whose mother was wild) never
became quiet ; after he had twice broken the cross wires, the attempt to photo-
graph him was abandoned. The remainder of the steers gave little trouble
after the first time, and it was comparatively easy to secure a pose that wasnormal.
Feeding.—After being separated from their dams, the steers of both groups
were held in corrals for a few days until they were weaned. During this time
they were taught to eat rolled barley and a cottonseed cake that was 43 per
cent protein. Next, the groups were separated and placed in adjacent 90-acre
pastures furnishing comparable amounts and quality of dried feed, whichhad not been subjected to grazing during the growing season. Group 1 wasfed supplements for the purpose of producing daily gains of 1.00 to 1.25
pounds until January 1, 1942 (period I). Group 2 received no supplements
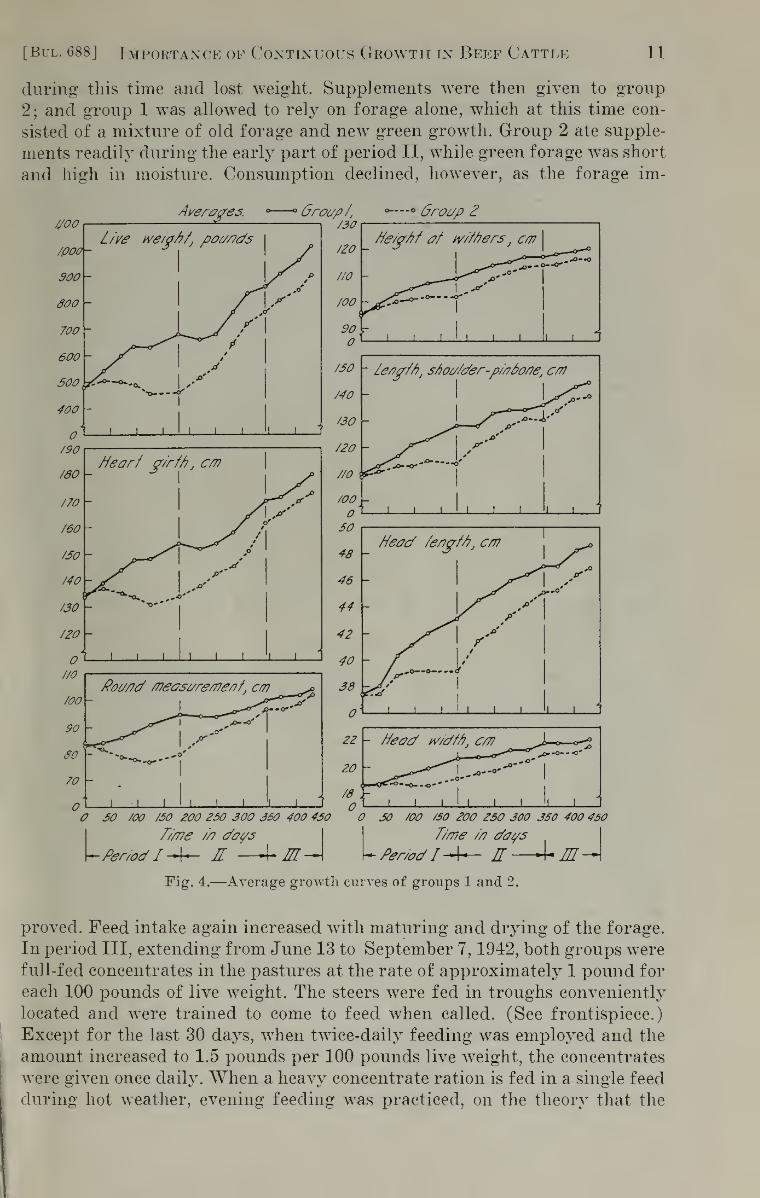
[Bul. 688] Importance of Continuous Growth in Beef Cattle 11
during this time and lost weight. Supplements were then given to group
2; and group 1 was allowed to rely on forage alone, which at this time con-
sisted of a mixture of old forage and new green growth. Group 2 ate supple-
ments readily during the early part of period II, while green forage was short
and high in moisture. Consumption declined, however, as the forage im-
//ooAverages. Oroi/p/j
/30
—• 6roi/p 2
/oo
90
SO
70
Poc//?d /neGss/re/nefifj cm
II ill 1 1 'i1
'
de/g/?f af tv/ftiersfcm
/SO - Le/iy/ti, stioc//der-p//7p'orteJ cm
MO IsZ./30
/20 J**"^*
//0 I
/OOi . ill i i
1 1'
SO
48
46
44
42
40
38
22
20
dead /enyftij cm
deod w/df/i, cm
30 /OO /30 200 230 300 350 400 430
///77<? //? days
—IL Per/od I £ m-
30 /OO /50 200 250 300 350 400 450
LT/me /n do//s
Per/od I E Vm-AFig. 4.—Average growth curves of groups 1 and 2.
proved. Feed intake again increased with maturing and drying of the forage.
In period III, extending from June 13 to September 7, 1942, both groups werefull-fed concentrates in the pastures at the rate of approximately 1 pound for
each 100 pounds of live weight. The steers were fed in troughs conveniently
located and were trained to come to feed when called. (See frontispiece.)
Except for the last 30 days, when twice-daily feeding was employed and the
amount increased to 1.5 pounds per 100 pounds live weight, the concentrates
were given once daily. When a heavy concentrate ration is fed in a single feed
during hot weather, evening feeding was practiced, on the theory that the
12 University of California—Experiment Station
resultant peak of body heat production might more readily be dissipated dur-
ing the cooler nights than during the heat of the day. Empirical observations
appear to justify this practice.
Table 3 gives the details of feeding throughout the experiment.
Marketing, Slaughter, and Carcass Studies.—The steers were brought fromtheir pastures to the corrals and weighed just before being loaded on the truck
at 3 :00 p.m., September 14. They arrived in the South San Francisco UnionStock Yards at 3 :00 a.m., September 15. They were allowed feed and water
;
were sold and weighed about 10 :00 a.m. of that day. They were purchased bySwift and Company, the buyer having attempted to evaluate the individual
animals as closely as possible. They were slaughtered on September 17, the
carcasses individually identified, and the warm dressed weights obtained. Thecarcasses, graded and stamped by official graders, were purchased by the
Safeway Stores and were transferred to their aging and distributing plant
on September 21. On September 24 the carcasses were weighed, the left sides
were cut into wholesale cute, and each cut was weighed. The cutting was done
by a Safeway crew. All the ribs were left on the forequarter. The cuts were
whole round including rump, whole loin including flank, prime rib, shin andshoulder (shoulder removed at the joint and including the cross arm cuts),
chuck including neck, and long plate including plate and brisket. After cutting
and weighing of the individual wholesale cuts, a sample consisting of the 12th
and 13th rib cuts was taken from each carcass. These rib cuts were brought to
Davis, the edible portions separated from the bone, and weights obtained on
meat and bone. The fat and lean from each rib cut were run twice through a
grinder and thoroughly mixed ; and a sample was taken for analysis of fat
and water content.
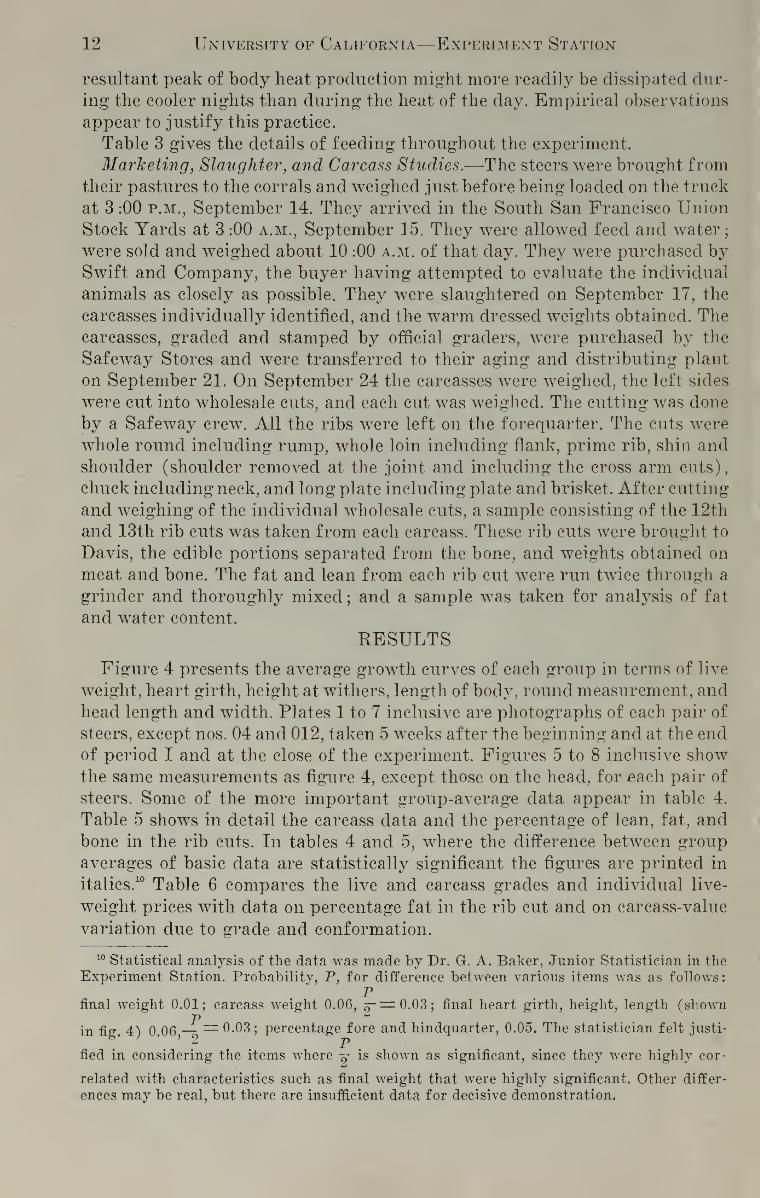
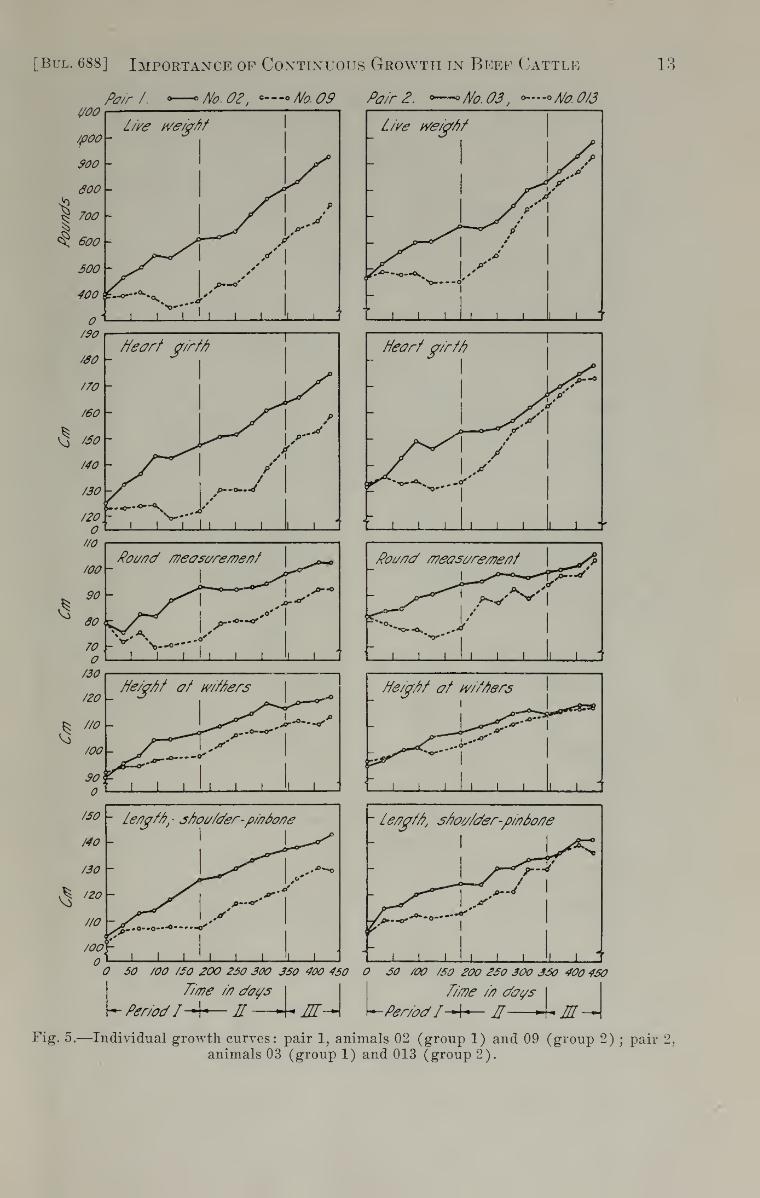
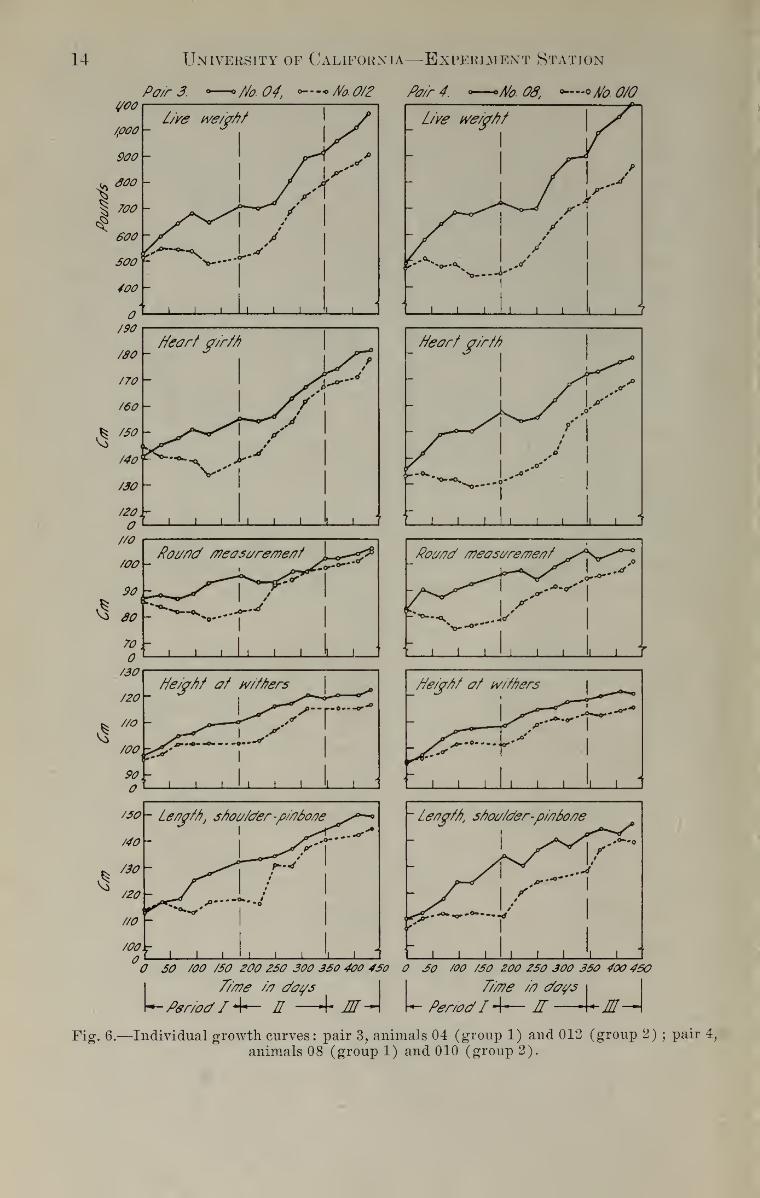
RESULTSFigure 4 presents the average growth curves of each group in terms of live
weight, heart girth, height at withers, length of body, round measurement, andhead length and width. Plates 1 to 7 inclusive are photographs of each pair of
steers, except nos. 04 and 012, taken 5 weeks after the beginning and at the endof period I and at the close of the experiment. Figures 5 to 8 inclusive showthe same measurements as figure 4, except those on the head, for each pair of
steers. Some of the more important group-average data appear in table 4.
Table 5 shows in detail the carcass data and the percentage of lean, fat, andbone in the rib cuts. In tables 4 and 5, where the difference between group
averages of basic data are statistically significant the figures are printed in
italics.10Table 6 compares the live and carcass grades and individual live-
weight prices with data on percentage fat in the rib cut and on carcass-value
variation due to grade and conformation.
10 Statistical analysis of the data was made by Dr. G. A. Baker, Junior Statistician in theExperiment Station. Probability, P, for difference between various items was as follows:
Pfinal weight 0.01; carcass weight 0.06, 5-= 0.03; final heart girth, height, length (shown
Pin fig. 4) 0.06 — = 0.03; percentage fore and hindquarter, 0.05. The statistician felt justi-
fied in considering the items where «c is shown as significant, since they were highly cor-
related with characteristics such as final weight that were highly significant. Other differ-
ences may be real, but there are insufficient data for decisive demonstration.
[Bul. 688] Importance of Continuous Growth in Beef Cattle
Po/rl. ^—+No.OZ, -—A/o.09 Pair 2. t>-—^No.03 J °~~°No.0/3
13
/ie/g/?f af tv/ftiers
^^Z^'^ 1
1 1 1 1 1 1 1 1 1 1-
O 50 /OO /50 200 250 300 350 400 450 O 50 /OO /50 200 250 300 350 4O0 450
VTime m dot/s
Period7'-+— E— -EL-A L-
Ti/ne m days
PeriodI-^r— E »1« EL —I
Fig. 5.—Individual growth curves: pair 1, animals 02 (group 1) and 09 (group 2) ;pair 2,
animals 03 (group 1) and 013 (group 2).
14 University of California—Experiment Station
Po/r3. •
—
*M).04t—-«MoO/2 Pair 4. <~^>A/o 08, °~--°A/oO/0
§
/zo
//o
/OOh,
90O
Hey/it &f tv/f/iers_!__
._..o—
-
*
1
ri
.«r-°
1 1
ill 1 1 i,1 '
tfe/y/if a/ w/ftiers
§
Lengf/i, sfiov/der-p/fibo/ie
O SO /OO /50 200 260 300 350 400 450
T/rie //i days
u Period f E M-
O SO /OO /SO 200 250 300 3SO 400 450
r//i?e //7 days
PeriodI ^r— IT mjFig. 6.—Individual growth curves: pair 3, animals 04 (group 1) and 012 (group 2) ;
pair 4,
animals 08 (group 1) and 010 (group 2).

PLATES
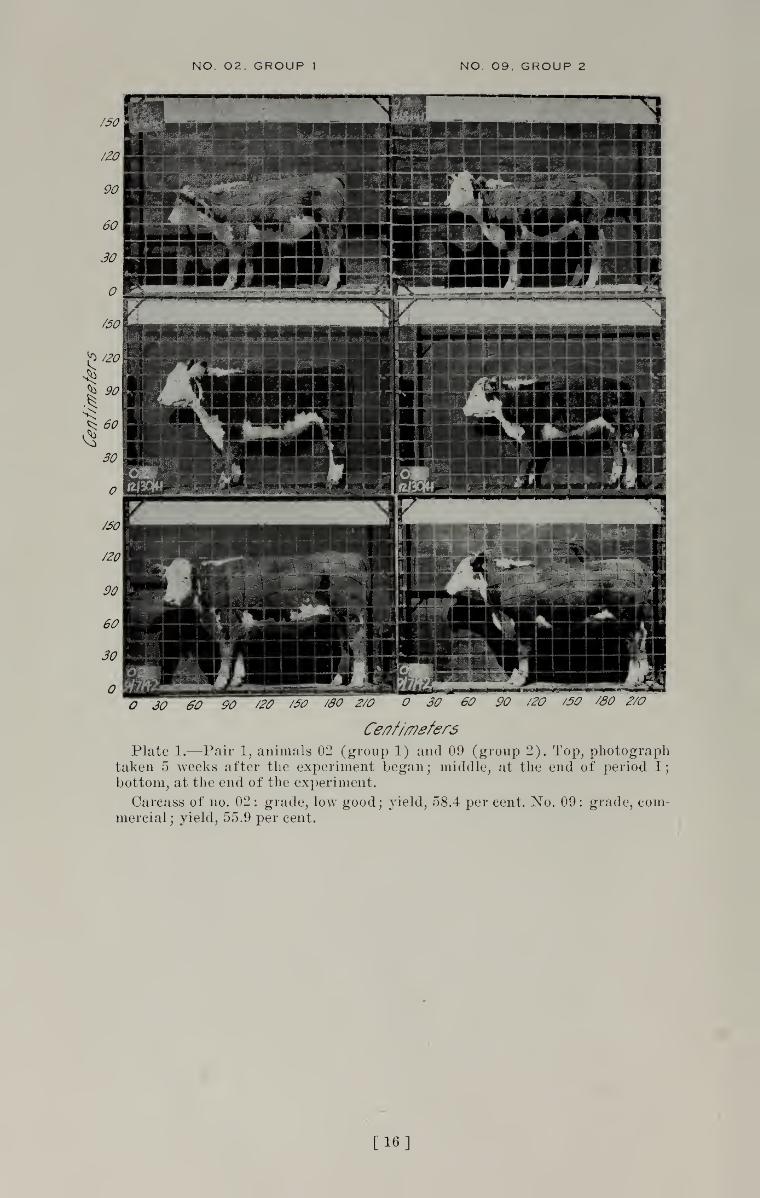
NO. 02. GROUP 1 NO. 09. GROUP 2
30 60 90 /20 /SO /SO 2/0 O 30 60 90 /20 /50 00 2/0
Ceflffmefers
Plate 1.—Pair 1, animals 02 (group 1) and 09 (group 2). Top, photographtaken 5 weeks after the experiment began ; middle, at the end of period I
;
bottom, at the end of the experiment.
Carcass of no. 02: grade, low good; yield, 58.4 per cent. No. 09: grade, com-mercial; yield, 55.9 per cent.
[16]
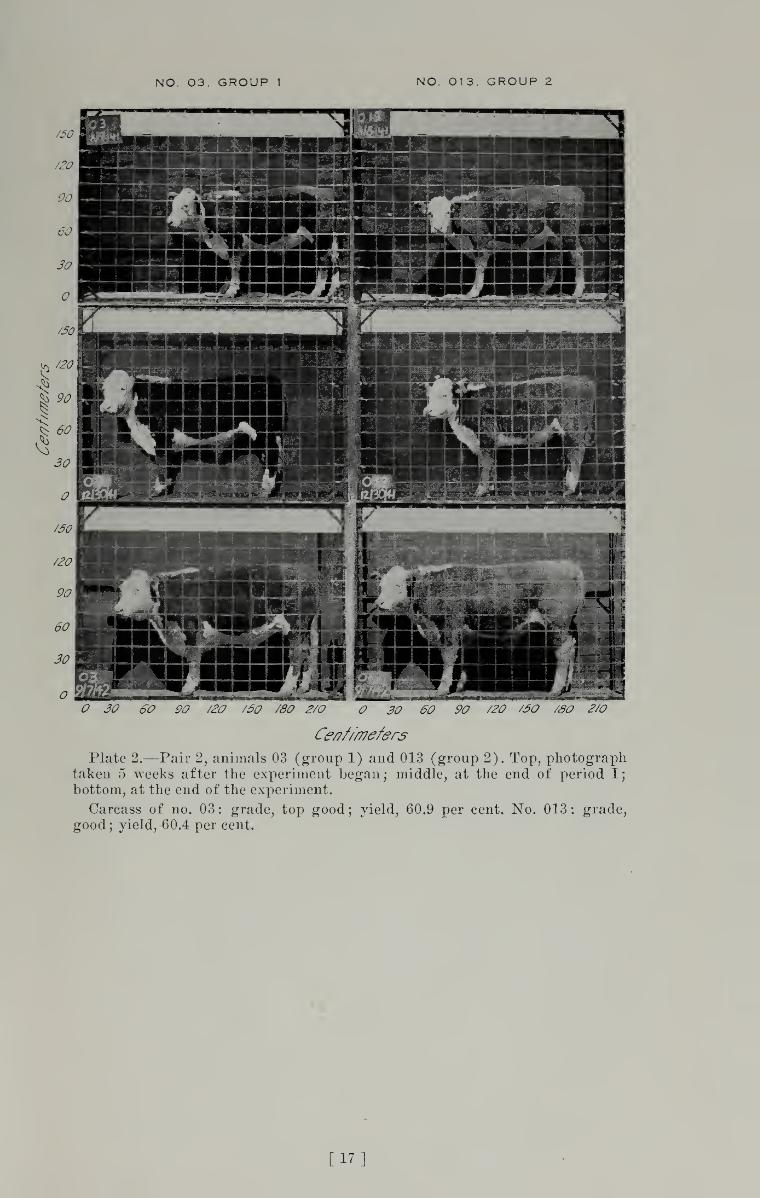
NO. 03. GROUP 1 NO. 013. GROUP 2
30 60 90 /20 /50 /80 2/0 30 60 90 /20 /50 /do 2/0
Ce/?fffffefer$
Plate 2.—Pair 2, animals 03 (group 1) and 013 (group 2). Top, photographtaken 5 weeks after the experiment began; middle, at the end of period Ij
bottom, at the end of the experiment.
Carcass of no. 03: grade, top good; yield, 60.9 per cent. No. 013: grade,
good; yield, 60.4 per cent.
[17]
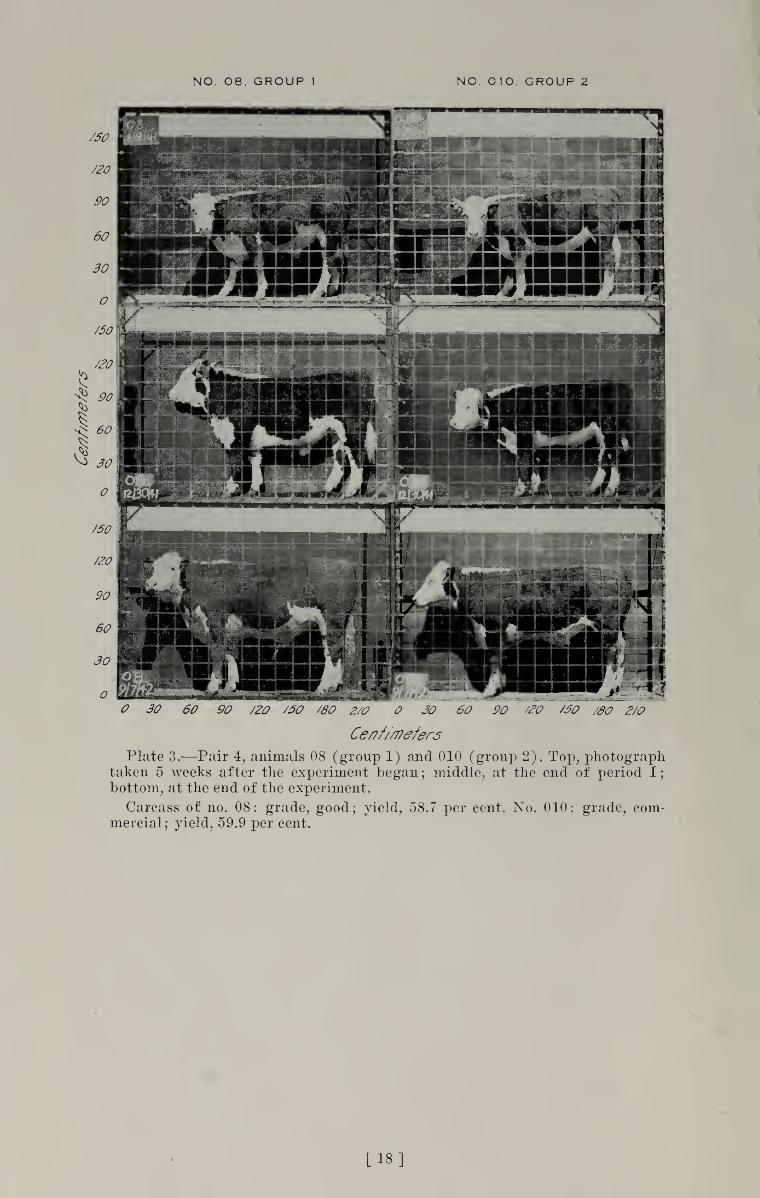
NO. 08. GROUP 1 NO. 010. GROUP 2
90 /20 /50 /80 2/0 '20 /50 /80 Z/O
Ce/?f//r?efers
Plate 3.—Pair 4, animals 08 (group 1) and 010 (group 2). Top, photographtaken 5 weeks after the experiment began; middle, at the end of period I;
bottom, at the end of the experiment.
Carcass of no. 08: grade, good; yield, 58.7 per cent. No. 010: grade, com-mercial; yield, 59.9 per cent.
Lis]
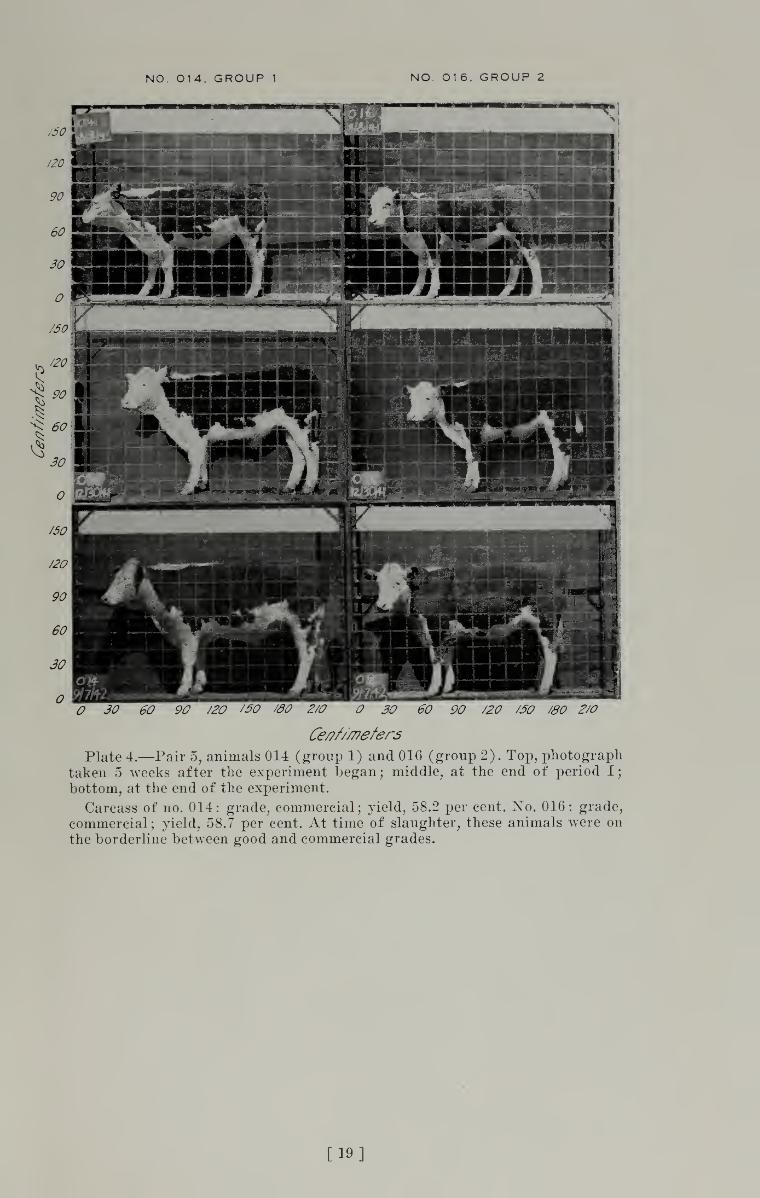
NO. 014. GROUP 1 NO. 016. GROUP 2
J<? ft? P<7 /a? /.#? #<? ^/<7 O 30 60 90 /20 /30 /80 2/0
Ce/?f//7?efers
Plate 4.—Pair 5, animals 014 (group 1) and 016 (group 2). Top, photograph
taken 5 weeks after the experiment began; middle, at the end of period I;
bottom, at the end of the experiment.
Carcass of no. 014: grade, commercial; yield, 58.2 per cent. No. 016: grade,
commercial; yield, 58.7 per cent. At time of slaughter, these animals were on
the borderline between good and commercial grades.
[19]
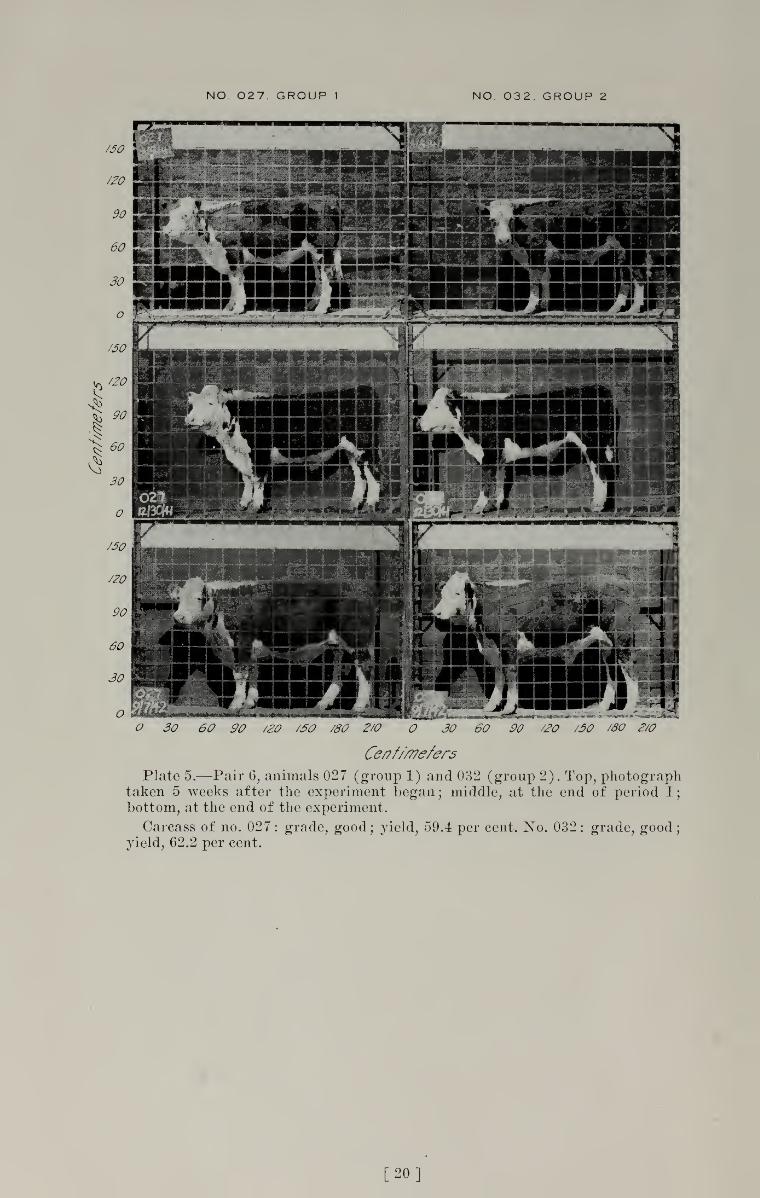
NO. 027. GROUP 1 NO. 032. GROUP 2
O 30 60 90 /20 /SO /80 2/0 30 60 90 /20 /50 /SO 3/0
Ce/?f//77efers
Plate 5.—Pair 6, animals 027 (group 1) and 032 (group 2). Top, photographtaken 5 weeks after the experiment began ; middle, at the end of period I
;
bottom, at the end of the experiment.
Carcass of no. 027: grade, good; yield, 59.4 per cent. No. 032: grade, good;yield, 62.2 per cent.
[20]
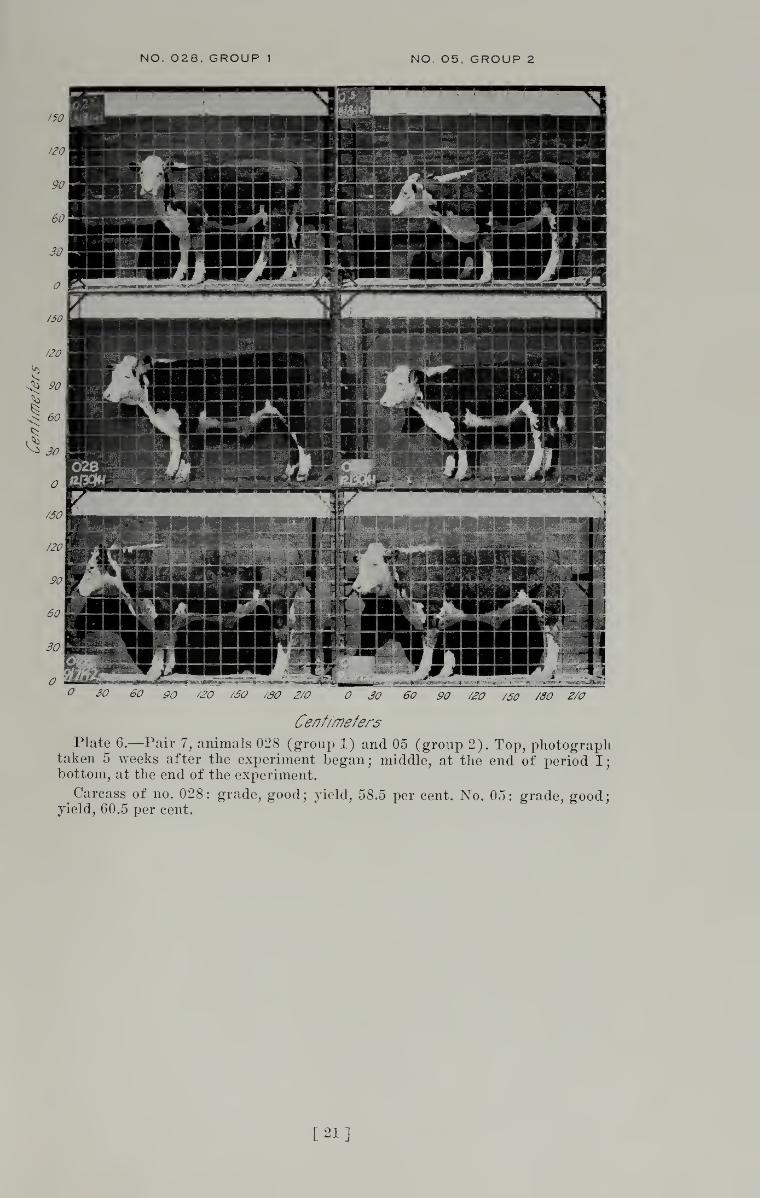
NO. 028. GROUP 1 NO. 05. GROUP 2
inm-'t*TH^„ : W^lb, .-MB!IB
lit; naniM i
.&? 5(7 Ptf /20 /50 /SO 2/0 JO 60 90 /20 /50 /80 2/0
Cenf/mefers
Plate 6.—Pair 7, animals 028 (group 1) and 05 (group 2). Top, photographtaken 5 weeks after the experiment began; middle, at the end of period I;bottom, at the end of the experiment.
Carcass of no. 028: grade, good; yield, 58.5 per cent. No. 05: grade, good;yield, 60.5 per cent.
[21]
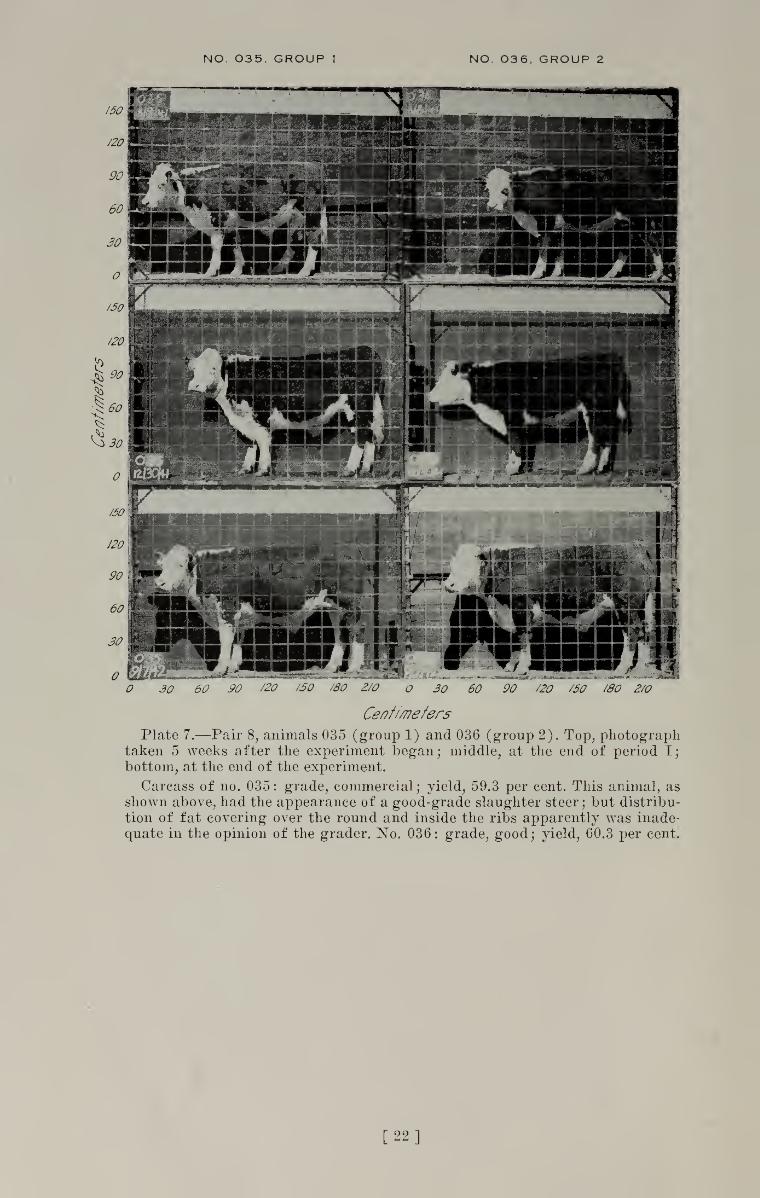
NO. 035. GROUP 1 NO. 036. GROUP 2
60 90 /20 /50 /80 2/0 '50 /80
Cenfi/nefers
Plate 7.—Pair 8, animals 035 (group 1) and 036 (group 2). Top, photographtaken 5 weeks after the experiment began; middle, at the end of period Ij
bottom, at the end of the experiment.
Carcass of no. 035 : grade, commercial;yield, 59.3 per cent. This animal, as
shown above, had the appearance of a good-grade slaughter steer ; but distribu-
tion of fat covering over the round and inside the ribs apparently was inade-
quate in the opinion of the grader. No. 036 : grade, good;yield, 60.3 per cent.
[22]
[Bul. 688 J Importance op Continuous Growth in Beef Cattle
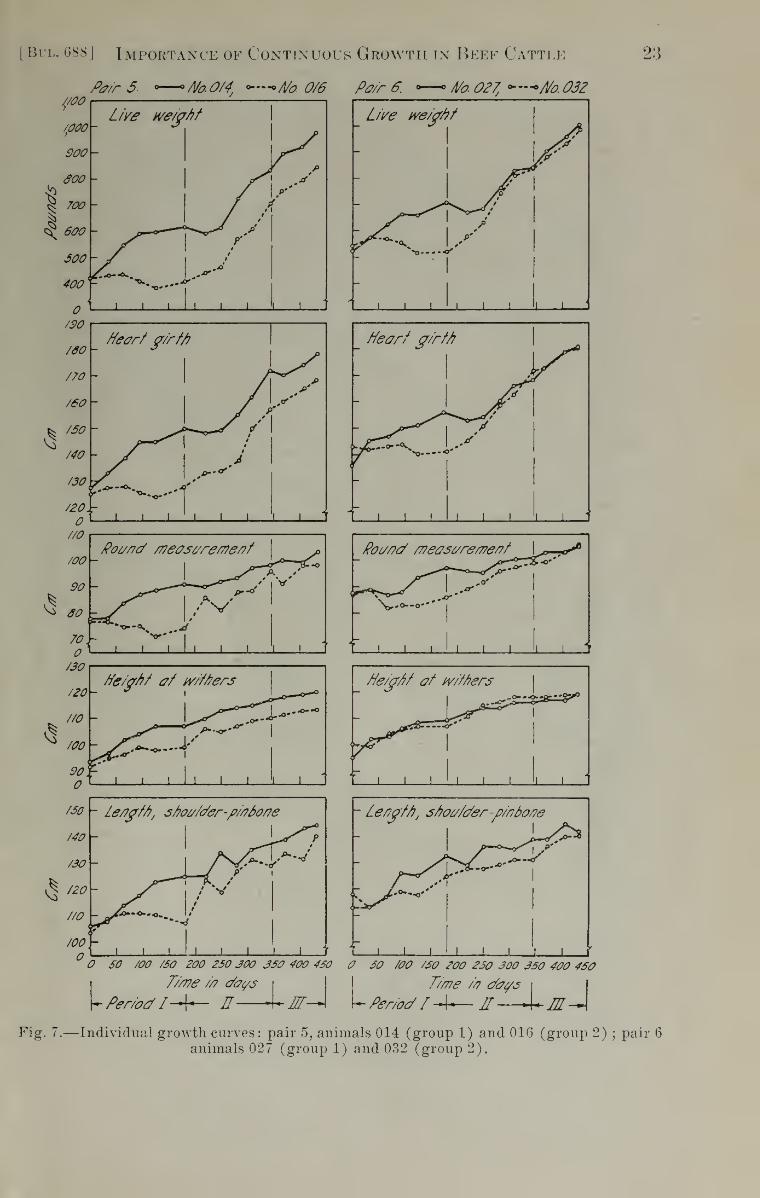
Pa/r 5. «
—
^ A/a 0/4, —•- A/a 0/6 Po/r 6.
—
* A/a 027, ~~*A/a 032
23
Pov/id /nees/sre/T/e/?/ Pai//?d /7?e/7s//re/7?e/?/ L,—<**
V-o—o--
f-o-'
1 1ill
1 1 'l 17
//e/gr/?/ &/ iv///?ers
/so - Le/?g//?, s/?ot//c/er-/>/rt/>or?e
I
J t
Le/?g//?t s/?o///c/er-/>/noo/?e
O SO /OO /SO 200 250 JOO S50 400 450 SO /OO /SO 200 2SO SOO S50 400 4SO
7/me //? c/a//sT///7e //? days
V Period'1'-4— H— m- *- Period' I £ ~m-AFig. 7.—Individual growth curves: pair 5, animals 014 (group 1) and 016 (group 2) ;
pair 6
animals 027 (group 1) and 032 (group 2).
24 University of California—Experiment Station
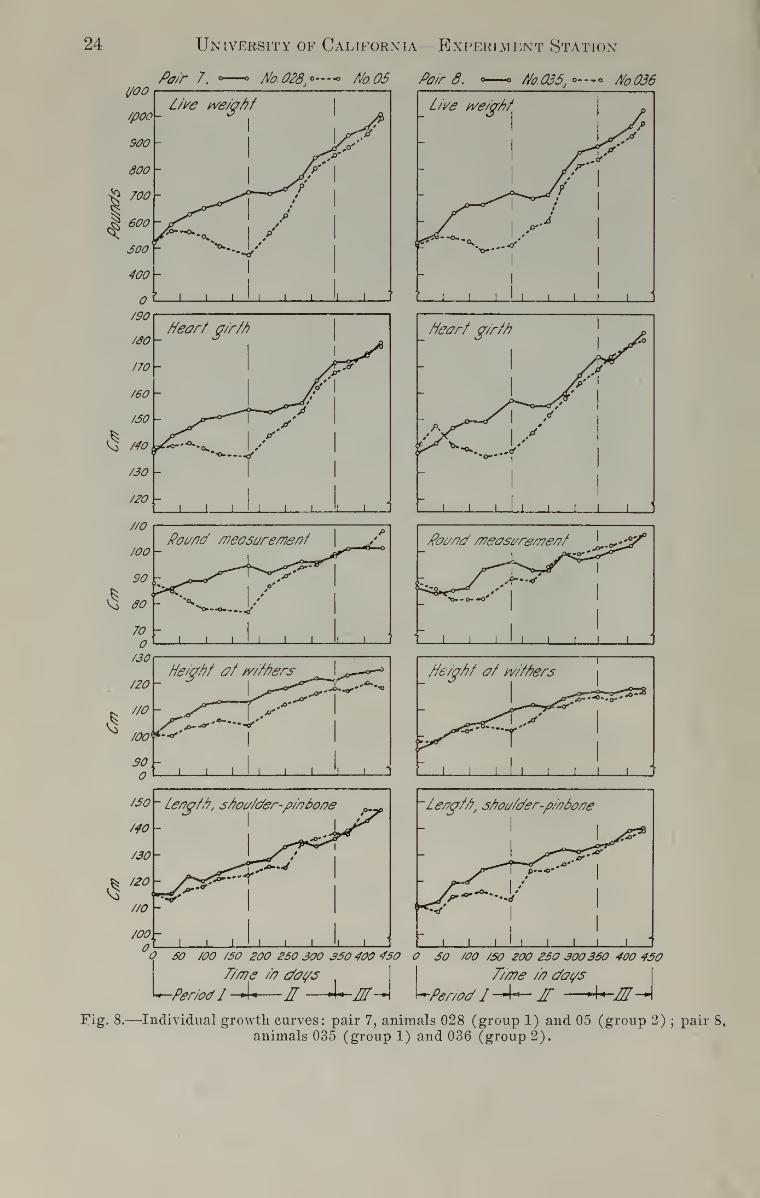
Pair 7. •— tfo.028t-~- No. 05 Pair 8. «>—* flo.035,—— A/o.036
Live tve/gtif
He/gtif #f tv/'/tiers
j j t
He/ahf af wi/tiers
/so - Leog/ti, stioc//der-p//76o/?e
/40 -
'Lergfti, stiou/der-p/rtbone
O SO /OO /SO 200 250 3O0 350 400 45O O SO /OO /50 200 25O 300 350 400 4S0
T///7S //? days P/d?e /ti days
•I*—H—X+-M-A U/*—PeriodI • -Period I- PT -4—M-MFig. 8.—Individual growth curves: pair 7, animals 028 (group 1) and 05 (group 2) ;
pair 8,
animals 035 (group 1) and 036 (group 2).

CO H Ph
PQ
EH
J<J>«wE-i
£MO£ /—
S
M nr>
w «tt mhH PW -tj
£en
ftw a>o fn
-*1 <y
H cti
oo C5£ 0)i—i i—
i
M .aP rt
PHM
ft
O oEH H3
oo T3
w ,P
O Ph!zi P
oP *H
P &c
JOc3
H<1 HFH
^x5?
a§wjft
Cm
Pm
oj•+»
oH
co CO ft-d a,—d co 3
o "3 -^
ft O <D3 CD
033)
**h
>>TJ
03 3 oTJ 33303 £ao3
o(-9o3 TJCM 0)
03
a3 O o3o +s S<H +3 Wo o
o
TJ >>03 03
!%«Ja
0343oEh
go co ftTJ 0J-—s3
co 3o1a
o -3 •+»
ft
TJ
O 03M 03
03
t*-H
>> TJ3 O
cb
TJ 2803M O03t-.
03
>c3 tj
03
I-H03CO
a 3 03
3o
o
oM£ 03
o
TJ >>03 03
3Stf.fi
COM3-CW> -s•-H CO03 03
*HSTJ8 03
E£•+3 CO
03 3-0*3T3 303-3>(-.
03+33M
TJ
"G03
ft.
CM O © CO Ocm co co "*< O
iO * n OrH T-H cm eo
irt >o o oi-H i-H CM CM
i-h
^ S 31 ^ 2OS h 2 07=i-H 1~ i—
i
- OO - . <=>
•O ~ «3 CO 0"3
5? "S -s > g
o o $ Q q
co » °! b- *"
£ S» a3 33 -; ca «? O8 « O
GO O £
TJ_o'G03
ft.
CM o to o> CM
>o OP * ^H iO
OS o CM 1^ mo |H o
CD © >o CO »o
H CM i-H o l-H
05 O Ttl CO
o o o
00 e lO CC m1—
1
CM o i—
.
3
CM
OS
^' CM
03 OJ
03 OS
—I CM
- I-.
Oi
fc. «3 5
i-i *^ CM CMCO 00 OO i—I ^h
S «J
S ^J33
p e a <j s
13O'G03
ft)
CO w *N CO N
O 00 t^.
CM CM Tt<
r-- Oi oi-H cm co
O OO t^
CM CM ^t
t~ o a>
t^ O CO
O « WCO CO w
© o oj
i-H CO CM
O "5 "5
CO CO "5
CM CM CM*S* "^ TftC33 05 OS
i? m a3 3 03
•-s << GQ
O33CO CM
03 ^ •
3 ^> M
•-S 1-3 <
CM
OS
03
33c4
t-a
+j3
-c 3M #
(H r03 i
—
i
axscogh3^-t^
n 3u Bl
3 S3+3
1-3
U ri u- (h 03
T3 a>
DO= Bj
+Jgj
*s3 r. 303
s03
S3
303 +J S3
a09a
a a3T3 3oo cu T,
-33 d
TJ
-i
TJ33
>S3
>0) on OJo
not CJ
*CM H —a a a3 3 33 o C
ooo
26 University of California—Experiment Station
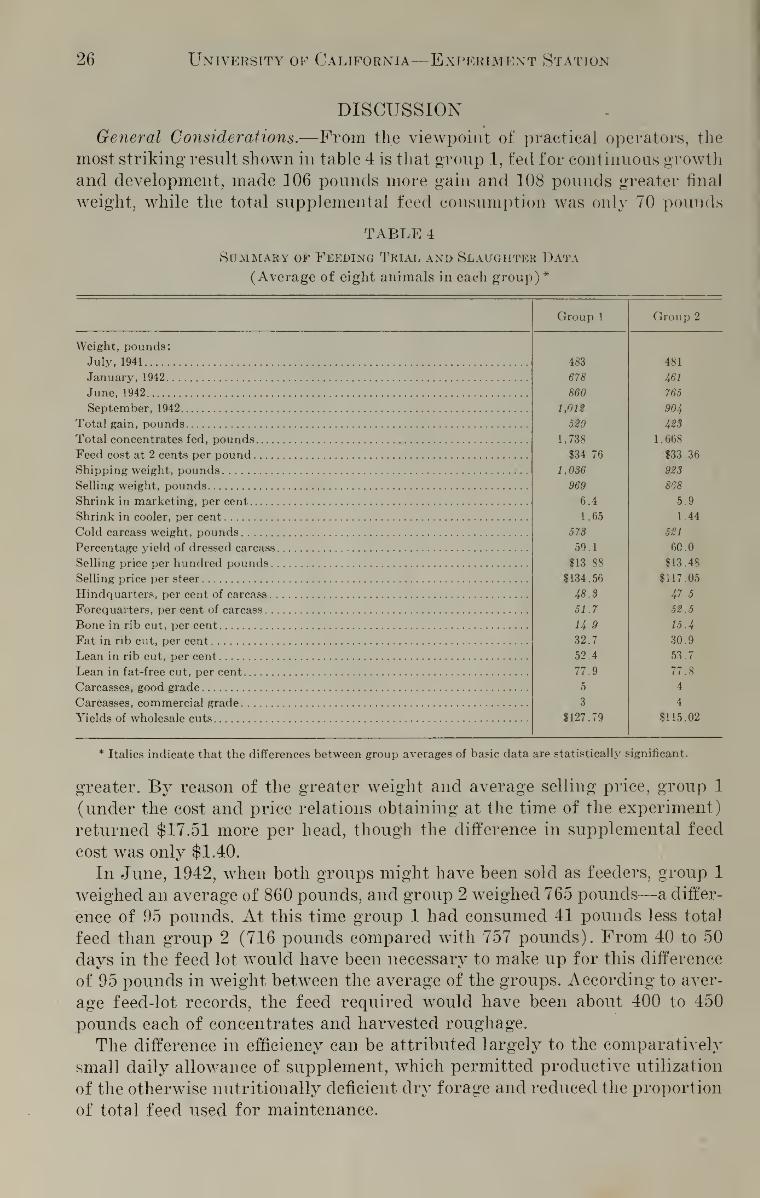
DISCUSSIONGeneral Considerations.—From the viewpoint of practical operators, the
most striking result shown in table 4 is that group 1, fed for continuous growthand development, made 106 pounds more gain and 108 pounds greater final
weight, while the total supplemental feed consumption was only 70 pounds
TABLE 4
Summary of Feeding Trial and Slaughter Data(Average of eight animals in each group) *
Weight, pounds:
July, 1941
January, 1942
June, 1942
September, 1942
Total gain, pounds
Total concentrates fed, pounds
Feed cost at 2 cents per pound ....
Shipping weight, pounds
Selling weight, poundsShrink in marketing, per cent
Shrink in cooler, per cent
Cold carcass weight, pounds
Percentage yield of dressed carcass
Selling price per hundred pounds.
Selling price per steer
Hindquarters, per cent of carcass
.
Forequarters, per cent of carcass. .
Bone in rib cut, per cent
Fat in rib cut, per cent
Lean in rib cut, per cent
Lean in fat-free cut, per cent
Carcasses, good grade
Carcasses, commercial grade
Yields of wholesale cuts
Group 1 Group 2
483 481
678 461
860 765
1,012 904
529 423
1,738 1,668
$34 76 $33.36
1,086 923
969 868
6.4 5.9
1.65 1 44
573 521
59.1 60.0
$13 88 $13.48
$134.56 $117.05
48.3 47 5
51.7 52.5
14.9 15.4
32.7 30.9
52.4 53.7
77.9 77.8
5 4
3 4
$127.79 $115.02
* Italics indicate that the differences between group averages of basic data are statistically significant.
greater. By reason of the greater weight and average selling price, group 1
(under the cost and price relations obtaining at the time of the experiment)
returned $17.51 more per head, though the difference in supplemental feed
cost was only $1.40.
In June, 1942, when both groups might have been sold as feeders, group 1
weighed an average of 860 pounds, and group 2 weighed 765 pounds—a differ-
ence of 95 pounds. At this time group 1 had consumed 41 pounds less total
feed than group 2 (716 pounds compared with 757 pounds). From 40 to 50
days in the feed lot would have been necessary to make up for this difference
of 95 pounds in weight between the average of the groups. According to aver-
age feed-lot records, the feed required would have been about 400 to 450
pounds each of concentrates and harvested roughage.
The difference in efficiency can be attributed largely to the comparatively
small daily allowance of supplement, which permitted productive utilization
of the otherwise nutritionally deficient dry forage and reduced the proportion
of total feed used for maintenance.
[Bul. oss J Importance of Continuous Growth in Beef Cattle 27
Xo means were available for ascertaining the amount of range forage
actually consumed by the two groups except that they had access to equal-
sized pastures of comparable feed. Stocking was at a rate above the average
maximum for the area.
Other information has demonstrated that animals on nutritionally deficient
diets consume less feed than when the ration is complete. From this we mayconclude that group 1 animals actually ate more forage during period I. Thefields, however, did not look noticeably different at the end of the period, for
feed disappears because of trampling, rodents, and weathering in any event.
The principal point is that in two equally stocked fields significant production
was induced in one case, actual weight was lost in the other, and the feed dis-
appeared in both.
As data (Wagnon, Griiilbert, and Hart, 1942) have shown, 300 to 600 poundsof supplemental feeds given to calves, during periods comparable with period
I in this experiment, resulted in weight differences varying from 100 to 255
pounds between them and control animals (receiving no supplement) at the
end of the following grass season. In large-scale ranch operations, including
the supplementing of deficient range and of low-protein hay, about 100 pounds
greater weight has been attained with as low as 200 pounds of extra feed.
These combined results justify certain statements : In California 200 to 300
pounds of supplemental feed given to younger cattle to promote continuous
growth and efficient use of dry range or hay will very commonly result in
about 100 pounds of additional weight. Such feed will replace about 500
pounds of concentrates and 400 to 500 pounds of harvested roughage required
to make up this difference later in the feed lots. In other words, the time re-
quired for feed-lot finishing is reduced about half.
This over-all view of production from the calf to the final product, rather
than a view of isolated production phases, is important. It considers not only
the profit of the producer but also the maximum amount of human food that
can be produced at the state or national level with the total feed available.
In this experiment and others cited, a lifetime total of 1,400 to 1,738 poundsof concentrates has resulted in grade-A long yearling* beef. Because of the
soil type, the relatively short period when the feed is nutritious, and the
acreage required per animal, this range must be considered a poor one fromthe standpoint of finishing cattle. The amounts of concentrates cited, how-ever, are not in excess of those required to finish in feed lots cattle of similar
age that have received no supplemental feed.
Judging from results, the total tonnage of beef produced from the feeds
available for beef cattle in California could be tremendously increased through
use of an increased proportion of the total for promoting continuous growth
during the 3 to 6 months of the year when the forage on most ranges is nu-
tritionally deficient or inadequate in quantity. The practice of allowing ani-
mals to gain and lose with the vagaries of climate and feed, although decreas-
ing, is still all too common. The lower efficiency of using the supplements andconcentrates only during a finishing period, either on range or in feed lots,
is shown by the fact that less total beef is produced with the same quantity
of feed.
The practicability of producing good-grade beef by a combination of sup-
28 University of California—Experiment Station
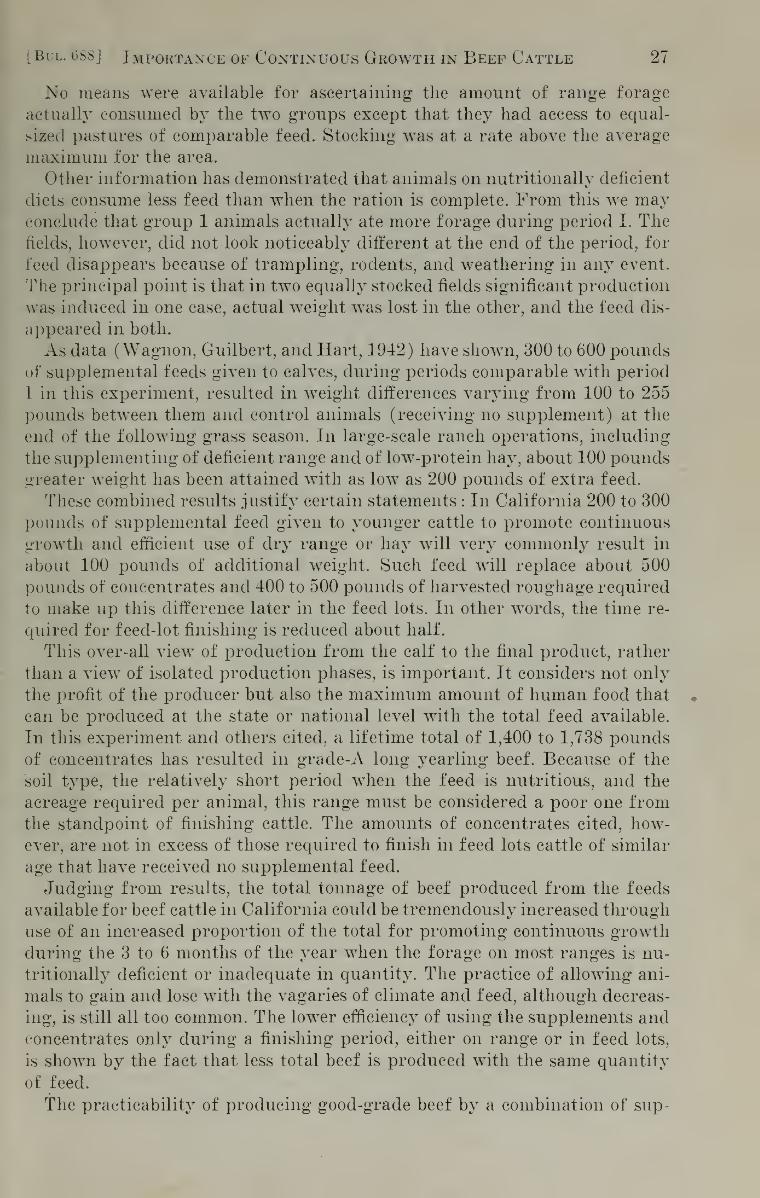
TABLE 5
Carcass Data: Yield, Shrinkage, Yield of Wholesale Cuts, Carcass Values, and
Composition of Rib Cuts
Groupno.
Animalno.
Carcassyield,
percent*
Coolershrink-age,
percentf
Hindquar-ters,
percentt
Forequar-ters,
percent
Wholeround,percent
Wholeloin,
percent
Primerib,
percent
Longplate,
percent
Shinand
shoul-der,
per cent
Chuck,percent
1 02 58.455.9
60.960.4
59.761.2
58.759.9
58.258.7
59.462.2
58.560.5
59 3
60.3
2.3
1.3
1.40.9
1.4
1.7
1.81.2
1.3
1.6
1.9
1.5
1.4
1.7
1.7
1.5
48.147.6
49.947.7
48.447.1
49 2
47.5
47.947.5
48.048.8
47.447.6
47.646.6
51.952.4
50 1
52.3
51.652.9
50.852.5
52.152.5
52.051.2
52.552.4
52 4
53.4
29.528.6
27.127.0
27.728.2
26.428.3
27.428.2
26.926.9
27.526.2
26.727.0
18.719.0
23.720.8
20.1
18.9
22.619.4
20 5
19.4
21.220.9
19.621.6
19.519.3
11.610.9
10 9
11.3
11.411.1
11.211.7
11.3
11.2
11.1
10.5
11.011.4
10 9
11.7
12.813.5
12 5
13 7
13.4
12.8
12.712.9
12.6
13.9
13.113.0
13.3
13.4
13.513.9
9.810.4
9.1
9.6
9.710.3
9.310 2
10.1
9.7
9.49.3
10.1
9.0
9.79.6
17.7
2 09 17.7
1 03 16.7
2 013 17.6
1 04 17.7
2 012 18.7
1 08 17.8
2 010 17.5
1 014 18.2
2 016 17.7
1 027 18.4
2 032 19.4
1 028 18.52 05 18.6
1
2
035036
19.7
18.6
Group 1, average§Group 2, average§
59.160.0
1.651.44
48.347.5
51.752.5
27.427.5
20.719.9
11.211.2
13
13.49.69.8
18.1
18.2
Animalno.
Carcassweight,pounds
Carcassgrade
Totalvalue, i
dollars^
Value percwt. dueto confor-mation,dollars||
Composition of 12th and 13th rib cut
Groupno.
Fat,per cent
Lean,per cent
Bone,per cent
Lean in
fat-free
cut,
per cent
1
2
1
2
02
09
03013
514
391
569541
612520
640488
541
478
573588
559584
578579
GoodCommercial
GoodGood
CommercialCommercial
GoodCommercial
CommercialCommercial
GoodGood
GoodGood
CommercialGood
118.2281.84
132.52124.48
128.28108.78
148.35102.43
113.83100.04
132 31
135.18
128.18134.79
120.69132.59
23 0022.93
23.2923.01
22.9922.95
23.1822.86
23 0822.94
23.0922.99
22.9323.08
22.8722.90
28.924.1
38.835.2
28.521.9
34.528.0
30.332.8
35.533.6
32.835.8
32.035.5
56.057.6
48.848.6
56.661.8
51.655.7
53.252.5
51.651.6
5049.5
51.952.5
15.1
18.3
12.4
16.2
14.916.3
13.916.3
16.514.7
12.914.8
17.214.7
16.112.0
78.875.9
79.775.1
1
2
1
04012
08
79.279.1
78.7
2 010 77.4
1 014 76.42 016 78.4
1 027 75
2 032 77.6
1 028 74.5
2 05... 77.0
1 035 76.42 036...- 81.4
Group 1, average§ 573521
127.79115 02
23 0522.95
32.730.9
52.453 7
14.915.4
77.9
Group 2. averaee§ 77.8
* Computed on the basis of selling weight and carcass weight after 7 days in cooler,
t Computed from warm dressed weight and carcass weight after 7 days in cooler.
% No ribs were left on the hindquarters.§ Italics indicate that the differences between group averages of basic data are statistically significant.
f Based on yield of wholesale cuts and price according to carcass grade.|| Based on yield of wholesale cuts and a standard price per pound for each cut. Variation, therefore, is caused
by difference in proportion of the various cuts.
[Bul. 688] Importance of Continuous Growth in Beef Cattle 29
plemental and full-feeding on range is, moreover, demonstrated. This type
of production should have a real place, particularly when competition for feed
supply and labor is great : it produces more beef on the same feed by using it
more effectively at earlier age; and it saves large quantities of harvested, baled,
transported, and milled roughages necessary in feed-lot operations.
Growth and Development.—The average growth curves, figure 4, and the
individual growth curves, figures 5 to 8, show a high correlation between
changes in weight and changes in heart girth and round measurement. Skeletal
development, on the other hand, as represented by height, body length, andhead measurements, continued at a reduced rate in group 2 during the early
part of period I. This increase occurred when body substance was being used
to supplement the energy intake from the dry forage. When the animals were
very thin and the feed still poorer in quality and less abundant, skeletal
growth also came to a standstill.
At the end of period I, animals of group 2 lacked development. They ap-
peared to have relatively longer legs, slimmer and shallower bodies, and lighter
rear quarters, which gave them the appearance of poorer-bred cattle. Com-parisons at this time are shown in the photographs taken December 30, 1941
(plates 1 to 7).
Although, by range standards, group 2 could not be considered weak at
the end of period I, the ease with which the hindquarters could be pushed
from side to side in the chute and the flabbiness of the shrunken thigh muscles
observed in the taking of round measurements were particularly striking. Thedifference in the animals after supplements had been given for 5 weeks wasvery impressive. The muscles felt firm and plump, with normal tonus; and a
conspicuous increase in measurement was shown.
Under the conditions of this experiment there was no conspicuous change
in the proportionate growth of length and width of heads. In McMeekan'sstudies of swine (1940-1941) the animals were permitted to grow at reduced
rates for long periods and increased in bone length at the expense of bone
thickness ; heads became longer in relation to width. This is doubtless the ex-
planation for observed fineness of bone in cattle developed on poor ranges.
The earlier in life the privation occurs, the more striking is the result. Ham-mond (1933) has shown that growth occurs in three overlapping phases, the
peak of bone growth preceding that of muscle, and muscle growth preceding
the peak of fat deposition.
Carcass Differences.—The difference in average carcass weight between
group 1 and group 2 shown in tables 4 and 5 was 52 pounds and is statistically
significant. In five of the eight pairs of animals there was a wide difference in
carcass weights. Carcass weights were equal in one pair, and group 2 animals
slightly exceeded their group 1 mates in two cases. Although the animals hadbeen carefully selected for uniformity of pairs, these and other data show that
there were genetic differences between them. Some were affected more than
others by privation, and there were evidently individual differences in ability
to respond to favorable environment.
Although in five out of eight pairs, group 1 animals were fatter as indicated
by the percentage fat in the rib cuts, and the group average was slightly higher
for group 1, the average difference was not statistically significant. In two of
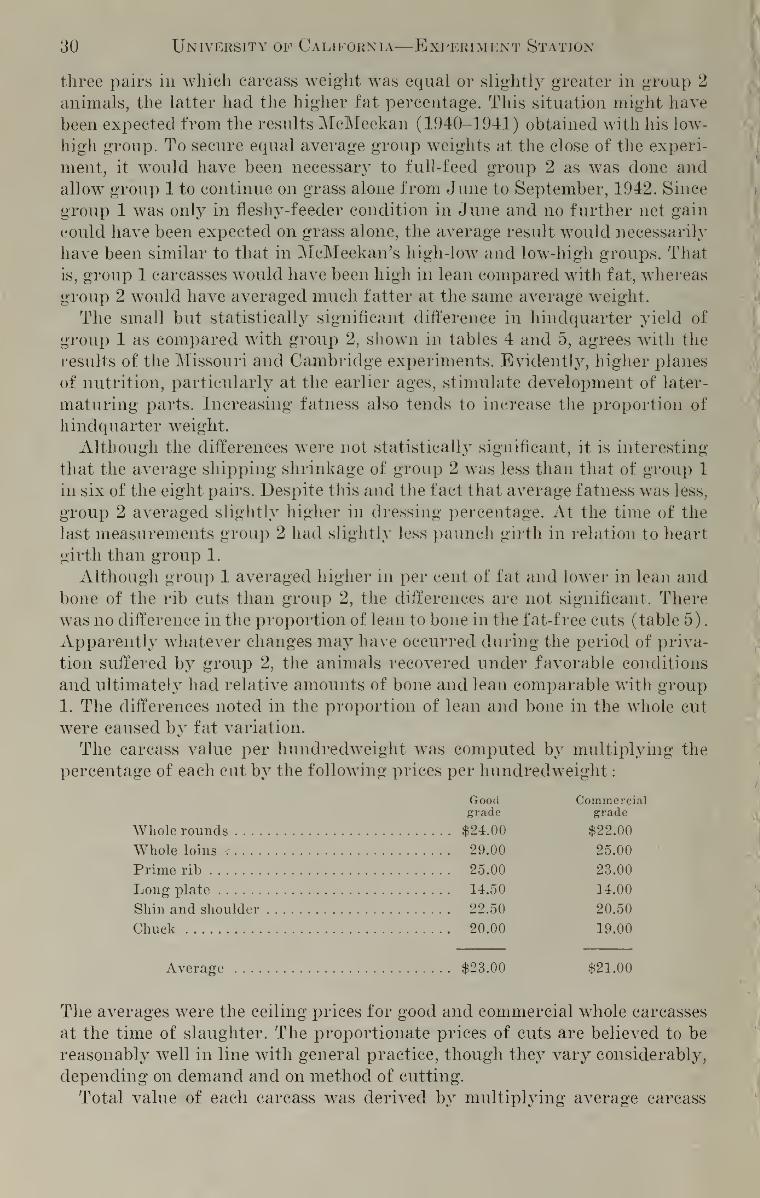
30 University of California—Experiment Station
three pairs in which carcass weight was equal or slightly greater in group 2
animals, the latter had the higher fat percentage. This situation might have
been expected from the results McMeekan (1940-1941) obtained with his low-
high group. To secure equal average group weights at the close of the experi-
ment, it would have been necessary to full-feed group 2 as was done and
allow group 1 to continue on grass alone from June to September, 1942. Since
group 1 was only in fleshy-feeder condition in June and no further net gain
could have been expected on grass alone, the average result would necessarily
have been similar to that in McMeekan's high-low and low-high groups. That
is, group 1 carcasses would have been high in lean compared with fat, whereas
group 2 would have averaged much fatter at the same average weight.
The small but statistically significant difference in hindquarter yield of
group 1 as compared with group 2, shown in tables 4 and 5, agrees with the
results of the Missouri and Cambridge experiments. Evidently, higher planes
of nutrition, particularly at the earlier ages, stimulate development of later-
maturing parts. Increasing fatness also tends to increase the proportion of
hindquarter weight.
Although the differences were not statistically significant, it is interesting
that the average shipping shrinkage of group 2 was less than that of group 1
in six of the eight pairs. Despite this and the fact that average fatness was less,
group 2 averaged slightly higher in dressing percentage. At the time of the
last measurements group 2 had slightly less paunch girth in relation to heart
girth than group 1.
Although group 1 averaged higher in per cent of fat and lower in lean andbone of the rib cuts than group 2, the differences are not significant. There
was no difference in the proportion of lean to bone in the fat-free cuts (table 5.)
.
Apparently whatever changes may have occurred during the period of priva-
tion suffered by group 2, the animals recovered under favorable conditions
and ultimately had relative amounts of bone and lean comparable with group
1. The differences noted in the proportion of lean and bone in the whole cut
were caused by fat variation.
The carcass value per hundredweight was computed by multiplying the
percentage of each cut by the following prices per hundredweight
:
Good Commercialgrade grade
Whole rounds $24.00 $22.00
Whole loins ; 29.00 25.00
Prime rib 25.00 23.00
Long plate 14.50 14.00
Shin and shoulder 22.50 20.50
Chuck 20.00 19.00
Average $23.00 $21.00
The averages were the ceiling prices for good and commercial whole carcasses
at the time of slaughter. The proportionate prices of cuts are believed to be
reasonably well in line with general practice, though they vary considerably,
depending on demand and on method of cutting.
Total value of each carcass was derived by multiplying average carcass
[Bul. 688] Importance of Continuous Growth in Beef Cattle 31
value per hundredweight by the carcass weight and thus includes variations
due both to grade and to conformation.
Table 6 presents data on some of the more important items that contribute
to the value of the animals and carcasses. The animals are listed without re-
spect to group and in order of degree of fatness as indicated by analysis of
the rib cut.
TABLE 6
Comparison of Various Marketing, Slaughter, and Carcass Data
(Arranged in order of increasing fat content of rib cuts)
Animalno.
Liveanimalgrade*
Official
U. S. carcassgrade
Packercarcassgrade
Liveanimalprice perhundred-weight
Percentfat inrib cut
Carcassvaluedue tograde
and con-forma-tion
per cwt.f
Carcassvaluedue toconfor-mationalone
per cwt.f.
Dress-ing,
per cent
012 Commercial Commercial Commercial $12.50 21.9 $20.92 $22.92 61.2
09 Commercial-f- Commercial Commercial 12.50 24.1 20.93 22.93 55.9
010 Commercial+ Commercial Commercial 13.50 28.0 20.99 22.86 59.9
04 Good Commercial Good 14.00 28.5 20.96 22.99 59.7
02 Commercial-|- Good Good 13.50 28.9 23.00 23.00 58.4
014 Commercial+ Commercial Good 14.00 30.3 21.04 23.08 58.2
035 Good Commercial Good 14.00 32.0 20.88 22.87 59.3
028 Commercial-f- Good Good 13.50 32.8 22.93 22.93 58.5
016 Good- Commercial Good 13.50 32.8 20.93 22.94 58.7
032 Good- Good Good 14.00 33.6 22.99 22.99 62.2
08 Good+ Good Good 14.00 34.5 23.18 23.18 58.7
013 Good Good Good 14.00 35.2 23.01 23.01 60.4
036 Good Good Good 14.00 35.5 22.90 22.90 60.3
027 Good Good Good 14.00 35.5 23.09 23 09 59.4
05 Good Good Good 14.00 35.8 23.08 23.08 60.5
03 Good+ Good Good $14.00 38.8 $23 . 29 $23 . 29 60.9
* The signs + and — indicate top and low end of grade respectively,
t See text for wholesale cut prices.
t Prices for good grade were used throughout in these calculations. Value per hundredweight variation is
therefore due solely to differences in proportion of various cuts.
There was perfect agreement in the grading of the live animals, the buyingprice, and the carcass grade in the first three animals (fat content 28 per cent
and under) and in the last seven (fat content 33.6 to 38.8 per cent) . Animals
04 to 016 inclusive ranged between 28.5 and 32.8 per cent fat in the rib cut,
were borderline between good and commercial, and caused considerable varia-
tion in judgment. Carcass value per hundredweight due to both grade andconformation is shown, and also variation due to conformation alone. Forthese latter calculations the price for good grade was used throughout andwas applied to the percentage yield of cuts of each carcass. The maximumdifference in value due to conformation (proportion of wholesale cuts) was43 cents per hundredweight, a difference of 1.9 per cent. Since all these animals
were considered to be within the limits of the range of one grade as feeders,
no great difference might be expected.
Largely because of higher yield of hindquarter in group 1, the average value
due to conformation was slightly higher in this group (table 5).
Dressing percentage in general tended to increase with the fat content. Size
32 University of California—Experiment Station
of middle and amount of fill were also important factors causing variation.
No. 012, the very nervous steer, had little fill and second highest carcass
yield, although he was the least fat.
Lush (1926) and workers in the U. S. Department of Agriculture Bureauof Animal Industry (Black and co-workers, 1940) found high correlation
between the percentage of fat in the edible portion of rib cuts and the per-
centage of fat in the entire carcass ; they developed formulas for estimating
the latter from the former. Total carcass fat content in this experiment wascalculated by means of the Bureau of Animal Industry equation : The per-
centage of fat (ether extract) in the edible portion of the carcass is 0.738
times the percentage of fat (ether extract) in the edible portion of the 9th,
10th, and 11th rib cut plus 3.56 per cent.
According to these calculations the carcasses that all graders agreed werecommercial (nos. 012 to 010 inclusive, table 6) varied from 22.9 to 28.2 per
cent fat in the edible portion of the carcasses ; those that were borderline, with
incomplete agreement (nos. 04 to 016 inclusive), varied from 29.3 to 31.3 per
cent ; those that all graders regarded as good grade (nos. 032 to 03 inclusive)
varied from 32.7 to 36.2 per cent fat.
No data are available to show that the 12th and 13th rib cuts used in the
present experiment are strictly comparable in composition with the 9th, 10th,
and 11th rib cuts, upon which the equation above is based. Since the loin nor-
mally contains more fat than the prime ribs, one might expect the rib cuts
nearest the loin to contain somewhat more fat. Black and his co-workers (1940)
estimated the fat in carcasses according to this formula. They obtained
average values of 23.94 to 31.09 per cent for groups of steers varying in carcass
grade from average commercial to average good. Chatfield (1926) estimated
that commercial carcasses varied between 18 and 25 per cent fat in the edible
portion, and good-grade carcasses from 25 to 35 per cent. Judging from these
results, further data are required before one can rely on the fat content of the
12th and 13th rib cuts for estimating fat in the entire carcass. These cuts were
used in the present work because of the Pacific Coast practice of leaving all
ribs on the forequarter and because of the convenience and economy of using
the first two-rib cut.
SUMMARY AND CONCLUSIONSThe experiment was designed to obtain data on the effectiveness of supple-
mental feed supplied at different periods of the year and at different stages
of development of the animals—factors that influenced the shape of their
growth curves. Data on costs, gains, and the carcass quality were obtained.
The sixteen steers to be finished as yearlings were selected from the SanJoaquin Experiment Range herd at weaning time (July 1, 1941) and weredivided into eight closely matched pairs, distributed equally into groups 1
and 2. The time interval of slightly over 14 months (July, 1941, to September,
1942) was divided into three periods: first, the dry-feed period from July to
January ; second, the green-feed period from January to June; third, a finish-
ing period from June to September 7, when both groups were full-fed con-
centrates on dry forage.
The main difference in management consisted in feeding group 1 steers con-
[Bul. 688] Importance of Continuous Growth in Beef Cattle 33
centrate supplements through period I so that they gained about 1 pounddaily, whereas group 2 (in accordance with common practice) subsisted on
range feed alone, and lost weight. In period II, group 1 received range feed
only and, after a short period when green forage was scant and high in mois-
ture, continued to gain. Group 2, on the other hand, now received concentrate
supplements with range feed and made greater gains. As is well recognized,
steers that maintain or lose weight in the dry-feed or winter season will gain
faster during the following green-feed season than comparable groups that
have made continuous gain induced by supplemental feeding. In this experi-
ment, feeding supplements to previously deprived animals in group 2 enhanced
their gain during period II. Group 1 gained an average of 182 pounds during
this period and at its close weighed 860 pounds, as compared with a gain of 304
pounds and an average weight of 765 pounds for steers of group 2. In period
III both groups were full-fed concentrates on the range at the rate of ap-
proximately 1 pound per 100 pounds live weight.
As a result of difference in management practice, group 1 returned $17.51
more per head, whereas the supplemented feed cost was only $1.40 greater,
only 70 pounds more concentrates having been consumed by them than by
group 2. This result was due to an average of 108 pounds greater live weight,
52 pounds greater carcass weight, and a somewhat higher selling price for
group 1.
During the 14-month period, changes in body size and proportions were
recorded by means of weights, body measurements, and photographs. Data on
grades and proportions of wholesale cuts for each carcass showed on the aver-
age that group 1 animals had the advantage.
Their greater efficiency was due to comparatively small daily allowances of
supplement. These allowances permitted efficient utilization of the nutrition-
ally deficient dry forage in period I, thereby promoting continuous growth
when the stimulus was greatest and decreasing the proportion of feed utilized
for maintenance. According to these and other data, 200 to 300 pounds of
supplemental feed used at earlier ages will in California commonly result in
100 pounds of additional weight and in a higher selling price for feeders. It
will, furthermore, save about 500 pounds of concentrates and 400 to 500
pounds of harvested roughages necessary to make up this difference later in
feed lots. Thus, in California, advantage would be derived if feeds available
for beef cattle were used in greater proportion to supplement range, andrelatively less feed would then be required for finishing in feed lot. As the
data also demonstrate, a combination of supplemental feeding for continuous
growth, followed by a finishing period on range with concentrates full-fed,
can produce grade-A long yearling beef. This saves the labor involved in the
harvesting, baling, transporting, and milling of roughages—a consideration
particularly important in wartime.
Many better California ranges will yield superior finish with less concen-
trates than the San Joaquin Experimental Range.
During their period of privation, group 2 animals had relatively longer legs,
slimmer shallower bodies, and lighter rear quarters with finer bone, which gave
them the appearance of poorer-bred animals. Skeletal growth continued dur-
ing the early part of the period, but practically ceased toward the end.
34 University of California—Experiment Station
At the conclusion of the experiment there was no significant difference in
average fatness of the two groups. Group 1 yielded relatively more hind-
quarter than group 2. These results agree with swine and sheep data cited,
which show that a high plane of nutrition early in life followed by a lower
plane results in carcasses higher in lean and lower in fat than when the
reverse occurs, even though the same final weight at the same age is obtained.
The data support the evidence that high planes of nutrition speed up the
development of thickness growth generally, especially in later-maturing parts
such as loin and hindquarter.
According to analysis of rib cuts from each carcass, on a fat-free basis, there
was no difference in proportion of lean to bone between the two groups.
From the standpoint of total feed required to produce a unit of product,
greatest efficiency is obtained from a high plane of nutrition, with continuous
growth and development. The degree of approach to the ideal that may be
made under specific conditions depends upon the relative costs of different
phases of production—for example, cost of summer gain on range comparedwith winter gain on hay. Particularly when maximum production is being
stressed, one should consider the birth-to-slaughter feed requirement and the
feed used at the stages and in the amounts that will yield greatest over-all
efficiency. When this broad view is taken, there is a high correlation between
biological efficiency and dollars-and-cents economy.
The principles and objectives brought out in this experiment may be realized
in ways other than the feeding of concentrate supplements. To secure con-
tinuous growth and development one may, for example, make coordinated use
of native forage and irrigated pasture; or one may improve the quality of
hay by including legumes and by cutting and curing the hay in a mannerthat will preserve its nutritive value ; or one may adopt better methods of
feeding. Any consideration of efficiency of beef production must begin with
the cow herd, the percentage calf crop, and the weaning weight. Adaptation
of creep-feeding practices to special conditions is another possible way of
increasing low-cost gain.
The experiment reported was designed primarily to illustrate a principle
rather than to indicate an exact practice. A six-year program is under way at
the San Joaquin Experimental Range to obtain detailed information on the
most practical methods for range finishing of long-yearling steers. This in-
volves the amount of feed and the most efficient rate of gain from weaning until
the next grass season ; the question of feeding concentrates during the green-
forage season or of full-feeding at the end of this season ; and, finally, the best
combination of practices for the three phases of this type of production pro-
gram. Each livestock producer should make such adaptations of these prin-
ciples as his individual situation makes practical.
[Bul. 688] Importance of Continuous Growth in Beep Cattle 35
LITERATURE CITEDBlack, W. H., J. R. Quesenberry, and A. L. Baker.
1939. Wintering steers on different planes of nutrition from weaning to 2^ years
of age. U. S. Dept. Agr. Tech. Bul. 667:1-20.
Black, W. H., R. L. Hester, L. B. Burk, L. M. Alexander, and C. V. Wilson.1940. Beef production and quality as affected by methods of feeding supplements to
steers on grass in the Appalachian Region. U. S. Dept. Agr. Tech. Bul. 717:1-32.
7 figs.
Chatfield, C.
1926. Proximate composition of beef. U. S. Dept. Agr. Dept. Cir. 389:1-18.
Gregory, P. W.1933. The nature of size factors in domestic breeds of cattle. Genetics 18:221-49.
Guilbert, H. R., L. W. Fluharty, and V. M. Shepard.
1943. California beef production data. California Agr. Exp. Sta. Lithoprint Leaflet. 6 p.
Guilbert, H. R., and H. Goss.
1944. Digestibility of range forages and flax hulls. California Agr. Exp. Sta. Bul.
684:1-10.
Hammond, J.
1933. How science can help improve the nation's food supply. Soc. Chem. Indus. Jour.
52:637-40.
1940. Farm animals: their breeding, growth and inheritance. 199 p. (See specifically
p. 88.) Longmans, Green and Co., New York, N. Y.
Hutchison, C. B., and E. I. Kotok.1942. The San Joaquin Experimental Range. California Agr. Exp. Sta. Bul. 663:1-145.
Lush, J. L.
1926. Practical methods of estimating the proportions of fat and bone in cattle
slaughtered in commercial packing plants. Jour. Agr. Res. 32:727-55.
McMeekan, C. P.
1940-1941. Growth and development in the pig, with special reference to carcass
quality characters. Jour. Agr. Sci. 30:276-337; 31:1-161.
Moulton, C. R., P. F. Trowbridge, and L. D. Haigh.1921. Studies in animal nutrition. I. Changes in form and weight on different planes
of nutrition. Missouri Agr. Exp. Sta. Res. Bul. 43:1-111. 30 figs.
1922a. Studies in animal nutrition. II. Changes in proportions of carcass and offal on
different planes of nutrition. Missouri Agr. Exp. Sta. Res. Bul. 54:1-76. 28 figs.
1922b. Studies in animal nutrition. III. Changes in chemical composition on different
planes of nutrition. Missouri Agr. Exp. Sta. Res. Bul. 55 : 1-88. 20 figs.
Trowbridge, P. F., C. R. Moulton, and L. D. Haigh.1915. The maintenance requirement of cattle. Missouri Agr. Exp. Sta. Res. Bul. 18:
1-62. 17 figs.
1918. Effect of limited food on growth of beef animals. Missouri Agr. Exp. Sta. Res.
Bul. 28:1-129. 23 figs.
1919. Composition of the beef animal and energy cost of fattening. Missouri Agr.
Exp. Sta. Res. Bul. 30:1-106. 25 figs.
Verges, J. B.
1936. The effect of nutrition on the carcass quality of Suffolk cross lambs. Suffolk
Sheep. Soc. Yearbook, Ipswich. (Original not seen; cited by Hammond, 1940.)
Wagnon, K. A., H. R. Guilbert, and G. H. Hart.1942. Experimental Herd Management. In: Hutchison, C. B., and E. I. Kotok. The
San Joaquin Experimental Range. California Agr. Exp. Sta. Bul. 663:50-82.
Watson, D. M. S.
1943. Beef cattle in peace and war. Empire Jour. Exp. Agr. 11:191-228.
12m-ll,'44(1367)