THE IMPACTS OF POPULATON GROWTH ON ...repository.out.ac.tz/2114/1/Simon Lugazo Dissertation-07...iv...
99
THE IMPACTS OF POPULATON GROWTH ON MANAGING FOREST RESOURCES IN WEST USAMBARA, TANZANIA SIMON CHARLES LUGAZO A DISSERTATION SUBMITTED IN PARTIAL FULFILLMENT OF THE REQUIREMENTS FOR THE DEGREE OF MASTER’S OF ARTS IN NATURAL RESOURCE ASSESSMENT AND MANAGEMENT OF THE OPEN UNIVERSITY OF TANZANIA 2017
Transcript of THE IMPACTS OF POPULATON GROWTH ON ...repository.out.ac.tz/2114/1/Simon Lugazo Dissertation-07...iv...

i
THE IMPACTS OF POPULATON GROWTH ON MANAGING FOREST
RESOURCES IN WEST USAMBARA, TANZANIA
SIMON CHARLES LUGAZO
A DISSERTATION SUBMITTED IN PARTIAL FULFILLMENT OF THE
REQUIREMENTS FOR THE DEGREE OF MASTER’S OF ARTS IN
NATURAL RESOURCE ASSESSMENT AND MANAGEMENT OF THE
OPEN UNIVERSITY OF TANZANIA
2017

ii
CERTIFICATION
The undersigned certifies that he has read and hereby recommends for acceptance by
the Open University of Tanzania a dissertation titled: Impact of population growth on
managing forest resources in West Usambara, Tanzania in partial fulfilment of the
requirements for the degree of Masters of Arts in Natural Resource Assessment and
Management of the Open University of Tanzania.
……………………………………………………….
Dr. Reguli Mushy
(Supervisor)
Date ………………..………………………

iii
COPYRIGHT
This dissertation is a copyright material under Berne Convention, the Copyright Act
of 1999 and other international and national enactments, in that behalf, on
intellectual property. It may not be reproduced by any means, in full or in part,
except for short extracts in fair dealings, for research or private study, critical
scholarly review or discourse with acknowledgement, without the written permission
of the Directorate of Postgraduate Studies, on behalf of both the author and the Open
University of Tanzania.

iv
DECLARATION
I, Simon Charles Lugazo, do hereby declare that, this dissertation is my own
original work, and that it has not been presented and will not be presented to any
other University or Institution for a similar or any other degree award.
………………….………………………….
Signature
………………………..…………..
Date

v
DEDICATION
This work is dedicated to my lovely wife Mariam Mambosasa and my children
Jennifer Lugazo, Jeremiah Lugazo and Jelyn Lugazo for their moral encouragement
during my study time. Moreover, it is dedicated to my beloved parents, my father
Mr. Charles Lugazo and my mother Ms.Margareth Semkiwa for laying down the
foundation of my education.

vi
ACKNOWLEDGEMENTS
My deepest appreciation and heartfelt special thanks go to my supervisor Dr. Reguli
Mushy for his guidance, moral support and valuable contribution during the
preparation of this dissertation. He spent precious time to give me constructive and
regular advice and corrections to document from the very beginning to end. I am
highly indebted to my course programme lecturers including Prof. D. Ngaruko, Dr. J.
Msindai, Dr. S. Gwalema, Dr. A. Wawa and Dr. C. Haule for their administrative
support, invaluable and untiring advice to this work.
Moreover, I express my thanks to all the 100 households surrounding Baga forest
reserve who took interview with me. I thank you for your patience and kindness to
provide your cooperation during field data collection. I would like to pass my great
gratitude and thanks to Bumbulu Forest officer, TFS Officer, TFCG Field Officer,
village leaders and village natural resource members that were involved directly or
indirectly in this work so that my study became a success. Above all, I thank the
Almighty God for giving me health and strength in my life and allow me for the
completion of the study.

vii
ABSTRACT
This dissertation set out to assess the impact of rapid population growth on forest
resource management in West Usambara, Tanzania. It aimed to determine the trend
of population growth in Tanzania over the past thirty years, socio-economic factors
affecting forest resource uses and evaluate intervention measures on forest resources
management. The field survey that was conducted in four wards Mayo, Baga,
Mgwashi and Bumbuli, and employed SPSS statistical analysis to assess the impact
of rapid growth of population on forest resource management. A total of sample of
100 heads of the households were randomly drawn to respond to household
questionnaires. Meanwhile, a total of eight key informants, Three Forest Officers
from Bumbuli District Council, TFS and TFCG, three village natural resource
committee and two village leaders. The study revealed that the population of the
study area has almost doubled from 246,049 in 1978 to 492,441 in 2012 with
population density of 120.4 persons per square Kilometer which is above the national
population density of 51 persons per square Kilometer. Furthermore, 84% of the
respondents collect fire wood from the forest while 96% revealed to depend in forest
for different forest products like fire wood, vegetables, fruits and medicine. About
96% revealed to practice PFM which is underperformed due to different challenges
mentioned. Moreover, the study concluded that population growth contributed
highly to the forest destruction. Finally it recommended that awareness rising on
family planning should be promoted, land use plan developed and PFM actively
established with equal benefit sharing among the actors. Likewise the policy and
regulations should be reviewed to favour forest adjacent community’s needs.

viii
TABLE OF CONTENTS
CERTIFICATION ............................................................................................ ii
COPYRIGHT ................................................................................................... iii
DECLARATION ............................................................................................. iv
DEDICATION .................................................................................................. v
ACKNOWLEDGEMENTS ............................................................................ vi
ABSTRACT .................................................................................................... vii
LIST OF TABLES .......................................................................................... xii
LIST OF FIGURES ........................................................................................ xii
LIST OF PLATES ......................................................................................... xiii
LIST OF ACRONYMS .................................................................................. xv
CHAPTER ONE ............................................................................................... 1
1.0 INTRODUCTION ................................................................................ 1
1.1 Background to the Research Problem ..................................................... 1
1.2 Statement of the Research Problem ........................................................ 3
1.3 Objective of the Study ............................................................................ 4
1.4 Research Questions ................................................................................. 4
1.5 Significance of the Study ........................................................................ 4
1.6 Limitations of the Study ......................................................................... 5
1.7 Organization of the Dissertation ............................................................. 6
CHAPTER TWO .............................................................................................. 7
2.0 LITERATURE REVIEW .................................................................... 7
2.1 Introduction ............................................................................................. 7
2.2 Theoretical Research Review ................................................................. 7

ix
2.2.1 Human Population Growth, Food Supplies and Natural Resource
Demand ................................................................................................... 7
2.3 Conceptual Literature Review ................................................................ 9
2.3.1 Trend of Population Growth around the World ...................................... 9
2.3.2 Socio-Economic Forest Resources Uses ............................................... 10
2.3.3 Impacts of Population Growth to Forest Management ......................... 11
2.3.4 Institutional Framework Performance .................................................. 12
2.4 Conceptual Framework ......................................................................... 14
2.5 Research Gap ........................................................................................ 16
CHAPTER THREE ........................................................................................ 17
3.0 RESEARCH METHODOLOGY ...................................................... 17
3.1 Introduction ........................................................................................... 17
3.2 Research Approach ............................................................................... 17
3.3 Research Design ................................................................................... 17
3.4 Area of Study ........................................................................................ 18
3.4.1 Geographical Location .......................................................................... 18
3.4.2 Area and Physical Characteristics ......................................................... 19
3.4.3 Climate .................................................................................................. 19
3.4.4 Vegetation ............................................................................................. 19
3.4.5 Population ............................................................................................. 20
3.4.6 Socio-Economic Activities ................................................................... 20
3.5 Sample Size and Frame ......................................................................... 20
3.6 Sampling Techniques ............................................................................ 23
3.6.1 Simple Random Sampling .................................................................... 24

x
3.6.2 Purposively Sampling ........................................................................... 24
3.7 Methods of Data collection ................................................................... 25
3.7.1 Pre- Survey ........................................................................................... 25
3.7.2 Documentary Review ........................................................................... 25
3.7.3 Observation ........................................................................................... 25
3.7.4 Satellite Imagery ................................................................................... 26
3.7.5 Questionnaire ........................................................................................ 26
3.7.6 Focus Group Discussion ....................................................................... 27
3.8 Validity and Reliability of Data Collection Instrument Reflect True ... 27
3.8.1 Validity ................................................................................................. 27
3.8.2 Reliability .............................................................................................. 28
3.9 Ethical Consideration ............................................................................ 28
3.10 Methods of Data Analysis ..................................................................... 28
CHAPTER FOUR .......................................................................................... 30
4.0 FINDINGS AND DISCUSSIONS...................................................... 30
4.1 Introduction ........................................................................................... 30
4.2 Socio-economic Characteristics of the Respondents ............................ 30
4.2.1 Sex and Marital Status of the Respondents .......................................... 30
4.2.2 Age of Respondents .............................................................................. 31
4.2.3 Ethnicity ................................................................................................ 32
4.2.4 Household size of the Study Area. ........................................................ 33
4.2.5 Respondents’ Level of Education ......................................................... 34
4.2.6 Origin and Reasons for Settling in the Village ..................................... 35
4.2.7 Economic Activities .............................................................................. 35
xi
4.3 Trend of Population Growth ................................................................. 37
4.3.1 Trends of Population Growth in the Study Area .................................. 37
4.3.2 Impact of Population Growth In Forest Resources ............................... 38
4.3.3 Measures Taken to Control the Impact of Population Growth on Natural
Resources .............................................................................................. 40
4.4 Access to and the Socio-Economic Uses of Forest Resources ............. 42
4.4.1 Access to Forest Products ..................................................................... 42
4.4.2 Demand for Forest Products ................................................................. 45
4.4.3 Alternative Sources of Forest Products ................................................ 45
4.5 Evaluate the Intervention Measures Used to Manage Forest Resources
.............................................................................................................. 48
4.5.1 Conservation Challenges Facing The Reserved Forest ........................ 48
4.5.2 Forest cover change .............................................................................. 51
4.5.3 Forest Management System Practice .................................................... 54
4.5.4 Forest Management Challenges ............................................................ 55
4.6 Summary of Chapter ............................................................................. 58
CHAPTER FIVE ........................................................................................... 58
5.0 CONCLUSIONS AND RECCOMANDATIONS ............................ 59
5.1 Introduction ........................................................................................... 59
5.2 Conclusion ............................................................................................ 59
5.3 Recommendation .................................................................................. 61
5.4 Recommendations for Further Research ............................................... 63
REFERENCES ............................................................................................... 64
APPENDICES ................................................................................................. 73

xii
LIST OF TABLES
Table 2.1: World Population Trend From 1986-2016 (In ‘Ooo) ........................... 10
Table 3.1: The Study on Population for Households Size ..................................... 21
Table 3.2: The Study Sample Size for Households Questionnaire ........................ 23
Table 4.1: Gender and Marital Status of Respondents ........................................... 31
Table 4.2: Age of the Respondents ........................................................................ 32
Table 4.3: Household Size of the Study Area ........................................................ 33
Table 4.4: Measure to Control the Impact of Population Growth on Natural
Resources .............................................................................................. 41
Table 4.5: Forest Cover Change Baga Forest Reserve 2002-2012 ........................ 52

xiii
LIST OF FIGURES
Figure 2.1: Malthus Basic Theory ............................................................................. 8
Figure 3.1: Show Map of Baga Forest Reserve and the Ward Surrounding the
Forest .................................................................................................... 18
Figure 4.2: Respondents Level of Education .......................................................... 34
Figure 4.3: Origin of the Respondents .................................................................... 35
Figure 4.4: Major Economic Activities of the Respondents ................................... 36
Figure 4.5: Population trend in Lushoto District from 1978 to 2012 ...................... 37
Figure 4.6: Impact of Population Growth on Forest Management .......................... 40
Figure 4.7: Access to Forest Products ..................................................................... 44
Figure 4.8: Community Forest Demand .................................................................. 45
Figure 4.9: Alternative Sources of Forest Products ................................................ 46
Figure 4.10: Conservation Challenges Experienced In The Study Area .................. 49
Figure 4.11: Forest Cover Change Baga Forest Reserve between 2002 and 2012 ... 53
Figure 4.12: Forest Management System Practice .................................................... 55
Figure 4.13: Forest Management Challenges............................................................ 58

xiv
LIST OF PLATES
Plate 4.1: Firewood Collection As It Observed on the Boundary of Baga
Forest .................................................................................................... 43
Plate 4.2: Woodlot Planted Observes At Mayo Village, West Usambara ............ 47
Plate 4.3: Agroforestry Farm Field As Observed at Sagara village, West
Usambara .............................................................................................. 47
Plate 4.4: Illegal Tree Cutting As Observed Inside Baga Forest Reserve ............ 49
Plate 4.5: Illegal Miners As Observed At Tewe Village in West Usambara ........ 51

xv
LIST OF ACRONYMS
CBFM Community Base Forest Management
FAO Food and Agriculture Organization
FBD Forest and Beekeeping Department
FGD Focus Group Discussion
FORMECU Forestry Resource, Managements, Evaluation and coordinating Units
GDP Gross Domestic Product
JFM Joint Forest Management
LDC Lushoto District Council
MNRT Ministry of Natural Resource and Tourism
MOHSW Ministry of Health and Social Welfare
NAFORMA National Forest Resources Monitoring and Assessment
NEMC National Environmental Management Council
NFPs National Forest Programme
NFPs Non Timber Forest Product
NGO’s Non- Government Organizations
PFM Participatory Forest Management
SPSS Statistical Package for Social Sciences
TFCG Tanzania Forest Conservation Group
TFS Tanzania Forest Services
UN United National
UN-DESA United National Department of Economic and Social Affairs
UNFPA United Nations Fund for Population Activities
URT United Republic of Tanzania

xvi
VNRC Village Natural Resource Committee

1
CHAPTER ONE
1.0 INTRODUCTION
1.1 Background to the Research Problem
Population increase has resulted to high pressure on natural resource in Tanzania. In
many areas, there is an increasing local pressure to extend agricultural activities at
the expense of forests and wildlife resources (Madulu, 2001). About 38 percent of
Tanzania’s total land area is covered by forests and woodlands that provide for
wildlife habitat, unique natural ecosystems and biological diversity, and water
catchments (World Bank, 2001). However, the existence of these natural resources is
threatened by human disturbances of the ecosystem. Experiences from Forest
Reserves in Tabora Region (Shishira and Yanda, 1998), Coast Region (Shishira et al,
1998) and Dodoma Region (Madulu, 2001) demonstrate clearly the dwindling
biodiversity in most protected areas due to human interference in the ecosystems.
Estimates of forest losses in Africa and Nigeria (FORMECU, 1999) were observed to
be higher in the past two decades. For instance between 1990 and 2000, the continent
lost about 52 million hectares of the forest, accounting for about 56 percent of the
global reduction of forest cover (Nwoboshi, 1987).
Rapid population growth has been associated with various aspects of resource
degradation, including deforestation, overgrazing, soil erosion, soil nutrient
depletion, and other problems (Scherr and Hazell, 1994; Kates and Haarmann, 1992).
As population density increases, the supply of people who clear trees increases Kang
and Wilson (1987); Southgate (1988); World Bank (1992) and the demand for

2
products from forest grows too. As a result of it, a larger forest area become
deforested and leads to biodiversity loss. In addition to these forest changes, both the
number of producers who use degrading agricultural or grazing practices increased,
Repetto (1986). Likewise the demand for crops and livestock produced with
degrading practices increase (Brown and Wolf, 1984).
According to the 2012 Census, Tanzania had a population of 44,929,002, compared
to 34,443,603 in 2002. Population of Mainland Tanzania according to 2012 Census
was 43,625,434 (compared to 33,461,849 in 2002). This means that the population of
Tanzania has increased by 10,485,399 persons or 30.4% since 2002. This translates
into a rate of growth of 2.7% per annum for Tanzania during the inter censual period
2002-2012, compared to 2.9% per annum in the previous inter censual period (1988-
2002).
About 200 years ago the world population was less than 1 billion and today there are
more than 7 billion living humans on earth (UN-DESA, 2015). This is one of the
most conspicuous empirical facts about world population growth: population grew
relatively slowly for thousands of years before it really began to climb.
Agricultural expansion is probably the most important human activity that causes
deforestation. Between 300,000 and 400,000 hectares of forest and bush land are
estimated to be cleared annually for agricultural expansion purposes (UN. 1993). An
elaborate example of the Usambara Mountains suggests that almost 70 percent of the
rain forests have been destroyed since 1954. While in areas like Tabora and Songea,
tree felling for tobacco cultivation and curing is rampant (Shishira and Yanda, 1998),
3
agricultural expansion in forested areas is very common in Kondoa, Iringa, and
Mufindi Districts (Madulu, 1998a, 1998b). Slash-and-burn cultivators set in motion a
series of events leading to destruction of forests. These trends have several adverse
consequences that include accelerated soil erosion, fuel wood scarcity, high rates of
evaporation, and climatic change.
1.2 Statement of the Research Problem
Overpopulation is the major problem influencing sustainable natural resource
management in the West Usambara Mountains. High growth rates now estimated at
2.2 % (Lushoto District, 2010) have led to populations higher than the carrying
capacity of the district. Coupled with this is the inheritance system and ownership of
parcels of land in different catchments. The impact of this is seen in increasing land
scarcity, fragmentation of lands into small uneconomical plots, limited attention of
parcel of lands located away from the households, wide spread cultivation on
marginal lands and encroaching into forest lands (84 % of the original forest has
been cleared). Based on species-area relationships such loss of original forests
suggests that approximately 34 % of the species in the West Usambara have become
extinct or are in a danger of extinction (Newmark, 2000).
In spite of efforts made by Tanzania government for introducing various methods of
family planning to control population growth and Participatory Forest Management
methods to manage the forest resources. Large influx of population growth has
becoming the big challenge on managing the protected forest found in West
Usambara. Therefore, the study was conducted to analyse much on the scenario of

4
population growth on forest resources management systems to fill the information
gap of proper forest management system in Tanzania.
1.3 Objective of the Study
The main objective of this research is to assess the impact of rapid population growth
on forest resource management in Tanzania. Specifically the study aim to achieve the
following specific objectives:
i) To examine the trend of population growth in West Usambara over the past
thirty years.
ii) To examine the socio-economic factor affecting forest resource uses in West
Usambara.
iii) To evaluate the intervention measures used to manage forest resources in
West Usambara.
1.4 Research Questions
i) What is the population trend over the past thirty years in West Usambara?
ii) What are the socio-economic factors affecting forest resource uses in West
Usambara?
iii) What are intervention measures used to manage forest resources in West
Usambara?
1.5 Significance of the Study
The research intends to look for population growth in relation to managing of forest
resources. For academician this research will enable scholars on doing research as

5
this can be part of references for reviewing also it assists the researcher to understand
the implication of population growth towards management of forest resources in
West Usambara. The study will be able to identify the extent the needs of managing
forest resources in West Usambara as among of potentiality areas for both socio-
economic benefits which will provide way forward for government intervention
through providing reliable policies that will help to realm these natural resources.
Also the research intends to add more knowledge on issues relating to managing of
forest resources and its application in community at all.
Furthermore the research intends to help district and communal forest department
and other forest stakeholders to understand the response of their managing forest
resources.
1.6 Limitations of the Study
During conducting this study some setback were encountered. These included the
limitation of getting reliable data of population change in the study area. Likewise
problem of respondent’s memory, especially on the historical back ground of the
forest uses and management. This required asking question more than once in
different ways and use of key informants to make the respondents understand
questions, get information and provide answers precisely. However, the financial
resource and time constrained the original budget to become sufficient to full support
the research in terms of intensity and coverage. This was rectified by using Tanzania
Forest conservation group (TFCG) field Assistants to distribute and collects the
questionnaires from their respective areas of control.

6
1.7 Organization of the Dissertation
This dissertation is organized in five chapters. Chapter one introduces the study by
giving background to the research problem, statement of the research problem,
research objectives and research questions. It also presents the significance of the
study and limitation of the study. Furthermore it presents the literature review related
to the study presented in chapter two by providing the definition of the key concepts,
theoretical framework, empirical review, conceptual framework and research gap.
Chapter three presents the research methodology adopted in conducting the study. It
encompasses the introduction, research design, research area, research population,
sample size and frame, sampling techniques, method of data collection and data
analysis. Chapter four contains the research findings, results and discussion. Finally
chapter five covers the conclusions and recommendations.

7
CHAPTER TWO
2.0 LITERATURE REVIEW
2.1 Introduction
This chapter covers review of various literatures concerning the impact of population
growth on forest management. The chapter covered the description of the theoretical
research review, empirical research review, conceptual framework, theoretical
framework and it the research gap.
2.2 Theoretical Research Review
The study as govern by Malthusian economists, neoclassical economist and neo
Malthusians theories they all discussed the human population growth and natural
resource in different perspectives.
2.2.1 Human Population Growth, Food Supplies and Natural Resource Demand
Malthusians theories on relationship between population growth and natural resource
traced in 1798 which stated that “ The rate of population growth is greater than of the
earth which is not big enough to produce food that would satisfy the present and
future generation,” (Malthus,1798). Moreover Malthus predicted that population
growth would exceed limited supply of natural resources especially land resources
(Malthus, 1798). He argued that human population grew geometrically while
subsistence increased arithmetically. He also hypothesized that, while human
population increases with the fast rate, foodstuff would be insufficient to feed the
entire number of people. Likewise as large rapidly growing population reaches a
critical point and exceeds the carrying capacity result to depletion of natural
8
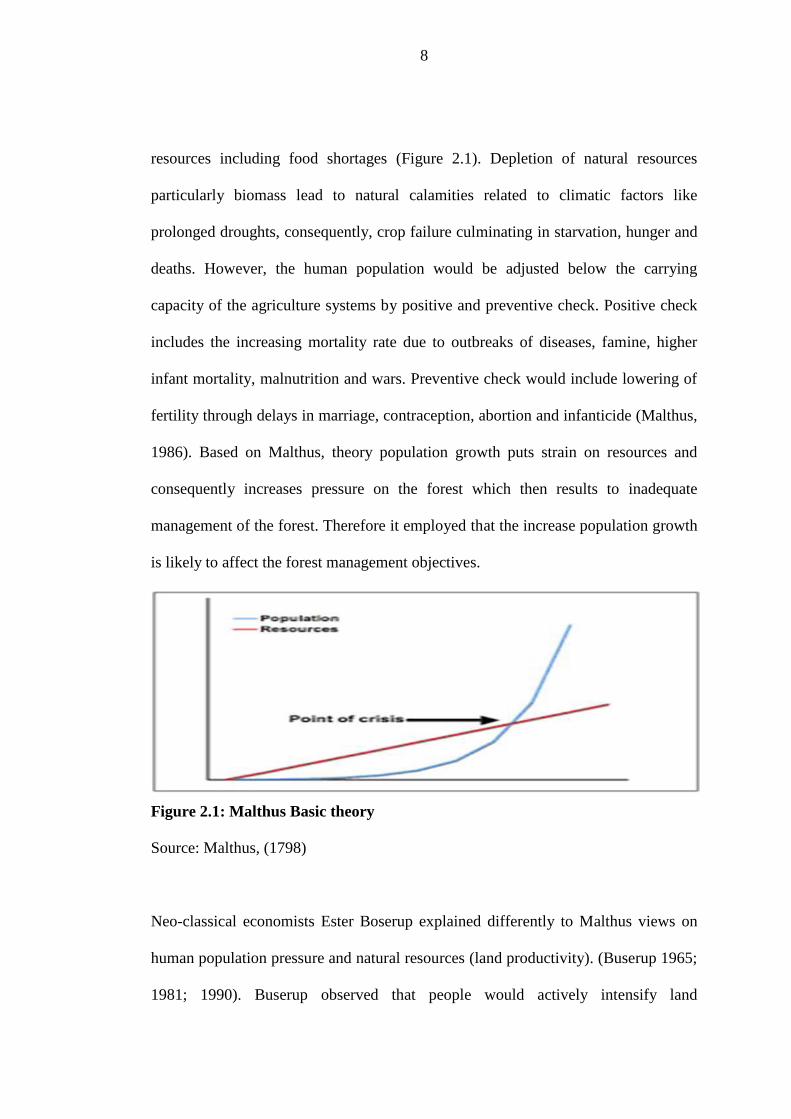
resources including food shortages (Figure 2.1). Depletion of natural resources
particularly biomass lead to natural calamities related to climatic factors like
prolonged droughts, consequently, crop failure culminating in starvation, hunger and
deaths. However, the human population would be adjusted below the carrying
capacity of the agriculture systems by positive and preventive check. Positive check
includes the increasing mortality rate due to outbreaks of diseases, famine, higher
infant mortality, malnutrition and wars. Preventive check would include lowering of
fertility through delays in marriage, contraception, abortion and infanticide (Malthus,
1986). Based on Malthus, theory population growth puts strain on resources and
consequently increases pressure on the forest which then results to inadequate
management of the forest. Therefore it employed that the increase population growth
is likely to affect the forest management objectives.
Figure 2.1: Malthus Basic theory
Source: Malthus, (1798)
Neo-classical economists Ester Boserup explained differently to Malthus views on
human population pressure and natural resources (land productivity). (Buserup 1965;
1981; 1990). Buserup observed that people would actively intensify land

9
productivity/ increasing agricultural yields, such as multi-cropping, irrigation, soil
conservation and application of better technologies all these would compensate
human population growth. Boserup commented that there are no limits to human
population growth that would be satisfactory to intensification of agriculture
productivity (Boserup, 1965).
Another theory is from Paul Ehrlich, a biologist, which state that the rate of
population growth was outstripping agricultural growth and the capacity for renewal
of Earth's resources. This means that the rate of population growth will affect the
capacity of the natural resource to regenerate and induced pressure to forest
management effort established.
The study used the theory of Thomas Robert Malthus because it is directly related
the impact of population growth to natural resource depletion which resulted from
poor management of the forest.
2.3 Conceptual Literature Review
2.3.1 Trend of Population Growth around the World
According to UN DESA report of world population prospects (2015) as presented in
the Table 1 shows the population trends of Tanzania and other continents over past
thirty years. In which population has changed tremendous to some continents
especially Africa which includes Tanzania as population rises slightly from 477
million people in 1980 to 1.6 billion in 2016 and the projection of rising to 11 billion
in 2050 and 2100 respectively; these have been due to low mortality rate and high
fertility rate that African countries have. Some other continents like Asia; China

10
population was maintained after adopting a policy of bearing one child. In Europe,
North and Latin America its population has a tendency of changing gradually in line
for economic recession and low fertility rate drawn from use of family planning.
Table 2.1: World Population Trend From 1986-2016 (In ‘Ooo)
CONTINENT/
COUNTRY
YEARS
1986 1991 1996 2001 2006 2011 2016
Tanzania 22,517 26,307 30,734 34,899 40,261 47,123 53,470
Africa 565,642 648,900 738,623 834,089 943,508 1,071,200 1,186,178
Asia 2,956,960 3,260,422 3,524,866 3 760 898 3,989,937 4,215,002 4,393,296
Europe 710,711 723,079 727,890 26,454 730,152 736,316 738,442
Latin America 414,126 455,030 495,357 534,468 571,089 606,878 634,387
North America 269,333 283,505 299,199 316,914 331,600 347,017 357,838
Ocenia 25,284 27,393 29,456 31,488 33,933 37,015 39,331
Source: United Nations, Department of Economic and Social Affairs, Population
Division (2015), World Population Prospects
2.3.2 Socio-Economic Forest Resources Uses
The majority of rural people depend heavily on the forests for their survival and most
of the export economy is land dependent. Forests and woodlands are recognized as
an important resource base for Tanzania’s social and economic development, and for
provision of many basic benefits and opportunities to rural and urban communities
(Mariki 2001). In west Usambara area there is an opportunity for agriculture activity
due to arable and fertile land that is composed from steep from Usambara Mountain,
thus encourage highly agriculture activities in this area.
According to FAO (2010c) report elaborate that; the rural population of Sudan, as
well as much of its urban population, depends on forests. Trees are the main source
of energy and provide timber for roofing and building. In rural Sudan, the extensive
benefits derived from forests include grazing, hunting, shade, forest foods in the form

11
of tree leaves, wild fruits, nuts, tubers and herbs, tree bark for medicinal purposes,
and non-wood products such as honey and gum. In addition, the commercial lumber
industry is a small but growing source of employment. FAO report shows that; the
forestry sector contributes as much as 13 percent to the gross domestic product of
Sudan. The forests of Sudan have economical, ecological, and recreational values,
known collectively as ecosystem services. Wood products from the forestry sector
include fuel wood, sawn timber and round poles. The Forest Product Consumption
Survey conducted by the FNC in Northern Sudan in 1995 found that the total annual
consumption of wood was 15.77 million m³. FAO calculated that in 1987, Sudan
produced 41,000 m³ of sawn timber, 1.9 million m³ of other industrial round wood,
and more than 18 million m³ of firewood. Each of these categories showed a
substantial increase from production levels in the 1970s.
Forests are estimated to cover approximately 48% of the total area of Central and
South America, (FAO, 2010c). The forestry sector is highly important in the region’s
economy, given that forests supply not only timber but also fibre, firewood, and
other non-timber forest products for industrial and non-industrial uses. Moreover,
they provide a number of ecosystem services (habitat, biodiversity, carbon storage,
etc.), which, although sometimes without direct commercial value, are essential both
locally and globally.
2.3.3 Impacts of Population Growth to Forest Management
The relationship between population growth and economic development has long
been debated ever since Malthus in the 18th century. Nevertheless, others have

12
observed that technological advances and institutional development could counter
negative effects of rapid population growth on development (Kuznets 1967;
Boserup1981; Simon 1981). Population growth may affect natural resource
management by affecting household decisions about land use, labour or capital
intensity, product choice, technology adoption, off-farm employment, migration, or
fertility (Bilsborrow and Carr, 1998; Panayotou, 1994; Boserup, 1965). It may affect
natural resource management by affecting community and societal decisions relating
to collective management of common property resources (Baland and Platteau,
1996); development or adaptation of technology (Boserup, 1965; Hayami and
Ruttan, 1985).
2.3.4 Institutional Framework Performance
The national or sub national policy framework on forests and their management aim
to guide decision-making and provide a clear sense of direction over time. In the
context of international commitments many countries have agreed to use ‘National
Forest Programmes’ (NFPs) as a comprehensive framework in order to develop and
implement their forest policies.
The Forestry and Beekeeping Division (FBD) of the Ministry of Natural Resources
and Tourism (MNRT) is the government agency responsible for forest management
issues on mainland Tanzania. It has a mandate to manage and supervise national
forest reserves (NFRs); collect revenue on forest operations and harvesting; issue
licenses and permits and, thereby, regulate harvesting of forest products nationally;

13
promote forest development; provide training in forestry; and undertake forest
research (through the Tanzania Forest Research Institute).
A key element of the new Tanzanian Forest Policy (URT, 1998) and Forest Act
(URT, 2002) is the devotion of ownership of land management responsibilities over
forest resources to local communities. Thus community-based approaches to
securing and managing forests, generally referred to as Participatory Forest
Management (PFM), has become the central strategy of the Forest and Beekeeping
Division (FBD) of Tanzania to ensure sustainable management and conservation of
Tanzania forests.
In Tanzania there are two form of PFM: Community-Based Forest Management
(CBFM) and Joint Forest Management (JFM). Each differs greatly in terms of forest
ownerships and cost/benefit flows. CBFM takes place on village land or private land,
and the trees are owned and managed by a village government through village
natural resource committee (VNRC), a group, or individual. In this case the owner
carries most of the costs and accrues most of the benefits relating to the management
and utilization. The role of central government is minim while the District authorities
only have role of monitoring.
On the other hand, JFM takes place on “reserve land” that is owned and managed by
either central or local government. Villagers typically enter into management
agreements to share responsibilities for the management with the forest owner (FBD,
2006).

14
2.4 Conceptual Framework
Figure: 2.2: A Conceptual Framework for Cause and Effect of Population
Growth
Source: Own Construct
Forests are important assets in Tanzania, offering numerous goods and services in the
national economy, to society at large, and to local livelihoods. The official forest
sector contribution to the economy is between 2 and 3 percent of total GDP (Salmi
and Monela 2000). The linkages between forest resources in rural areas and poverty
reduction have been heavily studied in Tanzania. Monela et al. (2000) estimate that
honey, charcoal, fuel wood, and wild fruits contribute 58 percent of the cash incomes
of farmers in six villages surveyed in a semiarid region of the country. Honey alone
accounted for one-third of all cash income in these villages (Figure 2.2).
Despite the significant contribution of forests to local livelihoods and the national
economy, forest destruction, poor management, and environmental degradation
Population Growth
Land scarcity
Forest encroachment
Overgrazing
Cultivation on
marginal land
Forest resource uses
Illegal tree cutting for
timber, building
materials
Charcoals production
Forest destruction

15
continue and, with it, negative impacts on marginal communities that depend on
forests and forest products (Mariki 2001). Tanzania is experiencing serious
environmental degradation—pressure on natural resources has progressively
escalated, and ecological degradation is evident, especially in arid and semiarid areas
(URT, 2001). Among the major causes of environmental degradation includes; Land
clearance for small-scale subsistence farming is one of the major causing of forest
cover loss, largely due to increasing populations and low-intensity agricultural
practices, such as shifting cultivation. Dependence by resource-poor households on
cash income from the sale of forest products, such as charcoal, honey, wild fruits,
and firewood appears to be another major driver of deforestation. Commercial
production of firewood and charcoal as an alternative source of income to meet urban
energy demands contributes significantly to deforestation. Policy problem World
Bank Environment Mission as indicated by Fottland (1993) states some reasons for
deforestation in Tanzania: (a) Inadequate pricing policy: The price estimated on
forest produce when collected from the forest is far below the price that is possible to
obtain at the market, (b) Lack of capacity to implement policy and legislation:
The forest managers have for considerable time suffered from lack of resource to do
good job. Further, the skill and dedication among the staff without the implementing
capacity, both legislation and policy become useless.
Tanzania is clearly making significant progress in mainstreaming the environment
into poverty reduction strategies; however, to create targeted poverty reduction
policies, the contribution of forests and natural resources to livelihoods and poverty

16
reduction must be fully realized, which requires the information to be captured and
measured. The 1998 National Forest Policy breaks new ground by explicitly
recognizing the contribution made by forests to poverty reduction and human
welfare. The overall goal of the National Forest Policy is to “enhance the
contribution of the forest sector to the sustainable development of Tanzania and the
conservation and management of her natural resources for the benefit of present and
future generations.”
2.5 Research Gap
Many studies have been undertaken in different regions and various research
methods were applied. However, there some key issues that have not yet been
addressed, concerning the rapid growth of human population in relation to forest
management practices. In Tanzania’s case, rapid increase of human population
growth has brought challenge to resources management in some area like Tanga
region particularly Lushoto district. The critical issues are on limited land and access
to forest products. Family planning has not yet been achieved particularly in rural
areas where the human population is high. Furthermore the forest policy contradicts
itself on proper forest management practices to be applied to the community. These
were the gaps in which the study addressed and suggested some potential resolution.

17
CHAPTER THREE
3.0 RESEARCH METHODOLOGY
3.1 Introduction
This chapter presents the methods and techniques used in this study. The chapter
describes the research approach, research design, study area, strategy of inquiry,
limitation of the study sampling techniques, data collection techniques, data
processing and analysis, presentation of the findings.
3.2 Research Approach
The study employed the qualitative research approach which is concerned with
subjective attitudes, behaviours and opinions of the respondents (Kothari). It allowed
the researcher to use the respondent’s personal word in order to gain deeper and clear
understanding of their knowledge, feelings and experiences (Creswell, 1994). The
study also preferred qualitative approach to acquire in-depth understanding of the
key informants view since each of them might has a different outlook about the
phenomenon being studied.
3.3 Research Design
It is an arrangement of the conditions for the collection and analysis of data in
manner that aim to combine relevance to the research conducted (Kothari, 2009). It
consists of the blueprint of the collection of measurement and analysis of data. The
research design of this study is descriptive design because the research intends to
describe by relating the managing of forest resources and rapid population growth. In

18
this design cross-sectional was employed because it is an appropriate way of
collecting data among respondents from diversified social economic characteristics,
in order to show its relation.
3.4 Area of Study
3.4.1 Geographical Location
The study was conducted in Lushoto district found at West Usambara Mountain in
10 villages surrounding Baga catchment forest reserve. Lushoto District situated in
the Northern part of Tanga region within 40 25’ – 40 55’ Latitude south of the
Equator and 300 10’ – 380 35’ Longitude East of Greenwich. The district shares
borders with Same District in the north – west, Republic of Kenya in the north-east,
and Korogwe District in the south.
Figure 3.1: Show Map of Baga Forest Reserve and the Ward Surrounding the
Forest
Source: Researcher’s Own Construct (2016)

19
3.4.2 Area and Physical Characteristics
The District has an area of 3,500km2 and accounts for about 12.8% of Tanga Region.
The main physical features of Lushoto are highlands which covered about 75%
(2625 km2) of the total District area, with altitude of 1000 – 2100m above sea level,
while lowlands cover about 25% (875km2) of the total District area between an
altitude of 300 – 600m above sea level. The mountains and their lower slopes occupy
about 90% of the total land of Lushoto district. The slopes are moderatly steep and
there are many narrow valleys as well as rock outcrop in the terrain.
3.4.3 Climate
The mountainous areas of Lushoto are cooler and less humid than the coastal areas of
Tanga Region. The highest temperatures reached in the period between October and
February and lowest during June to August. Lushoto district generally receives
rainfall on a bimodal pattern, with short rains from October to December and long
rains from March to June. The short rains are less reliable than the long rains. The
highlands get an average of 800 – 2000mm rainfall per annum and the lowlands get
about 500-800 mm per year. The District is divided into five agro-ecological zones
that offer different cropping possibilities which are humid, warm, dry, hot, and cold.
Lushoto District Council (2010).
3.4.4 Vegetation
The forests of the area are diverse and range from sub-montane to upper Montane in
type. The vegetation is woody with luxuriant growth of trees whereas the canopy is
differentiated in to strata which are the characteristic of high forests. The sub-

20
montane cover the vegetation of the trees which have height of 10-15m dominated by
Annonasenegalensis, Brachystegiaboehmii, B. spiciformis, Combretummolle,
Diplorhyncuscondylocarpon, Markamiaoptusifolia and Pterocarpusangolensis. The
upper Montane cover the trees which are evergreen forest with Brachlaenahuillensis
as dominant vegetation (Ruffo et al, 2002).
3.4.5 Population
According to 2012 Census report, the District has got population of 492,441 People,
of which 230,236 were Male and 262,205 Female. The district has an overall sex
ratio of 88 males for every 100 females with the average household size of 4.7
(Cencus.2012). It has the population density of 120.4 persons per square Kilometer
(Lushoto District Council, 2013).
3.4.6 Socio-Economic Activities
The main economic activities in Lushoto District are farming, livestock keeping and
business. The major crops grown are maize, banana, yams, paddy, Irish potatoes,
sweet potatoes, cassava and legumes, while cash crops are tea, coffee, vegetables,
cardamom and fruits. Livestock kept includes cattle, sheep, goats, chicken, duck,
guinea, fowls, pig and rabbit (Lushoto District Council, 2013).
3.5 Sample Size and Frame
A sample is a finite part of a statistical population whose properties are studied to
gain information about the whole (Webster, 1985). When dealing with people, it can
be defined as a set of respondents (people) selected from a larger population for the

21
purpose of a survey. The sampling frame of this study consisted of the total number
of 4268 households of the ten villages surrounding Baga Catchment forest reserve,
which amounted to 20,576 people almost 4.02% of the whole Lushoto District of
492,441 populations of people, (URT 2012). Since the average households’ size
varies in ten villages, computation to obtain the total number of households has been
made as it is shown in Table 3.1.
Table 3.1: The Study on Population for Households Size
Source: Field study (2016)
The sample size formula by Kothari (2004) based on Precision Rate and Confidence
Level will be used for estimating a percentage or proportion in calculating and
determining the sample size needed to be representative of the given population and
is given as:
SN Village
Total
number of
Population
Average
Househol
d size
Computation
to get number
of household
Total
number of
households
1 Kizanda 2560 4.5 2560/4.5 569
2 Mbokoi 1273 4.5 1273/4.5 283
3 Tanda 1264 4.5 1264/4.5 281
4 Mtunda 621 4.5 621/4.5 138
5 Kwemanolo 1108 4.5 1108/4.5 246
6 Wanga 2339 5 2339/5 468
7 Sagara 2350 5 2350/5 470
8 Malomboi 2830 5 2830/5 566
9 Baga 3843 5 3843/5 769
10 Mziasaa 2388 5 2388/5 478
Total
population 20,576 4268

22
n = z². p .q
e²
Where
z = the value of standard deviation level score corresponding to 95%
confidence interval = 1.96
p = the sample study assumed a population proportion of 50% since this would
provide the maximum sample size. Therefore, the value of p = 0.5
q = 1 – p
e = the precision rate (+/-10%)
n = size of sample
From: n = z² .p .q
e²
n = (1.96x1.96)x(0.5x0.5) = 96.04
(0.1x 0.1)
n = 96 ≈ 100
But for purposes of easy computation of proportionate samples, a round figure of 100
responds was adopted.
Due study’s limited resource and time budget, the sample size was drawn from
household population of 4268.The interviewed households were selected as shown in
Table 3.2 below.

23
Table 3.2: The Study Sample Size for Households Questionnaire
S/N Village Total
number of
household
100 Proportional
Representative Sample
(PRS) of Households
Number of
Households
Sampled
1 Kizanda 569 569/4268x100 13
2 Mbokoi 283 283/4268x100 7
3 Tanda 281 281/4268x100 7
4 Mtunga 138 138/4268x100 3
5 Kwemanolo 246 246/4268x100 6
6 Wanga 468 468/4268x100 11
7 Sagara 470 470/4268x100 11
8 Malomboi 566 566/4268x100 13
9 Baga 769 769/4268x100 18
10 Mzia Saa 478 478/4268x100 11
Total 4268 100
Source: Researcher’s own construct (2016)
From the computation on the table above therefore the interviewed households were
13 from Kizanda, 7 from Mbokoi, 7 from Tanda, 3 from Munda, 6 from Kwemanolo,
11 from Wanga, 11 from Sagara, 13 from Malomboi, 18 from Baga and 11 from
Mziasaa. The households were randomly selected for interview. Also, with the help
of village leaders, ten informants’ respondents from each village were purposely
selected for FGD and key informant interviews, respectively. The selection of
respondents for FGD and key informant interviews focused on Village natural
resource committee members and village leaders having knowledge of forest
conservation. Also two staffs from forest department were interviewed, one from
TFS and another one from Bumbuli District Council.
3.6 Sampling Techniques
This study employed two sampling techniques namely, simple random and
purposeful sampling

24
3.6.1 Simple Random Sampling
The study used simple systematic random sampling (SRS) in administering a person
to person interview of the 100 households. This method gave every household head
in a population equal probability of getting into the sample and all choices were
independent of one another. However, it gave each possible sample combination an
equal probability of being chosen (Kothari, 2004). Data from Tanzania National
Population Census and from Lushoto district records were used to draw a reliable
household sampling frame. Simple random sampling was deployed to pick household
to match the number of households selected for interview. Name of all the head for
each village were written on the pieces of paper by the researcher to maintain
confidentiality. The names were mixed in the box and the selected person closes his
eyes and picks the names according to the sampled number for each village. The
sampling units for this study were household heads or any other member above 18
years and public institutions which provided data and records on population changes
and forest management.
3.6.2 Purposively Sampling
Purposeful sampling is the intentional seeking or selecting of individuals or
situations likely to yield a greater understanding of phenomenon of interest (Kothari,
2004). Therefore, in this research the Lushoto District Council, Tanzania Forest
Conservation group (West Usamabara) and Tanzania forest service’s-Bumbuli were
selected in order to obtain the information, data and records related population
growth and forest management systems. These are informants who helped the study
to understand the contribution of each organization toward forest management.

25
Moreover the key informants provide general information on challenges and success
of the forest management system in the area in relation to population growth.
Furthermore, their opinions were also taken to improve the situation.
3.7 Methods of Data collection
According to Krishnaswami (2002) data are facts, figures and other relevant
materials, past and present that serve as bases for the study and analysis. In this
study, data collection methods which were used are reconnaissance survey,
documentary reviews, questionnaires, observation and satellite imagery. These
different types of data were used in order to triangulate information.
3.7.1 Pre- Survey
The researcher conducted the pre-survey to provide the general picture of the
research area and test the data collection tools. This visit was used to establish
contact with the key informants, familiarizing with the study area and finding
secondary data from the respondents.
3.7.2 Documentary Review
The documentary review in this study involved the Lushoto and Bumbuli Districts
reports, Tanzania forest conservation Group reports(NGO), The Open University of
Tanzania (OUT), Main library, internet, website, past thesis, journals and article,
Tanzania Forest service reports and Tanzania policy and Act documents.
3.7.3 Observation
Observation is essential in making a correlation of the questionnaire response to the

26
actual phenomenal on the ground (Kothari, 1990). Environmental degradation was
observed in term of soil erosion, soil fertility, deforestation, destruction on water
catchment and fuel wood shortage.
3.7.4 Satellite Imagery
The land cover maps for Baga forest was generated from a set of historical Landsat 5
and Landsat 7 to create a cloud-free product that identifies areas that have undergone
land cover transition between 2002 and 2012. For purpose of this study we only
included the forest loss and excluded the forest gain class. A 3x3-majority filter
applied to the loss pixels and the minimum patch was set to 0.5 hectares in order to
remain consistent with the existing land cover product.
3.7.5 Questionnaire
Both quantitative and qualitative methods of data collection were employed during
the study whereby structured and semi-structured questionnaire interview for
households were administered. Using questionnaire, each head of the household were
randomly selected and interviewed on his/her household practices and attitudes
related to forest management and forest resource uses, forest management practices
and impacts of population towards forest management were established.
However dependent variables on the other hand like demographic characteristics of
the study population such as age, educational level, sex, marital status, number of
person in the households and occupation respondent concern the forest resource
management in the area were involved.
27
3.7.6 Focus Group Discussion
Focused group discussion (FGD) is a form of structured group discussion involving
people with knowledge and interest in a particular topic. Focus groups provide an
opportunity to discussion thoroughly on the desired topics (Kothari, 1990). The focus
group was carried out by the researcher to group of 20 participants, comprising of 12
men and 8 women. It involved the village leaders, village natural resource committee
(VNRC), influential people, religion leaders and income generating groups.
Moreover face to face interview with the key informants was also consulted whereby
intensive strategic information sampling was used by people who were thought to
have most and relevant information. The key informants in this study include: the
District Forest Officer-Bumbuli, Forest Officer-TFS Bumbuli, Assistant Field
Officer- TFCG West Usambara, village leaders and Village natural resource
committee members.
3.8 Validity and Reliability of Data Collection Instrument Reflect True
3.8.1 Validity
Validity is the extent to which differences found with a measuring instrument reflect
true differences among those being tested (Kothari, 2004). In order to ensure validity
the structured questionnaires were deployed by 100 heads of household in order to
obtain the relevant information. Validity of instruments was enhanced by using pilot
study in order to assess the clarity of items administered. Modification was made
where the instruments were found to be inadequate hence clear instruments were
implemented during the actual field research survey.

28
3.8.2 Reliability
Reliability is the degree of consistency a given instrument demonstrates when it is to
measure a particular phenomenon (Best and Kahn, 1998). In this study reliability is
ensured by a deployed multiple sources of data including questionnaires, interview,
observation and secondary data. The study increased reliability of the study through
planned behaviour predictions. It also used international Business Machine (IBM)-
SPSS software version: 23.0 in coding and analysing the data, and minimisation of
errors and bias in the study.
3.9 Ethical Consideration
A clearance form was obtained from the Vice Chancellor of the Open University of
Tanzania. Then introduced myself to the Ward Executive Officers, Village Chairman
and the household of the target area. During the administration of questionnaires,
interviews, focus group discussions, and documentary review, the respondents were
assured that their information’s are privacy. For easy clarification, respondents were
liberty to discuss in English and Kiswahili. Finally recorded the notes by using the
operational language, English.
3.10 Methods of Data Analysis
According to Kothari (2004), the collected raw data were edited to detect errors,
omission and coded for efficient analysis. The raw data from the questionnaires were
coded, analysed and entered into computer using IBM-Scientific Package for Social
Scientists (SPSS) program. Ms excel and SPSS was used for analysis of information
obtained in numerical form. Descriptive statistics giving frequencies and percentages

29
were presented in various forms particularly by using tables, graphs, charts and
percentage. Different data were tabulated in order to establish their relations. The
qualitative data was analysed using the content-structural analysis. The content-
structural analysis was used to analyse in detail the components of verbal discussions
held with key informants. This helped the researcher in ascertaining values and
attitudes of respondents (Kajembe, 1994).

30
CHAPTER FOUR
4.0 FINDINGS AND DISCUSSIONS
4.1 Introduction
This chapter describes the analysis of data followed by a discussion of the research
findings. The findings relate to the research questions that guided the study. Data
were analyzed to identify, describe and explore the relationship between population
and forest management. It consists of five subsections which are socio-economic
characteristic, trend of population growth in the study area, impact of population
growth, socio-economic use of the forest resources and forest management system
practices. Data were obtained from self-administered questionnaires, completed by
100 households (n=100).
4.2 Socio-economic Characteristics of the Respondents
4.2.1 Sex and Marital Status of the Respondents
The study sample had a total of 100 households whereby 28% of the respondents
were women and 72% were men see Table 4.1. The sample comprised more men
than women because most of the households are headed by men. Men and women
have different knowledge of, access to, and control over natural resources, and
different opportunities to participate in decisions regarding natural resources use.
Due to their different roles and responsibilities, women and men have varying
interests and motivations to conserve, protect or manage their resources. In most
regions of the world, men play a greater role than women in the exploitation of
natural resources for commercial purposes, i.e., logging, grazing livestock, fishing,

31
hunting, mining and extracting various tree products. Men are therefore, more
destructive than women but negatively affected when natural resources are depleted.
Therefore due more of the respondents being men it review that most of the decision
are done by men and when it come nature resource management the effect on
exploitation will be higher than in the areas where most of the household are
controlled by women.
The marital status of the sampled households is presented in Table 4.1. About 93%
of respondents were married, 4% were single, divorced were 1% and 2% were
widows. This study found that most of the households in the study area are headed
and managed by married couples. This implies that there high quito marriage rate,
which led to increase in birth rate by women and as a result led to increase in
population.
Table 4.1 Gender and Marital Status of Respondents
Characteristic Gender and Marital status Respondents Percent
Gender
Male 72 72
Female 28 28
Marital status Married 93 93.0
Single 4 4.0
Divorced 1 1.0
Widow 2 2.0
4.2.2 Age of Respondents
The findings showed that the age of the respondents ranged from 18 to 75 years old.
Table 4.2 shows respondents’ age distribution of the study sample. A large number
of respondent’s about 69 % were aged between 40 and 59. About 9% of the
interviewed respondents were over 60 and 22% were between 18 and 39.

32
Table 4.2: Age of the Respondents
Characteristic Age group Respondents Percent
Age 18-39 22 22
40-59 69 69
60 and above 9 9
Total 100 100
Source: Field Survey Data (2016).
It was, therefore, revealed from the household interviews that most of the
respondents were still able bodied people, being in their early middle ages and
middle age years (40-55) who could actively participate in various livelihood
activities. Shackleton and Shackleton (2004) remarked that age affects the type and
amount of resources utilized, and it also affects the household’s labour supply, which
in turn affects natural resource use and its control over labour and its products and
access to natural resources.
4.2.3 Ethnicity
The study found out the study area comprised of two main ethnic groups, namely the
Sambaa and the Pare. Majority of respondents (80%) were the Sambaa people,
whereas the remaining 20% were the Pare (Figure 4.1). Similarly study reported that
the Sambaa formed 78% of population in West Usambara (Jambia, 1998). In the
recent years some town like Lushoto have been receiving other ethnic groups who
rea coming for to work work and this has a significant in forest management and
forest product utilization.

33
Figure 4.1: Ethnicity of the Respondent
Source: Field Survey Data (2016)
4.2.4 Household Size of the Study Area
The mean households’ sizes were 7 people, with a range of 5 to 9 people (73%).
(Table 4.3). According to National Population and Housing census of 2012 (URT,
2012), the mean household size in Lushoto District was reported to be 5 people. This
implies that the household size in the study area is above the average reported, that
means that there is high number of people per household which increases the demand
for forest product.
Table 4.3 Household Size of the Study Area
Source: Field Survey Data (2016).
Household Size Respondents Percent
2-5 19 19
5-9 73 73
10+ 8 8
Total 100

34
4.2.5 Respondents’ Level of Education
The respondents’ level of education varied. Figure 4.2 shows that about 89% of
respondents in the study area completed primary school, 7% had secondary
education and 4% had no formal education see figure 4.2 below. The illiteracy level
in the study area is lower about 4% compared to national average of 19.6% (URT,
2015). This indicate that the level of understanding is high in this area because
formal education can broaden the understanding of the individual when it comes to
adopting useful skills and technologies for conservation that have come from outside
the community. Education can promote sustainable utilization of those resources for
nutritional and health status (Mbwambo, 2000). Similarly according to Katani (1999)
find that the increase in education level increases the level of awareness and thereby
creates positive attitudes; this is crucial at all levels in order to enhance participation
of all stakeholders. Kalineza et al (2000) argued that knowledgeable farmers are
expected to adopt new techniques quicker compare to those unknowledgeable.
Figure 4.2: Respondents Level of Education
Source: Field Survey Data (2016)

35
4.2.6 Origin and Reasons for Settling in the Village
The majority of the respondents (98%) were born in the village, while 2% had
migrated into the village from within the District (Figure 4.3). Those who migrated
into the village (about 2%) gave one reasons for settling in the village which is
marriage. The majority of the people from this area are migrating to other area due to
scarcity of land, no immigrant to villages expect for the few government staffs
coming for employment purposes this is due to lack of enough area for cultivation.
Figure 4.3: Origin of the Respondents
Source: Field Survey Data (2016)
4.2.7 Economic Activities
The study revealed that respondents in the study area were engaged in different
economic activities such as crop production, wage paid casual labour and petty
business. Data on occupational activities show that 94% of the respondents
interviewed reported to be engaged in crop production as their first main economic
activity (Figure 4.4). This implies that majority of the households depend on farming
as their main economic activities. Due presence of high number of farmers in the

36
study area this can lead them to cultivation fragile soils such as wetland, highlands,
and forests. When farmland expands toward fragile lands in order to keep pace with
the needs of a growing population, it leads to deforestation, erosion, and
desertification. Agriculture remains the main economic activity in West Usambara
(Nambiza and Lyatura, 2013).
Furthermore casual labour, wage employed and petty business constituent of 3%, 1%
and 2% respectively (Figure 4.4). This implies that very few people are employed in
the study area or engaged on business this has significant effect on forest
management as many people will depend on forest due to lack of employment or
activity to perform. The similar study has been conducted in West Usambara
whereby it was revealed that 11% own kiosk, 2% masonry, 2% food vending
business, 2% selling alcohol (Nambiza and Lyatura, 2013).
Figure: 4.4: Major Economic Activities of the Respondents
Source: Field Survey Data (2016)

37
4.3 Trend of Population Growth
The study intended to examine the trend of population growth the study area. It
examine population change and growth rate from census records of 1978, 1988, 2002
and 2012. Moreover it revealed the impact of population growth on forest resource
management and measure taken to control population growth.
4.3.1 Trends of Population Growth in the Study Area
Tanga region as revealed by 1988 population census was one of the highest in the
country and Lushoto district with land area of 3,500 Sq. Km commanded the second
highly populated district in Tanga Region with population density of 120.4 persons
per sq km. Furthermore, Maro (1983) observed more marked variations at district
and ward levels with a higher concentration of people in some regional, districts and
wards than others. Figure 4.6 reviewed that population of Lushoto District had
increased from 246,049 in 1978 to 492,441 in 2012 almost double the number people
have been added in the district. The district has high population density of 120.4
persons per square Kilometer which is higher than the national population density of
51 Square Kilometer.(Lushoto District, 2013).
Figure 4.5: Population trend in Lushoto District from 1978 to 2012
Source: Census, (1978, 1988, 2002, 2012)

38
Population density in the West Usambara is high as 120.4 persons per square
Kilometer (Census, 2012). This high population growth has led to increase demands
for agriculture production and settlement hence results in unsustainable management
of the forest. The study is similar to Soini, (2002a) who revealed that densely
populated area had led to disappearance of ecological systems; the evidence is the
southern slopes of Mountain Kilimanjaro which covers the part of the Moshi District
Council. Recently, land use change analysis showed a vast expansion of agricultural
production over marginal land downward the slopes, extending further into the
uncultivated land, has caused the disappearance of vegetation cover, this is due to the
clearing of forest and natural bush resulting to ecological disappearance and
degradation.
Furthermore, high population growth rate in Tanzania have had significant
environmental implications in many areas, the environment have been degraded to
the extent that it can no longer support ecological balance and provision of necessary
resources to present and future Population(UNFPA,1991; Green, 1992).
4.3.2 Impact of Population Growth In Forest Resources
The study revealed that the impacts of population growth has resulted to several
forest management challenges whereby the respondents mentioned that 54% resulted
to illegal forest tree cutting in the study area (Figure 4.7). The study is supported by
Zahabu and Malimbwi, (1997) who reported that the most common human activities
triggering degradation in Mountane forests include, clearing for new farm land, pit
sowing, illegal timber harvesting, collection of building poles, cutting trees for

39
medicine, collecting fuel wood, and mining activities. Likewise Ndagalasi et al
(2007) conducted study at Magamba Nature Reserve found that forest degradation of
tree species including Ocotea usambaransis and Podocarpus usambaransis was
rampant due to illegal selective commercial logging, subsistence harvesting of tree
for building poles and fuel wood collection.
Moreover, the study revealed that 25% of the respondents utilized marginal land for
agriculture and grazing due high population (Figure 4.7). The study is similar to that
conducted to (Shishira and Yanda, 1998; Madulu, 2001) which reported that high
population growth has resulted in increasing opened up of farmers in the marginal
areas and even in the protected area in an effort to earn living. Furthermore Saunders
et al (1991) reported that Degradation of forest edges arising from small-scale
agriculture inevitably leads to fragmentation, and eventually deforestation. This
deforestation results in isolation of forest patches, causing transformation of
microclimate regimes.
Furthermore, the study revealed that increase in population has led to forest
encroachment by 21% (Figure: 4.7). The study is supported by Shishira et al., (1998),
who reported that the increasing population pressure around the forest reserve is
likely to lead to encroachment into the forest reserve, hence threatening its
sustainability. Likewise Madulu, 2001 reported that forest clearing for agriculture
expansion has been rampant around the Swagaswaga Game Reserve in Kondoa
District. Moreover Kaale (1984) reported that in 1980, about 200ha of Kilimanjaro
forest reserve, a water catchment forest, were encroached by farmers.

40
Figure 4.6: Impact of Population Growth on Forest Management
Source: Field Survey Data (2016)
4.3.3 Measures Taken to Control the Impact of Population Growth on Natural
Resources
Due to the increase in population and its effect in natural resource several measure
have been taken to rescue the situation. The result data from the surveyed area has
revealed that 39% practiced improved agriculture and conservation techniques as the
way of maximize crop production in small area reduced pressure to forest (Table
4.4). The result from end-line survey conducted by TFCG revealed that 42% of
famers in West Usambara were applying conservation agriculture methods. The
focus of conservation agriculture is on soil moisture management, crop rotation,
permanent cover crops which apparently contributed to increased crop production
(Nambiza and Lyatora, 2013). This implies that there is low adoption rate of people
on use of improved agriculture practices which required more training and awareness
to improve the situation.

41
About 32% mentioned that some of the villagers have been shifted to other Districts
like Handeni where they can have enough land for cultivation (Table 4.4). Likewise
many people especially youth, form Lushoto district are moving to big city like Dar-
es-salaam and Arusha because they become landless due to overpopulation (Lushoto
District, 2010). The similar issue happens in Kilimanjaro whereby the region has
high population density that increases pressure on land resource. Recent study
commented that 70% of the household in Kilimanjaro had insufficient quantities of
land resources to sustain their livelihoods for agricultural activities and settlement
expansion (Soini, 2002a). These forced the people of Kilimanjaro to move to other
areas looking for settlement and farm field. Likewise landlessness has also been
reported by Mwihomeke (2001) which has led to some people migrating to the
lowlands (Johansson, 2001) and urban centres due to increase in population.
Table 4.4: Measure to Control the Impact of Population Growth on Natural
Resources
Source: Field Survey Data (2016)
27% revealed that they are using family planning methods to ensure the number of
children matches with the available resources and 2% mentioned that there is no
measure taken (table 4.4 above). Data from the two most recent demographic and
health surveys indicate the use of modern family planning methods increased from
Characteristics Percent
Family planning 27
Shifting to other area 32
Improve agriculture and soil conservation techniques 39
No measure taken 2
Total 100

42
20% among married women 2004-2005 to 27% in 2010. Nevertheless 25% of
married women were found to have unmet need for family planning i.e. they want to
space their next birth or stop childbearing entirely but were not using contraception.
In response, efforts were intensified to realize the goal of National Family Planning
Costed implementation program 2010-2015 to raise contraceptive prevalence rate to
60% (MOHSW, 2013). This shows that the adoption rate of the family planning
methods is almost the same as the National rate of 27% , which implies that the study
area are aware on the important of family planning.
4.4 Access to and the Socio-Economic Uses of Forest Resources
This part presents the results and discussion on the access to forest products and uses
in the study area. The first part covers the results and discussion on the access to
forest product in the study area. The second part presents the results and discussion
on the demand for forest products in the study area. The last part presents the
alternative sources of forest products.
4.4.1 Access to Forest Products
The study revealed that 84% of the respondents collect fire wood from the forest
(Figure 4.8). This implies that fire wood is the major source of cooking fuel in the
study area. Fire wood is the cheapest source of energy in Tanzania, approximately
90% of the population uses firewood and charcoal for their cooking and heating
needs (Monela, 1999). Even more so in the West Usambara where approximately
99% of the use fire wood to cook (Kaale, 1993). Lusambo (2009) reported that
Tanzania energy balance dominated by biomass-based fuels, particularly wood fuel

43
(fire wood and charcoal) which account for > 90% of primary energy supply. The
findings similar to Giliba et al., (2010) who reported that 92% of NTFPs collected
from the forest were firewood in Mbulu and Babati districts. The finding similar to
Msaliwa (2013) who reported that 98% of people in Kilolo district use firewood as
the main source of energy. Furthermore, the finding similar to Mainski (2008) who
reported that Malawi 97.0% of the rural house uses firewood as the major source of
cooking fuel.
Plate 4.1: Firewood Collection As It Observed on the Boundary of Baga Forest
Likewise the study revealed that 9% of the respondents depend on forest for
medicine (Figure 4.8). This implies that very few household depend on forest for
medicine probably this is because of the availability of dispensaries and Bumbuli

44
Hospital which are found nearby the villages or the medicine inside the forest have
been finished due to over utilization. The findings are similar to observation done by
Mogaka (1992) who reported that plants from forests have significant proportion of
medicine value that can be useful to surrounding population. This could probably be
due to the reasons that firewood is the only cheaper, available and affordable primary
source of energy in the study area.
Furthermore, the study shows that 5% of the respondents depend on forest for
vegetables (Figure 4.8). This implies that very few household depend on forest for
vegetable probably because the majority of the villagers are practicing vegetable
farming which have observed on the side of the river line. This study is similar to
Katriina (2000), who reported that the most vegetable are collected and used in four
days a week on average. 2% revealed that they collect fruits from the forest (figure
4.8).
Figure 4.7: Access to Forest Products
Source: Field Survey Data (2016)
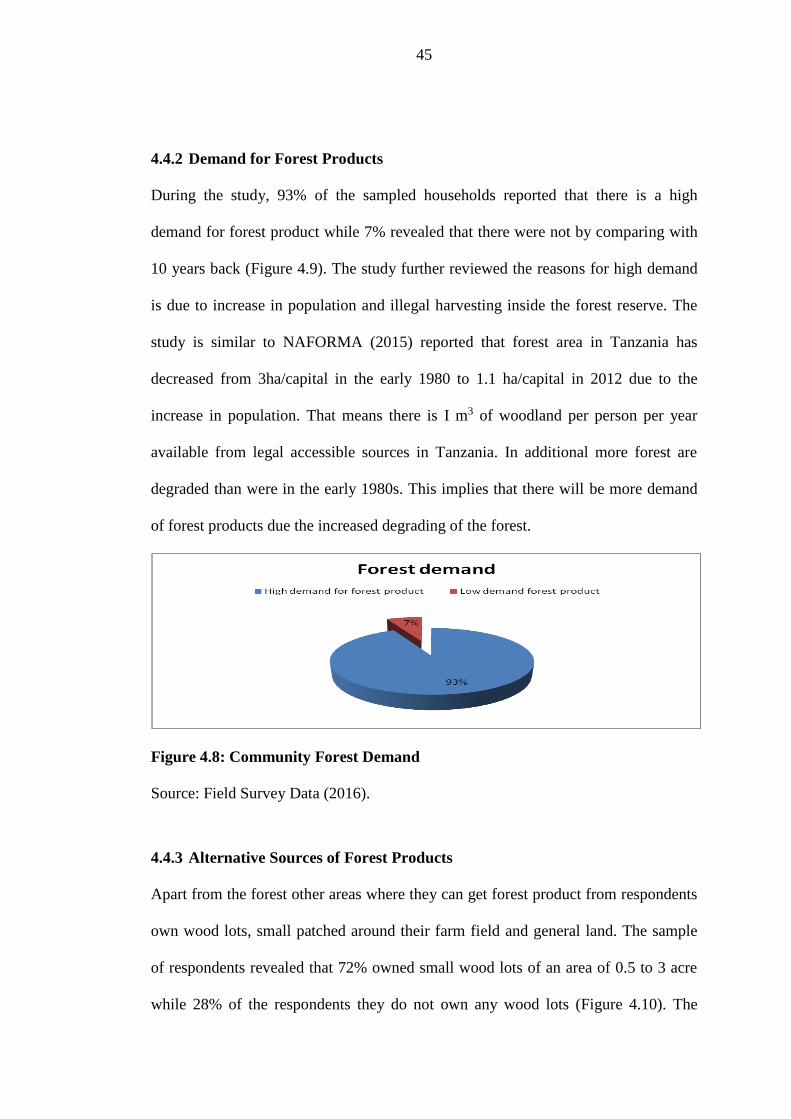
45
4.4.2 Demand for Forest Products
During the study, 93% of the sampled households reported that there is a high
demand for forest product while 7% revealed that there were not by comparing with
10 years back (Figure 4.9). The study further reviewed the reasons for high demand
is due to increase in population and illegal harvesting inside the forest reserve. The
study is similar to NAFORMA (2015) reported that forest area in Tanzania has
decreased from 3ha/capital in the early 1980 to 1.1 ha/capital in 2012 due to the
increase in population. That means there is I m3 of woodland per person per year
available from legal accessible sources in Tanzania. In additional more forest are
degraded than were in the early 1980s. This implies that there will be more demand
of forest products due the increased degrading of the forest.
Figure 4.8: Community Forest Demand
Source: Field Survey Data (2016).
4.4.3 Alternative Sources of Forest Products
Apart from the forest other areas where they can get forest product from respondents
own wood lots, small patched around their farm field and general land. The sample
of respondents revealed that 72% owned small wood lots of an area of 0.5 to 3 acre
while 28% of the respondents they do not own any wood lots (Figure 4.10). The

46
study shows that many household have woodlots in the study area. This is because
the demand for forest product is very high in the area and a lot of awareness has been
conducted in the study area about tree planting. Most of the planted trees in woodlots
technology were exotic species like Gravillea robusta, Eucalyptus and Acrocarpus
species. Basically, these species were introduced in order to meet critical fuel wood
demands for domestic uses and maintenance of conditions allowing for sustained
agriculture and livestock production (Mnzava, 1980; Kaale, 1984). The study is
similar to (Indufor, 2011) who estimated that there is about 80,000 to 140,000ha in
total of village (woodlots) and farm plantation in Tanzania. Furthermore, FBD
(2005) reported the similar study that tree planting became an entrenched practice by
people and when seedlings were not available from local authorities nurseries,
residents used seedlings self-germinating under existing trees. A few individuals also
established small nurseries to produce seedling for their own requirements and also
for sale to other farmers. This implies the households in the study area highly
motived in tree planting to offset the challenges of forest products demand.
Figure 4.9: Alternative Sources of Forest Products
Source: Field Survey Data (2016)

47
Plate 4.2: Woodlot Planted Observes At Mayo Village, West Usambara
Plate 4.2: Agroforestry Farm Field As Observed at Sagara village, West
Usambara

48
4.5 Evaluate the Intervention Measures Used to Manage Forest Resources
The study identified management challenges facing the reserved forest and Forest
Management system practiced in the study area.
4.5.1 Conservation Challenges Facing The Reserved Forest
The study area experienced conservation challenges on the reserved areas whereby
48% of the household respondent revealed that illegal tree cutting is the main
conservation challenges (Figure 4.11). This implies that illegal tree cutting has
greatly influenced the natural resource management in West Usambara. Apart from
increased demand for agriculture practiced due to increase in population, shifting
agriculture in the past and lack of traditional among the local people for protecting
the trees are principle causes of illegal tree cutting (Huwe, 1988). It also shows that
the continuous illegal tree cutting in West Usambara has led to land degradation.
This attributed to poor land husbandry, increase erosion and decline of soil fertility
and no limited use of fertilizer. The impact of this is declining of crops yields,
increased food insecurity and reliance of food aid, poor nutrition and increased
dependence on forest for livelihoods (Mwihomeke, 2002).
Rapid deforestation in West Usambara has been driven by industrial logging, small
scale logging, fire wood collection, subsistence agriculture, large scale agriculture
such as tea plantations as well as monocultures of exotic Eucalyptus, pines or
cypress; mining and other uses (Hall et al. 2009). With the estimated 57%
deforestation in the East Usambara mountain and 73% deforestation in the nearby
West Usambara mountains over the last 150 years (Newmark, 2002). This implies

49
that the area experience high rate of deforestation due to high demand of forest for
different uses.
Figure 4.10: Conservation Challenges Experienced In The Study Area
Source: Field Survey Data (2016)
Plate 4.4: Illegal Tree Cutting As Observed Inside Baga Forest Reserve

50
Likewise the study revealed that 26% forest encroachment as the management
challenges which affect the reserve area (Figure 4.11). This implies that the study
area has been affected by forest encroachment and this probably happen due to high
population growth and shortage of cultivation land. According to MNRT reported the
similar issue that encroachment and over-utilization has been taking place in the
forest reserves which are under jurisdiction of the central and local government
(URT, 1997). Moreover local people considered protected or reserved areas as
constraints to their livelihoods. Since it was not possible to create rigid separation
between land used by local people to obtain natural resource products and those
designated by governments as protected areas, encroachment, poaching, and
degradation were invertible (Primack, 2002). This is also supported by Hoffmann
(2002) who explained that agricultural expansion and consequent land degradation
processes; that is, overgrazing and deforestation as experienced in the Southern
Slope of Mount Kilimanjaro and West Usambara in Lushoto District explain why
land degradation occurs in relation to population density.
The study also revealed that mining contributes to 10% of forest destruction in the
study area (Figure 4.11). Small-scale artisanal miners have invaded the forests,
causing severe environmental destruction by felling valuable old indigenous trees to
dig up gold. Also it destroys water sources and wetlands. This is supported by
Mafupa (2006) who reported that in Eastern Africa severe encroachment and
exploitation of mining activities destroying the forest that occurs in fragmented
patches.

51
Plate 4.3: Illegal Miners As Observed At Tewe Village in West Usambara
4.5.2 Forest cover change
Data from the Landsat image taken between 2002 and 2012 shows a vegetation cover
change caused by deforestation by 0.87%, grassland change by 4.4% and Montane
and Lowland forest 94.73% (Table 4.5). From the analysis satellite data,
deforestation rate is minimum in the study area as it has shown in the Figure 4.12
below. The data obtained from satellite image differ from the obtained surveyed data
which show high deforestation rate in the study area.

52
Table 4.5: Forest Cover Change Baga Forest Reserve 2002-2012
Land cover name Area (Ha) % of the total area
Montane and Lowland forest 3409.29 94.73
Deforestation 31.41 0.87
Grassland 158.22 4.4
Total 3,598.92 100
This variation is due to the fact that satellite image shows only the above tree canopy
cover. Likewise field observation and discussion with the key informant revealed
that that illegal harvesting are done by selective tree cutting whereby different tree
species are selected according to the uses example timber, fire wood and poles which
make difficult for satellite image to observe the effect under the tree canopy. This is
similar to findings conducted in Eastern Arc explain eight of the top eleven most
commonly cut species are known to be good sources of timber and fuel wood
(Shulman et al 1998, Mbuya et al 1994).
Furthermore according to Bumbuli Forest Officer about 20 illegal tree cutting has
been reported from Baga forest and 1200cm3 of timber has been confiscated between
2015 and 2016. Likewise Halter (2016) observed the stem cut density of 180
stems/ha (>20cm diameter) in Baga II forest reserve which also supported by
(Schulman et al. 1998) who found that the stem cut density in montane forests to be
200-300 stems/ha. Study conducted by (Newmark, 1998) revealed that over 2000
year ago the forest cover for Eastern Arc Mountain has changed from 23,000 km2 to
15,000km2 by mid 1900s. Losses were greatest, relative to original cover in Taita
Hills (98%), Ukaguru (90%), Mahenge (89%) and West Usambara (84%).
Furthermore, based on Tabor et al (2010) finding deforestation rate for Tanzania

53
protected area are -0.05% per year whereas rate of outside the protected areas are -
0.26% per year.12% of deforestation occurred inside the protected area.
Figure 4.11: Forest Cover Change Baga Forest Reserve between 2002 and 2012
From the satellite image (Table 4.5 and Figure 4.12), it was shown that 31.41 hectare
of forest has been degraded in Baga forest reserve between 2002 and 2012. This is
similar to study conducted Temu and Mbwana (1984) who reported that in East
Usambara for example, the Amani forest has been reduced by about 50% while in the
Western Usambara, an estimated average of about 7,000ha of forest has been cleared
annually between 1960 and 1980. Likewise NEMC, (1995) estimated that over 70%
of the Usambara forests have been cleared since 1905. Finding by Kashaigilia et al
(2013) in Tanzania revealed that during the period 1980-1995 and 1995-2010, closed

54
forest decreased by 635.5ha (-11.9%) and 1674.9 ha (31.3%), respectively. Hansen et
al (2004) observed that the tree cover of the world had decreased between 1984 and
1997 and the annual deforestation rate in tropical Africa was about 0.09%. In his
study to identify and map deforestation using Landsat images and Global inventory
Modelling and Mapping Studies (GIMMS) data from 1980s to 2000s Wu (2011)
found that Kenya still remained at the deforestation rate of about 0.3% per year.
Large loss of forest area was indicated for Tanzania and Uganda, about 1.2% and
2.7% per year, respectively.
4.5.3 Forest Management System Practice
The survey revealed two types of management system which are Joint forest
management system and Community base forest management system, Figure 4.13
show that 71% of respondents revealed to practices joint forest management system,
25% both community and joint forest management system, 4% Managed by
Government. In 1998, Tanzania approved a National Forestry Policy, the first new
forest policy since 1963 which promoted substantial change in the way forests are
managed (MNRT, 1998a). The policy aims to promote participation in forest
management through the establishment of VLFRs, where communities are both
managers and owners of forests, as well as through JFM, where local communities
co-manage NFRs or LAFRs with central and local government authorities. As it was
revealed the study area practiced both Joint forest management and community forest
management as it was stipulated in the Forest Policy. Participatory forest
management system involves a high degree of participation of villagers in all stages
of forest management planning, implementation, monitoring and evaluation and also

55
sharing of benefit (Bromley and Ramadhani, 2006). Participation of communities to
forest management enables sustainable flow of forest products which improves the
livelihoods of communities surrounding the forest through creating awareness to
them (Iddi, 2002). According to Kessy (1998), recommended approaches in
participatory forest management vary from one locality to another depending on
group interests. Also it argued that local community interest in participatory
management of forest is influenced by the need for forest product, by cultural factors
and in the option of using forests as source of household food and income or
employment (Kessy, 1998).
Figure 4.12: Forest Management System Practice
Source: Field Survey Data (2016).
4.5.4 Forest Management Challenges
The study area experienced several challenges regarding forest management about
36% of the respondents mentioned management plan, Joint agreement and bylaw
developed were not being approved by the government (Figure 4.14).The
implementation of Joint Forest Management, legalized through the signing of Joint

56
Management Agreements, management plan and bylaws which has been more
uncertain to the study area. Only the management plan and bylaws for community
and village forest reserve have been signed but none of the Joint agreement,
management plan and bylaws in the forest reserve have been signed which cause
problem on the implementation and management of the forest.
Likewise 28% of the respondents mentioned benefit sharing between Government
and community not clear (figure 4.14).The issue of benefit sharing is not clear on the
joint management agreement this is largely because of the fact that the law remains
silent on how the benefits of forest management can be equitably shared with
participating communities. In many cases, benefit-sharing arrangements remain in a
legal limbo – with de facto management at the local level taking place, in return for
vague promises about benefits at a later date. Clearly, this is a situation that cannot
be sustained indefinitely. Without benefits reaching a level that equal or exceed the
costs being borne, in terms of local forest management, the long term future of Joint
Forest Management remains uncertain (Blomley and Iddi, 2009).
Furthermore, 22% mentioned poor law enforcement (figure 4.14).The study also
observed the existence of weak forest management systems (in particular the
lack of effective implementation of forest management laws), and the lack of a
formal mandate to control the use of forest products within the village were
reported to constrain the management of forest resources. For instance, it was
reported by key informants (members of the VNRC) that district natural resource
officers were unwilling to give them a formal mandate to enforce laws and control

57
the use of forest products. Thus, this constrains efforts geared at the sustainable
management of forest resources, in particular by controlling deforestation caused by
cutting trees for building materials and timber. This concern is also reported by
Blomley and Ramadhani (2006), who asserted that those responsible for
disseminating and implementing laws, such as district technical staff, may be
unwilling to divest themselves of power and give it to villagers. Also Shemdoe,
(2003) reported the existence of governance structures with cultural background
(Informal local governance structures) and those with political background (formal
local governance structures) in his study villages around Lake Manyara National
Park Tanzania. Therefore, good governance is needed in order to enable community
to manage forest in sustainable way.
Moreover, 10% of the respondent mentioned low awareness about forest
conservation practices (Figure 4.14). Community involvement in forest management
need be enhanced through increasing awareness, education and empowerment (Paulo
et al.2007). Similarly Anim (1999) reported that awareness on land degradation and
perception of the benefits to accrue out of the forest management practices are
crucial factors for investment and adoption of conservation measures. Kajembe et al
(2004) emphasized that to ensure full participation in PFM programmes, stakeholder
at community level need essential skills and sensitization about their rights,
responsibilities and expected return.
About 4% of the respondents mentioned low understanding about forest policy and
Act (Figure 4.14) which contributed to poor management of the forest. According to

58
National Forest Programme (NFP) of Tanzania it emphasizes the need for awareness
creation in forest management among all stakeholders to ensure effective
involvement in the implementation of the National Policy and Forest Act (Iddi,
2003).
Figure 4.13: Forest Management Challenges
Source: Field Survey Data (2016).
4.6 Summary of Chapter
The present chapter has dealt with the study findings, results and discussion. This
chapter particularly dwelt on descriptive analysis of sample characteristics as well as
the quantitative of the study variables. The data presentation and analysis focused on
testing the three research questions to achieve the desired objectives of the study.
The qualitative analysis was used to examine the relationship of the interested
variables.

59
CHAPTER FIVE
5.0 CONCLUSIONS AND RECCOMANDATIONS
5.1 Introduction
This chapter presents conclusions of the study findings, results and discussion
presented in chapter four. Finally the chapter presents recommendations for
administrative action and for further study.
5.2 Conclusion
This chapter summaries the findings and results related to population growth, forest
management, social economic factors relating forest uses, benefit sharing and Policy,
legislative and regulatory measures-enforcement and compliance
The finding revealed that forests in the study are poorly managed and community do
not adhered to government laws, rules and regulation. Forest has been under pressure
due to illegal activity such as tree cutting, fire wood collection, and forest
encroachment and mining. The evidence showed that rapid urban population growth
has led to poor forest management in the study area because the demand and supply
of the natural resource requirement do not balance.
The first objective of this study examined the trend of population growth in Tanzania
over the past thirty years. The study has shown that population of Tanzania has
doubled from 17.5 million in 1978 to 44.9 million in 2012 while the population of
Lushoto District raise from 246,049 in 1978 to 492,441 in 2012 with a population
60
density of 120.4 Square Kilometer which is higher than the national population
density of 51 persons per Square Kilometer. High population density in the study
area resulted to shortage of land for cultivation as the result lead to forest
encroachment and illegal activity inside the forest.
The basis of objective two was to examine the socio-economic factor affecting forest
resource uses. The study assessed the factors affecting the resource uses in the study
area and it has found that about 84% of the community depends on forest for fire
wood while the 93% revealed that there is high demand for forest products like
medicine, firewood, poles in the study area. The finding from the study area revealed
high demand for forest product to support their social and economic needs which
required attention from the conservationist to find the alternative solution for it. The
study area is surrounded with reserved forest owned by the government, but due to
adjacent community population growth; high demand of the forest products and poor
forest management practices has led to high pressure to the forest. Some measure
should be taken to resolve this such as introduction of agroforestry practices and
woodlot establishment.
The final objective of the study was to evaluate forest management intervention
measures taking place in the study area. The focus was on observing forest
management system existing in the study area. The finding revealed that proper
forest management practices do not exist in the study area, although participatory
policies have been adopted, JFM model does not adequately grant local actors the
real decision making authority to participate actively and effectively in natural

61
resource management. This is because the JFM model dictate the limit of local actors
participation and the vision of resource management remains rather resource state-
centric, with very little room for local actors to accurate their own interests. None of
Joint forest agreement which explain the distribution of the benefit sharing has been
signed, as the result community they don’t fill as part of the management. The
responds from the key informant revealed that the study area has weak forest
management system, poor laws enforcement and lack of cooperation between the
community and Forest departments. This has resulted on continuously uptake of the
forest products from the forest reserve.
5.3 Recommendation
The following recommendations were drawn on the basis of this study
i) The study recommends that family planning education and campaign should
be strengthened in Lushoto District Council, so as to reduce human
population pressure over the land. Likewise the district should re-mobilize,
re-encourage and sensitize people to move to unoccupied/vast land especially
in Handeni and Kilindi or to establish employment opportunities that will
attract people to settle and work on these suggested areas. The district should
develop land use plan to each village which will show equal distribution land
according to the use. Furthermore the community should be trained on
optimal utilization of available land using improved agriculture practices.
ii) Social economic benefit of the forest should be considered during the initial
stage of the development of the management plan, this includes high cultural,

62
spiritual, or recreational value, employment, value generated from the
processing and trade of forest products, and investments in the forest sector.
Maintaining and enhancing these functions is a part of sustainable forest
management, hence information on status and trends in socio-economic
benefits is essential.
iii) Ministry of Natural Resource should ensure that PFM is actively
implemented and the challenge of benefit sharing between government and
forest adjacent community is resolved. Active Joint Forest Management will
control harvesting and utilization of the forest product and maintained
sustainably. Community forest management should be promoted because it
gives community responsibility to protect their own forests and the right to
use them in sustainable manner which lead to improvement of forest
condition.
iv) The study recommended that government could develop the mechanisms
whereby National and international beneficiaries of the environmental
services of forests have to pay for such services .There has been some
success in devising schemes to collect payments for environmental
services like carbon sequestration, biodiversity conservation and
catchment protection. This success can further be more realized by
integrating participatory mode of management with these collection
schemes to ensure rights and tenure with equity in resource and benefit
sharing for improving the livelihood of the rural poor who actually are the

63
primary stakeholders of conservation and management. All parties with an
interest in the fate of the forest should be communally involved in
planning, management and profit sharing.
v) Wide variety of policy statements and legislative and regulatory
measures have been established to protect forests but need to be
effectively enforced. New modifications/adjustments are of course needed
for site specific conditions. Laws, policy and legislation should be such
that they encourages local people and institutional participation in
forestry management and conservation along with safeguarding indigenous
people’s traditional rights and tenure with rightful sharing of benefits.
Many formal and informal enforcement/compliance mechanisms can be used
to protect forest. These approaches include negotiation, warnings, cancelling
work orders, notices of violation, fines, arrests and court action.
5.4 Recommendations for Further Research
This study dealt only with the assessment of the impact of population growth on
forest resource management in West Usambara, Tanzania. It is suggested that,
further research should be done to assess the social-economic impacts of population
growth or other related aspect on population and sustainable utilization of the forest
products.

64
REFERENCES
Anim, F. D.K. (1999). “A Note on Adoption of Soil Conservation Measures in the
Northern Provence of South Africa”. Journal of Agriculture Economics
50(2), 336-345.
Baland, J. M. and Platteau, J. P. (1996). Halting degradation of natural resources: Is
there a role for rural communities. Oxford: Clarendon Press.
Best, J. W. and Kahn, J. V. (1998). Research and Education. Boston: Alyn Bacon.
Bilsborrow, R .E. and Carr, D. L. (1998). Population, agricultural land use and the
environment in developing countries. Paper presented at the AAEA
International Conference on Agricultural Intensification, Economic
Development, and the Environment, Salt Lake City, July 31-August 1, 1998.
Boserup, E. (1965). The conditions of agricultural growth. New York: Aldine
Publishing Co.
Boserup, E. (1981). Population and Technological Change: A Study of Long-Term
Trends. Chicago: University of Chicago Press.
Boserup, E. and Schultz, T. P. Eds. (1990). Economic and demographic relationships
in development. Baltimore, MD: Johns Hopkins University Press.
Chomitz, K. M., Buys, P., Luca, G. D., Thomas, T. S. and Wertz-Kanounnikoff, S.
(2007). At loggerheads? Agricultural expansion, poverty reduction and
environment in the tropical forests. World Bank Policy Research Report.
Washington DC: World Bank.
Coale, A. J. and Hoover, E. M. (1958). Population Growth and Economic
Development in Low-Income Countries: A Case Study of India's Prospects.
Princeton: Princeton University Press.

65
Creswell, J. (1994). Research Design: Qualitative and Quantitative Research
Approaches. New York: Sage Publishers.
MNRT, (2005). Forest Inventory Reports. Districts of Rufiji, Liwale, Kilwa,
Mkuranga/Kisarawe, Mvomero, Tunduru, Kilombero, Mpanda,
Nachingwea, Ulanga and Handeni/Kilindi. Forest and Beekeeping Division.
Dar es Salaam: Government Printer.
MNRT, (2006). Participatory Forest Management in Tanzania Facts and Figures.
(First edition). Dar es Salaam: Government Printer.
Green, C. P. (1992). The environment and population growth: Decade for action,
Population. Baltimore: Johns Hopkins University Press.
Giliba, R. A., Lupala, Z. J. and Mafura, C. (2010). Non-timber Forest Products and
their Contribution to Poverty Alleviation and Forest Conservation in Mbulu
and Babati Districts-Tanzania. Journal of Human Ecology 31(2), 73-78.
Retrieved from http://www.krepublishers.com/...Journals/...Giliba.../ on 11th
March, 2017.
Hayami, Y, and Ruttan, V. W. (1985). Agricultural development: An international
Perspective, (2nd edition). Baltimore: Johns Hopkins University Press.
Hall, J., Burgess, N. D., Lovett, J., Mbilinyi, B. and Gereao, R. E. (2009).
Conservation Implications of deforestation across an elevation gradient in
Eastern Arc Mountains, Tanzania. Biological conservation, 142, 2510-2521.
Retrieved from https://www.cabdirect.org/cabdirect/abstract/20103079004
on 13th May, 2017.
Hoffmann, W. A. and Jackson, R. B. (2002). Vegetation-climatic feedbacks in the
conversion of tropical savannah to grassland. America Meteorology Society
66
13, 1593-1602. Retrieved on 22nd September, 2016 from
citeseerx.ist.psu.edu/viewdoc/download?doi=10.1.1.456.5924&rep=rep1.
Iddi, S. (2002). Community Participatory in Forest Management in the Republic of
Tanzania. Proceedings of Second International Workshop on Participatory
Forestry in Africa, defining the wayward: Sustainable Livelihoods and
Sustainable Forest Management through Participatory Forestry, 18-22
February 2002, Arusha, Tanzania.
Iddi, S. (2003). Communication Workshop at Morogoro 2002-2003. In URT (Ed).
Proceedings of FBD Workshop on Communication. 7-8 August, Morogoro,
Tanzania.
Kalineza, H. M. M., Mdoe, N. S. Y. and Mlozi, M. R. S. (2000). Factors influencing
Adoption of Soil Conservation technologies in Tanzania. Journal of
Agriculture Economics, 17, 27-40. Retrieved on 13th March, 2017 from
www.tzonline.org/pdf/factorinfluencingadoptionofsoil.pd.
Kang, B. T., and G.F. Wilson.(1987). The development of alley cropping as a
promising agroforestry technology. Nairobi: Nairobi: ICRA.
Katani, J. Z. (1999). Coping strategies Against Deforestation: of Socio-Economic
Factors with special Attention to Gender-based Indigenous Knowledge in
Mwanza District. MSc Degree Dissertation, Sokoine University of
Agriculture, Morogoro, Tanzania.
Vainio-Mattila, K. (2000). Wild vegetables used by the Sambaa in West Usambara
Mountains, NE Tanzania-Ann. Annales Botanici Fennici, 37(1), 57-67.
Retrieved on 23rd May, 2017 from http://www.jstor.org/stable/23726936.

67
Krishnaswami, O. R. (2002), Methodology of research in social sciences. Delhi:
Himalaya.
Kothari, C. R. (1990), Research methodology: Methods and Techniques. New Delhi:
Age International.pg 160-165.
Kothari C.R. (2004). Research methodology methods and technique, (2nd edition).
New Delhi: New Age International Publisher.
Kothari, C. R. (2009). Research Methodology. Methods and Techniques, (2nd
edition). New Delhi: New Age International Publishers.
Kuznets, S. (1967). Population and Economic Growth. Proceedings of the American
Philosophical Society, 111(3), 170-93. Retrieved on 12th June, 2017 from
www.popline.org/node/510080.
Lusambo, L. P. (2009). Socio-economic analysis of Land use fact factors causing
degradation and deforestation of Miombo woodlands in Kilosa district,
Tanzania. MSc Degree Dissertation, Sokoine University of Agriculture,
Morogoro Tanzania.
Lushoto District Council (ed.) (2010): The Lushoto District Socio-economic Profile.
The District Executive Director Office, Lushoto.
Lushoto District Council (ed.) (2013). The Lushoto District Socio-economic Profile.
The District Executive Director Office, Lushoto.
Madulu, N. F. (2001). Population Dynamics Sustainable Conservation of Protected
Areas in Tanzania: The Case of Swagaswaga Game Reserve in Kondoa
District, READ No. 2, Report in Environmental Assessment and
Development, Applied Environmental Impact Assessment, Uppsala
University, Sweden. Retrieved on 15th July, 2017 from

68
www.citeseerx.ist.psu.edu/viewdoc/download?doi=10.1.1.605.2103&rep=re
p1.
Mafupa, C. J. (2006). Impacts of human disturbances in Miombo Woodlands of
Igomba River Forest Reserve, Nzega District, Tanzania. MSc Degree
Dissertation, Sokoine University of Agriculture, Morogoro, Tanzania.
Maro, P. (1983). Population of Tanzania: 1978 Population Census, Vol. VIII, Bureau
of Statistics, and Ministry of Planning and Economic Affairs. Dar es
Salaam: Government Printer.
Malinski, B. (2008). Impact Assessment of Chitetezo Mbaula. Improved Household
Firewood Stove in Rural Malawi. Retrieved on 24th June, 2017 from
https://cepa.rmportal.net/.../Impact%20Assessment%20of%20Chitetezo%20
Mbaula%2.
Mbwambo, J. S (2000). The Role of Local Knowledge and Organizations in
Sustainable Conservation of Biodiversity: A case Study of Udzungwa
Mountains, Tanzania. MSc Degree Dissertation, Sokoine University of
Agriculture, Morogoro, Tanzania.
Msaliwa, U. (2013). Role of Non-Timber Forest Products in Climatic Change
Adaptation by forest dependent Communities in Kilolo district, Iringa,
Tanzania. MSc Degree Dissertation, Sokoine University of Agriculture
Morogoro, Tanzania.
Monela, G. C., Kajembe, G. C., Kaoneka, A. R .S. and Kowero, G. (2000).
Household livelihood strategies in the Miombo woodlands of Tanzania:
Emerging Trends. Tanzania Journal of Forestry and Nature Conservation
73, 17–33. Retrieved on 22nd May, 2016 from

69
http://www.cifor.org/library/692/household-livelihood-strategies-in-the-
miombo-woodlands-of-tanzania-emerging-trends/?pub=692&pf=1.
MOHSW, (2013). National Family Planning Costed Implementation Program 2010-
2015. Dar-e-Salaam: Government Printer.
Mnzava, E. M. (1980). Village afforestation: Lessons of Experience in Tanzania.
Rome: FAO.
Multhus, T. R. (1798). An Essay on the Principle of Population. London: J. Johnson.
Nambiza, W. and Lyatura, N. (2013). Endline Survey for project Improving
Livelihood security and sustainability for rural communities in the Eastern
Arc Mountains Project and Baseline Survey for New Generation Watershed
Management Project. TFCG Technical Paper 42. Retrieved from
http://www.tfcg.org/pdf/TFCG%20West%20Usambara%20Monitoring%20
Report%202013%20FINAL.pdf on 5th April, 2017.
Ndagalasi, H. R., Bitariho, G. and Dovie, D. B. K. (2007). Harvesting of non-timber
forest products and implications for conservation in two montane forests of
East Africa. Biological Conservation 134, 242-250. Retrieved on 3rd May,
2016 from itfc.org/publications/MUP%20monitoring%20paper%202.pdf.
NEMC, (1995). Tanzania National Strategy for Sustainable Development. Dar es
Salaam: Government Printer.
Newmark, W. D. (2000). Forest area, fragmentation and loss in the Eastern Arc
Mountains: Implications for conservation of biological diversity. Journal of
East African Natural History. 87(1), 29-36. Retrieved on 1st May, 2016
from www.bioone.org/doi/pdf/10.../0012-8317(1998)87%5B29:FAFALI%

70
Newmark, W. D. (2002). Conserving Biodiversity in East African Forests: Berlin:
Springer-Verlag.
Panayotou, T. (1994). Population, environment, and development nexus. In
Population and development: Old debates, new conclusions, R. Cassen, ed.
Washington, D.C: Overseas Development Council.
Primack, R. B. (2002). Essentials of conservation biology, 3rd ed. Cambridge:
Associates Inc.
Repetto, R. (1986). Soil loss and population pressure on Java. Ambio15 (1): 14-18.
Retrieved on 22nd July, 2017 from https://www.researchgate.net/.../
Ruffo, K. C., Birnie, A. and Botengnas (2002). Edible Wild Plants of Tanzania.
Nairobi: RELMA.
Salmi, J. and Monela, G. C. (2000). Study on Financing in Forestry, Formulation of
National Forest Programme in Tanzania, Final Report, Ministry of Natural
Resources and Tourism, Forestry and Beekeeping Division. Dar es Salaam:
Government Printer.
Schulman, L., Junika, L., Mndolwa, A. and Rajabu, I. (1998). Tree of Amani Nature
Reserve: NE Tanzania. Helsinki: Helsinki University Printing House.
Shackleton, C. and Shackleton, S (2004). The importance of non-timber forest
Products in rural livelihood security and as safety nets: a review of evidence
from South Africa. South African Journal of Science, 100 (12), 658-664.
Retrieved on 11th July, 2017 from citeseerx.ist.psu.edu/viewdoc/
download?doi=10.1.1.581.8830&rep=rep1.
Scherr, S. J., and Hazell, P. (1994). Sustainable agricultural development strategies
in fragile lands. EPTD Discussion Paper No. 1. Washington, D.C.

71
International Food Policy Research Institute. Retrieved on 5th March, 2017
from https://www.researchgate.net/publication/.../.
Shishira, E. K. and Yanda, P. Z. (1998). An Assessment and Mapping of Forest
Resources in Part of Tabora Region, Tanzania, Using Aerial Photography.
Research Report Submitted to the Division of Forestry, Ministry of Natural
Resources and Tourism, Dar es Salaam.
Shishira, E., Yandaand, P. Z., Lyimo, G. (1998). Human Pressure on Coastal Forests
in Tanzania: The Case of Pugu and Kazimzumbwi Forest Reserves and
Surrounding Areas, IRA Research Papers, University of Dar es Salaam.
Simon, J. (1981). The Ultimate Resource. Princeton: Princeton University Press.
Soini, E. (2002a). Changing landscapes on the southern slopes of Mt. Kilimanjaro,
Tanzania. World Agroforestry Centre, Nairobi. Retrieved on 2nd March,
2017 from http://www.worldagroforestry.org/downloads/Publications/...pdf.
Southgate, D. (1988). The economics of land degradation in the Third World, World
Bank, Environment Department Working Paper No. 2, May. Washington,
D.C.: World Bank.
Tabor, K., Kashaigili, J. J., Mbilinyi, B. and Wright, M. T. (2010). Forest cover and
change for the Eastern Arc Mountains and Coastal Forests of Tanzania and
Kenya circa 2000 to circa 2010. Final Report. Retrieved on 13th March,
2016 from https://www.birdlife.org/sites/default/files/.../cepf...pdf.
Temu, A. B and Mbwana, S. B. (1984). Social economic impact of illegal tree
cutting. National tree planting Workshop, September 1984. Ministry of
Land, Natural Resources and Tourism, Dar es Salaam.

72
United Republic of Tanzania, (2012). Population and Housing Census, National
Bureau of Statistics. Dar es Salaam: Government Printer.
United Republic of Tanzania, (2002). Forest Act. Dar es Salaam: Government
Printer.
United Republic of Tanzania (1998). National Forestry Policy. Dar es Salaam:
Government Printer.
United Republic of Tanzania, (2001). The Economic survey 2000. The Planning
Commission. Dar es Salaam: Government Printer.
United National Fund for Population Activity, (1991). Population, Resource and the
Environment: The critical challenges. New York: UNFP.
Webster, M. (1985). Webster`s ninth new collegiate dictionary. Meriam - Webster
Inc.
World Bank, (1992). World Development Report 1992: Development and the
environment. New York: Oxford University Press.
World Bank, (2001). Tanzania Forest Conservation and Development Project.
Project Appraisal document. Washington DC: World Bank.
Wu, Y. (2011). Investigation of Deforestation in East Africa on Regional Scales.
Master’s Thesis Geography. Stockholm: Stockholm University. Retrieved
from www.diva-portal.org/smash/get/diva2:450729/FULLTEXT01.pdf on
25th September, 2016

73
APPENDICES
APPENDICES 1
Household questioners
Interviewers start by clarifying the objective of the research, and reassuring the
respondent that all information they provide will be strictly confidential and will not
be used against them and that they should feel free to talk about all benefits derived
from the forest, even those that are illegal.
A. Location of the Village
Questionnaire number………………………………………...………..………………
1. Name of Interviewer…………….......................................................................
2. Village………..……ward……..…….Division…………….District….………
B. Respondent Information
1. Gender: 1. Male ( ) 2. Female ( )
2. Age ……………………… (in years).
3. Ethnic Group ……………………………………………………………….
4. Marital status
1. Married 2. Single 3.Separated 4.Divorced 5. Widow
Household size
(1) 1 (2) 2-5 (3) 5-9 (4) 10+9. Level of education
No. Level of education Tick Specify exact class
1. No formal education

74
2. Primary education
3. Secondary education
4. Technical education
5. Diploma or University Education
6. Others (Specify)
7. Place of origin
1. Born in the village ( ) 2. Born outside the village but within the district ( ) 3.
Born outside of the district but within the region ( ) 4. Born outside the region ( )
8. If you moved into this village, when did you settle in this village? …………….
(Year)
9. What were your main reasons for settling in this village?
1. In search of agricultural land 2. In search of business opportunities
3. Unfavorable climatic conditions in previous place 4. Following relatives
5. Marriage 6. Employment 7. Others (specify)
…………………………………………………
10. What is your main occupation?
1. Crop production 2. Livestock keeping 3. Wage employment 4. Petty business
( ) 5. Beekeeping ( ) 6. Collecting and selling forest products 7. Casual labor ( )
8. Others (Specify)………………………………………..
(C) Information about Forest Management Challenges
1. What is the general situation of the reserved forest in your village?
1. Good 2. Moderate 2 .Bad 4 Others (Specify.…………
………………..…..….. ( )

75
2. What are the main challenge facing the reserved forest in your village?
3. Illegal tree cutting 2. Forest encroachment 3. Grazing 4. Mining
4. Others (Specify …………….…………….………….…………… ( )
5. Do you think there is forest destruction in your village/area?
YES/NO………….
6. If YES, What are the main causes of forest destruction in this village?
7. Over stocking
8. Poor agriculture practices
9. High rate of population growth
10. Poverty
11. Others specify …………………………………………..…………….…. ( )
D) Information about Forest Managemnt System
1. Do you have forest reserve? Yes or No
2. What type of the forest reserve do you have?
i) Community forest
ii) Catchment forest reserve
iii) Village forest reserve
iv) Both village and catchment forest reserve
v) Both community and catchment forest reserve
vi) Traditional forest
vii) Others (Specify)
3. What type of forest Management system do you have?
i) Community base forest management system

76
ii) Joint forest management system
iii) Both community and Joint forest management system
iv) Others (specify)
4. Is there any forest management challenge in the village? Yes or No
If yes, what are those challenges?
i) Poor law enforcement
ii) Low of awareness about forest conservation practices
iii) Management plan and bylaws not approved
iv) Low knowledge about forest policy and act
v) Benefit sharing not clear
vi) Others (specify)
5. What measures have been taken to resolve those challenges? Mention
……………………………………………………………………………………..
………………………………………………………………………………..……
E. Availability and Uses of Forest Products
1. Do you have access to forest products? 1. Yes ( ) 2. No ( )
2. How do you gain access to these forest resources?
i) Allowed by the village government ( )
ii) Allowed by the existing traditional institutions ( )
iii) Both existing village government and existing traditional institutions ( )
iv) Pioneering into the forest
v) Community forest management plan and bylaws
vi) Joint forest management plan and bylaws
vii) Both community Joint forest management plan and bylaws

77
viii) Other means (specify)……………………………………………… ( )
ix) Mention type of forest products does your family collect from forest?
1. Firewood ( ) 2. Poles ( ). 3. Medicine ( ). 4. Timber ( ).5 fruits. 6.
3. Is there other benefit do you get from forest apart from forest product? Yes or No
If the answer is Yes, Please mention
…………………………………………………………….............................................
4. Apart from forest where else can you get forest products?
1. Own wood lots ( ) 2. Forest patches around our farms ( ). 3 General land ( )
5. How many days per week do you go to collect the forest products?
1. One ( ) 2. Two ( ) 3. Three ( ) 4. Every day ( ) 5. Not involved ( )
6. Describe and name forest products in detail, and their uses within your locality.
The relative importance of various forest resources for different groups
Type of local use Low Medium High
Food
Medicine
Building/construction materials
Fodder/grazing
Fuel wood for energy
Spiritual /Ritual use
Others (specify)
7. Do you own woodlots/farm trees? 1. Yes ( ) 2. No ( ).
8. If the answer is yes, will you please provide information to fill the table below
No. Name of
tree
planted
Type
(1.Exotic, 2.
Indigenous)
Number
of trees
owned
Where planted
(1.Within village,
2. Outside village)
Size of
farm
Use of
trees
1
2
3
4

78
9. What problems do you faced on woodlots establishments and management?
1. Theft ( ) 2. Drought ( ) 3.Lack of tree seed ( ) 4.Disease and pest ( ) 5.Fire( )
6. None ( )
10. Do you have any challenges in accessing forest products? Yes or No
If yes what challenges do you faced? Mentions
……………………………………………………………………………
…………………………………………………………………………….
11. What measures have been taken to resolve those challenges?
…………………………………………………………………………………..
…………………………………………………………………………………..
F. Information about Population Growth
1. Do you think high rate of population growth has led to the increase in forest
destruction? Yes or No
2. If yes in which aspects
i) Forest encroachment
ii) High demand for forest products
iii) Utilization of marginal land
iv) Others specify
3. How do you compare the availability of forest products over the past 10 years?
1. Increasing ( ) 2. Decreasing ( ) 3. No change ( )
4. If decreasing, what are the causes for such decrease?
i) High demand forest products due to increase in population
ii) Poor law enforcement
iii) Climatic change

79
iv) 4. Lack of education about forest conservation
v) 5. Lack of awareness about forest conservation
vi) 6. Other specify
5. What measures have been taken to control the impact of population growth on
natural resources?
i) Family planning
ii) Shifting to other area
iii) Improved agriculture and soil conservation techniques
iv) No measure taken
THANK YOU FOR YOUR COOPERATION
80
APPENDICES 2.
Focus group discussion
2.1 Forest Management System
District Forest Department/Village Natural Resource Committee
Form number…………………
Date of interview: ……………………………………………
Group Name: …………………………………………………
1. What is the existing forest management system in your village? Mention
…………………………………………………………………………………………
2. What are the existing rules/regulations for accessing such forest
products/resources?
No. Rules on Forest Resources Who formulated those Satisfied Yes/No
Reason Any suggestions
………………………………………………………………………………………….
3. What institutions are responsible for forest and forest resources management?
No. Name of Institution Roles Name of institution Roles
…………………………………………………………………………………..……
4. How is community involved in forest resources management?
5. How are benefits from forest resources management shared by the community?
6. What problems/challenges are faced in accessing and utilizing forest resources?
7. What are the major problems/challenges are facing management of forest
resources?
8. What should be done to overcome these problems?
…………………………………………………………………………………

81
2.2 Village Chairmen and Village Executive Officers
Location
Village: Ward: Division: District
Date of interview: --------------------------
Position at the village: ----------Age------------- Sex---------------
1. How long have you lived in this village?
2. How many households does the village have?
3. What was the population for the past 10, 20 and 30 and present?
Years Present 10 20 30
Population
4. What forest management system do you have?
5. Are there some regulations and bylaws set by the village/ward/district regarding
forest management?
6. Do the communities adhere to the forest regulation and bylaws? Yes or No
7. If the answer is no, why? ....................................
8. Do you think the forest regulation and bylaws help in forest protection? Yes or
No
9. If the answer is No, why?
.....................................................................................
10. What type forest products does community use?
Mention…………………………………………………………………
11. Is the community allowed to access forest products? Yes or No
12. Which criteria are used to access forest product?

82
13. In your opinion, do you think the increase in population affect forest
management? Yes or No
14. If yes in which aspect?
THANK YOU FOR YOUR COOPERATION

83
APPENDICES 3
Individual interview checklist
Interviewee name and title……………………………………………..………..
Date of interview and place………………………………………………………
1. Briefly explain the environmental situation in the village adjacent to Baga Forest
reserve
2. Why do you think the increase in population is a major problem in forest
management? What are the causes and the magnitude of the problem? What do
you think is the impact of this situation?
3. What are forest management system practiced by Forest department and
community?
4. What are factors affecting forest management system, magnitude of the effect,
measure taken to overcome the effect?
5. Do you think the measure taken by the government and NGOs to address the
Problems it’s adequately enough? What other measures should be taken?
6. What will happen if nothing will be done regard to the increase in population?
7. What recommendation do you give to improve the forest management system in
this area?
THANK YOU FOR YOUR COOPERATION