The Impact of Welfare Reform on Charitable Organizations: The Capacity ... · PDF fileThe...
144
CENTER FOR PUBLIC POLICY AND ADMINISTRATION University of Utah WELFARE REFORM INITIATIVE The Impact of Welfare Reform on Charitable Organizations: The Capacity of the Charitable Welfare Sector in Utah August 2001 Laurie N. DiPadova, Ph.D. Center for Public Policy and Administration Center for Public Policy and Administration University of Utah 1901 E. South Campus Drive, Room 2120 Salt Lake City, UT 84112-9363 (801) 581-6491
Transcript of The Impact of Welfare Reform on Charitable Organizations: The Capacity ... · PDF fileThe...
CENTER FOR PUBLIC POLICY AND ADMINISTRATIONUniversity of Utah
WELFARE REFORM INITIATIVE
The Impact of Welfare Reform on Charitable Organizations:The Capacity of the Charitable Welfare Sector in Utah
August 2001
Laurie N. DiPadova, Ph.D.Center for Public Policy and Administration
Center for Public Policy and AdministrationUniversity of Utah
1901 E. South Campus Drive, Room 2120Salt Lake City, UT 84112-9363
(801) 581-6491
CENTER FOR PUBLIC POLICY AND ADMINISTRATIONUniversity of Utah
WELFARE REFORM INITIATIVE
The Impact of Welfare Reform on Charitable Organizations:The Capacity of the Charitable Welfare Sector in Utah
Author:
Laurie N. DiPadova, Ph.D., Policy Fellow and Principal Investigator
Project Staff:
Center for Public Policy and Administration
James J. Gosling, DirectorLaurie N. DiPadova, Policy Fellow and Principal InvestigatorSara McCormick, Project Specialist
Thrasher Research Fund
Victor Brown, President and CEO (retired)
Financial supporter of this project and report:
Utah Department of Workforce Services
Financial supporters of CPPA's Welfare Reform Initiative:
Catholic Diocese of Salt Lake CityThe Church of Jesus Christ of Latter-day Saints
Humanitarian ServiceHoly Cross MinistriesIHC FoundationIntermountain Health Care, Mission Services
Salt Lake County GovernmentThrasher Research FundUtah Association of CountiesUtah Department of Human ServicesUtah Department of Workforce ServicesUtah Division of Indian Affairs
COPYRIGHT 8 2001by the Center for Public Policy and Administration
WELFARE REFORM INITIATIVEADVISORY COMMITTEE
Pamela Atkinson, Intermountain Health Care, Mission Services
Amanda Barusch, Social Research Institute, Graduate School of Social Work, University of Utah
Victor Brown, Thrasher Research Fund (retired)
Laurie DiPadova, Center for Public Policy & Administration, University of Utah
Jim Gosling, Center for Public Policy & Administration, University of Utah
Garth Mangum, Department of Economics, University of Utah
Sara McCormick, Center for Public Policy & Administration, University of Utah
Roz McGee, Utah Children
Lloyd Pendleton, The Church of Jesus Christ of Latter-day Saints Humanitarian Service
Pam Perlich, Bureau of Economic & Business Research, University of Utah
Ross Reeve, Demographic & Economic Analysis, Governor's Office of Planning and Budget
Thayne Robson, Bureau of Economic & Business Research, University of Utah
Kerry Steadman, Human Services, Salt Lake County
Mary Jane Taylor, Social Research Institute, Graduate School of Social Work, University of Utah
Helen Thatcher, Employment Development Division, Department of Workforce Services
Bill Walsh, Walsh & Weathers Research & Policy Studies
Shirley Weathers, Walsh & Weathers Research & Policy Studies
Cathy Zick, Family & Consumer Studies, University of Utah

2
3
ACKNOWLEDGMENTS
Any research project of this magnitude is not the work of one person, but of many. It is difficult tostart naming people who have contributed because I have learned much from countlesscommunity leaders while in the process of conducting this research.
That being said, I do need to acknowledge a few individuals specifically. I am grateful to ElderAlexander Morrison, Ph.D., of The Church of Jesus Christ of Latter-day Saints who, in 1997,requested that I conduct research on the impact of welfare reform on the charitable sector inUtah. He recommended that Dr. Victor Brown work with CPPA in this effort. Victor was trulymonumental in all of our welfare reform initiative efforts. Within weeks the Welfare ReformAdvisory Committee was formed and gave tremendous effort in framing and conceptualizing ourwork. I have learned a great deal from each of the members of that committee, a few of whomhave authored our CPPA reports. Shirley Weathers, Bill Walsh, and Garth Mangum truly possessencyclopedic knowledge of social welfare policy and poverty issues.
Other leaders provided us with early guidance and support which proved crucial to this effort:Bishop Neideraurer of the Catholic Diocese of Salt Lake City, along with Sister Suzanne Brennanof Holy Cross Ministries and Dee Rowland of the Diocese. Conversations with them were highlyinstructive for me.
Sara McCormick at CPPA played a key role with this research, as well as with the overall WelfareReform Initiative. Sara's sharp analytical thinking combined with her broad-based knowledge ofthe nonprofit community and other skills too numerous to list, are indispensable to CPPA efforts.
Our skilled and diligent interns from the Masters of Public Administration Programs at both theUniversity of Utah and Brigham Young University gave dedicated efforts to our work; we aregrateful to Hillary Diamond, Sopon Permpoonwiwat, and Amanda Holmes-Webster for their workwith us.
I am deeply grateful to all of those who provided us with data: participants in focus groups,charitable leaders who completed our surveys, LDS bishops and other clergy who submitted tointerviews, and other LDS Church sources for information. All of these individuals were highlysupportive of our efforts and eager to help.
Funding, of course, is key to the existence of our work and we are grateful to the UtahDepartment of Workforce Services for providing the grant for this research, and for HelenThatcher’s expert guidance. In addition, our other funders for the entire Welfare Reform Initiativeat CPPA have been of tremendous help to our efforts.
I have been heartened by all those with whom I have associated in this project, includingcharitable leaders in the state of Utah: their knowledge, their passion in caring for others, andtheir dedication and hard work are sources of inspiration for me.
Appreciation is expressed to those who graciously reviewed this manuscript. They include:Victor Brown, Darin Brush, Greg Gardner, Jim Gosling, Amanda Holmes-Webster, GarthMangum, Sara McCormick, Helen Thatcher, Bill Walsh, and Shirley Weathers.
Finally, I must take responsibility for any and all errors herein.
−Laurie N. DiPadova

4
5
TABLE OF CONTENTS
List of Tables .....................................................................................................................6List of Abbreviations..........................................................................................................7Executive Summary of Major Findings .............................................................................9Introduction......................................................................................................................15I. Welfare Reform in the United States .....................................................................17II. Economic Context and Provisions of Welfare Reform..........................................23III. Types of Charitable Institutions Studied ................................................................31IV. Methodology...........................................................................................................35
Phase 1 – Interviews and Focus Groups ...........................................................35Phase 2 – Initial Capacity Survey .......................................................................37
Database Development ................................................................................38Survey Distribution and Response Rate ......................................................39
Phase 3 – Post-Implementation Surveys ...........................................................40V. Research Findings and Discussion .......................................................................43
Capacity and Scope of LDS Welfare Sector ......................................................43LDS Wards....................................................................................................43Welfare Square .............................................................................................44LDS Inner City Project ..................................................................................45Conclusion ....................................................................................................45
Initial Capacity Study..............................................................................................46Greatest Concern Regarding the Impact of Welfare Reform
on Individuals and Families ..........................................................................53Conclusion ..........................................................................................................56
Post Implementation Surveys ................................................................................59First Post-Implementation Survey Findings and Discussion..............................59Summary.............................................................................................................66Second Post-Implementation Survey Findings and Discussion ........................66Summary.............................................................................................................77
VI. Summary of Findings .............................................................................................79Initial Capacity Study...........................................................................................79Summary of Findings from Surveys Administered After the
Implementation of Time Limits......................................................................83VII. Conclusion .............................................................................................................89
Bibliography.....................................................................................................................95
Appendix A – List of Welfare Reform Initiative Publications ........................................103Appendix B – Initial Survey and Cover Letters.............................................................105Appendix C – Post Implementation Surveys and Cover Letters..................................121Appendix D – Discussion Points: Religion and the Single Parent Family
on Welfare ..............................................................................................141
6
LIST OF TABLES
MethodologyTable 1: Initial Survey Response Rate...................................................................40Table 2: First Post-Implementation Survey Response Rate..................................41Table 3: Second Post-Implementation Survey Response Rate ............................41
Initial SurveyTable 4: Summary of Services Provided by Bishops at Welfare Square ..............45Table 5: Relative Knowledge of Welfare Policy Changes......................................46Table 6: Households with/without Children ............................................................48Table 7: Households Served and Employment Status ..........................................49Table 8: Households Served Receiving Government Assistance.........................50Table 9: Services Provided by Charitable Organizations ......................................51
First Post-Implementation SurveyTable 10: Changes in Requests from Various Household Categories ....................61Table 11: Indications of Change by Timeframe as Compared with
January-March 2000.................................................................................62Table 12: Mean Percentage Increases in Services Requested of Charitable
Organizations Compared to January-March 1999...................................63Table 13: Mean Percentage Increases in Services Requested of Charitable
Organizations Compared to October-December 1999............................64
Second Post-Implementation SurveyTable 14: Percentage of Respondents Reporting Changes in Number of
Requests over Previous Year...................................................................67Table 15: Percentage of Respondents Reporting Changes in Number of
Referrals over Previous Year ...................................................................69Table 16: Changes in Requests from Various Household Categories during
first six months of 2000, as compared with the previous year.................71Table 17: Indications of Change by Timeframe as Compared with
January-June 2000...................................................................................73Table 18: Mean Percentage Increases in Services Requested of Charitable
Organizations Compared to January-June 1999.....................................73Table 19: Mean Percentage Increases in Services Requested of Charitable
Organizations Compared to July-December 1999 ..................................75
Summary TableTable 20: Changes in Requests for Services: Major Changes in Rankings
of Increases in Services Requested of Charitable OrganizationsOver Time.................................................................................................86
7
LIST OF ABBREVIATIONS
AFDC Aid to Families with Dependent ChildrenDWS Department of Workforce ServicesFEP Family Employment ProgramLDS The Church of Jesus Christ of Latter-day SaintsPRWORA Personal Responsibility and Work Opportunity Reconciliation Act of 1996TANF Temporary Assistance to Needy Families

8
9
EXECUTIVE SUMMARY OF MAJOR FINDINGS
The purpose of this research is to examine the impact of welfare reform on charitableorganizations in Utah. Qualitative and quantitative data were collected and analyzed, along withadministrative and published data. All charitable welfare organizations in Utah were surveyed,with the exception of bishops of The Church of Jesus Christ of Latter-day Saints (LDS).However, other LDS data were collected. Respondents to the initial questionnaire were sentadditional surveys, designed to measure the impact of the implementation of time limits on theirorganizational capacity. Respondents to the surveys represent approximately one-ninth of thewelfare charitable leaders and organizations in Utah.
Major findings include:
I. Description of the Charitable Welfare Sector in Utah: A. The charitable sector consists of three segments: social service nonprofit
organizations, the welfare activities of The Church of Jesus Christ of Latter-day Saints,and religious congregations not affiliated with the LDS faith.
B. Using standard comparative measures, the LDS welfare subsector was found toapproximate two-thirds of the charitable welfare activities in the state of Utah.
C. As is the case of other states, religious organizations provide the vast majority ofcharitable welfare services in Utah. Typically, religious affiliation (or non-affiliation) is nota factor in granting assistance.
D. The charitable welfare sector in Utah represents a variety of organizations thatform a strong collaborative partnership to assist those in need. Theseorganizations know the services and expertise of one another and freely referpetitioners across religious, nonprofit, and government agency lines. Theseorganizations also provide support (financial, volunteer, and goods) to one another.
E. Religious leaders reported knowing far less about changes in welfare policy thando leaders of social service nonprofit organizations.
F. Social service nonprofit organizations maintain better records of characteristicsof those served and types of services rendered, than do religious organizations.
G. Members of religious congregations render substantial spontaneous assistance to othersin the congregation who are in need, frequently without direction from or directknowledge of the clergy.
II. Variety and Extent of Services Rendered by Charitable Organizations in Utah:
A. The charitable welfare sector serves vast numbers of people in Utah, far morethan can be accounted for by those on welfare, eligible for welfare, or livingat or below the poverty level. Survey respondents reported rendering service toover 788,000 people a year. While many families are served multiple times, it
10
must be recalled that this figure reflects the report of only one-ninth of charitablewelfare organizations.
B. Charitable organizations provide a wide range of services to those in need.Over half of the charitable organizations surveyed provide the following: servicesto homeless individuals and families, monetary assistance, transportation, food,clothing. Over one-third of the charitable organizations surveyed provide thefollowing: housing, medical/dental/prescription assistance; over 20% of thecharitable organizations surveyed provide the following: education, childcare,employment assistance; and 10-19% of the surveyed charitable organizations provide the following: substance abuse assistance, domestic violence/abuseassistance, legal services.
III. Persons and Households Assisted by the Charitable Sector:
A. The majority of the households served are families with one or two working adults andchildren.
B. Over 30% of the families receiving charitable aid are reported as not receivinggovernment assistance. Some of these families are eligible for such assistance and notreceiving it.
C. Middle class families receive charitable welfare services, most likely a result of jobdisplacements, downsizing, and underemployment, combined with the low wagestructure, high birthrate and the record high bankruptcy rate. Middle class petitionersare reported by charitable leaders as a relatively new development.
D. Most of the households receiving charitable welfare assistance are headed byadults between 18-64 years of age, with children at home, and are Caucasian.
E. The situations of those seeking assistance are reportedly more complex anddesperate than has been seen in the recent past. In addition, increasing numbers ofworking families with children are being served by charitable organizations.
F. Charitable leaders report the following concerns for those seeking help: housing,limited resources of their organizations, available assistance inadequate tomeet needs, spiritual needs of families, and welfare policy seen as disadvantagingcharitable organizations.
G. Surveyed religious leaders reported difficulty with discerning who should receiveassistance. They expressed the fear of distributing limited funds to those whomight be scamming the congregation. Leaders of social service nonprofits reported no such concerns.
IV. Capacity Concerns of the Charitable Welfare Sector:
A. Social service nonprofit organizations report increases in requests for servicesin the wake of welfare reform and the imposition of time limits, while religiousleaders report no significant changes in numbers of services requested.
11
B. Nearly all of the charitable organizations surveyed refer petitioners to otherorganizations. Usually (92%) referrals are made because the service requestedis not provided.
C. Two-thirds of the social service nonprofits surveyed can absorb only 10% or less morerequests for services; for 40% of the nonprofits, funding has decreased in the past fewyears.
D. Over 50% of the funding for social service nonprofit organizations is fromgovernment sources.
E. With regard to increases in requests for services beyond their current capacity, thestrategy of most nonprofits would be to seek additional funding and increase staff tocope with the demand; some ration their services.
V. Findings from Charitable Organizations after the Implementation of Time Limits inUtah:
A. After time limits were implemented, services requested of charitable organizations beganto focus on education, clothing, food, and help with domestic violence and abuse. Sixmonths later, charitable leaders reported that medical/dental/prescription services, fostercare, education and housing were the most requested services.
B. Charitable organizations reported increases in funds and services expended in theaftermath of time limits.
C. Charitable leaders reported changes in those requesting assistance: people with morecomplex problems and desperation; increasing numbers of immigrants and workingsingle mothers; increasing numbers of people living together without being married;more seniors; more under 18 requesting rental assistance; more people no longerreceiving TANF; more children affected.
D. Charitable organizations reported operating at close to capacity level.
VI. Major Issues Raised by These Findings:
A. Most of the charitable welfare sector in Utah is comprised of religiousorganizations. This finding raises important issues, especially in light of federalactions designed to provide funding for religious efforts.
1. Religious leaders reported knowing less about welfare policy than dosocial service nonprofit leaders. This may have dire consequences as somepeople, with their life-time limits expiring, likely approach religious organizations forassistance. Since many clergy may not be aware of this provision of welfare reform,they may have a difficult time understanding the petitioners' situation.
12
2. While assistance is typically granted without regard to religious affiliation, religiousleaders responding to the survey experience difficulty discerning those petitionerswith legitimate needs from those trying to take advantage of the congregation.
3. Religious institutions that do not participate in the Charitable Choice provision ofPRWORA, as is the case for most religious congregations in Utah, have every rightto deny requests for assistance on any grounds whatsoever, yet are being relied onby governments to render assistance.
4. Some petitioners may be afraid of an obligation (real or perceived) to attendworship services, or may be afraid to be disloyal to their own religious upbringing byseeking assistance from another religious source.
5. Many mothers on welfare have a history of being sexually abused. They mayhave difficulty approaching religious leaders (predominantly male) for assistance. Inaddition, anyone whose lifestyle does not conform to the espoused values of thereligion, may be at added risk for denial of their request, and thus reluctant to petitionfor assistance.
6. Some single mothers with little transportation, scant knowledge of communityresources, lack of government help, fear of negative judgment, but with a need tohouse and feed their children, may be forced back into abusive situations. Thisraises a painful possibility that as government assistance becomes less accessible,economic circumstances may force mothers to place themselves and their childrenat risk. What is needed is a targeted effort to address the fears of any who might askreligious organizations for help.
B. Over the past decade, government funds for those in need have beenincreasingly dispersed to social service nonprofit organizations. If PresidentBush’s agenda prevails, the dispersion of public funds will extend to religiousinstitutions, as well.
1. While dispersing of welfare funding for services through charitable welfareorganizations has many advantages, the large numbers of referrals reported bycharitable leaders mark an inefficiency that many of those in need can ill afford.Going from place to place for help, when one is limited by income and transportation,and is likely working at a low hourly wage, may place undue burdens on receivingassistance for which one is eligible.
2. The public funds designated to help those in need include taxes paid by the workingpoor. It appears to be an added burden for those individuals to receive services forwhich they are eligible, but which are paid for, in part, by their own labors.
C. Members of the middle class are seeking charitable welfare assistance, along with theirlow-income counterparts. Corporate and organizational restructuring, together withaccompanying underemployment, has had dire economic impact on tens of millions ofmiddle class Americans whose predicament, along with that of the working poor, is notreflected in the unemployment rate or in other major economic indicators.
13
1. While the strength of Utah’s economy, as well as that of most of the rest of thenation, has been lauded, it is clear that the economy is strong for a few people, butnot for all in the middle class, and certainly not for the working poor.
2. The consequences of middle class families competing with low-income families forlimited charitable financial resources need to be examined fully.
D. Thousands of Utahns who are employed are seeking charitable aid, which highlightsissues of inadequate wages, unstable employment, high costs of living, high housingcosts, and other economic difficulties.
E. Religious organizations, like many social service nonprofits, assist those whonever come to the attention of government agencies. Much is to be learned fromcharitable sources regarding poverty, the circumstances of the working poor,and the shrinking middle class. Public policy makers must harvest thisknowledge.
VII. Recommended Changes in the Personal Responsibility and WorkOpportunity Act of 1996 Based on this Research. Many of the concerns ofcharitable leaders with regards to PRWORA can be addressed with the followingchanges to the law. It is expected that the following will be addressed in thecurrent PRWORA reauthorization efforts.1
A. PRWORA should create policies which would assist families into family-sustainingemployment.
B. PRWORA is a welfare-to-work program that must be keyed to the unemploymentrate or to the employment to population ratio. Citizens find themselves time-limitedoff of the welfare rolls when they live in areas of high unemployment.
C. PRWORA must mandate tracking of what happens to those who leave the welfarerolls. In transitioning from an entitlement program to a welfare-to-work program withshort life-time limits, many people left the rolls and their status is unknown. To gainan understanding of the impact of welfare policy changes, the tracking of those wholeave the rolls should be mandated.
D. PRWORA must mandate programmatic and support involvement of all governmentlevels. Those working their way off welfare, or who may be sanctioned offassistance, need the full inclusion of government attention, including their localgovernment, to receive needed help, especially given time limits.
E. PRWORA's method of calculating the 20% extensions needs to be changed.Currently it provides for an increasingly shrinking pool of welfare recipients eligiblefor those extensions. In 1996, 20% of the 12,955 Utahns on the rolls numbered2,591; in 2000 with 8,254 on the rolls, the extensions could number 1,650--adifference in assisting over 900 families. Given the shortness of the time limits andthe lack of consideration for the unemployment rate, it would have been far wiser to
1 For current information regarding the PRWORA reauthorization issues, seewww.welfareinfo.org/roundup.htm.
14
have the 20% calculated on a base of the first year of welfare reform implementation,or the year with the highest case number.
F. PRWORA pays insufficient attention to the needs of children. As a welfare-to-workprogram, TANF focuses on the value of work, rather than on what may be in the bestinterest of children in poor families. This must be remedied. The reported increasedrequests for foster care and abuse/domestic violence services raise the unwelcomedpossibility of more children at risk due to welfare reform.
G. PRWORA uses time limits to unravel a long-standing safety net. Given theincreased administrative complexity of TANF, combined with short life-time limits,those citizens most vulnerable are placed even more at risk. This issue can beaddressed in part by lengthening the life-time limits requirements.
15
INTRODUCTION
I would hire a convicted felon any day, before I would hire someonewho has been on welfare.
--Business owner in northern Virginia
This report presents findings of the University of Utah Center for Public Policy and
Administration’s (CPPA) study of the impact of welfare reform on the charitable sector in Utah.
The term – charitable organizations – refers to all nongovernmental faith-based and nonfaith-
based organizations rendering direct service to those in need. Religious institutions and
congregations, as well as community-based nonprofit organizations, are included.
Commissioned and funded by the Utah Department of Workforce Services, this study is a key
component of CPPA’s Welfare Reform Initiative, established in 1998. This initiative has
produced a number of research reports2 and public policy events.
It is notable that the Welfare Reform Initiative was instigated at the request of a
prominent Utah religious leader who expressed concern with regard to the capacity of charitable
organizations to meet the needs of the poor in the wake of federal welfare reform legislation.
This 1996 welfare-to-work legislation decreased government responsibility while increasing
involvement of religious and nonprofit organizations with service provision to those in need. A
committee of university researchers and community leaders who assembled to conceptualize
and assist our efforts, framed CPPA’s Welfare Reform Initiative. This multi-year project includes
information dissemination, partnership-building, public policy forums, empirical research, and
report production and distribution.
The Welfare Reform Initiative in its entirety has been made possible by broad-based
charitable and government agency funding: The Catholic Diocese of Salt Lake, The Church of
Jesus Christ of Latter-day Saints (LDS) Charities and LDS Humanitarian Service, Holy Cross
Ministries, Intermountain Health Care Foundation, Intermountain Health Care Mission Services,
Salt Lake County Government, Thrasher Research Fund, Utah Association of Counties, Utah
Department of Human Services, Utah Department of Workforce Services, and the Utah Division
of Indian Affairs.
Using qualitative and quantitative methods, this study assesses the capacity of faith-
based and nonfaith-based charitable organizations to meet the needs of TANF-eligible families.
16
Findings from the qualitative phase of the research have been published previously and are
referenced throughout this report.3
As the goal of this study is to present an analysis of the capacity of the charitable sector
in Utah, we were determined to present a description of the capacity of the entire charitable
sector as a whole. Early in our efforts, we found that various organizations in the charitable
sector−religious and nonfaith-based−have significant collaborative relationships that provide
support for their common goals to assist those in need. Unfortunately, the goal of presenting a
single portrayal proved to be unrealistic, as the differences between religious congregations and
social service nonprofits merited separate descriptions and to some extent, separate data
analyses. The determination to present at least the religious welfare sector as a whole was
compromised by the inability to collect LDS congregational survey data. Obviously the LDS
Church welfare sector in Utah could not be ignored; thus a separate discussion and description
is unavoidable. It is important, then, to recognize that the separate descriptions, while
necessary, may convey mis-impressions in that the descriptions do not take into account the
collaborative partnerships and mutual support (including resource sharing) found among
charitable organizations in their work.
2 See Appendix A for complete list of all welfare reform reports. They are available on the CPPA website:www.cppa.utah.edu/wri.3 The qualitative research findings are discussed in full and reported in Laurie N. DiPadova, Utah'sCharitable Organizations Face Welfare Reform: Concerns of Charitable Leaders . Center for Public Policyand Administration, University of Utah. January 2000. This report is available atwww.cppa.utah.edu/wri/charitleaders.pdf.
17
I. WELFARE REFORM IN THE UNITED STATES
Compassion is the work of a nation, not just a government.−President George W. Bush, 29 January 2001
Efforts by government agencies, charitable organizations, and individuals to assist those
in need are a matter of utmost importance in every society. A society is judged by how it treats
its most vulnerable and needy members. For centuries, religious and other charitable
organizations in the United States have taken responsibility for assisting those in need. This
tradition is heightened by current welfare reform issues.4 After the Great Depression of the
1930s, the administration of President Franklin D. Roosevelt established a solid government
responsibility for those in need with the Aid to Dependent Children (ADC) program. This
program, later renamed the Aid to Families of Dependent Children (AFDC) program, defined
assistance to poor families as an entitlement, and the poor underclass as a societal
responsibility.
After it was instituted, AFDC was for decades under political attack for fostering
dependency and providing disincentives to productive citizenship and responsibility, all at a cost
to taxpayers. It was also criticized for failure to foster a responsible work ethic, as recipients
were actually penalized for attaining employment.
Concern also centered on generations being raised fatherless,5 without knowing the
value of work, and being content to “live on the dole”, thus perpetuating welfare in some families
over time. This was seen as especially detrimental to children in welfare families. Additionally,
debates focused on whether government welfare in fact was providing incentives for out of
wedlock births.
While to some extent the poor have always been blamed for their situations,6 the
institution of government welfare heightened these blaming ideological arguments7 as
justifications for the view that being poor is a quasi-criminal condition that merits social
4 As one current example, see Niebuhr, 2000, for a description of various religions' responses.5 For a current expression of this argument, see the 1995 work by Francis Fukuyama, Trust: The SocialVirtues and the Creation of Prosperity. New York: The Free Press.6 The historic distinctions in the early part of the 19th century between paupers (the able-bodied poor) andthe impotent poor (those in circumstances beyond their control) find currency in today's discussions. SeeKatz, 1989.7 Jonathon Kozol's Amazing Grace: The Lives of Children and the Conscience of a Nation (1995)confronts readers with some of the difficulties inherent in blaming poor children for their plight.
18
punishment. Such blaming ideology continues to this day,8 even though children and the elderly
currently comprise the majority of Americans considered poor.
At the same time, AFDC was criticized for not redressing the real issues of poverty in the
United States (Gans, 1995), and for perpetuating the underclass and the growing income
inequalities in the United States (Mishel, Bernstein, and Schmitt, 1999) while corporations and
business firms received ample "welfare" of their own from government sources at taxpayer
expense.9 As families on AFDC were primarily women heads of households with children at
home, and the majority of welfare recipients are children,10 welfare debates also addressed the
socio-economic value of child-rearing in our society. These and other political debates highlight
the myriad issues involved in helping those in need.
The calls for a welfare-to-work program11 finally won. Politicians who used to argue that
child welfare issues demand that mothers should stay home to raise their children and leave the
workplace to men, now concurrently argue that poor mothers need to work; these same child
welfare concerns are not applied to children born in poverty.
On August 22, 1996, President Bill Clinton signed into law the most significant welfare
reform legislation in three generations, the Personal Responsibility and Work Opportunity
Reconciliation Act (PRWORA). This legislation has the potential to impact charitable
organizations more than any Congressional action in recent memory. Congress acknowledged
that the Act left gaps in service provision and made clear its intent that the charitable sector
would be expected to assume a greater role in meeting the needs of the poor.
While the Act itself does not state that poverty reduction is a goal of PRWORA, it
prompted trepidation and dismay from those who feared the dissolution of the "safety net" and
the concomitant uncertainties facing America's poor. At the much-publicized signing of the Act,
8 Americans are evenly divided on the issue of whether the poor are doing enough to help themselves outof poverty, or whether circumstances beyond their control cause people to be poor. See National PublicRadio/ Kaiser Foundation/John F. Kennedy School of Government poll on Poverty in America,2001.www.npr.org/programs/specials/poll/poverty/staticresults.html. May 2001.9 An excellent popular media account of the dynamics of corporate welfare is found in Donald Bartlett andJames Steele, "What Corporate Welfare Costs" in Time, issues throughout November 1998.10 Research is mixed regarding the impact of welfare reform on children. See Duncan and Chase-Lansdale, 2001. A synthesis of five empirical studies is provided by Morris et al, 2001. Mediaannouncements in April 2001 regarding the federal study associating time in day care and children'sproblem behavior, heightened concerns and this debate. See Vedantam, 2001. A Florida study,released in July 2001, found that adolescent children in welfare-to-work households experience lowerachievement and more behavioral problems than do children in other welfare households. See Lewin,2001.11 For complete analysis of actions in various cities to enhance employment opportunities for welfarerecipients, see Roberts and Padden, Welfare to Wages: Strategies to Assist the Private Sector to EmployWelfare Recipients published by the Charles Stewart Mott Foundation. 2 vols. August 1998.www.mott.org/publications/welfv1.pdf.
19
President Clinton acknowledged that it was not perfect. Promising to amend it in the future, he
nonetheless hailed the reform as the "end to welfare as we know it."
PRWORA devolves to the states major responsibility for assistance to families with
dependent children and imposes limitations on the receipt of various types of public assistance.
Time limits and the welfare-to-work provisions increased substantially the complexity of
implementing TANF over administering AFDC. These administrative complexities require
increased resources and training of case managers; otherwise, families in need may be more
vulnerable and at risk due to inevitable managerial implementation challenges.12 Thus the
safety net is unraveled not only by policy, but also by administration of the policy.13
Replacing the entitlement provisions for financial assistance with time-limited, work-
based assistance, coupled with possible but inadvertent administrative mismanagement of a
more complex policy, the new program is expected to compel the poor increasingly to turn to
religious and community social service organizations for help. This increased responsibility
presents new pressures for nonprofit organizations and their leaders (Alexander, 1999) who fear
the dissolution of the "safety net" and the concomitant uncertainties facing America's poor.
The Act was met with wide acclaim from many Americans who were frustrated with the
traditional welfare system. Headlines in the news media have reported the apparent success of
the sweeping 1996 welfare reform legislation, adding to the popularity of the enormous body of
this policy. Nationwide, welfare recipients are leaving the welfare rolls in record numbers,
including in Utah. Indeed, cases of single mothers on welfare, successfully entering the
workforce, are being heralded—and are to be applauded.
Welfare-to-work mandates are continuing in the new presidential administration of 2001.
President George W. Bush openly endorses the expanded role of charitable institutions to
provide welfare services for those in need. He advocates a heightened role for social service
12 One sign of the difficulties in implementing the more complex policy may be found in jurisdictions simplypaying the poor to relocate to other states. See Nieves, 2001. On a local note, Captain Scott Atkinson ofthe Salt Lake City Police Department confirmed that while the department keeps no records tracking theincidence of people being sent to Salt Lake City by other cities for the purpose of getting aid, it is clearfrom his experience that this happens on occasion (interview July 9, 2001).13 For full discussions of research related to the complexity of administrative issues with TANF, seeBryner, 1999; Gais, Nathan, Lurie, and Kaplan, 2000; and Nathan and Gais, 1998. As a personal note, Iwant to be clear that I am not, in any way, disparaging the public administrators who work hard toimplement TANF; I have found them to be conscientious and competent in every respect. In truth,however, criticisms of administrative matters are grounded in organizational systems and in policies thatmake such administration immensely challenging, calling forth the proverbial wisdom of Solomon. As afaculty member in a distinguished Masters of Public Administration program, I can attest to the inherentdifficulties of preparing students for such responsibilities.
20
provision by religious organizations,14 including increased government funding to those
organizations. The President has established a White House Office for Faith-Based and
Community Initiatives, headed by social scientist John DiIulio, Jr., which is directed to support
and oversee religious and community-based efforts to assist those in need.15 Nationally,
religious leaders are seeming to fall on both sides of the efforts of this new office;16 some are
concerned for the autonomy of religious institutions and protecting the religious freedom of
welfare recipients, while other leaders are anxious to secure any funding to assist those in
need.17
If proposed legislation is enacted, religious groups will be able to compete for
government funding, as do nonfaith-based nonprofits, to address social ills. It appears at this
time that religious groups receiving government assistance would be able to maintain the ability
to consider religious affiliation in hiring employees, but would not be able to impose
requirements of religious practices on employees.18
It is important to note that as the news media widely reported welfare reform to be a
success, and politicians capitalized on the heightened role of charitable organizations in social
policy, Utah’s charitable leaders were not convinced. While charitable organizations would like
14 While success stories abound, to date there is little empirical research demonstrating the long-termeffectiveness of religious programs. See Laurie Goldstein, “Church-Based Projects Lack Data on Results”in The New York Times , April 24, 2001.15 President George W. Bush, announcement of the formation of the White House Office of Faith-basedand Community Initiatives, January 29, 2001. www.washingtonpost.com/wp-srv/onpolitics/elections/bushtext012901.htm.16 Many congregations continue to express reluctance to obtain government funding. See LauraMeckler’s Associated Press article, "Religious Groups Still Not Biting 5 years After Welfare Law Passed."March 20, 2001, and Eilperin, 2001. Clerical positions on this matter seem to fall along racial andeconomic lines, with clergy of more impoverished congregations willing to fulfill the requirements forgovernment grants, and clergy of more affluent congregations voicing concern over First Amendmentrights for welfare recipients. See Laurie Goodstein, “A Clerical, and Racial Gap Over Federal Help”, NewYork Times , March 24, 2001.17 The myriad of possible First Amendment issues involved in government's funding of religiouscongregational efforts to provide social services are important to consider, but are beyond the scope ofthis research. For further information on these issues with regard to the new White House office, seeCharles Babington, "Faith-Based Office Sparks Debate", Washington Post, January 29, 2001.http://washingtonpost.com/wp-dyn/articles/A62314-2001Jan29.html; Frank Bruni and Laurie Goodstein,"New Bush Office Seeks Closer Ties to Church Groups." The New York Times . January 29, 2001.www.nytimes.com/2001/01/29/politics/29FAIT.html?pagewated=all.18 Concerns that public funds would support religious discrimination in hiring are raised by AmericansUnited for Separation of Church and State. At this time, the faith-based initiative legislation is still beingdebated in the Congress and has support from the U.S. Conference of Mayors. See Allen and Kovaleski,2001 and the Associated Press report in The New York Times , June 25, 2001 available atwww.nytimes.com/aponline/national/AP-Bush.html. Adding fuel to the controversy, on July 10, 2001, theWashington Post reported that the Salvation Army has agreed to lobby for passage of the faith-basedinitiative, in exchange from assurances from the White House that the Salvation Army would be protectedfrom federal nondiscrimination hiring requirements. See Milbank, 2001.
21
nothing more than to help all in need, many leaders voiced alarm at what their institutions are
currently experiencing, even during exceptionally strong economic times for the state. Even
those leaders who agreed with the welfare-to-work emphasis, expressed deep concern about
the ability of the charitable sector to take up where government is backing off (DiPadova,
2000).19 Their concerns were echoed by officials of county governments in Utah (Weathers and
Walsh, 2000).20
The majority of Utah's religious leaders report disinterest in seeking government
assistance21 to support their efforts to help those in need (DiPadova, 2000). At the same time,
the survey research reported herein supports the view that public policy makers would be well
advised to gather information on the experiences of leaders of religious organizations, as well
as social service nonprofit leaders. These people lead organizations that directly address
poverty issues. Charitable organizations serve individuals and families before they request
government assistance, while they are receiving government assistance, and after they leave
government assistance. These organizations also meet the needs of the vast array of those
who do not qualify for such assistance or will not ask for it. Thus, charitable organizations have
unique perspectives that could be used to enhance the efforts of government to frame workable
policies to address social needs.22
19 A June 5, 2001 report released by the Barna Research Group's annual survey of giving to nonprofitorganizations finds that giving to nonprofit organizations and churches declined by 6% from 1999 and 9%from 1998. See www.barna.org.20 See CPPA report by Shirley Weathers, Ph.D. and William P. Walsh, Jr., Walsh & Weathers Researchand Policy Studies, Welfare Reform: Unintended Consequences for Utah Counties, February 2000.Funded by Salt Lake County Government. Available at www.cppa.utah.edu/wri/county_report.pdf.21 Many churches in Utah, including the LDS Church, traditionally neither seek nor accept governmentfunds.22 For a superb analysis of appropriate effective roles for government welfare and charitable welfare inhelping families in need, see Mangum, 2000.

22
23
II. ECONOMIC CONTEXT AND PROVISIONS OF WELFARE REFORM
This past year, the congregation has had several families frommiddle income brackets request help.
−Congregational Leader
Like welfare caseloads across the nation, the welfare caseload in Utah has dropped
dramatically since the implementation of welfare reform programs. Utah has seen a drop from
almost 12,955 cases at the end of 199623 to a caseload of 8,254 as of the end of 2000.24
Economic Context: In order to consider properly the provisions of welfare reform, and
its implementation in Utah, it is necessary briefly to discuss relevant national and Utah data
which provide an employment and economic context for those entering the workforce. Utah’s
economy has been regarded as vigorous over the past ten years. While for most of 2000,
Utah's overall unemployment rate averaged 3.1%, in 2001 it has climbed. January saw a jump
to 3.5% and in April, the rate was reported as 3.9%.25 In 1998-1999, the state's poverty rate
averaged 7.3%, the second lowest in the United States.26 Other estimates indicate that nearly
180,000 individuals of the state's 2.1 million population are living in poverty, including some
90,000 children.27
Utah’s per capita income in 1999 was $23,288, or 18.4% below the national average of
$28,542.28 The wage rates in Utah have been steady at approximately 16% below the national
average, while housing costs along the Wasatch Front, where the vast majority of the state's
population resides, are well above the national average.29
23 According to DWS reports, Utah's welfare averaged over 18,000 throughout 1993.24 While good economic times and the availability of jobs are often credited for people leaving the welfarerolls, research nationally suggests that state welfare policies of sanctioning people off of the rolls accountfor most of the decrease. See Walters, 1999. In contrast, DWS reports indicate that over the past yearapproximately 30-40% of the cases closed each month have been due to the fact that earned income istoo high; 6-9% of the cases are closed due to non-participation in an employment plan; andapproximately 5-7% of the cases are closed each month due to time limits and loss of extension eligibility.25 See Utah Department of Workforce Services Labor Market Reports, Vol. 11, issues for February,March, April, and May 2001.26 Federal Census Bureau report. See Titze, 2000.27 According to Utah Children, Measures of Child Well-Being in Utah, 2001, in 1997 children in the statewere living at or below the poverty level numbered 89,867, representing an increase from 73,381children in 1995.28 Utah’s median household income is 45,257, 114% above the national average. Due to Utah’s largefamily size (3.06 as compared with the national average of 2.61), the per capita income figure isconsidered to be a more realistic indicator of economic well-bring. See Verma, Mangum, and Cookson,2001.29 See National Low Income Housing Coalition's Out of Reach report, September 2000, finding that 42%of Utah's tenants are unable to afford rent for a two-bedroom apartment in Utah. Seewww.nlihc.org/pubs/index.htm. Nationally, HUD Secretary Andrew Cuomo issued a report finding that in
24
In spite of Utah’s generally lauded strong economy, citizens in record numbers sought
bankruptcy during the first three months of 2001, most of them seeking relief due to personal
financial crises (Oberbeck, 2001b). This record is part of a troubling trend: “Utah’s economy
grew steadily over the past decade and logic suggests the number of bankruptcies should drop
when the economy is sound. Yet with the exception of 1993, 1994, and 1995, bankruptcies in
Utah increased steadily” (Oberbeck, 2001a).30
Nationally, in spite of a record-breaking booming economy over the decade of the
1990s, Americans are poorer; their net worth has fallen for the first time since 1945.31 Troubling
personal economic trends center on three variables: the personal savings rate, consumer debt,
and bankruptcies. The personal savings rate is at the lowest in over 50 years.32 Consumer
debt and bankruptcies have been at their highest in the 1990s. Over 1.3 million Americans filed
for bankruptcy in 1999 alone and consumer credit is a major growth industry in the United
States (Manning, 2000).
Spawning the acceleration of these trends over the past two decades has been, no
doubt, the restructuring of corporations and other organizations, ushering in the New Economy
while severing literally tens of millions of middle-class Americans from their jobs and benefits.33
In addition to these downsized employees, millions of others have become underemployed due
to job displacements, or accepted lower wages in their current reconfigured positions.34
American workers affected by these dynamics are not reflected in the unemployment rate, or in
the employment-to-population ratio. Their plight remains hidden from any major economic
indicators.
1999, 5.4 million low income families were paying more than half of their income for housing, a rise of 12percent since 1991. See Molotsky 2000.30 In 2000, Utah ranked second among the 50 states in bankruptcy filings; Tennessee ranked first.Coinciding with the increase in bankruptcies is the oft-relayed phrase in the media that many Americansare but two paychecks away from losing their homes.31 Americans' net worth fell an additional 4% in the first quarter of 2001. In addition, for the first time since1996, growth in personal income has dropped below the 2% mark. See Leonhardt, 2001.32 For a complete review of the U.S. personal savings rate, see U. S. Department of Commerce, Bureauof Economic Analysis, National Income of Product Accounts of the United States, 1928-2001. SeeTables 2.1 and 2.9 titled: Personal Income and Its Disposition available at www.bea.doc.gov/. See alsothe American Savings Education Council reports at www.asec.org.33 Downs (1995) and Stein (1998) present evidence that many corporations that have engaged indownsizing are not fiscally better off.34 See Kletzer (2000), along with two excellent internet sources for current information: The FederalReserve Bank of San Francisco weekly online newsletter at www.frbsf.org/econrsrch/wklyltr and TheIndustry Standard Layoff Tracker at www.thestandard.com/trackers/layoff/ . Some companies recognizethe economic impact of layoffs on communities and have fared better by avoiding layoff actions. SeeAnsberg, 2001, “…even many of those whose business has softened are holding on to their workers, bothout of loyalty to their communities and employees and out of fear that they will be left without muchneeded talent when the economy strengthens” (page A-1).
25
The middle class is shrinking. In part as a result, a reported 43 million Americans have
no health insurance; for some, this situation marks financial catastrophe waiting to happen.35
Corporate restructuring, coupled with aggressive credit card marketing by financial institutions,
and federal tax policies since 1977, have fostered the growth of the income gap (Shapiro and
Greenstein, 1999).36
A by-product of corporate mergers and acquisitions is layoffs for senior and middle
managers, as well as other staff, as these positions are eliminated from the new organizational
structures. As indicated above, organizational restructuring, downsizing, and so forth have
prevailed in corporate America for decades. In Utah, for example, in technology-related
companies alone from January 1994 through January 2001, 264 such mergers and acquisitions
were initiated (nine of which have since been withdrawn).37 Affected managers and other
employees must find employment elsewhere. Many become underemployed at lower wages.
While it is beyond the scope of this report to explore fully these trends, the following is
clear: the middle-class has been in increasing economic trouble (Sullivan, Warren, and
Westbrook, 2000; Wolman and Colamosca, 1997). "Family income has fallen in the 1990s, a
period when jobs have become less secure and less likely to offer health and pension
benefits...the net worth of the middle-class family has also fallen" (Wolman and Colamosca,
1997: 5). It is not surprising that researchers concur that bankruptcy afflicts the middle-class
consumer. Personal bankruptcies are now carrying less social stigma, prompting in part
Congress to pass the bankruptcy reform bill, designed to make bankruptcies more problematic
for consumers to obtain.38
Middle-class families fall into the lower class through unemployment, health
emergencies, and divorce. During hard times, these families use their available credit-card
limits for living expenses: food, rent, mortgage, medical bills, as well as for debt payments
(Sullivan, Warren, and Westbrook, 2000). Credit card debt, combined with refinanced home
35 Among the proposals by Kletzer and Litan, 2001, is that wage insurance be provided for displacedworkers, along with subsidies for health insurance.36 The role of education is frequently discussed in the dynamics of the income gap. See Gramlich andLong, 1996, and Spiers, 1996. Additionally, attention is given to changing marriage patterns and the roleof women in the workforce. See National Public radio broadcast, February 28, 1996, atwww.npr.org/issues/gap3.html. See also Isaac Shapiro and Robert Greenstein, The Widening IncomeGulf. Washington, D.C.: Center on Budget and Policy Priorities. 1999. Report available at www.cbpp.org.37 This according to a Harvard Business School report, funded by the Utah Department of Community andEconomic Development, Division of Technology. See Graham, Hawkins, and Reading, 2001.38 For an overview of the implications of the new legislation on debt-ridden Americans, see analysis byConsumer's Union: "Pushed off the Financial Cliff" in Consumer Reports, July 2001. Pp. 20-25.
26
mortgages,39 may be the "welfare" option of first resort for the middle class. When making debt
payments becomes untenable, families reluctantly turn to charity for help. It is little wonder that
charitable leaders in Utah report seeing more middle-class families requesting assistance
(DiPadova, 2000), raising the specter of "Middle-Class Welfare" in this nation.40 Those among
the middle class are more likely to seek help from the charitable sector, rather than from
government, as they do not qualify for welfare assistance.41
As can be seen, economic hard times are not the exclusive arena of the lower class;
increasing numbers of middle class Americans are similarly afflicted. However, welfare reform
issues are directed primarily at the lower class, and it is to this group of citizens that welfare
reform is aimed.
Provisions of Welfare Reform: Within the national economic and labor context
described, welfare reform legislation was passed. Briefly, there are five key differences
between the old welfare system (AFDC) and the new welfare system under PRWORA. First, the
federal financial commitment to welfare programs has been reduced and block-granted to the
states. While primary responsibility is devolved to the states, the federal government maintains
some regulatory involvement. Second, welfare assistance is no longer an entitlement to the
poor, as it was under AFDC. Now AFDC is replaced by Temporary Assistance to Needy
Families (TANF), as welfare programs have become work-based; thus TANF is not an
entitlement program.
The third key difference between AFDC and TANF is that now families in need have a
60-month federal lifetime limit on the receipt of financial assistance, with the states empowered
to choose lower limits. The 60-month limit was adopted by 28 states; the 22 other states have a
range of 12-48 month limits.42 Utah has adopted a 36-month limit, which began to close cases
on December 31, 1999. At that time, cases closed due to time-limits numbered 143 families,
39 In the 1980's Americans held mortgages, on the average, on approximately 35% of the value of theirhomes; currently that figure has risen to 45%, without the concomitant reduction in consumer debt. SeeLeonhardt, 2001.40 This is not to be confused with Glassman's (2000) arguments regarding the growing welfare state forthe rich in high-tech industrial capitalist societies.41 The implications of the middle-class competing with lower class for limited charitable assistance havenot been fully explored. In contrast with government assistance, charitable assistance may provide moreconfidentiality and perhaps less embarrassment for many middle-class petitioners. Clearly those from themiddle class seeking assistance do so with more resources and less stigma than do those from the lowerclasses. Further, middle class families are more stable geographically and perhaps more likely to a"church home" than perhaps many lower class families, especially those who are homeless.42 Note that New York State is the only state whose Constitution mandates care for the poor; thus afterNew York’s federal assistance expires, the State is bound constitutionally to care for those in need. Inaddition, the state of Michigan has opted to assume responsibility for the poor after the federal limitsexpire.
27
including 412 children. Thereafter, on a monthly basis, cases are closed due to time limits,
resulting in an additional 247 families having their cases closed due to time limits by September
31, 2000.
The law permits 20% of the caseload to be exempted from the life-time limits due to
hardship, e.g., where specified medical conditions or domestic violence exist, where the parent
is under age 19, or where other special conditions are demonstrated. In Utah, families may be
extended on a month-to-month basis. However, it is not known whether 20% will be sufficient
over time, especially as the total caseload comes to be increasingly dominated by families
experiencing more difficult situations.43
Fourth, for the first time in the history of our nation’s welfare programs, the economy is a
major factor in welfare assistance. The presumption is that many will leave welfare for secure
family-sustaining jobs.44 Reflecting this welfare-to-work45 emphasis, Utah’s state agency
responsible for administering TANF funds and other assistance programs for the poor is the
Department of Workforce Services (DWS). The DWS mission is two-fold: to assist workers in
finding jobs, and to administer the Family Employment Program (FEP), Utah’s TANF program.
At the time TANF was implemented, Utah’s economy had been showing exceptional strength
and growth; such growth was expected to continue until 2002, the year of the winter Olympic
games, and also the end of the four-year Interstate 15 highway reconstruction (currently the
most significant highway project in the nation).46 Indeed, as noted above, Utah welfare
recipients are now leaving welfare for work in record numbers and the number of cases on the
welfare rolls has dramatically decreased. Unfortunately, available evidence indicates that in
43 An important exception to time limits is provided for Native American reservations. If theunemployment rate is over 50%, then the time-limit provision of PRWORA does not apply. In Utah, boththe Navajo nation and the Utes have unemployment rates in excess of 50%. However, the Utereservation is a “checkerboard” reservation, rather than being an uninterrupted stretch of land, as is thecase with the Navajo. In the case of checkerboard reservations, federal law requires that theunemployment rate for “Indian country”—that is, including non-Indians in surrounding counties—be over50%. Thus, even though Ute records show their unemployment rate to be 77%, they remain subject tothe time limit provisions because unemployment for non-Indians in the area is less than 10%. Hence, asof this writing, negotiations are taking place between Ute leaders and Utah state officials. See Romboy,2000.44 The welfare-to-work focus raises other key issues: 1) barriers to employment of welfare recipients. SeeDanziger, et al.'s 1999 report: "Barriers to the Employment of Welfare Recipients", Institute for Researchon Poverty, University of Wisconsin, available at www.ssc.wisc.edu/irp/. Discussion paper no. 1193-99,and 2) the ability of the labor market to absorb three million welfare recipients. Burtless (1998:1)estimates that "as many as 3.3 million adults on the rolls [in 1994] would have been affected by the toughwork rules in the 1996 legislation if those rules had been fully in effect in 1994."45 AFDC supported studies in pursuit of a college degree. TANF does not and instead supports direct jobtraining and skill development. Many researchers point to the attainment of higher education as key toindividuals' addressing the growing income gap. See Gramlich and Long (1996).46 However, as indicated above, as of this writing, Utah's economy is showing signs of a slowdown.
28
Utah, as in the rest of the nation,47 the vast majority of those who leave welfare rolls for
employment are joining the ranks of the working poor48 (Coon, Geo-Jaja, and Mangum, 2000).
Finally, and significantly for this research, there is clear expectation in the
law−expressed by Congress−that charitable organizations would fill in the gaps of social service
provision. The Charitable Choice section of PRWORA allows religious institutions to apply for
government grants to provide welfare assistance; however, like their counterparts nationwide,
most religious leaders in Utah were unaware of this clause and those who were made aware of
it, shunned its use (DiPadova, 2000; Moore and Williams, 1999). While the Charitable Choice
provision may constitute a “model of change” for cooperation between church and state (Sider
and Unruh, 1999: 49), some legal scholars question its constitutionality (see Weaver, 1997).
Also some have expressed concern that this relationship may in fact advance a great long-term
detriment to the poor. Governments by law cannot discriminate on the basis of race, religion,
and so forth, but these same anti-discrimination laws do not apply to charitable organizations
(Van Biema, 1995). If charitable responsibility for the poor is accelerated as government
responsibility lessens, the inevitable “gap” in services to the underclass that afflict even the best
of programs may widen considerably, negatively impinging on more families and children. How
these issues are addressed by the newly formed White House Office for Faith-Based and
Community Initiatives remains to be seen.
Currently, what these new welfare changes mean is that as the role of governments to
assist those in need decreases, the pressure on charitable organizations to fill this role
increases. It is important to note that this is not the case due to an edict, shall we say, of
government policy makers; this is the case precisely because of the long-honored role of
religious and social service nonprofit efforts in our society. In modern society, both in the United
States and abroad, charitable organizations have maintained a tradition of rendering direct
assistance to those in need for hundreds of years. Many of these organizations do so with great
effort and sacrifice by staff and volunteers. For the most part they are not resource-rich
institutions; they rely on the good graces of contributors and funders. Many of these
47 A number of state reports are available which confirm the results in Utah studies. For example, see theCenter for the Study of Women in Society at the University of Oregon report titled Oregon Families WhoLeft TANF or Food Stamps: A Study of Economic and Family Well-Being 1998-2000, available athttp://csws.uoregon.edu. See also Wisconsin Legislative Audit Bureau, An Evaluation of the WisconsinWorks (W-2) Program: Department of Workforce Development, April 2001. Available atwww.legis.state.wi.us/lab/Reports/01-7full.pdf.48 A snapshot of the working poor in Utah can be found in the northwest quadrant of the Salt Lake Valley.Here families speak 20 different languages. Two-thirds of the individuals are employed, 28% of themmaking less than $15,000 a year. 18% of households (26% of households with children) report difficultyin obtaining enough food for their families. See Office of Public Health Assessment, 2000.

29
organizations struggled to meet unmet needs during the past half-century of the federal welfare
entitlement program. Now they face a major policy effect, and many local leaders are caught
unawares.
As this study examines the impact of welfare reform on charitable institutions in Utah, we
now turn to a description of those institutions.

30
31
III. TYPES OF CHARITABLE INSTITUTIONS STUDIED
Church members should be taking care of each other’s needs,rather than the government doing it.
--Congregational Leader
By charitable organizations we refer to all nongovernmental organizations (faith-based
and nonfaith-based) rendering direct service to those in need. Included are religious institutions
and congregations as well as community-based nonprofit organizations. The charitable sector
represents a widely diverse group of organizations that differ along a myriad of variables,
including approaches, interests, resources, and primary missions.
In this research we examine the capacity of three types of charitable organizations, as
follows. The first category consists of social service non-profit organizations, such as the
Traveler's Aid Society. This category includes those affiliated with religious organizations but
whose primary role is the delivery of social services, such as Catholic Community Services.
Leaders of these organizations tend to be very aware of public policy changes that affect them;
they often have a paid staff and volunteers who follow legislative activities and engage in
advocacy efforts, as well as provide needed services. Their funding is from a variety of sources;
they tend to keep accurate records of types of services provided and to whom. For these
organizations, social service delivery is their fundamental defining priority.
The second category consists of religious congregations headed by professional clergy.
For these organizations, religious purposes are their major endeavor; clergy are full-time and
have recognized education and credentials. Welfare and social policy are not their prime
function. While large denominations may have welfare policy experts and advocates working at
the multi-congregational level, such as a diocese, for the most part, congregational clergy have
limited knowledge in the area of welfare policy.
Congregational leaders want to help others and wish for their congregational members
to help, as well. Some clergy feel that their congregations have a responsibility to take care of
the poor. These clergy tend to favor minimal government involvement. Other clergy take the
position that more referrals to government programs and nonprofit organizations are needed.
For the most part, they keep few records regarding assistance rendered. In fact, some leaders
point out that congregations give significant help, emerging spontaneously from members, and
that in these instances, the clergy actually would know little about what is happening. Yet they
worry that their capacity will not meet all the need. These clergy work to attract funds for their
operations and other purposes.
32
Some leaders of smaller congregations, usually not affiliated with a strong centralized
denomination, applaud the work-based aspects of welfare reform. They feel that religious
congregations are responsible for aiding the poor and that the government should not be
involved. Many religious leaders share the basic philosophy that, although they appreciate the
help government gives to those in need, “we have a responsibility to take this on.”49
The third category consists of congregations (or wards) of The Church of Jesus Christ of
Latter-day Saints (LDS). Like the second category, religious purposes are their major endeavor.
However, unlike the second category, these congregations are headed by part-time lay-leaders,
or bishops, whose primary responsibilities are their own families and career endeavors. Bishops
hold full-time jobs elsewhere.
LDS bishops are welfare agents, and are assisted by the ward Relief Society50
Presidents. They are part of a church-wide welfare program the policies of which are
administered by the Church Welfare Services Department. Bishops are considered
responsible for the temporal well-being of all individuals and families living in the ward, or
geographic boundaries, regardless of religious affiliation. Welfare policy advises bishops to seek
out those in need, give those receiving assistance the opportunity to work,51 and keep needs
and assistance in strictest confidence.52
Like their counterparts in the second category, some LDS bishops feel that they should
take care of the poor and favor minimal government involvement; other bishops, however, take
the position that more referrals to government programs and nonprofit organizations are
needed. Like other religious congregational leaders, bishops point out that considerable help is
offered among members of the congregation, both informally and through the visiting teaching
program of the Relief Society and the home teaching program of the priesthood quorums.
Thus, bishops do not track much of the assistance being rendered.
Unlike other religious leaders, LDS bishops do not concern themselves with fundraising
and with resource limitations when it comes to serving those in need. The LDS Church, a
centralized religious institution, collects offerings from congregational members to distribute
worldwide, through the bishops, according to need. Local bishops also rely on a strong network
49 See views of charitable leaders in DiPadova, 2000.50 The Relief Society is the women's organization of the LDS Church and has a long-standing welfareservice role.51 According to bishops' regional welfare training materials from a local LDS stake: "Assistance should begiven according to need, and work should be assigned according to ability...When recipients areencouraged to work energetically and willingly for the help they receive, they can hold their heads high.Only then can they really feel good about the temporary help they receive."52 See LDS Church welfare handbook titled Providing in the Lord's Way: A Leader's Guide to Welfare.1990.
33
of LDS Church welfare resources, such as Bishops' Storehouses, canneries, Deseret Industries,
and so forth. The resource of concern to LDS bishops is their time required to assess and
respond to the needs of families and individuals requesting assistance.
Three distinct types of charitable organizations have been described, each with their
own unique responses to welfare reform. All of these leaders enjoy various levels of discretion
regarding whom they will render service to, with religious leaders having the maximum
discretion as their services are not tied to government funding. It is clear that as these leaders
are feeling the impact of policy change, their concerns are mounting. We now turn to the
research itself, beginning with the methodology used for this study.

34
35
III. METHODOLOGY
The purpose of this study is to ascertain the capacity of charitable institutions in Utah to
meet the needs of TANF-eligible families and others in need. Data were collected in three
phases. The first phase involved the collection of qualitative data and instrument refinement
through interviews and focus groups. The focus groups with leaders of charitable organizations
were conducted in each of the five DWS regions of the state: in Brigham City, Heber, Parowan,
Price, and Salt Lake City.53 In addition, eight clergy were interviewed, including six LDS
bishops. The second phase used a survey instrument to collect organizational capacity data
prior to the implementation of financial assistance time limits. Phase three used two follow-up
surveys to trace changes in impact three and six months after the implementation of time limits
in Utah. Findings from the first phase, the qualitative research, have been reported previously
and are referenced throughout this report (DiPadova, 2000). This report concerns itself primarily
with the results of the quantitative data collection.
In this research, every effort has been made to present the capacity to assist those in
need of Utah’s charitable sector as a whole. Researchers did not wish to single out any
charitable organization, or group of charitable organizations, for special attention. Instead we
made every effort to reflect accurately the information detailed by charitable leaders and to
avoid comparisons of charitable organizations with each other; hence, appropriate descriptive
statistics were used to analyze the data. However, as the research progressed, it became clear
that, among the types of organizations within the charitable sector, described previously, there
are considerable differences, and that those differences in turn inhibit collection of the same
data and reporting of those data across all organizations. Hence, the findings are reported from
all of the surveys, or only from the social service nonprofit surveys, or comparisons made
between religious organizations and social service nonprofit organizations, as appropriate and
helpful to our understanding.
PHASE 1 – INTERVIEWS AND FOCUS GROUPS
Six focus groups of leaders of charitable organizations were conducted. Every effort
was made to have a diversity of charitable organizations represented. One group was held in
each of the five DWS regions with a second focus group held in the Central Region. Altogether
53 Due to the magnitude of charitable organizations in Salt Lake and Tooele counties (the DWS CentralRegion), two focus groups were conducted in Salt Lake City.
36
62 individuals were invited and 46 people attended. Each session was well attended with the
exception of one region; in that case, those who did not attend were interviewed by telephone.
Participants were invited to the focus groups by telephone and a follow up confirmation
letter was sent, along with a version of the Urban Institute survey instrument,54 which had been
used for congregational and nonprofit research in the Washington, D.C. area. The survey was
modified slightly and presented to participants in draft form. Participants were invited to bring
suggestions for modifications to the meeting.55
Each meeting followed a standard agenda and procedure. After the project team
members and participants introduced themselves, the purpose of the meeting was outlined.
Confidentiality governing both the discussions and any written input was stressed, as was the
voluntary nature of their participation. The purpose of the Welfare Reform Initiative was
described and reactions regarding the project and/or welfare reform were invited. Charitable
leaders informed the researchers of pertinent information relating to their organizations, serving
the poor, and welfare issues.
Next, input on the draft survey was solicited. Researchers asked participants to provide
any lists of organizations that should be included in the sample database.
Any questions raised regarding the details of welfare reform policy were answered when
possible. Also, each participant was provided with a copy of a summary handout based on the
Foundation Report: The Charitable Sector and Welfare Reform in Utah, April 1999, by Shirley
Weathers, which was produced by the Center for Public Policy and Administration.56 As a result
of the structure of the focus groups, the sessions were both informative for the participants as
well as for the researchers.
Regarding the survey, some faith-based organizational leaders reported that
congregations often do not collect the information requested. A religious congregation’s main
purpose is to attend to the spiritual needs of its members. As a result, the demographics of the
people served, and extent of services provided, are not routinely recorded. This is in contrast to
the practices of most nonprofit organizations. In general, nonprofit organizations reported that
the survey was reasonable, although specific suggestions for improvement were made.
54 The Urban Institute survey regarding service and capacity of religious congregations in the metropolitanWashington D.C. area. See Urban Institute, 1998 and Printz, 1999.55 Researchers used the focus groups to refine the survey instrument for quantitative data collection.Specifically, participants were asked to suggest any changes to the survey, including unclear or confusingwording, whether any questions should be omitted, and whether any questions needed to be added.56 This report is found at www.cppa.utah.edu/wri/found_report.pdf. Copies of this report were provided tofocus group participants.
37
The charitable leaders in the focus groups and interviews volunteered critical information
regarding the impact of welfare policy on the poor and on their organizations. Again, these
results are detailed in the January 2000 CPPA report titled: Utah's Charitable Organizations
Face Welfare Reform: Concerns of Charitable Leaders.57
PHASE 2 − INITIAL CAPACITY SURVEY
Responses to the survey during the focus groups made it clear that all charitable leaders
did not relate to the one instrument; thus separate instruments were developed for the
quantitative data gathering for three distinct categories of charitable institutions, described at
length above. To recall, the first category consists of social service nonprofit organizations,
such as Traveler’s Aid Society. This category also includes those affiliated with religious
organizations but whose primary role is the delivery of social services, such as Catholic
Community Services. These were coded as nonprofits because structurally they are more
similar to a nonprofit organization than to religious congregations. The second category consists
of religious congregations headed by professional clergy. The third category consists of
congregations (or wards) of The Church of Jesus Christ of Latter-day Saints (LDS). The three
instruments permitted tailoring of items and language to the various organizations being studied;
however, researchers maintained important overlap among the three versions, allowing for
consistency in data collection.
The surveys contain questions regarding types of social services provided; service
capacity: waiting lists and so forth; collaborations with other organizations; funding for programs
and services; characteristics of clientele; increases or decreases in demand experienced; and
strategies planned if demands outstrip capacity.
Originally, it was intended that each of the surveys would be sent to a statewide sample
of 1,000 religious leaders, nonprofit officials and LDS bishops. Researchers planned to conduct
a random sample of the total 4,518 charitable organizations in Utah, including the 3,74958 LDS
congregations. Any survey to local LDS bishops, however, must be approved by the Church's
research department. Our request was denied due to concerns that bishops receiving the
survey would be hesitant to answer questions for an outside research group regarding matters
of a confidential nature. Also considered was the fact that bishops are called for approximately
five years; at any given time, 40% of the LDS bishops sample may be in office for less than two
57 Published by the Center for Public Policy and Administration, University of Utah. January 2000. Thisreport is found at www.cppa.utah.edu/wri/charitleaders.pdf.
38
years. As a result, many bishops would not be able to respond with accuracy to the questions.
Publicly available administrative and program data from the LDS Church were then gathered.
The findings reported in this study regarding the LDS welfare sector reflect these and other
data.
Based on the original research design, a random sample of nonprofits and religious
organizations was generated from the database of organizations, which is described in more
detail below. After the LDS Church decided not to participate in the survey, two options were
considered. The first was to send surveys to all organizations in the database and the second
was to cut the sample size from the original 1000. It was determined in consultation with DWS
to expand the sample to include the entire population in the database.59 Thus, researchers
surveyed all charitable organizations in the state, with the exception of LDS congregations.
The following sections describe the development of the database, the survey
distribution, and the response rate.
Database Development
A database of both faith-based and nonfaith-based charitable organizations was created.
The goal was to include only Utah organizations that provided services to families or individuals
that are eligible for or who receive TANF/FEP or who may become eligible for that type of
government financial assistance. Nonprofit organizations that are focused on specific diseases
were excluded, as were organizations that provide services exclusively to people with
disabilities. Some organizations may have been included in error because researchers decided
to risk erring on the side of being overly inclusive rather than risk excluding an appropriate
organization. Also, Associations of Governments60 were included since they often provide
services that are similar to services provided by nonprofit organizations.
Sources of names of organizations that were used to build the database include in part:
§ Utah Nonprofits Directory;
§ Department of Workforce Services web page list of service providers;
§ Community Resources Directory;
§ Utah Food Bank;
58 At the time of the design of this study, there were 3,749 LDS congregations; as of March 1, 2001, thereare 3,903 such congregations (see page 44).59 Although a random sample was generated, it was not used. The process used for generating it will notbe summarized here but is available upon request.60 Associations of Governments (AOGS) are multi-county planning districts of two or more counties inUtah. The purpose of the AOGs is to facilitate regional and statewide planning and integration, reduce
39
§ Coalition of Religious Communities;
§ lists from Utah religious organizations including the Catholic Diocese, Presbyterian Church
USA, and Episcopal Church of Utah;
§ the Internet;
§ the Yellow Pages;
§ attendees from previous Welfare Reform Initiative events; and
§ lists of organizations provided by focus group participants.
Organizations were coded either as religious or nonprofit organizations. The database
contained 771 organizations: 454 religious organizations and 317 nonprofit organizations.
Survey Distribution and Response Rate
A cover letter, survey, and prepaid response envelope were mailed in two separate
batches in November 1999.61 To allow tracking of responses from individual organizations, the
prepaid response envelopes were numbered. When a response was received, the number was
used to determine who submitted it and this was registered in the sample database. Whether
the respondent desired to receive a copy of the survey results (as offered in the last question)
was noted and the name and address voluntarily provided were used to update the sample
database. Then the survey itself was assigned a sequential number based on the order in
which it was received. The envelope was then separated from the survey so that no one else
could identify who had submitted the survey. The last question on the surveys invited
respondents to provide their name and address so that they could be informed of the study’s
results; those who complied were identifiable to researchers.
To increase the response rate, a second copy of the survey was mailed to all non-
respondents approximately one month after the initial survey was sent. The tracking of returned
surveys discussed above allowed the follow-up surveys to non-respondents to be performed
easily.
Of the 768 surveys mailed to eligible organizations, the overall response rate was 28.9%
(222 surveys). Of the total returned, 132 were from religious organizations (59.45%) and 90
were from nonprofit organizations (40.54%). Of the ones from nonprofit organizations, 16 were
religious affiliates.
duplication of local government efforts, and provide and operate services or facilities that are moreefficiently provided on a district-wide basis. Seven AOGs exist in Utah.61 See Appendix B for the cover letters and surveys.
40
Table 1: Initial Survey Response Rate
OrganizationType
# SurveysMailed
# SurveysReturned w/Usable Data
ResponseRate
% of TotalSurveysReturned
Religious 454 132 29.1% 59.5%Nonprofit 314 90 28.7% 40.5%Total 768 222 28.9% 100%
After the surveys were returned, three nonprofit organizations that submitted surveys were
excluded because it was determined that these organizations did not meet the criteria
established for inclusion in the database and the analysis.
Responses to open-ended questions were typed into Microsoft Word. The rest of the
responses were input into an SPSS database. All input was double-checked for accuracy.
PHASE 3 − POST-IMPLEMENTATION SURVEYS
The third phase of the study collected data after the imposition of time limits. Items in
follow-up surveys62 were designed to measure over time any impact of the imposition of time
limits on charitable organizations. All organizations that responded to the first survey were sent
post-implementation follow-up surveys.
Two follow-up surveys were conducted, each of which looked at different time-frames.
The first survey asked respondents to compare January-March of 2000 with January-March of
1999 and with October-December of 1999. The second follow-up survey asked respondents to
compare January-June of 2000 with January-June of 1999 and July-December of 1999.
Like the initial survey, the follow-up surveys contained questions regarding types of
social services provided, service capacity, waiting lists, collaborations with other organizations,
funding for programs and services, characteristics of clientele, increases or decreases in
demand experienced, and strategies planned if demands outstrip capacity.
Only organizations that responded to the initial survey were asked to complete the post-
implementation surveys. Of the 222 organizations that responded to the first survey, 213 were
traceable. These 213 organizations were sent the two post-implementation surveys. The same
method that was used to track respondents on the initial survey was used for the post-
implementation surveys. Also, survey responses were entered using the same method used
previously.
62 See Appendix C for the follow-up surveys.
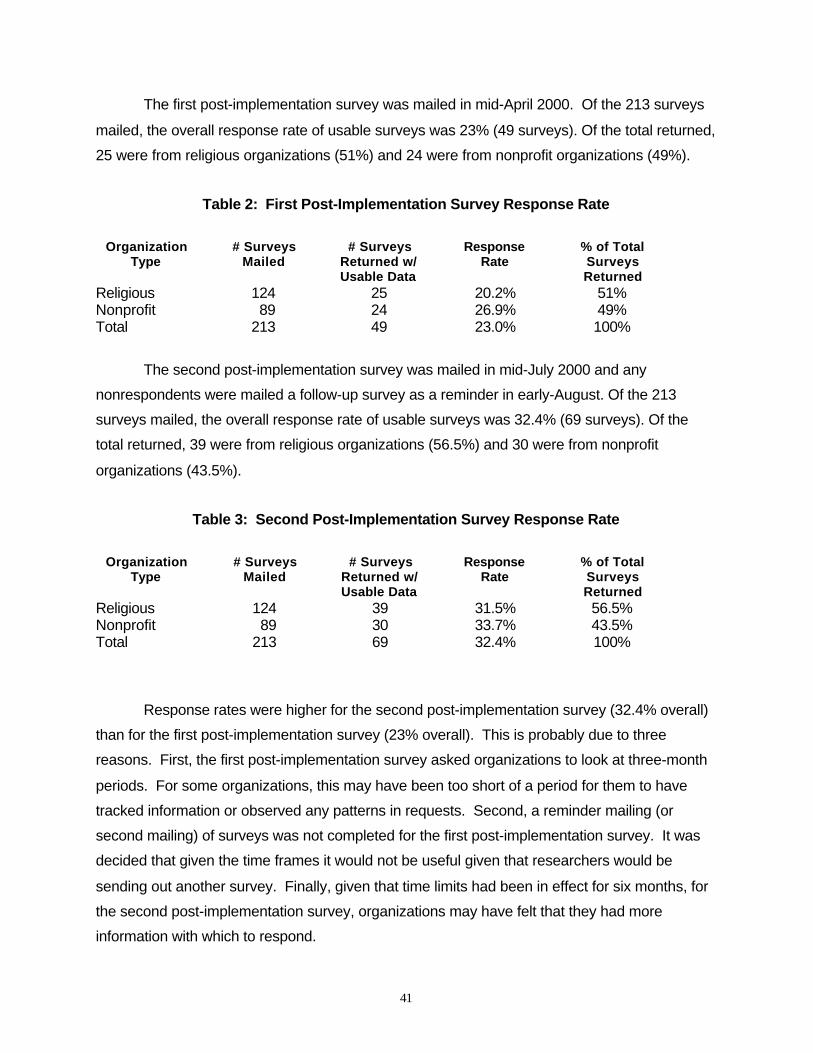
41
The first post-implementation survey was mailed in mid-April 2000. Of the 213 surveys
mailed, the overall response rate of usable surveys was 23% (49 surveys). Of the total returned,
25 were from religious organizations (51%) and 24 were from nonprofit organizations (49%).
Table 2: First Post-Implementation Survey Response Rate
OrganizationType
# SurveysMailed
# SurveysReturned w/Usable Data
ResponseRate
% of TotalSurveysReturned
Religious 124 25 20.2% 51%Nonprofit 89 24 26.9% 49%Total 213 49 23.0% 100%
The second post-implementation survey was mailed in mid-July 2000 and any
nonrespondents were mailed a follow-up survey as a reminder in early-August. Of the 213
surveys mailed, the overall response rate of usable surveys was 32.4% (69 surveys). Of the
total returned, 39 were from religious organizations (56.5%) and 30 were from nonprofit
organizations (43.5%).
Table 3: Second Post-Implementation Survey Response Rate
OrganizationType
# SurveysMailed
# SurveysReturned w/Usable Data
ResponseRate
% of TotalSurveysReturned
Religious 124 39 31.5% 56.5%Nonprofit 89 30 33.7% 43.5%Total 213 69 32.4% 100%
Response rates were higher for the second post-implementation survey (32.4% overall)
than for the first post-implementation survey (23% overall). This is probably due to three
reasons. First, the first post-implementation survey asked organizations to look at three-month
periods. For some organizations, this may have been too short of a period for them to have
tracked information or observed any patterns in requests. Second, a reminder mailing (or
second mailing) of surveys was not completed for the first post-implementation survey. It was
decided that given the time frames it would not be useful given that researchers would be
sending out another survey. Finally, given that time limits had been in effect for six months, for
the second post-implementation survey, organizations may have felt that they had more
information with which to respond.
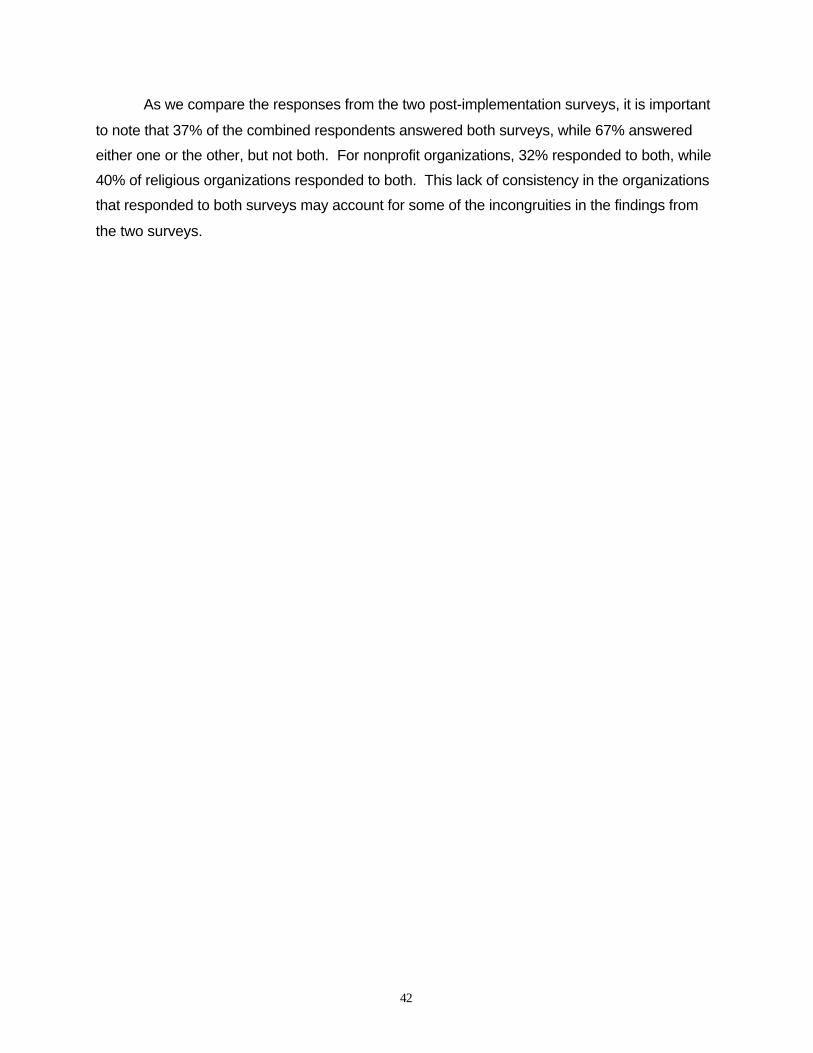
42
As we compare the responses from the two post-implementation surveys, it is important
to note that 37% of the combined respondents answered both surveys, while 67% answered
either one or the other, but not both. For nonprofit organizations, 32% responded to both, while
40% of religious organizations responded to both. This lack of consistency in the organizations
that responded to both surveys may account for some of the incongruities in the findings from
the two surveys.
43
V. RESEARCH FINDINGS AND DISCUSSION
You have dignity and self-esteem...life is easier without having to ask for help.---Long-term welfare recipient (quoted in Taylor, 2000).
It's scary when welfare is all there is left, and now there is nothing.---Long-term welfare recipient (quoted in Taylor, 2000).
This section presents research findings and discussion. We begin with describing the
capacity and scope of the LDS welfare sector, estimating its proportion of the entire Utah
charitable welfare sector. With that estimate, the results of our surveys of the balance of the
charitable sector in Utah can be better interpreted.
CAPACITY AND SCOPE OF LDS WELFARE SECTOR
Researchers were unable to obtain permission to survey a sample of LDS bishops in
Utah, as originally planned; thus we here describe findings regarding the capacity and scope of
the LDS welfare sector, drawing on administrative data, published sources, and interviews.63
Not surprisingly, the largest charitable organization in the state of Utah is The Church of
Jesus Christ of Latter-day Saints. Utah is the world headquarters of the LDS Church, recently
identified by the National Council of Churches as the fifth-largest denomination in the United
States. The considerable resources of the LDS Church have been generally publicized,64 and
the vast extent of the LDS Church welfare programs is widely acknowledged. Approximately
76% of the population of Utah,65 or 1,604,700 individuals, are affiliated with the LDS Church.
This represents an increase from 1,458,350 in 1994.
LDS Wards
As noted previously, every LDS bishop serves as a welfare agent. Bishops, as
congregational leaders, are charged with responsibility for the welfare of all who live within the
geographical ward boundary, regardless of their religious affiliation (or non-affiliation). Welfare
assistance is rendered entirely at their discretion. Welfare assistance is not limited to LDS
members; assistance may be given to others regardless of religious affiliation.
63 We appreciate the efforts of officials in the Church Welfare Services Department for assistingresearchers with relevant data.64 As an example, see Richard Ostling’s Mormon America: The power and the promise, published in 1999by Harper.65 Precise figures vary with regards to the proportion of the population of Utah to be LDS. The range isfrom less than 50% in Salt Lake City, to nearly 100% in some small town and rural areas.
44
Information available from the LDS Church Welfare Services Department reveals that as
of March 1, 2001, there were 3,903 LDS congregations in Utah, representing an increase from
3,239 since 1994. Bishops are supported by the following structure: 22 Bishops' Storehouses
(where people can "shop", using a bishop's order instead of money, for food and other
necessities); 24 Deseret Industries outlets (where used clothing and furniture is refurbished and
available for purchase to the general public); 13 family service agencies, and 19 employment
centers.66
Welfare Square
Welfare Square, located in a city block at 700 South and 800 West in Salt Lake City, is a
facility with agencies and services that supplement the welfare efforts of LDS bishops. It
includes an employment center, a bishops' storehouse, bakery, Family Support Services
Center, grain storage, cannery, dairy, and a Deseret Industries Store; similar services are
available in other areas of Utah. It serves those of any faith who seek assistance, with or
without referral, as authorized by an LDS bishop.67 Table 1 represents data from the LDS
Welfare Square facility for 1999 and 2000, indicating the following levels of service to individuals
and families.68
As can be seen, in 1999, the two bishops at Welfare Square conducted 12,589
interviews of individuals and families 69 seeking assistance. In contrast, in 2000−after the
imposition of time limits−the bishops conducted 10,980 interviews, representing a decrease of
12.8% seeking assistance from the bishops at Welfare Square. All of these cases were either
referred to other sources for help−such as to the Community Action Program, or assisted
directly with food, bus fare, gasoline, lodging, etc. These figures do not include the assistance
of LDS Employment Services, also located at Welfare Square.
Of special note is the fact that the number of children served in these cases in 2000
numbered 11,677, representing a 2.7% increase over the number of children served in 1999.
The total number of people assisted in 2000 was 19,180, representing a decrease in those
served of 8%. Welfare Square officials report that while they are not seeing any increase in
66 For a full description of the development of LDS welfare services, see Garth L. Mangum and Bruce D.Bluwell, The Mormons’ War on Poverty. Salt Lake City, University of Utah Press, 1993. See also the LDSChurch Welfare handbook, Providing in the Lord's Way: A Leader's Guide to Welfare. Salt Lake City,Utah: The Church of Jesus Christ of Latter-day Saints. 1990.67 Authorization may be obtained from a local congregational bishop or from one of the two bishopslocated at Welfare Square.68 I am indebted to Bishop Mark Blackham, one of the two bishops at Welfare Square, for this information,provided in February of 2001.
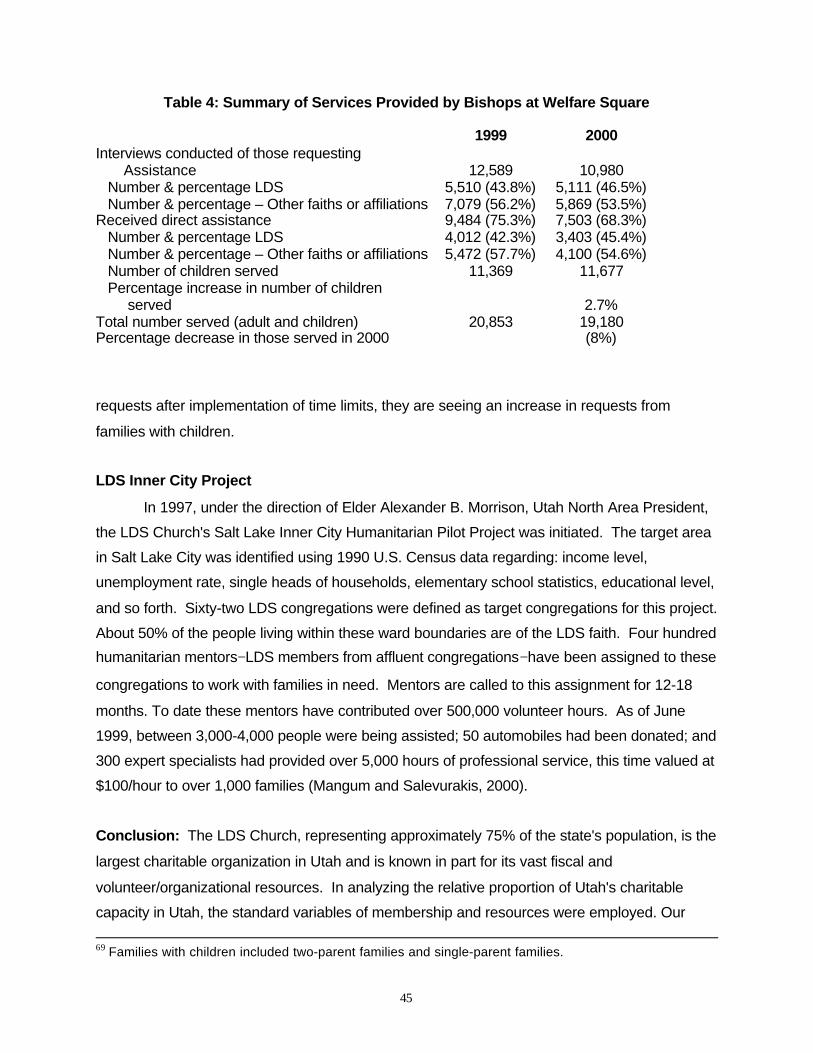
45
Table 4: Summary of Services Provided by Bishops at Welfare Square
1999 2000Interviews conducted of those requesting Assistance 12,589 10,980
Number & percentage LDS 5,510 (43.8%) 5,111 (46.5%)Number & percentage – Other faiths or affiliations 7,079 (56.2%) 5,869 (53.5%)
Received direct assistance 9,484 (75.3%) 7,503 (68.3%)Number & percentage LDS 4,012 (42.3%) 3,403 (45.4%)Number & percentage – Other faiths or affiliations 5,472 (57.7%) 4,100 (54.6%)Number of children served 11,369 11,677Percentage increase in number of children served 2.7%
Total number served (adult and children) 20,853 19,180Percentage decrease in those served in 2000 (8%)
requests after implementation of time limits, they are seeing an increase in requests from
families with children.
LDS Inner City Project
In 1997, under the direction of Elder Alexander B. Morrison, Utah North Area President,
the LDS Church's Salt Lake Inner City Humanitarian Pilot Project was initiated. The target area
in Salt Lake City was identified using 1990 U.S. Census data regarding: income level,
unemployment rate, single heads of households, elementary school statistics, educational level,
and so forth. Sixty-two LDS congregations were defined as target congregations for this project.
About 50% of the people living within these ward boundaries are of the LDS faith. Four hundred
humanitarian mentors−LDS members from affluent congregations−have been assigned to these
congregations to work with families in need. Mentors are called to this assignment for 12-18
months. To date these mentors have contributed over 500,000 volunteer hours. As of June
1999, between 3,000-4,000 people were being assisted; 50 automobiles had been donated; and
300 expert specialists had provided over 5,000 hours of professional service, this time valued at
$100/hour to over 1,000 families (Mangum and Salevurakis, 2000).
Conclusion: The LDS Church, representing approximately 75% of the state's population, is the
largest charitable organization in Utah and is known in part for its vast fiscal and
volunteer/organizational resources. In analyzing the relative proportion of Utah's charitable
capacity in Utah, the standard variables of membership and resources were employed. Our
69 Families with children included two-parent families and single-parent families.
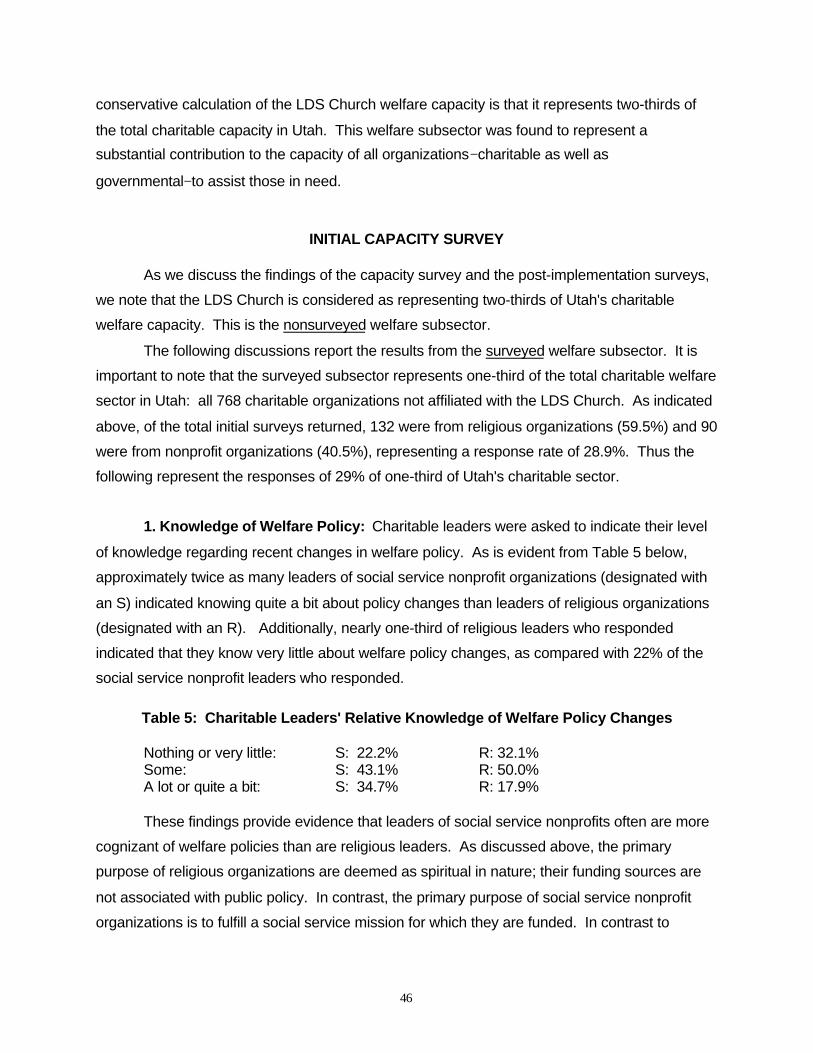
46
conservative calculation of the LDS Church welfare capacity is that it represents two-thirds of
the total charitable capacity in Utah. This welfare subsector was found to represent a
substantial contribution to the capacity of all organizations−charitable as well as
governmental−to assist those in need.
INITIAL CAPACITY SURVEY
As we discuss the findings of the capacity survey and the post-implementation surveys,
we note that the LDS Church is considered as representing two-thirds of Utah's charitable
welfare capacity. This is the nonsurveyed welfare subsector.
The following discussions report the results from the surveyed welfare subsector. It is
important to note that the surveyed subsector represents one-third of the total charitable welfare
sector in Utah: all 768 charitable organizations not affiliated with the LDS Church. As indicated
above, of the total initial surveys returned, 132 were from religious organizations (59.5%) and 90
were from nonprofit organizations (40.5%), representing a response rate of 28.9%. Thus the
following represent the responses of 29% of one-third of Utah's charitable sector.
1. Knowledge of Welfare Policy: Charitable leaders were asked to indicate their level
of knowledge regarding recent changes in welfare policy. As is evident from Table 5 below,
approximately twice as many leaders of social service nonprofit organizations (designated with
an S) indicated knowing quite a bit about policy changes than leaders of religious organizations
(designated with an R). Additionally, nearly one-third of religious leaders who responded
indicated that they know very little about welfare policy changes, as compared with 22% of the
social service nonprofit leaders who responded.
Table 5: Charitable Leaders' Relative Knowledge of Welfare Policy Changes
Nothing or very little: S: 22.2% R: 32.1%Some: S: 43.1% R: 50.0%A lot or quite a bit: S: 34.7% R: 17.9%
These findings provide evidence that leaders of social service nonprofits often are more
cognizant of welfare policies than are religious leaders. As discussed above, the primary
purpose of religious organizations are deemed as spiritual in nature; their funding sources are
not associated with public policy. In contrast, the primary purpose of social service nonprofit
organizations is to fulfill a social service mission for which they are funded. In contrast to
47
religious organizations, the survival of social service nonprofit organizations often depends in
part on their ability to be aware of−and respond to−policy changes.
2. Requests Increasing or Decreasing: Charitable leaders were asked whether, over
the past year, requests for services were decreasing or increasing. The different responses
mirror their differences as organizations. Religious clergy, in focus groups, surveys, and
interviews, reported that requests for services were about the same; the one exception is
information regarding services rendered by the two bishops at Welfare Square showing a
decrease of 12.8% in 2000, as compared with 1999. In contrast, reports in the media highlight
dramatic increases in requests by social service nonprofit organizations; these findings are
supported by respondents to our surveys who predicted an increase for 2000.
The discrepancy between religious organizations and social service nonprofits is not
unexpected. Welfare services rendered by religious and other social service nonprofit
organizations respond to poverty conditions in general, and not only to government policy. The
faith-based charitable social net is substantial and may not be affected greatly by changes in
government welfare policy. In contrast, social service nonprofits with funding tied to government
programs are likely to be directly affected by government social welfare policy. This dynamic
might change for those religious organizations that choose to participate in the Charitable
Choice provision of PRWORA.
3. Number of Individuals Served: Charitable organizations were asked to report how
many individuals to whom they had directly provided service during the past year. Respondents
indicated that they had directly assisted 788,565 individuals in need, representing a mean of
3552.09 people per organization in the past year. The range was 12 - 201,000. Undoubtedly,
the exceptionally large number of individuals assisted is a reflection of assisting people multiple
times (as in serving meals), as well as some individuals being assisted by multiple
organizations. Even so, when we remember that these raw numbers are from only 29% of one-
third of the charitable welfare sector in Utah, these results are impressive. Obviously, charitable
organizations are assisting many more people than those who are cycling on and off
government welfare rolls.
Charitable organizations report that the elderly account for approximately 165,600 of the
people assisted. In addition, the following demographic descriptions of individuals assisted
were provided by social service nonprofit respondents: 4% are African American; 4% are
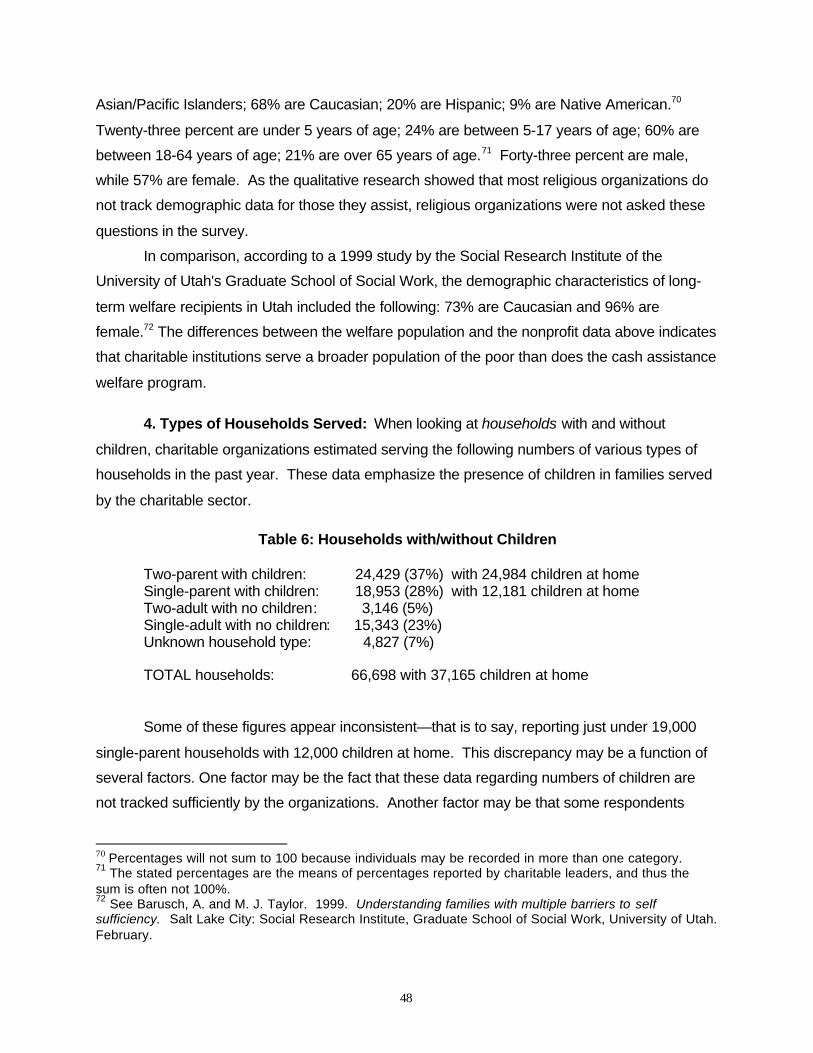
48
Asian/Pacific Islanders; 68% are Caucasian; 20% are Hispanic; 9% are Native American.70
Twenty-three percent are under 5 years of age; 24% are between 5-17 years of age; 60% are
between 18-64 years of age; 21% are over 65 years of age.71 Forty-three percent are male,
while 57% are female. As the qualitative research showed that most religious organizations do
not track demographic data for those they assist, religious organizations were not asked these
questions in the survey.
In comparison, according to a 1999 study by the Social Research Institute of the
University of Utah's Graduate School of Social Work, the demographic characteristics of long-
term welfare recipients in Utah included the following: 73% are Caucasian and 96% are
female.72 The differences between the welfare population and the nonprofit data above indicates
that charitable institutions serve a broader population of the poor than does the cash assistance
welfare program.
4. Types of Households Served: When looking at households with and without
children, charitable organizations estimated serving the following numbers of various types of
households in the past year. These data emphasize the presence of children in families served
by the charitable sector.
Table 6: Households with/without Children
Two-parent with children: 24,429 (37%) with 24,984 children at homeSingle-parent with children: 18,953 (28%) with 12,181 children at homeTwo-adult with no children: 3,146 (5%)Single-adult with no children: 15,343 (23%)Unknown household type: 4,827 (7%)
TOTAL households: 66,698 with 37,165 children at home
Some of these figures appear inconsistent—that is to say, reporting just under 19,000
single-parent households with 12,000 children at home. This discrepancy may be a function of
several factors. One factor may be the fact that these data regarding numbers of children are
not tracked sufficiently by the organizations. Another factor may be that some respondents
70 Percentages will not sum to 100 because individuals may be recorded in more than one category.71 The stated percentages are the means of percentages reported by charitable leaders, and thus thesum is often not 100%.72 See Barusch, A. and M. J. Taylor. 1999. Understanding families with multiple barriers to selfsufficiency. Salt Lake City: Social Research Institute, Graduate School of Social Work, University of Utah.February.
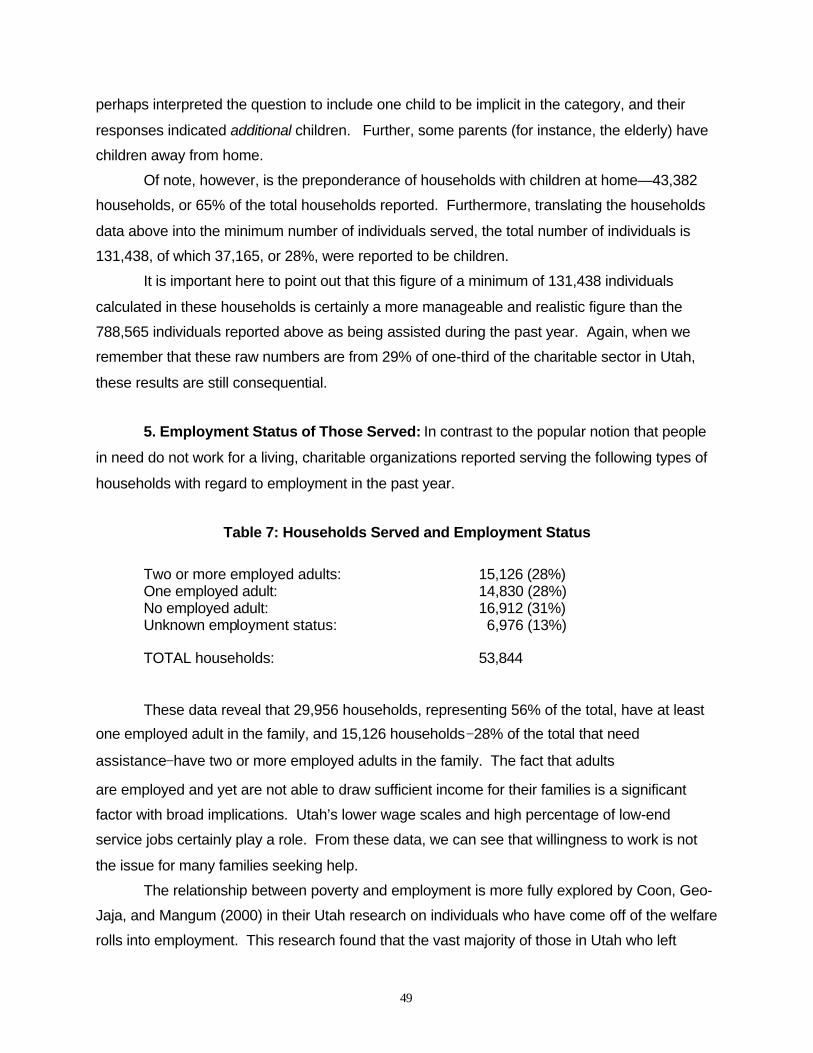
49
perhaps interpreted the question to include one child to be implicit in the category, and their
responses indicated additional children. Further, some parents (for instance, the elderly) have
children away from home.
Of note, however, is the preponderance of households with children at home—43,382
households, or 65% of the total households reported. Furthermore, translating the households
data above into the minimum number of individuals served, the total number of individuals is
131,438, of which 37,165, or 28%, were reported to be children.
It is important here to point out that this figure of a minimum of 131,438 individuals
calculated in these households is certainly a more manageable and realistic figure than the
788,565 individuals reported above as being assisted during the past year. Again, when we
remember that these raw numbers are from 29% of one-third of the charitable sector in Utah,
these results are still consequential.
5. Employment Status of Those Served: In contrast to the popular notion that people
in need do not work for a living, charitable organizations reported serving the following types of
households with regard to employment in the past year.
Table 7: Households Served and Employment Status
Two or more employed adults: 15,126 (28%)One employed adult: 14,830 (28%)No employed adult: 16,912 (31%)Unknown employment status: 6,976 (13%)
TOTAL households: 53,844
These data reveal that 29,956 households, representing 56% of the total, have at least
one employed adult in the family, and 15,126 households−28% of the total that need
assistance−have two or more employed adults in the family. The fact that adults
are employed and yet are not able to draw sufficient income for their families is a significant
factor with broad implications. Utah’s lower wage scales and high percentage of low-end
service jobs certainly play a role. From these data, we can see that willingness to work is not
the issue for many families seeking help.
The relationship between poverty and employment is more fully explored by Coon, Geo-
Jaja, and Mangum (2000) in their Utah research on individuals who have come off of the welfare
rolls into employment. This research found that the vast majority of those in Utah who left
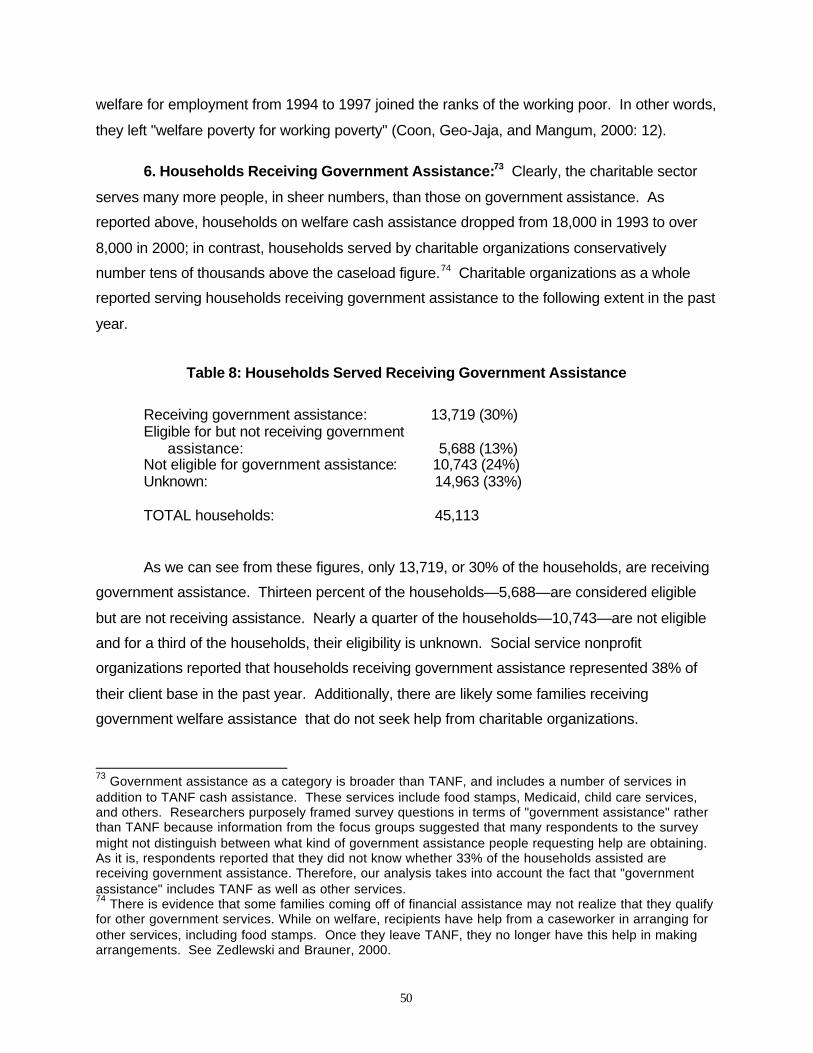
50
welfare for employment from 1994 to 1997 joined the ranks of the working poor. In other words,
they left "welfare poverty for working poverty" (Coon, Geo-Jaja, and Mangum, 2000: 12).
6. Households Receiving Government Assistance:73 Clearly, the charitable sector
serves many more people, in sheer numbers, than those on government assistance. As
reported above, households on welfare cash assistance dropped from 18,000 in 1993 to over
8,000 in 2000; in contrast, households served by charitable organizations conservatively
number tens of thousands above the caseload figure.74 Charitable organizations as a whole
reported serving households receiving government assistance to the following extent in the past
year.
Table 8: Households Served Receiving Government Assistance
Receiving government assistance: 13,719 (30%)Eligible for but not receiving government assistance: 5,688 (13%)Not eligible for government assistance: 10,743 (24%)Unknown: 14,963 (33%)
TOTAL households: 45,113
As we can see from these figures, only 13,719, or 30% of the households, are receiving
government assistance. Thirteen percent of the households—5,688—are considered eligible
but are not receiving assistance. Nearly a quarter of the households—10,743—are not eligible
and for a third of the households, their eligibility is unknown. Social service nonprofit
organizations reported that households receiving government assistance represented 38% of
their client base in the past year. Additionally, there are likely some families receiving
government welfare assistance that do not seek help from charitable organizations.
73 Government assistance as a category is broader than TANF, and includes a number of services inaddition to TANF cash assistance. These services include food stamps, Medicaid, child care services,and others. Researchers purposely framed survey questions in terms of "government assistance" ratherthan TANF because information from the focus groups suggested that many respondents to the surveymight not distinguish between what kind of government assistance people requesting help are obtaining.As it is, respondents reported that they did not know whether 33% of the households assisted arereceiving government assistance. Therefore, our analysis takes into account the fact that "governmentassistance" includes TANF as well as other services.74 There is evidence that some families coming off of financial assistance may not realize that they qualifyfor other government services. While on welfare, recipients have help from a caseworker in arranging forother services, including food stamps. Once they leave TANF, they no longer have this help in makingarrangements. See Zedlewski and Brauner, 2000.
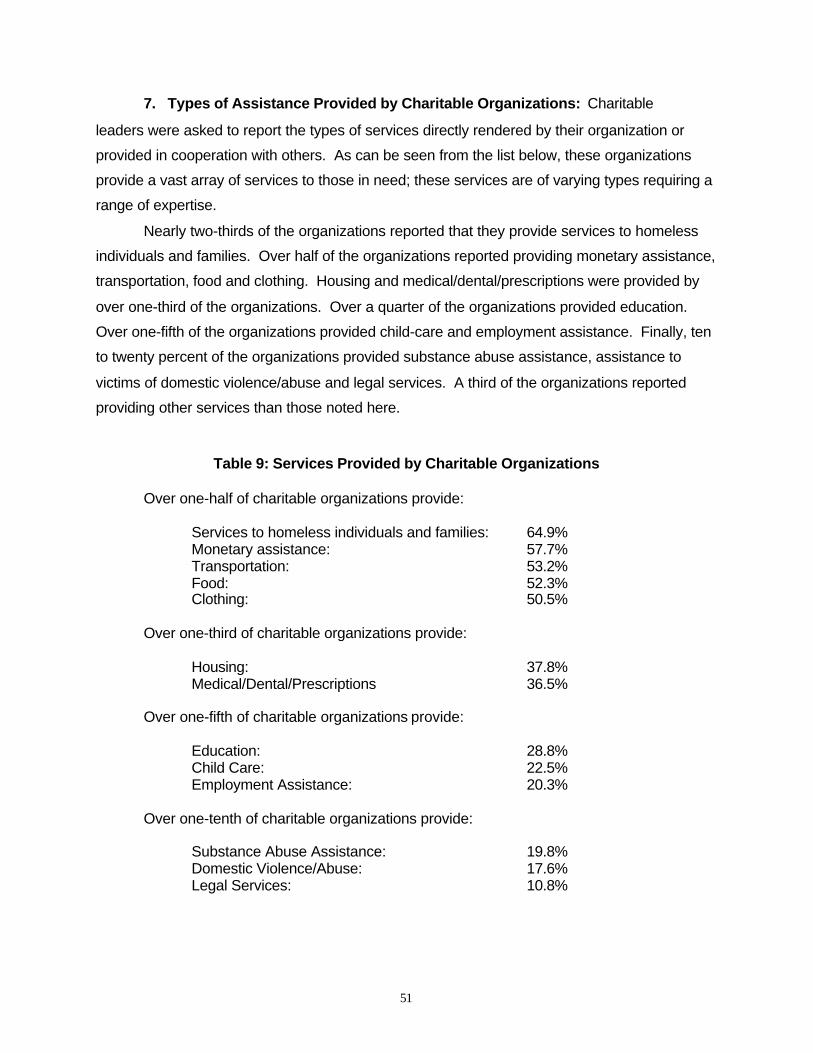
51
7. Types of Assistance Provided by Charitable Organizations: Charitable
leaders were asked to report the types of services directly rendered by their organization or
provided in cooperation with others. As can be seen from the list below, these organizations
provide a vast array of services to those in need; these services are of varying types requiring a
range of expertise.
Nearly two-thirds of the organizations reported that they provide services to homeless
individuals and families. Over half of the organizations reported providing monetary assistance,
transportation, food and clothing. Housing and medical/dental/prescriptions were provided by
over one-third of the organizations. Over a quarter of the organizations provided education.
Over one-fifth of the organizations provided child-care and employment assistance. Finally, ten
to twenty percent of the organizations provided substance abuse assistance, assistance to
victims of domestic violence/abuse and legal services. A third of the organizations reported
providing other services than those noted here.
Table 9: Services Provided by Charitable Organizations
Over one-half of charitable organizations provide:
Services to homeless individuals and families: 64.9%Monetary assistance: 57.7%Transportation: 53.2%Food: 52.3%Clothing: 50.5%
Over one-third of charitable organizations provide:
Housing: 37.8%Medical/Dental/Prescriptions 36.5%
Over one-fifth of charitable organizations provide:
Education: 28.8%Child Care: 22.5%Employment Assistance: 20.3%
Over one-tenth of charitable organizations provide:
Substance Abuse Assistance: 19.8%Domestic Violence/Abuse: 17.6%Legal Services: 10.8%
52
In providing help, charitable organizations often collaborate with one another and with
government agencies, indicating a strong network of organizations that know each others'
expertise and capacities. Nearly all (98.6%) of the respondents indicated that they refer people
to other organizations for assistance: over one-third refer to clergy/religious leaders, over ninety
percent refer to nonprofit organizations, and nearly eighty percent refer to government agencies.
Charitable leaders listed a variety of shelters, churches, state/local/county government
agencies, and social service nonprofit organizations to which they refer people for assistance.
Overwhelmingly, the primary reason is that their organization does not offer the requested
service (91.9%). This suggests a major inefficiency for those seeking assistance. That is to
say, they apparently need to transport themselves from one organization to another to receive
the services they need. This task may be daunting to those with limited resources. Also,
32.9% of the respondents also reported that their reason for referrals was that their
organization's service capacity is full.
8. Service Capacity of Nonprofits: Nonprofit leaders were asked how much of an
increase in requests for services their organizations are able to absorb. The majority (66%)
indicated that their organizations could absorb only 10% or less. Nineteen percent indicated
that they could absorb an additional 20% of current requests for assistance, while only 14%
could absorb more than 20% of current requests. In fact, over the past three years, nearly 40%
indicated that their funding had decreased. In response to this decrease, these organizations
reduced their full-and part-time staff, increased their use of volunteers, reduced hours and
services, and increased collaborations with other groups for referral purposes. Nearly one-third
reported a negative cash-flow from the previous fiscal year, while just over 10% broke even.
For the nonprofits who responded to our survey, the total operating budgets for social service
programs and services for the current fiscal year was over $ 74,000,000.00.
Funding for social service nonprofit organizations in Utah comes primarily from four
sources (percentages listed are means of the percentages of funds): fees for services (27.4% of
funds), federal government grants (26.4% of funds), individual donors and members (25.1% of
funds), and state government contracts and grants (23.8% of funds). Other funding sources, in
descending order, include: foundations, private corporations, local governments, United Way,
and endowments. It is important to note that governmental sources provide over half of the
funding for these social service nonprofits. One implication of this fact is that nonprofit social
service organizations are more closely tied to governmental welfare programs than are religious
congregations, in general.
53
9. Strategies for the Future: Looking at the upcoming year, 35% of the charitable
leaders foresee an increase in demand for food and cash, 25% anticipate an increase in
demand for housing, and 14% predict an increase in demand for medical and dental assistance.
Twenty-three percent of the charitable leaders are planning for an increase in demand for all
services.
When asked what their strategies would be in the event of increases in requests for
services beyond what they can presently absorb, respondents were evenly divided on the
options of raising more funds and increasing staff (31.5% and 32.0% respectively).
Approximately a quarter reported that they would have to reduce services (24.3%), while only
26.1% indicated that they would be able to expand services. Note that respondents were able to
give more than one answer.
GREATEST CONCERN REGARDING THE IMPACT OF WELFARE REFORM ON
INDIVIDUALS AND FAMILIES
That they have little chance of surviving without some assistance and that what assistance isavailable is woefully inadequate. The difficulties in negotiating the regulations of government
agencies are tremendous. The shortage of adequate housing for low-income families, lowwages, and nearly non-existent medical and dental services are an embarrassment and a
crime. −Congregational Leader
The last item on the survey was an open-ended question, asking respondents to share
their greatest concern regarding the impact of welfare reform on the families and individuals
who come to them for assistance. While approximately one-fifth, or 48, of charitable leaders
surveyed choose not to respond to this question, written answers were received from 174, or
nearly 80% of the respondents. Of the written responses, six reported that they had no concerns
about the impact of welfare reform and 168 expressed some concern. Their comments are
instructive and add considerably to our understanding.
Of the 168 responses expressing concerns, nearly two-thirds expressed concerns in
three areas: lack of affordable housing; limited resources of charitable organizations; and ability
to give only inadequate assistance.
54
Lack of Affordable Housing. This issue was the most dominant concern indicated by
respondents,75 and reflects considerable experience and current research regarding the lack of
affordable housing in Utah. Comments included: "People need affordable housing; families in
need cannot afford high rents"; "Rent assistance is needed−families are threatened with eviction
and in many cases with very cruel notices from landlords"; "High cost of housing−saving enough
for security deposit and first & last months' rent is virtually impossible for these folk"; "My
greatest concern is that the community increases the availability of affordable housing for the
poor".
Their Organization has Limited Resources. The second most dominant theme from
our respondents is the realization that the resources of their respective organizations are
limited. As they put it: "We have very limited funds available to assist in rent and utility bills.
Many we see have already been turned down by other agencies"; "That I don't have enough
services to offer them, especially in the medical/dental area"; "That the church will not be able to
help. The majority of those that ask, usually come here after all other areas have turned them
away"; "The inability to serve those who need it the most"; "I need to comment that those
requesting help from us were declined because we are running out of money. When our funds
were depleted, we had to turn down several requests, and then began to receive fewer
requests"; "I worry about availability of services, poor policies, and lack of cooperation among
agencies". As can be seen, expressed concerns are heightened because they see people who
have been turned down elsewhere.
Available Assistance is Inadequate. A related dominant theme expressed is the
realization that fundamentally all available assistance is inadequate. "Assistance is often a stop-
gap measure. We need good-paying entry-level jobs"; "They should receive increased help from
government agencies. Health care is a major concern"; "Government agencies actually block us
from providing assistance"; "I am concerned that the poor will expect the private sector to
support them in at least the same manner that the public sector has−which is impossible.
Charitable dollars cannot/will not take the place of tax dollars"; "Government is relying on private
nonprofits to provide services−in many communities, nonprofit services are inadequate". Many
report that the cases coming to them now are more complex.
75 Wages are sometimes too low to afford housing, as full-time workers are often reported to be living incars or in homeless shelters. In 1998, research of 30 cities by the U.S. Conference of Mayors found that20% of those in homeless shelters are full-time wage earners. See www.nationalhomeless.org/jobs.html.
55
A number of charitable leaders also expressed concerns about the following key areas:
sufficient food for those in need ("I am concerned about their ability to obtain sufficient food for
their families"); employment and wages ("We need living wages for those who work!") and
medical/health insurance ("We see people with health problems and no health insurance").
Also frequently noted as two areas of prime concern were long-term assistance and
spiritual needs. It’s important to note that religious leaders were not the only ones to express
concern for people's spiritual well-being−other nonprofit leaders indicated this concern, as well.
Long-term Assistance. Here we see concerns that people receive long-term
preparation for life, and not merely short-term assistance. As these leaders pointed out: "I am
concerned that people develop the long-term ability to get off of welfare and stay off"; "Most of
our clients are working but at minimum wage jobs. Welfare reform has not impacted our
services at all. However, we are concerned about individuals with very low reading skills. It will
take literally years (at least) to improve their reading enough to get a better paying job"; "What
we are able to provide is very temporal. We may help with food, but there is nothing provided to
change the long-term situation."
Spiritual Needs. The precise meaning of the phrase ‘spiritual needs' widely varies, of
course. However, the phrase was used by charitable leaders to refer to more lasting conditions,
such as low self-esteem, difficulty taking responsibility, and so forth. As they put it: "Their
spiritual condition is #1. Their lack of ability or desire to plan ahead and take responsibility for
their own needs and problems is a great hindrance to them"; "Their spiritual needs, as
expressed in poor self-image and no work ethic. They lack basic skills and motivation, including
education. They have a destructive family life due to dependencies on drugs, etc."; "Their
general state of hopelessness. Most of the people we see in this capacity are people that have
been needy for quite some time."
Discernment: One of the dilemmas reported by religious leaders in distributing limited
resources for assistance to those in need is the problem of determining whose needs are truly
legitimate. Charitable leaders, especially leaders of religious congregations, face this problem
squarely as they are often not bound by funding mandates to serve those in a specified
category. Religious leaders must act on solely their own discernment and it is difficult. Our
respondents expressed a strong mixture of compassion and skepticism towards those who
request assistance. Many religious leaders expressed strong feelings regarding the plight of the
56
poor, the deficiencies inherent in the welfare-to-work government welfare system, and concerns
about our responsibility as members of society to help one another. One leader wrote: "How did
they get where they are? Who failed them and how can we make it right?" On the other hand,
several spoke of their fear that the church is "being swindled." One pastor reported: "I have
been the pastor of a center city, urban church in California. My first assessment is to determine
if the person is a ‘pro' trying to hustle me. In our setting they almost always are ‘pros'".
Welfare Policy: Finally, charitable leaders also expressed concerns about the welfare
policy changes: "I am concerned that Workforce Services has creamed off the best clients while
those who remain are taken off cash grants, are going to come to our shelter, and there won't
be room"; "We have seen a 26% increase in single mothers in poverty since welfare reform
began"; "That many women who are close to getting their lives together will have to go back to
batterers for financial security." One leader could not control feelings of disgust for the
policymakers: "Welfare reform was brought about by people who do not see the big picture and
are filled with greed and fear. The low wage earners and poor people are the people who suffer
most, and most of those people are children."
CONCLUSION: Utah's charitable sector capacity as a whole consists of three parts: the
LDS Church welfare sector as representing two-thirds of the capacity, with the other one-third
capacity represented by over 750 social service nonprofit organizations and religious
congregations. Social service nonprofits report significantly greater knowledge of welfare policy
changes than do religious leaders, and they keep better demographic records of the
characteristics of those to whom service is rendered than do religious organizations. These
findings may reflect the fact that approximately half of the funding for nonprofits comes from
government sources; government sources require strict accountability, including collection of
specific client characteristics.
Government funding to help the poverty population is administered only in part through
government channels; government also funds assistance through nonprofits. This funding
pattern is being extended further to include religious institutions through the White House Office
on Faith-Based Initiatives. Thus government assistance as a whole is less accessible to the
public. That is to say, while citizens in need may access government funds indirectly through
nonprofit organizations, this dispersion of service provision places those seeking help in the
position of having to search for the help they need–which is forthcoming ultimately from the
57
government. Often these people have limited resources for transportation, and are working on
an hourly wage.
While religious organizations, including the LDS Church, report little or no increase in
requests for services since the institution of welfare reform, nonprofits report dramatic increases
in requests for services. Nonprofits typically provide a targeted set of services to a targeted
population, while religious organizations tend to serve a wide range of needs for a broader
population. Increases in requests are anticipated in the areas of food, cash, and housing; most
nonprofits plan to seek more funding and increase staff to meet the demands, while some report
the need to ration out services to people who ask for help.
Charitable organizations reported serving 788,565 individuals in the past year. This
report is striking considering that these are raw numbers from 29% of the surveyed subsector.
Obviously numerous people are being assisted numerous times; however, what is clear is that
the charitable sector is providing service at an enormous level.
Most of the households served by charitable organizations have children at home, have
at least one employed adult, and slightly over 30% are not known to be receiving government
assistance.
The population served by the charitable sector is far broader than the TANF population.
In addition to those living in poverty, middle class families are seeking charitable help.
Most of the charitable organizations provide services to homeless individuals and
families, monetary assistance, transportation, food, and clothing; only a few charitable
organizations provide substance abuse assistance, domestic violence/abuse assistance, and
legal services.
Under AFDC, as an entitlement, citizens in need went to the government for assistance;
they were entitled to this assistance because they met certain eligibility criteria. Under
PRWORA, citizens can still go to government, but receiving available help often requires that
work-related participation requirements be met. Many turn to charity to supplement their aid.
As was the case under AFDC, some approach charity as the first option and do not approach
government services at all.
In Utah the vast majority of charitable help is from religious institutions. The evidence
indicates that religious organizations in Utah provide service on an humanitarian basis without
regard to religious affiliation or activity.
As generous as these institutions are, this raises troubling issues. First, it is important to
recognize that any religious organization that is not obtaining government funding for service
provision (as is the case with the vast majority of such organizations in Utah) may legitimately
58
restrict its assistance for any reason. As the comments from surveyed congregational leaders
reflected, there is at times great difficulty in discerning to whom help should be given.
Some petitioners for help may not be comfortable going to religious sources for a variety
of reasons. Many women in need may have had difficulty with male authority figures, especially
given the exceptionally high incidence of abuse from men in their lives. Most of the clergy in the
United States are male, and Utah is no exception. Further, religious institutions frequently
advance specific lifestyles that potential petitioners may not embrace. Hence single mothers
with children may be hesitant to place themselves in a situation of inviting a judgmental
response. In addition, some may be afraid of an obligation (real or perceived) to attend worship
services, or may be afraid to be disloyal to their own religious upbringing by seeking assistance
from another religious source.
Obviously no one would wish for a mother to return to an abusive situation with a
husband or boyfriend. However, for single mothers with little transportation, scant knowledge of
community resources, lack of government help, fear of negative judgment, but with a need to
house and feed their children, there are few other options. This entire issue raises a painful
possibility that as government assistance becomes less accessible, as we have discussed,
economic circumstances may force mothers to place themselves at risk in abusive situations.
Thus while the charitable sector is of impressive size in Utah, and while people go to great
lengths to help those in need, what may be missing is a targeted effort to address the fears of
those most at risk to ask religious organizations for help. It follows, then, that an analysis of the
barriers of those seeking help from faith-based institutions would be appropriate for religious
leaders and for public policy-makers to consider.76
76 For a suggested analysis, see Bill Walsh, "Religion and the Single Parent Family on Welfare"Discussion Points. Unpublished. January 1999. Included as Appendix D.
59
POST-IMPLEMENTATION SURVEYS
The three-year life time limits on TANF cash assistance in Utah began to expire on
December 31, 1999. In order to examine the extent to which families coming off of welfare
might impact charitable organizations, researchers administered two post-implementation
surveys. The first post-implementation survey compares services for the first three months of
2000, with the first three months of 1999 and with the last three months of 1999. The second
post-implementation survey compares services for the first six months of 2000, with the first half
(January through June) of 1999 and with the last half (July through December) of 1999.
While the response rate for both of the post-implementation surveys are respectable, the
numbers of responses for each question may vary and sometimes are low. Hence, researchers
are reluctant to draw strong conclusions based on these data. That being said, we can detect
early indications of trends. Many of these early indications are slight; some are moderate, and a
few may be designated as strong. In this discussion we can begin to see some patterns of the
changing needs and situations of those seeking help.
FIRST POST-IMPLEMENTATION SURVEY FINDINGS AND DISCUSSION: COMPARISONSOF THE FIRST QUARTER OF 2000 WITH
THE FIRST AND LAST QUARTERS OF 1999
More women are losing their children because of lack of funding and we see people losing theirjobs and now having no benefits.
--Charitable Leader
A summary of charitable organizations’ responses to questions follow. All findings refer
to comparisons on the first three months of 2000 (January through March) with the first three
months of 1999 (January through March) and the last three months of 1999 (October through
December).
1. Changes in Funds and Services Expended: A moderate number of organizations
reported increases in funds and services expended in the aftermath of the imposition of
time-limits. Comparing the total amount of funds and services expended for social
services for the first three months of 1999, with the first three months of 2000, 83.6%
indicated that there had been no increases, while 16.3% indicated that they had
experienced increases. These organizations also compared the total amount of funds
and services expended for social services for the last three months of 1999, with the first
three months of 2000. Of the respondents, 81.3% indicated that there had been no
increases, while 18.8% indicated that they had experienced increases.
60
We can safely say that the charitable sector experienced slight to moderate
increases when compared to the previous year, with religious congregations reporting
nearly identical responses as social service nonprofits in our sample.
2. Changes in Numbers of Referrals: Organizations compared the total numbers of
referrals they were making to other organizations for the last three months of 1999, with
the first three months of 2000. Of the respondents, 70% of nonprofits indicated that there
had been no changes in the numbers of referrals. While 30% indicated that they had
experienced changes, they were evenly divided on an increase in referrals and a
decrease in referrals. In contrast, the vast majority (96%) of religious congregations
reported no change. Thus we conclude that on the balance, there was little change in
the number of referrals in the time frames specified.
3. Changes in Characteristics of People Served: The characteristics of people served by
charitable organizations changed slightly with the implementation of time limits. By
characteristics we are referring to age, marital status, employment status, ethnicity,
receiving government assistance, immigrant status, etc. Looking at the first three
months of 1999 as compared with the first three months of 2000, almost 90% of social
service nonprofits indicated that they had noticed no changes, while 10% did see
changes in who was coming to them for assistance. The comparison with the last
quarter of 1999 yielded approximately the same result. Social service nonprofit
organizations were more likely to note changes than were religious congregations.
When comparing the first three months and the last three months of 1999 with the first
three months of 2000, 96% of religious organizations reported no change, while 4%
indicated some changes were apparent. The changes noted included: assistance being
rendered to those outside the congregation (for religious organization), situations of
people needing help are more complex, more immigrants, more single mothers, and
more children.
4. Changes in Household Types: With regard to households types, organizations were
asked if, during the first three months of 2000, they had seen a change in requests for
assistance from people who live in various household types. Slightly more charitable
organizations experienced a decline in requests from two-parent families with children,
while experiencing moderate increases in requests from single-parent families with
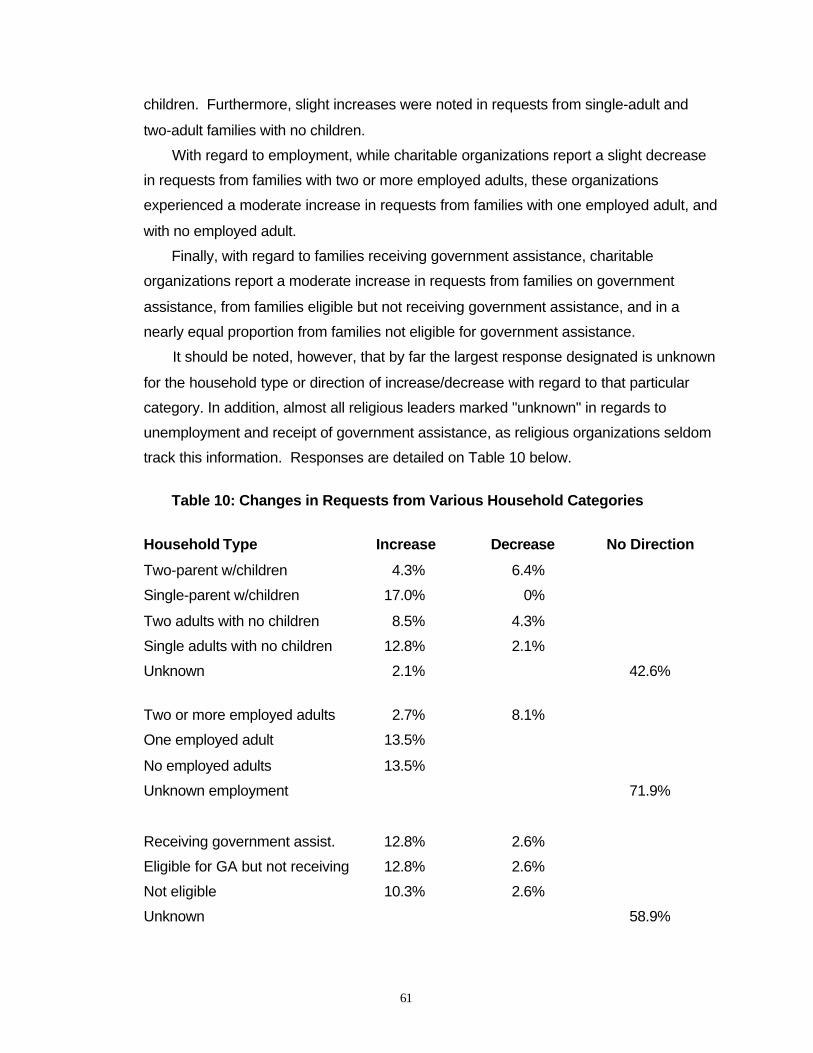
61
children. Furthermore, slight increases were noted in requests from single-adult and
two-adult families with no children.
With regard to employment, while charitable organizations report a slight decrease
in requests from families with two or more employed adults, these organizations
experienced a moderate increase in requests from families with one employed adult, and
with no employed adult.
Finally, with regard to families receiving government assistance, charitable
organizations report a moderate increase in requests from families on government
assistance, from families eligible but not receiving government assistance, and in a
nearly equal proportion from families not eligible for government assistance.
It should be noted, however, that by far the largest response designated is unknown
for the household type or direction of increase/decrease with regard to that particular
category. In addition, almost all religious leaders marked "unknown" in regards to
unemployment and receipt of government assistance, as religious organizations seldom
track this information. Responses are detailed on Table 10 below.
Table 10: Changes in Requests from Various Household Categories
Household Type Increase Decrease No Direction
Two-parent w/children 4.3% 6.4%
Single-parent w/children 17.0% 0%
Two adults with no children 8.5% 4.3%
Single adults with no children 12.8% 2.1%
Unknown 2.1% 42.6%
Two or more employed adults 2.7% 8.1%
One employed adult 13.5%
No employed adults 13.5%
Unknown employment 71.9%
Receiving government assist. 12.8% 2.6%
Eligible for GA but not receiving 12.8% 2.6%
Not eligible 10.3% 2.6%
Unknown 58.9%
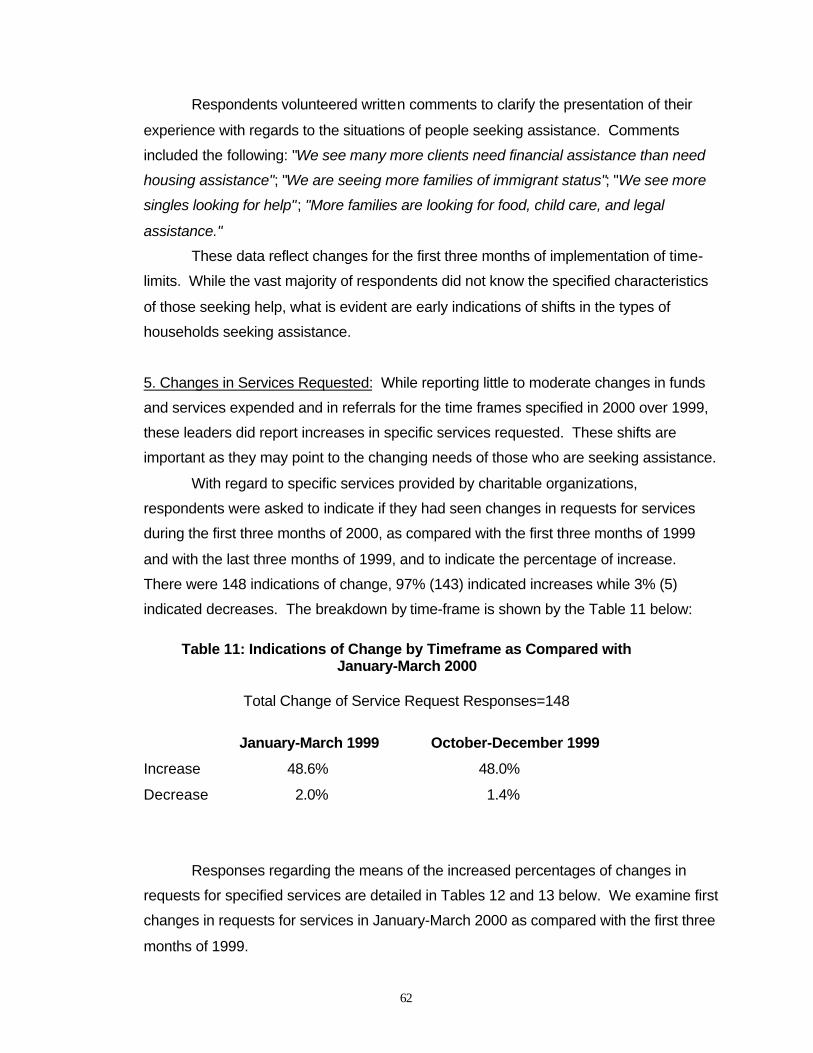
62
Respondents volunteered written comments to clarify the presentation of their
experience with regards to the situations of people seeking assistance. Comments
included the following: "We see many more clients need financial assistance than need
housing assistance"; "We are seeing more families of immigrant status"; "We see more
singles looking for help"; "More families are looking for food, child care, and legal
assistance."
These data reflect changes for the first three months of implementation of time-
limits. While the vast majority of respondents did not know the specified characteristics
of those seeking help, what is evident are early indications of shifts in the types of
households seeking assistance.
5. Changes in Services Requested: While reporting little to moderate changes in funds
and services expended and in referrals for the time frames specified in 2000 over 1999,
these leaders did report increases in specific services requested. These shifts are
important as they may point to the changing needs of those who are seeking assistance.
With regard to specific services provided by charitable organizations,
respondents were asked to indicate if they had seen changes in requests for services
during the first three months of 2000, as compared with the first three months of 1999
and with the last three months of 1999, and to indicate the percentage of increase.
There were 148 indications of change, 97% (143) indicated increases while 3% (5)
indicated decreases. The breakdown by time-frame is shown by the Table 11 below:
Table 11: Indications of Change by Timeframe as Compared withJanuary-March 2000
Total Change of Service Request Responses=148
January-March 1999 October-December 1999
Increase 48.6% 48.0%
Decrease 2.0% 1.4%
Responses regarding the means of the increased percentages of changes in
requests for specified services are detailed in Tables 12 and 13 below. We examine first
changes in requests for services in January-March 2000 as compared with the first three
months of 1999.
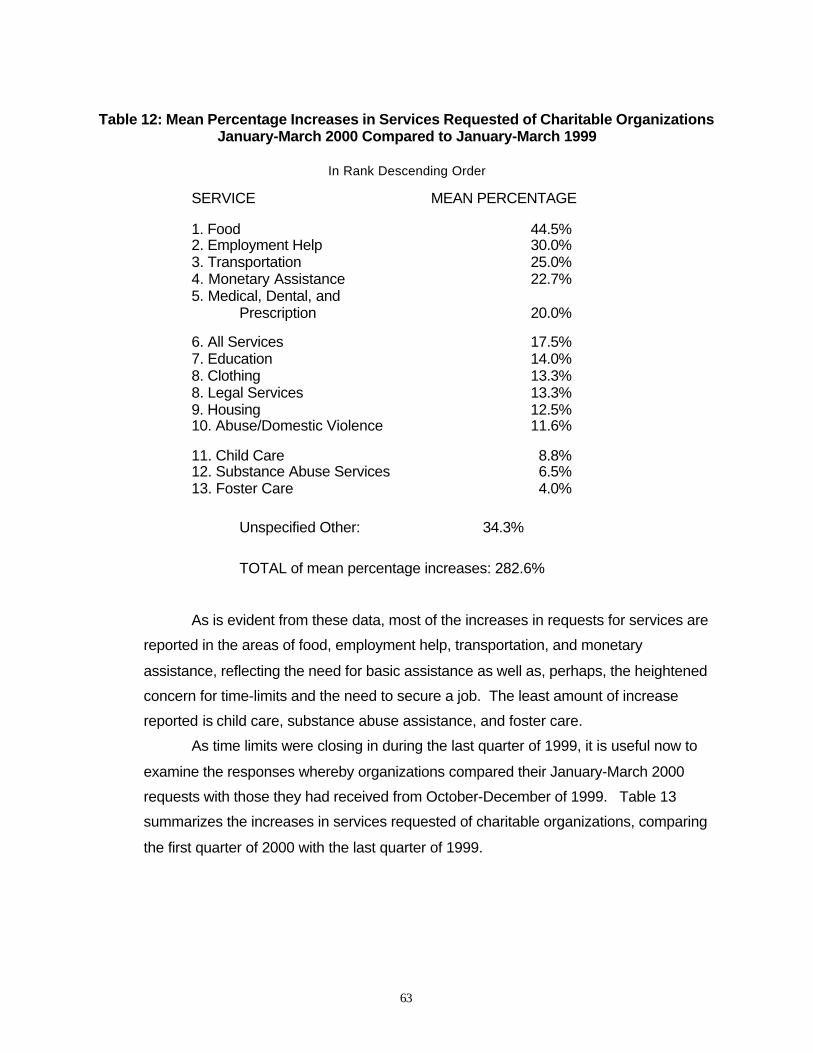
63
Table 12: Mean Percentage Increases in Services Requested of Charitable OrganizationsJanuary-March 2000 Compared to January-March 1999
In Rank Descending Order
SERVICE MEAN PERCENTAGE
1. Food 44.5%2. Employment Help 30.0%3. Transportation 25.0%4. Monetary Assistance 22.7%5. Medical, Dental, and
Prescription 20.0%
6. All Services 17.5%7. Education 14.0%8. Clothing 13.3%8. Legal Services 13.3%9. Housing 12.5%10. Abuse/Domestic Violence 11.6%
11. Child Care 8.8%12. Substance Abuse Services 6.5%13. Foster Care 4.0%
Unspecified Other: 34.3%
TOTAL of mean percentage increases: 282.6%
As is evident from these data, most of the increases in requests for services are
reported in the areas of food, employment help, transportation, and monetary
assistance, reflecting the need for basic assistance as well as, perhaps, the heightened
concern for time-limits and the need to secure a job. The least amount of increase
reported is child care, substance abuse assistance, and foster care.
As time limits were closing in during the last quarter of 1999, it is useful now to
examine the responses whereby organizations compared their January-March 2000
requests with those they had received from October-December of 1999. Table 13
summarizes the increases in services requested of charitable organizations, comparing
the first quarter of 2000 with the last quarter of 1999.
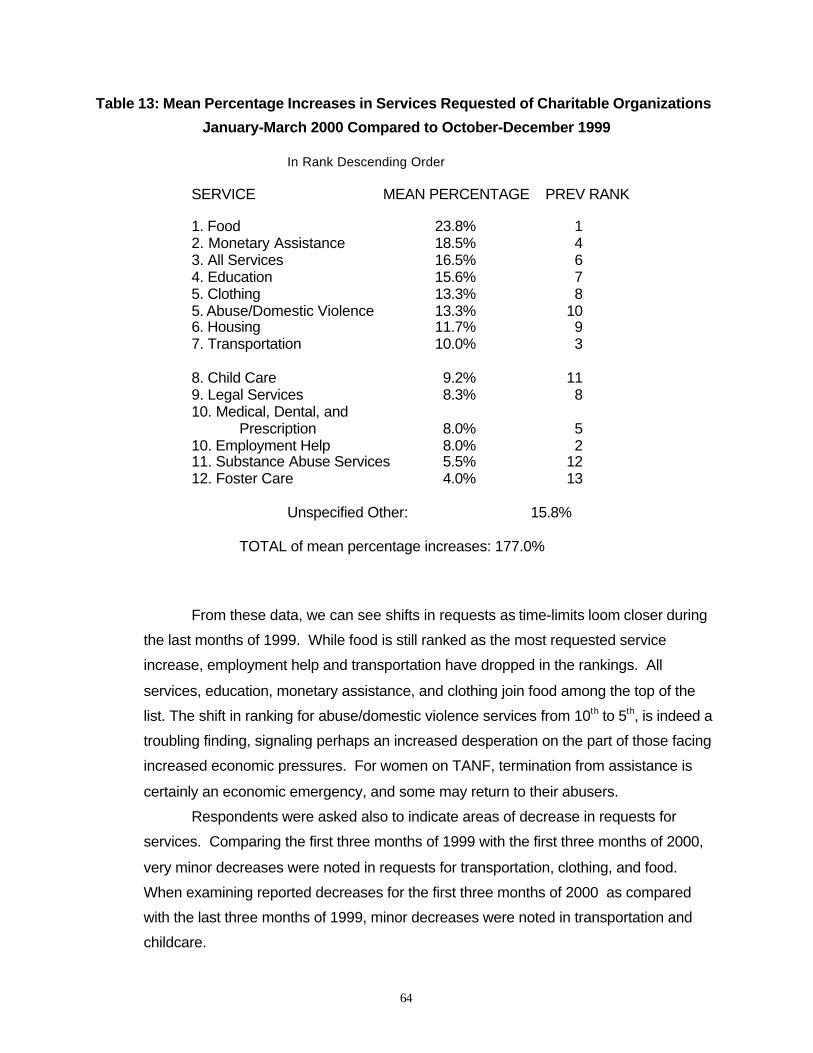
64
Table 13: Mean Percentage Increases in Services Requested of Charitable Organizations
January-March 2000 Compared to October-December 1999
In Rank Descending Order
SERVICE MEAN PERCENTAGE PREV RANK
1. Food 23.8% 12. Monetary Assistance 18.5% 43. All Services 16.5% 64. Education 15.6% 75. Clothing 13.3% 85. Abuse/Domestic Violence 13.3% 106. Housing 11.7% 97. Transportation 10.0% 3
8. Child Care 9.2% 119. Legal Services 8.3% 810. Medical, Dental, and
Prescription 8.0% 510. Employment Help 8.0% 211. Substance Abuse Services 5.5% 1212. Foster Care 4.0% 13
Unspecified Other: 15.8%
TOTAL of mean percentage increases: 177.0%
From these data, we can see shifts in requests as time-limits loom closer during
the last months of 1999. While food is still ranked as the most requested service
increase, employment help and transportation have dropped in the rankings. All
services, education, monetary assistance, and clothing join food among the top of the
list. The shift in ranking for abuse/domestic violence services from 10th to 5th, is indeed a
troubling finding, signaling perhaps an increased desperation on the part of those facing
increased economic pressures. For women on TANF, termination from assistance is
certainly an economic emergency, and some may return to their abusers.
Respondents were asked also to indicate areas of decrease in requests for
services. Comparing the first three months of 1999 with the first three months of 2000,
very minor decreases were noted in requests for transportation, clothing, and food.
When examining reported decreases for the first three months of 2000 as compared
with the last three months of 1999, minor decreases were noted in transportation and
childcare.
65
6. Greatest Concerns: Concluding the first post-implementation survey, respondents
were asked in an open-ended question to share their greatest concern regarding the
implementation of time limits on individuals and families coming to them for help. Sixty-
nine percent of the respondents described their concerns, categorized below.
A number of respondents expressed concerns in the following five categories:
1. Housing: "Housing is a huge problem because of high rents and low incomes." "We
are very concerned about families maintaining their housing without cash
assistance."
2. Shortness of time-limits: "Three years lifetime limit may not always be sufficient time
to achieve financial stability and permanent self-reliance." "Families will not have
enough time to become stable, find housing, and become employed before being
forced to leave FEP due to time limits." "There are multiple problems in these
families' lives, and it takes longer to help them improve their situations."
3. Low paying jobs: "All of our families are employed. All of them are below the median
income. We serve families that are 30%-50% of median income." "We are
concerned about working poor families remaining in low paying jobs rather than
having the opportunities for education that would propel them out of poverty."
4. Can offer only one-time help: "We are worried that requests go unanswered due to
our limited resources."
5. Welfare of children: "We do not need any more kids at risk for any reason. This law
is short-sighted and quite frankly ‘sucks'." "Legal children of undocumented aliens
have special heath care needs that are not being met. This is a travesty." "When
families lose their financial assistance, they lose their housing and their children. This
marks the break up of poor families and children are the ones suffering."
One respondent took the opportunity to list overarching concerns: people lack
necessary skills for self-sufficiency; lack of food; that the economy will suffer a turndown;
educational needs not being met; the emotional components of welfare not being
addressed; families lacking in social skills; people not being treated like human beings;
some are simply unable to change their situation; resources for those who cannot work
are taken by those who will not work; needy and desperate people might abuse the
system, giving false information in the hopes of getting more help from churches.
66
Summary: Looking at the first three months of 2000, after time limits were first
imposed on December 31, 1999, and comparing with the first and last quarters of 1999, overall
increases in requests for assistance netted no dramatic change. While a moderate number of
organizations reported increases in funds and services rendered, slight changes were reported
in the characteristics of clients requesting assistance. Charitable leaders reported slightly more
requests from single mothers, from immigrants, and that the situations of people asking for help
were notably more complex.
In addition, requests for assistance from two parent families decreased slightly, while
requests from one-parent families increased slightly; requests decreased slightly from families
with two employed adults while increasing moderately from families with one or no employed
adult; and requests also increased from those on government assistance.
As predicted by respondents to the initial survey, increases in requests for food, cash,
and housing were noted. However, by the end of 1999, requests for education, clothing, and
assistance with abuse/domestic violence situations outpaced requests for housing assistance.
The rise in requests for assistance with domestic violence/abuse, from 10th rank in comparison
with January-March 1999 to 5th rank in comparison with October-December 1999, as the
December 31 deadline loomed, is important to highlight. This indeed is a troubling finding, as
it, coupled with the rise in requests from single mothers, may possibly reflect an increasing
incidence of women returning to abusive situations as they see no other help available.
Charitable leaders, in their written comments, expressed concerns regarding housing,
the shortness of TANF time limits, the prevalence of low-paying jobs that do not cover expenses
for families, and the well-being of children. These leaders also expressed frustration over their
ability to provide only short-term assistance while these families had long-term needs.
SECOND POST-IMPLEMENTATION SURVEY FINDINGS AND DISCUSSION: CHANGES
DURING THE FIRST SIX MONTHS OF 2000.
We are seeing approximately 30% more working poor clients.---Charitable Leader
In order to enlarge our understanding of the impact of the implementation of time limits,
we now turn to the findings of the second post-implementation survey. The time limits in Utah
began to expire on December 31, 1999. The first post-implementation survey examined the
extent of any impact on charitable organizations during the first three months after the
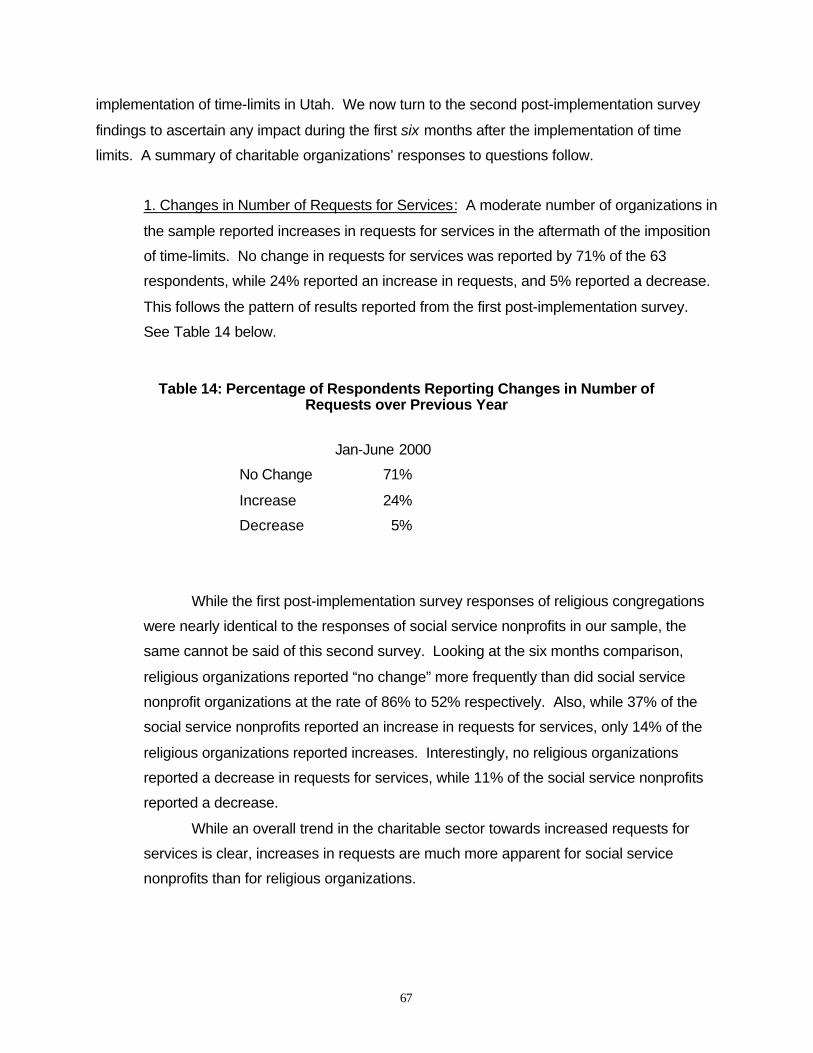
67
implementation of time-limits in Utah. We now turn to the second post-implementation survey
findings to ascertain any impact during the first six months after the implementation of time
limits. A summary of charitable organizations’ responses to questions follow.
1. Changes in Number of Requests for Services: A moderate number of organizations in
the sample reported increases in requests for services in the aftermath of the imposition
of time-limits. No change in requests for services was reported by 71% of the 63
respondents, while 24% reported an increase in requests, and 5% reported a decrease.
This follows the pattern of results reported from the first post-implementation survey.
See Table 14 below.
Table 14: Percentage of Respondents Reporting Changes in Number ofRequests over Previous Year
Jan-June 2000
No Change 71%
Increase 24%
Decrease 5%
While the first post-implementation survey responses of religious congregations
were nearly identical to the responses of social service nonprofits in our sample, the
same cannot be said of this second survey. Looking at the six months comparison,
religious organizations reported “no change” more frequently than did social service
nonprofit organizations at the rate of 86% to 52% respectively. Also, while 37% of the
social service nonprofits reported an increase in requests for services, only 14% of the
religious organizations reported increases. Interestingly, no religious organizations
reported a decrease in requests for services, while 11% of the social service nonprofits
reported a decrease.
While an overall trend in the charitable sector towards increased requests for
services is clear, increases in requests are much more apparent for social service
nonprofits than for religious organizations.
68
2. Changes in Funds and Services Expended: To examine further the dynamic of
changes in demands for services, organizations were asked if the total amount of funds
and services expended for social services during the first six months of 2000 had
increased or decreased over each of the 1999 half-year periods. January-June 2000
Compared with January-June 1999: Comparing with January - June of 1999, 41.6% of
the organizations reported no change in the January-June of 2000 time period.
Reporting increases in funds and services expended were 48.3% of the organizations,
while 10% reported that such expenditures decreased.
Of the organizations in the sample reporting an increase, 51.7% reported the
increase to be slight: 10% or under. Another 27.6% reported somewhat moderate
increases of 11-20%; 13.8% reported moderate increases of 21-30%; and 3.5%
indicated only that there had been an increase with no percentage designated. An
average of the increases over the first half of 1999 seem to be in the moderate range for
all respondents.
Of the six organizations in our sample reporting decreases, most indicated that
the decreases were slight, again 10% or less, while a third of the sample indicated the
decreases in the somewhat moderate range of 11-20%. The decreases in funds and
services over the first half of 1999 appear to be slight.
January -June 2000 Compared with July-December 1999: Turning now to comparisons
in expenditures for funds and services between the second half of 1999 and January-
June of 2000, 50.9% of the organizations reported no change. This represents an
increase in those reporting no change by approximately 8% over the comparison with
the January-June 1999 time period. Reporting increases in funds and services
expended were 40.4% of the organizations, a respective drop of approximately 8%,
while 8.8% reported that such expenditures decreased.
Of the organizations in the sample reporting an increase, 52.2% reported the
increase to be slight: 10% or under. Another 30.4% reported somewhat moderate
increases of 11-20%; 13.0% reported moderate increases of 21-30%; and 4.3% reported
higher increases. Mirroring the comparisons with the first six months of 1999, an
average of the increases over the second half of 1999 seems to be in the somewhat
moderate range.
Of the few organizations in our sample reporting decreases, most indicated that
the decreases were slight, again 10% or less. Like the first half of 1999, the decreases
in funds and services over the second half of 1999 appear to be slight.
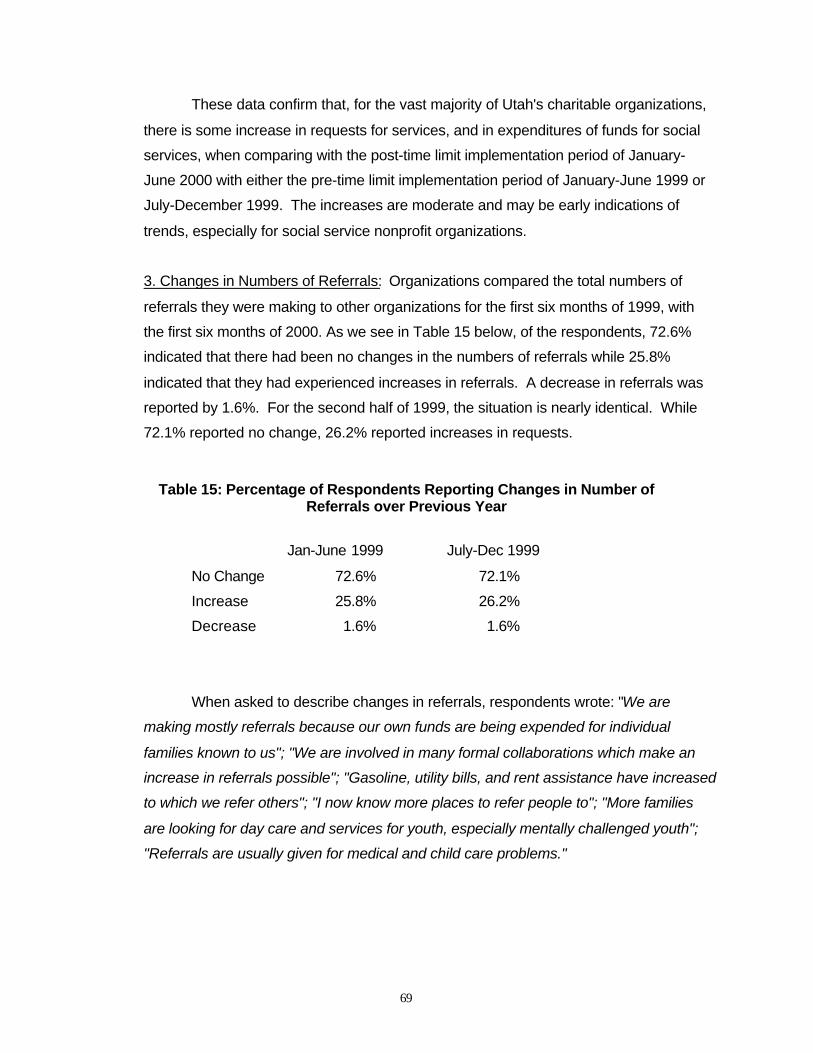
69
These data confirm that, for the vast majority of Utah's charitable organizations,
there is some increase in requests for services, and in expenditures of funds for social
services, when comparing with the post-time limit implementation period of January-
June 2000 with either the pre-time limit implementation period of January-June 1999 or
July-December 1999. The increases are moderate and may be early indications of
trends, especially for social service nonprofit organizations.
3. Changes in Numbers of Referrals: Organizations compared the total numbers of
referrals they were making to other organizations for the first six months of 1999, with
the first six months of 2000. As we see in Table 15 below, of the respondents, 72.6%
indicated that there had been no changes in the numbers of referrals while 25.8%
indicated that they had experienced increases in referrals. A decrease in referrals was
reported by 1.6%. For the second half of 1999, the situation is nearly identical. While
72.1% reported no change, 26.2% reported increases in requests.
Table 15: Percentage of Respondents Reporting Changes in Number ofReferrals over Previous Year
Jan-June 1999 July-Dec 1999
No Change 72.6% 72.1%
Increase 25.8% 26.2%
Decrease 1.6% 1.6%
When asked to describe changes in referrals, respondents wrote: "We are
making mostly referrals because our own funds are being expended for individual
families known to us"; "We are involved in many formal collaborations which make an
increase in referrals possible"; "Gasoline, utility bills, and rent assistance have increased
to which we refer others"; "I now know more places to refer people to"; "More families
are looking for day care and services for youth, especially mentally challenged youth";
"Referrals are usually given for medical and child care problems."
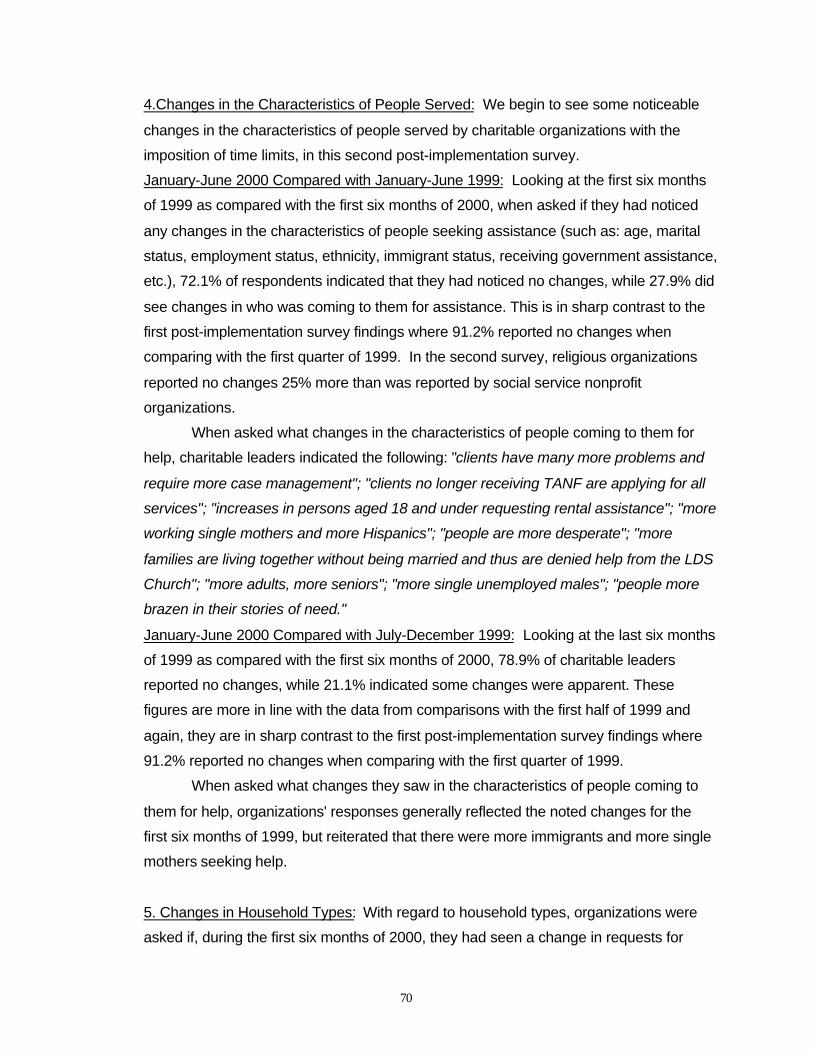
70
4.Changes in the Characteristics of People Served: We begin to see some noticeable
changes in the characteristics of people served by charitable organizations with the
imposition of time limits, in this second post-implementation survey.
January-June 2000 Compared with January-June 1999: Looking at the first six months
of 1999 as compared with the first six months of 2000, when asked if they had noticed
any changes in the characteristics of people seeking assistance (such as: age, marital
status, employment status, ethnicity, immigrant status, receiving government assistance,
etc.), 72.1% of respondents indicated that they had noticed no changes, while 27.9% did
see changes in who was coming to them for assistance. This is in sharp contrast to the
first post-implementation survey findings where 91.2% reported no changes when
comparing with the first quarter of 1999. In the second survey, religious organizations
reported no changes 25% more than was reported by social service nonprofit
organizations.
When asked what changes in the characteristics of people coming to them for
help, charitable leaders indicated the following: "clients have many more problems and
require more case management"; "clients no longer receiving TANF are applying for all
services"; "increases in persons aged 18 and under requesting rental assistance"; "more
working single mothers and more Hispanics"; "people are more desperate"; "more
families are living together without being married and thus are denied help from the LDS
Church"; "more adults, more seniors"; "more single unemployed males"; "people more
brazen in their stories of need."
January-June 2000 Compared with July-December 1999: Looking at the last six months
of 1999 as compared with the first six months of 2000, 78.9% of charitable leaders
reported no changes, while 21.1% indicated some changes were apparent. These
figures are more in line with the data from comparisons with the first half of 1999 and
again, they are in sharp contrast to the first post-implementation survey findings where
91.2% reported no changes when comparing with the first quarter of 1999.
When asked what changes they saw in the characteristics of people coming to
them for help, organizations' responses generally reflected the noted changes for the
first six months of 1999, but reiterated that there were more immigrants and more single
mothers seeking help.
5. Changes in Household Types: With regard to household types, organizations were
asked if, during the first six months of 2000, they had seen a change in requests for
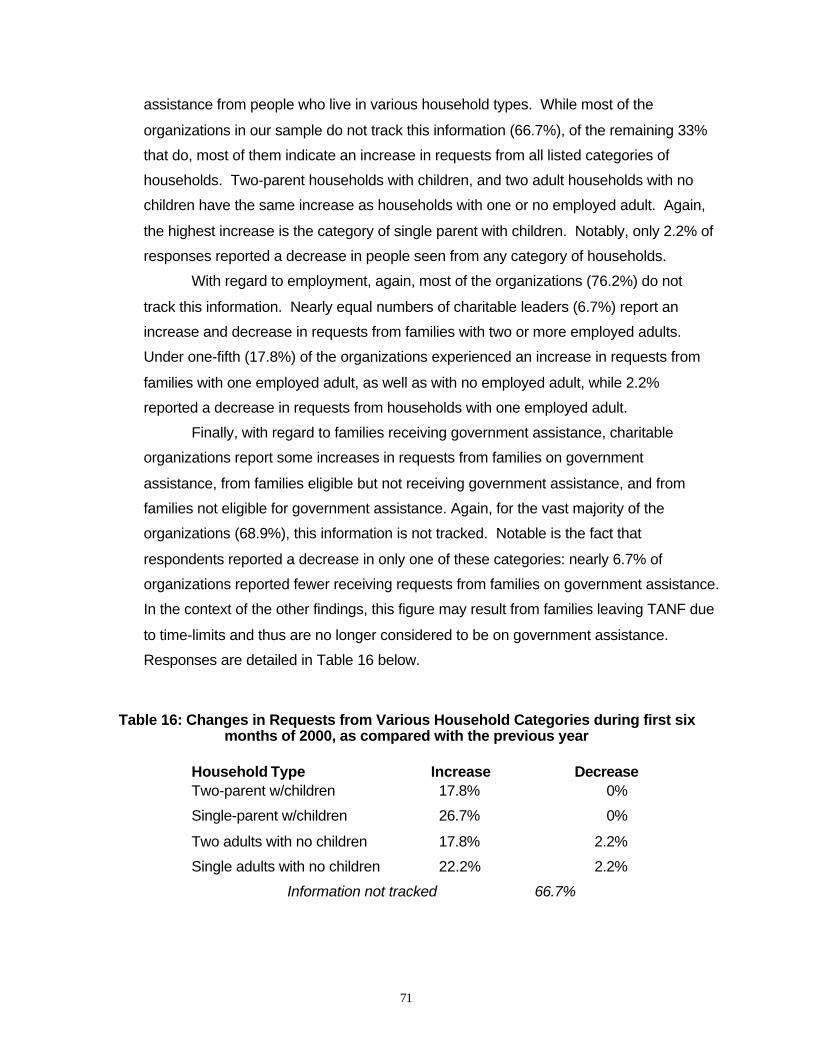
71
assistance from people who live in various household types. While most of the
organizations in our sample do not track this information (66.7%), of the remaining 33%
that do, most of them indicate an increase in requests from all listed categories of
households. Two-parent households with children, and two adult households with no
children have the same increase as households with one or no employed adult. Again,
the highest increase is the category of single parent with children. Notably, only 2.2% of
responses reported a decrease in people seen from any category of households.
With regard to employment, again, most of the organizations (76.2%) do not
track this information. Nearly equal numbers of charitable leaders (6.7%) report an
increase and decrease in requests from families with two or more employed adults.
Under one-fifth (17.8%) of the organizations experienced an increase in requests from
families with one employed adult, as well as with no employed adult, while 2.2%
reported a decrease in requests from households with one employed adult.
Finally, with regard to families receiving government assistance, charitable
organizations report some increases in requests from families on government
assistance, from families eligible but not receiving government assistance, and from
families not eligible for government assistance. Again, for the vast majority of the
organizations (68.9%), this information is not tracked. Notable is the fact that
respondents reported a decrease in only one of these categories: nearly 6.7% of
organizations reported fewer receiving requests from families on government assistance.
In the context of the other findings, this figure may result from families leaving TANF due
to time-limits and thus are no longer considered to be on government assistance.
Responses are detailed in Table 16 below.
Table 16: Changes in Requests from Various Household Categories during first sixmonths of 2000, as compared with the previous year
Household Type Increase DecreaseTwo-parent w/children 17.8% 0%
Single-parent w/children 26.7% 0%
Two adults with no children 17.8% 2.2%
Single adults with no children 22.2% 2.2%
Information not tracked 66.7%
72
Table 16 (continued): Changes in Requests from Various Household Categories duringfirst six months of 2000, as compared with the previous year
Two or more employed adults 6.7% 6.7%
One employed adult 17.8% 2.2%
No employed adults 17.8% 0%
Information not tracked 76.2%
Receiving government assist. 11.1% 6.7%
Eligible for GA but not receiving 8.9% 0%
Not eligible 11.1% 0%
Information not tracked 68.9%
What is evident from these data are early indications of increases in certain types
of households seeking assistance. These early indications include increases in requests
from all household types; increases in requests from households with one employed
adult as well as no employed adult; and increases in requests from households
regardless of whether they are receiving government assistance or are eligible for same.
Two changes are of most interest. First is the slight decrease in those seeking help who
are receiving government assistance, and second is the increase in single parents
requesting assistance. Both of these may be a reflection of time limits and households
needing additional assistance since they are no longer on the welfare rolls.
6. Changes in Services Requested: Here we examine changes in requests for services
since the imposition of time limits. As is recalled from Table 14, a sizable majority of
organizations, 71%, indicated no change, while 24% reported an increase in requests
and 5% reported an actual decrease. Thus, 29% of respondents reported a change in
requests for services.
To investigate this further, respondents were asked to indicate by services
requested and by time frame (January-June 1999 and July-December 1999) increases
or decreases in requests, and by what percentage. In terms of requests for specified
services, the total number of change indications were 195; of these, 180 (92.3%)
indicated an increase in requests for specified services, while 15 (7.7%) indicated a
decrease in requests for specified services. See Table 17 for distribution of change
indications from those respondents reporting a change.
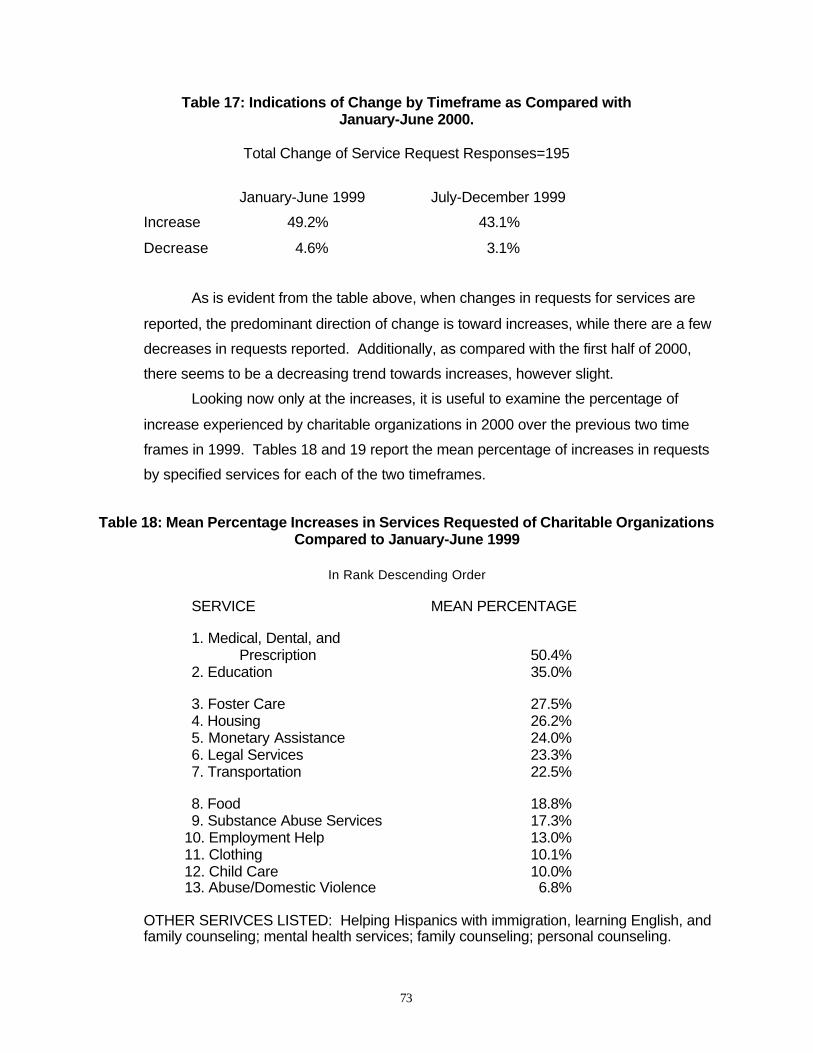
73
Table 17: Indications of Change by Timeframe as Compared withJanuary-June 2000.
Total Change of Service Request Responses=195
January-June 1999 July-December 1999
Increase 49.2% 43.1%
Decrease 4.6% 3.1%
As is evident from the table above, when changes in requests for services are
reported, the predominant direction of change is toward increases, while there are a few
decreases in requests reported. Additionally, as compared with the first half of 2000,
there seems to be a decreasing trend towards increases, however slight.
Looking now only at the increases, it is useful to examine the percentage of
increase experienced by charitable organizations in 2000 over the previous two time
frames in 1999. Tables 18 and 19 report the mean percentage of increases in requests
by specified services for each of the two timeframes.
Table 18: Mean Percentage Increases in Services Requested of Charitable OrganizationsCompared to January-June 1999
In Rank Descending Order
SERVICE MEAN PERCENTAGE
1. Medical, Dental, andPrescription 50.4%
2. Education 35.0%
3. Foster Care 27.5%4. Housing 26.2%5. Monetary Assistance 24.0%6. Legal Services 23.3%7. Transportation 22.5%
8. Food 18.8%9. Substance Abuse Services 17.3%
10. Employment Help 13.0% 11. Clothing 10.1% 12. Child Care 10.0% 13. Abuse/Domestic Violence 6.8%
OTHER SERIVCES LISTED: Helping Hispanics with immigration, learning English, andfamily counseling; mental health services; family counseling; personal counseling.
74
As indicated by this table, by far the highest increase in services reported is in
the medical, dental, and prescription area. The reported mean percentage is over 15%
above the second ranked service, education. Foster care ranks third.
This is the first appearance in any of the post-implementation surveys of the
medical, dental, prescription services as top ranked. This possibly may reflect the
impression by the poor that less medical assistance was available to them, as well as
their increased desperation to ensure care for their children as parental ability to support
them is compromised. Education has consistently been designated as near the top of
the rankings, indicating perhaps the need to prepare for work or advancement.
The appearance of foster care as third ranked is an important development; in
the first post-implementation survey it was consistently ranked last.
It is useful now to examine the responses whereby organizations compared their
January-June 2000 requests with requests they had received from July-December of
1999 when time limits were approaching (see Table 19).
From these data, we can see shifts in requests as time-limits loom closer during
the last months of 1999. The most prominent service from the first half of 1999, medical
care, has fallen from its top rank to #7, while foster care maintains in the top three.
These findings contrast sharply with the first post-implementation survey results, and
may reflect the increasing sense of desperation as parents coming off of time limits try to
arrange for their children through foster care.
Increases in requests for services were not the only changes that charitable
organizations reported. A few organizations also indicated decreases in requests for
services during the first half of 2000, as compared with the first half of 1999 and with the
last half of 1999. For nonprofits approximately half of the 13 services listed in the survey
were identified as decreasing. For religious organizations, only two of 13 services were
identified as decreasing.
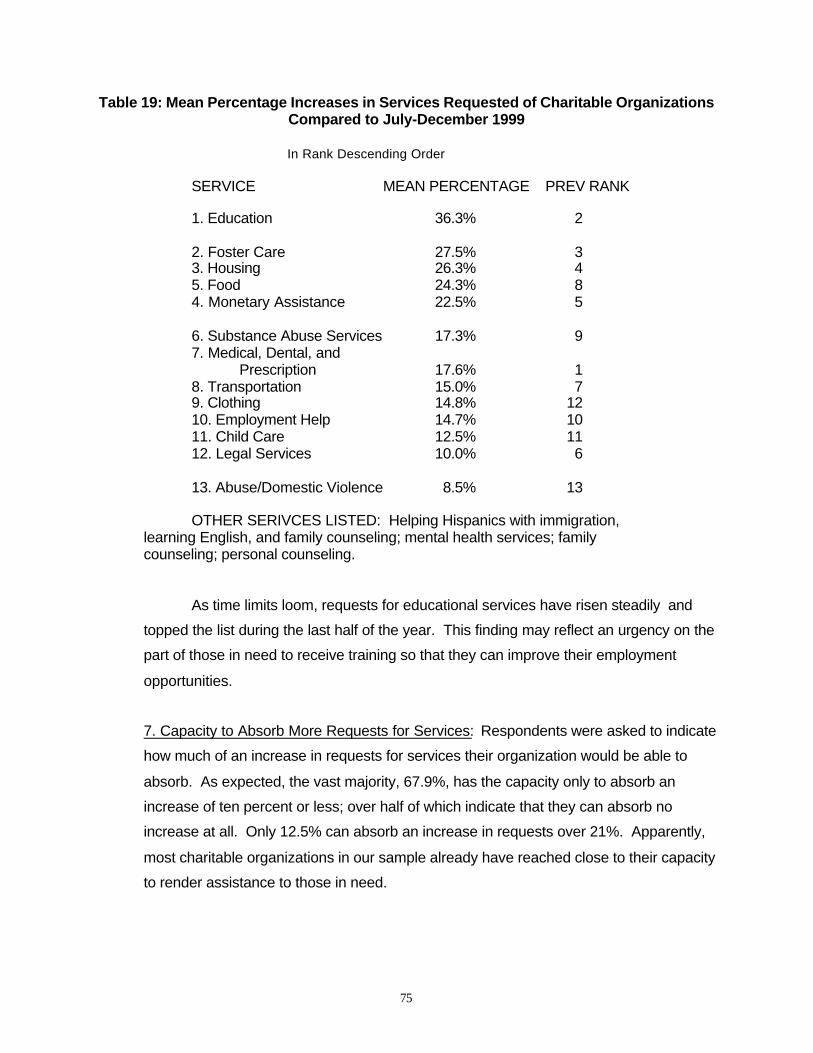
75
Table 19: Mean Percentage Increases in Services Requested of Charitable OrganizationsCompared to July-December 1999
In Rank Descending Order
SERVICE MEAN PERCENTAGE PREV RANK
1. Education 36.3% 2
2. Foster Care 27.5% 33. Housing 26.3% 45. Food 24.3% 84. Monetary Assistance 22.5% 5
6. Substance Abuse Services 17.3% 97. Medical, Dental, and
Prescription 17.6% 18. Transportation 15.0% 79. Clothing 14.8% 1210. Employment Help 14.7% 1011. Child Care 12.5% 1112. Legal Services 10.0% 6
13. Abuse/Domestic Violence 8.5% 13
OTHER SERIVCES LISTED: Helping Hispanics with immigration,learning English, and family counseling; mental health services; familycounseling; personal counseling.
As time limits loom, requests for educational services have risen steadily and
topped the list during the last half of the year. This finding may reflect an urgency on the
part of those in need to receive training so that they can improve their employment
opportunities.
7. Capacity to Absorb More Requests for Services: Respondents were asked to indicate
how much of an increase in requests for services their organization would be able to
absorb. As expected, the vast majority, 67.9%, has the capacity only to absorb an
increase of ten percent or less; over half of which indicate that they can absorb no
increase at all. Only 12.5% can absorb an increase in requests over 21%. Apparently,
most charitable organizations in our sample already have reached close to their capacity
to render assistance to those in need.
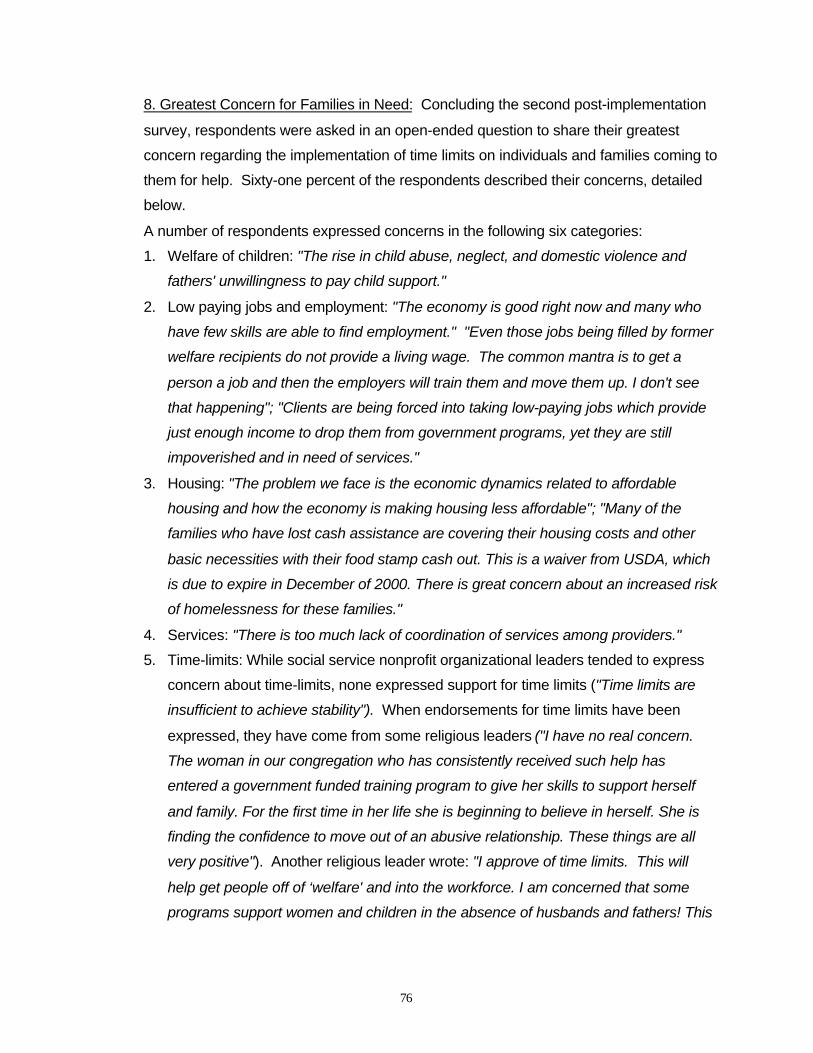
76
8. Greatest Concern for Families in Need: Concluding the second post-implementation
survey, respondents were asked in an open-ended question to share their greatest
concern regarding the implementation of time limits on individuals and families coming to
them for help. Sixty-one percent of the respondents described their concerns, detailed
below.
A number of respondents expressed concerns in the following six categories:
1. Welfare of children: "The rise in child abuse, neglect, and domestic violence and
fathers' unwillingness to pay child support."
2. Low paying jobs and employment: "The economy is good right now and many who
have few skills are able to find employment." "Even those jobs being filled by former
welfare recipients do not provide a living wage. The common mantra is to get a
person a job and then the employers will train them and move them up. I don't see
that happening"; "Clients are being forced into taking low-paying jobs which provide
just enough income to drop them from government programs, yet they are still
impoverished and in need of services."
3. Housing: "The problem we face is the economic dynamics related to affordable
housing and how the economy is making housing less affordable"; "Many of the
families who have lost cash assistance are covering their housing costs and other
basic necessities with their food stamp cash out. This is a waiver from USDA, which
is due to expire in December of 2000. There is great concern about an increased risk
of homelessness for these families."
4. Services: "There is too much lack of coordination of services among providers."
5. Time-limits: While social service nonprofit organizational leaders tended to express
concern about time-limits, none expressed support for time limits ("Time limits are
insufficient to achieve stability"). When endorsements for time limits have been
expressed, they have come from some religious leaders ("I have no real concern.
The woman in our congregation who has consistently received such help has
entered a government funded training program to give her skills to support herself
and family. For the first time in her life she is beginning to believe in herself. She is
finding the confidence to move out of an abusive relationship. These things are all
very positive"). Another religious leader wrote: "I approve of time limits. This will
help get people off of ‘welfare' and into the workforce. I am concerned that some
programs support women and children in the absence of husbands and fathers! This
77
pays people for maintaining illicit relationships! We need programs to assist intact
families."
6. Can offer limited help: "I am concerned that people will go hungry, be malnourished
and/or lose their housing." A congregational leader noted: “Greatest concern being
a responsible steward is helping people in need and not being taken advantage of.”
Summary: The second post-implementation survey examined the extent of any impact
of welfare reform on the first six months after time limits were imposed. The picture from the
first six months of 2000 as compared with 1999 show that charitable organizations are seeing
some increases in requests for services, in expenditures of funds and services, and in referrals.
Between twenty and thirty percent of respondents report some change in clients asking for help,
noting more single mothers and more immigrants seeking help. Slight increases were reported
in requests from all household types, single parents with children, families with one or no
employed adult, and a decrease of those on government assistance.
In terms of types of services requested, it is here that we see two important
developments. The first is a surprising increase in requests for medical, dental, and prescription
assistance, reflecting perhaps the inability to access medical help, whether through loss of
medicaid or private health insurance is not known. While families are on TANF, their case
workers assist them in arranging for other government services for which they are eligible, such
as medicaid and food stamps. Once families leave the welfare rolls, they often have no one to
connect them to other assistance.
The second is a dramatic increase in requests for foster care services, which may signal
escalating concerns of parents over taking care of their children. This reinforces the suspicion
that parents may fear losing their children due to poverty reasons and that this dynamic may be
exacerbated by welfare reform. 77 These findings contrast sharply with the first post-
implementation survey results, where foster care ranked last.
77 According to Taylor and Barusch (2000) Social Research Institute report, nearly 20% of their sample ofUtah welfare recipients reported that their children had gone to live with someone else. Twelve percent ofthose respondents reported that their children left the home because they could not afford to care for thechild, while 18% reported that their children were removed by the Division of Child Protective Services. Atthe same time, data from the Utah Department of Human Services point out that the number of youth infoster care has dropped from December 1997 to December 2000.

78
79
VI. SUMMARY OF FINDINGS
The children of our low-income clients are being taken away by DCFS and put in foster care,mostly because the families cannot afford to support their children.
---Charitable Leader
This study presents results of extensive research on the capacity of the charitable
welfare sector in Utah. Data from focus groups, interviews, and surveys were examined, as well
as administrative data. The qualitative findings are reported in the CPPA report, Utah's
Charitable Organizations Face Welfare Reform: Concerns of Charitable Leaders (DiPadova,
2000). The findings reported below reflect the information received during that study.
A summary of the findings of this research is as follows, beginning with the findings of
the initial capacity survey and then with findings from the post-implementation surveys.
INITIAL CAPACITY STUDY
Composition of the charitable welfare sector: The charitable welfare sector in Utah
consists of religious congregations and social service nonprofit organizations. The LDS welfare
sector was found to account for two-thirds of the capacity, with other religious congregations
and social service nonprofits providing the balance. All available evidence points to welfare
services by the religious subsector being rendered on an humanitarian basis without respect to
the religious affiliation (or non-affiliation) of recipients. However, the fact that well over two-
thirds of the charitable capacity in Utah is faith-based may hinder accessibility to those services
by those who, for a variety of reasons, fear or do not know how to approach clergy for help, or
who are not religiously affiliated.
• Different types of data were available from each subsector grouping: the LDS Church
provided primarily administrative data and nonprofit organizations tracked details of
recipients and services, which were reported to us. Religious organizations as a whole keep
fewer records of services than do social service nonprofit organizations.
• Social service nonprofits report a greater knowledge of welfare reform than do religious
congregational leaders; thus the charitable welfare sector in Utah is administered primarily
by congregational leaders who reportedly know markedly less about welfare policy than do
leaders of social service nonprofit organizations.
80
• Religious organizations reported little or no increase in requests for services, while social
service nonprofits reported increases, reflecting both the targeted responsibilities of
nonprofits and the wide range of people served by the religious welfare sector.
• The charitable sector provides numerous services in striking quantities. While it is clear that
many are served numerous times, the sheer volume of service provided is impressive.
• The sheer numbers served by the charitable sector suggest that a far greater array of
people is being assisted than those who are or have been on government assistance. At
the same time, many religious leaders reported increasing services to middle class families,
while reporting no change in the number of requests overall. While the reasons for this
volume and the extent of assistance rendered to middle class families is not fully known,
these data certainly suggest that charitable organizations assist others than those
considered poor.
Characteristics of those served: Charitable leaders report assisting a wide range of
families, including those who never approach the government for help, families who are
receiving government assistance, and families before and after receiving government help.
• Nearly two-thirds of those receiving services from the charitable sector have children
living at home.
• Nearly 28% of those receiving services from the charitable sector have two working
adults and children.
• Those households receiving services with employed adults outnumber those not
employed by a margin of 2 to 1.
• Most households served are not receiving government assistance; over 5,000 of
these households are reported as being eligible for the those services.
• Charitable leaders reported that the circumstances of those coming for help tended
to be more complex and required more time and resources to address than in the
past.
• Middle class families are seeking charitable assistance.
Contrary to the popular notions regarding those who seek help, the characteristics of
most of those served include families consisting of working adults, who are not on government
assistance, and who have children at home.
Services provided by the charitable welfare sector: The charitable sector provides a
wide array of services to those in need.
81
• Over half of the charitable organizations surveyed provide services to homeless
individuals and families, monetary assistance, transportation, food or clothing.
• Education, employment, and child care—key services related to finding and holding
down jobs—are provided by less than 30% of the organizations surveyed.
• Many charitable organizations report that often they do not provide services
requested and refer applicants to other service providers. Applicants with few
resources may have difficulty getting from place to place seeking help.
Service capacity: The capacity of charitable organizations to serve those in need must
be considered in the context that leaders and others in these organizations want to help people.
• While congregational leaders emphasized the informal assistance rendered to others
through church members as an ever increasing resource, they did express financial
concerns about their capacity to help increasing numbers of people, and were
making preparations.
• Congregational leaders also expressed considerable difficulty with discerning
legitimate needs when help was requested.
• Social service nonprofit organizations reported that over half of their funding comes
from government sources. When governments cut funding, these nonprofits cannot
increase services without additional sources of monetary support.
• Possible strategies for nonprofits include raising more funds and decreasing services
to those in need.
• Most congregational leaders expressed no interest in obtaining government support
for their program through the Charitable Choice provision of PRWORA.
Strategies for the Future: Charitable leaders were asked to indicate what actions
they would take if demand for services were to substantially increase. The strategies reported
were:
• One-third of charitable organizations would raise more funds;
• One-third of charitable leaders would increase staff;
• One-quarter of charitable leaders would reduce services; and
• One-quarter of charitable leaders would expand services.
82
Major concerns: Charitable leaders expressed concerns with regard to the impact of
welfare reform on families in need. Over two-thirds of respondents reported the following
concerns:
• lack of affordable housing;
• charitable organizations’ limited resources to help people; and
• inadequacy of available assistance to those in need.
In addition, the following concerns were frequently noted by charitable leaders:
• The need for long-term assistance to help people;
• Spiritual needs of recipients;
• The challenges of exercising discernment in whether to provide services; and
• Government welfare policy.
Anticipated areas of increased requests for services: Charitable leaders were asked to
indicate what services would likely see an increase in requests, after the implementation of time
limits. Leaders reported that they expected to see more requests for the following, in rank
order:
• Food
• Cash
• Housing
• All services.
Issues Raised by the Findings: Three fundamental issues which merit further study and
discussion are raised by these findings.
• It is clear that religious organizations may be the last resort for many families in
need. Yet religious leaders and other clergy report knowing little about welfare policy.
Therefore, many may be under the misimpression that the welfare system is
fundamentally unchanged. For over six decades, these leaders have known that
most petitioners for help could go to government sources. Now that religious
organizations may be the last resort, they need to fully understand the policies and
the consequences of turning people away. Government agencies have the
responsibility of educating clergy as to their heightened role.
83
• The challenges that are faced by those in need of approaching faith-based charitable
organizations are not fully understood. In Utah, faith-based welfare services are the
most ubiquitous among charitable services. When government services cut back, or
redirected in some ways, religious organizations may be the last resort for those
seeking help. At the same time, as has been pointed out, religious and other such
private organizations that do not receive government funding have every right to
deny anyone who petitions for help, and for any reason.
• Social service nonprofit organizations report that over half of their funding comes
from government sources. Theoretically, this represents public funds that in the past
were used by welfare agencies to assist clients. Currently, those funds are
dispersed to social service nonprofit organizations to assist clients. In addition, the
vast majority of these nonprofits report that they frequently make referrals because
they do not provide the services requested, or they are at capacity.
While the stated purpose of such contracting out is to enhance the quality of
service provision, it is important to consider the issue from the perspective of the
applicant, who with limited resources is trying to figure out where to go to receive
what services. Now s/he cannot receive them from a central government welfare
office, but presumably must travel to various locations.78
The implications of these issues merit further study and include:
knowledge of case workers and nonprofit leaders regarding the location of
the nearest providers, continuity of services, and transportation costs.
SUMMARY OF FINDINGS FROM SURVEYS ADMINISTERED
AFTER THE IMPLEMENTATION OF TIME LIMITS
The thirty-six months lifetime limits in Utah began to be imposed on December 31, 1999.
This research reports the findings of two surveys designed to measure the impact of time limits
on charitable organizations in Utah. While the findings of the initial survey demonstrates that
the charitable sector serves a vast number of people in Utah, and thus the impact of time-limits
would be cushioned (especially among the religious subsector), we see with these surveys
78 While government assistance is typically not dispensed at one central agency location, the fact remainsthat contracting through social service nonprofits represents further dispersion of government-fundedservices. See Ehrenreich (2001) for real life examples of those with little resources trying to obtain help.
84
slight changes in types of services requested, reflecting the altering concerns of people living in
poverty.
First Post-Implementation Survey: The first post-implementation survey examined impact on
the charitable sector of the first three months after the limits were imposed (January-March
2000) with the first three months of 1999 and the last three months of 1999. In terms of capacity
changes, the following were noted:
• Requests for assistance in the first three months of 2000 over 1999 netted no
dramatic change.
• Most organizations reported no change in expenditures of funds, while some
reported increases in expenditures.
• Most organizations reported no change in referrals.
• Most organizations reported no change in the characteristics of people served.
Looking at the first three months of 2000, minor increases in services requested were noted,
comparing with requests in early 1999 and late 1999:
• More requests for monetary assistance, education, clothing, abuse/domestic
violence services, housing, and child care.
• Food continued to be ranked first
• Foster care continued to be ranked last.
Little change was noted in the characteristics of clients served; over 90% of respondents
reported no change. Those who reported a change noted:
• Slightly fewer requests from two-parent families with children.
• Moderately more requests from single-parent families with children.
• Moderately more requests from families with one or no employed adult.
• Moderately more requests from families on and/or eligible for government
assistance.
• Situations of clients were noted to be increasingly complex.
85
Comparing the first three months of 2000 with the first and last parts of 1999, charitable leaders
expressed concerns with regard to welfare reform and families in need. The major concerns
were:
• Housing
• Shortness of time limits
• Low-paying jobs available to the poor
• Their organizations can offer only one-time help
• Welfare of children
Second Post-Implementation Survey: The second post-implementation survey examined the
impact of time limits on the charitable sector for the first six months of 2000, as compared with
the first six months of 1999 and the last six months of 1999. The findings of this survey show
subtle shifts in types of services requested, reflecting the altering circumstances of people living
in poverty.
• Moderate increases in requests for assistance were reported for the first six months
of 2000 over 1999.
• Over a third of nonprofit organizations noted an increase while under 15% of
religious organizations reported an increase.
• Nearly half of the organizations reported increases in funds expended, even with the
very moderate increases in requests for services; over half of the organizations
reported no change. While inflation may possibly be a factor, it has been very low.
Thus, this increase most likely reflects reports of more complex problems among
their clients.
• Most organizations reported no change in referrals.
Slight changes were noted in the characteristics of clients served, with over 25% of the
respondents reporting changes:
• More requests from one-parent families.
• More requests from families with one or no employed adult.
• Slightly more requests from families not eligible for government assistance.
• The situations of clients were noted to be increasingly complex.
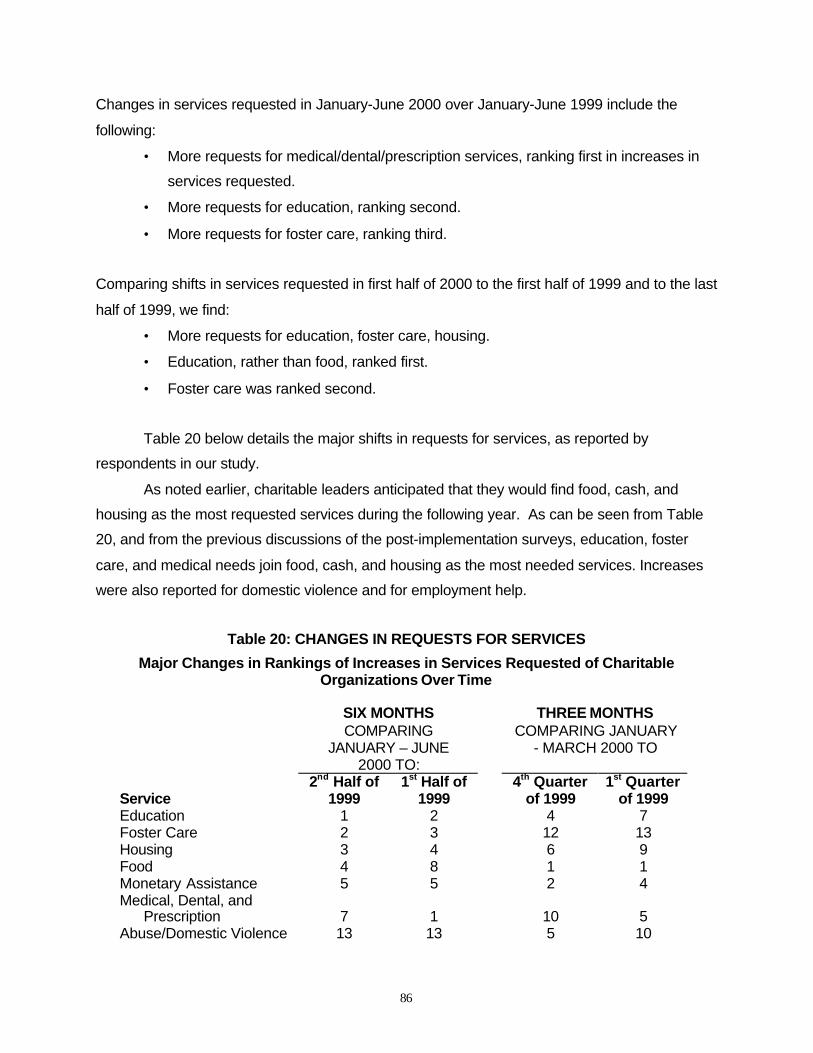
86
Changes in services requested in January-June 2000 over January-June 1999 include the
following:
• More requests for medical/dental/prescription services, ranking first in increases in
services requested.
• More requests for education, ranking second.
• More requests for foster care, ranking third.
Comparing shifts in services requested in first half of 2000 to the first half of 1999 and to the last
half of 1999, we find:
• More requests for education, foster care, housing.
• Education, rather than food, ranked first.
• Foster care was ranked second.
Table 20 below details the major shifts in requests for services, as reported by
respondents in our study.
As noted earlier, charitable leaders anticipated that they would find food, cash, and
housing as the most requested services during the following year. As can be seen from Table
20, and from the previous discussions of the post-implementation surveys, education, foster
care, and medical needs join food, cash, and housing as the most needed services. Increases
were also reported for domestic violence and for employment help.
Table 20: CHANGES IN REQUESTS FOR SERVICES
Major Changes in Rankings of Increases in Services Requested of CharitableOrganizations Over Time
SIX MONTHSCOMPARING
JANUARY – JUNE2000 TO:
THREE MONTHSCOMPARING JANUARY
- MARCH 2000 TO
Service2nd Half of
19991st Half of
19994th Quarter
of 19991st Quarter
of 1999Education 1 2 4 7Foster Care 2 3 12 13Housing 3 4 6 9Food 4 8 1 1Monetary Assistance 5 5 2 4Medical, Dental, and
Prescription 7 1 10 5Abuse/Domestic Violence 13 13 5 10
87
Several important post-implementation developments are apparent, as we look at increases in
requests for:
• medical/dental/prescription services, which may possibly suggest difficulty in
accessing medical assistance;
• foster care, perhaps reflecting increased concerns of parents over taking care of their
children; and
• help with abuse/domestic violence. Though reports of increases were temporary,
these reports still fuel concerns that women are going back to abusive relationships.
Regarding the issue of how much of an increase in requests for services can be absorbed:
• Two-thirds of respondents reported the capacity to absorb only 10% or less, with half
of the respondents reporting they can absorb no more increases; and
• Less than 15% of the charitable organizations reported that they can absorb an
increase of over 20%.
When comparing the first six months of 2000 with the first and last halves of 1999, charitable
leaders expressed concerns with regard to welfare reform and families in need. The major
concerns were, in ranked order:
• Welfare of children;
• Low-paying jobs and employment;
• Housing;
• Lack of coordination of services among providers, government and nongovernment;
• Time-limits; and
• Their ability to provide only limited help.
Additional Issues Raised by the Findings: Several fundamental issues which merit
further study and discussion are raised by these findings. In addition to the previous issues
raised, the following are apparent:
• Charitable organizations are seeing some increases in requests for services, in
expenditures of funds and services, and in referrals. The impact of time limits and
other economic pressures on people seeking assistance needs to be fully
researched.
88
• In terms of types of services requested, we find a surprising increase in requests for
medical, dental, and prescription assistance. The impact of being removed from the
welfare rolls on the accessibility of other government services for which one is
eligible, needs to be fully addressed.
• We also find an increase in requests related to domestic violence and abuse, the
reasons for which must be fully delineated and addressed by policymakers.
• We also find an increase in requests for foster care services, which may signal
escalating concerns of parents over taking care of their children. This needs to be
fully explored.
89
VII. CONCLUSION
People forget that welfare is about children.---Charitable Leader
This research examines the impact of welfare reform on charitable organizations in Utah.
The entire charitable sector was found to administer a wide array of critical services to a sizable
portion of Utah's population, including families with both parents employed and middle-class
families.
This study finds the charitable welfare sector in Utah to be divided into three subparts:
the LDS welfare subsector; other religious congregations; and non faith-based social service
nonprofit organizations. The LDS welfare subsector, from which researchers were not able to
collect congregational survey data, was estimated to account for approximately two-thirds of
Utah's charitable welfare capacity. Charitable organizations in Utah were found to collaborate
fully with one another, making frequent referrals across organizations and granting support in a
myriad of ways.
Welfare policies in retreat from government's decades-old responsibility of assisting
those in need, intensify reliance of citizens on charitable organizations. Thus, the consequential
nature of the efforts of charitable organizations is even more pronounced and the capacity of
these organizations to respond to increasing numbers of requests for services is an important
issue. By and large, the surveyed charitable organizations reported limited capacity to expand
their services without additional funding support.
Given the striking numbers of people served by the charitable sector, it is highly
implausible that the vast use of charitable services is solely a function of welfare reform. A wide
variety of people seek charitable help; their differences defy stereotyping and cannot be easily
categorized. In addition to low-income families, people on welfare, the working poor, and
immigrant groups, those seeking assistance are also reported to come from lower-middle and
middle-income families.
Charitable leaders report shifting trends in requests for services, in the wake of time limit
implementation. These shifts supply preliminary indications that people in need may be more
subjected to domestic violence and perhaps to the prospect of losing their children than
originally anticipated. In addition, they have increasing medical, educational and employment
needs.
90
The work of the charitable sector is as substantial as it is laudable. For the most part,
charitable organizations have been making substantial contributions to those in need for
generations—long before the 1996 federal welfare reform legislation. The expertise and
knowledge of charitable leaders in assisting those in need from all circumstances could be
useful information in framing and examining public welfare policy. However, their expertise is
seldom harvested in a systematic fashion by government policy makers.
Demands on charitable organizations seem to be a function of far more pervasive
economic shifts rather than welfare reform alone. This is evidenced in part by the large
numbers of individuals and families assisted by charitable organizations and by the high
percentages of families filing for bankruptcy in Utah over the past decade. As sudden
unemployment due to corporate downsizing or divorce has driven up debt, some families seek
out food pantries as one way to try to make ends meet. Thus we have some reports that
charitable organizations are increasingly assisting those from the middle-class economic strata
of our society; indeed, we may be witnessing the rise of “middle-class welfare.”
While middle class welfare is not measured by any of the major economic indicators, it
makes sense that charitable organizations would be the first sector in our society to detect this
phenomenon. Embarrassed by their plight, middle class families do not talk openly about their
personal economic straits, and instead quietly approach charity for help after all other recourses
are exhausted–including their debt limits.
Notable also is the fact that charitable organizations assist many who are eligible for
government assistance but who do not apply for help. As a case in point, charitable leaders
reported that some TANF-eligible young mothers with infants, facing a three- year lifetime limit
for assistance, opt not to seek government help at this time. Instead, they decide to wait until
the child is older, eating more, and thus more expensive to care for. Some women became
TANF-eligible when they left physically and emotionally abusive husbands/boyfriends, seeking
their safety and the safety of their children. As they reach their time limits, they may be placed
in a financial crisis and some will return to their husbands/boyfriends so their children can eat.
In the process they will endanger their own and their children’s safety.
There is a distinct difference between a family being off of the welfare rolls, and being
self-sufficient. It is clear that many leave the welfare rolls to join the ranks of the working poor,
with few opportunities to make a family-sustaining income. These families, too, are assisted by
charitable organizations. Many individuals and families in Utah served by charitable
organizations are working full time at non-family sustaining wages. Having a minimum wage job
while providing for small children, with predictable difficulties in child care and transportation,
91
coupled with costly housing, does not lead to self-sufficiency. While TANF provides for job-
training, the program does not encourage higher education attainment, long recognized as
important to one's future earnings potential and considered key to closing the income gap.
The implications of increased responsibility given to the charitable sector by government
needs to be fully explored. For those social service nonprofits under government contract to
provide specific welfare services, the consequences of citizens’ looking for services in scattered
locations are yet to be investigated. Although fine scholarly work has been done on the
intricacies of the contracting relationship, accountability, and the issue of when private
contractors legally become agents of the government, it is not clear that these intricacies are
fully understood.
As is typical in other states, the majority of the Utah's charitable welfare sector is
religiously based. All indications point to substantial services being rendered eagerly and
willingly. As Larry Crenshaw, Director of Planning and Administration of the LDS Church’s
Welfare Services Department, pointed out in a 2001 interview, historically Utah has been an
unusually generous community, eager to assist others. While this has been the case of the LDS
tradition, he suggested that it has been especially true of other religious and community
traditions. In fact, Father Terence Moore, addressing CPPA's Public Policy Forum in Salt Lake
City on March 12, 1999, pointed out that: "Our common faith traditions call us to practice social
justice. We must ask, where is the justice and equity when we build up large budget surpluses
in a thriving economy and dole out the scraps from our tables with ever increasing stinginess?"
Elder Alexander B. Morrison (2000), in an address at Brigham Young University, pointed out
that: "The responsibility to care for the poor and needy lies at the very heart of the Christian
gospel...In addition to refraining from evil, true disciples of the Master wear out their lives in the
service of others."
However, it must be remembered that in the final analysis, many charitable institutions
have a right to turn away anyone who seeks help, on any basis unrelated to need, while
governments do not have such discretion. This is especially the case with religious institutions
not participating in charitable choice funding programs or in other government funding
programs. Strong efforts must be made to apprise clergy of the differences between the prior
government entitlement welfare system as compared with TANF and its lifetime limits.
Additionally, diligent care needs to be taken to assure that help is rendered to those who may
not be comfortable going to religious organizations for help.
So, what do charitable organizations bring to the discussion of social welfare policy?
These organizations bring a focus on the plight of individuals, as distinct and unique in their
92
situations. In contrast, government programs must group and categorize people, in accord with
the explicit requirement that government institutions treat everyone impartially under the law and
bound by principles of equity, fairness, and nondiscrimination.79
Unfortunately, in public policy making, efforts to treat everyone the same lend
themselves to categorization. It is necessary to categorize people for eligibility, for example, as
is the case for welfare services. Such categorization can foster a failure to view people in need
as diverse, and may encourage negative stigmatization,80 resulting in the "social construction of
difference...whereby we mistake socially constructed categories for natural distinctions" (Katz,
1989:5-6).
Thus, an important value that charitable leaders bring to the discussion table is the
tendency to see the diversity among citizens in need, because categorization is not part of their
organizational service mandate. As we conclude this report, a number of questions prompted
by the concerns of charitable leaders, and reflecting their focus on the uniqueness of
individuals, clearly merit further investigation, only a few of which are mentioned here:
Ø What happens to children of TANF-families who lose their eligibility? To what extent
are they more vulnerable to being taken from their parents?
Ø Over the long-term, will the 20 percent extension be sufficient to care for those
needing additional assistance?
Ø Due to a lack of options, is TANF forcing women back into abusive situations, and if
so, to what extent?
Ø What is the impact of being hired into a job, and then being fired–out of no fault of
one's own–due to shifting economic forces? How does this affect one's future ability
to become self-sufficient?
Ø What services are appropriate and reasonable for nonprofits and for religious
institutions to provide?81 What is the role of government in service provision?
Ø What are the implications of reliance on a largely religious-based charitable sector
for the provision of traditionally-designated government services, such as on-going
79 In other words, equity and nondiscrimination require that those who fail a professional licensing examshould not be given special consideration because of any circumstances, including wealth, family status,or so forth.80 Hence our society decries mothers not staying home to care for their children, but mandates thatmothers in low-income families go to work, thus consigning their children to nonparental care. Thissuggests that children of poor families are inherently less worthy of their mother's care than are childrenof affluent families. This paradox is a consequence of negative social stigma and an expression of aninability or unwillingness to identify with the poor, a failure to see them as peers in our community.81 See Mangum 2000.
93
financial assistance and other services requiring the skill and training of professional
service providers?
Ø If charitable organizations exercise their discretion and refuse service to a single
mother with children, and that mother has already used up her time limits, where can
she and her children turn?
Ø How can agencies remedy clients’ not being enrolled in other government services
for which they are eligible after they leave the welfare rolls?
Ø What are the differences between the circumstances and needs of middle class
petitioners seeking assistance, compared with lower-class applicants? What are the
implications of these differences and do they compete for the same resources?
Fundamentally, the issues of assisting others are multiple and complex. In our society
these issues are compounded by the dynamics of the New Economy which have produced
large rewards for some but much less for others, jeopardizing the growth of the middle class
while making low wage earners far more vulnerable than in recent decades. While charitable
welfare efforts, coupled with government programs, address some primarily short-term needs,
the fact is that attention by all sectors: business, government, and charitable, must focus on
stability and growth for American families. It is instructive to remember that the majority of the
people to whom welfare assistance (charitable as well as governmental) is rendered–or denied–
are children, and it is in the hands of our children that the future of our society is entrusted.

94
95
BIBLIOGRAPHY
Alexander, J. 1999. "The Impact of Devolution on Nonprofits." Nonprofit Management &Leadership, vol. 10. Fall. Pp. 57-70.
Allen, M. and S. F. Kovaleski. 2001. “Bush Argues Case for Church-based Social Services.”Washington Post. June 26. Page A2.
Ansberg, A. 2001. "By Resisting Layoffs, Small Manufacturers Help Protect Economy", TheWall Street Journal, July 6, pp. A1-A2.
Associated Press. 2001. "Bush to Adjust ‘Faith-Based' Bill. New York Times, June 25.www.nytimes.com/aponline/national/AP-Bush.html.
Babington, C. 2001. "Faith-Based Office Announcement Sparks Debate." Washington Post.Monday, January 29. http://washingtonpost.com/wp-dyn/articles/A62314-2001Jan29.html.
Barna Research Group. 2001. "Churches Lose Financial Ground in 2000." Ventura, CA: BarnaResearch Group. June 5.
Bartlett, D. L. And J. B. Steele. 1998. "What Corporate Welfare Costs." Time. Special reportfrom issues dated November 9, 16, 23, and 30 1998.
Barusch, A. and M. J. Taylor. 1999. Understanding families with multiple barriers to self-sufficiency. Salt Lake City: Social Research Institute, Graduate School of Social Work,University of Utah. February.
Bruni, F and L. Goodstein. 2001. "New Bush Office Seeks Closer Ties to Church Groups." NewYork Times. Monday, January 29.www.nytimes.com/2001/01/29/politics/29FAIT.html?pagewanted-all
Bryner, G. 1999. "Welfare Reform in Utah." Paper presented at the 1999 annual meeting of theAmerican Political Science Association, September 2-5.
Burtless, G. 1998. "Can the Labor market Absorb Three Million Welfare Recipients?" Focus.Madison, WI: The University of Wisconsin-Madison Institute for research on Poverty.Vol. 19, No. 3. Summer-Fall 1998.Pp. 1-6.
Bush, George W. 2001. "Announcement of the Formation of the White House Office of faith-based and Community Initiatives" The Washington Post. Monday, January 29.www.washingtonpost.com/wp-srv/onpolitics/elections/bushtext012901.htm.
Castelli, J. 1997. “Faith-based social services: A blessing not a miracle.” Progressive PolicyInstitute, December. www.ppionline.org/documents/ACFEWOdwh4Tc.pdf
Castelli, J. and J. D. McCarthy. 1997. “Religion-sponsored social service providers: The not-so-independent sector,” Working Paper Series of the Aspen Institute Nonprofit SectorResearch Fund.
96
Catholic Charities USA. 1998. “Summary of parish social ministries welfare reform survey,”State Welfare Project. April.
Center for the Study of Women in Society at the University of Oregon. 2001. Oregon FamiliesWho Left TANF or Food Stamps: A Study of Economic and Family Well-Being 1998-2000, available at http://csws.uoregon.edu.
"Charitable Choice," Section 104 of the Personal Responsibility and Work OpportunityReconciliation Act of 1996 (P.L. 104-193).
Church of Jesus Christ of Latter-day Saints. 1991. Church Welfare Resources for Use in theUnited States and Canada. Salt Lake City, UT: The Church of Jesus Christ of Latter-daySaints.
Church of Jesus Christ of Latter-day Saints. 1990. Providing in the Lord's Way: A Leader'sGuide to Welfare. Salt Lake City, UT: The Church of Jesus Christ of Latter-day Saints.
Cnaan, R.A. 1997. “Social and Community Involvement of Religious Congregations Housed inHistoric Religious Properties: Findings from a Six-City Study.” Final Report to Partnersfor Sacred Places, School of Social Work, University of Pennsylvania, Dec. 2, 1997.
Connolly, C. 1999. “Gore urges role for ‘faith-based’ groups,” Washington Post, May 5, p. A04.
Consumer's Union. 2001. "Pushed Off the Financial Cliff." in Consumer Reports, Vol. 66, No. 7.July. Pp. 20-25.
Danziger, S., M. Concoran, S. Dangizer, C. Heflin, A. Kalil, J. Levine, D. Rosen, K. Seefeldt, K.Siefert, R. Tolman. 1999. "Barriers to the Employment of Welfare Recipients."University of Wisconsin-Madison. Institute for Research on Poverty. Discussion Paperno. 1193-99. www.ssc.wisc.edu/irp/.
DiPadova, L. N. 2000. Utah's Charitable Organizations Face Welfare Reform: Concerns ofCharitable Leaders. Center for Public Policy and Administration, University of Utah.January 2000. www.cppa.utah.edu/wri/charitleaders.pdf.
Downs, A. 1995. Corporate Executions: The ugly truth about layoffs--how corporate greed isshattering lives, companies, and communities. New York: American ManagementAssociation.
Duncan, G. J. and P. L. Chase-Lansdale. 2001. "Welfare Reform and Child Well-being."Paper presented at the New World Conference of Welfare Reform. Washington, D.C.:February 1-2.
Edin, K. and L. Lein, 2000. “The private safety net: the role of charitable organizations in thelives of the poor,” Housing Policy Debate, Fannie Mae Foundation, Vol. 9, No. 3, pp.541-573.
Ehrenreich, B. 2001. Nickel and Dimed: On (not) getting by in America. New York:Metropolitan Books.
97
Eilperin, J. 2001. “For N.Y. Minister, a Faith-Based ‘No’ to U.S. Aid.” Washington Post. June 26.Pg. A-2.
Federal Reserve Bank of San Francisco. FRBSF Economic Newsletter.www.frbsf.org/econrsrch/wklyltr/.
Fukuyama, F. 1995. Trust: The social virtues and the creation of prosperity. NewYork: The Free Press.
Gais, T. L., R. P. Nathan, I. Lurie, and T. Kaplan. 2000. The Implementation of thePersonal Responsibility Act of 1996: Commonalities, Variations, and theChallenge of Complexity. Nelson A. Rockefeller Institute of Government Report.Albany, NY. http://rockinst.org/publications/federalism/pr_act.pdf.
Gallagher, L. J., M. Gallagher, K. Perese, S. Schreiber, and K. Watson. 1998. One year afterfederal welfare reform: a description of state temporary assistance for needy families(TANF) decisions as of October 1997. Urban Institute Press, March.
Gans, H. 1995. The War Against the Poor: The underclass and antipoverty policy. New York,NY: Basic Books.
Glassman, R. M. 2000. Caring Capitalism: A new middle-class base for the welfare state. NewYork: St. Martin's Press.
Goldstein, L. 2001b. “Church-Based Projects Lack Data on Results.” New York Times, April 24,2001.
Goodstein, L. 2001a. “A Clerical, and Racial, Gap Over Federal Help.” New York Times. March24, 2001.
Gorrell, M. 1999. “Put charities first, Romney tells would-be Olympic contributors.” Salt LakeTribune, September 27. p.A1.
Graham, W. B., M. J. Hawkins, and J. B. Reading. 2001. The Utah Venture Report. January.Unpublished paper.
Gramlich, E. M. and M. Long. 1996. "Growing Income Inequality: Roots and Remedies." TheFuture of the Public Sector Series. No. 3. June. Washington, D.C.: The Urban Institute.
Hodgkinson, V. 1999. “Welfare reform: challenges and opportunities for religious and othercharitable organizations.” Keynote address, American Society for Public AdministrationRegion VIII Conference, Salt Lake City, Utah. March 11.
Hoppe, C. 1999. “Bush backs funds for church groups to help needy, sick,” The Dallas MorningNews, July 23, p. A-1.
Kamen, A. 1999. “Clinton touts decline in welfare rolls, new rules for states,” Washington Post,April 11, p. A07.
Katz, M. B. 1989. The Undeserving Poor: From the war on poverty to the war on welfare. NewYork: Pantheon Books.
98
Kletzer, L. G. 2000. "Trade and Job Loss in U.S. Manufacturing, 1979-94" in R. C. Feenstra,ed., The Impact of International Trade on Wages. Chicago: University of Chicago Press.
Kletzer, L. G. And R. E. Litan. 2001. "A Prescription to Relieve Worker Anxiety", InternationalEconomics Policy Briefs Number 01-2. Washington, DC: Institute for InternationalEconomics. February.
Kozol, J. 1995. Amazing Grace: The Lives of Children and the Conscience of a Nation. NewYork: Crown Publishers.
Leonhardt, D. 2001. "Belt Tightening Seen as Threat to the Economy." The New York Times.July 15. Available at: www.nytimes.com/2001/07/15/business/12SPEN.html.
Lewin, T. 2001. “Surprising Result in Welfare-to-Work Studies.” The New York Times. A16.July 31.www.nytimes.com/2001/07/31/national/31WELF.html?ex=997611281&ei=1&en=e011dbfdcec4427c
Mangum, G. 2000. The Reality of Private Sector Substitutes for Public Assistance. Salt LakeCity, UT: Center for Public Policy and Administration, University of Utah. October.
Mangum, G. L. and B. D. Blumell. 1993. Mormons’ war on poverty. Salt Lake City: University ofUtah Press.
Mangum, G., S. Weathers, J. K. Bell, and S. Lazerus. 1998. On being poor in Utah. Salt LakeCity: University of Utah Press.
Manning, R. D. 2000. Credit Card Nation: The consequences of America's addiction to credit.New York: Basic Books.
Meckler, L. 2001. "Religious Groups Still Not Biting 5 years After Welfare Law Passed." SaltLake Tribune (Associated Press), March 20, 2001. Page A6.
Milbank, D. 2001. "Charity Cites Bush Help in Fight Against Hiring Gays: Salvation ArmyWants Exemption form Laws." Washington Post. July 10. Pg. A01.www.washingtonpost.com/wp-dyn/articles/A37723-2001Jul9.html.
Mishel, L., J. Bernstein, and J. Schmitt. 1999. The State of Working America: 1998-99.Economic Policy Institute. Ithaca, NY: ILS Press.
Molotsky, I. 2000. "Robust Economy is Contributing to a Loss of Affordable Housing". NewYork Times . March 28, 2000. www.nytimes.com/00/03/38/news/national/poor-housing.html.
Moore, J. and G. Williams. 1999. “Good-faith effort off to a slow start: Few religious charitiesseek public funds under new welfare law,” The Chronicle of Philanthropy, Vol. XI, no. 12,April 8, pp. 1, 27, 29, 30.
99
Moore, T. 1999. "Religious Perspectives and Welfare Reform." Address delivered at thePublic Policy Forum in Salt Lake City, sponsored by the Center for Public Policy andAdministration, March 12.
Morris, P.A., A.C. Huston, G.J. Duncan, D.A. Crosby, and J.M. Bos, 2001. “How welfare andwork policies affect children: A synthesis of Research.” Manpower DemonstrationResearch Corporation, March. See www.mdrc.org.
Morrison, A. B. 2000. "Service: The Essence of True Religion." Brigham Young UniversityDevotional. March 14.
Nathan, R. P. And T. L. Gais. 1998. Implementation of the Personal Responsibility Act of 1996.Albany, NY: Nelson A. Rockefeller Rockefeller Institute of Government.
National Coalition for the Homeless. 1999, "Employment and Homelessness." NCHFact Sheet #4. February. Available at www.nationalhomeless.org/jobs.html.
National Low Income Housing Coalition. 2000. Out of Reach. Washington, D.C. September2000. www.nlihc.org/pubs/index.htm.
National Public Radio/ Kaiser Foundation/John F. Kennedy School of Government. 2001.Poverty in America. www.npr.org/programs/specials/poll/poverty/staticresults.html. May2001.
Neal, T. M. 1999. “Bush outlines charity-based social policies,” Washington Post, July 23, p.A02.
Neibuhr, G. 2000. "Christian Groups Urge a Vast, Coordinated Attack on Poverty." New YorkTimes. February 17, 2000. http://nytimes.qpass.com/qpass-arc...%2017%2C2000%22%20and%20Christians.html.
Nieves, E. 2001. "A Fertile Farm Region Pays Its Jobless to Quit California." The New YorkTimes. June 18. www.nytimes.com/2001/06/18/national/.
Oberbeck, Steven. 1999. “Bankruptcy: Flip Side of Utah’s Economic Boom.” Salt Lake Tribune,July 18, 1999, page A-7.
Oberbeck, Steven. 2001a. “In 2000, More Utahns Sought Debt Relief.” Salt Lake Tribune,January 11, 2001, page A-1.
Oberbeck, Steven. 2001b. “Utah Bankruptcies Set Record.” Salt Lake Tribune, April 17, 2001.www.sltrib.com/04172001/utah/89490.htm.
Office of Public Health Assessment, Utah Department of Health and Bureau of Epidemiology,Salt Lake Valley Health Department. 2000. Northwest Salt Lake Valley CommunitiesHealth Status Report. Salt Lake City, UT: Utah department of Health.
Ostling, R. L. 1999. Mormon America: The power and the promise. San Francisco: HarperBooks.
100
Printz, T. J. 1999. “Faith-based service providers in the nation’s capitol: can they do more?”Washington, D.C.: Center for Nonprofits and Philanthropy at the Urban Institute.
Roberts, B. and J. D. Padden, 1998. Welfare to Wages: Strategies to Assist the Private Sectorto Employ Welfare Recipients. Flint, MI: The Charles Stewart Mott Foundation. 2 vols.August 1998. www.mott.org/publications/welfv1.pdf.
Romboy, D. 2000. “Welfare Loss to Hit Utes Hard,” Deseret News , January 1, p. B1.
Salt Lake Tribune. 1998. “Utah’s welfare rolls drop 40%: Decline came after law mandated jobhunt, school or benefits cut.” February 17. P. B1.
Shapiro, I. And R. Greenstein. 1999. The Widening Income Gulf. Washington, D.C.: Center forBudget and Policy Priorities. Available at www.cbpp.org.
Sider, R. J. and H. R. Unruh. 1999. “No aid to religion? Charitable choice and the FirstAmendment,” Brookings Review, Spring, Vol. 17 No. 2. pp. 46-49.
Spiers, J. 1996. "Why the Income Gap Won't Go Away." Fortune. Vol. 133. No. 2. February 5.
Stein, H. F. 1998. Euphemism, Spin, and the Crisis in Organizational Life. Westport, CT:Quorum Books.
Steuerle, C. E. and V. A. Hodgkinson. 1999. “Meeting social needs: comparing the resources ofthe independent sector and government” in E. T. Boris and C. E. Steuerle, eds.,Nonprofits and Government: Collaboration and Conflict. Washington, D.C.: The UrbanInstitute Press.
Sullivan, T. A., E. Warren, and J. L. Westbrook. 2000. The Fragile Middle Class: Americans inDebt. New Haven: Yale University Press.
Taylor, M. J. and A. Barusch. 2000. Multiple Impacts of Welfare Reform in Utah: Experiences ofFormer Long-term Welfare Recipients. Salt Lake City, UT: Social Research Institute,Graduate School of Social Work, University of Utah.
Titze, M. 2000. "Poverty Down, Income Up in Utah". Deseret News . September 27, 2000.http://deseretnews.com/dn/view/0,1249,195017279,00.html
The Industry Standard, Layoff Tracker. www.thestandard.com/trackers/layoffs/.
U. S. Department of Commerce, Bureau of Economic Analysis. Tables 2.1 and 2.9: PersonalIncome and Its Disposition: 1928-2001. www.bea.doc.gov.
Urban Institute. 1998. "Services and Capacity of Religious Congregations in the MetropolitanArea." Washington, D.C.: Center on Nonprofits and Philanthropy.
Utah Children, 2001. Measures of Child Well-Being in Utah, 2001. A report of KIDS COUNT.Salt Lake City, Utah.
Van Biema, D. 1995. “Can charity fill the gap?” Time. December 4.
101
Vedantam, S. 2001 "Child Aggressiveness Study Cites Day Care." The Washington Post. April19, p. A6.
Verma, N., G. Mangum, and C. Cookson. 2001. Poverty in Utah 2000. Salt Lake City: UtahIssues. March.
Walters, J. 1999. "Beyond the Welfare Clock." Governing. April 1999, pp. 21-26.
Weathers, S. 1999. Foundation Report: The charitable sector and welfare reform in Utah, April1999. Salt Lake City, UT: Center for Public Policy and Administration, University ofUtah.
Weathers, S. and W. P. Walsh, Jr., Welfare Reform: Unintended Consequences for UtahCounties, February 2000. www.cppa.utah.edu/wri/county_report.pdf.
Weaver, J. 1997. “Charitable Choice: Will This Provision of Welfare Reform SurviveConstitutional Scrutiny?” Perspectives, T.C. Williams School of Law, University ofRichmond, Richmond, VA.law.richmond.edu/RJOLPI/Issues/Spring%201997%20Welfare%20Reform/weaver.htm
Wilson, J.Q. 1999. “Religion and Public Life: Moving private funds to faith-based social serviceproviders,” The Brookings Review, Spring. Vol. 17 No. 2.
Wisconsin Legislative Audit Bureau. 2001. An Evaluation of the Wisconsin Works (W-2)Program: Department of Workforce Development, April 2001.www.legis.state.wi.us/lab/Reports/01-7full.pdf.
Withorn, A. and P. Jons 1999. Worrying about welfare reform: Community-based agenciesrespond. Boston, MA: Academics Working Group on Poverty.
Wolman, W. And A. Colamosca. 1997. The Judas Economy: The triumph of capital and thebetrayal of work. Reading, MA: Addison-Wesley Publishing Company, Inc.
Zedlesski, S. R. And S. Brauner. 2000. Are the Steep Declines in Food Stamp ParticipationLinked to Falling Welfare Caseloads? Number B-3 in Series, "New Federalism: NationalSurvey of America's Families." Washington, D.C.: The Urban Institute. Available from:http://newfederalism.urban.org.

102
103
APPENDIX A
Center for Public Policy and AdministrationWelfare Reform Initiative
Publications List
All of the following reports are available on the web at www.cppa.utah.edu/wri
Welfare Reform: The Impact on Native Americans in Utah's Uintah Basin, February 2001,Shirley A. Weathers, Ph.D., and William P. Walsh, Jr., Walsh & Weathers Research and PolicyStudies
From Welfare Poor to Working Poor: Post AFDC/TANF Income in the State of Utah, Novmber2000, Andrea Coon, Ph.D. Candidate in Economics, University of Utah, Mcleans Geo-Jaja,Associate Professor, Brigham Young University, Garth Mangum, Max McGraw Professor ofEconomics and Management Emeritus, University of Utah
From Welfare Poor to Working Poor: Post AFDC/TANF Income in Salt Lake County, Utah,November 2000, Andrea Coon, Ph.D. Candidate in Economics, University of Utah, McleansGeo-Jaja, Associate Professor, Brigham Young University, Garth Mangum, Max McGrawProfessor of Economics and Management Emeritus, University of Utah
Impact of Welfare Reform on the Charitable Efforts of the Salt Lake Valley Faith Community,October 2000, Garth Mangum, Max McGraw Professor of Economics and ManagementEmeritus, University of Utah, and John Salevurakis, Ph.D. Candidate in Economics, Universityof Utah
The Reality of Private Sector Substitutes for Public Assistance, October 2000, Garth Mangum,Max McGraw Professor of Economics and Management Emeritus, University of Utah
How Have the Welfare Reform Changes Impacted the Navajo Nation? August 2000,Vanesscia Bates
Welfare Reform: Unintended Consequences for Utah Counties, February 2000, ShirleyWeathers, Ph.D., and William P. Walsh, Jr., Walsh & Weathers Research and Policy Studies
Press Release issued 2/2/2000 -- "Welfare Reform a Work in Progress: Cooperation Key toSuccess, Says U. Report"
Utah's Charitable Organizations Face Welfare Reform: Concerns of Charitable Leaders,January 2000, Laurie N. DiPadova, Ph.D., Policy Fellow, Center for Public Policy andAdministration
Foundation Report: The Charitable Sector and Welfare Reform in Utah, April 1999, ShirleyWeathers, Ph.D., Walsh & Weathers Research and Policy Studies

104
105
APPENDIX B
Initial Survey and Cover Letters
The following are the cover letters and surveys mailed to nonprofit and religious organizations.Since a second letter and survey was sent to nonrespondents both letters are included but onlyone copy of the survey since it was identical.
The following outlines in order the documents that follow.
Religious OrganizationsCover letter dated November 30, 1999Follow-up cover letter dated January 25, 2000Survey dated December 15, 1999
Nonprofit OrganizationsCover letter dated November 30, 1999Follow-up cover letter dated January 25, 2000Survey response date of December 15, 1999
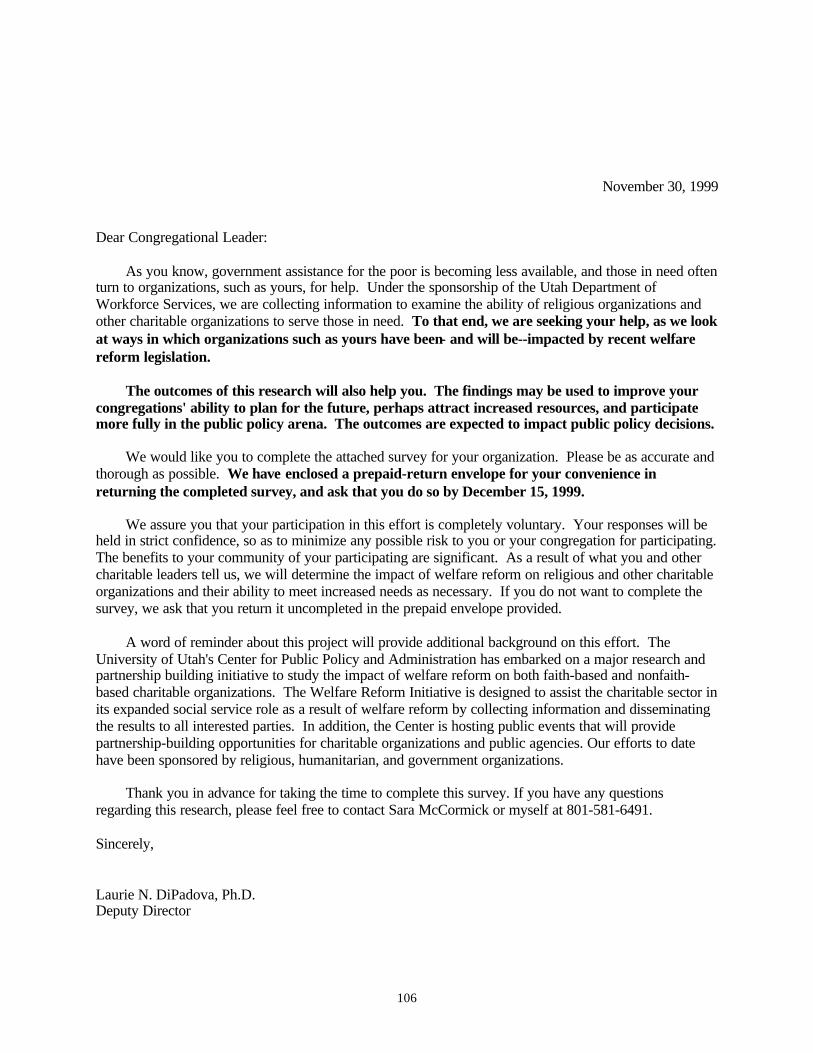
106
November 30, 1999
Dear Congregational Leader:
As you know, government assistance for the poor is becoming less available, and those in need oftenturn to organizations, such as yours, for help. Under the sponsorship of the Utah Department ofWorkforce Services, we are collecting information to examine the ability of religious organizations andother charitable organizations to serve those in need. To that end, we are seeking your help, as we lookat ways in which organizations such as yours have been−and will be--impacted by recent welfarereform legislation.
The outcomes of this research will also help you. The findings may be used to improve yourcongregations' ability to plan for the future, perhaps attract increased resources, and participatemore fully in the public policy arena. The outcomes are expected to impact public policy decisions.
We would like you to complete the attached survey for your organization. Please be as accurate andthorough as possible. We have enclosed a prepaid-return envelope for your convenience inreturning the completed survey, and ask that you do so by December 15, 1999.
We assure you that your participation in this effort is completely voluntary. Your responses will beheld in strict confidence, so as to minimize any possible risk to you or your congregation for participating.The benefits to your community of your participating are significant. As a result of what you and othercharitable leaders tell us, we will determine the impact of welfare reform on religious and other charitableorganizations and their ability to meet increased needs as necessary. If you do not want to complete thesurvey, we ask that you return it uncompleted in the prepaid envelope provided.
A word of reminder about this project will provide additional background on this effort. TheUniversity of Utah's Center for Public Policy and Administration has embarked on a major research andpartnership building initiative to study the impact of welfare reform on both faith-based and nonfaith-based charitable organizations. The Welfare Reform Initiative is designed to assist the charitable sector inits expanded social service role as a result of welfare reform by collecting information and disseminatingthe results to all interested parties. In addition, the Center is hosting public events that will providepartnership-building opportunities for charitable organizations and public agencies. Our efforts to datehave been sponsored by religious, humanitarian, and government organizations.
Thank you in advance for taking the time to complete this survey. If you have any questionsregarding this research, please feel free to contact Sara McCormick or myself at 801-581-6491.
Sincerely,
Laurie N. DiPadova, Ph.D.Deputy Director
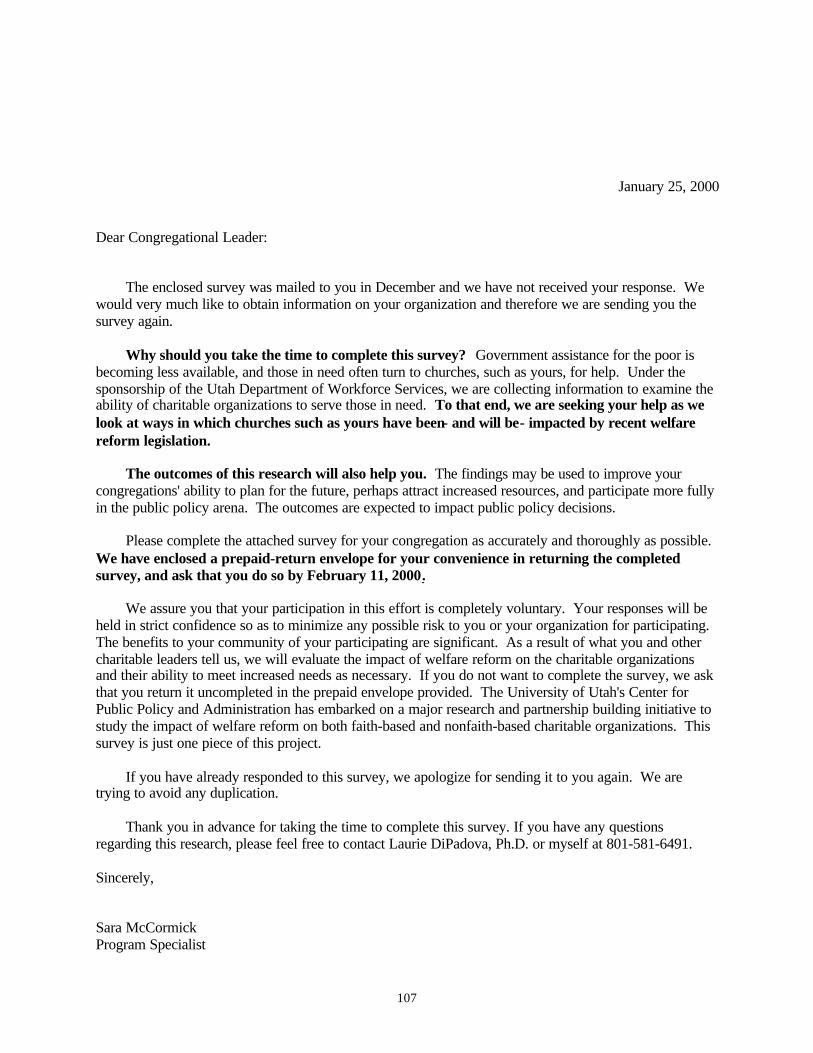
107
January 25, 2000
Dear Congregational Leader:
The enclosed survey was mailed to you in December and we have not received your response. Wewould very much like to obtain information on your organization and therefore we are sending you thesurvey again.
Why should you take the time to complete this survey? Government assistance for the poor isbecoming less available, and those in need often turn to churches, such as yours, for help. Under thesponsorship of the Utah Department of Workforce Services, we are collecting information to examine theability of charitable organizations to serve those in need. To that end, we are seeking your help as welook at ways in which churches such as yours have been−and will be−impacted by recent welfarereform legislation.
The outcomes of this research will also help you. The findings may be used to improve yourcongregations' ability to plan for the future, perhaps attract increased resources, and participate more fullyin the public policy arena. The outcomes are expected to impact public policy decisions.
Please complete the attached survey for your congregation as accurately and thoroughly as possible.We have enclosed a prepaid-return envelope for your convenience in returning the completedsurvey, and ask that you do so by February 11, 2000.
We assure you that your participation in this effort is completely voluntary. Your responses will beheld in strict confidence so as to minimize any possible risk to you or your organization for participating.The benefits to your community of your participating are significant. As a result of what you and othercharitable leaders tell us, we will evaluate the impact of welfare reform on the charitable organizationsand their ability to meet increased needs as necessary. If you do not want to complete the survey, we askthat you return it uncompleted in the prepaid envelope provided. The University of Utah's Center forPublic Policy and Administration has embarked on a major research and partnership building initiative tostudy the impact of welfare reform on both faith-based and nonfaith-based charitable organizations. Thissurvey is just one piece of this project.
If you have already responded to this survey, we apologize for sending it to you again. We aretrying to avoid any duplication.
Thank you in advance for taking the time to complete this survey. If you have any questionsregarding this research, please feel free to contact Laurie DiPadova, Ph.D. or myself at 801-581-6491.
Sincerely,
Sara McCormickProgram Specialist
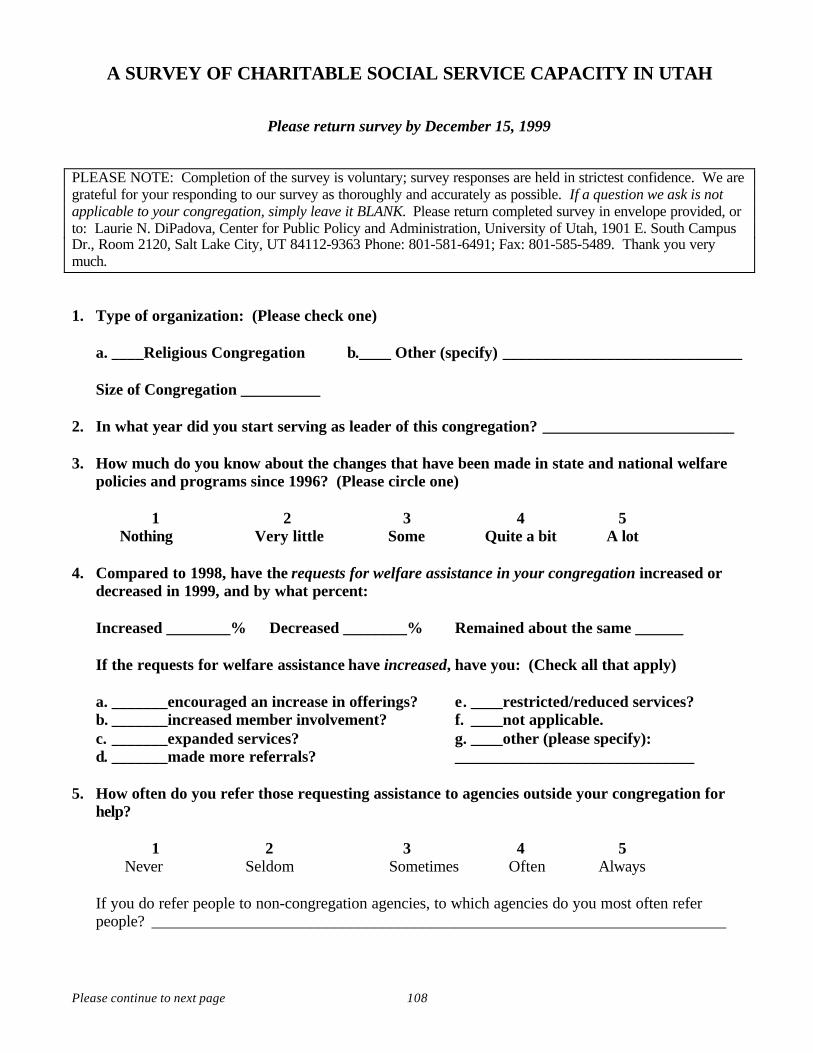
Please continue to next page 108
A SURVEY OF CHARITABLE SOCIAL SERVICE CAPACITY IN UTAH
Please return survey by December 15, 1999
PLEASE NOTE: Completion of the survey is voluntary; survey responses are held in strictest confidence. We aregrateful for your responding to our survey as thoroughly and accurately as possible. If a question we ask is notapplicable to your congregation, simply leave it BLANK. Please return completed survey in envelope provided, orto: Laurie N. DiPadova, Center for Public Policy and Administration, University of Utah, 1901 E. South CampusDr., Room 2120, Salt Lake City, UT 84112-9363 Phone: 801-581-6491; Fax: 801-585-5489. Thank you verymuch.
1. Type of organization: (Please check one)
a. ____Religious Congregation b.____ Other (specify) ______________________________
Size of Congregation __________
2. In what year did you start serving as leader of this congregation? ________________________
3. How much do you know about the changes that have been made in state and national welfarepolicies and programs since 1996? (Please circle one)
1 2 3 4 5Nothing Very little Some Quite a bit A lot
4. Compared to 1998, have the requests for welfare assistance in your congregation increased ordecreased in 1999, and by what percent:
Increased ________% Decreased ________% Remained about the same ______
If the requests for welfare assistance have increased, have you: (Check all that apply)
a. _______encouraged an increase in offerings? e. ____restricted/reduced services?b. _______increased member involvement? f. ____not applicable.c. _______expanded services? g. ____other (please specify):d. _______made more referrals? ______________________________
5. How often do you refer those requesting assistance to agencies outside your congregation forhelp?
1 2 3 4 5Never Seldom Sometimes Often Always
If you do refer people to non-congregation agencies, to which agencies do you most often referpeople? ________________________________________________________________________
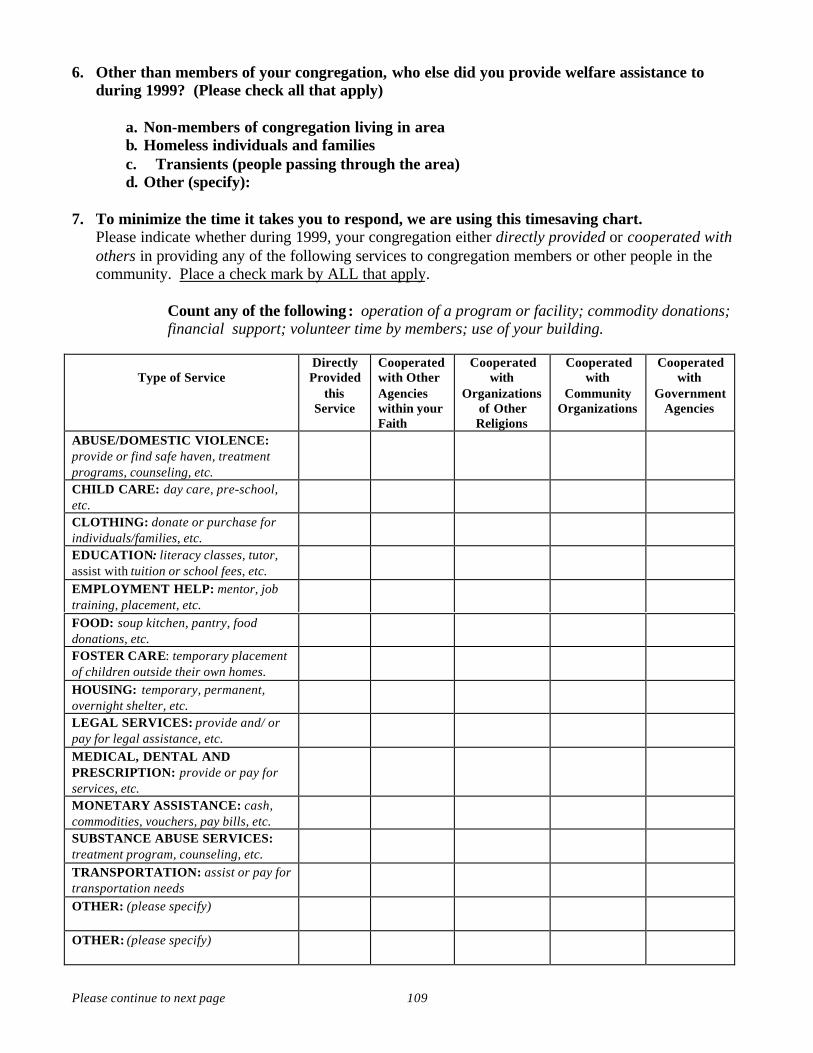
Please continue to next page 109
6. Other than members of your congregation, who else did you provide welfare assistance toduring 1999? (Please check all that apply)
a. Non-members of congregation living in areab. Homeless individuals and familiesc. Transients (people passing through the area)d. Other (specify):
7. To minimize the time it takes you to respond, we are using this timesaving chart.Please indicate whether during 1999, your congregation either directly provided or cooperated withothers in providing any of the following services to congregation members or other people in thecommunity. Place a check mark by ALL that apply.
Count any of the following: operation of a program or facility; commodity donations;financial support; volunteer time by members; use of your building.
Type of ServiceDirectlyProvided
thisService
Cooperatedwith OtherAgencieswithin yourFaith
Cooperatedwith
Organizationsof OtherReligions
Cooperatedwith
CommunityOrganizations
Cooperatedwith
GovernmentAgencies
ABUSE/DOMESTIC VIOLENCE:provide or find safe haven, treatmentprograms, counseling, etc.CHILD CARE: day care, pre-school,etc.CLOTHING: donate or purchase forindividuals/families, etc.EDUCATION: literacy classes, tutor,assist with tuition or school fees, etc.EMPLOYMENT HELP: mentor, jobtraining, placement, etc.FOOD: soup kitchen, pantry, fooddonations, etc.FOSTER CARE: temporary placementof children outside their own homes.HOUSING: temporary, permanent,overnight shelter, etc.LEGAL SERVICES: provide and/ orpay for legal assistance, etc.MEDICAL, DENTAL ANDPRESCRIPTION: provide or pay forservices, etc.MONETARY ASSISTANCE: cash,commodities, vouchers, pay bills, etc.SUBSTANCE ABUSE SERVICES:treatment program, counseling, etc.TRANSPORTATION: assist or pay fortransportation needsOTHER: (please specify)
OTHER: (please specify)
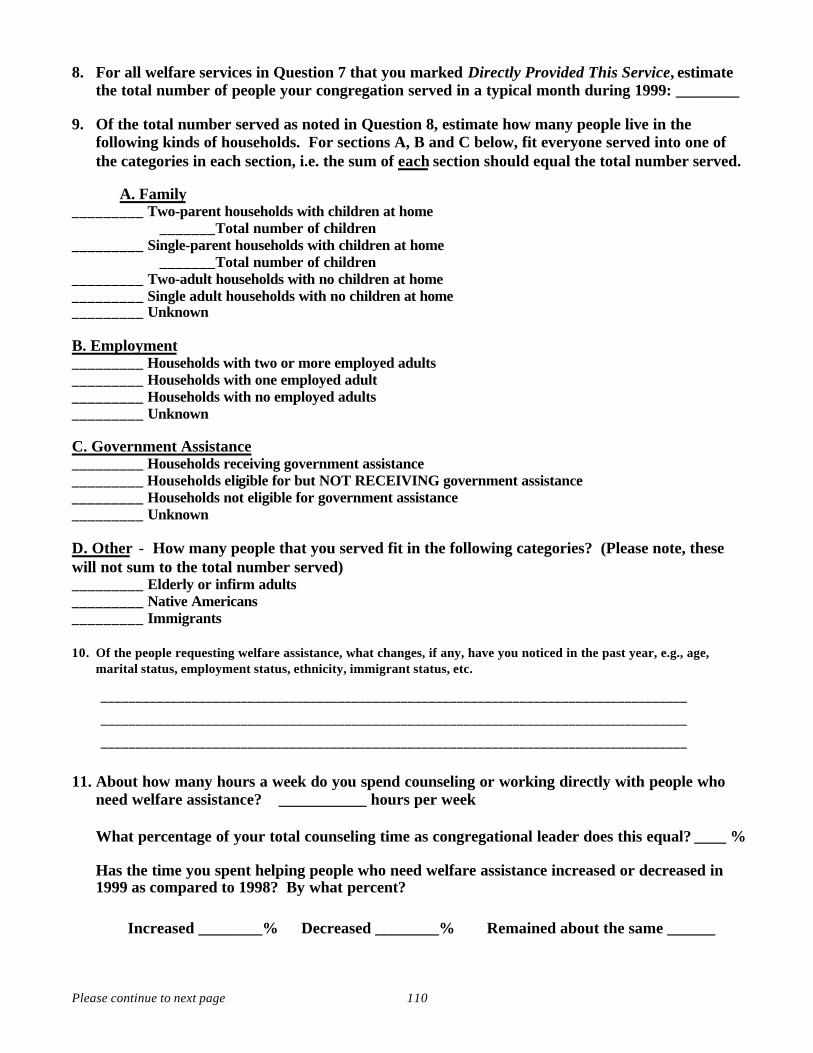
Please continue to next page 110
8. For all welfare services in Question 7 that you marked Directly Provided This Service, estimatethe total number of people your congregation served in a typical month during 1999: ________
9. Of the total number served as noted in Question 8, estimate how many people live in thefollowing kinds of households. For sections A, B and C below, fit everyone served into one ofthe categories in each section, i.e. the sum of each section should equal the total number served.
A. Family_________ Two-parent households with children at home
_______Total number of children_________ Single-parent households with children at home
_______Total number of children_________ Two-adult households with no children at home_________ Single adult households with no children at home_________ Unknown
B. Employment_________ Households with two or more employed adults_________ Households with one employed adult_________ Households with no employed adults_________ Unknown
C. Government Assistance_________ Households receiving government assistance_________ Households eligible for but NOT RECEIVING government assistance_________ Households not eligible for government assistance_________ Unknown
D. Other − How many people that you served fit in the following categories? (Please note, thesewill not sum to the total number served)_________ Elderly or infirm adults_________ Native Americans_________ Immigrants
10. Of the people requesting welfare assistance, what changes, if any, have you noticed in the past year, e.g., age,marital status, employment status, ethnicity, immigrant status, etc.
____________________________________________________________________________________
____________________________________________________________________________________
____________________________________________________________________________________
11. About how many hours a week do you spend counseling or working directly with people whoneed welfare assistance? ___________ hours per week
What percentage of your total counseling time as congregational leader does this equal? ____ %
Has the time you spent helping people who need welfare assistance increased or decreased in1999 as compared to 1998? By what percent?
Increased ________% Decreased ________% Remained about the same ______
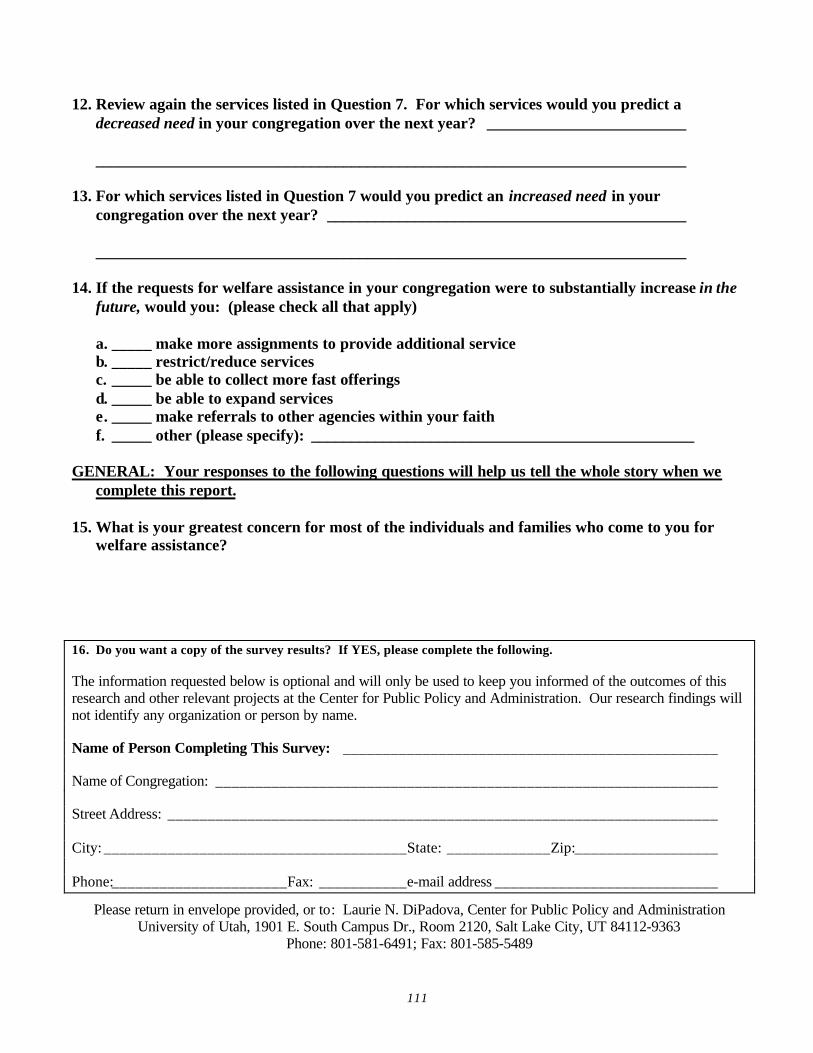
111
12. Review again the services listed in Question 7. For which services would you predict adecreased need in your congregation over the next year? _________________________
__________________________________________________________________________
13. For which services listed in Question 7 would you predict an increased need in yourcongregation over the next year? _____________________________________________
__________________________________________________________________________
14. If the requests for welfare assistance in your congregation were to substantially increase in thefuture, would you: (please check all that apply)
a. _____ make more assignments to provide additional serviceb. _____ restrict/reduce servicesc. _____ be able to collect more fast offeringsd. _____ be able to expand servicese. _____ make referrals to other agencies within your faithf. _____ other (please specify): ________________________________________________
GENERAL: Your responses to the following questions will help us tell the whole story when wecomplete this report.
15. What is your greatest concern for most of the individuals and families who come to you forwelfare assistance?
16. Do you want a copy of the survey results? If YES, please complete the following.
The information requested below is optional and will only be used to keep you informed of the outcomes of thisresearch and other relevant projects at the Center for Public Policy and Administration. Our research findings willnot identify any organization or person by name.
Name of Person Completing This Survey: _______________________________________________
Name of Congregation: _______________________________________________________________
Street Address: _____________________________________________________________________
City: ______________________________________State: _____________Zip:__________________
Phone:______________________Fax: ___________e-mail address ____________________________
Please return in envelope provided, or to: Laurie N. DiPadova, Center for Public Policy and AdministrationUniversity of Utah, 1901 E. South Campus Dr., Room 2120, Salt Lake City, UT 84112-9363
Phone: 801-581-6491; Fax: 801-585-5489
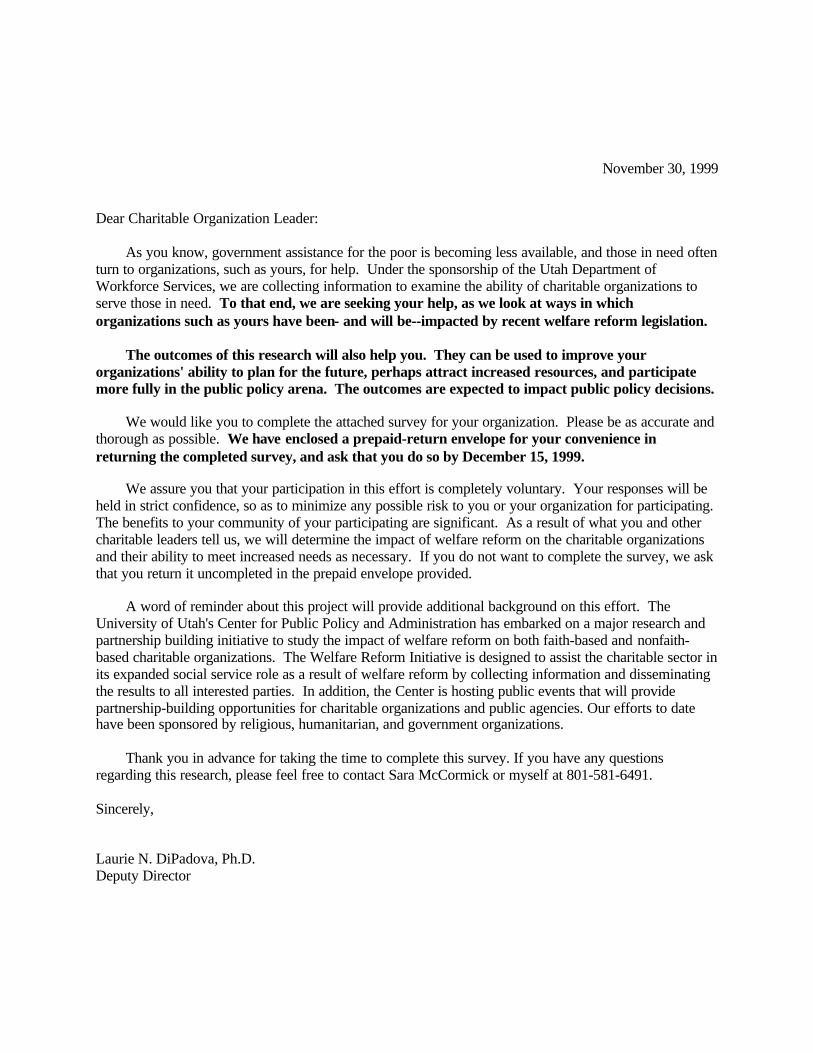
November 30, 1999
Dear Charitable Organization Leader:
As you know, government assistance for the poor is becoming less available, and those in need oftenturn to organizations, such as yours, for help. Under the sponsorship of the Utah Department ofWorkforce Services, we are collecting information to examine the ability of charitable organizations toserve those in need. To that end, we are seeking your help, as we look at ways in whichorganizations such as yours have been−and will be--impacted by recent welfare reform legislation.
The outcomes of this research will also help you. They can be used to improve yourorganizations' ability to plan for the future, perhaps attract increased resources, and participatemore fully in the public policy arena. The outcomes are expected to impact public policy decisions.
We would like you to complete the attached survey for your organization. Please be as accurate andthorough as possible. We have enclosed a prepaid-return envelope for your convenience inreturning the completed survey, and ask that you do so by December 15, 1999.
We assure you that your participation in this effort is completely voluntary. Your responses will beheld in strict confidence, so as to minimize any possible risk to you or your organization for participating.The benefits to your community of your participating are significant. As a result of what you and othercharitable leaders tell us, we will determine the impact of welfare reform on the charitable organizationsand their ability to meet increased needs as necessary. If you do not want to complete the survey, we askthat you return it uncompleted in the prepaid envelope provided.
A word of reminder about this project will provide additional background on this effort. TheUniversity of Utah's Center for Public Policy and Administration has embarked on a major research andpartnership building initiative to study the impact of welfare reform on both faith-based and nonfaith-based charitable organizations. The Welfare Reform Initiative is designed to assist the charitable sector inits expanded social service role as a result of welfare reform by collecting information and disseminatingthe results to all interested parties. In addition, the Center is hosting public events that will providepartnership-building opportunities for charitable organizations and public agencies. Our efforts to datehave been sponsored by religious, humanitarian, and government organizations.
Thank you in advance for taking the time to complete this survey. If you have any questionsregarding this research, please feel free to contact Sara McCormick or myself at 801-581-6491.
Sincerely,
Laurie N. DiPadova, Ph.D.Deputy Director
January 25, 2000
Dear Charitable Organization Leader:
The enclosed survey was mailed to you in December and we have not received your response. Wewould very much like to obtain information on your organization and therefore we are sending you thesurvey again.
Why should you take the time to complete this survey? Government assistance for the poor isbecoming less available, and those in need often turn to organizations, such as yours, for help. Under thesponsorship of the Utah Department of Workforce Services, we are collecting information to examine theability of charitable organizations to serve those in need. To that end, we are seeking your help as welook at ways in which organizations such as yours have been−and will be−impacted by recentwelfare reform legislation.
The outcomes of this research will also help you. The findings may be used to improve yourorganizations' ability to plan for the future, perhaps attract increased resources, and participate more fullyin the public policy arena. The outcomes are expected to impact public policy decisions.
Please complete the attached survey for your congregation as accurately and thoroughly as possible.We have enclosed a prepaid-return envelope for your convenience in returning the completedsurvey, and ask that you do so by February 11, 2000.
We assure you that your participation in this effort is completely voluntary. Your responses will beheld in strict confidence so as to minimize any possible risk to you or your organization for participating.The benefits to your community of your participating are significant. As a result of what you and othercharitable leaders tell us, we will evaluate the impact of welfare reform on the charitable organizationsand their ability to meet increased needs as necessary. If you do not want to complete the survey, we askthat you return it uncompleted in the prepaid envelope provided. The University of Utah's Center forPublic Policy and Administration has embarked on a major research and partnership building initiative tostudy the impact of welfare reform on both faith-based and nonfaith-based charitable organizations. Thissurvey is just one piece of this project.
If you have already responded to this survey, we apologize for sending it to you again. We aretrying to avoid any duplication.
Thank you in advance for taking the time to complete this survey. If you have any questionsregarding this research, please feel free to contact Laurie DiPadova, Ph.D. or myself at 801-581-6491.
Sincerely,
Sara McCormickProgram Specialist
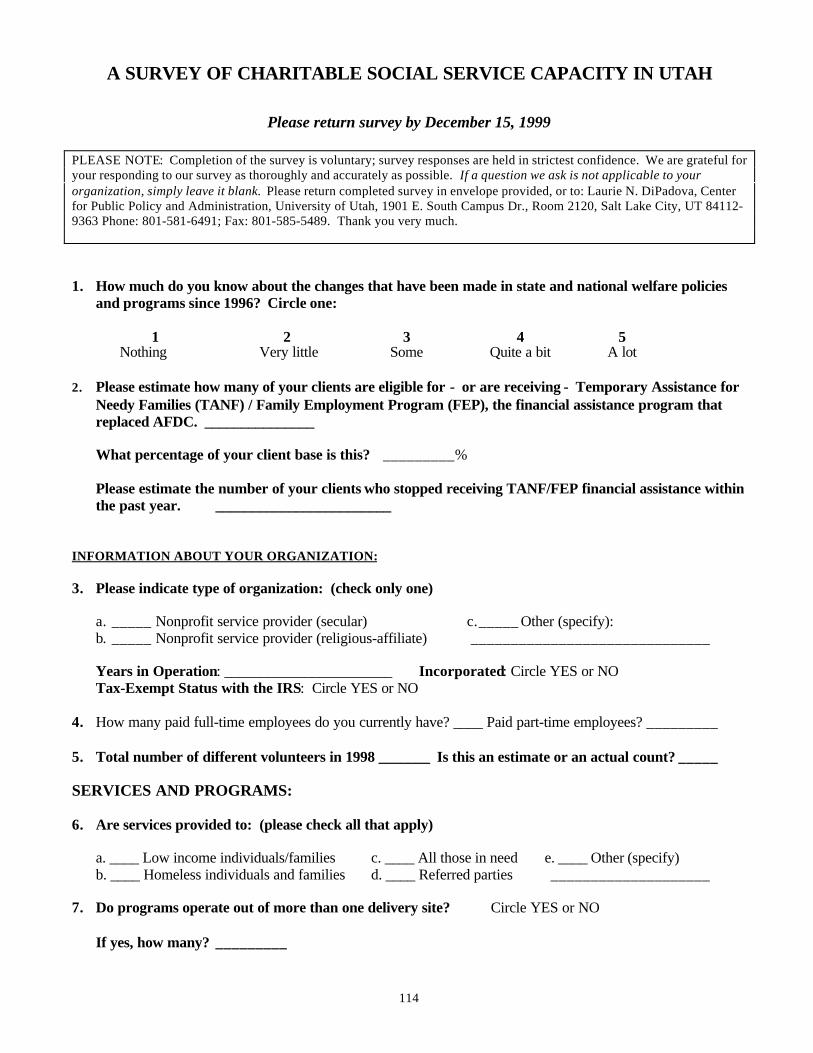
114
A SURVEY OF CHARITABLE SOCIAL SERVICE CAPACITY IN UTAH
Please return survey by December 15, 1999
PLEASE NOTE: Completion of the survey is voluntary; survey responses are held in strictest confidence. We are grateful foryour responding to our survey as thoroughly and accurately as possible. If a question we ask is not applicable to yourorganization, simply leave it blank. Please return completed survey in envelope provided, or to: Laurie N. DiPadova, Centerfor Public Policy and Administration, University of Utah, 1901 E. South Campus Dr., Room 2120, Salt Lake City, UT 84112-9363 Phone: 801-581-6491; Fax: 801-585-5489. Thank you very much.
1. How much do you know about the changes that have been made in state and national welfare policiesand programs since 1996? Circle one:
1 2 3 4 5Nothing Very little Some Quite a bit A lot
2. Please estimate how many of your clients are eligible for − or are receiving − Temporary Assistance forNeedy Families (TANF) / Family Employment Program (FEP), the financial assistance program thatreplaced AFDC. _______________
What percentage of your client base is this? _________%
Please estimate the number of your clients who stopped receiving TANF/FEP financial assistance withinthe past year. ________________________
INFORMATION ABOUT YOUR ORGANIZATION:
3. Please indicate type of organization: (check only one)
a. _____ Nonprofit service provider (secular) c._____ Other (specify):b. _____ Nonprofit service provider (religious-affiliate) ______________________________
Years in Operation: _______________________ Incorporated: Circle YES or NOTax-Exempt Status with the IRS: Circle YES or NO
4. How many paid full-time employees do you currently have? ____ Paid part-time employees? _________
5. Total number of different volunteers in 1998 _______ Is this an estimate or an actual count? _____
SERVICES AND PROGRAMS:
6. Are services provided to: (please check all that apply)
a. ____ Low income individuals/families c. ____ All those in need e. ____ Other (specify)b. ____ Homeless individuals and families d. ____ Referred parties ____________________
7. Do programs operate out of more than one delivery site? Circle YES or NO
If yes, how many? _________
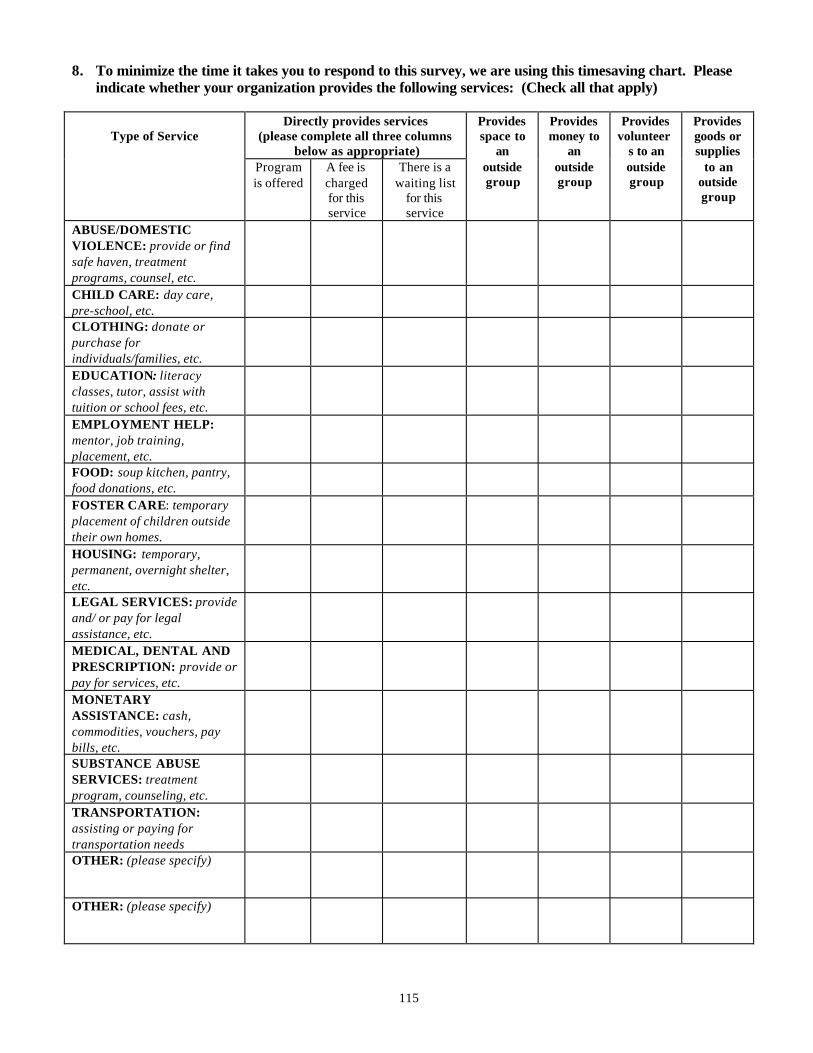
115
8. To minimize the time it takes you to respond to this survey, we are using this timesaving chart. Pleaseindicate whether your organization provides the following services: (Check all that apply)
Directly provides services(please complete all three columns
below as appropriate)Type of Service
Programis offered
A fee ischargedfor thisservice
There is awaiting list
for thisservice
Providesspace to
anoutsidegroup
Providesmoney to
anoutsidegroup
Providesvolunteer
s to anoutsidegroup
Providesgoods orsupplies
to anoutsidegroup
ABUSE/DOMESTICVIOLENCE: provide or findsafe haven, treatmentprograms, counsel, etc.CHILD CARE: day care,pre-school, etc.CLOTHING: donate orpurchase forindividuals/families, etc.EDUCATION: literacyclasses, tutor, assist withtuition or school fees, etc.EMPLOYMENT HELP:mentor, job training,placement, etc.FOOD: soup kitchen, pantry,food donations, etc.FOSTER CARE: temporaryplacement of children outsidetheir own homes.HOUSING: temporary,permanent, overnight shelter,etc.LEGAL SERVICES: provideand/ or pay for legalassistance, etc.MEDICAL, DENTAL ANDPRESCRIPTION: provide orpay for services, etc.MONETARYASSISTANCE: cash,commodities, vouchers, paybills, etc.SUBSTANCE ABUSESERVICES: treatmentprogram, counseling, etc.TRANSPORTATION:assisting or paying fortransportation needsOTHER: (please specify)
OTHER: (please specify)
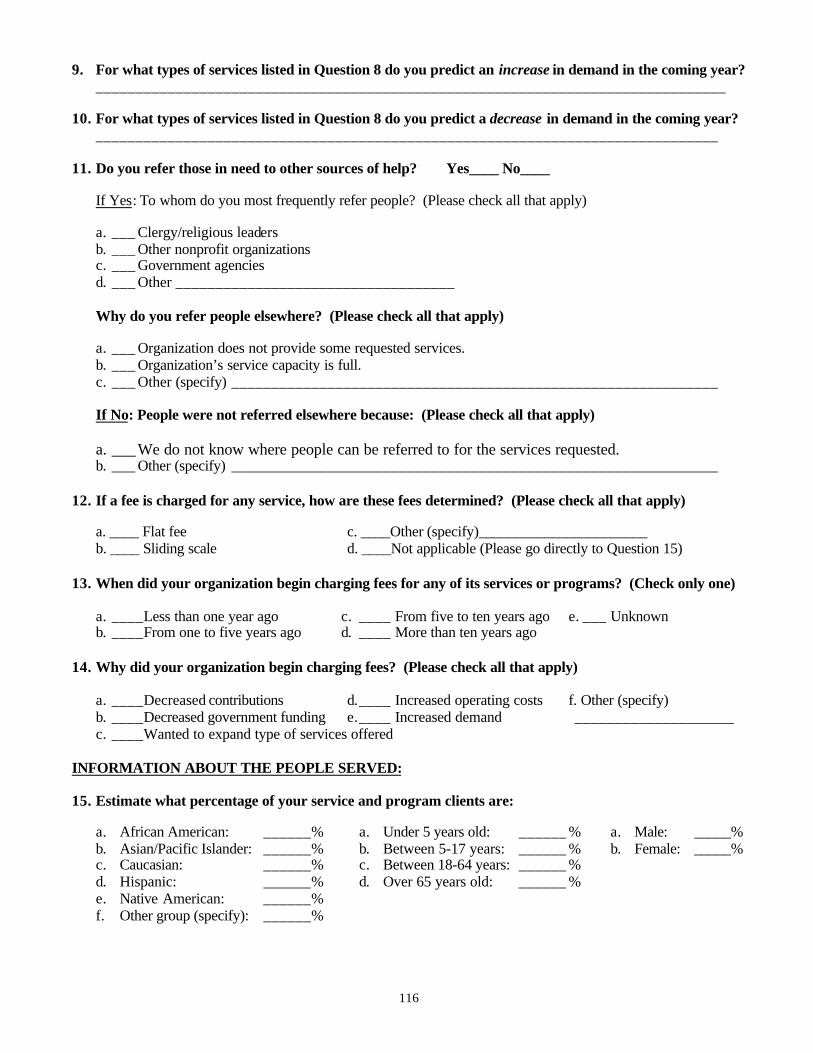
116
9. For what types of services listed in Question 8 do you predict an increase in demand in the coming year?_______________________________________________________________________________
10. For what types of services listed in Question 8 do you predict a decrease in demand in the coming year?______________________________________________________________________________
11. Do you refer those in need to other sources of help? Yes____ No____
If Yes: To whom do you most frequently refer people? (Please check all that apply)
a. ___ Clergy/religious leadersb. ___ Other nonprofit organizationsc. ___ Government agenciesd. ___ Other ___________________________________
Why do you refer people elsewhere? (Please check all that apply)
a. ___ Organization does not provide some requested services.b. ___ Organization’s service capacity is full.c. ___ Other (specify) _____________________________________________________________
If No: People were not referred elsewhere because: (Please check all that apply)
a. ___We do not know where people can be referred to for the services requested.b. ___ Other (specify) _____________________________________________________________
12. If a fee is charged for any service, how are these fees determined? (Please check all that apply)
a. ____ Flat fee c. ____Other (specify)_______________________b. ____ Sliding scale d. ____Not applicable (Please go directly to Question 15)
13. When did your organization begin charging fees for any of its services or programs? (Check only one)
a. ____Less than one year ago c. ____ From five to ten years ago e. ___ Unknownb. ____From one to five years ago d. ____ More than ten years ago
14. Why did your organization begin charging fees? (Please check all that apply)
a. ____Decreased contributions d.____ Increased operating costs f. Other (specify)b. ____Decreased government funding e.____ Increased demand ____________________c. ____Wanted to expand type of services offered
INFORMATION ABOUT THE PEOPLE SERVED:
15. Estimate what percentage of your service and program clients are:
a. African American: ______% a. Under 5 years old: ______ % a. Male: _____%b. Asian/Pacific Islander: ______% b. Between 5-17 years: ______ % b. Female: _____%c. Caucasian: ______% c. Between 18-64 years: ______ %d. Hispanic: ______% d. Over 65 years old: ______ %e. Native American: ______%f. Other group (specify): ______%
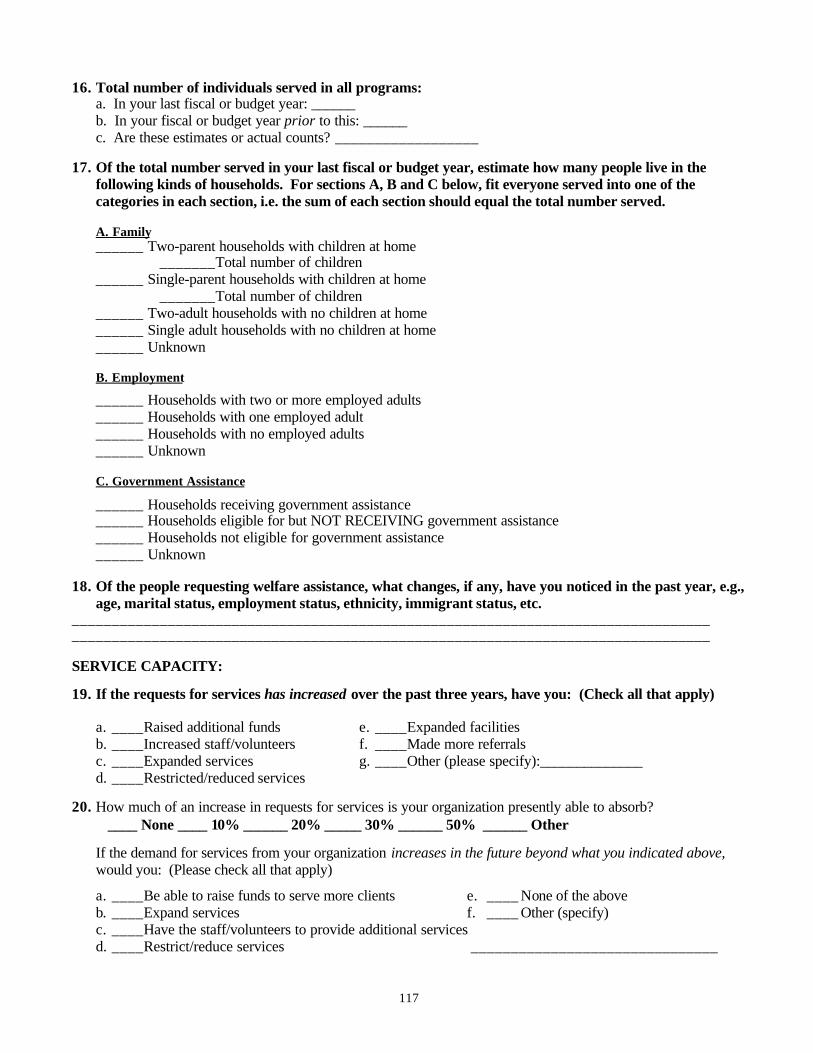
117
16. Total number of individuals served in all programs:a. In your last fiscal or budget year: ______b. In your fiscal or budget year prior to this: ______c. Are these estimates or actual counts? __________________
17. Of the total number served in your last fiscal or budget year, estimate how many people live in thefollowing kinds of households. For sections A, B and C below, fit everyone served into one of thecategories in each section, i.e. the sum of each section should equal the total number served.
A. Family______ Two-parent households with children at home
_______Total number of children______ Single-parent households with children at home
_______Total number of children______ Two-adult households with no children at home______ Single adult households with no children at home______ Unknown
B. Employment
______ Households with two or more employed adults______ Households with one employed adult______ Households with no employed adults______ Unknown
C. Government Assistance
______ Households receiving government assistance______ Households eligible for but NOT RECEIVING government assistance______ Households not eligible for government assistance______ Unknown
18. Of the people requesting welfare assistance, what changes, if any, have you noticed in the past year, e.g.,age, marital status, employment status, ethnicity, immigrant status, etc.
________________________________________________________________________________________________________________________________________________________________
SERVICE CAPACITY:
19. If the requests for services has increased over the past three years, have you: (Check all that apply)
a. ____Raised additional funds e. ____Expanded facilitiesb. ____Increased staff/volunteers f. ____Made more referralsc. ____Expanded services g. ____Other (please specify):______________d. ____Restricted/reduced services
20. How much of an increase in requests for services is your organization presently able to absorb?____ None ____ 10% ______ 20% _____ 30% ______ 50% ______ Other
If the demand for services from your organization increases in the future beyond what you indicated above,would you: (Please check all that apply)
a. ____Be able to raise funds to serve more clients e. ____ None of the aboveb. ____Expand services f. ____ Other (specify)c. ____Have the staff/volunteers to provide additional servicesd. ____Restrict/reduce services _______________________________
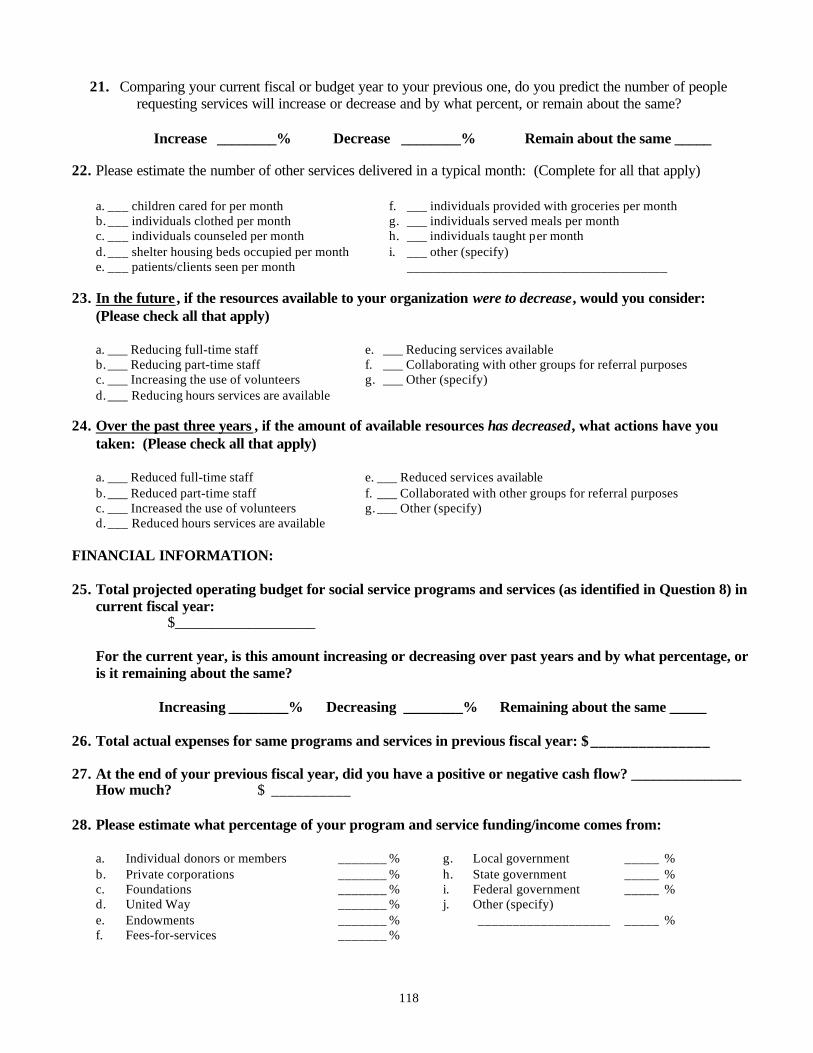
118
21. Comparing your current fiscal or budget year to your previous one, do you predict the number of peoplerequesting services will increase or decrease and by what percent, or remain about the same?
Increase ________% Decrease ________% Remain about the same _____
22. Please estimate the number of other services delivered in a typical month: (Complete for all that apply)
a. ___ children cared for per month f. ___ individuals provided with groceries per monthb.___ individuals clothed per month g. ___ individuals served meals per monthc. ___ individuals counseled per month h. ___ individuals taught per monthd.___ shelter housing beds occupied per month i. ___ other (specify)e. ___ patients/clients seen per month _______________________________________
23. In the future , if the resources available to your organization were to decrease, would you consider:(Please check all that apply)
a. ___ Reducing full-time staff e. ___ Reducing services availableb.___ Reducing part-time staff f. ___ Collaborating with other groups for referral purposesc. ___ Increasing the use of volunteers g. ___ Other (specify)d.___ Reducing hours services are available
24. Over the past three years , if the amount of available resources has decreased, what actions have youtaken: (Please check all that apply)
a. ___ Reduced full-time staff e. ___ Reduced services availableb.___ Reduced part-time staff f. ___ Collaborated with other groups for referral purposesc. ___ Increased the use of volunteers g.___ Other (specify)d.___ Reduced hours services are available
FINANCIAL INFORMATION:
25. Total projected operating budget for social service programs and services (as identified in Question 8) incurrent fiscal year:
$___________________
For the current year, is this amount increasing or decreasing over past years and by what percentage, oris it remaining about the same?
Increasing ________% Decreasing ________% Remaining about the same _____
26. Total actual expenses for same programs and services in previous fiscal year: $_______________
27. At the end of your previous fiscal year, did you have a positive or negative cash flow? _______________How much? $ __________
28. Please estimate what percentage of your program and service funding/income comes from:
a. Individual donors or members _______ % g. Local government _____ %b. Private corporations _______ % h. State government _____ %c. Foundations _______ % i. Federal government _____ %d. United Way _______ % j. Other (specify)e. Endowments _______ % ___________________ _____ %f. Fees-for-services _______ %
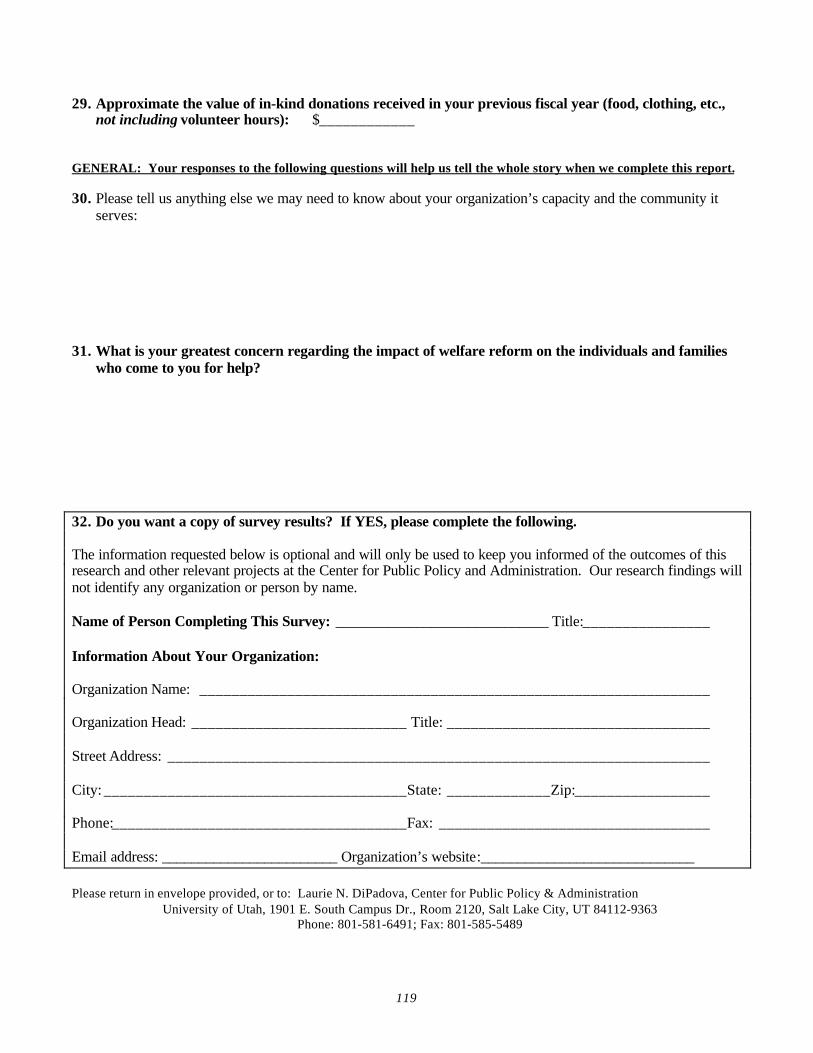
119
29. Approximate the value of in-kind donations received in your previous fiscal year (food, clothing, etc.,not including volunteer hours): $____________
GENERAL: Your responses to the following questions will help us tell the whole story when we complete this report.
30. Please tell us anything else we may need to know about your organization’s capacity and the community itserves:
31. What is your greatest concern regarding the impact of welfare reform on the individuals and familieswho come to you for help?
32. Do you want a copy of survey results? If YES, please complete the following.
The information requested below is optional and will only be used to keep you informed of the outcomes of thisresearch and other relevant projects at the Center for Public Policy and Administration. Our research findings willnot identify any organization or person by name.
Name of Person Completing This Survey: _____________________________ Title:________________
Information About Your Organization:
Organization Name: ________________________________________________________________
Organization Head: ___________________________ Title: _________________________________
Street Address: ____________________________________________________________________
City: ______________________________________State: _____________Zip:_________________
Phone:_____________________________________Fax: __________________________________
Email address: ________________________ Organization’s website:_____________________________
Please return in envelope provided, or to: Laurie N. DiPadova, Center for Public Policy & AdministrationUniversity of Utah, 1901 E. South Campus Dr., Room 2120, Salt Lake City, UT 84112-9363
Phone: 801-581-6491; Fax: 801-585-5489

120
121
APPENDIX C
Post Implementation Surveys and Cover Letters
The following are post-implementation surveys and cover letters mailed separately to bothnonprofit and religious organizations. For the second post-implementation survey, a secondletter and survey was sent to nonrespondents both letters are included but only one copy of thesurvey since it was identical except the return date.
The following outlines in order the documents that follow.
First Post-implementationReligious Organizations
Cover letter dated April 17, 2001Survey with response date of May 5, 2000
Nonprofit OrganizationsCover letter dated April 17, 2001Survey with response date of May 5, 2001
Second Post-implementationReligious Organizations
Cover letter dated July 18, 2001Follow-up cover letter dated August 8, 2001Survey with response date of August 18, 2001
Nonprofit OrganizationsCover letter dated July 18, 2001Follow-up cover letter dated August 8, 2001Survey with response date of August 18, 2001
April 17, 2000
Dear Congregational Leader,
Thank you very much for taking the time to complete the survey sent to you by the Center forPublic Policy and Administration last winter. We appreciate the valuable information providedby you and other organization leaders.
Government assistance for the poor is becoming less available, and those in need often turn tochurches for help. Under the sponsorship of the Utah Department of Workforce Services, we arecollecting information to examine the ability of religious congregations to serve those in need.As part of the TANF program, time limits on financial assistance began to be imposed in Utah onDecember 31, 1999. Part of our study of charitable social service capacity in Utah is to assessthe impact of time limits on congregations such as yours. The enclosed survey is designed as afollow-up to the initial survey. A second follow-up survey will also be sent in June 2000.
Please complete the attached survey for your congregation as accurately and thoroughly aspossible, focusing on the past three months since the implementation of time limits. We haveenclosed a prepaid-return envelope for your convenience in returning the completed survey, andask that you do so by May 5, 2000.
We assure you that your participation in this effort is completely voluntary. Your responses willbe held in strict confidence so as to minimize any possible risk to you or your congregation forparticipating. As a result of what you and other charitable leaders tell us, we will determine theimpact of welfare reform on the religious and other charitable organizations and their ability tomeet increased needs as necessary. If you do not want to complete the survey, we ask that youreturn it uncompleted in the prepaid envelope provided. The University of Utah’s Center forPublic Policy and Administration has embarked on a major research and partnership buildinginitiative to study the impact of welfare reform on both faith-based and nonfaith-based charitableorganizations. Religious, humanitarian, and government organizations have sponsored ourefforts. This survey is just one piece of this project.
Thank you in advance for taking the time to complete this survey. If you have any questionsregarding this research, please feel free to contact Laurie DiPadova at 801-585-1771 or HillaryDiamond at 801-581-6491.
Sincerely,
Laurie DiPadova, Ph.D.Policy Fellow
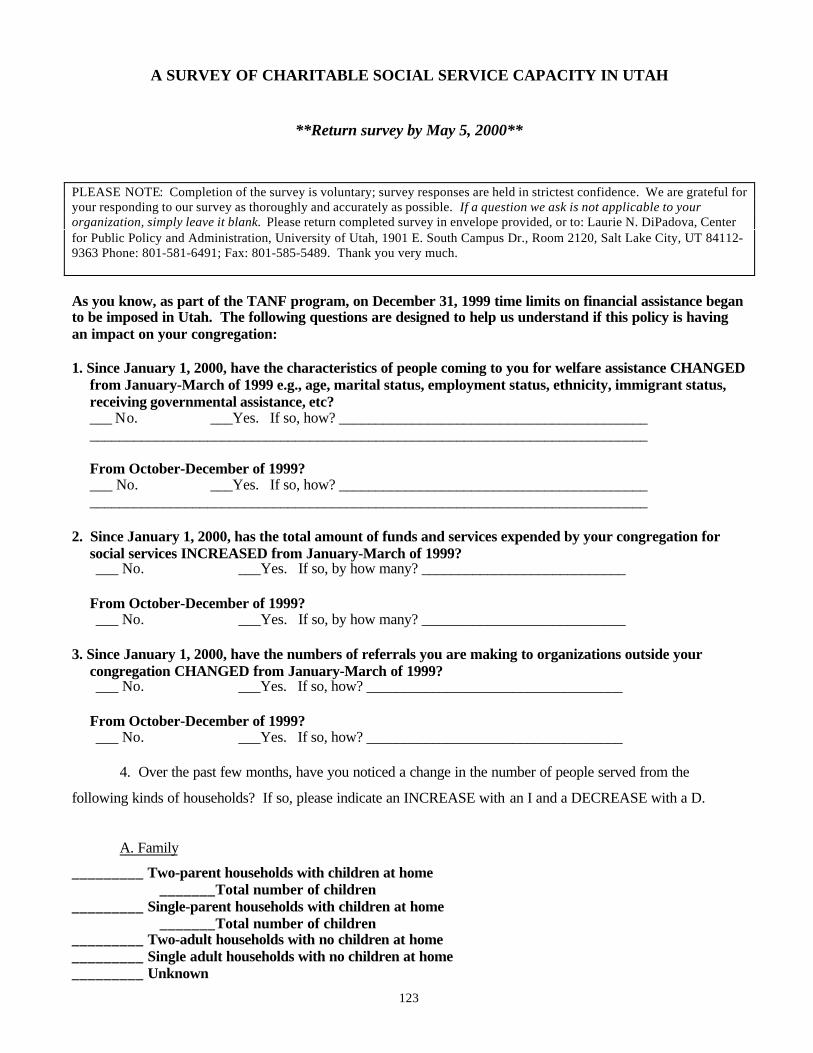
123
A SURVEY OF CHARITABLE SOCIAL SERVICE CAPACITY IN UTAH
**Return survey by May 5, 2000**
PLEASE NOTE: Completion of the survey is voluntary; survey responses are held in strictest confidence. We are grateful foryour responding to our survey as thoroughly and accurately as possible. If a question we ask is not applicable to yourorganization, simply leave it blank. Please return completed survey in envelope provided, or to: Laurie N. DiPadova, Centerfor Public Policy and Administration, University of Utah, 1901 E. South Campus Dr., Room 2120, Salt Lake City, UT 84112-9363 Phone: 801-581-6491; Fax: 801-585-5489. Thank you very much.
As you know, as part of the TANF program, on December 31, 1999 time limits on financial assistance beganto be imposed in Utah. The following questions are designed to help us understand if this policy is havingan impact on your congregation:
1. Since January 1, 2000, have the characteristics of people coming to you for welfare assistance CHANGEDfrom January-March of 1999 e.g., age, marital status, employment status, ethnicity, immigrant status,receiving governmental assistance, etc?___ No. ___Yes. If so, how? ______________________________________________________________________________________________________________________
From October-December of 1999?___ No. ___Yes. If so, how? ______________________________________________________________________________________________________________________
2. Since January 1, 2000, has the total amount of funds and services expended by your congregation forsocial services INCREASED from January-March of 1999?___ No. ___Yes. If so, by how many? ____________________________
From October-December of 1999?___ No. ___Yes. If so, by how many? ____________________________
3. Since January 1, 2000, have the numbers of referrals you are making to organizations outside yourcongregation CHANGED from January-March of 1999?___ No. ___Yes. If so, how? ___________________________________
From October-December of 1999?___ No. ___Yes. If so, how? ___________________________________
4. Over the past few months, have you noticed a change in the number of people served from the
following kinds of households? If so, please indicate an INCREASE with an I and a DECREASE with a D.
A. Family
_________ Two-parent households with children at home_______Total number of children
_________ Single-parent households with children at home_______Total number of children
_________ Two-adult households with no children at home_________ Single adult households with no children at home_________ Unknown
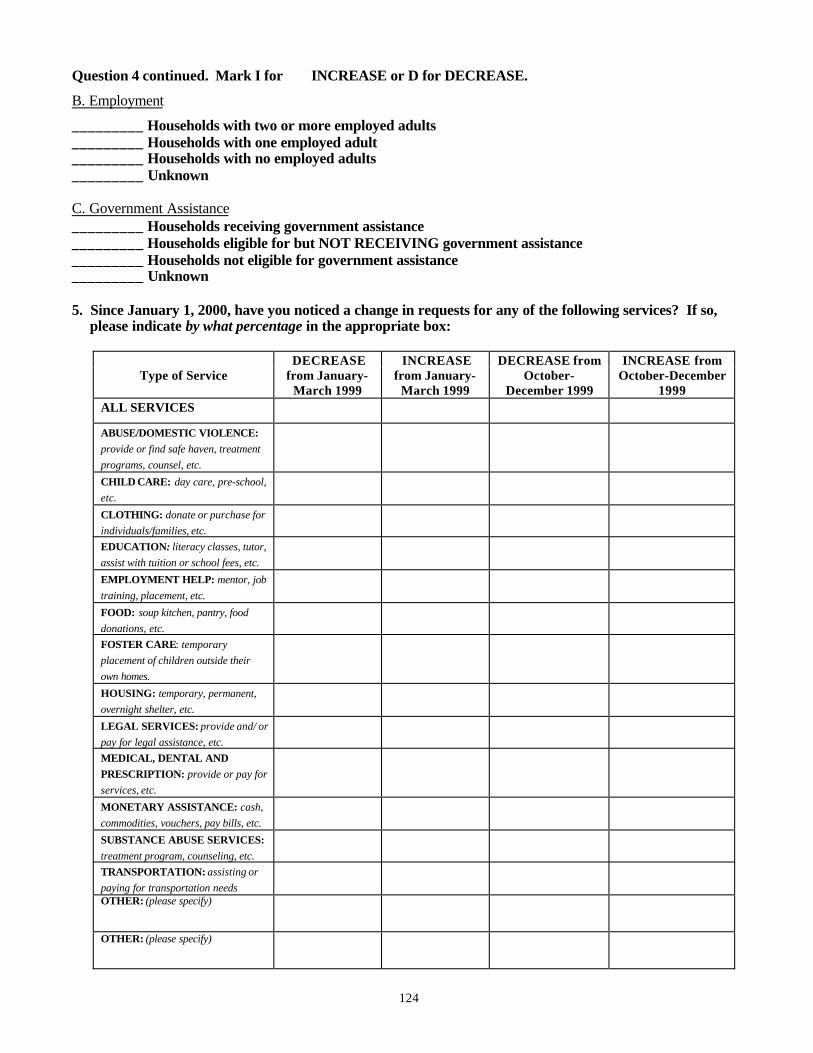
124
Question 4 continued. Mark I for INCREASE or D for DECREASE.
B. Employment
_________ Households with two or more employed adults_________ Households with one employed adult_________ Households with no employed adults_________ Unknown
C. Government Assistance_________ Households receiving government assistance_________ Households eligible for but NOT RECEIVING government assistance_________ Households not eligible for government assistance_________ Unknown
5. Since January 1, 2000, have you noticed a change in requests for any of the following services? If so,please indicate by what percentage in the appropriate box:
Type of ServiceDECREASE
from January-March 1999
INCREASEfrom January-
March 1999
DECREASE fromOctober-
December 1999
INCREASE fromOctober-December
1999ALL SERVICES
ABUSE/DOMESTIC VIOLENCE:provide or find safe haven, treatmentprograms, counsel, etc.
CHILD CARE: day care, pre-school,etc.
CLOTHING: donate or purchase forindividuals/families, etc.EDUCATION: literacy classes, tutor,assist with tuition or school fees, etc.
EMPLOYMENT HELP: mentor, jobtraining, placement, etc.
FOOD: soup kitchen, pantry, fooddonations, etc.FOSTER CARE: temporaryplacement of children outside theirown homes.
HOUSING: temporary, permanent,overnight shelter, etc.
LEGAL SERVICES: provide and/ orpay for legal assistance, etc.MEDICAL, DENTAL ANDPRESCRIPTION: provide or pay forservices, etc.
MONETARY ASSISTANCE: cash,commodities, vouchers, pay bills, etc.
SUBSTANCE ABUSE SERVICES:treatment program, counseling, etc.TRANSPORTATION: assisting orpaying for transportation needsOTHER: (please specify)
OTHER: (please specify)
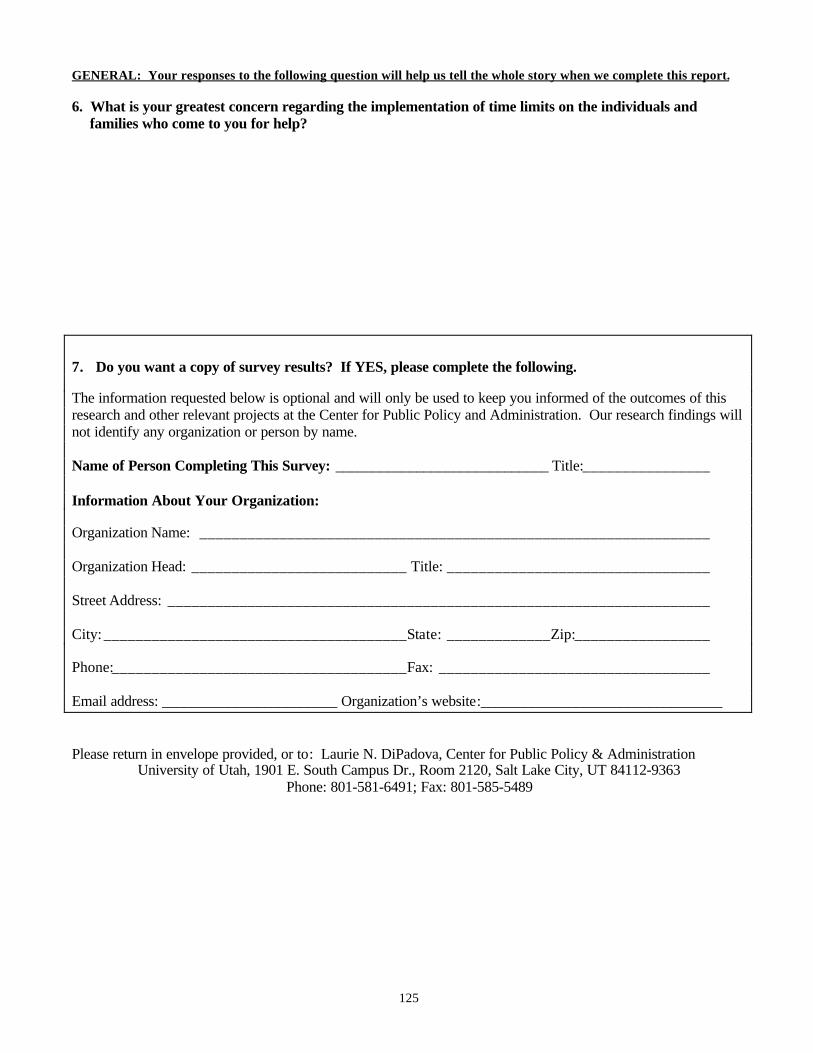
125
GENERAL: Your responses to the following question will help us tell the whole story when we complete this report.
6. What is your greatest concern regarding the implementation of time limits on the individuals andfamilies who come to you for help?
7. Do you want a copy of survey results? If YES, please complete the following.
The information requested below is optional and will only be used to keep you informed of the outcomes of thisresearch and other relevant projects at the Center for Public Policy and Administration. Our research findings willnot identify any organization or person by name.
Name of Person Completing This Survey: _____________________________ Title:________________
Information About Your Organization:
Organization Name: ________________________________________________________________
Organization Head: ___________________________ Title: _________________________________
Street Address: ____________________________________________________________________
City: ______________________________________State: _____________Zip:_________________
Phone:_____________________________________Fax: __________________________________
Email address: ________________________ Organization’s website:_________________________________
Please return in envelope provided, or to: Laurie N. DiPadova, Center for Public Policy & AdministrationUniversity of Utah, 1901 E. South Campus Dr., Room 2120, Salt Lake City, UT 84112-9363
Phone: 801-581-6491; Fax: 801-585-5489
April 17, 2000
Dear Charitable Organization Leader,
Thank you very much for taking the time to complete the survey sent to you by the Center forPublic Policy and Administration last winter. We appreciate the valuable information providedby you and other organization leaders.
Government assistance for the poor is becoming less available, and those in need often turn tocharitable organizations for help. Under the sponsorship of the Utah Department of WorkforceServices, we are collecting information to examine the ability of charitable organizations to servethose in need. As part of the TANF program, time limits on financial assistance began to beimposed in Utah on December 31, 1999. Part of our study of charitable social service capacity inUtah is to assess the impact of time limits on organizations such as yours. The enclosed surveyis designed as a follow-up to the initial survey. A second follow-up survey will also be sent inJune 2000.
Please complete the attached survey for your organization as accurately and thoroughly aspossible, focusing on the past three months since the implementation of time limits. We haveenclosed a prepaid-return envelope for your convenience in returning the completed survey, andask that you do so by April 30, 2000.
We assure you that your participation in this effort is completely voluntary. Your responses willbe held in strict confidence so as to minimize any possible risk to you or your organization forparticipating. As a result of what you and other charitable leaders tell us, we will determine theimpact of welfare reform on the charitable organizations and their ability to meet increased needsas necessary. If you do not want to complete the survey, we ask that you return it uncompletedin the prepaid envelope provided. The University of Utah’s Center for Public Policy andAdministration has embarked on a major research and partnership building initiative to study theimpact of welfare reform on both faith-based and nonfaith-based charitable organizations. Thissurvey is just one piece of this project.
Thank you in advance for taking the time to complete this survey. If you have any questionsregarding this research, please feel free to contact Laurie DiPadova at 801-585-1771 or HillaryDiamond at 801-581-6491.
Sincerely,
Laurie DiPadova, Ph.D.Policy Fellow
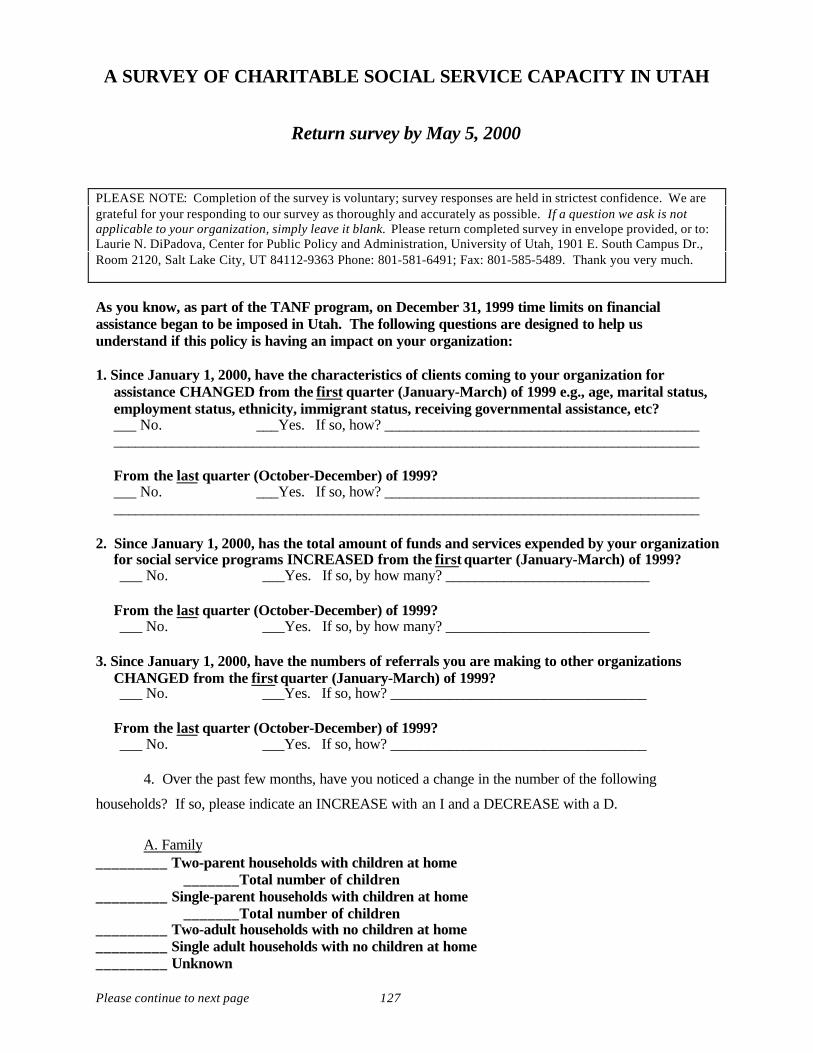
Please continue to next page 127
A SURVEY OF CHARITABLE SOCIAL SERVICE CAPACITY IN UTAH
Return survey by May 5, 2000
PLEASE NOTE: Completion of the survey is voluntary; survey responses are held in strictest confidence. We aregrateful for your responding to our survey as thoroughly and accurately as possible. If a question we ask is notapplicable to your organization, simply leave it blank. Please return completed survey in envelope provided, or to:Laurie N. DiPadova, Center for Public Policy and Administration, University of Utah, 1901 E. South Campus Dr.,Room 2120, Salt Lake City, UT 84112-9363 Phone: 801-581-6491; Fax: 801-585-5489. Thank you very much.
As you know, as part of the TANF program, on December 31, 1999 time limits on financialassistance began to be imposed in Utah. The following questions are designed to help usunderstand if this policy is having an impact on your organization:
1. Since January 1, 2000, have the characteristics of clients coming to your organization forassistance CHANGED from the first quarter (January-March) of 1999 e.g., age, marital status,employment status, ethnicity, immigrant status, receiving governmental assistance, etc?___ No. ___Yes. If so, how? ___________________________________________________________________________________________________________________________
From the last quarter (October-December) of 1999?___ No. ___Yes. If so, how? ___________________________________________________________________________________________________________________________
2. Since January 1, 2000, has the total amount of funds and services expended by your organizationfor social service programs INCREASED from the first quarter (January-March) of 1999?___ No. ___Yes. If so, by how many? ____________________________
From the last quarter (October-December) of 1999?___ No. ___Yes. If so, by how many? ____________________________
3. Since January 1, 2000, have the numbers of referrals you are making to other organizationsCHANGED from the first quarter (January-March) of 1999?___ No. ___Yes. If so, how? ___________________________________
From the last quarter (October-December) of 1999?___ No. ___Yes. If so, how? ___________________________________
4. Over the past few months, have you noticed a change in the number of the following
households? If so, please indicate an INCREASE with an I and a DECREASE with a D.
A. Family_________ Two-parent households with children at home
_______Total number of children_________ Single-parent households with children at home
_______Total number of children_________ Two-adult households with no children at home_________ Single adult households with no children at home_________ Unknown
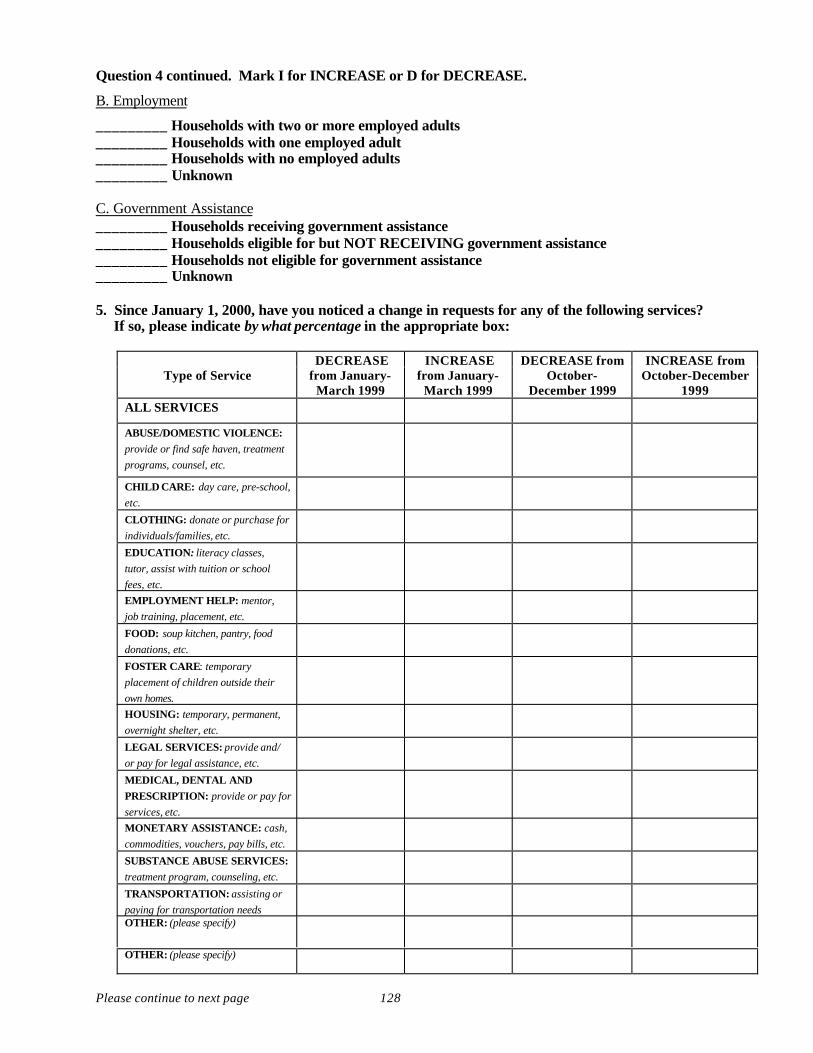
Please continue to next page 128
Question 4 continued. Mark I for INCREASE or D for DECREASE.
B. Employment
_________ Households with two or more employed adults_________ Households with one employed adult_________ Households with no employed adults_________ Unknown
C. Government Assistance_________ Households receiving government assistance_________ Households eligible for but NOT RECEIVING government assistance_________ Households not eligible for government assistance_________ Unknown
5. Since January 1, 2000, have you noticed a change in requests for any of the following services?If so, please indicate by what percentage in the appropriate box:
Type of ServiceDECREASE
from January-March 1999
INCREASEfrom January-
March 1999
DECREASE fromOctober-
December 1999
INCREASE fromOctober-December
1999ALL SERVICES
ABUSE/DOMESTIC VIOLENCE:provide or find safe haven, treatmentprograms, counsel, etc.
CHILD CARE: day care, pre-school,etc.
CLOTHING: donate or purchase forindividuals/families, etc.
EDUCATION: literacy classes,tutor, assist with tuition or schoolfees, etc.EMPLOYMENT HELP: mentor,job training, placement, etc.
FOOD: soup kitchen, pantry, fooddonations, etc.
FOSTER CARE: temporaryplacement of children outside theirown homes.HOUSING: temporary, permanent,overnight shelter, etc.
LEGAL SERVICES: provide and/or pay for legal assistance, etc.
MEDICAL, DENTAL ANDPRESCRIPTION: provide or pay forservices, etc.MONETARY ASSISTANCE: cash,commodities, vouchers, pay bills, etc.
SUBSTANCE ABUSE SERVICES:treatment program, counseling, etc.
TRANSPORTATION: assisting orpaying for transportation needsOTHER: (please specify)
OTHER: (please specify)
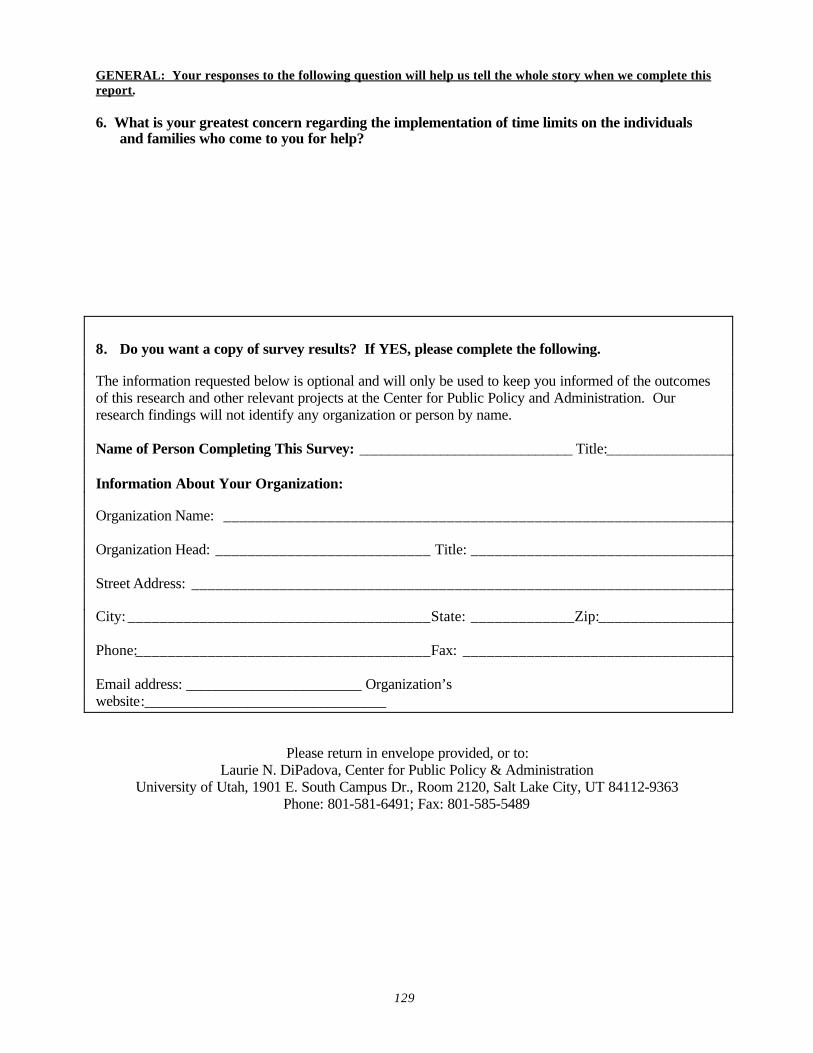
129
GENERAL: Your responses to the following question will help us tell the whole story when we complete thisreport.
6. What is your greatest concern regarding the implementation of time limits on the individualsand families who come to you for help?
8. Do you want a copy of survey results? If YES, please complete the following.
The information requested below is optional and will only be used to keep you informed of the outcomesof this research and other relevant projects at the Center for Public Policy and Administration. Ourresearch findings will not identify any organization or person by name.
Name of Person Completing This Survey: _____________________________ Title:________________
Information About Your Organization:
Organization Name: ________________________________________________________________
Organization Head: ___________________________ Title: _________________________________
Street Address: ____________________________________________________________________
City: ______________________________________State: _____________Zip:_________________
Phone:_____________________________________Fax: __________________________________
Email address: ________________________ Organization’swebsite:_________________________________
Please return in envelope provided, or to:Laurie N. DiPadova, Center for Public Policy & Administration
University of Utah, 1901 E. South Campus Dr., Room 2120, Salt Lake City, UT 84112-9363Phone: 801-581-6491; Fax: 801-585-5489
July 18, 2000
Dear Congregational Leader,
Thank you very much for taking the time to complete the survey sent to you by the Center forPublic Policy and Administration last winter. We appreciate the valuable information providedby you and other organization leaders.
Under the sponsorship of the Utah Department of Workforce Services, we are collectinginformation to examine the ability of charitable organizations to serve those in need. Part of ourstudy is to assess the impact of TANF time limits—imposed in Utah on December 31, 1999—oncongregations such as yours. The enclosed survey is designed as a follow-up to the initial surveyas well as to the first post-implementation time limit survey you received in May of this year.This is the final survey we will be conducting in this study. Consequently, it is the lastopportunity you have to tell us if and how your congregation and the people you serve have beenimpacted. We need your help to accurately determine demand for charitable services in Utah.
We assure you that your participation in this effort is completely voluntary. Your responses willbe held in strict confidence so as to minimize any possible risk to you or your organization forparticipating. As a result of what you and other charitable leaders tell us, we will determine theimpact of welfare reform on the religious and other charitable organizations and their ability tomeet increased needs as necessary. If you do not want to complete the survey, we ask that youreturn it uncompleted in the prepaid envelope provided. The University of Utah’s Center forPublic Policy and Administration has embarked on a major research and partnership buildinginitiative to study the impact of welfare reform on both faith-based and nonfaith-based charitableorganizations. This survey is just one piece of this project.
Thank you in advance for taking the time to complete this survey. If you have any questionsregarding this research, please feel free to contact Laurie DiPadova at (801) 585-1771 or SaraMcCormick at (801) 581-6491.
Sincerely,
Laurie DiPadova, Ph.D.Policy Fellow
Please complete the attached survey for your congregation as accurately and thoroughly aspossible, focusing on the six months since the implementation of time limits. We haveenclosed a prepaid-return envelope for your convenience in returning the completed survey.
Please return the survey by August 1, 2000.
August 8, 2000
Dear Congregational Leader,
Thank you very much for taking the time to complete the survey sent to you by the Center forPublic Policy and Administration last winter. We appreciate the valuable information providedby you and other organization leaders. We need your help, again—NOW!
Under the sponsorship of the Utah Department of Workforce Services, we are collectinginformation to examine the ability of religious congregations to serve those in need. Part of ourstudy is to assess the impact of TANF time limits—implemented in Utah on December 31,1999—on congregations such as yours. The enclosed survey is designed as a follow-up to theinitial survey as well as to the first post-implementation time limit survey you received in May ofthis year. This is the final survey we will be conducting in this study. Consequently, it is the lastopportunity you have to tell us if and how your congregation and the people who come to youhave been impacted. We need your help to accurately determine demand for charitable servicesin Utah.
We assure you that your participation in this effort is completely voluntary. Your responses willbe held in strict confidence so as to minimize any possible risk to you or your congregation forparticipating. As a result of what you and other charitable leaders tell us, we will determine theimpact of welfare reform on the religious and other charitable organizations and their ability tomeet increased needs as necessary. If you do not want to complete the survey, we ask that youreturn it uncompleted in the prepaid envelope provided. The University of Utah’s Center forPublic Policy and Administration has embarked on a major research and partnership buildinginitiative to study the impact of welfare reform on both faith-based and nonfaith-based charitableorganizations. Religious, humanitarian, and government organizations have sponsored ourefforts. This survey is just one piece of this project.
Thank you in advance for taking the time to complete this survey. If you have any questionsregarding this research, please feel free to contact Laurie N. DiPadova at (801) 585-1771 or SaraMcCormick at (801) 581-6491.
Sincerely,
Laurie N. DiPadova, Ph.D.Policy Fellow
Please complete the attached survey for your congregation as accurately and thoroughly aspossible, focusing on the six months since the implementation of time limits. We haveenclosed a prepaid-return envelope for your convenience in returning the completed survey.
Please return the survey by August 18, 2000.
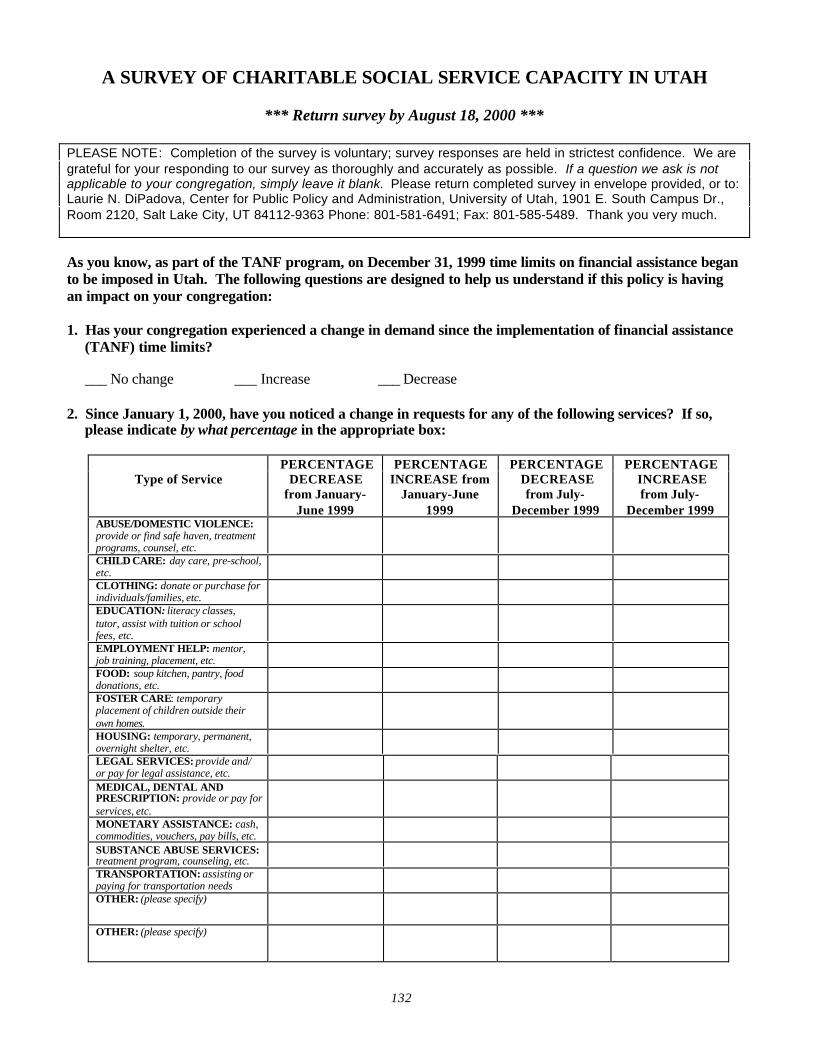
132
A SURVEY OF CHARITABLE SOCIAL SERVICE CAPACITY IN UTAH
*** Return survey by August 18, 2000 ***
PLEASE NOTE: Completion of the survey is voluntary; survey responses are held in strictest confidence. We aregrateful for your responding to our survey as thoroughly and accurately as possible. If a question we ask is notapplicable to your congregation, simply leave it blank. Please return completed survey in envelope provided, or to:Laurie N. DiPadova, Center for Public Policy and Administration, University of Utah, 1901 E. South Campus Dr.,Room 2120, Salt Lake City, UT 84112-9363 Phone: 801-581-6491; Fax: 801-585-5489. Thank you very much.
As you know, as part of the TANF program, on December 31, 1999 time limits on financial assistance beganto be imposed in Utah. The following questions are designed to help us understand if this policy is havingan impact on your congregation:
1. Has your congregation experienced a change in demand since the implementation of financial assistance(TANF) time limits?
___ No change ___ Increase ___ Decrease
2. Since January 1, 2000, have you noticed a change in requests for any of the following services? If so,please indicate by what percentage in the appropriate box:
Type of ServicePERCENTAGE
DECREASEfrom January-
June 1999
PERCENTAGEINCREASE from
January-June1999
PERCENTAGEDECREASEfrom July-
December 1999
PERCENTAGEINCREASEfrom July-
December 1999ABUSE/DOMESTIC VIOLENCE:provide or find safe haven, treatmentprograms, counsel, etc.CHILD CARE: day care, pre-school,etc.CLOTHING: donate or purchase forindividuals/families, etc.EDUCATION: literacy classes,tutor, assist with tuition or schoolfees, etc.EMPLOYMENT HELP: mentor,job training, placement, etc.FOOD: soup kitchen, pantry, fooddonations, etc.FOSTER CARE: temporaryplacement of children outside theirown homes.HOUSING: temporary, permanent,overnight shelter, etc.LEGAL SERVICES: provide and/or pay for legal assistance, etc.MEDICAL, DENTAL ANDPRESCRIPTION: provide or pay forservices, etc.MONETARY ASSISTANCE: cash,commodities, vouchers, pay bills, etc.SUBSTANCE ABUSE SERVICES:treatment program, counseling, etc.TRANSPORTATION: assisting orpaying for transportation needsOTHER: (please specify)
OTHER: (please specify)
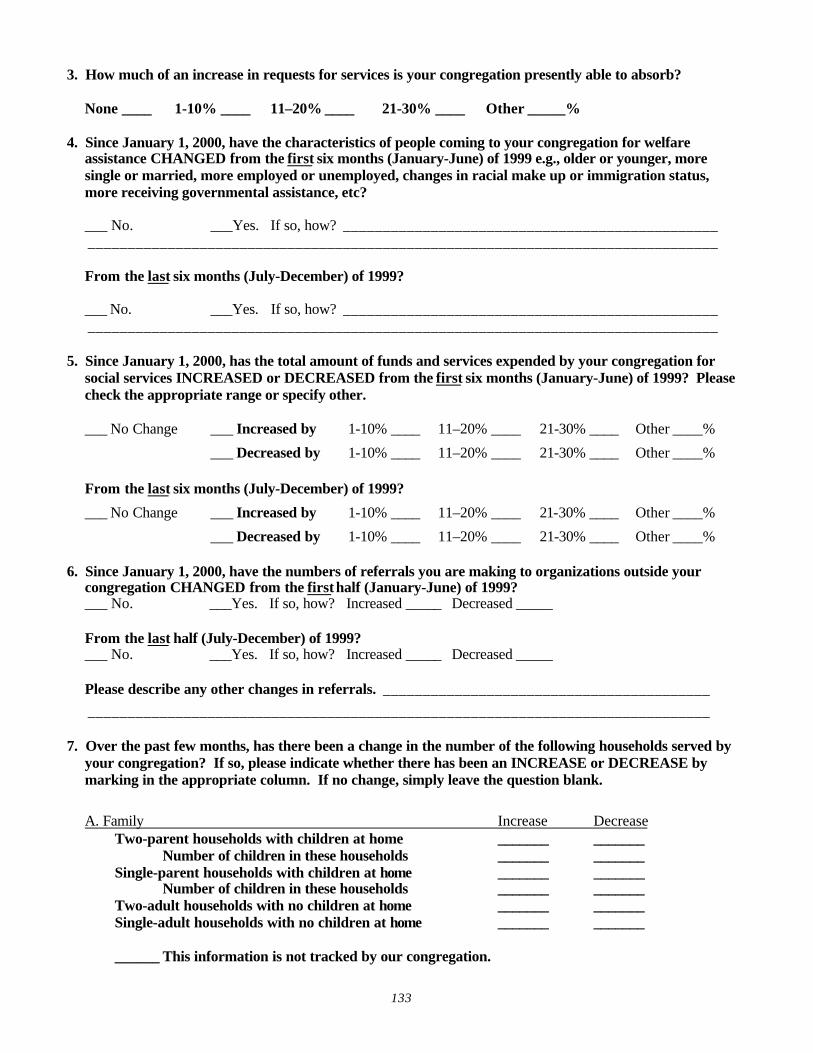
133
3. How much of an increase in requests for services is your congregation presently able to absorb?
None ____ 1-10% ____ 11–20% ____ 21-30% ____ Other _____%
4. Since January 1, 2000, have the characteristics of people coming to your congregation for welfareassistance CHANGED from the first six months (January-June) of 1999 e.g., older or younger, moresingle or married, more employed or unemployed, changes in racial make up or immigration status,more receiving governmental assistance, etc?
___ No. ___Yes. If so, how? ______________________________________________________________________________________________________________________________
From the last six months (July-December) of 1999?
___ No. ___Yes. If so, how? ______________________________________________________________________________________________________________________________
5. Since January 1, 2000, has the total amount of funds and services expended by your congregation forsocial services INCREASED or DECREASED from the first six months (January-June) of 1999? Pleasecheck the appropriate range or specify other.
___ No Change ___ Increased by 1-10% ____ 11–20% ____ 21-30% ____ Other ____%
___ Decreased by 1-10% ____ 11–20% ____ 21-30% ____ Other ____%
From the last six months (July-December) of 1999?
___ No Change ___ Increased by 1-10% ____ 11–20% ____ 21-30% ____ Other ____%
___ Decreased by 1-10% ____ 11–20% ____ 21-30% ____ Other ____%
6. Since January 1, 2000, have the numbers of referrals you are making to organizations outside yourcongregation CHANGED from the first half (January-June) of 1999?___ No. ___Yes. If so, how? Increased _____ Decreased _____
From the last half (July-December) of 1999?___ No. ___Yes. If so, how? Increased _____ Decreased _____
Please describe any other changes in referrals. _______________________________________________________________________________________________________________________
7. Over the past few months, has there been a change in the number of the following households served byyour congregation? If so, please indicate whether there has been an INCREASE or DECREASE bymarking in the appropriate column. If no change, simply leave the question blank.
A. Family Increase DecreaseTwo-parent households with children at home _______ _______
Number of children in these households _______ _______Single-parent households with children at home _______ _______
Number of children in these households _______ _______Two-adult households with no children at home _______ _______Single-adult households with no children at home _______ _______
______ This information is not tracked by our congregation.
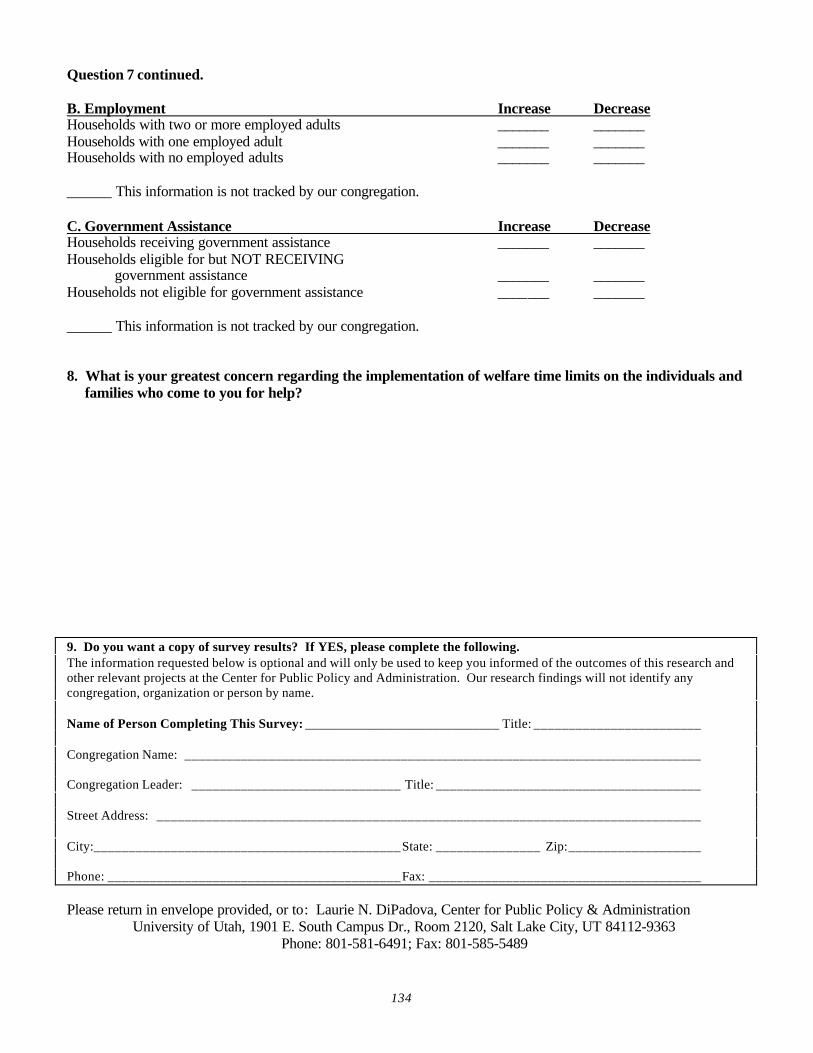
134
Question 7 continued.
B. Employment Increase DecreaseHouseholds with two or more employed adults _______ _______Households with one employed adult _______ _______Households with no employed adults _______ _______
______ This information is not tracked by our congregation.
C. Government Assistance Increase DecreaseHouseholds receiving government assistance _______ _______Households eligible for but NOT RECEIVING
government assistance _______ _______Households not eligible for government assistance _______ _______
______ This information is not tracked by our congregation.
8. What is your greatest concern regarding the implementation of welfare time limits on the individuals andfamilies who come to you for help?
9. Do you want a copy of survey results? If YES, please complete the following.The information requested below is optional and will only be used to keep you informed of the outcomes of this research andother relevant projects at the Center for Public Policy and Administration. Our research findings will not identify anycongregation, organization or person by name.
Name of Person Completing This Survey: _____________________________ Title: ________________________
Congregation Name: __________________________________________________________________________
Congregation Leader: ______________________________ Title: ______________________________________
Street Address: ______________________________________________________________________________
City:____________________________________________State: _______________ Zip:___________________
Phone: __________________________________________Fax: _______________________________________
Please return in envelope provided, or to: Laurie N. DiPadova, Center for Public Policy & AdministrationUniversity of Utah, 1901 E. South Campus Dr., Room 2120, Salt Lake City, UT 84112-9363
Phone: 801-581-6491; Fax: 801-585-5489
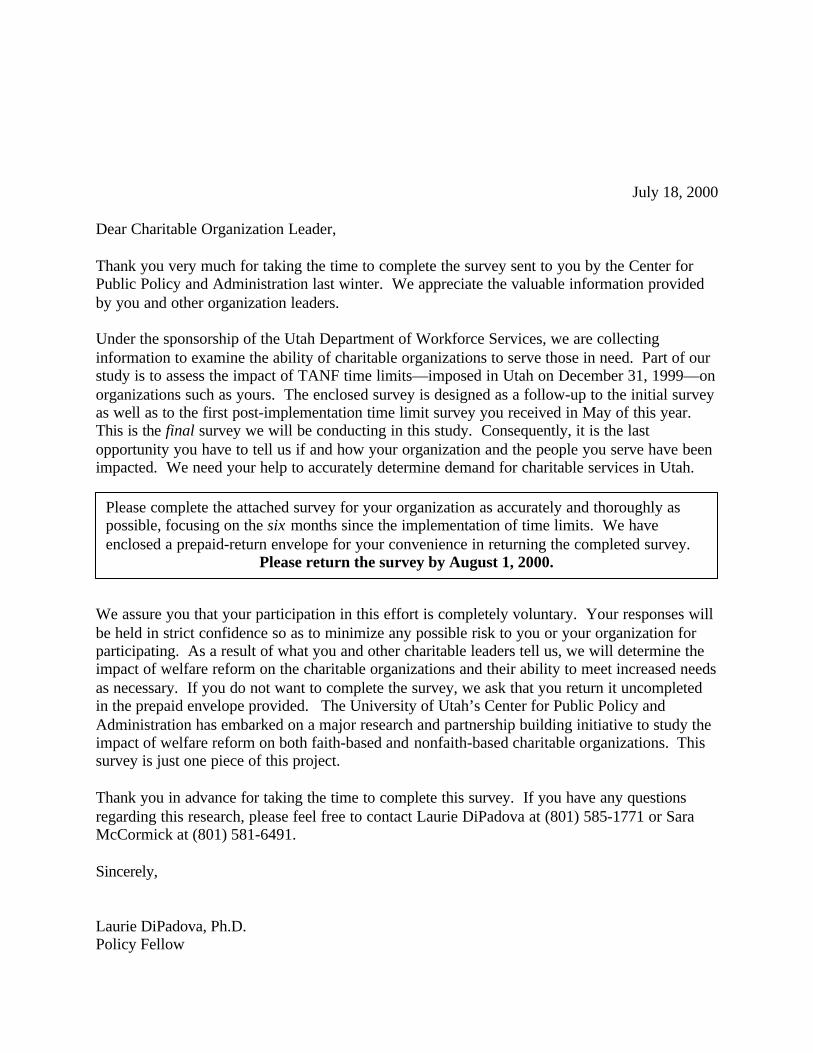
July 18, 2000
Dear Charitable Organization Leader,
Thank you very much for taking the time to complete the survey sent to you by the Center forPublic Policy and Administration last winter. We appreciate the valuable information providedby you and other organization leaders.
Under the sponsorship of the Utah Department of Workforce Services, we are collectinginformation to examine the ability of charitable organizations to serve those in need. Part of ourstudy is to assess the impact of TANF time limits—imposed in Utah on December 31, 1999—onorganizations such as yours. The enclosed survey is designed as a follow-up to the initial surveyas well as to the first post-implementation time limit survey you received in May of this year.This is the final survey we will be conducting in this study. Consequently, it is the lastopportunity you have to tell us if and how your organization and the people you serve have beenimpacted. We need your help to accurately determine demand for charitable services in Utah.
We assure you that your participation in this effort is completely voluntary. Your responses willbe held in strict confidence so as to minimize any possible risk to you or your organization forparticipating. As a result of what you and other charitable leaders tell us, we will determine theimpact of welfare reform on the charitable organizations and their ability to meet increased needsas necessary. If you do not want to complete the survey, we ask that you return it uncompletedin the prepaid envelope provided. The University of Utah’s Center for Public Policy andAdministration has embarked on a major research and partnership building initiative to study theimpact of welfare reform on both faith-based and nonfaith-based charitable organizations. Thissurvey is just one piece of this project.
Thank you in advance for taking the time to complete this survey. If you have any questionsregarding this research, please feel free to contact Laurie DiPadova at (801) 585-1771 or SaraMcCormick at (801) 581-6491.
Sincerely,
Laurie DiPadova, Ph.D.Policy Fellow
Please complete the attached survey for your organization as accurately and thoroughly aspossible, focusing on the six months since the implementation of time limits. We haveenclosed a prepaid-return envelope for your convenience in returning the completed survey.
Please return the survey by August 1, 2000.
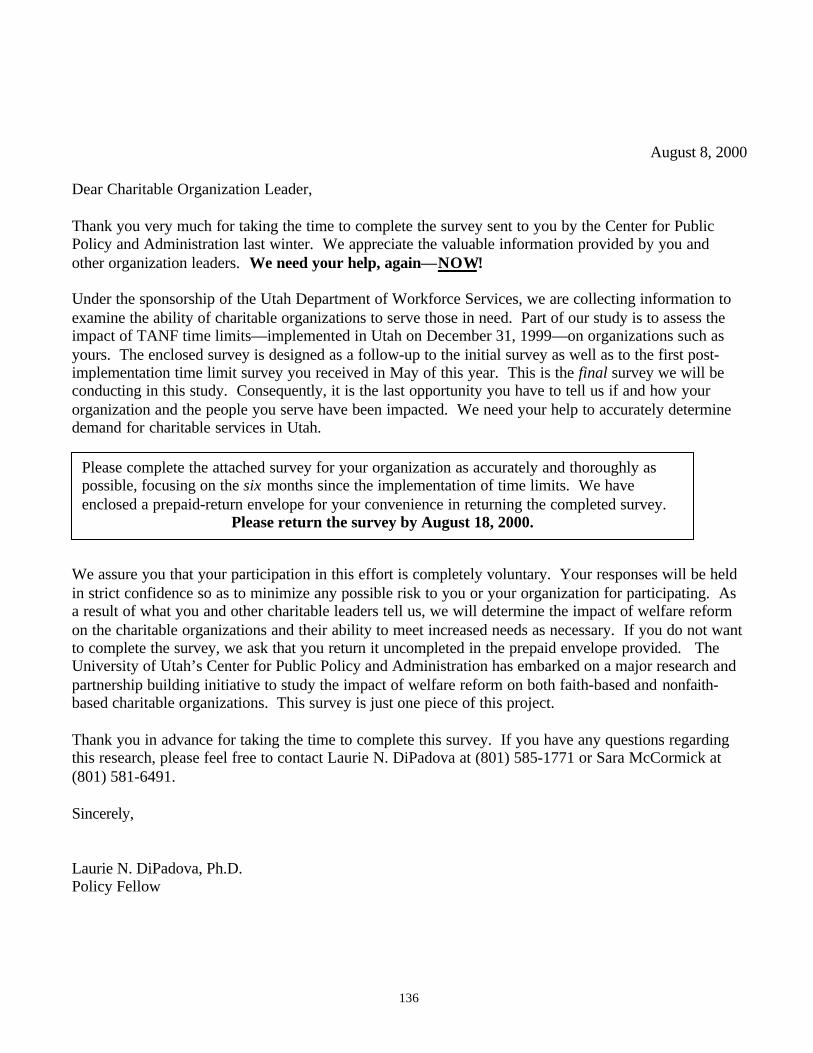
136
August 8, 2000
Dear Charitable Organization Leader,
Thank you very much for taking the time to complete the survey sent to you by the Center for PublicPolicy and Administration last winter. We appreciate the valuable information provided by you andother organization leaders. We need your help, again—NOW!
Under the sponsorship of the Utah Department of Workforce Services, we are collecting information toexamine the ability of charitable organizations to serve those in need. Part of our study is to assess theimpact of TANF time limits—implemented in Utah on December 31, 1999—on organizations such asyours. The enclosed survey is designed as a follow-up to the initial survey as well as to the first post-implementation time limit survey you received in May of this year. This is the final survey we will beconducting in this study. Consequently, it is the last opportunity you have to tell us if and how yourorganization and the people you serve have been impacted. We need your help to accurately determinedemand for charitable services in Utah.
We assure you that your participation in this effort is completely voluntary. Your responses will be heldin strict confidence so as to minimize any possible risk to you or your organization for participating. Asa result of what you and other charitable leaders tell us, we will determine the impact of welfare reformon the charitable organizations and their ability to meet increased needs as necessary. If you do not wantto complete the survey, we ask that you return it uncompleted in the prepaid envelope provided. TheUniversity of Utah’s Center for Public Policy and Administration has embarked on a major research andpartnership building initiative to study the impact of welfare reform on both faith-based and nonfaith-based charitable organizations. This survey is just one piece of this project.
Thank you in advance for taking the time to complete this survey. If you have any questions regardingthis research, please feel free to contact Laurie N. DiPadova at (801) 585-1771 or Sara McCormick at(801) 581-6491.
Sincerely,
Laurie N. DiPadova, Ph.D.Policy Fellow
Please complete the attached survey for your organization as accurately and thoroughly aspossible, focusing on the six months since the implementation of time limits. We haveenclosed a prepaid-return envelope for your convenience in returning the completed survey.
Please return the survey by August 18, 2000.
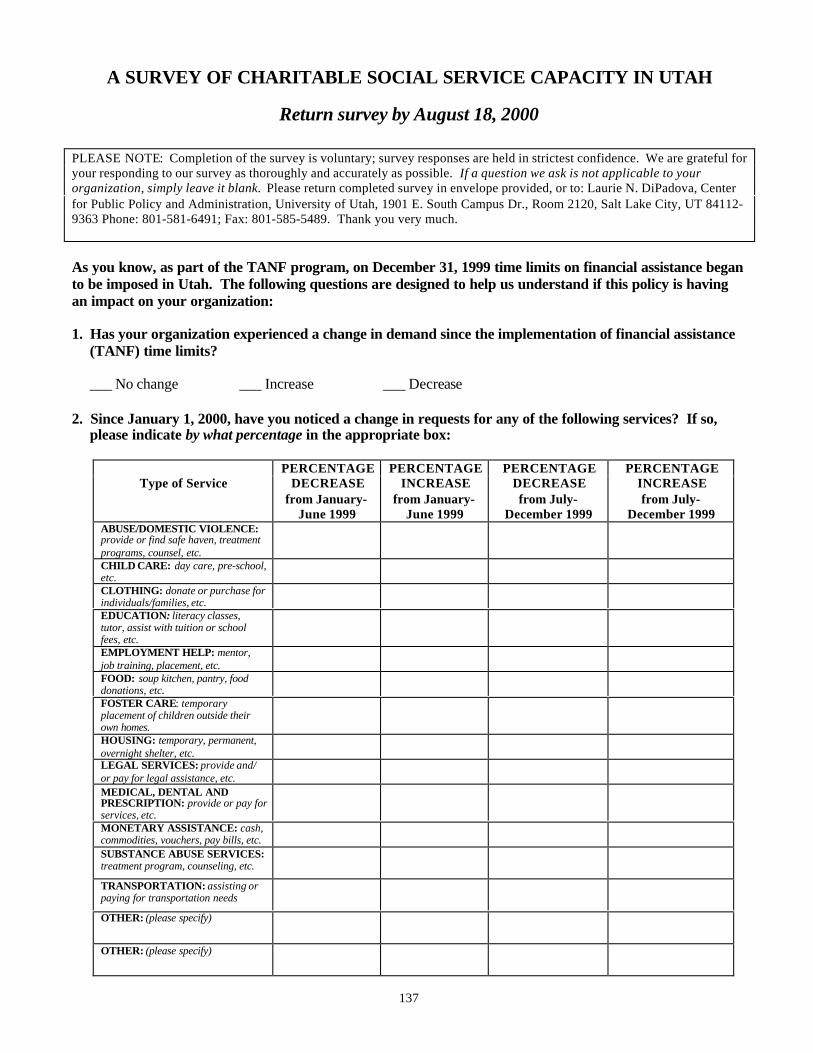
137
A SURVEY OF CHARITABLE SOCIAL SERVICE CAPACITY IN UTAH
Return survey by August 18, 2000
PLEASE NOTE: Completion of the survey is voluntary; survey responses are held in strictest confidence. We are grateful foryour responding to our survey as thoroughly and accurately as possible. If a question we ask is not applicable to yourorganization, simply leave it blank. Please return completed survey in envelope provided, or to: Laurie N. DiPadova, Centerfor Public Policy and Administration, University of Utah, 1901 E. South Campus Dr., Room 2120, Salt Lake City, UT 84112-9363 Phone: 801-581-6491; Fax: 801-585-5489. Thank you very much.
As you know, as part of the TANF program, on December 31, 1999 time limits on financial assistance beganto be imposed in Utah. The following questions are designed to help us understand if this policy is havingan impact on your organization:
1. Has your organization experienced a change in demand since the implementation of financial assistance(TANF) time limits?
___ No change ___ Increase ___ Decrease
2. Since January 1, 2000, have you noticed a change in requests for any of the following services? If so,please indicate by what percentage in the appropriate box:
Type of ServicePERCENTAGE
DECREASEfrom January-
June 1999
PERCENTAGEINCREASE
from January-June 1999
PERCENTAGEDECREASEfrom July-
December 1999
PERCENTAGEINCREASEfrom July-
December 1999ABUSE/DOMESTIC VIOLENCE:provide or find safe haven, treatmentprograms, counsel, etc.CHILD CARE: day care, pre-school,etc.CLOTHING: donate or purchase forindividuals/families, etc.EDUCATION: literacy classes,tutor, assist with tuition or schoolfees, etc.EMPLOYMENT HELP: mentor,job training, placement, etc.FOOD: soup kitchen, pantry, fooddonations, etc.FOSTER CARE: temporaryplacement of children outside theirown homes.HOUSING: temporary, permanent,overnight shelter, etc.LEGAL SERVICES: provide and/or pay for legal assistance, etc.MEDICAL, DENTAL ANDPRESCRIPTION: provide or pay forservices, etc.MONETARY ASSISTANCE: cash,commodities, vouchers, pay bills, etc.SUBSTANCE ABUSE SERVICES:treatment program, counseling, etc.
TRANSPORTATION: assisting orpaying for transportation needs
OTHER: (please specify)
OTHER: (please specify)
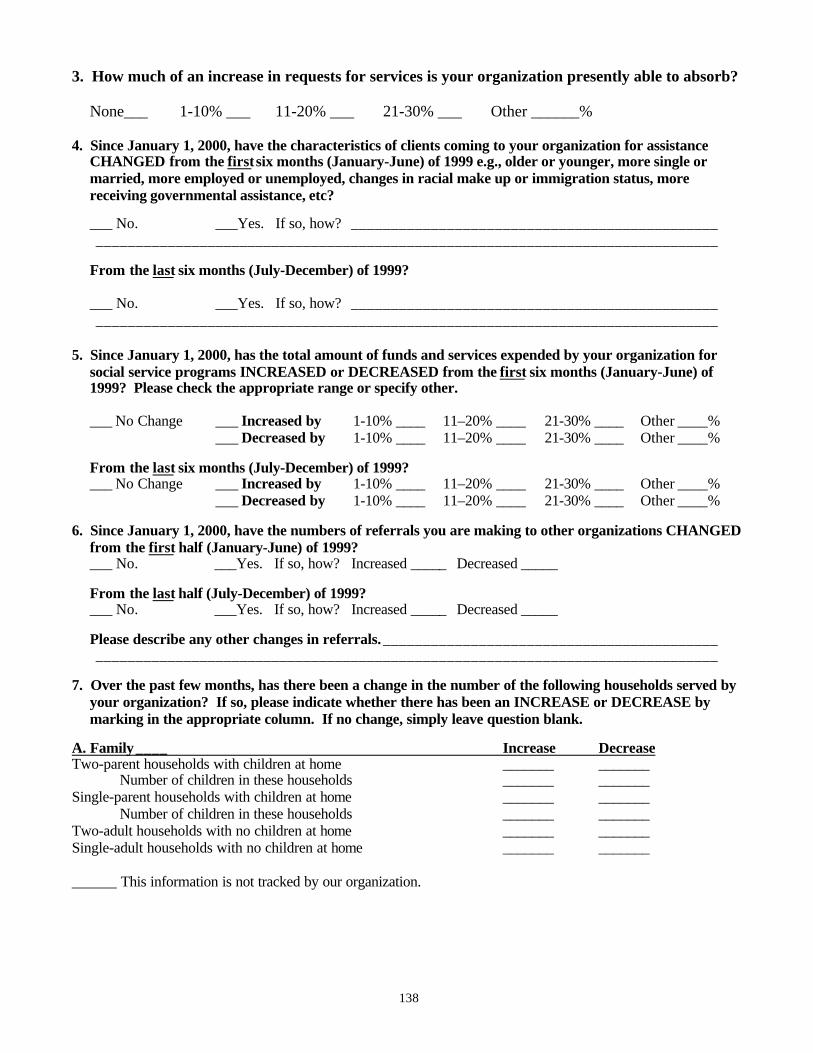
138
3. How much of an increase in requests for services is your organization presently able to absorb?
None___ 1-10% ___ 11-20% ___ 21-30% ___ Other ______%
4. Since January 1, 2000, have the characteristics of clients coming to your organization for assistanceCHANGED from the first six months (January-June) of 1999 e.g., older or younger, more single ormarried, more employed or unemployed, changes in racial make up or immigration status, morereceiving governmental assistance, etc?
___ No. ___Yes. If so, how? ____________________________________________________________________________________________________________________________
From the last six months (July-December) of 1999?
___ No. ___Yes. If so, how? ____________________________________________________________________________________________________________________________
5. Since January 1, 2000, has the total amount of funds and services expended by your organization forsocial service programs INCREASED or DECREASED from the first six months (January-June) of1999? Please check the appropriate range or specify other.
___ No Change ___ Increased by 1-10% ____ 11–20% ____ 21-30% ____ Other ____%___ Decreased by 1-10% ____ 11–20% ____ 21-30% ____ Other ____%
From the last six months (July-December) of 1999?___ No Change ___ Increased by 1-10% ____ 11–20% ____ 21-30% ____ Other ____%
___ Decreased by 1-10% ____ 11–20% ____ 21-30% ____ Other ____%
6. Since January 1, 2000, have the numbers of referrals you are making to other organizations CHANGEDfrom the first half (January-June) of 1999?___ No. ___Yes. If so, how? Increased _____ Decreased _____
From the last half (July-December) of 1999?___ No. ___Yes. If so, how? Increased _____ Decreased _____
Please describe any other changes in referrals. ________________________________________________________________________________________________________________________
7. Over the past few months, has there been a change in the number of the following households served byyour organization? If so, please indicate whether there has been an INCREASE or DECREASE bymarking in the appropriate column. If no change, simply leave question blank.
A. Family ____ Increase DecreaseTwo-parent households with children at home _______ _______
Number of children in these households _______ _______Single-parent households with children at home _______ _______
Number of children in these households _______ _______Two-adult households with no children at home _______ _______Single-adult households with no children at home _______ _______
______ This information is not tracked by our organization.
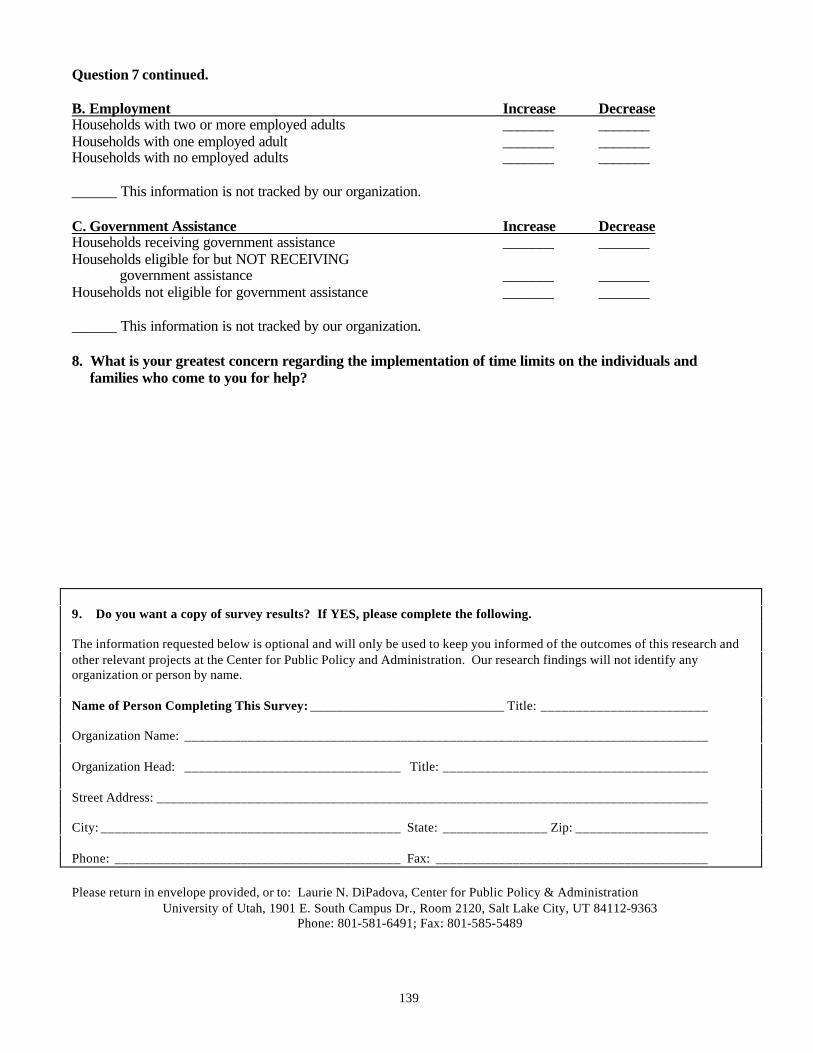
139
Question 7 continued.
B. Employment Increase DecreaseHouseholds with two or more employed adults _______ _______Households with one employed adult _______ _______Households with no employed adults _______ _______
______ This information is not tracked by our organization.
C. Government Assistance Increase DecreaseHouseholds receiving government assistance _______ _______Households eligible for but NOT RECEIVING
government assistance _______ _______Households not eligible for government assistance _______ _______
______ This information is not tracked by our organization.
8. What is your greatest concern regarding the implementation of time limits on the individuals andfamilies who come to you for help?
9. Do you want a copy of survey results? If YES, please complete the following.
The information requested below is optional and will only be used to keep you informed of the outcomes of this research andother relevant projects at the Center for Public Policy and Administration. Our research findings will not identify anyorganization or person by name.
Name of Person Completing This Survey: _____________________________ Title: ________________________
Organization Name: ___________________________________________________________________________
Organization Head: _______________________________ Title: ______________________________________
Street Address: _______________________________________________________________________________
City: ___________________________________________ State: _______________ Zip: ___________________
Phone: _________________________________________ Fax: _______________________________________
Please return in envelope provided, or to: Laurie N. DiPadova, Center for Public Policy & AdministrationUniversity of Utah, 1901 E. South Campus Dr., Room 2120, Salt Lake City, UT 84112-9363
Phone: 801-581-6491; Fax: 801-585-5489

140
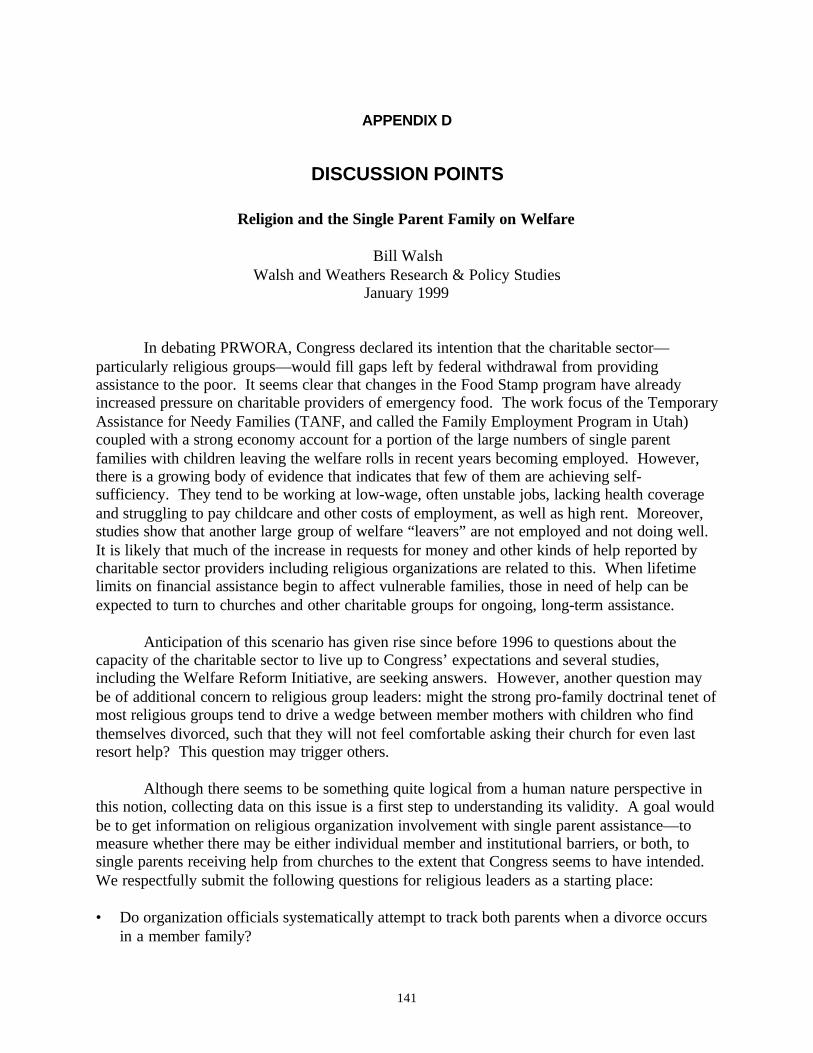
141
APPENDIX D
DISCUSSION POINTS
Religion and the Single Parent Family on Welfare
Bill WalshWalsh and Weathers Research & Policy Studies
January 1999
In debating PRWORA, Congress declared its intention that the charitable sector—particularly religious groups—would fill gaps left by federal withdrawal from providingassistance to the poor. It seems clear that changes in the Food Stamp program have alreadyincreased pressure on charitable providers of emergency food. The work focus of the TemporaryAssistance for Needy Families (TANF, and called the Family Employment Program in Utah)coupled with a strong economy account for a portion of the large numbers of single parentfamilies with children leaving the welfare rolls in recent years becoming employed. However,there is a growing body of evidence that indicates that few of them are achieving self-sufficiency. They tend to be working at low-wage, often unstable jobs, lacking health coverageand struggling to pay childcare and other costs of employment, as well as high rent. Moreover,studies show that another large group of welfare “leavers” are not employed and not doing well.It is likely that much of the increase in requests for money and other kinds of help reported bycharitable sector providers including religious organizations are related to this. When lifetimelimits on financial assistance begin to affect vulnerable families, those in need of help can beexpected to turn to churches and other charitable groups for ongoing, long-term assistance.
Anticipation of this scenario has given rise since before 1996 to questions about thecapacity of the charitable sector to live up to Congress’ expectations and several studies,including the Welfare Reform Initiative, are seeking answers. However, another question maybe of additional concern to religious group leaders: might the strong pro-family doctrinal tenet ofmost religious groups tend to drive a wedge between member mothers with children who findthemselves divorced, such that they will not feel comfortable asking their church for even lastresort help? This question may trigger others.
Although there seems to be something quite logical from a human nature perspective inthis notion, collecting data on this issue is a first step to understanding its validity. A goal wouldbe to get information on religious organization involvement with single parent assistance—tomeasure whether there may be either individual member and institutional barriers, or both, tosingle parents receiving help from churches to the extent that Congress seems to have intended.We respectfully submit the following questions for religious leaders as a starting place:
• Do organization officials systematically attempt to track both parents when a divorce occursin a member family?
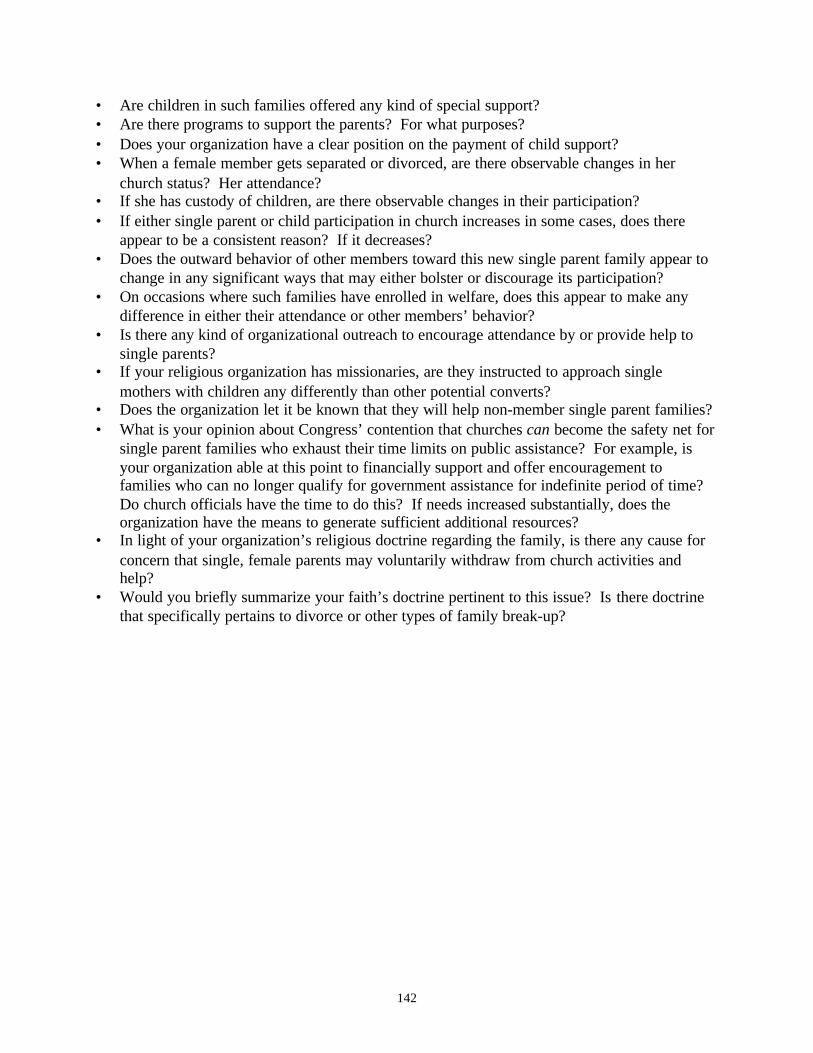
142
• Are children in such families offered any kind of special support?• Are there programs to support the parents? For what purposes?• Does your organization have a clear position on the payment of child support?• When a female member gets separated or divorced, are there observable changes in her
church status? Her attendance?• If she has custody of children, are there observable changes in their participation?• If either single parent or child participation in church increases in some cases, does there
appear to be a consistent reason? If it decreases?• Does the outward behavior of other members toward this new single parent family appear to
change in any significant ways that may either bolster or discourage its participation?• On occasions where such families have enrolled in welfare, does this appear to make any
difference in either their attendance or other members’ behavior?• Is there any kind of organizational outreach to encourage attendance by or provide help to
single parents?• If your religious organization has missionaries, are they instructed to approach single
mothers with children any differently than other potential converts?• Does the organization let it be known that they will help non-member single parent families?• What is your opinion about Congress’ contention that churches can become the safety net for
single parent families who exhaust their time limits on public assistance? For example, isyour organization able at this point to financially support and offer encouragement tofamilies who can no longer qualify for government assistance for indefinite period of time?Do church officials have the time to do this? If needs increased substantially, does theorganization have the means to generate sufficient additional resources?
• In light of your organization’s religious doctrine regarding the family, is there any cause forconcern that single, female parents may voluntarily withdraw from church activities andhelp?
• Would you briefly summarize your faith’s doctrine pertinent to this issue? Is there doctrinethat specifically pertains to divorce or other types of family break-up?