The Impact of Vertical Integration on Inventory Turnover...
36
The Impact of Vertical Integration on Inventory Turnover and Operating Performance Citation for published item: Andreou, P. C., Louca, C., Panayides, Ph.M. The Impact of vertical integration on inventory turnover and operating performance. International Journal of Logistics Research and Applications, forthcoming. View online & further information on publisher’s website: http://www.tandfonline.com/doi/abs/10.1080/13675567.2015.1070815
Transcript of The Impact of Vertical Integration on Inventory Turnover...
The Impact of Vertical Integration on Inventory Turnover and
Operating Performance
Citation for published item:
Andreou, P. C., Louca, C., Panayides, Ph.M. The Impact of vertical integration on inventory turnover and operating performance. International Journal of Logistics Research and Applications, forthcoming.
View online & further information on publisher’s website:
http://www.tandfonline.com/doi/abs/10.1080/13675567.2015.1070815
1
The Impact of Vertical Integration on Inventory Turnover and Operating Performance
Abstract
This paper investigates how vertical integration may influence inventory turnover and firm
operating performance. A causal model is developed to investigate the effects of vertical
integration on three types of inventory, namely raw materials inventory (RMI), work in
progress inventory (WIPI) and finished goods inventory (FGI). The model tests the
interactions between inventory types and the consequences of inventory turnover performance
on various aspects of firm performance including costs and profitability. In particular, path
analysis supports systematic differences with respect to how vertical integration affects RMI,
WIPI and FGI. Vertical integration has a positive effect on RMI and FGI turnover but no
significant effect on WIPI turnover. FGI contributes to a reduction in supporting processes
costs which causes an improvement in Return on Sales (ROS). Vertical integration impacts
ROS directly.
Keywords
Vertical integration, inventory, supply chain management
2
1.0 Introduction
One critical operations management challenge faced by firms in manufacturing and
distribution is the management of their inventory and importantly the level of inventory
turnover. Several models have been developed in the scientific literature to address the
challenges posed by inventory including the Economic Order Quantity (EOQ) model,
stochastic inventory models, materials requirement planning (MRP) production systems and
just-in-time (JIT) environments (see Hopp and Spearman, 1996; Nahmias, 1997). Inventory
control problems have also been addressed from a supply chain management perspective
focusing on the effective co-ordination of material flows, information flows and financial
flows (Buzacott and Zhang, 2004; Cachon and Fisher, 2000; Dong and Xu, 2002; Shah and
Shin, 2007).
To alleviate supply chain related problems managers as well as scholars have considered the
effects of a vertically integrated organization structure. Vertical integration entails the control
of a firm’s assets and provision of goods, services or intermediate inputs and outputs in-
house. From a practical management perspective, vertical integration has been pursued by
companies that have been engaged primarily in exploration and extraction of crude petroleum
and decided to acquire downstream refineries and distribution networks. Companies such as
Shell and BP came to control every step involved in bringing oil from exploration to the
consumers’ vicinity in an effort to address supply chain related problems among other goals.
In terms of scholarly research, the work of Baker and Hubbard (2003, 2004) and Pirrong
(1993) raise the interesting question of whether vertically integrated control structures have a
natural advantage in solving complex coordination or matching problems that would include
supply chain problems. In addition from an economic perspective both the transaction cost
approach (Williamson, 1975, 1985) and the property rights model (Grossman and Hart, 1986)
indicate positive performance implications from vertical integration.
Transaction cost theory also suggests that vertical integration should have a positive effect on
inventory turnover levels within an organization (D’Aveni and Ravenscraft, 1994). For
instance, a higher degree of internal transfers that will occur in a vertically integrated
organization will reduce transaction costs and improve information exchange through
successive production stages. On this basis vertical integration will also facilitate the internal
and external supply chain integration of a firm, i.e. the collaboration among supply chain
partners which are internally owned and controlled, thus contributing to more effective and
3
efficient intra and inter-organizational processes (Zhao et al, 2008; 2011). Vertical transfers
will also improve production and inventory scheduling that can substantially reduce a firm’s
cost by reducing unused capacity and inventory carrying costs (Harrigan, 1983).
According to Frohlich and Westbrook (2001) the essence of supply chain and logistics
integration is the well-coordinated flow of materials from suppliers which allow firms to have
a smooth production process. This meant that firms needed not only to improve production
techniques but to focus on the integration of the supply activity with what customers demand
(Frohlich and Westbrook, 2001). The concept of integration extends to the linking of
customers as well as suppliers (Calantone et al., 2002). A prime objective of integration is
pursuing an information-sharing policy to control supply chain uncertainties arising from
variable lead time (Beamon and Chen 2001; Dev, et al, 2013; Hung et al, 2014). The links in a
manufacturing firm’s value/supply chains is critical if the firm is to deliver superior value to
the consumer (Ragatz et al, 2002). Value in the form of on-time delivery, delivery reliability,
lead time length and inventory service level are especially critical in today's lean supply
chains, where deficient service performance can have consequences that, due for example to
low buffer stocks and make-to-order strategies, can propagate to the end-customer (Forslund
and Jonsson, 2010). On this basis vertical integration should contribute to better integration
and co-ordination in a firm’s value (supply) chain and hence an improvement in the co-
ordination mechanisms associated with the inbound, operations and outbound processes and
not least with the level and cost of inventory as well as with financial performance.
Inventories represent a major part of a firm’s assets particularly the combination of raw
materials inventory (RMI), work in progress inventory (WIPI) and finished goods inventory
(FGI). Operations management research has not as yet addressed whether and how vertical
integration affects the various dimensions of firm operational, supply chain and operating
performance, particularly in the context of the various inventory types that accrue within a
manufacturing organization’s internal supply chain (Harrigan, 1985; D’Aveni and
Ravenscraft, 1994; Leiblein et al, 2002; Li and Tang, 2010).
Even the direct effect of vertical integration on operating performance is ambiguous and
requires further empirical investigation and scrutiny. For instance, D’Aveni and Ravenscraft
(1994) found that vertically integrated lines of business economized on general and
administrative, other selling, advertising and R&D expenditures but had higher production
costs, therefore, only marginally contributed to profitability compared to non-integrated firms.
4
Li and Tang (2010) refer to an inverted U shaped relationship between vertical integration and
innovative performance and a diminishing reduction on the impact of the effectiveness of
external knowledge sourcing on performance. Jacobides and Hitt (2005) on the other hand
suggest that productive capabilities may be leveraged better by using both vertical integration
and the non-vertically integrated governance mode and conclude that the distribution of
productive capabilities along the value chain, catalyzed by transaction costs, ultimately drives
vertical scope.
The aim of this paper is to test an empirical model of the consequences of vertical integration
in improving inventory turnover performance across the three types of inventory, namely,
RMI, WIPI and FGI. In addition, the paper will test the consequences of inventory turnover
performance on various aspects of firm performance including costs and profitability. The
study contributes to theoretical knowledge and the extant literature as follows.
First, in a meticulous and exhaustive analysis of the literature dealing with the consequences
of vertical integration, Lafontaine and Slade (2007) identify effects of prices, quantities,
investment and profits but do not provide evidence of supply chain effects such as inventory
performance. Although there are many explanations as to the benefits emanating from vertical
integration, the arguments are based on the theory of transaction cost economics used to
explain vertical boundary choice (Balakrishnan and Wernerfelt, 1986; McDonald, 1985;
Williamson, 1985). For instance, Mahoney (1989; 1992) classifies the motives for vertical
integration into transaction costs considerations, strategic considerations such as raising entry
barriers, output and /or input price advantages brought about by reduction of the effect of
monopolists in the firm’s production process and uncertainties/risks in costs and/or prices
reduced through vertical financial ownership. There has been less focus on the supply chain
performance consequences of vertical integration, an aspect addressed in this paper by
focusing on inventory performance. For the first time the effects of vertical integration are
examined in relation to the internal supply chain process of firms which includes the inbound,
work in progress and outbound inventory performance as well as the supporting processes.
Capkun et al (2009) examined the relationship between the discrete types of inventory and
gross and operating profitability. Eroglu and Hofer (2011a) find a concave relationship
between inventory leanness and firm performance. We add to this literature by examining also
the effects of vertical integration on RMI, WIPI, FGI and firm operating performance.
5
Second, previous research, particularly in the operations management and supply chain
literature, focused on explaining the effects of integration between supply chain partners on
the basis of vertical integration effected via contractual and inter-organizational relationships
(e.g. Das et al, 2006; Goffin et al., 2006; Chan and Prakash, 2012). It has been long
acknowledged however, that contractual and inter-organizational relationships are susceptible
to market failures (Williamson, 1971) whereas vertical integration poses possible advantages
(Harrigan, 1985). This study makes a contribution by investigating the supply chain
performance effects of firms that are vertically integrated in the supply chain process through
the full financial ownership of other firms than mere outsourcing relations or quasi-vertical
integration.
Third, the study contributes to the literature examining the relationship between vertical
integration and firm performance which arguably posits mixed results. For instance, Reed and
Fronmueller (1990) reject the hypothesis of possible performance differentials between
vertically integrated and non-integrated entities. They state that vertical integration (via whole
ownership) is performance and risk-neutral suggesting that successful strategy selection and
subsequent performance is a function of firm-specific competencies and opportunities.
Bhuyan (2002) reveals the existence of a negative relationship between vertical integration
and profitability. According to this study of vertical mergers in US food manufacturing firms,
the negative impact on firm profitability arises because vertical integration fails to create
differential advantages such as cost savings for the integrated firm. On the other hand,
D’Aveni and Ravenscraft (1994) find net benefits and operational advantages from vertical
integration arising from lower general, selling and administrative costs and lower R&D
expenditures. Our study contributes to this stream of literature by recognizing the different
characteristics and possible differential effects in the interactions between vertical integration
and the three recognized and distinct types of inventory performance. This is achieved by
empirically testing a causal model using path analysis.
The paper is structured as follows. Section 2 reviews the relevant theoretical background on
vertical integration and inventory turnover performance, which represent the central concepts
of the study. Section 3 develops the research hypotheses. Section 4 presents the methodology
adopted to facilitate the empirical examination of the research hypotheses. Section 5 discusses
the results of the study. The paper concludes with a summary of the study’s results and
reference to the limitations and future research prospects in section 6.
6
2. Theoretical framework
2.1 Vertical integration
The theoretical literature treats vertical integration in relation to the decision by corporations
to provide certain goods, services or intermediate inputs and outputs in-house or purchase
them from outsiders instead (e.g. Harrigan, 1985). This can be manifested either through
vertical financial ownership and complete control over assets achieved through merger,
acquisition or internal development extending company boundaries or through vertical
contracting which includes exclusive dealing, resale price maintenance and exclusive
territories (Mahoney, 1992). Regarding the latter, Blois (1972) used the term ‘vertical quasi-
integration’ to define financial relationships between firms in neighboring stages. These
relationships need not involve additional control of production and distribution decisions such
as equity investment, loans or loan guarantees, leases on real estate or capital and inventory
credits. However, most theories of vertical financial ownership are more accurately described
as theories of vertical integration strategy (Mahoney, 1992). As stated by Maddigan (1981)
vertical integration describes the firm’s strategy of exercising ownership control in the
production of products that are used as inputs to each other and thus, it is much more than the
joining or contractual integration of production processes. Vertical integration can also be
described as the overall scope of different business activities in a supply chain brought under
the management of a single company (Majumdar and Ramaswamy, 1994). It is distinct from
supply chain integration which has been described as the integration of all value-adding
activities and business processes from raw material extraction to the consumption of products
by end users (e.g. Cousins and Menguc, 2006; Frohlich and Westbrook, 2001; Narasimhan
and Kim, 2002).
Perry (1989) describes a vertically integrated firm as one that encompasses two single-output
production processes in which either (1) the entire output of the “upstream” process is
employed as part or all of the quantity of one intermediate input into the “downstream”
process or (2) the entire quantity of one intermediate output into the “downstream” process is
obtained from part or all of the output of the “upstream” process. Harrigan (1986) on a similar
premise defines vertical integration in relation to the requirements for a particular resource
that a business unit obtains from an upstream sister business unit or the outputs that a business
unit sells to (or through) a downstream sister unit. Perry (1989) suggests that ‘partial’ vertical
7
integration would exist in the case where most (and not all) of the output of the upstream
process is employed as most of the input in the downstream process.
The paper adopts the definition provided by Grossman and Hart (1986) who argued that
vertical integration is the ownership and thus complete control over ‘assets’. They assert that
the nature of the firm’s relationship with labor, as discussed by Williamson (1975) and
Cheung (1983) is not relevant for distinguishing vertical integration. Inherent in this
definition of vertical integration is the elimination of contractual or market exchanges with
the vertically integrated organizations, and the substitution of internal exchanges within the
boundaries of the firm.
2.2 Inventory
Inventory represents a portion of a firm’s assets. Inventory serves specific purposes that bring
certain advantages for a firm (see Stock and Lambert, 2001 for an analysis of the advantages
of holding inventory). However, since the early 1980s, the inventory literature has treated
inventory as a waste that should be minimized (e.g. Hall, 1983; Schmenner and Swink, 1988).
Inventory reduction has been the target for various operations management approaches
including lean production (Chen et al, 2005), just-in-time (Huson and Nanda, 1995) and total
quality management (Flynn et al., 1995).
The literature (e.g. Eroglu and Hofer, 2011a) recognizes three types of inventory namely, raw
materials inventory (RMI), work in progress inventory (WIPI) and finished goods inventory
(FGI). It has been recognized however, that most studies have focused almost exclusively on
FGI despite the widely acknowledged significant differences in the behaviors of RMI, WIPI
and FGI (Chican, 1996; Eroglu and Hofer, 2011a; Holly and Turner, 2001; Sensier, 2003;
Tsoukalas, 2006). Humphreys et al (2001) and Eroglu and Hofer (2011b) view the failure to
recognize interactions among inventories in different stages of manufacturing (RMI, WIPI,
FGI) as a major theoretical and empirical weakness in economic research that attempts to
explain the behavior of profit-maximizing firms. Chen et al (2005) identified that RMI, WIPI
and FGI of US companies have changed at different rates during the period of 1981-2005,
suggesting that there are differential effects and possible interaction effects between the three
types of inventory.
8
The management of inventory internally, achieved via a vertically-integrated structure, may
have implications for the total cost of inventory management and firm performance. For
example, Dong and Xu (2002) found vendor managed inventory (VMI) to reduce
total costs of the channel system. A typical VMI program involves a supplier which
monitors inventory levels at its customer’s warehouses and assumes inventory management
responsibilities; in effect what is achieved through a vertically integrated structure. According
to the authors anecdotal evidence suggests that a consignee may enjoy reductions in
holding costs and some operational costs plus cash flow benefits. In addition, inventory
inaccuracy which may arise due to information distortion in the supply chain arising from
misalignment between physical and information flows will lead to increase in costs and the
reduction of supply chain performance (Fleisch and Tellkamp, 2005).
3. Hypothesis development
According to Klein (1988), by shifting the ownership of an organizational asset, vertical
integration can imply an increased ability to direct cooperating inputs compared to a long-
term contractual arrangement. There is an existing set of theoretical literature that focuses on
the consequences of vertical integration. Vertical integration, can enhance performance
through the coordination mechanisms associated with internalization and reduction in
transaction costs and market exchanges (Williamson 1975), exploiting opportunities for
coordinating internal activities, (Harrigan, 1983; Hennart, 1988) creating power over buyers
and suppliers (Vickers and Waterson, 1991), the development of firm specific capabilities
over time (Novak and Stern, 2008) and the development of knowledge (Kogut and Zander,
1992; Grant, 1996; Nickerson and Zenger, 2004). These perspectives form a theoretical basis
for the conceptual relationship between vertical integration, inventory turnover and operating
performance.
3.1 Vertical integration and inventory management
On the basis of the transaction cost approach, vertical integration may confer inventory
turnover improvement chiefly because of the coordination benefits associated with
internalization. Increased coordinative abilities may be due to either an improved flow of
administrative information or due to technological interdependencies that exist between
activity stages and specifically in the process of inbound and outbound transfer of raw
materials and finished goods respectively as well as during the process of manufacturing
(work in progress inventory). This perspective is supported by research which suggests that
9
locating manufacturing activities outside of the firm’s boundaries can degrade a firm’s
capabilities by impairing cross-functional coordination (e.g. Allen, Lee, and Tushman, 1980;
Chesbrough and Teece, 1996; Griffin and Hauser, 1992; Hatch and Mowery, 1998; Teece,
1996). Harrigan (1983) indicates that extensive internal vertical transfers and coordination in
production and inventory scheduling can substantially reduce unused capacity and inventory
carrying costs. Central in inventory management is communication efficiency between supply
chain partners. An advantage of vertically integrated firms is the development of a coding
system which increases communication efficiencies and provides stability in operations
(Arrow, 1975; Mahoney, 1992; Malmgren, 1961). The literature does not however, provide
unequivocal evidence on the impact of vertical integration on the various components of
inventory turnover namely, raw materials inventory turnover (RMIT), work in progress
inventory turnover (WIPIT) and finished goods inventory turnover (FGIT).
On the basis of the above it is hypothesized that:
H1(a): Vertical integration will be associated with increased raw materials inventory turnover
levels.
H1(b): Vertical integration will be associated with increased work in progress inventory
turnover levels.
H1(c): Vertical integration will be associated with increased finished goods inventory turnover
levels.
In addition to the above, and based on the work of Chen et al (2005), Chican (1996) and
Eroglu and Hofer (2011a), improved inventory turnover levels are hypothesized to have
causal influences between each other. For instance, improved RMIT may contribute to an
improvement in WIPIT and FGIT. WIPIT may also impact on FGIT. On this basis:
H2(a): Improved raw materials inventory turnover will lead to improved work in progress
inventory turnover.
H2(b): Improved raw materials inventory turnover will lead to improved finished goods
inventory turnover.
H2(c): Improved work in progress inventory turnover will lead to improved finished goods
inventory turnover
3.2 Inventory turnover and firm performance
10
The inventory management literature recognized the significant positive impact of good
inventory management on firm performance (Capkun et al., 2009; Eroglu and Hofer, 2011a).
However, most previous research focused either on total inventory performance (Gaur et al,
2005) or exclusively on finished goods inventory (e.g. Blinder and Maccini, 1991; Cachon
and Olivares, 2010). D’Aveni and Ravenscraft (1994) suggest that transaction costs such as
selling and advertising expenses may be eliminated because product information is transferred
through internal hierarchies and order taking is also handled administratively rather than
through exchange in the open market. Support activities in the value chain are impacted by
supply chain management systems according to Dehning et al (2007). Hence, improved
inventory management performance (measured by inventory turnover) is bound to produce
cost savings across the value chain.
Among the studies that have distinguished between the three types of inventory, Lieberman et
al (1999) use survey data on several hundred automotive suppliers in North America to
evaluate the determinants of inventory levels in high-volume discrete parts manufacturing.
They assess the magnitude of raw materials, work-in-progress, and finished goods inventories
held at automotive supply plants and conclude that each type of inventory is driven by very
different factors. Safizadeh and Ritzman (1997) find that the effects of manufacturing process
choice vary across RMI, WIPI and FGI. Dehning et al (2007) examine the financial benefits
of information technology investments around newly adopted IT-based supply chain
management (SCM) systems and found that the adoption of SCM affects differentially RMI,
WIPI and FGI. They find that SCM systems increase gross margin, inventory turnover,
market share, return on sales, and reduce selling, general, and administrative expenses.
Capkun et al (2009) test the relationship between both inventory performance and the discrete
types of inventory (RMI, WIPI, and FGI) and the profitability of operations, both at the gross
and at the operating profit levels. The paper finds a significant positive correlation between
inventory performance (total as well as the discrete components of inventory) and measures
of financial performance (at both the gross and operating levels) for firms in manufacturing
industries. The correlation between the performance of discrete types of inventory and
financial performance varies significantly across inventory types. RMI performance has the
highest correlation with all financial performance measures (earnings before interest and taxes
and gross profit margins). Between WIPI and FGI performance, the former is more highly
11
correlated with gross profit margins while FGI is more highly correlated with operating profit
measures.
Eroglu and Hofer (2011a) test empirically the performance effects of raw materials, work-in-
progress and finished goods inventories using data from US manufacturing industries. Their
study identifies differential effects between the three types of inventory. Specifically raw
materials inventories were found to have greater impact on firm performance than work in
progress and finished goods inventories. The suggested reason is the possible asymmetrical
effects of raw materials and finished goods inventories on each other over time.
The above lead to the following research hypotheses:
H3(a): High RMIT levels will reduce the costs associated with supporting processes in a firm’s
internal supply chain.
H3(b): High WIPIT levels will reduce the costs associated with supporting processes in a
firm’s internal supply chain.
H3(c): High FGIT levels will reduce the costs associated with supporting processes in a firm’s
internal supply chain.
It is also expected that a reduction in the costs associated with supporting processes in a
firm’s internal supply chain will contribute to an improvement in financial performance. For
instance, it is interpreted in fundamental analysis that an increase in selling, goods and
administrative costs (margin) is a negative signal to future profitability and firm value
(Anderson et al, 2007). On this basis:
H4: The level of supporting costs in a firm’s internal supply chain will be inversely related to
a firm’s operating performance.
3.3 Vertical integration and performance
The literature suggests that vertical integration can also have a direct effect on firm
performance. For instance, vertical integration can increase profits through higher prices by
creating barriers to entry (Bain, 1956; Salop and Scheffman, 1983), allowing price
discrimination (Perry 1980), reducing service and advertising externalities (Jones and Hill,
1988) or providing a firm with power over buyers or suppliers (Porter, 1980). Costs may also
be decreased by avoiding market costs (Jones and Hill, 1988), by reducing transaction costs
(Mahoney, 1992) by decreasing uncertainty or asymmetric information resulting in a more
12
efficient use of inputs (Riordan and Sappington, 1987) and by protecting proprietary
technology (Jones and Hill, 1988).
The theoretical evidence is centered on the transaction cost economics approach (Williamson,
1975) and indicates that the decision to use vertical integration depends on the relative
monitoring costs that arise from bounded rationality and from uncertainty due to partners’ self
interest and opportunism (Kaufman et al, 2000). Despite the theoretical arguments, the
empirical literature has not established in absolute terms the relationship between vertical
integration and performance.
According to Mahoney (1992) the transaction cost approach suggests that vertical financial
ownership may most effectively achieve the profit inventive since preemptive claims on
profits between separate firms are eliminated. D’Aveni and Ravenscraft (1994) found that
vertical integration results in economies even after industry effects and economies of scale
and scope are controlled. They posit that vertically integrated lines of business economized on
general and administrative other selling, advertising and R&D expenditures. However, they
had only marginally higher profitability than non-integrated lines of business due to higher
production costs. In addition, they found that forward vertical integration was associated with
lower transaction costs. Rothaermel et al (2006) found that vertical integration has an
increasingly positive effect on firm performance. The positive effect on performance is likely
to be due to the reduction in transaction costs by internalizing the value chain activities.
On the basis of the above we expect in the context of our conceptual model a positive relation
between vertical integration and firm performance. This hypothesis serves to test the direct
effect of vertical integration on operating performance vis-à-vis the impact of vertical
integration via improved inventory turnover and the reduction of process supporting costs.
Hence:
H5: Vertically integrated firms will be associated with improved overall financial
performance in relation to non-vertically integrated firms.
4. Methodology
The hypotheses presented entail the simultaneous examination of causal relationships between
the variables. Structural equation modeling (SEM) is an appropriate methodology for
capturing such relationships between variables because it is concerned with estimating the
13
magnitude of the linkages between variables and using these estimates to provide information
about underlying causal processes (Bollen, 1989). Where only single indicators for each of
the variables in the model are available then path analysis which is a special case of SEM is
deployed. Path analysis is particularly suited to operations management research (Anderson et
al, 1995; Paiva et al, 2008; Swamidass and Newell, 1987). Mathematically path analysis
decomposes the empirical correlations among the measured variables to estimate the path
coefficients in the path diagram. On this basis path analysis was used to estimate the empirical
model. Data was fitted using the SEM library in STATA, with the Maximum Likelihood
(ML) estimation method. Missing data were addressed using listwise deletion and the models
were fitted in the raw dataset. Raw data were used in order to report robust standard errors
allowing for clustering on raw data.
4.1 Sample
Manufacturing companies were chosen for sampling purposes because these are firms with
inbound and outbound supply chain processes and hence can adequately measure the changes
in the turnover performance of raw materials, work and in progress and finished goods
inventory in their internal supply chain. An important part of the sample selection process was
the identification of vertically integrated organizations vis-à-vis non-vertically integrated
organizations. For the selection process we adopted the definition of between-stages vertical
integration and the method suggested and applied by Davis and Duhaime (1992). In particular
they posit that vertical integration that occurs between stages in the valued-added chain such
as between mining and manufacturing or manufacturing and distribution can be identified
using standard industry classification (SIC) codes.
Following Davis and Duhaime (1992), vertically integrated firms are classified using industry
segment data from the Compustat database. In particular, for each year primary and secondary
standard industry classification (SIC) codes are compared. When either the primary or the
secondary SIC codes belong to different value added stages (raw materials, manufacturing, or
services) while the other SIC code belongs to one of the other two stages, it is regarded as an
indication that a firm is vertically integrated.
The sample consisted of 2,193 firms (or 10,771 firm year observations) that operate in the
manufacturing services industry (SIC codes 2000-3999) during the period 1986-2010. We
ended up with this sample after listwise deletion of missing observations (considered missing
14
completely at random after testing for omission bias). Of the 10,771 observations, 5743 or
53.32% are vertically integrated while the remaining 5028 or 46.68% are non-vertically
integrated firms.
In order to verify that the chosen companies were vertically integrated, we randomly selected
a sample of companies and investigated their vertical integration structure in more depth.
Companies Royal Dutch Shell, Petrochina Co Ltd and Shell Transport and Trading have
operations classified in SIC 2911 Petroleum Refining and SIC 5172 Wholesale Petroleum and
Petroleum Products (no bulk stations). Similarly, Shell Oil Co operates in SIC 2911
Petroleum Refining and SIC 5171 Wholesale Petroleum Bulk Stations and Terminals. It is
evident that the above companies are vertically integrated with operations in the extraction of
commodities and subsequently their trading in a supply chain adjacent SIC. Similarly
companies Texaco Inc., Amoco Co. and Marathon Oil Corp. are vertically integrated with
operations in SIC 1311 Crude Petroleum and Natural Gas and SIC 2911. Kubota Corp. is
classified in SIC 3321 Iron and Steel Foundries and SIC 1623 Water, Sewer Pipeline,
Communication and Power Lines Construction. The company is vertically integrated as it
uses the raw materials from its operations in steel foundries to develop and install pipelines
and power lines in its second industry sector. Similarly Chrysler operates in SIC 3712 Motor
Vehicles, and Passenger Car Bodies and SIC 5012 Wholesale Motor Vehicles and Motor
Vehicles Parts and Supplies. Baxter International is classified in SIC 3841 Surgical and
Medical Instruments and Apparatus and in SIC 5122 Wholesale Drugs, Proprieties &
Druggists’ Sundries. The analysis of the companies provides strong qualitative evidence of
their vertically integrated structure as they operate in industry sectors that are considered to be
adjacent in a supply chain context.
4.2 Measures
Inventory performance has been measured using a variety of ratios in operations management
research. They include absolute measures such as average inventory levels and maximum
inventory levels (King and Lenox, 2011) standardized measures such as inventory turnover
(Schonberger, 2007; Gaur et al, 2005), days of supply (Koumounakos, 2008) and inventory to
sales ratios (Swamidass, 2007). The most widely used measures are inventory to sales ratio,
inventory to assets ratio, and inventory turnover (White et al, 1999; Chen et al, 2005). Shah
and Shin (2007) use inventory to sales ratio because they find that the three measures are
highly correlated and the relative amount of inventory used to achieve a certain sales volume
15
represents a sector’s overall efficiency in inventory management. The current study aims to
measure independently the three inventory turnover measures namely, RMI, WIPI and FGI.
Eroglu and Hofer (2011a) develop an inventory leanness indicator which measures the
relationship between sales and inventories in multiple stocking locations of a firm thereby
identifying economies of scale in inventory holding. The indicator is used by Eroglu and
Hofer (2011b) to measure the three respective types of inventory i.e. an inventory leanness
indicator for RMI, WIPI and FGI respectively. The inventory turnover measures used in our
analysis were pre-selected based on the Dehning et al (2007) value chain model and in accord
to previous empirical studies (Spekman et al., 1994; Fisher, 1997; Elmuti, 2002; Hult et al.,
2000; Wisner and Tan, 2000; Chan et al., 2003; Hendricks and Singhal, 2003). In particular,
RMIT was measured as cost of goods sold/RMI, WIPIT as cost of goods sold/WIPI, FGIT as
cost of goods sold/FGI. The cost of goods sold consists of raw materials, direct labour and
overheads. The ratio measures the ability to turn over inventory in relation to cost.
As a measure of supporting costs associated with an improvement in inventory management,
we use selling, good and administrative expenses (SGA). The measure was used by Dehning
et al (2007) to measure cost savings in administrative accounts across the value chain which
are more readily observed in lower discretionary expenses such as selling, general and
administrative expenses (Kalwani and Narayandas, 1995). Finally, we used return on sales
(ROS) measured as income before extraordinary items/net sales as a holistic measure of firm
performance (Byrd and Davidson, 2003; Tan et al., 1999; Vickery et al., 2003). Compustat
data were used for deriving all performance measures. Each variable was Winsorized at +-3
standard deviations from the mean (1% level) to control for any potential outliers.
4.3 Control variables
In addition to examining the hypothesized effects, we control for three variables that may
impact the performance of a firm. First we control for the size of the firm using the natural log
of total assets of the firm. Larger firms may have access to more resources and are
consequently able to achieve scale economies (Pfeffer and Salancik, 1978). Second we use the
market to book ratio to control for investment and growth opportunities for the firms that are
bound to affect firm performance. Market to book ratio measures the relative value of a
company compared to its stock price and a low value indicates investment opportunities. Last
we use technological intensity measured by R&D expenditure to control for higher
performance of advanced technology firms.
16
5. Analysis of Results
5.1 Assessing model fit
Table 1 in the appendix shows the correlation matrix with descriptive statistics (means and
standard deviations) of the variables.
We fitted the model described in the methodology section. Table 2 presents this model along
with the respective fit statistics. Since the model was constructed a priori, the primary concern
is in the model fit. Although individual p-values for the coefficient estimates are generally
considered to be valid taking them into account and investigating potential improvements in
the model by removing causal relations falls within the realm of exploratory analysis.
Therefore only the fit of the hypothesized model was considered and evaluated using the Chi-
squared statistic, the Root Mean Squared Error of Approximation (RMSEA), the Standardized
Root Mean Squared Residual (SRMSR), the Comparative Fit Index (CFI) and the Tucker
Lewis Index (TLI).
The chi-squared statistic had 29 degrees of freedom and yielded a value of 280.752; this
meant that the chi-squared test was highly significant (p-value<0.0001) suggesting a poor fit
to the data. However the chi-square test is known to be biased for large sample sizes and will
reject valid models (Bagozzi and Yi, 1988). In line with common practice we relied on other
indices to assess model fit. The RMSEA statistic yielded a value of 0.028 with a 90%
confidence interval of 0.025 to 0.031. This indicates that with 90% confidence the RMSEA
statistic is below the desired threshold of 0.05 suggesting a good fit to the data. The SRMR
statistic has a value of 0.033 which is also below the desired threshold of 0.05 suggesting a
good fit to the data. The CFI and the TLI statistics yielded values of 0.985 and 0.982
respectively which were above the desired threshold of 0.9 also suggesting a good fit to the
data. All of these indices met or exceeded the critical values for good model fit (Hulland et al,
1996) hence providing evidence of good model fit to the data.
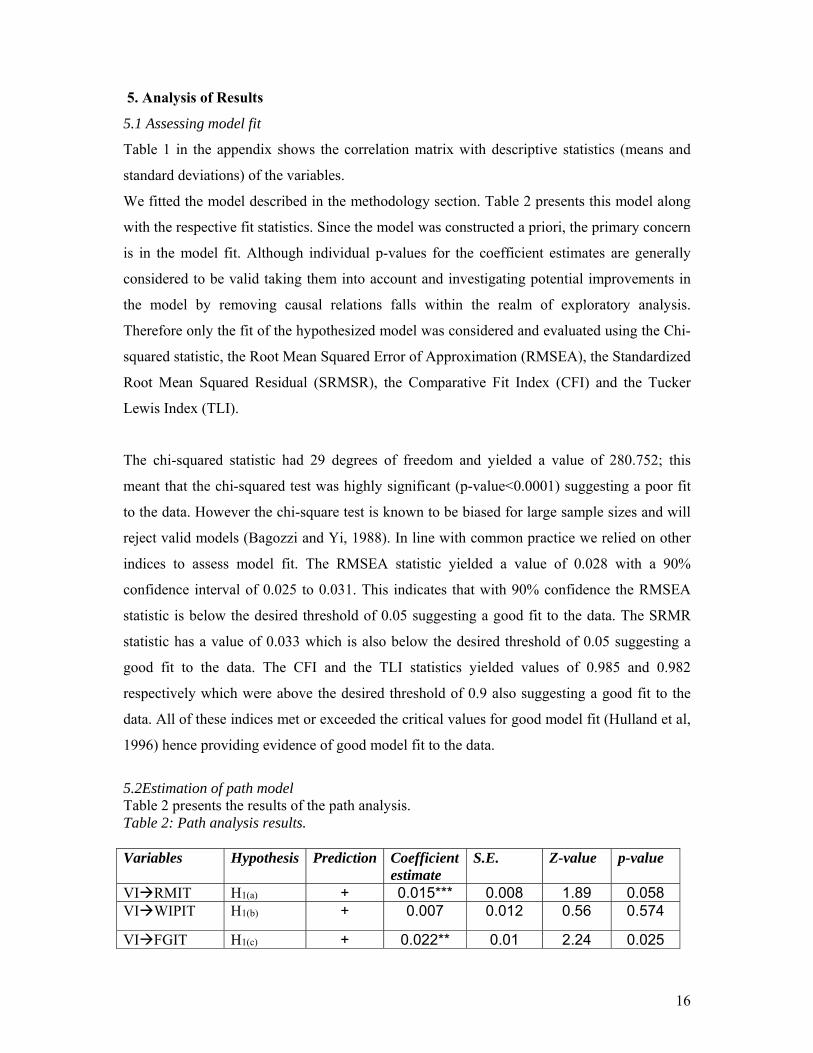
5.2Estimation of path model Table 2 presents the results of the path analysis. Table 2: Path analysis results. Variables Hypothesis Prediction Coefficient
estimate S.E. Z-value p-value
VIRMIT H1(a) + 0.015*** 0.008 1.89 0.058 VIWIPIT H1(b) + 0.007 0.012 0.56 0.574
VIFGIT H1(c) + 0.022** 0.01 2.24 0.025
17
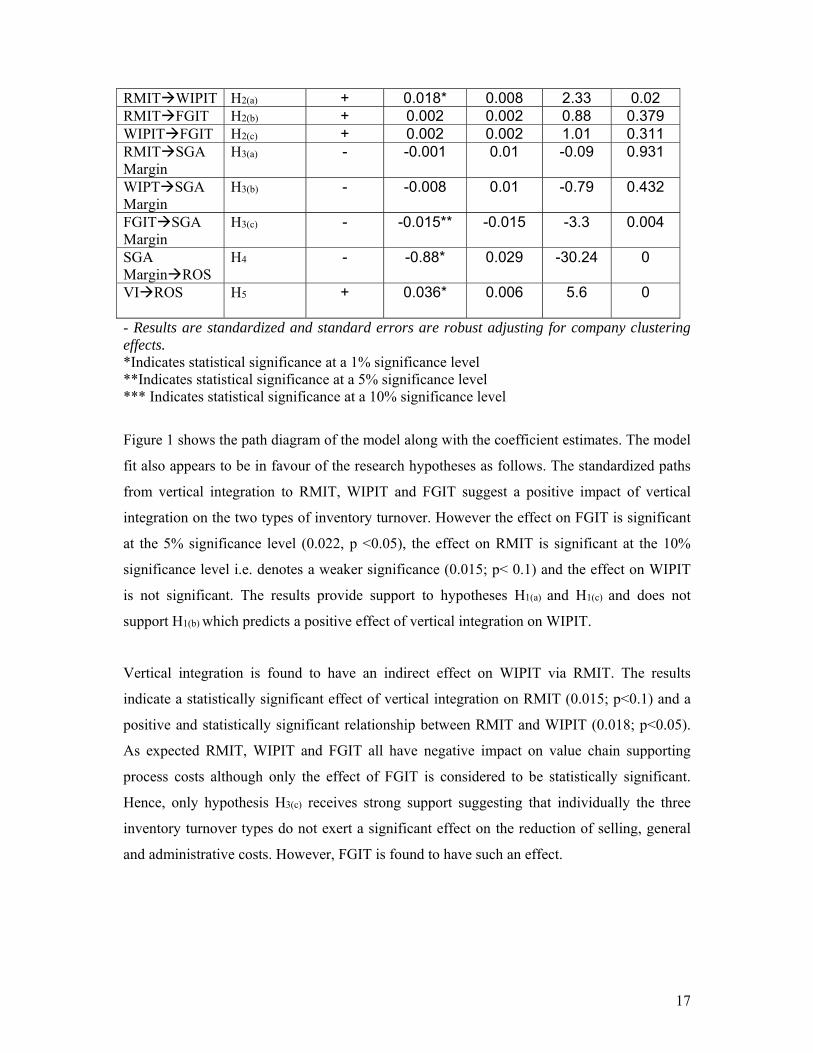
RMITWIPIT H2(a) + 0.018* 0.008 2.33 0.02 RMITFGIT H2(b) + 0.002 0.002 0.88 0.379 WIPITFGIT H2(c) + 0.002 0.002 1.01 0.311 RMITSGA Margin
H3(a) - -0.001 0.01 -0.09 0.931
WIPTSGA Margin
H3(b) - -0.008 0.01 -0.79 0.432
FGITSGA Margin
H3(c) - -0.015** -0.015 -3.3 0.004
SGA MarginROS
H4 - -0.88* 0.029 -30.24 0
VIROS H5 + 0.036*
0.006 5.6 0
- Results are standardized and standard errors are robust adjusting for company clustering effects. *Indicates statistical significance at a 1% significance level **Indicates statistical significance at a 5% significance level *** Indicates statistical significance at a 10% significance level
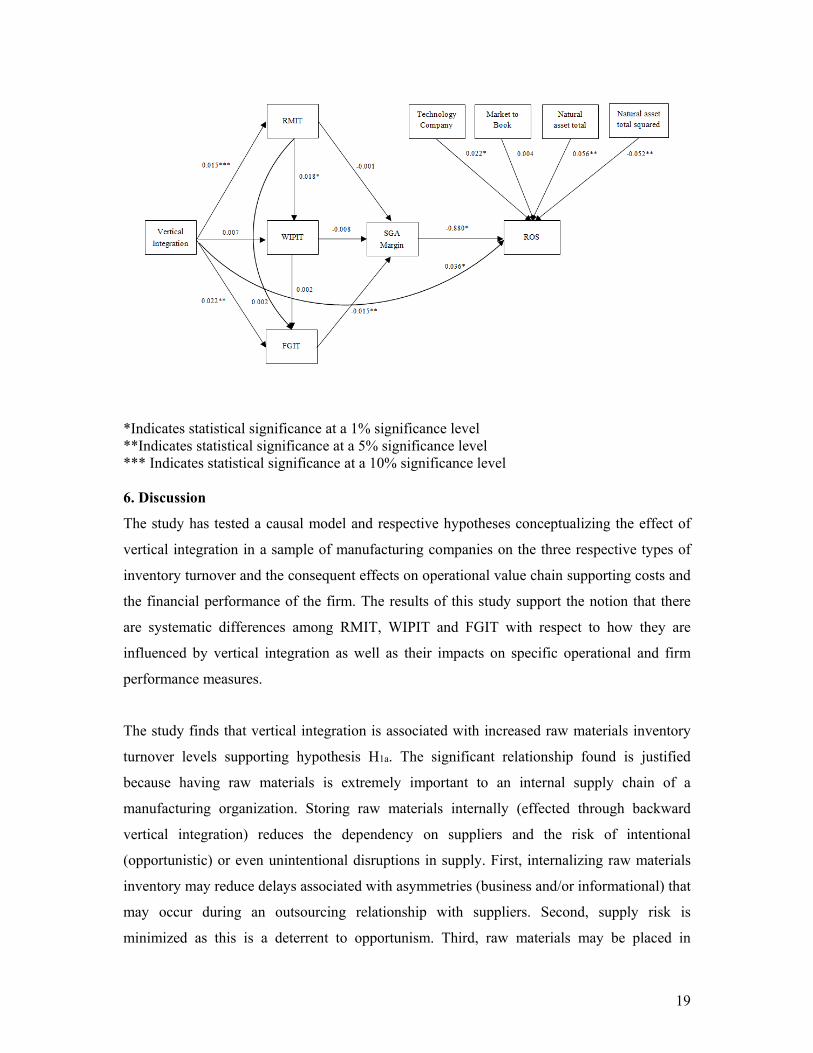
Figure 1 shows the path diagram of the model along with the coefficient estimates. The model
fit also appears to be in favour of the research hypotheses as follows. The standardized paths
from vertical integration to RMIT, WIPIT and FGIT suggest a positive impact of vertical
integration on the two types of inventory turnover. However the effect on FGIT is significant
at the 5% significance level (0.022, p <0.05), the effect on RMIT is significant at the 10%
significance level i.e. denotes a weaker significance (0.015; p< 0.1) and the effect on WIPIT
is not significant. The results provide support to hypotheses H1(a) and H1(c) and does not
support H1(b) which predicts a positive effect of vertical integration on WIPIT.
Vertical integration is found to have an indirect effect on WIPIT via RMIT. The results
indicate a statistically significant effect of vertical integration on RMIT (0.015; p<0.1) and a
positive and statistically significant relationship between RMIT and WIPIT (0.018; p<0.05).
As expected RMIT, WIPIT and FGIT all have negative impact on value chain supporting
process costs although only the effect of FGIT is considered to be statistically significant.
Hence, only hypothesis H3(c) receives strong support suggesting that individually the three
inventory turnover types do not exert a significant effect on the reduction of selling, general
and administrative costs. However, FGIT is found to have such an effect.
18
SGA margin has a highly significant negative effect on the firms’ ROS (-0.880; p< 0.01). This
provides support to hypothesis H4 which indicates that a higher SGA margin will have a
negative impact on a firm’s ROS.
Finally, the path coefficient from vertical integration to ROS is significant (0.036; p <0.01
level) supporting hypothesis H5 which indicates that vertical integration has a direct positive
impact on the financial performance of a firm.
These results are mostly explained by the correlations between the measures discussed in the
previous section with the exceptions being the relations between ROS and high technology
companies (Technology Company) and ROS and the Market to Book ratio. Based on the
correlation structure of the data, Technology Company and the Market to Book ratio appear to
be negatively related to ROS (the correlations were not statistically significant) but in the
model their effect appears to be positive. These differences between the model and the
correlation structure may suggest that the control variables choice of the model was correct,
since omitting them might have overestimated or underestimated the effect of the other
coefficients (paths) to ROS. However it has to be stressed that the correlation estimate
between Technology Company and ROS was an inadequate estimate of their relationship and
a more appropriate statistic is the corrected Kendalls’s tau-b statistic which indicated a
positive statistically significant relationship between the two. The sign of the control variables
is consistent with prior literature.
Overall, the hypothesized model provides evidence that vertical integration affects positively
a firm’s financial performance directly and indirectly by improving a firm’s inventory
turnover performance and reducing supporting costs in a firm’s internal supply chain.
Figure 1: Model path diagram with coefficients.
19
*Indicates statistical significance at a 1% significance level **Indicates statistical significance at a 5% significance level *** Indicates statistical significance at a 10% significance level 6. Discussion
The study has tested a causal model and respective hypotheses conceptualizing the effect of
vertical integration in a sample of manufacturing companies on the three respective types of
inventory turnover and the consequent effects on operational value chain supporting costs and
the financial performance of the firm. The results of this study support the notion that there
are systematic differences among RMIT, WIPIT and FGIT with respect to how they are
influenced by vertical integration as well as their impacts on specific operational and firm
performance measures.
The study finds that vertical integration is associated with increased raw materials inventory
turnover levels supporting hypothesis H1a. The significant relationship found is justified
because having raw materials is extremely important to an internal supply chain of a
manufacturing organization. Storing raw materials internally (effected through backward
vertical integration) reduces the dependency on suppliers and the risk of intentional
(opportunistic) or even unintentional disruptions in supply. First, internalizing raw materials
inventory may reduce delays associated with asymmetries (business and/or informational) that
may occur during an outsourcing relationship with suppliers. Second, supply risk is
minimized as this is a deterrent to opportunism. Third, raw materials may be placed in

20
production more efficiently when dependence on outside suppliers is eliminated. Emery and
Marques (2011) found that storing raw materials by customers of the raw materials suppliers
reduces the transaction costs (including opportunism) and improves the overall effectiveness
of managing external supply chain costs.
The findings of this study provide support to the strong relationship between vertical
integration and FGIT reached by Cachon and Olivares (2010). Cachon and Olivares (2010)
found that the substantial and persistent differences in finished goods inventory performance
between Toyota and Chrysler is due to a manufacturing advantage (production flexibility) and
upstream supply chain management at Toyota that extends to their finished-goods supply
chain downstream from their assembly plants to their dealerships. We assert that vertical
integration improves upstream supply chain management as documented by various studies
pointing to the increase of supply chain disruptions due to outsourcing (Craighead et al, 2007;
Hendricks et al, 2009; Kleindorfer and Saad, 2005).
No significant effect is found between vertical integration and WIPIT levels (H1b). This may
be attributed to the fact that forward vertical integration can contribute to greater efficiency in
the delivery of finished goods downstream in the supply chain. Lieberman et al (1999) find
that maintaining communication with suppliers and customers leads to reductions in RMI and
FGI with no impact on WIP inventory. As Balakrishnan et al (1996, p. 195) argue, reducing
WIP inventory requires less coordination with a firm’s suppliers or customers than is required
to reduce RMI or FGI and thus impose fewer implementation costs. In addition, that unlike
RMI, reducing WIP does not require supply chain stability. Vertical integration is found to
affect the three types of inventory performance differentially. This supports the argument by
Dehning et al (2007) who document how the adoption of supply chain management systems
differentially affects RMIT, WIPIT and FGIT. Lieberman and Asaba (1997) report
differences regarding inventory performance across the supply chains of Japanese and US
auto manufacturers, although FGI is excluded from the analysis.
Improved RMIT is found to reduce WIPIT (H2a). This finding is supported by the fact that
RMIT (i.e. turning raw materials quicker in the internal supply chain) will influence directly
internal supply chain functions such as queuing, processing, waiting for batch, moving and
waiting to match, discussed as determinants of WIPIT by Hopp and Spearman (2001). RMIT
and WIPIT are not found to have any effect on FGIT (H2b and H2c) respectively.
21
The findings of the study contribute further to our understanding of the interactions between
the different types of inventory turnover and their relationship to performance. The findings
support and extend previous studies that have found a positive causal effect between total
inventories improvement and performance (Fullerton and McWatters, 2001; Fullerton et al,
2003; Huson and Nanda, 1995; Swamidass, 2007). This study contributes to the literature by
providing support to the thesis that the different types of inventory have different effects on
performance and that the performance effect of FGIT (H3c) is found to be stronger than that
of RMIT (H3a) and WIPIT (H3b). This finding can be justified by the fact that RMIT and
WIPIT have a lower unit value than FGIT which includes the added value from the
manufacturing or conversion process (Hilton, 2009). In addition, customer service and other
value chain activities are directly affected by FGI whereas research in pricing indicates that
sales prices are a function of the amount of FGI held during and toward the end of the selling
season (Smith and Achabal, 1998; Su, 2007). On this basis it is expected that FGIT will have
a greater effect on performance and on the costs associated with value chain supporting
processes than WIPIT and RMIT. The above is supported by the findings of this study. Also
as indicated by Capkun et al (2009) many inventory management initiatives such as just-in-
time and setup reduction time have focused on reducing FGIT and WIPIT as opposed to
RMIT. Eroglu and Hofer (2011b) despite supporting conceptually and hypothesizing the
greater effect of FGIT on performance do not find supporting evidence to their hypothesis.
They characterize their findings as intriguing and attribute it to possible inter-temporal
interactions between RMIT and other inventory types. Capkun et al (2009) on the other hand
found that total inventories and all three types of inventories have a significant effect on firm
performance with the stronger effect exhibited by RMIT.
Although H3(a)(b) are not supported with statistical significance the fact that the association
between each of the three inventory turnover types and SGA margin is negative is indicative
of the direction of this association, i.e. that inventory turnover performance reduces selling
general and administrative costs. A significant relationship may be associated with total
inventory turnover performance and the SGA margin. In this study we tested the individual
effects of the three inventory types which arguably would have a lower effect on reducing the
total supporting costs association with selling general and administrative expenses.
22
The studies by Capkun et al (2009) and Eroglu and Hofer (2011a) have indentified differential
effects between inventory types and performance measures but have not crystallized the
possible reasons for such effects on the basis of the performance measure used. We find that
FGIT has a significant effect on SGA as opposed to RMIT and WIPIT. It is possible that
FGIT will have greater effects on costs associated with holding inventory because there is
considerably more work associated with holding finished products as opposed to raw
materials.
As hypothesized (H4), there is a significant negative relationship between SGA margin and
ROS, indicative of the relation between a reduction in SGA margin and the consequent
increase in ROS. The results also indicate a positive indirect effect of vertical integration on
ROS through the reduction in value chain supporting processes costs (SGA margin).
The last research hypothesis (H5) is derived from the conceptual relationship between vertical
integration and performance. This study finds that vertical integration has a positive causal
effect on financial performance, i.e. vertically integrated companies have higher financial
performance as measured by ROS. Empirical evidence in support of these findings can be
traced in a study of vertical integration in the airline industry where Lederman and Forbes
(2010) found that vertical integration in airlines is associated with improved operating
performance. Novak and Stern (2009) in a study of automobile systems also find that
integrated firms have greater improvements in performance over time after vertical
integration. This result provides support to the thesis that a high degree of backward vertical
integration through internal transfers can create economies by ensuring the adequacy in
quality and quantity of supplies as well as reducing cost distortions from monopolized inputs.
In addition it provides access to information about input costs and manufacturing process
which also contributes towards the achievement of lower costs. Similarly, a high degree of
forward vertical integration through internal transfers can reduce costs possibly by
guaranteeing adequate outlets for a firm’s outputs.
The findings suggest that vertical integration is related to better financial performance, either
directly or indirectly through the reduction in FGIT in particular. It also reduces RMIT and
indirectly WIPIT.
6.0 Conclusion
23
The concept of integration is central in supply chain management as evidence by a review of
key supply chain process frameworks, such as the supply chain operations reference (SCOR)
model and the global supply chain forum (GSCF) framework (Grubic, 2010). This study
investigates the effect of vertical integration on various types of inventory turnover in a firm’s
supply chain and the consequent impact on operational and financial performance for the
firm. We find supporting evidence to the hypothesis that vertical integration has a positive
effect on raw materials inventory turnover and finished goods inventory turnover but no
significant effect on work in progress inventory turnover. FGIT is found to contribute to a
reduction in supporting processes costs and in consequence an improvement in ROS. Vertical
integration is also found to impact financial performance (ROS) directly.
The results of the study indicate that management must be aware of the power of supply chain
integration, including vertical integration in the supply chains, as a means for achieving
operational and financial goals. The firm may integrate externally with other firms and
internally across functional units to improve inventory levels and generate efficiencies. The
results of the study indicate that vertical integration has positive and beneficial impacts on
inventory levels which points to the possible positive effects of vertical integration in terms of
co-operation, collaboration and co-ordination between upstream and downstream suppliers
and distributors. The positive effects of vertical integration may be due to the higher levels of
control, co-ordination and integration achieved between previously separated supply chain
nodes that came under common control. The internalization of the manufacturer’s interactions
and exchanges with suppliers, places increased demands for understanding the requirements
of distributors, wholesalers and retailers. For the supply chain to function seamlessly and for
the benefits of vertical integration to be fully realized it is important that functions related to
downstream logistics and marketing are performed efficiently. Hence, the managers of a
vertical integrated organization will need to undertake and play a greater role in the influence,
control, coordination and integration of downstream supply chain partners. Managers must
also be aware of the fact that supply chain integration does not merely impact on inventory
levels and operational performance but also influences firm financial performance.
The findings of this study are robust in relation to the methodology used. Obviously the
model developed can be refined further by considering different inter-relationships between
the key variables as well as various other measures for these variables. The model may benefit
from the adoption of a case study approach where the inter-relationships between the
24
variables may be tested in various settings in specific industrial sectors. For instance, one may
specifically examine possible variations in the strength of the relationship between the various
types of inventory, vertical integration and performance depending on the industrial sector
setting. In addition to the above, the model may benefit by considering other ways of
measuring the variables, especially the inventory types where, in the context of a case study,
actual levels of inventory may be used. In a case study context, future studies may gather data
from the focal firm, its suppliers and customers thus facilitating a more encompassing
perspective of the supply chain and aim at analyzing with additional parameters the
relationship between inventory performance and financial performance. Another interesting
extension of this study would be to collect longitudinal data in order to see the results of
vertical integration on the three types of inventory performance and financial performance
over time. Lastly, future research may also examine how a focal firm's vertical integration
enable it to better respond to a competitor’s inventory and supply chain actions.
As with any study of this nature, our research also has certain limitations. First, although
inferences are drawn from panel data, there is scope for further research with longitudinal data
that can help unearth inter-relationships over time. Second although this paper measures
vertical integration, the hypotheses do not distinguish the effects between backward or
forward vertical integration. It is possible that backward vertical integration will influence
raw materials inventory performance and forward vertical integration finished goods
inventory performance. This can be the subject of further empirical investigation. In addition
the results are subject to the limitations endogenous in path analysis. Those limitations have
been addressed mainly by grounding the hypothesized inter-relationships in the extant
literature.
The paper contributes to the literature on vertical integration which suggests varying effects
of vertical integration on supply chain and financial performance. In particular the
relationship between vertical integration and the possible differential effects on the various
components of inventory turnover have not been examined before, despite the recognition that
different inventory types may be differentially affected, interact and influence other variables
pertaining to the management of the supply chain. The study shows that vertical integration
can have beneficial effects on two key inventory types namely, RMI and FGI. This would
mean improved inbound and outbound processes for a manufacturing firm as a result of
vertical integration. An improvement in finished goods inventory turnover will also reduce
25
the cost of selling, general and administrative expenses directly and indirectly influence
positively the financial performance of the firm.
On the basis of the above future research should aim at differentiating between the three types
of inventory and not treat them as a unified entity. The latter would invariably conceal
important differences in antecedents and consequences of the components of inventory. The
study confirms that inventories play an important role in affecting operational and financial
performance of manufacturing firms and an integration strategy via vertical financial
ownership would impact the different types of inventory differentially. Hence, firms need to
analyze what performance targets they seek with respect to the different inventory
components prior to vertical integration.
The empirical estimation of the five research hypotheses and sub-hypotheses provide practical
implications for companies assessing the extent to which vertical integration is related to
inventory, operational and financial performance. The study finds that only raw materials
inventory turnover will have an impact on work in progress inventory. This means that
vertically integrated firms will be able to not only turn raw materials quicker but this higher
performance will also influence work in progress inventory turnover. This finding re-affirms
the importance of treating inventory type performance in isolation as an improvement in one
type of inventory performance will influence total inventory performance differentially.
References Allen, T.J., Lee, D.M.S., M. L. Tushman. 1980. R & D performance as a function of internal communication, project management, and the nature of the work. IEEE Transactions Engineering Management, EM-27, 2-12. Anderson, M., Banker, R., Huang, R., S. Janakiraman. 2007. Cost behavior and fundamental analysis of SG&A costs. Journal of Accounting, Auditing and Finance, 22, 1-28. Anderson, J.C., Rungtusanatham, M., Schroeder, R.G., S. Devaraj. 1995. A path analytic model of a theory of quality management underlying the Deming management method: Preliminary empirical findings. Decision Sciences, 26(5), 637-658. Arrow, K.J. 1975. Vertical integration and communication. Bell Journal of Economics, 6(1), 173-183. Bagozzi, R.P., Y. Yi. 1988. On the evaluation of structural equation models. Journal of the Academy of Marketing Science, 16, 74–94. Bain, J.S. 1956. Barriers to new competition. Harvard University press, Cambridge, MA.
26
Baker, G.P., T. N. Hubbard. 2003. Make versus buy in trucking: Asset ownership, job design and information. American Economic Review, 93 (3), 551-72. Baker, G.P., T. N. Hubbard. 2004. Contractibility and asset ownership: On-Board computers and governance in U.S. Trucking. Quarterly Journal of Economics, 119(4), 1443–79. Balakrishnan, S., B. Wernerfelt. 1986. Technical change, competition and vertical integration. Strategic Management Journal, 7, 347–359. Beamon, B. M. and Chen, V. C. P. 2001. Performance analysis of conjoined supply chains. International Journal of Production Research, 39(14): 3195–3218 Bhuyan, S. 2002. Impact of vertical mergers on industry profitability: an empirical evaluation. Review of Industrial Organization, 20(1), 61-79. Blinder, A.S., Maccini, L.J. 1991. Taking stock: A critical assessment of recent research on inventories. Journal of Economic Perspectives, 5(1), 73–96. Blois, K.J. 1972. Vertical quasi-integration. Journal of Industrial Economics, 20(3), 253-272. Bollen, K. A. 1989. Structural Equations with Latent Variables. Wiley, New York. Buzacott, J.A., R.Q. Zhang. 2004. Inventory management with asset-based financing. Management Science, 50(9), 1274-1292. Cachon, P.G., M. Fisher. 2000. Supply chain inventory management and the value of shared information. Management Science, 46(8), 1032-1048. Byrd, T.A., N.W. Davidson. 2003. Examining possible antecedents of IT impact on the supply chain and its effect on firm performance. Information and Management, 41(2), 243–255. Cachon, G.P., M. Olivares. 2010. Drivers of finished-goods inventory in the U.S. Automobile industry. Management Science, 56(1), 202-216. Calantone, R.J. Cavusgil, S.T., Y. Zhao. 2002. Learning orientation, firm innovation capability, and firm performance. Industrial Marketing Management, 31, 515–52 Capkun, V., Hameri, A.-P., L.A., Weiss. 2009. On the relationship between inventory and financial performance in manufacturing companies. International Journal of Operations and Production Management, 29(8), 789–806. Chan, F.T.S., Qi, H.J., Chan, H.K., Lau, H.C.W., R.W.L. Ip. 2003. A conceptual model of performance measurement for supply chains. Management Decision, 41 (7), 635–642. Chan, F.T.S., A. Prakash, 2012. Inventory management in a lateral collaborative manufacturing supply chain: a simulation study. International Journal of Production Research, 50 (16), 4670-4685.
27
Chen, H., Frank, M.Z., O.Q. Wu. 2005. What actually happened to inventories of American companies between 1981 and 2000? Management Science, 51, 1015-1031. Chesbrough, H.W., D.J. Teece. 1996. When is virtual virtuous: Organizing for innovation, Harvard Business Review, 74(1), 65-73. Chikan, A. 1996. The volume and structure of inventories. International Journal of Production Economics, 45(1–3), 1–7. Cheung, S. N. S. 1983. The contractual nature of the firm. Journal of Law and Economics, 26, 1-21. Cousins, P.D., B. Menguc. 2006. The implications of socialization and integration in supply chain management. Journal of Operations Management, 24 (5), 604-620. Craighead, C. W., Blackhurst, J., Rungtusanatham, M. J., R.B. Handfield. 2007. The severity of supply chain disruptions: design characteristics and mitigation capabilities. Decision Sciences, 38, 131–156. D’Aveni, R.A., D. J. Ravenscraft. 1994. Economies of integration versus bureaucracy costs: does vertical integration improve performance? Academy of Management Journal, 37(5), 1167-1206. Das, A., Narasimhan, R., S. Talluri. 2006. Supplier integration: finding an optimal configuration, Journal of Operations Management, 24(5), 563-582. Davis, R., I.M. Duhaime. 1992. Diversification, vertical integration and industry analysis: new perspectives and measurement, Strategic Management Journal, 13, 511-524. Dehning, B., Richardson, V.J., R.W. Zmud. 2007. The financial performance effects of IT-based supply chain management systems in manufacturing firms. Journal of Operations Management, 25(4), 806–24. Dev, N.K., Caprihan, R., Swami, S. 2013. Strategic positioning of inventory review policies in alternative supply chain networks: an information-sharing paradigm perspective. International Journal of Logistics Research and Applications, 16(1), 14-33. Dong, Y., K. Xu 2002. A supply chain model of vendor managed inventory. Transportation Research E, 38(2), 75-95. Elmuti, D. 2002. The perceived impact of supply chain management on organizational effectiveness. Journal of Supply Chain Management, 38(3), 49–57. Emery, G.W., M.A. Marques. 2011. The effect of transaction costs, payment terms and power on the level of raw materials inventories, Journal of Operations Management, 29(3), 236-249. Eroglu, C., C. Hofer. 2011a. Lean, Leaner, Too lean? The inventory–performance link revisited. Journal of Operations Management, 29(4), 356–69.
28
Eroglu, C., C. Hofer, C., 2011b. Inventory types and firm performance: Vector autoregressive and vector error correction models. Journal of Business Logistics,. 32(3), 227-239. Fleisch, E., Ch. Tellkamp. 2005. Inventory inaccuracy and supply chain performance: a simulation study of a retail supply chain. International Journal of Production Economics, 95, 373–385. Flynn, B.B., Sakakibara, S., R.G. Schroeder. 1995. Relationship between JIT and TQM: Practices and performance. Academy of Management Journal, 38, 1325-1360. Fisher, M.L. 1997. What is the right supply chain for your product? Harvard Business Review, 75(2), 105–116. Frohlich, M.T., R. Westbrook. 2001. Arcs of integration: an international study of supply chain strategies. Journal of Operations Management, 19(2), 185–200. Forbes, S.J., Lederman, M. 2010. Does vertical integration affect firm performance? Evidence from the airline industry. RAND Journal of Economics, 41(4), 765–790. Forslund, H., Johnson, P. 2010. Integrating the performance management process of on-time delivery with suppliers. International Journal of Logistics Research and Applications, 13(3), 225-241. Fullerton, R.R., C.S. McWatters 2001. The production performance benefits from JIT implementation. Journal of Operations Management, 19, 81-96. Fullerton, R.R., McWatters, C.S., C. Fawson. 2003. An examination of the relationships between JIT and financial performance. Journal of Operations Management, 21, 383-404. Gaur, V., Fisher, M.L., A. Raman. 2005. An econometric analysis of inventory turnover performance in retail services. Management Science, 51(2), 181-194. Goffin, K., Lemke, F., Szwejczewski, M. 2006. An exploratory study of close supplier manufacturer relationships, Journal of Operations Management. 24 (2), 189-209. Grossman, S.J., O.D. Hart. 1986. The costs and benefits of ownership: A theory of vertical and lateral integration. Journal of Political Economy, 94, 691-719. Grant, R.M. 1996. Toward a knowledge-based theory of the firm. Strategic Management Journal, 17, 109-122. Griffin, A., Hauser, J.R., 1992. Patterns of communication among marketing, engineering, and manufacturing - A comparison between two product teams. Management Science, 38, 360–373. Grubic, T., Bastl, M., Fan, Ip-S., Harrison, A., Templar, S. 2010. Towards the integrative supply chain model. International Journal of Logistics Research and Applications, 13(1), 59-73. Hall, R.W. 1983. Zero inventories, Dow Jones-Irwin, Homewood, IL.
29
Harrigan, K.R. 1983. Strategies for Vertical Integration, Lexington, Mass, D. C. Heath & Co. Harrigan, K.R. 1985. Vertical integration and corporate strategy. Academy of Management Journal, 28(2), 397-425. Harrigan, K. R. 1986. Matching vertical integration strategies to competitive conditions, Strategic Management Journal, 7(6), 535-555.
Hatch, N.W., D.C. Mowery 1998. Process innovation and learning by doing in semiconductor manufacturing, Management Science, 44(11), 461-1477. Hennart, J.F. 1988. A transaction costs theory of equity joint ventures. Strategic Management Journal, 9, 361-374. Hendricks, K.B., V.R. Singhal. 2003. The effect of supply chain glitches on shareholder wealth. Journal of Operations Management, 21(5), 501–522. Hendricks, K.B., Singhal, V.R., R. Zhang 2009. The effect of operational slack, diversification, and vertical relatedness on the stock market reaction to supply chain disruptions. Journal of Operations Management, 27, 233–246 Hilton, R.W. 2009. Managerial accounting: Creating value in a dynamic business environment. Irwin McGraw-Hill, Boston. Holly, S., P. Turner. 2001. Inventory investment and asymmetric adjustment: Some evidence From the UK. International Journal of Production Economics, 72(3), 251–260. Hopp. W.J., M.L. Spearman. 1996. Factory Physics: Foundations of Manufacturing Management, ed. Waveland, Chicago Hopp. W.J., M.L. Spearman. 2001. Factory Physics, 2nd ed. Irwin McGraw-Hill, New York Hulland, J., Chow, Y., S. Lam. 1996. Use of causal models in marketing research: a review. International Journal of Research in Marketing, 13, 181–197. Hult, G.T.M., Nichols, E.L., Giunipero, L.C., R.F. Hurley. 2000. Global organizational learning in the supply chain: a low versus high learning study. Journal of International Marketing, 8(3), 61–83. Humphreys, B.R., Maccini, L.J., S. Schuh 2001. Input and output inventories. Journal of Monetary Economics, 47(2), 347–75. Hung, W-H., Lin, C-P and Ho, C-F. 2014. Sharing information in a high uncertainty environment: lessons from the divergent differentiation supply chain. International Journal of Logistics Research and Applications, 17(1), 46-63. Huson, M., D. Nanda. 1995. The impact of just-in-time manufacturing on firm performance. Journal of Operations Management, 12, 297-310.
30
Jacobides, M.G., L.M. Hitt. 2005. Losing sight of the forest for the trees? Productive capabilities and gains from trade as drivers of vertical scope. Strategic Management Journal, 26, 1209-1227. Jones, G.R., C.W.L. Hill. 1988. Transaction cost analysis of strategy-structure choice. Strategic Management Journal, 9, 159-172. Kalwani, M.U., N. Narayandas. 1995. Long-term manufacturer-supplier relationships: do they pay off for supplier firms? Journal of Marketing, 59 (1), 1-16. King, A.A., M.J. Lenox. 2011. Lean and green? An empirical examination of the relationship between lean production and environmental performance. Production and Operations Management, 10 (3), 244–256 Kleindorfer, P.R., G.H. Saad. 2005. Managing disruption risks in supply chains. Production and Operations Management, 14(1), 53–68. Kaufman, A., Wood, C.H., G. Theyel. 2000. Collaboration and technology linkages: a strategic supplier typology. Strategic Management Journal, 21, 649–663. Klein, B. 1988. Vertical integration as organizational ownership: The Fisher Body-General Motors relationship revisited. Journal of Law, Economics and Organization, 4, 199-213. Kogut B, U. Zander. 1992. Knowledge of the firm, combinative capabilities, and the replication of technology. Organisation Science, 3, 383–397. Koumounakos, D.P. 2008. The effect of inventory management in firm performance. International Journal of Productivity and Performance Management, 57(5), 355-369. Lafontaine, F., M. Slade. 2007. Vertical integration and firm boundaries: The evidence. Journal of Economic Literature, 45(3), 629-685. Lederman, M., S.J. Forbes. 2010. Does vertical integration affect firm performance? Evidence from the airline industry, RAND Journal of Economics, 41(4), 765–790 Lieberman, M.B., Helper, S., L. Demeester. 1999. The empirical determinants of inventory levels in high-volume manufacturing. Production and Operations Management, 8(1), 44-55. Lieberman, M.B., S. Asaba. 1997. Inventory reduction and productivity growth: A comparison of Japanese and US automotive sectors. Managerial and Decision Economics, 18(2), 73-85. Leiblein, M.J., Reuer, J.J., F. Dalsace. 2002. Do make or buy decisions matter? The influence of organizational governance on technological performance. Strategic Management Journal, 23(9), 817-833. Li, Η.L, M.J. Τang. 2010. Vertical integration and innovative performance: The effects of external knowledge sourcing modes. Technovation, 30, 401-410.
31
McDonald, J.M. 1985. Market exchange or vertical integration: An empirical analysis. Review of Economics and Statistics, 67(2), 327-331 Maddigan, R.J. 1981. The measurement of vertical integration. Review of Economics and Statistics, 63 (3), 328-335 Mahoney, J.T. 1989. Organizational rationalization and innovation: Vertical integration and multidivisional organization. Unpublished doctoral dissertation, Wharton School, University of Pennsylvania, Philadelphia, PA. Mahoney, J.T. 1992. The choice of organizational form: vertical financial ownership versus other methods of vertical integration. Strategic Management Journal, 13(8), 559-584. Majumdar, S.K., V. Ramaswamy. 1994. Explaining downstream integration. Managerial and Decision Economics, 15(2), 119-129. Malmgren, H. B. 1961. Information, expectations, and the theory of the firm. Quarterly Journal of Economics, 75, 399-421. Nahmias, S. 1997. Production and Operations Analysis, 3rd ed., Homewood, IL, Irwin. Narasimhan, R., SW. Kim. 2002. Effect of supply chain integration on the relationship between diversification and performance: evidence from Japanese and Korean firms, Journal of Operations Management, 20, 303–323.
Nickerson, J.A., T.R. Zenger. 2004. A knowledge-based theory of the firm: The problem-solving perspective. Organization Science, 15(6), 617-632.
Novak, S., S. Stern. 2008. How does outsourcing affect performance dynamics? Evidence from the automobile industry. Management Science, 54, 1963–1979. Novak, S., S. Stern. 2009. Complementarity among vertical integration decisions: Evidence from automobile product development. Management Science, 55 (2), 311-332. Paiva, E.L., Roth, A.V., J.E. Fensterseifer. 2008. Organizational knowledge and the manufacturing strategy process: A resource-based view analysis. Journal of Operations Management, 26, 115-132. Perry, M.K. 1980. Forward integration by Alcoa: 1888-1930. Journal of Industrial Economics, 29, 159-170. Perry, M.K. 1989. Vertical integration: Determinants and effects. Handbook of Industrial Organization, 1, 183-255. Pfeffer J., G. Salancik. 1978. The External Control of Organizations. Harper 8c Row, New York. Pirrong, S.C. 1993. Contracting practices in bulk shipping markets: A transactions cost explanation. Journal of Law and Economics, 36(2), 937–976.
32
Porter, M.A. 1980. Competitive Strategy: Techniques for Analyzing Industries and Competitors, Free press, New York.
Ragatz, G.L., Handfield, R.B., K.J. Petersen. 2002. Benefits associated with supplier integration into new product development under conditions of technology uncertainty. Journal of Business Research, 55, 389–400. Reed, R., M.P. Fronmueller. 1990. Vertical integration: a comparative analysis of performance and risk. Managerial and Decision Economics, 11(3), 177-185. Riordan, M.H., D.E.M. Sappington. 1987. Information, incentives and organizational mode. Quarterly Journal of Economics, 102, 243-263. Rothaermel, F.T., Hitt, M.A., L.A. Jobe. 2006. Balancing vertical integration and strategic outsourcing: Effects on product portfolio, product success, and firm performance. Strategic Management Journal, 27, 1033-1056. Safizadeh, M.H., L.P. Ritzman. 1997. Linking performance drivers in production planning and inventory control to process choice. Journal of Operations Management. 15, 389-403 Salop, S.C., D.T. Scheffman. 1983. Raising rivals’ costs. American Economic Review, 73, 267-271. Schmenner, R.W., M.L. Swink. 1988. On theory in operations management. Journal of Operations Management, 17, 97-113. Schonberger, R.J. 2007. Japanese production management: An evolution - With mixed success. Journal of Operations Management, 25, 403–419 Sensier, M. 2003. Inventories and asymmetric business cycle fluctuations in the UK: A structural approach. Applied Economics, 35(4), 387–402. Shah, R., S.M. Goldstein. 2006. Use of structural equation modeling in operations management research: Looking back and forward. Journal of Operations Management, 24, 148–169 Shah, R., H. Shin. 2007. Relationships among information technology, inventory, and profitability: An investigation of level invariance using sector level data. Journal of Operations Management, 25, 768–784 Smith, S.A., D.D. Achabal. 1998. Clearance pricing and inventory policies for retail chains. Management Science, 44(3), 285-300. Spekman, R., Salmonds, D., J. Kamauff. 1994. At last procurements becomes strategic. Long Range Planning, 27(2), 76-84. Stock, J.R., D.M. Lambert. 2001. Strategic Logistics Management, Irwin McGraw-Hill, Burr Ridge, IL.
33
Su, X. 2007. Intertemporal pricing with strategic customer behavior. Management Science, 53 (5), 726-741. Swamidass, P.M., W. T. Newell. 1987. Manufacturing strategy, environmental uncertainty and performance: A path analytic model. Management Science, 33 (4), 509-524. Swamidass, P.M. 2007. The effect of TPS on US manufacturing during 1981-1998: Inventory increased or decreased as a function of plant performance. International Journal of Production Research, 45, 3763-3778. Tan, K.C., Kannan, V.R., Handfield, R.B., S. Gosh. 1999. Supply chain management: an empirical study of its impact on performance. International Journal of Production Research, 19(10), 1034-1052. Teece, D.J. 1996. Firm organization, industrial structure and technological innovation. Journal of Economic Behavior and Organization, 31(2), 193-224. Tsoukalas, J.D. 2006. Modeling manufacturing inventories. Working Paper. Tan, K.C., Kannan, V.R., Handfield, R.B., S. Ghosh. 1999. Supply chain management: an empirical study of its impact on performance. International Journal of Production Research, 19(10), 1034 - 1052 Vickery, S.K., Jayaram, J., Droge, C., R. Calantone. 2003. The effects of an integrative supply chain strategy on customer service and financial performance: an analysis of direct versus indirect relationships. Journal of Operations Management, 21, 523–539. Vickers, J., M. Waterson. 1991. Vertical relationships: An introduction. Journal of Industrial Economics, 39(5), 445-450. White, R.E, Pearson, J.N., C.K. Wilson. 1999. JIT manufacturing survey of implementations in small and large U.S. manufacturers. Management Science, 45(1), 1-55. Williamson, O.E. 1971. The vertical integration of production: market failure considerations. American Economic Review, 61(2), 112-123. Williamson, O.E. 1975. Markets and hierarchies: Analysis and Antitrust Implications, Free Press, New York. Williamson, O.E. 1985. The Economic Institutions of Capitalism, Free Press, New York. Wisner, J., K. Tan. 2000. Supply chain management and its impact on purchasing. Journal of Supply Chain Management, 36(4), 33–42. Zhao, X., Huo, B., Flynn, B.B., J. Yeung. 2008. The impact of power and relationship commitment on the integration between manufacturers and customers in a supply chain. Journal of Operations Management, 26(3), 368–388.
34
Zhao, X., Huo, B., Selen, W., J. Yeung. 2011. The impact of internal integration and relationship commitment on external integration. Journal of Operations Management, 29, 17-32.
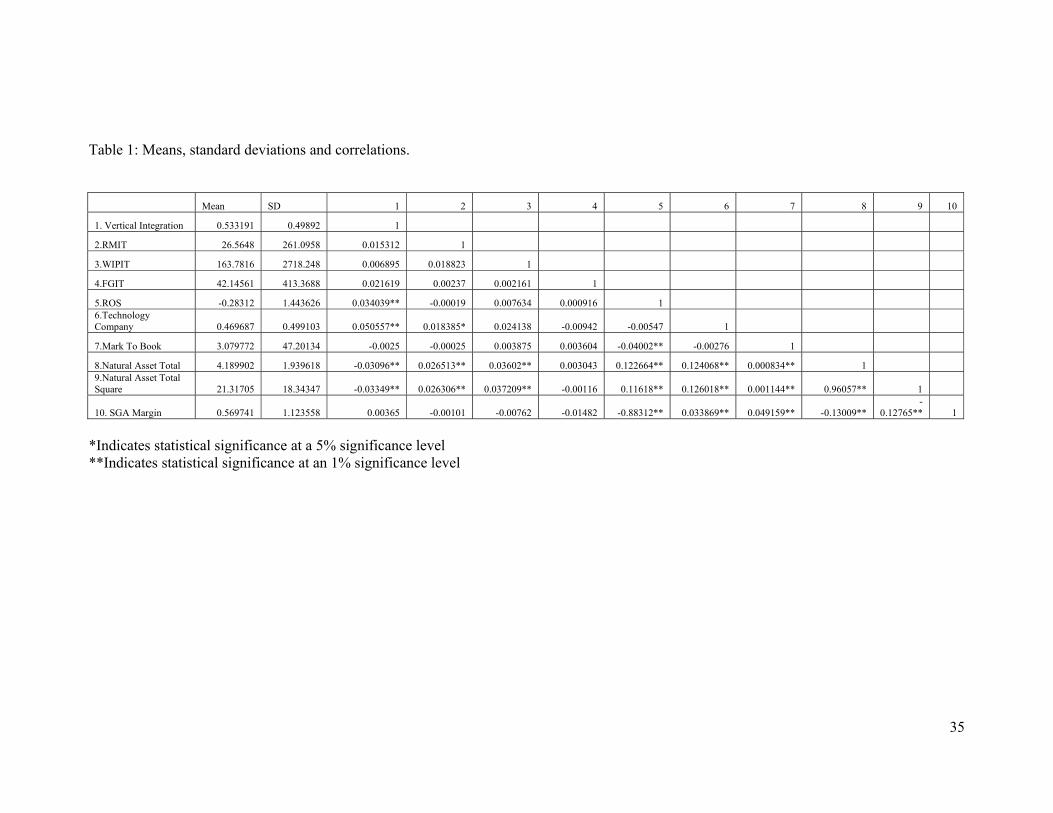
35
Table 1: Means, standard deviations and correlations.
Mean SD 1 2 3 4 5 6 7 8 9 10
1. Vertical Integration 0.533191 0.49892 1
2.RMIT 26.5648 261.0958 0.015312 1
3.WIPIT 163.7816 2718.248 0.006895 0.018823 1
4.FGIT 42.14561 413.3688 0.021619 0.00237 0.002161 1
5.ROS -0.28312 1.443626 0.034039** -0.00019 0.007634 0.000916 1 6.Technology Company 0.469687 0.499103 0.050557** 0.018385* 0.024138 -0.00942 -0.00547 1
7.Mark To Book 3.079772 47.20134 -0.0025 -0.00025 0.003875 0.003604 -0.04002** -0.00276 1
8.Natural Asset Total 4.189902 1.939618 -0.03096** 0.026513** 0.03602** 0.003043 0.122664** 0.124068** 0.000834** 1 9.Natural Asset Total Square 21.31705 18.34347 -0.03349** 0.026306** 0.037209** -0.00116 0.11618** 0.126018** 0.001144** 0.96057** 1
10. SGA Margin 0.569741 1.123558 0.00365 -0.00101 -0.00762 -0.01482 -0.88312** 0.033869** 0.049159** -0.13009** -
0.12765** 1
*Indicates statistical significance at a 5% significance level **Indicates statistical significance at an 1% significance level