Centre-based early education interventions for improving ...

U . S . D E PA R T M E N T O F E D U C AT I O N
The Impact of Two Professional Development Interventions on Early Reading Instruction and Achievement
NCEE 2008-4030

September 2008
The Impact of Two Professional Development Interventions on Early Reading Instruction and Achievement
Michael S. GaretStephanie CronenMarian EatonAnja KurkiMeredith LudwigWehmah JonesKazuaki UekawaAudrey Falk American Institutes for Research
Howard S. BloomFred DoolittlePei ZhuLaura Sztejnberg MDRC
Marsha SilverbergProject OfficerInstitute of Education Sciences
NCEE 2008–4030U.S. DEPARTMENT OF EDUCATION

U.S. Department of EducationMargaret SpellingsSecretary
Institute of Education SciencesGrover J. WhitehurstDirector
National Center for Education Evaluation and Regional AssistancePhoebe CottinghamCommissioner
September 2008
This report was prepared for the Institute of Education Sciences under Contract No. ED-01-CO-0026/0020. The project offi cer was Marsha Silverberg in the National Center for Education Evaluation and Regional Assistance.
IES evaluation reports present objective information on the conditions of implementation and impacts of the programs being evaluated. IES evaluation reports do not include conclusions or recommendations or views with regard to actions policymakers or practitioners should take in light of the fi ndings in the reports.
This report is in the public domain. Authorization to reproduce it in whole or in part is granted. While permission to reprint this publication is not necessary, the citation should be: Garet, Michael S., Stephanie Cronen, Marian Eaton, Anja Kurki, Meredith Ludwig, Wehmah Jones, Kazuaki Uekawa, Audrey Falk, Howard Bloom, Fred Doolittle, Pei Zhu, and Laura Sztejnberg. The Impact of Two Professional Development Interventions on Early Reading Instruction and Achievement (NCEE 2008-4030). Washington, DC: National Center for Education Evaluation and Regional Assistance, Institute of Education Sciences, U.S. Department of Education.
To order copies of this report,
• Write to ED Pubs, Education Publications Center, U.S. Department of Education, P.O. Box 1398, Jessup, MD 20794-1398.
• Call in your request toll free to 1-877-4ED-Pubs. If 877 service is not yet available in your area, call 800-872-5327 (800-USA-LEARN). Those who use a telecommunications device for the deaf (TDD) or a teletypewriter (TTY) should call 800-437-0833.
• Fax your request to 301-470-1244.• Order online at www.edpubs.org.
This report also is available on the IES website at http://ies.ed.gov/ncee.
Upon request, this report is available in alternate formats such as Braille, large print, audiotape, orcomputer diskette. For more information, please contact the Department’s Alternate Format Center at 202-260-9895 or 202-205-8113.

iii
ACKNOWLEDGMENTS
This study represents a collaborative effort of school districts, schools, teachers, researchers, and professional development providers. We appreciate the willingness of the school districts, schools, and teachers to volunteer for the study, participate in the professional development, and respond to many requests for data, feedback, and access to classrooms. We were also fortunate to have the advice of an expert technical working group. Members included Tom Cook, Northwestern University; Linnea C. Ehri, City University of New York; Barbara Foorman, Florida State University; Mary M. Kennedy, Michigan State University; Andrew C. Porter, University of Pennsylvania; Brian Rowan, University of Michigan; Latrice M. Seals, educational consultant for the Houston Independent School District; Michael Seltzer, University of California, Los Angeles; William Shadish, University of California, Merced; and Joseph Torgesen, Florida State University. We also benefitted from the informed feedback on the study’s statistical analyses and report from the following people at the American Institutes for Research (AIR) and MDRC: George Bohrnstedt, Terry Salinger, James Kemple, Charles Michalopoulos, and Gordon Berlin.
We would like to thank all those who provided the professional development during the study, including the coaches within the study districts; the LETRS facilitators at Sopris West, and the coaching facilitators at the Consortium on Reading Excellence (CORE), as well as the members of the intervention team who provided monitoring support: Kirk Walters, Judith Littman, and Terry Anstrom. We also thank Michelle Cantave, Amber Noel, Sara Yonker, Consuelo Aceves, Kristen Hodge, Shelley Rappaport, and Jeanna Hicks for coordinating the classroom observations and survey administration and data processing; Sandra Tang and Jeannette Moses for all their support to the staff conducting data collection and processing; Lynne Blankenship and the conference staff for all their support in managing many of the study’s professional development activities; Susan Sepanik and Adam Wodka for their excellent research assistance with the student records; all of the staff at REDA International, Inc., MDRC, and AIR who helped us collect and process data throughout the study; and the AIR and MDRC staff who helped us start the study up during the early years: Reuben Jacobson, Courtney Tanenbaum, Steve Hurlburt, Robert Ivry, Jason Snipes, Kristin Porter, and Jean Eisberg. Finally, we would like to thank our report editors, Holly Baker, Mike Rollins, and Maria Stephens who helped to make the report useful and understandable.


v
DISCLOSURE OF POTENTIAL CONFLICTS OF INTEREST1
The research team for this study consisted of a prime contractor, American Institutes for Research (AIR), and two subcontractors, MDRC and REDA International, Inc. None of these organizations or their key staff has financial interests that could be affected by findings from the Early Reading PD Interventions Study. No one on the seven-member Expert Advisory Panel, convened by the research team one to two times a year to provide advice and guidance, has financial interests that could be affected by findings from the evaluation.
1 Contractors carrying out research and evaluation projects for IES frequently need to obtain expert advice and technical assistance from individuals and entities whose other professional work may not be entirely independent of or separable from the particular tasks they are carrying out for the IES contractor. Contractors endeavor not to put such individuals or entities in positions in which they could bias the analysis and reporting of results, and their potential conflicts of interest are disclosed.


vii
TABLE OF CONTENTS
Acknowledgments.............................................................................................................................................iii
Disclosure of Potential Conflicts of Interest .................................................................................................v
Executive Summary The Impact of Two Professional Development Interventions for Early Reading Instruction ..........................................................................................................................xix The PD Interventions Evaluated ..............................................................................................................xx Study Participants .......................................................................................................................................xxi Study Design .............................................................................................................................................xxiv Study Findings ..........................................................................................................................................xxvi
Chapter 1 Introduction ....................................................................................................................................1 Research on PD and Early Reading Instruction.......................................................................................2 Overview of the Early Reading PD Interventions Study Interventions ...............................................4 Overview of the Study’s Evaluation Design .............................................................................................6 Content and Organization of This Report ................................................................................................7
Chapter 2 Implementation of the Early Reading PD Interventions Study Design ................................9 Recruitment, Random Assignment, and Study Samples..........................................................................9 Data Collected for the Study .....................................................................................................................14 Outcome Measures .....................................................................................................................................17 Characteristics of the Study Sample at the Time of Random Assignment .........................................19 Estimation Methods....................................................................................................................................21
Chapter 3 Implementation of the PD Interventions.................................................................................29 Teacher Institute Series ..............................................................................................................................29 Coaching .......................................................................................................................................................33 Comparison of the Professional Development Experienced by Treatment and Control Groups .39 Cost of the PD Interventions....................................................................................................................40
Chapter 4 Impact of the Two PD Interventions During the Implementation Year ............................43 Understanding the Impact Tables.............................................................................................................43 Impacts on Teachers: Knowledge of Early Reading Content and Instruction and Use of Instructional Practices in the Classroom ...............................................................................................45
Impact on Students: Reading Achievement ...........................................................................................49
Chapter 5 Findings from the Follow-Up Year ...........................................................................................53 Understanding the Impact Tables.............................................................................................................53 Impacts on Teachers: Knowledge of Early Reading Content and Instruction and Use of Instructional Practices in the Classroom ...............................................................................................54
Impact on Students: Reading Achievement ...........................................................................................60
Chapter 6 Exploratory Analyses ...................................................................................................................63 Student Achievement..................................................................................................................................63 Teacher Knowledge and Instructional Practice ......................................................................................67

viii
References .........................................................................................................................................................75
Appendix A Theory of Action and Development of the PD Interventions for the Early Reading PD Interventions Study ............................................................................................................ A-1 I. Theory of Action for the Early Reading PD Interventions Study ............................................... A-1 II. Details on the Institute and Seminar Series ................................................................................... A-4 III. Details on the Coaching Intervention........................................................................................... A-9
Appendix B Details on the Study Design and Implementation ............................................................B-1 I. Similarity of the Teacher Sample to National Populations ............................................................B-1 II. Post-Random Assignment Teacher Exit and Entry ......................................................................B-2 III. Samples Referenced in the Report..................................................................................................B-5 IV. Estimates of Statistical Precision Based on Data Used in Analyses ..........................................B-6
Appendix C Details on Teacher Data and Teacher Sample Characteristics ....................................... C-1 I. Summary of Teacher Response Rates .............................................................................................. C-1 II. Teacher Variables Used in the Analysis of Baseline Characteristics .......................................... C-2 III. Group Equivalence for Teachers Included in the Impact Analyses......................................... C-6
Appendix D Reading Content and Practices Survey Design and Scales .............................................D-1 I. Overall Design of the RCPS..............................................................................................................D-1 II. Characteristics of the RCPS Item Bank and Construction of Multiple Test Forms................D-1 III. Administration During the Implementation and Follow-Up Years .........................................D-3 IV. Scaling ................................................................................................................................................D-3 V. Outcome Measure Properties...........................................................................................................D-4
Appendix E Classroom Observer Training and Inter-Rater Reliability .............................................. E-1 I. Development of the Protocol............................................................................................................ E-1 II. Selection and Assignment of Observers......................................................................................... E-2 III. Training Workshops ........................................................................................................................ E-3 IV. Approach to Inter-Rater Reliability ............................................................................................... E-3 V. Inter-Rater Reliability Results........................................................................................................... E-5
Appendix F Classroom Observation Scales and Descriptive Statistics ................................................F-1 I. Explicit Instruction/Independent Student Activity ........................................................................F-1 II. Differentiated Instruction..................................................................................................................F-3 III. Reliability of the Scales .....................................................................................................................F-4 IV. Items Used to Create the Explicit Instruction, Independent Student Activity, and Differentiated Instruction Scales ..........................................................................................................F-5
V. Descriptive Statistics for Classroom Observations........................................................................F-8
Appendix G Details on Student Data, Sample Characteristics, and Achievement Measures ..........G-1 I. Analysis Sample Description .............................................................................................................G-1 II. Student Achievement Tests..............................................................................................................G-1
Appendix H Details on Implementation of the PD Interventions ......................................................H-1 I. Fidelity of the Institutes and Seminars .............................................................................................H-1 II. Coaching..............................................................................................................................................H-3

ix
Appendix I Validation of the Survey Data on Professional Development Participation ...................I-1 I. Participation in Institutes and Seminars.............................................................................................I-1 II. Participation in Coaching....................................................................................................................I-2
Appendix J Estimation Methods and Hypothesis Testing ......................................................................J-1 I. Analysis Models .....................................................................................................................................J-1 II. Standardization of Outcome Measures ............................................................................................J-5 III. Approach to Multiple Hypothesis Testing .....................................................................................J-6
Appendix K Fall 2005 Short-Term Teacher Practice Outcomes .........................................................K-1
Appendix L Supporting Tables and Figures for Impact Analyses ........................................................L-1 I. Unadjusted Means ................................................................................................................................L-1 II. Interaction of the Impact of the Treatment and Baseline Teacher Knowledge........................L-7 III. Coach Clustering Sensitivity Analysis...........................................................................................L-10 IV. Teacher Knowledge Measure Misfit Exclusion Sensitivity Analysis........................................L-11 V. Analysis of District Variation in the Impact of the Treatments ................................................L-13 VI. Analysis of the Impact of the PD Interventions on Classroom Instruction Separately for Word and Meaning-Level Instruction ......................................................................L-33
Appendix M Supplementary Analyses ......................................................................................................M-1 I. Outcomes for Stable Teachers ..........................................................................................................M-1 II. Achievement Outcomes for Stable Students of Stable Teachers Analysis................................M-3 III. Level of Teacher Knowledge at Baseline, Spring of Implementation Year, and Spring of Follow-Up Year ....................................................................................................................M-5
IV. Variation in the Use of Explicit Instruction, Independent Study Activity, and Differentiated Instruction.....................................................................................................................M-7

x
LIST OF TABLES
Table E-1. Characteristics of Study Schools and Average Urban or Urban Fringe U.S. Elementary Schools, 2005–2006...........................................................................................xxiii
Table E–2. Number of Schools, Teachers, and Students in Spring 2006 Sample, Overall and by Group.....................................................................................................................xxiii
Table 2-1. Characteristics of Study Schools and Average Urban or Urban Fringe
U.S. Elementary Schools, 2005–2006..............................................................................................11 Table 2-2. Number of Schools by Treatment Group and District..........................................................11 Table 2-3. Number of Teachers in Semester-Specific Samples, by Group............................................12 Table 2-4. Stable Teachers as a Percentage of Semester-Specific Samples, by Group.........................13 Table 2-5. Number of Schools, Teachers, and Students in Implementation Year
Spring Sample, Overall and by Group ............................................................................................14 Table 2-6. Timing of Key PD and Data Collection Activities ..................................................................15 Table 2-7. School Characteristics, by Group, Baseline Year (2004–2005).............................................22 Table 2-8. Teacher Characteristics, by Group, Fall of Implementation Year (2005–2006) ...............23 Table 3-1. Fidelity of Teacher Institutes and Seminars: Percent of Planned Institute Series
Time Delivered (Duration) and Percent of Agenda Subtopics in Which the Format Matched the Plan, the Content Matched the Plan, and in Which More than 80 Percent of Teachers Were Engaged, Averaged Across Day and District.............................32
Table 3-2. Mean Hours of Participation in Institute Series by PD Topic Area [Implementation Year Spring Sample] ............................................................................................33
Table 3-3. Hours of Coaching Institute Delivered, by PD Topic Area..................................................36 Table 3-4. Hours of Coaching Provided to Treatment Group B Teachers During the
Implementation Year, Overall and by Activity and Topic [Implementation Year Spring Sample] ....................................................................................................................................38
Table 3-5. Teacher-Reported Hours of Participation in Study-Relevant Professional Development During Summer 2005 and the 2005–2006 School Year, by Treatment Group [Implementation Year Spring Sample] ...............................................................................41
Table 3-6. Cost of the Eight Day Institute Series Professional Development During Summer 2005 and the 2005–2006 School Year, Overall and by Cost Category.......................42
Table 3-7. Cost of Treatment B, Overall and by Cost Category .............................................................42 Table 4-1. Impact of the PD Interventions on Teacher Knowledge: Total Score,
Word-Level Score, and Meaning-Level Score [Implementation Year Spring Sample] ............46 Table 4-2. Impact of the PD Interventions on Teacher Practices in Reading Instruction:
Teacher-Led Explicit Instruction, Independent Student Activity, and Differentiated Instruction [Implementation Year Spring Sample] .......................................................................48
Table 4-3. Impact of the PD Interventions on Student Reading Scores: Total Reading Score and Percent At or Above the Overall Baseline Mean [Implementation Year Spring Sample].......51
xi
Table 5-1. Impact of the PD Interventions on Teacher Knowledge: Total Score, Word-Level
Score, and Meaning-Level Score [Follow-Up Year Spring Sample] ...........................................55 Table 5-2. Impact of the PD Interventions on Teacher Practices in Reading Instruction:
Teacher-Led Explicit Instruction, Independent Student Activity, and Differentiated Instruction [Follow-Up Year Fall Sample] .....................................................................................58
Table 5-3. Impact of the PD Interventions on Student Reading Scores: Total Reading Score and Percent At or Above the Overall Baseline Mean [Follow-Up Year Spring Sample] ........61
Table 6-1. Associations Between Teacher Variables and Student Reading Achievement ...................65 Table 6-2. Mean Hours of Attendance During Coverage of Word- and Meaning-Level
Topics in Teacher Institute Series [Implementation Year Spring Sample] ................................69 Table 6-3. Emphasis Placed on Word- and Meaning-Level Content in the Professional
Development Institutes Teachers Participated in During the 2005–2006 School Year, as Reported by Teachers on a Scale of 1 (Not an Emphasis) to 4 (Major Emphasis) [Implementation Year Spring Sample] ............................................................................................70
Table 6-4. Baseline Teacher Knowledge Scores on the Reading Content and Practice Survey, by Word- and Meaning-Level Scales [Implementation Year Fall Sample] ................................71
Table 6-5. Scores on the Reading Content and Practice Survey for Experienced Reading Professional Development Providers, Control Group Teachers, Coaches, and Novices.......73
Table B-1. Characteristics of Average Urban or Urban Fringe U.S. Second Grade Teachers
and Study Teachers [Implementation Year Spring Sample] ......................................................B-1 Table B-2. Number and Percent of Implementation Year Fall Sample Teachers Who Were
Also in the Implementation Year Spring Sample, Overall and by District and Group.........B-3 Table B-3. Number and Percent of Implementation Year Fall Sample Teachers Who
Were Also in Both the Fall and Spring Follow-up Year Samples, Overall and by District and Group .....................................................................................................................B-3
Table B-4. Minimum Detectable Effects for Implementation Year Spring Sample Impact Estimates ...........................................................................................................................................B-7
Table B-5. Minimum Detectable Effects for Follow-Up Year Sample Impact Estimates ................B-8 Table B-6. Minimum Detectable Effects for Implementation Year Sample RCPS Baseline
Interaction Effects ...........................................................................................................................B-8 Table B-7. Minimum Detectable Effects for Implementation Year Stable Students of Stable
Teachers Sample Impact Estimates...............................................................................................B-9 Table B-8. Minimum Detectable Effects for Follow-Up Year Stable Teachers Sample Impact
Estimates ...........................................................................................................................................B-9 Table C-1. Response Rates for Teacher Data Collections, by Group ................................................. C-3 Table C-2. Chi-Square Test of Equal Proportions for Response Rates Between Study Groups .... C-4 Table C-3. Teacher Characteristics, by Group [Implementation Year Spring Teacher
Knowledge Analysis Sample (RCPS)] .......................................................................................... C-7

xii
Table C-4. Teacher Characteristics, by Group [Follow-Up Year Spring Teacher Knowledge Analysis Sample (RCPS)]................................................................................................................ C-8
Table C-5. Teacher Characteristics, by Group [Implementation Year Spring Teacher Practices Analysis Sample] ............................................................................................................. C-9
Table C-6. Teacher Characteristics, by Group [Follow-Up Year Fall Teacher Practices Analysis Sample] ............................................................................................................................ C-10
Table D-1. Summary of Item Topics and Formats in the RCPS Item Bank......................................D-2 Table D-2. Matrix of Topics Covered by RCPS Items (Number of Items in Each Category)........D-2 Table D-3. Distribution of Item Blocks among RCPS Forms and Administrations ........................D-3 Table E-1. Percentage Agreement for the Overall Observation Protocol, Fall 2005,
Spring 2006, and Fall 2006............................................................................................................. E-5 Table F-1. Percent and Number of Teachers Who Did Not Engage in Differentiated
Instruction During Any Interval in Spring of the Implementation Year, by District............F-3 Table F-2a. Percent of Intervals Spent in Different Classroom Formats, Fall of the
Implementation Year .......................................................................................................................F-8 Table F-2b. Percent of Intervals Spent in Different Components of Reading Instruction and
Other Content Areas, Fall of the Implementation Year ............................................................F-8 Table F-2c. Percent of Intervals Spent in Type of Instruction, Fall of the Implementation Year ....F-9 Table F-3a. Average Length of Observations, in Three Minute Intervals, Spring of the
Implementation Year .......................................................................................................................F-9 Table F-3b. Percent of Intervals in Different Classroom Formats, Spring of the
Implementation Year .......................................................................................................................F-9 Table F-3c. Percent of Intervals in Different Components or Content Areas, Spring of the
Implementation Year .....................................................................................................................F-10 Table F-3d. Percent of Intervals Spent in Type of Instruction, Spring of the Implementation
Year ..................................................................................................................................................F-10 Table F-4a. Average Length of Observations, in Three Minute Intervals, Fall of the
Follow-Up Year ..............................................................................................................................F-11 Table F-4b. Percent of Intervals in Different Classroom Formats, Fall of the Follow-Up Year ....F-11 Table F-4c. Percent of Intervals in Different Components or Content Areas, Fall of the
Follow-Up Year ..............................................................................................................................F-11 Table F-4d. Percent of Intervals Spent in Type of Instruction, Fall of the Follow-Up Year...........F-12 Table G-1. Student Characteristics, by Group [Implementation Year Spring Sample] ....................G-2 Table G-2. Student Characteristics, by Group [Follow-Up Year Spring Sample] .............................G-3 Table I-1. Difference in Institute and Seminar Participation Between Teachers in
Conditions A and B (PD Seminars/Institutes).............................................................................I-2

xiii
Table J-1. Results of Implementation Year Composite Tests.................................................................J-8 Table J-2. Results of Follow-Up Year Composite Tests..........................................................................J-8 Table K-1. Short-Term Impact of the PD Interventions on Teacher Practices in Reading
Instruction: Teacher-Led Explicit Instruction, Independent Student Activity, and Differentiated Instruction [Implementation Year Fall Sample] ...............................................K-2
Table L-1. Impact of the PD Interventions on Teacher Knowledge: Total Score, Word-Level
Score, and Meaning-Level Score [Implementation Year Spring Sample, Unadjusted Means]................................................................................................................................................L-2
Table L-2. Impact of the PD Interventions on Teacher Practices in Reading Instruction: Teacher-Led Explicit Instruction, Independent Student Activity, and Differentiated Instruction [Implementation Year Spring Sample, Unadjusted Means]...................................L-3
Table L-3. Impact of the PD Interventions on Student Reading Scores: Total Reading Score and Percent At or Above the Overall Baseline Mean [Implementation Year Spring Sample, Unadjusted Means]............................................................................................................L-4
Table L-4. Impact of the PD Interventions on Teacher Knowledge: Total Score, Word-Level Score, and Meaning-Level Score [Follow-Up Year Spring Sample, Unadjusted Means] ......L-5
Table L-5. Impact of the PD Interventions on Teacher Practices in Reading Instruction: Teacher-Led Explicit Instruction, Independent Student Activity, and Differentiated Instruction [Follow-Up Year Fall Sample, Unadjusted Means] ................................................L-6
Table L-6. Impact of the PD Interventions on Student Reading Scores: Total Reading Score and Percent At or Above the Overall Baseline Mean [Follow-Up Year Spring Sample, Unadjusted Means]...........................................................................................................................L-7
Table L-7. Interaction of Baseline Teacher Knowledge and the Treatment Effect, Teacher Knowledge Outcomes [Implementation Year Spring Sample] .................................................L-8
Table L-8. Interaction of Baseline Teacher Knowledge and the Treatment Effect, Teacher Practice Outcomes [Implementation Year Spring Sample] .......................................................L-9
Table L-9. Interaction of Baseline Teacher Knowledge and the Treatment Effect, Student Achievement Outcomes [Implementation Year Spring Sample] ............................................L-10
Table L-10. Impact of the PD Interventions on Teacher Practices in Reading Instruction: Teacher-Led Explicit Instruction, Independent Student Activity, and Differentiated Instruction [Implementation Year Spring Sample, Accounting for Coach Clustering].......L-11
Table L-11. Impact of the PD Interventions on Teacher Knowledge: Total Score and Word-Level Score [Implementation Year Spring Sample, Excluding Misfitting Word-Level Item]...........................................................................................................................L-12
Table L-12. Impact of the PD Interventions on Teacher Knowledge: Total Score and Word-Level Score [Follow-Up Year Spring Sample, Excluding Misfitting Word-Level Item]...........................................................................................................................L-13
Table L-13. Results of F-test for Variation in District-Level Impacts, Teacher Knowledge Outcomes [Implementation Year Spring Sample].....................................................................L-14
Table L-14. Results of F-test for Variation in District-Level Impacts, Teacher Practice Outcomes [Implementation Year Spring Sample].....................................................................L-14

xiv
Table L-15. Results of F-test for Variation in District-Level Impacts, Student Achievement Outcomes [Implementation Year Spring Sample].....................................................................L-15
Table L-16. Results of F-test for Variation in District-Level Impacts, Teacher Knowledge Outcomes [Follow-Up Year Spring Sample]..............................................................................L-15
Table L-17. Results of F-test for Variation in District-Level Impacts, Teacher Practice Outcomes [Follow-Up Year Fall Sample] ..................................................................................L-16
Table L-18. Results of F-test for Variation in District-Level Impacts, Student Achievement Outcomes [Follow-Up Year Spring Sample]..............................................................................L-16
Table L-19. Impact of the PD Interventions on Teacher-led Explicit Instruction During Intervals in Which Word- and Meaning-Level Components of Reading Are the Focus of Instruction [Implementation Year Spring Sample]...................................................L-34
Table L-20. Impact of the PD Interventions on Independent Student Activity During Intervals in Which Word- and Meaning-Level Components of Reading Are the Focus of Instruction [Implementation Year Spring Sample]...................................................L-35
Table M-1. Teacher Knowledge Outcomes at Follow-Up: Total Score and Word-Level Score
[Follow-Up Year Spring Stable Teacher Sample] .......................................................................M-2 Table M-2. Teacher Practice Outcomes at Follow-Up: Teacher-Led Explicit Instruction
[Follow-Up Year Fall Stable Teacher Sample] ............................................................................M-3 Table M-3. Student Achievement Outcomes in the Implementation Year [Stable Students of
Stable Implementation Year Teacher Sample]............................................................................M-4 Table M-4. Percent of Teachers who Engaged in Differentiated Instruction and Mean Percent
of Intervals During Which Teachers Engaged in Differentiated Instruction, by District [Implementation Year Spring Sample] .........................................................................................M-7
xv
LIST OF FIGURES
Figure E-1. Effects of the PD Interventions on Teachers’ Total, Word-Level, and Meaning-Level Reading Knowledge Score, Implementation Year Spring Sample............. xxviii
Figure E-2. Effects of the PD Interventions on Teachers’ Use of Explicit Instruction, Independent Student Activity (ISA), and Differentiated Instruction (DI), Implementation Year Spring Sample ...........................................................................................xxix
Figure E-3. Effects of the PD Interventions on Standardized Student Total Reading Test Scores, Implementation Year Spring Sample...............................................................................xxx
Figure E-4. Impact of the PD on Teacher Knowledge Total Score, Word-Level Score, and Meaning-Level Score: Implementation vs. Follow-Up Year............................................xxxi
Figure E-5. Impact of the PD on Explicit Instruction, Independent Student Activity, and Differentiated Instruction: Implementation vs. Follow-Up Year..........................................xxxii
Figure E–6. Impact of the PD on Standardized Student Total Reading Scores: Implementation vs. Follow-Up Year......................................................................................... xxxiii
Figure E-7. Impact of the PD on Student Dichotomous Outcome: Implementation vs. Follow-Up Year ............................................................................................................................ xxxiii
Figure 5-1. Impact of the PD on Teacher Knowledge Total Score, Word-Level Score, and
Meaning-Level Score: Implementation vs. Follow-Up Year ......................................................56 Figure 5-2. Impact of the PD on Explicit Instruction, Independent Student Activity, and
Differentiated Instruction: Implementation vs. Follow-Up Year..............................................59 Figure 5-3. Impact of the PD on Standardized Student Total Reading Scores:
Implementation vs. Follow-Up Year...............................................................................................61 Figure 5-4. Impact of the PD on Student Dichotomous Outcome: Implementation vs.
Follow-Up Year ..................................................................................................................................62 Figure L-1. Impact of the PD Interventions on Teacher Knowledge: Total Score, by
District [Implementation Year Spring Sample] .........................................................................L–17 Figure L-2. Impact of the PD Interventions on Teacher Knowledge: Word-Level Score,
by District [Implementation Year Spring Sample] ...................................................................L–18 Figure L-3. Impact of the PD Interventions on Teacher Knowledge: Meaning-Level Score,
by District [Implementation Year Spring Sample] ...................................................................L–19 Figure L-4. Impact of the PD Interventions on Teacher Practices in Reading Instruction:
Explicit Instruction, by District [Implementation Year Spring Sample]...............................L–20 Figure L-5. Impact of the PD Interventions on Teacher Practices in Reading Instruction:
Independent Student Activity, by District [Implementation Year Spring Sample] .............L–21 Figure L-6. Impact of the PD Interventions on Teacher Practices in Reading Instruction:
Differentiated Instruction, by District [Implementation Year Spring Sample]....................L–22 Figure L-7. Impact of the PD Interventions on Student Reading Scores: Total Reading
Score, by District [Implementation Year Spring Sample] .......................................................L–23

xvi
Figure L-8. Impact of the PD Interventions on Student Achievement: Percent At or Above Overall Baseline Mean, by District [Implementation Year Spring Sample].............L–24
Figure L-9. Impact of the PD Interventions on Teacher Knowledge: Total Score, by District [Follow-Up Year Spring Sample] .............................................................................L–25
Figure L-10. Impact of the PD Interventions on Teacher Knowledge: Word-Level Score, by District [Follow-Up Year Spring Sample] ............................................................................L–26
Figure L-11. Impact of the PD Interventions on Teacher Knowledge: Meaning-Level Score, by District [Follow-Up Year Spring Sample] ................................................................L–27
Figure L-12. Impact of the PD Interventions on Teacher Practices in Reading Instruction: Explicit Instruction, by District [Follow-Up Year Fall Sample].............................................L–28
Figure L-13. Impact of the PD Interventions on Teacher Practices in Reading Instruction: Independent Student Activity, by District [Follow-Up Year Fall Sample] ...........................L–29
Figure L-14. Impact of the PD Interventions on Teacher Practices in Reading Instruction: Differentiated Instruction, by District [Follow-Up Year Fall Sample]..................................L–30
Figure L-15. Impact of the PD Interventions on Student Reading Scores: Total Reading Score, by District [Follow-Up Year Spring Sample] ................................................................L–31
Figure L-16. Impact of the PD Interventions on Student Achievement: Percent At or Above Overall Baseline Mean, by District [Follow-Up Year Spring Sample]......................L–32
Figure M-1. Level of Teacher Knowledge at Baseline, Spring of Implementation Year,
and Spring of Follow-up Year [Follow-up Year Stable Teacher Sample]..............................M–6 Figure M-2. Percent of Study Schools in Each District With No, Some, or All Teachers
Observed to Engage in Differentiated Instruction [Implementation Year Spring Sample] ................................................................................................................................M–8

xvii
LIST OF EXHIBITS
Exhibit 1-1. Early Reading PD Interventions Study Theory of Action ...................................................7 Exhibit A-1. Theory of Action for the Early Reading PD Interventions Study ............................... A–2 Exhibit B-1. Flowchart of Teacher Sample Exit and Entry ..................................................................B–4 Exhibit G-1. Descriptive Characteristics and Properties of Student Reading
Achievement Tests.........................................................................................................................G–4 Exhibit H-1. Sample from Fidelity Coding Form, Institute Day 1 .....................................................H–2 Exhibit J-1. Outcome Domains, Measures, Subgroups, and Types of Tests for Early Reading
PD Interventions Study................................................................................................................... J–7


xix
EXECUTIVE SUMMARY
THE IMPACT OF TWO PROFESSIONAL DEVELOPMENT
INTERVENTIONS ON EARLY READING INSTRUCTION
Professional development (PD) of teachers is viewed as a vital tool in school improvement efforts (Hill 2007). The importance of professional development (PD) for teachers is underscored in several major federal education initiatives, including the No Child Left Behind (NCLB) statute. For example, Title II of NCLB provided $585 million to states and districts for PD activities during the 2002-2003 school year alone in order to meet the goal of having a highly qualified teacher in every classroom (U.S. Department of Education, 2005). Two years later, Title II funding for PD remained at over $500 million (U.S. Department of Education 2007).
Are teachers receiving the PD that they need? A recent national study of state and local NCLB implementation indicated that 80 percent of elementary teachers reported participating in 24 hours of PD on reading instruction or less during the 2003–2004 school year and summer (U.S. Department of Education 2007). Reading and PD experts have raised a concern that this level of PD is not intensive enough to be effective, and that it does not focus enough on subject-matter knowledge (Cohen and Hill 2001; Fletcher and Lyon 1998; Foorman and Moats 2004; Garet, Porter, Desimone, Birman, and Yoon 2001).
To help states and districts make informed decisions about the PD they implement to improve reading instruction, the U.S. Department of Education commissioned the Early Reading PD Interventions Study to examine the impact of two research-based PD interventions for reading instruction: (1) a content-focused teacher institute series that began in the summer and continued through much of the school year (treatment A) and (2) the same institute series plus in-school coaching (treatment B). The study team consists of AIR, MDRC, and REDA International, Inc., who conducted the research activities, and Sopris West and the Consortium on Reading Excellence (CORE), who delivered the teacher and coach PD.
The Early Reading PD Interventions Study used an experimental design to test the effectiveness of the two PD interventions in improving the knowledge and practice of teachers and the reading achievement of their students in high-poverty schools. It focused specifically on second grade reading because (1) this is the earliest grade in which enough districts collect the standardized reading assessment data needed for the study; and (2) later grades involve supplementary (pull out) instruction, which was outside the scope of the study. The study was implemented in 90 schools in six districts (a total of 270 teachers), with equal numbers of schools randomly assigned in each district to treatment A, treatment B, or the control group, which participated only in the usual PD offered by the district. This design allowed the study team to determine the impact of each of the two PD interventions by comparing each treatment group’s outcomes with those of the control group, and also to determine the impact of the coaching above and beyond the institute series by comparing treatment group B with treatment group A.
This report describes the implementation of the PD interventions tested, and examines their impacts at the end of the year the PD was delivered. In addition, we investigate the possible lagged

xx
effect of the interventions, based on outcomes data collected the year after the PD interventions concluded.
The study produced the following results:
• Although there were positive impacts on teacher’s knowledge of scientifically based reading instruction and on one of the three instructional practices promoted by the study PD, neither PD intervention resulted in significantly higher student test scores at the end of the one-year treatment. Teachers in schools that were randomly assigned to receive the study’s PD scored significantly higher on the teacher knowledge test than did teachers in control schools, with standardized mean difference effect sizes (hereafter referred to as “effect sizes”) of 0.37 for the institute series alone (treatment A) and 0.38 for the institute series plus coaching (treatment B). Teachers in both treatment A and treatment B used explicit instruction to a significantly greater extent during their reading instruction blocks than teachers in control schools (effect size of 0.33 for treatment A and 0.53 for treatment B). However, there were no statistically significant differences in achievement between students in the treatment and control schools.
• The added effect of the coaching intervention on teacher practices in the implementation year was not statistically significant. The effect sizes for the added impact of coaching were 0.21 for using explicit instruction, 0.17 for encouraging independent student activity, and 0.03 for differentiating instruction, but these effects may be due to chance.
• There were no statistically significant impacts on measured teacher or student outcomes in the year following the treatment.
The PD Interventions Evaluated
The study team drew on the research on reading instruction as summarized by the National Reading Panel (NRP) (National Institute of Child Health and Human Development; NICHD 2000) and on the PD literature to determine the types of interventions to be evaluated. 2 Several criteria guided the selection of both the models of interest (institute series and coaching) and the specific interventions. We sought PD interventions that:
• Included content on the five components of reading instruction that were identified as “essential” by the National Reading Panel (NICHD 2000): phonemic awareness, phonics, and fluency (“word-level” content) and vocabulary and comprehension (“meaning-level” content);
2 See, for example, Ball 1996; Carpenter et al. 1989; Cohen and Hill 1998; Cohen and Hill 2001; Desimone et al. 2002; Elmore 2002; Garet et al. 2001; Grant, Peterson and Shojgreen-Downer 1996; Hargreaves and Fullan 1992; Kennedy 1998; Knapp 1997; Lieberman 1996; Lieberman and McLaughlin 1992; Little 1993; Loucks-Horsley et al. 1998; McCutchen et al. 2002; Stiles, Loucks-Horsley and Hewson 1996; Talbert and McLaughlin 1993.
xxi
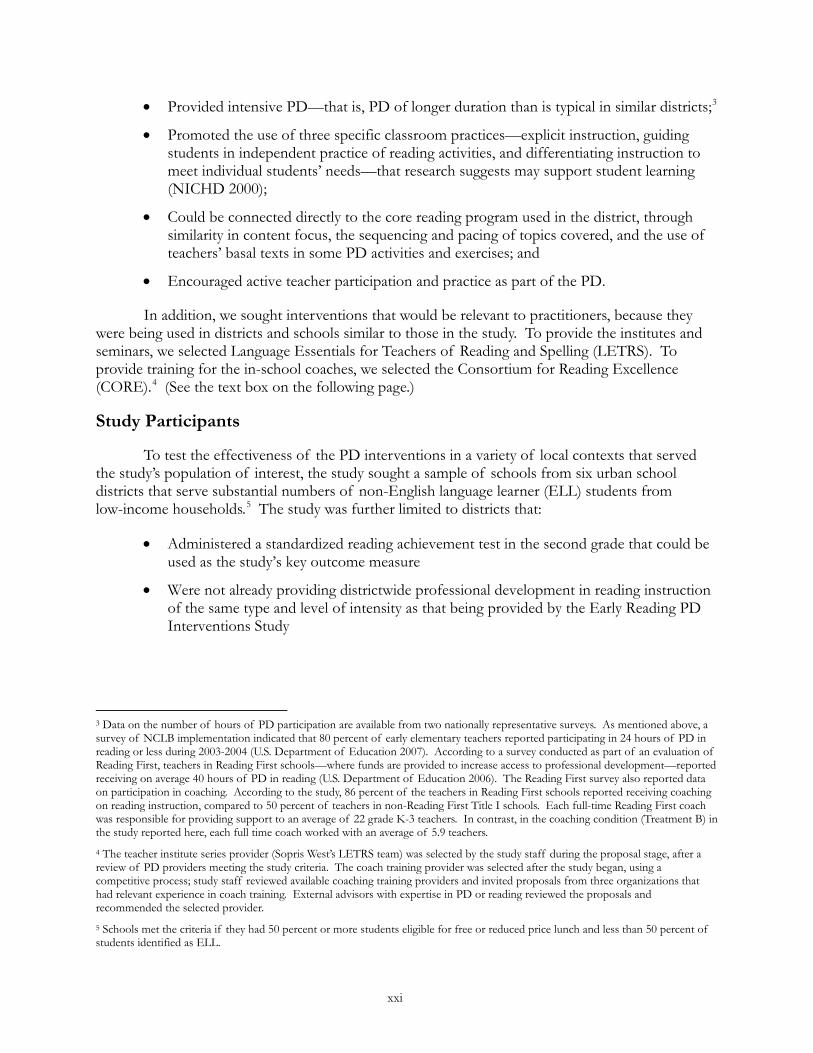
• Provided intensive PD—that is, PD of longer duration than is typical in similar districts;3
• Promoted the use of three specific classroom practices—explicit instruction, guiding students in independent practice of reading activities, and differentiating instruction to meet individual students’ needs—that research suggests may support student learning (NICHD 2000);
• Could be connected directly to the core reading program used in the district, through similarity in content focus, the sequencing and pacing of topics covered, and the use of teachers’ basal texts in some PD activities and exercises; and
• Encouraged active teacher participation and practice as part of the PD.
In addition, we sought interventions that would be relevant to practitioners, because they were being used in districts and schools similar to those in the study. To provide the institutes and seminars, we selected Language Essentials for Teachers of Reading and Spelling (LETRS). To provide training for the in-school coaches, we selected the Consortium for Reading Excellence (CORE).4 (See the text box on the following page.)
Study Participants
To test the effectiveness of the PD interventions in a variety of local contexts that served the study’s population of interest, the study sought a sample of schools from six urban school districts that serve substantial numbers of non-English language learner (ELL) students from low-income households.5 The study was further limited to districts that:
• Administered a standardized reading achievement test in the second grade that could be used as the study’s key outcome measure
• Were not already providing districtwide professional development in reading instruction of the same type and level of intensity as that being provided by the Early Reading PD Interventions Study
3 Data on the number of hours of PD participation are available from two nationally representative surveys. As mentioned above, a survey of NCLB implementation indicated that 80 percent of early elementary teachers reported participating in 24 hours of PD in reading or less during 2003-2004 (U.S. Department of Education 2007). According to a survey conducted as part of an evaluation of Reading First, teachers in Reading First schools—where funds are provided to increase access to professional development—reported receiving on average 40 hours of PD in reading (U.S. Department of Education 2006). The Reading First survey also reported data on participation in coaching. According to the study, 86 percent of the teachers in Reading First schools reported receiving coaching on reading instruction, compared to 50 percent of teachers in non-Reading First Title I schools. Each full-time Reading First coach was responsible for providing support to an average of 22 grade K-3 teachers. In contrast, in the coaching condition (Treatment B) in the study reported here, each full time coach worked with an average of 5.9 teachers. 4 The teacher institute series provider (Sopris West’s LETRS team) was selected by the study staff during the proposal stage, after a review of PD providers meeting the study criteria. The coach training provider was selected after the study began, using a competitive process; study staff reviewed available coaching training providers and invited proposals from three organizations that had relevant experience in coach training. External advisors with expertise in PD or reading reviewed the proposals and recommended the selected provider. 5 Schools met the criteria if they had 50 percent or more students eligible for free or reduced price lunch and less than 50 percent of students identified as ELL.

xxii
• Were using one of the two scientifically based reading series targeted by the study as the core second grade reading program, and had been using the program for at least one year prior to the study.6
Summary of the PD Interventions Evaluated
Teacher Institute and Seminar Series (Treatment A)
Treatment A involved eight content-focused institute and seminar days, implemented during summer 2005 and the 2005–2006 school year. The teacher institute and seminar series was based on Language Essentials for Teachers of Reading and Spelling (LETRS), a professional development curriculum developed by Louisa Moats (2005) and modified for the purposes of the study. LETRS consists of topic-based modules that align with the NRP’s essential components of reading instruction. The LETRS developer and lead facilitator, with oversight from the study’s intervention team, designed the eight institute and seminar days (48 hours of PD) to focus on topics relevant to second grade reading instruction, relying primarily on the module contents and accompanying trainer materials. The topics of the eight institute and seminar days were: (1) the challenge of learning to read; (2) phoneme awareness; (3) spellography/phonics; (4) fluency and analyzing student work samples; (5) vocabulary; (6) review of phonemic awareness, phonics, analyzing student work samples, and an introduction to differentiated instruction; (7) reading comprehension; and (8) review of vocabulary, reading comprehension, analyzing student work samples, and differentiated instruction.
Added In-School Coaching (Treatment B)
In addition to the institute and seminar days, treatment B provided a half-time coach in each participating school to work with second grade teachers (an average of three teachers per school). The study’s coaching model was designed to increase teachers’ understanding of the content learned in the institute series and to provide ongoing practice and support for applying their new knowledge and implementing their core reading program effectively. It was expected that teachers would receive, on average, 60 hours of coaching during the school year.
Coaches received three types of training to prepare them for their roles and responsibilities. First, the study coaches attended all LETRS institute and seminar days with their assigned school(s) to become familiar with the content. In addition, AIR contracted with the Consortium on Reading Excellence (CORE) to deliver a three-day coaching institute and four on-site follow-up trainings in the coaches’ schools during the implementation year that focused on the coach’s role in implementing effective reading instruction in the classroom; coaching individual teachers using a multi-step cycle; drawing on assessment data to identify and address student needs; and organizing grade level teacher meetings to build teachers’ capacity to examine student work and plan instruction.
6 The study focused on schools that used one of two core reading programs to ensure compatibility between the content of the PD and the instructional context in which the content would be applied and to minimize variability in the reading curriculum while still providing a test of the PD in multiple settings. The two reading programs were selected based on their fit with the planned PD and input from a panel of reading and PD experts. The Early Reading PD Interventions Study is a study of the impact of the specific PD interventions used; it is not designed to test the effectiveness of the reading programs used in the participating districts.

xxiii
Six eligible districts agreed to participate, located in urban or urban fringe areas across four eastern and mid-western states. Each district provided six to 24 study schools, producing a total sample size of 90 schools, which met the study’s recruitment target. Table E-1 shows that in comparison to the average urban/urban fringe school, the study schools had a significantly higher percentage of students eligible for free or reduced-price lunch, a significantly higher percentage of African American students, and a significantly lower percentage of White and Hispanic students. Study schools had an average of three second grade teachers and 61 second grade students in regular classrooms. (Self-contained special education classes were excluded.) This resulted in an analysis sample in the 90 schools of 270 teachers and about 5,500 students for the spring of the treatment year (table E-2), 250 teachers for fall of the follow-up year, and 254 teachers and 4,614 students for spring of the follow-up year.
Table E-1. Characteristics of Study Schools and Average Urban or Urban Fringe U.S. Elementary Schools, 2005–2006
Characteristics Average Urban/Urban
Fringe U.S. School Average Study
School Number of Students Per Teacher 16.6 16.0* Number of Students Per School 527.6 460.2* Percentage of Students Eligible for Free or Reduced Price Lunch
48.6 78.3*
Student Race/Ethnicity (percent) White 45.3 14.8* African American 22.2 78.4* Hispanic 25.3 4.6* Asian 6.3 1.8* Native American 0.8 0.4 Number of Schools 24,275 90 SOURCE: 2005–2006 Common Core of Data.
NOTES: The national sample of schools upon which these statistics are based was drawn from the CCD. The sample was restricted to districts characterized in the CCD as regular districts in the 50 states and District of Columbia serving Large City, Mid-Size City, and Urban Fringe of Large City locales. The sample of schools from these districts was restricted to schools characterized in the CCD as regular (school type) primary (school level) schools serving more than 12 second grade students.
Ns for all study school statistics were 90. Ns for average urban/urban fringe U.S. schools were 24,275 except for students per teacher (N = 24,177) and students eligible for free or reduced price lunch (N = 24,181).
*Indicates a statistically significant difference between national and study sample means (p < .05).
Table E–2. Number of Schools, Teachers, and Students in Spring 2006 Sample, Overall and by Group
Number of Second Grade Teachers Number of Second Grade Students Treatment
Status Number of
Schools Total Number Average Per
School Total Number Average Per
School Treatment A 30 93 3.1 1,983 66.1 Treatment B 30 88 2.9 1,738 57.9 Control 30 89 2.9 1,809 60.3
Total 90 270 3.0 5,530 61.4
SOURCE: Early Reading PD Interventions Study Teacher Rosters and District Enrollment Records.

xxiv
Study Design
The 90 study schools were randomly assigned in spring 2005 so that equal numbers within each district received treatment A (the institutes), treatment B (the institutes plus coaching), and no treatment (the district’s “business as usual” PD). A variety of data were collected from the teachers and students in these schools, primarily in the fall and spring of the implementation year (2005-06) and the fall and spring of the follow-up year (2006-07). Based on these data, several outcome measures were constructed:
• Teachers’ knowledge about reading instruction. The study team administered a Reading Content and Practices Survey (RCPS) to all treatment and control teachers in fall and spring of the implementation year and the spring of the follow-up year.7 Although the overall knowledge score is the main measure for this outcome, we also computed two subscores—a word-level subscore, measuring teachers’ knowledge of word-level components of reading instruction (phonemic awareness, phonics, and fluency), and a meaning-level subscore, measuring teachers’ knowledge of meaning-level components of reading instruction (vocabulary and reading comprehension). The two subscores were included to permit exploration of possible differences in the impact of the PD on the domains of knowledge it addressed.8 The teacher knowledge measures were standardized based on the control group mean and standard deviation so that impacts can be displayed as effect sizes. The first administration of the RCPS (prior to delivery of the PD) was used as a baseline measure of teacher knowledge.
• Teachers’ use of research-based instructional practices. Trained observers visited all second grade classrooms in study schools in the fall and spring of the implementation year and in the fall of the follow-up year, tallying activities that occurred during each three-minute interval over a full period of reading instruction. Outcome measures derived from the observations of reading instruction included scores for explicit teaching methods, independent student activity (i.e., guided student practice), and differentiation of instruction to address students’ diverse needs, three areas of teachers’ practice that the PD was intended to affect. 9 Again, so that the impacts can be displayed as effect sizes, each classroom instruction measure was standardized based on the control group mean and standard deviation.
• Students’ reading achievement. Students’ reading achievement was the primary outcome for the study. The key measure was the standardized average reading score, obtained from the district assessments. Because the tests used in the six study districts
7 The outcomes of the teacher knowledge assessment, like other achievement or aptitude tests, are scaled in logits, which represent the log of the odds of getting correct answers to each test item. 8 The word-level material in the PD curriculum emphasized foundational knowledge underlying “best practices” in phonics and fluency instruction, topics believed to be unfamiliar to most teachers (Moats 2002). The meaning-level material in the curriculum emphasized teaching strategies for building students’ vocabularies and comprehension skills, both of which were built into the lesson structure of the core readers the teachers used. 9 The measures of explicit instruction and independent student activity were scaled in logits, paralleling the scales used for the teacher knowledge outcomes. Logits are commonly used in situations in which the purpose is to measure the proportion of occasions in which an event occurs. Each teacher’s logit score represents the log of the odds of the teacher engaging in explicit instruction or independent student activity during each three-minute observation interval. The differentiated instruction measure was not scaled in logits because the majority of teachers did not engage in differentiated instruction during the classroom observation; logits cannot be calculated for zero occurrences.

xxv
differed, there was no one consistent test metric. Hence the scaled scores reported by the districts were standardized within each district so that they can be compared across districts. 10 Standardizing the achievement scores makes it possible to interpret the impact estimates as effect sizes. It is possible that the PD interventions might not have an impact on average achievement, but the interventions might affect the achievement distribution. For that reason, a secondary, dichotomous measure was constructed. First, the average reading test score in the 2004–2005 school year (latest baseline year) for all second grade students in the study schools within each district was chosen as a cut-point. Each student’s implementation year and follow-up year test scores were compared to this cut-point, and each student was categorized as achieving above or below that cut-point in the implementation year as well as the follow-up year tests. This metric reflects the percentage of students who performed at or above the mean baseline performance level. The analysis based on this measure focused on the impact of the PD treatment on the proportion of students with above average achievement in the study schools.
We also surveyed teachers to gather data on their backgrounds and on the amount and type of PD they participated in during the study years. Study staff obtained information on the implementation of the two interventions by observing the institutes and from logs maintained by coaches that recorded the nature of each coach interaction with each teacher.
The basic analytic strategy for assessing the impacts of the PD interventions was to compare outcomes for schools that were randomly assigned within each district to each of the three study conditions. Because we used data on students, nested within teachers’ classrooms, nested within study schools, three-level multilevel models were used to estimate the impacts of professional development on student reading achievement and two-level models were used for estimating impacts on the teacher measures. The impact model uses the sample of teachers and students present in the study schools as of the spring 2006 (implementation year) and 2007 (follow-up year) data collection periods. The estimates provide an intent-to-treat analysis of the impact of the interventions because they reflect the PD effects on the targeted (or “intended”) sample, whether or not all the teachers in the treatment schools participated fully in the PD provided.
A summary of the study sample and design is provided in the following text box.
10 The standardized scores were calculated by subtracting the second grade student reading test average for the district’s study schools in 2004–2005 from each student’s total reading score and then dividing it by the standard deviation for the second grade students in the district’s study schools in 2004–2005.

xxvi
Study Sample and Design Summary
Participants: Six districts, 90 schools, and 270 second grade teachers participated in the study during the year that the PD interventions were implemented. During the follow-up year (which included only data collection), the number of teachers participating was 250 in the fall and 254 in the spring. Participating districts used one of two commonly used scientifically based reading programs. Schools selected for the study were high-poverty urban or urban fringe public elementary schools in which fewer than half the students were designated as English language learners (ELL). Schools were screened out if they were already receiving Reading First funding (and therefore might already be participating in intensive PD) or if they planned to receive this funding during the first year of the study.
Research Design: Within each district, schools were randomly assigned in equal numbers to treatment A, treatment B, or the control group. Each group therefore consisted of 30 schools and 88 to 93 teachers during the implementation year or 81 to 85 teachers during the follow-up year. School-level student achievement data were collected from district records for student cohorts from the two years prior to the study as pretest data, and teachers took a teacher knowledge pretest before participating in any study PD. Outcomes data collected consisted of student achievement scores from spring of the implementation and follow-up years, obtained from district records; teacher knowledge scores from posttests administered in spring of the implementation and follow-up years; and classroom observations conducted during fall and spring of the implementation year and during fall of the follow-up year. These data were collected from all three study groups. Because students were clustered within classrooms and classrooms were clustered within schools, effects for the study were estimated using hierarchical linear models.
Outcomes: The study examined impacts on three sets of outcomes: teachers’ knowledge of reading instruction, based on data from the Reading Content and Practices Survey (RCPS); teachers’ reading instructional practices, based on observations by trained observers; and student reading test scores, collected from district records. Study Findings
Implementation
On average:
• 93 percent (45 of 48 hours) of the planned institute and seminar hours were delivered in the districts.
• Treatment group A and B teachers attended 35 of the 45 implemented hours of study-provided PD (78 percent), according to institute and seminar attendance records.
• Teachers in treatment A and B reported receiving significantly more hours of reading-related institutes and seminars during the implementation year—including both study-provided PD and PD not related to the study—than did teachers in control schools (39 hours and 47 hours compared with 13 hours).

xxvii
• Coach logs indicate that teachers in treatment B schools received an average of 62 hours of coaching over the course of the year, consistent with the guidelines provided in the coach training (approximately 2 hours per teacher per week over about 30 weeks). Almost 80 percent of the coaching hours (49 of 62 hours) were spent on topics that were a focus of the study’s PD.11
• Teachers in the treatment B schools reported participating in significantly more coaching in reading instruction during the implementation year (71 hours) than did teachers in treatment A (4 hours) or control (6 hours) schools.
Effects of the PD Interventions During the Implementation Year
Teachers’ Knowledge of Early Reading Content and Instruction
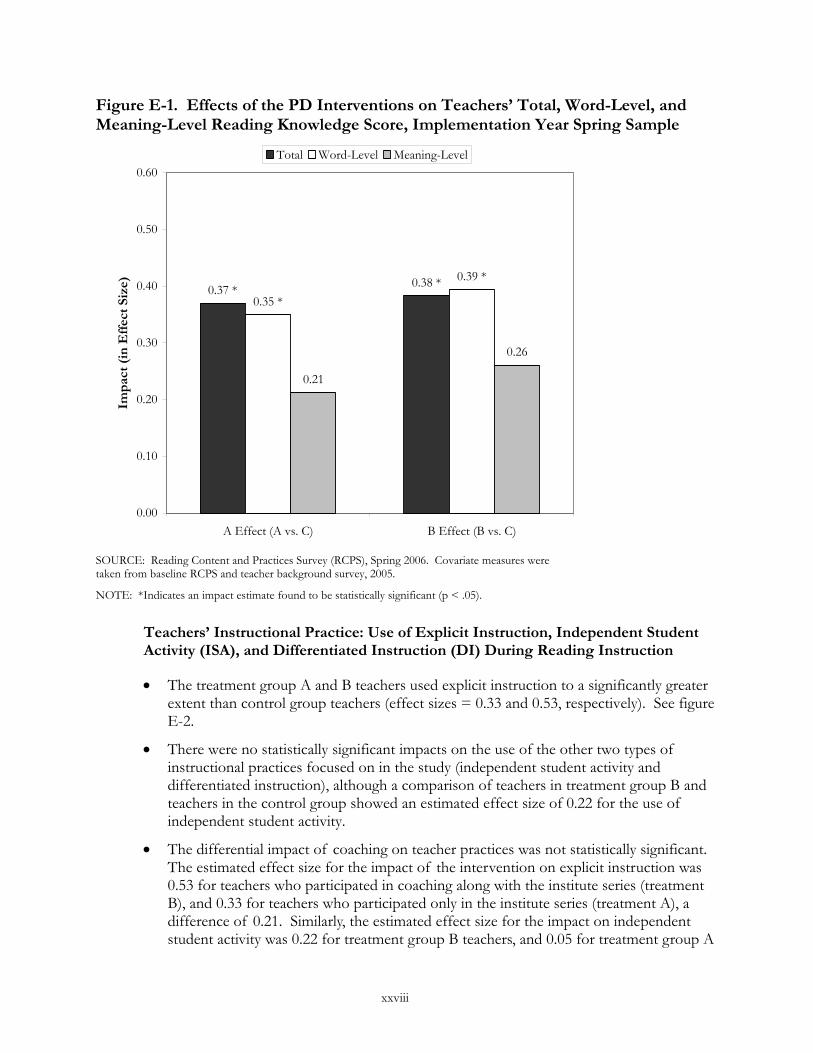
• Teachers who were assigned to the institute series only group (treatment A) or the institute series plus coaching group (treatment B) scored significantly higher on the overall teacher knowledge total score, in comparison with the control group teachers (effect sizes = 0.37 and 0.38, respectively; see figure E-1). In addition, treatment group A and B teachers scored significantly higher than control group teachers on the word-level subscale (effect sizes = 0.35 and 0.39, respectively). The estimated effects were not statistically significant for the meaning-level subscale (effect sizes = 0.21 for treatment A and 0.26 for treatment B), although they were positive.
• The institute series was designed to nurture teacher knowledge, whereas the coaching was designed to help teachers translate this knowledge into practice. Therefore, coaching was not expected to have an impact on teacher knowledge. The additional PD delivered through coaching (tested by comparing treatment B with treatment A) did not produce a statistically significant added effect on overall teacher knowledge or either of the teacher knowledge subscales (effect sizes for the difference in impacts between treatments B and A were 0.01 on the total score, 0.04 on the word-level subscale, and 0.05 on the meaning-level subscale).
11 It should be noted that the treatment B teachers reported an average of 71 hours of coaching rather than the 62 reported by the study coaches; however, the teacher survey item this estimate is based on did not limit teachers’ responses to only the study-provided coaching. Therefore, teacher estimates may also include coaching and mentoring from other sources.
xxviii
Figure E-1. Effects of the PD Interventions on Teachers’ Total, Word-Level, and Meaning-Level Reading Knowledge Score, Implementation Year Spring Sample
0.37 * 0.38 *0.35 *
0.39 *
0.21
0.26
0.00
0.10
0.20
0.30
0.40
0.50
0.60
A Effect (A vs. C) B Effect (B vs. C)
Imp
act
(in
Eff
ect
Size
)
Total Word-Level Meaning-Level
SOURCE: Reading Content and Practices Survey (RCPS), Spring 2006. Covariate measures were taken from baseline RCPS and teacher background survey, 2005.
NOTE: *Indicates an impact estimate found to be statistically significant (p < .05).
Teachers’ Instructional Practice: Use of Explicit Instruction, Independent Student Activity (ISA), and Differentiated Instruction (DI) During Reading Instruction
• The treatment group A and B teachers used explicit instruction to a significantly greater extent than control group teachers (effect sizes = 0.33 and 0.53, respectively). See figure E-2.
• There were no statistically significant impacts on the use of the other two types of instructional practices focused on in the study (independent student activity and differentiated instruction), although a comparison of teachers in treatment group B and teachers in the control group showed an estimated effect size of 0.22 for the use of independent student activity.
• The differential impact of coaching on teacher practices was not statistically significant. The estimated effect size for the impact of the intervention on explicit instruction was 0.53 for teachers who participated in coaching along with the institute series (treatment B), and 0.33 for teachers who participated only in the institute series (treatment A), a difference of 0.21. Similarly, the estimated effect size for the impact on independent student activity was 0.22 for treatment group B teachers, and 0.05 for treatment group A

xxix
teachers, a difference of 0.17. The estimated effect sizes for differentiated instruction, however, were negative for both treatment A and treatment B (-0.05 and -0.02, respectively) with a difference of 0.03. None of these differences between treatment A and treatment B were statistically significant.
Figure E-2. Effects of the PD Interventions on Teachers’ Use of Explicit Instruction, Independent Student Activity (ISA), and Differentiated Instruction (DI), Implementation Year Spring Sample
0.33 *
0.53 *
0.05
0.22
-0.05-0.02
-0.10
0.00
0.10
0.20
0.30
0.40
0.50
0.60
A Effect (A vs. C) B Effect (B vs. C)
Imp
act
(in
Eff
ect
Size
)
Explicit ISA DI
SOURCE: Early Reading PD Interventions Study Classroom Observations, Spring 2006. Covariate measures were taken from baseline RCPS and teacher background survey, 2005.
NOTE: *Indicates an impact estimate found to be statistically significant (p < .05).
Students’ Reading Achievement
• The improvement in teacher knowledge and the increased explicitness of teachers’ instruction caused by the PD intervention did not translate into improvements in student reading achievement as measured by standardized tests given by each district. Neither the institute series alone (treatment A) nor the combination of institutes, seminars, and coaching (treatment B) produced a statistically significant impact on the main outcome measure: standardized student reading test scores (effect sizes = 0.08 and 0.03, respectively; see figure E-3). Nor was there a statistically significant effect on the percent of students scoring at or above the overall baseline mean reading score (3.48 and -2.35 percent, respectively).

xxx
Figure E-3. Effects of the PD Interventions on Standardized Student Total Reading Test Scores, Implementation Year Spring Sample
0.080.03
0.00
0.10
0.20
0.30
0.40
0.50
0.60
A Effect (A vs. C) B Effect (B vs. C)
Imp
act
(in
Eff
ect
Size
)
SOURCE: Student records from each individual school district for 2003–2004 and 2004–2005 school years.
NOTE: There were no significant impacts on this outcome (all p’s > .05).
Effects of the PD Interventions During the Follow-Up Year
• The year after the PD was concluded, there was no statistically significant effect of either the institute series alone (treatment A) or the institute series plus coaching (treatment B) on teacher’s knowledge of reading content (figure E-4) or their use of the instructional practices encouraged by the study PD (figure E-5). With one exception (see below), the difference in teacher impacts between the implementation year and the follow-up year was not statistically significant; thus, we cannot conclude with confidence that any positive impacts during the implementation year declined over time.
• The estimated effect of treatment B on the use of explicit instruction was lower by a statistically significant margin in the fall of the follow-up year (-0.03) than in the implementation year (0.53; figure E-5).

xxxi
Figure E-4. Impact of the PD on Teacher Knowledge Total Score, Word-Level Score, and Meaning-Level Score: Implementation vs. Follow-Up Year
Teacher Knowledge
SOURCE: Reading Content and Practices Survey (RCPS), Spring 2006 and 2007; covariate measures were taken from baseline RCPS and teacher background survey, 2005 and 2006.
NOTES: Covariate measures were taken from baseline RCPS and teacher background survey, 2005 and 2006.
*Indicates an impact estimate found to be statistically significant (p < .05).
There were no statistically significant implementation year vs. follow-up year comparisons (all p’s > .05).

xxxii
Figure E-5. Impact of the PD on Explicit Instruction, Independent Student Activity, and Differentiated Instruction: Implementation vs. Follow-Up Year
Teacher Practices
SOURCE: Early Reading PD Interventions Study Classroom Observations, Spring and Fall 2006; Covariate measures were taken from baseline RCPS and teacher background survey, 2005 and 2006.
NOTES: *Indicates an impact estimate found to be statistically significant (p < .05).
+Indicates a statistically significant implementation year vs. follow-up year comparison (p < .05).
• Neither treatment had statistically significant impacts on student achievement in the
follow-up year (figures E-6 and E-7).
• There were no statistically significant differences between the follow-up and implementation year impacts for either the standardized student test score (figure E-6) or the dichotomous outcome (figure E-7).

xxxiii
Figure E–6. Impact of the PD on Standardized Student Total Reading Scores: Implementation vs. Follow-Up Year
Reading Score
SOURCE: Student records from each individual school district for 2003–2004, 2004–2005, and 2006–2007 school years.
NOTE: There were no statistically significant impacts or implementation year vs. follow-up year comparisons (all p’s > .05).
Figure E-7. Impact of the PD on Student Dichotomous Outcome: Implementation vs. Follow-Up Year
Dichotomous Outcome
SOURCE: Student records from each individual school district for 2003–2004, 2004–2005, and 2006–2007 school years.
NOTE: There were no statistically significant impacts or implementation year vs. follow-up year comparisons (all p’s > .05).


1
CHAPTER 1
INTRODUCTION
Professional development (PD) of teachers is viewed as a vital tool in school improvement efforts (Hill 2007). The importance of professional development (PD) for teachers is underscored in several major federal education initiatives, including the No Child Left Behind (NCLB) statute. For example, Title II of NCLB provided $585 million to states and districts for PD activities during the 2002-2003 school year alone in order to meet the goal of having a highly qualified teacher in every classroom (U.S. Department of Education 2005). Two years later, Title II funding for PD remained at over $500 million (U.S. Department of Education 2007).
Are teachers receiving the PD that they need? A recent national study of state and local NCLB implementation indicated that 80 percent of elementary teachers reported participating in 24 hours of PD or less on reading instruction during the 2003–2004 school year and summer (U.S. Department of Education 2007). Reading and PD experts have raised a concern that this level of PD is not intensive enough to be effective, and that it does not focus enough on subject-matter knowledge (Cohen and Hill 2001; Fletcher and Lyon 1998; Foorman and Moats 2004; Garet, Porter, Desimone, Birman, and Yoon 2001).
To help states and districts make informed decisions about the PD in reading instruction they implement, the U.S. Department of Education’s Institute of Education Sciences initiated the Early Reading PD Interventions Study. The Early Reading PD Interventions Study is a large-scale randomized field trial designed to test the effectiveness of two promising research-based PD interventions for improving the in-service knowledge and practice of teachers and the reading achievement of their students. Specifically, we focused on second grade reading instruction, and we sought to test the effectiveness of the two PD interventions in urban, high poverty settings.12 The two PD interventions tested were:
• an eight-day series of content-based in-service institutes and seminars focusing on second grade reading instruction, based on Language Essentials for Teachers of Reading and Spelling (LETRS; treatment A); and
• the institute and seminar series plus intensive in-school coaching with coach training provided by the Consortium on Reading Excellence (CORE; treatment B).
These PD interventions were selected to align with best practices identified in the research literature. The remainder of this chapter provides a summary of the research on promising features of PD and early reading instruction, followed by details on the selection criteria for the two PD interventions evaluated in the study. Next, we provide a description of the theory of action through which these interventions are hypothesized to affect teacher and student outcomes. Finally, we provide an overview of the study’s design, outcome measures, and research questions, and outline the remaining chapters of the report.
12 The study focuses on second grade because the student outcome of interest is performance on standardized reading assessments; second grade is the lowest grade at which an appreciable number of districts administer these assessments. The study focused on high poverty settings with the goal of producing results that would inform initiatives that target high poverty populations.

2
Research on PD and Early Reading Instruction
What is Known about Promising PD Strategies
Currently, there is little strong evidence to guide either practitioners or researchers in selecting promising PD interventions. Over the past decade, hundreds of studies have addressed the topic of teacher learning and PD (for reviews, see Borko 2004; Clewell, Campbell, and Perlman 2004; Kennedy 1998; Richardson and Placier 2001; Supovitz 2001; Yoon, Duncan, Lee, Scarloss, B., and Shapley 2007).13 Nine of these studies had the types of rigorous designs—randomized control trials (RCTs) or quasi-experimental designs (QEDs)—that allow causal inferences to be made about the effectiveness of various PD strategies, and six have addressed PD’s effect on reading or English Language Arts (ELA) achievement (Yoon et al. 2007).
Of the six studies included in the Yoon et al. review that examined the impact of PD interventions in early reading or ELA, three showed positive and statistically significant impacts on achievement.14 There was insufficient variation in the features of the PD interventions tested in these six studies, however, to draw conclusions about the characteristics of the PD interventions that were effective. For example, all PD interventions in the studies were delivered in the form of workshop or summer institute by the author(s) or their affiliated researchers, along with some form of follow-up support.15
Four of the six studies Yoon et al. reviewed focused on reading/ELA content or reading/ELA-related pedagogy, while the remaining two tested general pedagogical interventions, but the studies were too limited in their sample sizes to determine whether a specific focus on reading/ELA content or a focus on general pedagogy was more effective. The studies did suggest that the duration or “dosage” of PD may be related to its effectiveness, however. The hours of PD provided ranged from 10 to 100 hours. The two studies that provided the least intensive PD (10 to 14 hours) did not find statistically significant impacts of the PD on students’ reading achievement (Duffy et al. 1986; Tienken 2003), whereas three of the four studies that provided 30 to 100 hours of PD did find statistically significant impacts (Cole 1992; McCutchen et al. 2002; McGill-Franzen et al. 1999).
The less rigorous PD literature, based on correlational and descriptive studies of PD, was another source for identifying potentially promising features of PD. According to this literature (see Desimone et al. 2002; Garet et al. 2001; Yoon, Garet, and Birman 2007), in addition to duration, several other features of PD may hold promise for improving teacher and student outcomes. First, a focus on content–-that is, the subject to be taught and how students learn the content—may be most promising for changing teacher practice and student outcomes (Carpenter et al. 1989; Cohen and Hill 2001; Garet et al. 2001; Kennedy 1998; McCutchen et al. 2002). Other promising features include (1) the extent to which teachers have opportunities for active practice (Garet et al. 2001;
13 For example, Yoon et al. alone identified 1,343 studies of PD. 14 Five studies total showed positive estimated effect sizes; three of these studies had effect sizes that were statistically significant. The effect sizes reported for the five studies were: 0.82 for reading and 0.24 for language (Cole 1992); 0.00 for reading (Duffey et al. 1986); 0.39 for reading (McCutchen et al. 2002); a range from 0.32 to 1.11 for tests of specific reading skills (McGill-Franzen et al. 1999); and 0.68 for reading (Sloan 1993); and 0.41 in narrative writing (Tienken 2003). 15 In addition, the six studies involved a limited number of teachers, ranging from 5 to 44, and clustered within 1 to 40 schools. In general, these might be viewed as efficacy trials, testing the impact of the PD interventions in small, controlled settings, in contrast to effectiveness trials, like the current study, which test interventions on a larger scale, in more varied settings.

3
Lieberman 1996; Loucks-Horsley et al. 1998); (2) the degree to which the PD is coherent or aligned with other interventions going on in the teachers’ schools and districts (Cohen and Hill 1998; Garet et al. 2001; Grant, Peterson and Shojgreen-Downer 1996; Lieberman and McLaughlin 1992); (3) the extent to which the PD is embedded in or linked to teachers’ daily work (Garet et al. 2001; Hargreaves and Fullan 1992; Little 1993; Stiles, Loucks-Horsley and Hewson 1996); and (4) the degree to which the PD provides teachers the opportunity to participate with colleagues at the same school or grade level to reinforce what is learned (Ball 1996; Elmore 2002; Knapp 1997; Talbert and McLaughlin 1993). It should be emphasized that the research base related to these features of effective PD is quite limited, and thus the choice of the features included in the treatments tested in this study is in part speculative.16
What is Known about the Content Focus for PD in Early Reading
The literature on PD suggests that a focus on the subject to be taught and how students learn the content is a central feature of high quality PD. The National Reading Panel’s report (NICHD 2000) not only emphasized the importance of developing teachers’ content knowledge but identified the five components of reading instructions that research found to improve teachers’ reading instruction and students’ reading achievement.17 The five “essential” components of reading instruction identified by the panel included:
• Phonemic awareness (the ability to recognize and distinguish the speech sounds of English)
• Phonics (an understanding of letter-sound correspondences)
• Fluency (the efficient decoding of words and connected text)
• Vocabulary (an understanding of the meaning of words and meaningful subunits of words)
• Comprehension (an understanding of the meaning of sentences, paragraphs, and longer passages)
The work of the NRP indicates that explicit systematic instruction and guided practice in phonemic awareness and phonics build a foundation for growth in fluency, which in turn supports the development of vocabulary and comprehension, the ultimate goal of reading instruction.18 The NRP indicates that teachers require the capacity to identify students’ level of development in each of the five components of reading instruction, and to focus appropriate instruction on these components.
16 The evidence for specific features draws primarily on research syntheses (Kennedy 1998; Yoon et al. 2007) and two correlational studies (Cohen and Hill 2001; Garet et al. 2001). See appendix A for more details on the best practices research base. 17 The NRP panel’s recommendations were based on meta-analyses of experimental or quasi-experimental studies meeting their standards (see report for full selection criteria). The recommendations were also informed by public testimony from 125 individuals or organizations representing the ultimate users and beneficiaries of the Panel’s findings. 18 The number of studies included in the NRP meta-analysis for each component of reading instruction was: 52 phonemic awareness studies; 38 phonics studies; 16 guided fluency studies; 50 vocabulary studies; and 205 reading comprehension studies.

4
Overview of the Early Reading PD Interventions Study Interventions
Selection
Consistent with the research summarized above, we sought PD interventions that met the following criteria:
• Included content on the five components of reading instruction that were identified as “essential” by the National Reading Panel (NICHD 2000): phonemic awareness, phonics, and fluency (“word-level” content) and vocabulary and comprehension (“meaning-level” content);
• Was intensive, providing PD of longer duration than is typical in similar districts19;
• Promoted the use of specific classroom practices related to the five components of reading instruction, including explicit instruction, helping students work on reading activities independently, and differentiating instruction to meet individual students’ needs;
• Could be connected directly to the core reading program used in the district, through similarity in content focus, the sequencing and pacing of topics covered, and the use of teachers’ basal texts in some PD activities and exercises; and
• Encouraged active teacher participation and practice as part of the PD.
In addition, we sought interventions that would be relevant to practitioners, because they were currently being used in other high poverty districts and schools.
After reviewing PD interventions that embodied these key features, and for which there existed well-specified “off the shelf ” interventions easily adaptable for use in the study, project staff, in consultation with external advisors with expertise in early reading and PD, decided to test the impact of two different PD interventions that shared the same content focus but differed in the form in which some of the PD was delivered, with one intervention focusing on PD delivered in traditional institute form (institutes and follow-up seminars), and the other intervention adding in-school coaching, a type of PD embedded in teachers’ work in the classroom. The decision to examine two interventions made it possible to test whether teachers are able to translate what they learn in institutes and seminars into practice without additional support, and also to test the incremental impact of coaching, which has become a popular PD approach, but for which there is no rigorous evidence of effectiveness (Taylor 2007). These two interventions became the experimental conditions of the Early Reading PD Interventions Study referred to as treatment A and treatment B. A third condition, “business as usual,” served as the control and represented
19 For example, in a national study of local and state implementation of No Child Left Behind (NCLB), 80 percent of grade K-3 teachers reported participating in 24 hours of PD in reading or less, on average, during 2003-2004 (U.S. Department of Education 2007). In addition, teachers in Reading First schools—where funds are provided to increase access to professional development—reported receiving on average 40 hours of PD in reading (U.S. Department of Education 2006). These teachers were also more likely to report receiving coaching on reading instruction in comparison to the non-Reading First Title I schools (86 percent compared to 50 percent), although the coaching was not intensive; each full-time Reading First coach was responsible for providing support to an average of 22 grade K-3 teachers.

5
whatever PD was provided in the district. The two interventions selected are described in more detail below.20
Teacher Institute Series (Treatment A)
Treatment A was comprised of eight content-focused institute and follow-up seminar days, implemented during summer of 2005 and the 2005–2006 school year. The plan called for a total of 48 hours of PD.21 The teacher institute and seminar series was based on a subset of the Language Essentials for Teachers of Reading and Spelling (LETRS) modules by Louisa Moats (2005) and modified for the purposes of the study. LETRS consists of topic-based modules designed to align with the NRP’s essential components of reading instruction.22 The LETRS developer and lead facilitator, with support from the study’s intervention team, designed the eight institute and seminar days to focus on topics most relevant to second grade reading instruction, relying primarily on the LETRS module content and accompanying trainer materials. 23,24 Further, the training supplemented the LETRS module content with activities that: (1) had teachers practice and apply the content using their own reading program, (2) trained teachers on how to use what they learned in the LETRS modules to analyze their students’ own work, and (3) helped teachers develop strategies for differentiating instruction based on their diagnosis of students’ reading difficulties.
Teacher Institute Series Plus In-School Coaching (Treatment B)
Treatment B provided a half-time coach in each participating school to work with second grade teachers, in addition to the same institute series provided to treatment group A teachers. The number of hours of coaching planned was approximately 2 hours per week per teacher, on average, for a total of 60 hours for a 30 week academic year. Coaches were trained not to expect to spend two hours per week with every teacher; they were instructed in how to use their professional judgment in deciding which teachers needed more or less coaching.
Coaches were current or former school district staff. They were assigned half-time to the second grade teachers (on average three) in each treatment B school. Coaches received three types of training to prepare them for their roles and responsibilities. First, the study coaches attended all institute and seminar days with their assigned school(s) to become familiar with the content. In
20 More details on the interventions tested are also included in sections II and III of appendix A. 21 Each institute and seminar day included 6 hours of PD, exclusive of breaks. The events lasted from approximately 7 to 7.5 hours per day total. 22 The teacher institute series provider (Sopris West’s LETRS team) was selected by the study staff during the proposal stage, after a review of PD providers meeting the study criteria. There are 12 LETRS modules in all. The study PD used the first six modules. We did not use all modules because each requires nearly a full day of PD, and providing 12 full days of PD was outside the scope of the study. 23 The project staff were divided into two teams: the evaluation team, which was responsible for the study design, data collection, analysis, and reporting; and the intervention team, which was responsible for the selection of the PD providers, as well as the logistics involved in providing the PD (e.g., facilities and scheduling), and monitoring the delivery of the institutes, seminars, coach hiring, and training. The evaluation team maintained independence from the intervention providers throughout the study, with the exception of asking for their input on the outcomes that their PD could be expected to affect. 24 The term “institute” was used to describe a day that was focused primarily on delivering content for the first time. The term “seminar” was used to describe a day that usually focused on reviewing content from past institutes and discussing the application of the content since it was introduced. As implemented, all institute days briefly reviewed content from previous days, and seminars introduced some amount of new content.

6
addition, AIR contracted with the Consortium on Reading Excellence (CORE) to deliver a three-day coaching institute and four on-site follow-up trainings in the coaches’ schools.25
The PD Impact coaching intervention was designed to provide teachers with ongoing practice and support for applying their new knowledge and implementing their core reading program effectively. To make the connections between the content of the teacher institute series and the focus of coaching, LETRS trainers worked with CORE trainers to develop a crosswalk between teacher institute and seminar activities and the core reading program instructional routines. Coaches were provided with these crosswalks as part of their training. In addition, the teacher and coach trainers attended both types of PD to ensure congruency between the two interventions.
Overview of the Study’s Evaluation Design
The Theory of Action Guiding the Study Design
Based on the available research evidence, we developed a theory of action describing the relationship between features and outcomes of PD.26 According to this theory of action, participation in PD like the study’s institute series is expected to strengthen teachers’ knowledge of the content they teach and how children learn this content. This knowledge, which the study coaching was designed to help teachers implement, is expected to support teachers in changing their classroom teaching practice, which ultimately will improve student achievement outcomes.27 The research questions we sought to address in this study were based on the hypothesized relationships between PD and both teacher and student outcomes. These questions are reviewed below.
Questions Addressed by the Early Reading PD Interventions Study
The study was designed to examine the impact of two PD interventions on three domains of outcomes: teachers’ knowledge of reading content and practices, teachers’ research-based instructional practices and, most importantly, the reading achievement of second grade students. In particular, the study addressed three main research questions:
• What effects do institutes with research based content and follow-up seminars (treatment A) have on teachers’ knowledge and instructional practices and on their students’ reading achievement?
• What effects do institutes with research based content and follow-up seminars plus in school coaching (treatment B) have on teachers’ knowledge and instructional practices and on their students’ reading achievement?
25 AIR held an invited competition to select the coach training subcontractor. Proposals were requested from three organizations that had relevant experience in coach training. The proposals were reviewed by three external study advisors with expertise in PD or reading, who recommended that CORE be selected. 26 The Early Reading PD Interventions Study theory of action is described in more detail in appendix A. 27 The institute series was designed to nurture teacher knowledge, whereas the coaching was designed to help teachers translate this knowledge into practice. Therefore, coaching was not expected to have an impact above and beyond the impact of the institute series on teacher knowledge.

7
• What is the added effect of in school coaching (beyond the institute and seminar series) on teachers’ knowledge and instructional practices and on students’ reading achievement?
Exhibit 1-1. Early Reading PD Interventions Study Theory of Action
The first question was addressed by comparing outcomes for the teachers and their students assigned to treatment A with the business as usual control group; the second question was addressed by comparing treatment B with the control group; and the third question was addressed by comparing treatment B with A. We examined the impact of the treatments during the year in which the PD interventions were implemented, to assess the immediate impact of these forms of PD. We also examined the impact in the year following the PD interventions, to examine the degree to which impacts observed during the implementation of the PD interventions were sustained in the absence of ongoing study PD implementation.
Summary of the Study Design
The Early Reading PD Interventions Study design and outcomes are summarized in the box on the next page. More in-depth information on the design and outcome measures is provided in chapter 2.
Content and Organization of This Report
The findings in this report focus primarily on the short-term impacts of the PD interventions during the school year when the interventions were implemented, although impacts for the school year following the delivery of the PD are also presented. The first year of the Early Reading PD Interventions Study included the random assignment of schools to one of the three PD conditions, the implementation of the PD interventions, and the collection of the primary wave of data on teacher and student outcomes. The second year of the study included follow-up data collection only for the purpose of evaluating potential long-term or lagged effects of the PD provided during the first year.
Professional Development
(PD)
Student Achievement
(SA)
Teacher Knowledge
(TK)
Teacher Practice
(TP)

8
Study Design Summary
Participants: Six districts, 90 schools, and 270 second grade teachers participated in the study during the year the PD interventions were implemented. During the follow-up year (which included only data collection), 250 teachers participated in the fall, and 254 teachers participated in the spring. Participating districts used one of two commonly used scientifically based reading programs. Schools selected for the study were high-poverty urban or urban fringe public elementary schools in which fewer than half the students were designated as English Language Learners (ELL).
Research Design: Within each district, schools were randomly assigned in equal numbers to the institute series only (treatment A), the institute series plus coaching (treatment B), or the control group. Each group therefore consisted of 30 schools and 88 to 93 teachers during the implementation year, and 81 to 85 teachers during the follow-up year. School-level student achievement data were collected from district records for student cohorts from the two years prior to the study as pretest data, and teachers took a teacher knowledge pretest before participating in any study PD. Outcome data collected consisted of student achievement scores from spring of the implementation and follow-up years, obtained from district records; teacher knowledge scores from posttests administered in spring of the implementation and follow-up years; and classroom observations conducted during fall and spring of the implementation year and during fall of the follow-up year. These data were collected from all three study groups. Because students were clustered within classrooms and classrooms were clustered within schools, effects for the study were estimated using hierarchical linear models.
Outcomes Analyzed: The study examined impacts on two intermediate outcomes (teachers’ knowledge of reading content and instruction; and teachers’ use of research-based instructional practices in reading) and one primary outcome (student reading test scores).
The remainder of the report includes a description of how the study was conducted
(chapter 2), an analysis of the implementation of the PD interventions (chapter 3), an analysis of the impacts of the PD interventions during the implementation year (chapter 4), and an examination of the lagged effects of the interventions during the year following the delivery of the PD (chapter 5). Finally, chapter 6 provides a discussion of exploratory analyses that supplement the main impact results. Appendices provide additional detail on the PD interventions tested, the study samples, the data collected, and the statistical approaches employed during the study.
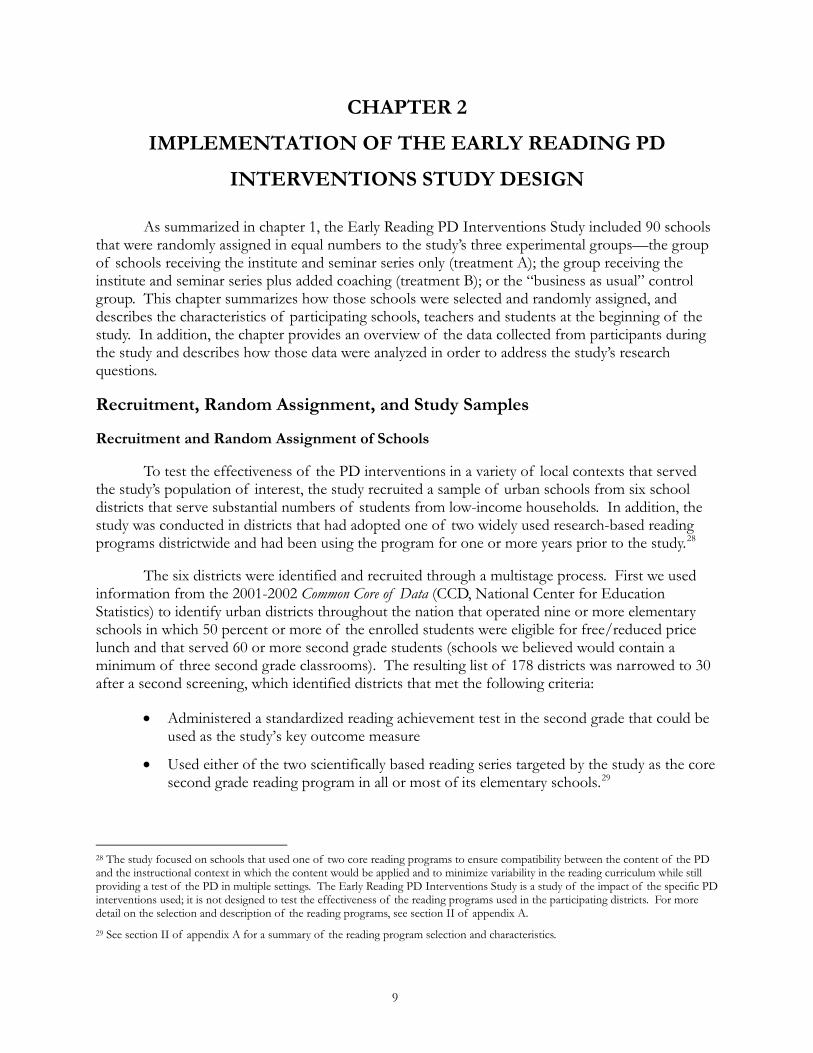
9
CHAPTER 2
IMPLEMENTATION OF THE EARLY READING PD
INTERVENTIONS STUDY DESIGN
As summarized in chapter 1, the Early Reading PD Interventions Study included 90 schools that were randomly assigned in equal numbers to the study’s three experimental groups—the group of schools receiving the institute and seminar series only (treatment A); the group receiving the institute and seminar series plus added coaching (treatment B); or the “business as usual” control group. This chapter summarizes how those schools were selected and randomly assigned, and describes the characteristics of participating schools, teachers and students at the beginning of the study. In addition, the chapter provides an overview of the data collected from participants during the study and describes how those data were analyzed in order to address the study’s research questions.
Recruitment, Random Assignment, and Study Samples
Recruitment and Random Assignment of Schools
To test the effectiveness of the PD interventions in a variety of local contexts that served the study’s population of interest, the study recruited a sample of urban schools from six school districts that serve substantial numbers of students from low-income households. In addition, the study was conducted in districts that had adopted one of two widely used research-based reading programs districtwide and had been using the program for one or more years prior to the study.28
The six districts were identified and recruited through a multistage process. First we used information from the 2001-2002 Common Core of Data (CCD, National Center for Education Statistics) to identify urban districts throughout the nation that operated nine or more elementary schools in which 50 percent or more of the enrolled students were eligible for free/reduced price lunch and that served 60 or more second grade students (schools we believed would contain a minimum of three second grade classrooms). The resulting list of 178 districts was narrowed to 30 after a second screening, which identified districts that met the following criteria:
• Administered a standardized reading achievement test in the second grade that could be used as the study’s key outcome measure
• Used either of the two scientifically based reading series targeted by the study as the core second grade reading program in all or most of its elementary schools.29
28 The study focused on schools that used one of two core reading programs to ensure compatibility between the content of the PD and the instructional context in which the content would be applied and to minimize variability in the reading curriculum while still providing a test of the PD in multiple settings. The Early Reading PD Interventions Study is a study of the impact of the specific PD interventions used; it is not designed to test the effectiveness of the reading programs used in the participating districts. For more detail on the selection and description of the reading programs, see section II of appendix A. 29 See section II of appendix A for a summary of the reading program selection and characteristics.

10
• Did not provide district-wide professional development in reading instruction of the same type and level of intensity as that being provided by the Early Reading PD Interventions Study.30,31
Through direct discussions with officials in these districts and an informational meeting in Washington, D.C., six districts were ultimately recruited to participate in the study. Staff from each district helped us identify and recruit a sample of local schools that were not already involved in special PD provided by the federally funded Reading First program.32 The six study districts were located in urban or urban fringe areas across four eastern and mid-western states. The number of study schools in each district varied from 6 to 24, for a total of 90 schools. Each of the two reading programs targeted by the study had been adopted by three of the districts and was used by all of the study schools in those districts; one program was used in 48 schools, the other in 42 schools.
Table 2-1 illustrates how the 90 study schools compared with a national sample of elementary schools in urban or urban fringe districts during the implementation year of the study. Study schools, on average, had significantly smaller pupil per teacher ratios and student enrollment when compared with the national averages for urban or urban fringe schools. Study schools had a significantly higher percentage of students receiving free or reduced price lunch relative to the average urban or urban fringe school, consistent with the study’s goal of testing the interventions within the context of high poverty schools. The study schools also had a significantly larger percentage of African American students than the average urban or fringe school and a significantly smaller percentage of Hispanic, white, or Asian students.33
In spring 2005, the schools chosen by the districts to participate in the study were randomly assigned to treatment group A, treatment group B, or the control group.34 Table 2-2 summarizes the numbers of participating schools from each district and their assignments by group.
30 Districts that provided professional development in reading instruction that targeted teachers of students in grades other than second, involved fewer than 10 hours of training, was attended by individual teachers rather than teams of teachers from the same schools, or focused on topics such as classroom management rather than the theory and practices of reading instruction were eligible for the study. Districts that assigned reading coaches to support the entire teaching staff of one or more schools, or to support teachers of students in grades other than second were eligible for the study. 31 The second screening used information gathered from reading program publishers, district websites, and consultants familiar with some of the districts. 32 Teachers in Reading First schools receive coaching and participate in a PD program that focuses on many of the same aspects of reading that were presented by the Early Reading PD Interventions Study. Thus, the inclusion of Reading First schools would have reduced or eliminated the service contrast between treatment and control schools. 33 In recruiting districts and schools for the study, schools with more than 50 percent of its students designated as English Language Learners were excluded, because the majority of students in such schools might be enrolled in reading courses designed for English language learners, for which the PD might not be directly relevant. 34 In five districts, officials asked that the assignment process be conducted in a manner that ensured that schools with particular characteristics (e.g., geographic location) were equally represented in the treatment and control conditions. Schools within these districts were grouped into blocks of schools with similar characteristics, and one-third of the schools within each block were randomly assigned to each treatment group. Blocking in two districts was based on the percentage of minority students enrolled in the schools; in the other three, it was based on geographic region. The sixth district was not subdivided and thus constituted a single block in which one-third of the schools were randomly assigned to each treatment condition. Across the six districts, there were 14 blocks. These were built into statistical models used in analyses, but impact estimates are not reported separately by block.
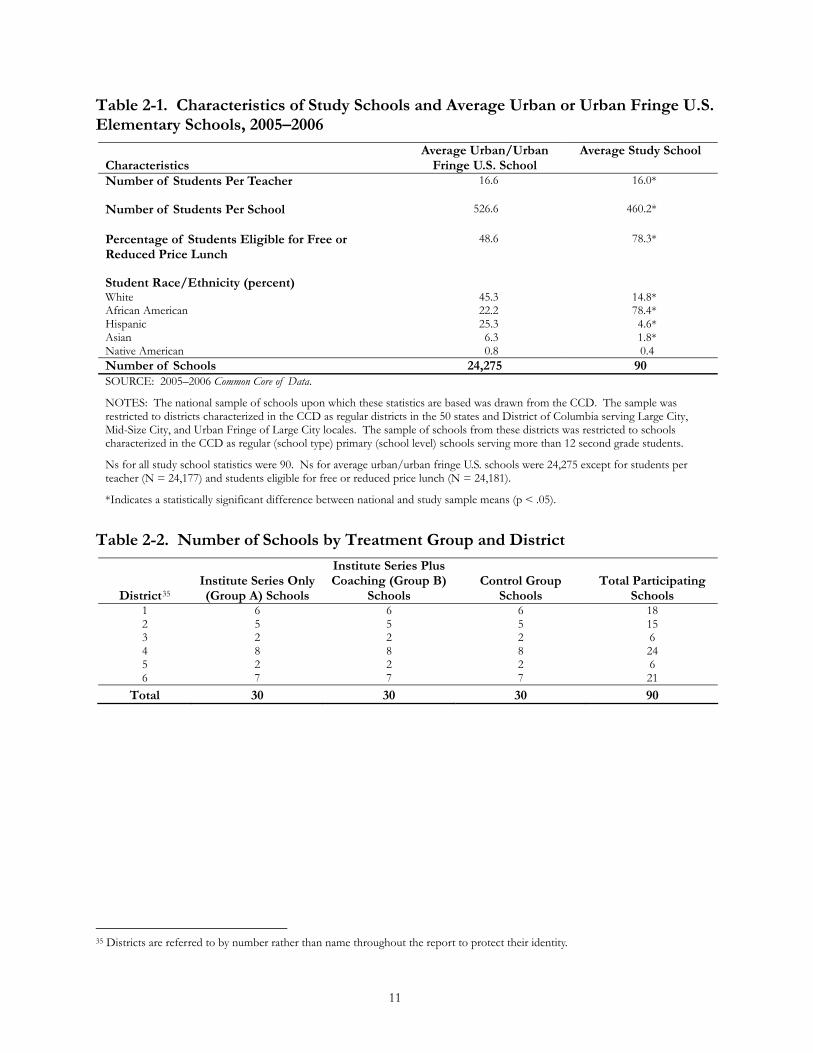
11
Table 2-1. Characteristics of Study Schools and Average Urban or Urban Fringe U.S. Elementary Schools, 2005–2006
Characteristics Average Urban/Urban
Fringe U.S. School Average Study School
Number of Students Per Teacher 16.6 16.0* Number of Students Per School 526.6 460.2* Percentage of Students Eligible for Free or Reduced Price Lunch
48.6 78.3*
Student Race/Ethnicity (percent) White 45.3 14.8* African American 22.2 78.4* Hispanic 25.3 4.6* Asian 6.3 1.8* Native American 0.8 0.4 Number of Schools 24,275 90 SOURCE: 2005–2006 Common Core of Data.
NOTES: The national sample of schools upon which these statistics are based was drawn from the CCD. The sample was restricted to districts characterized in the CCD as regular districts in the 50 states and District of Columbia serving Large City, Mid-Size City, and Urban Fringe of Large City locales. The sample of schools from these districts was restricted to schools characterized in the CCD as regular (school type) primary (school level) schools serving more than 12 second grade students.
Ns for all study school statistics were 90. Ns for average urban/urban fringe U.S. schools were 24,275 except for students per teacher (N = 24,177) and students eligible for free or reduced price lunch (N = 24,181).
*Indicates a statistically significant difference between national and study sample means (p < .05).
Table 2-2. Number of Schools by Treatment Group and District
District35 Institute Series Only (Group A) Schools
Institute Series Plus Coaching (Group B)
Schools Control Group
Schools Total Participating
Schools 1 6 6 6 18 2 5 5 5 15 3 2 2 2 6 4 8 8 8 24 5 2 2 2 6 6 7 7 7 21
Total 30 30 30 90
35 Districts are referred to by number rather than name throughout the report to protect their identity.

12
Teacher and Student Samples
Semester-specific and stable teacher samples. Once schools were randomly assigned to treatment conditions, the second grade teachers within them became members of the teacher samples for the treatment A, treatment B, and control groups. In September 2005, a total of 270 teachers comprised the sample of “original” (or implementation year fall) teachers in the study. During the following two years, some teachers left the study schools and were replaced by “late entry” teachers. Consequently, the membership of the teacher samples available to contribute to the data collections conducted during each semester changed over time.36 By spring 2007, the spring of the follow-up year, 171 (63 percent) of the original 270 teachers were still teaching in the study schools.
Data were collected in four waves, with each wave occurring during one of the four semesters during which the study was conducted. In each wave we included all regular second grade teachers teaching reading in the 90 schools at the time of the data collection. In the rest of the report, we refer to these four samples as the implementation year fall and spring samples (the fall 2005 and spring 2006 semesters, respectively), and the follow-up year fall and spring samples (the fall 2006 and spring 2007 semesters). Teachers were defined as members of a semester-specific sample if they were the “teacher of record” in a regular second grade classroom in a study school during the semester. In most cases, the teacher of record was the only teacher who taught in the classroom during the semester; but when one teacher was present in a classroom at the beginning of a semester and a second teacher was present at the end, the teacher of record was defined as the individual who spent the greater part of the semester in the classroom. Table 2-3 summarizes the four semester-specific samples for the three study groups. The samples shown in table 2-3, which are defined based on the teacher of record for each semester, are the samples that were used for the teacher impact analyses reported in chapters 4 and 5. As indicated in the table, the total number of second grade teachers in the study schools declined in the second year of the study.
Table 2-3. Number of Teachers in Semester-Specific Samples, by Group
Institute Series Only (Group A) Teachers
Institute Series Plus Coaching (Group B)
Teachers
Control Group Teachers Total Participating Teachers
Implementation Year Fall Sample
91 88 91 270
Implementation Year Spring Sample
93 88 89 270
Follow-up Year Fall Sample
85 84 81 250
Follow-up Year Spring Sample
85 85 84 254
SOURCE: Early Reading PD Interventions Study Teacher Rosters.
In the samples for each of the three later semesters of the study (spring implementation year, fall follow-up year, and spring follow-up year), surviving members of the implementation year fall sample comprise a “stable teacher sample” for that semester. Table 2-4 summarizes the number of stable teachers in the three study groups and indicates the proportion of the semester-specific sample comprised by stable (or “original”) teachers. Overall, 95.6 percent of the teachers in the 36 Exhibit B-1 in appendix B is a graphical representation of the movement of teachers in and out of the study sample, and indicates the reasons why individual teachers left the study.

13
spring implementation year sample were stable, and 67.3 percent of the teachers in the spring follow-up year were stable. We tested whether there were differences in teacher retention rates across the two treatment groups and the control group, and the differences were not statistically significant (p = .81). We also tested for differences across groups in the characteristics of teachers who remained in the schools and found no significant differences.37 It is of course possible that the stable teachers differed across groups in unmeasured ways.
Table 2-4. Stable Teachers as a Percentage of Semester-Specific Samples, by Group Institute Series Only
(Group A) Teachers N and (percent of semester sample)
Institute Series Plus Coaching (Group B)
N and (percent of semester sample)
Control Group Teachers N and (percent of semester sample)
Total Teachers N and (percent of semester sample)
Implementation year spring stable sample
87 (93.5) 84 (95.4) 87 (97.8) 258 (95.6)
Follow-up year fall stable sample
56 (66.0) 61 (72.6) 62 (76.5) 179 (71.6)
Follow-up year spring stable sample
55 (64.7) 58 (68.2) 58 (69.0) 171 (67.3)
SOURCE: Early Reading PD Interventions Study Teacher Rosters.
Student samples. The student sample included all students in the study schools who were enrolled in classes taught by regular second grade teachers in the spring. Because students moved in and out of the schools during the year, not all students present in the spring had been in the classes for the entire year. In the spring of the implementation year, 17 percent of students who were enrolled in the spring had not been enrolled in the school in the fall of the school year. (The corresponding information for the follow-up year is unavailable because one district did not provide follow-up year student attendance data.) The study defined three samples of students who were taught by the study sample of teachers and took reading tests at the end of their second grade year:
• The implementation year spring sample consisted of 5,530 second grade students who were in the study schools at the time of the spring 2006 student outcomes data collection.
• The implementation year stable students of stable teachers sample consisted of 4,012 students who remained in the study school throughout the implementation year and who were taught by teachers who also remained in the study school throughout this same year.
• The follow-up year spring sample consisted of 5,297 second grade students who were in the study schools at the time of the spring 2007 student outcomes data collection.
Table 2-5 displays the overall numbers of schools assigned to each treatment group (across districts) as well as the numbers of second grade teachers and students in those schools as of the spring 2006 outcomes data collection. Study schools had an average of three second grade teachers and 61 second grade students in regular classrooms (special education classrooms were excluded
37 The characteristics tested were: Baseline total teacher knowledge score, educational level, years of teaching experience, years of reading program experience, percent of students one or more years below grade level, and class size. These measures, which served as the covariates for the impact analyses of teacher outcomes, are discussed in the Estimation Methods section below.

14
from the study). All regular second grade teachers who taught reading were included in the sample; teachers who taught self-contained special education classes and their students were excluded.
Table 2-5. Number of Schools, Teachers, and Students in Implementation Year Spring Sample, Overall and by Group
Number of Second grade Teachers Number of Second grade Students Treatment
Status Number of
Schools Total Number Average Per
School Total Number Average Per
School Treatment A 30 93 3.1 1,983 66.1 Treatment B 30 88 2.9 1,738 57.9 Control 30 89 2.9 1,809 60.3
Total 90 270 3.0 5,530 61.4 SOURCE: Early Reading PD Interventions Study Teacher Rosters and District Enrollment Records.
Data Collected for the Study
The study’s data collections were designed to serve four main purposes: to document the delivery of the PD; to provide descriptive information about sample characteristics; to serve as covariates in the outcome analyses; and to provide data on study outcomes. In this section, we provide a brief overview of these data collections.38 Table 2-6 shows the main sources of data for the study and presents the timing of the data collections in relation to the delivery of the study PD.39
• Fidelity forms. Observers from the project team completed a closed-ended observation protocol during each institute and seminar, documenting the time spent on the major topics and activities outlined in the syllabus for each day of PD. Forms were completed for all teacher institute and seminar days. These data were used to measure the fidelity with which the intended professional development program was delivered in the 6 districts.
• Coaching logs. Coaches completed logs documenting the content and duration of each interaction they had with a study teacher. They were instructed to submit logs every two weeks during the months they worked with teachers during the 2005–2006 school year. Logs were submitted for 97 percent of these two-week recording periods. Data from the logs were used to estimate the amount of coaching each teacher in the institutes-plus-coaching intervention received as well as the proportion of coaching time devoted to specific activities and reading-related topics during the implementation year.
• Common Core of Data (CCD). This database is maintained by the National Center for Education Statistics (NCES). We extracted 2004–2005 school year data on total enrollment, ethnic composition of the enrollment, and percentage of students eligible for free or reduced-price lunch for the schools in the study sample. These data were used in a baseline (pre-random assignment) comparison of schools in the three study groups.
38 More detailed information about the measures used in the analyses is provided in appendices D, E, and F. 39 In all six districts, the study’s institute and seminar series for treatment A and treatment B teachers concluded 3 or more weeks before student testing began in spring 2006. In addition, on average 86 percent of the coaching was delivered by the time students were tested.

15
Table 2-6. Timing of Key PD and Data Collection Activities
Implementation Year Follow-Up Year Baseline Year
Spring 2005Summer
2006 Fall 2005
Winter 2006
Spring 2006
Fall 2006
Spring 2007
Delivery of PD
Institutes and seminars X X X Coaching X X X
Data on PD Delivery
Fidelity forms X X X Coaching logs X X X
School-Level Data
CCD file (SY 2004–2005) X Teacher-Level Data
Teacher Background Survey X X X X Reading Content and Practices Survey (RCPS)
X X X X
Classroom observations X X X Student-Level Data
District records X X X NOTES: CCD data were compiled for study schools for the 2004–2005 (baseline) school year.
The baseline RCPS was administered in the summer for treatment teachers, and in the fall for control teachers.
Student achievement data were compiled from school districts for the spring of the 2003–2004 and 2004–2005 school years, the two years prior to the implementation of the PD.
Student achievement testing in spring 2006 occurred after all the institutes and seminars and a substantial portion of the coaching had been delivered. See appendix G for additional details.
• Teacher Background Survey. We administered teacher surveys by mail or in person at
four time points: the fall and spring of the school year in which the PD was implemented (2005–2006) and the fall and spring of the school year subsequent to the PD (2006–2007).40 The surveys were developed specifically for this study and served two main purposes. First, they provided data on characteristics of study teachers (e.g., degree earned, years of teaching experience), which were used as covariates in the teacher impact analyses. Second, they provided data on teachers’ participation in reading PD during the summer and school year, which were used for descriptive purposes and as checks on PD participation. Response rates ranged from 85 to 92 percent across the four administrations.41
• Reading Content and Practices Survey (RCPS) pre- and post-tests. The RCPS was developed specifically for this study to assess teachers’ knowledge of theory and practice of reading instruction with an emphasis on topics relevant to second grade reading. Teachers received different but equivalent forms of the test at each administration to
40 Because the study was conducted with random assignment at the school level and employed an “intent-to-treat” approach to testing impacts, we gathered teacher data from all second-grade teachers who were working in the study schools at the time of each data collection. 41 See table C-1 in appendix C for complete information on response rates of the teacher data collections.
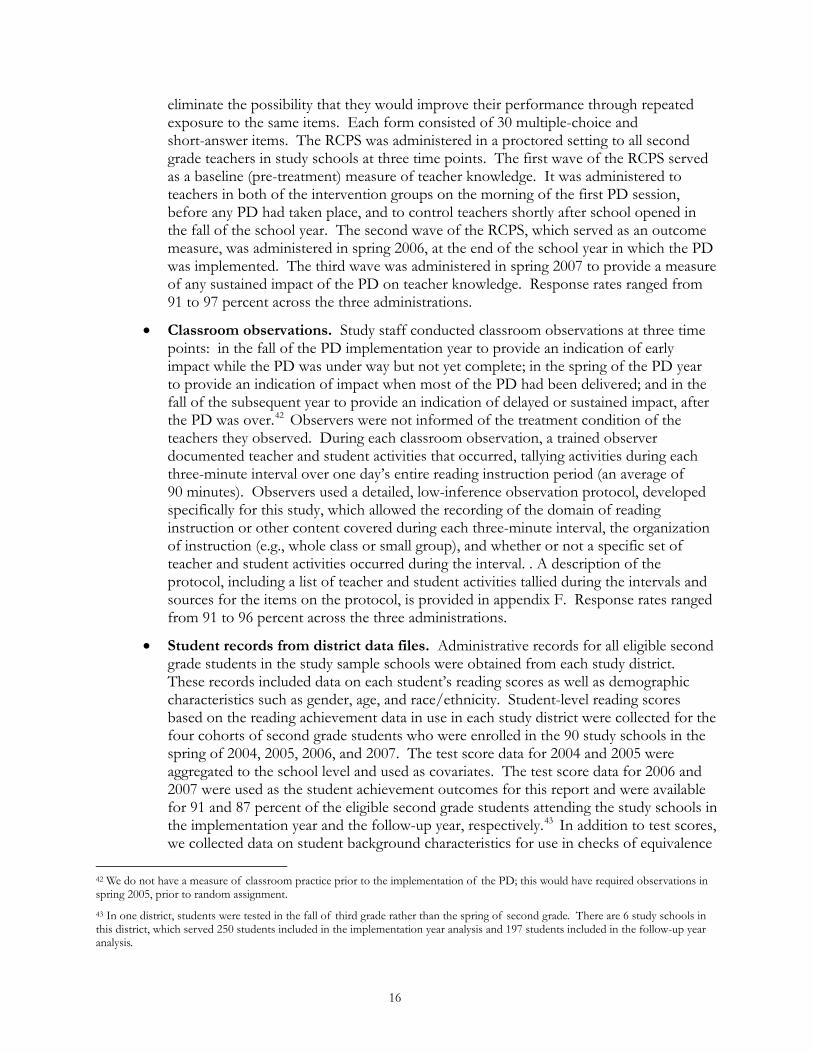
16
eliminate the possibility that they would improve their performance through repeated exposure to the same items. Each form consisted of 30 multiple-choice and short-answer items. The RCPS was administered in a proctored setting to all second grade teachers in study schools at three time points. The first wave of the RCPS served as a baseline (pre-treatment) measure of teacher knowledge. It was administered to teachers in both of the intervention groups on the morning of the first PD session, before any PD had taken place, and to control teachers shortly after school opened in the fall of the school year. The second wave of the RCPS, which served as an outcome measure, was administered in spring 2006, at the end of the school year in which the PD was implemented. The third wave was administered in spring 2007 to provide a measure of any sustained impact of the PD on teacher knowledge. Response rates ranged from 91 to 97 percent across the three administrations.
• Classroom observations. Study staff conducted classroom observations at three time points: in the fall of the PD implementation year to provide an indication of early impact while the PD was under way but not yet complete; in the spring of the PD year to provide an indication of impact when most of the PD had been delivered; and in the fall of the subsequent year to provide an indication of delayed or sustained impact, after the PD was over.42 Observers were not informed of the treatment condition of the teachers they observed. During each classroom observation, a trained observer documented teacher and student activities that occurred, tallying activities during each three-minute interval over one day’s entire reading instruction period (an average of 90 minutes). Observers used a detailed, low-inference observation protocol, developed specifically for this study, which allowed the recording of the domain of reading instruction or other content covered during each three-minute interval, the organization of instruction (e.g., whole class or small group), and whether or not a specific set of teacher and student activities occurred during the interval. . A description of the protocol, including a list of teacher and student activities tallied during the intervals and sources for the items on the protocol, is provided in appendix F. Response rates ranged from 91 to 96 percent across the three administrations.
• Student records from district data files. Administrative records for all eligible second grade students in the study sample schools were obtained from each study district. These records included data on each student’s reading scores as well as demographic characteristics such as gender, age, and race/ethnicity. Student-level reading scores based on the reading achievement data in use in each study district were collected for the four cohorts of second grade students who were enrolled in the 90 study schools in the spring of 2004, 2005, 2006, and 2007. The test score data for 2004 and 2005 were aggregated to the school level and used as covariates. The test score data for 2006 and 2007 were used as the student achievement outcomes for this report and were available for 91 and 87 percent of the eligible second grade students attending the study schools in the implementation year and the follow-up year, respectively.43 In addition to test scores, we collected data on student background characteristics for use in checks of equivalence
42 We do not have a measure of classroom practice prior to the implementation of the PD; this would have required observations in spring 2005, prior to random assignment. 43 In one district, students were tested in the fall of third grade rather than the spring of second grade. There are 6 study schools in this district, which served 250 students included in the implementation year analysis and 197 students included in the follow-up year analysis.

17
of treatment groups and as covariates in impact analyses. Student data from one control school with a single second grade classroom were not available for either year of the study. Table 2-5 (see “Teacher and Student Samples” section above) summarizes the numbers of schools, teachers, and students in the study at the time of the spring 2006 data collections.
Outcome Measures
Outcome measures were constructed within three domains that corresponded to the study’s research questions—teachers’ knowledge about reading instruction, teachers’ use of research-based practices, and students’ reading achievement. Below we summarize the outcome variables created within each domain.
• Teachers’ knowledge about reading instruction. Outcome measures derived from RCPS responses included an overall score and two subscores—a word-level subscore, measuring teachers’ knowledge of word-level components of reading instruction (phonemic awareness, phonics, and fluency), and a meaning-level subscore, measuring teachers’ knowledge of meaning-level components of reading instruction (vocabulary and reading comprehension). The two subscores were included to permit exploration of possible differences in the impact of the PD on the domains of knowledge it addressed.44
The outcomes for teacher knowledge in reading are scaled in logits. A logit is the log of the odds of obtaining a particular answer or response on an item, and thus logits are a common metric for scaling achievement tests. A logit value of 0 indicates that a teacher has a 50 percent chance of answering a typical item correctly, a logit of 0.5 indicates that the teacher has a 62 percent chance, and a logit of –0.5 indicates that the teacher has a 38 percent chance.45 For purposes of the impact analyses, we standardized the teacher knowledge measures, so the impact estimates can be interpreted directly as standardized difference effect sizes (hereafter referred to as effect sizes). Each teacher knowledge measure was standardized based on the control group mean and standard deviation. Thus, the control group teachers have a mean of zero and a standard deviation of one.46 The internal consistency reliability of the teacher knowledge measures, defined as the ratio of true variance to observed variance, was 0.60 for the total scale, 0.45 for the word level scale, and 0.49 for the meaning level scale for the implementation year. Because teacher knowledge is a dependent variable in the impact analysis, the measurement error
44 The word-level material in the PD curriculum emphasized foundational knowledge underlying “best practices” in phonics and fluency instruction, topics believed to be unfamiliar to most teachers (Moats 2002). The meaning-level material in the curriculum emphasized teaching strategies for building students’ vocabularies and comprehension skills, both of which were built into the lesson structure of the core readers the teachers used. 45 The average score on the word component of the assessment (focusing on phonemic awareness, phonics, and fluency) was -0.05 logits, indicating that teachers had a 49 percent chance of getting a typical word item correctly at baseline; the average score on the meaning component of the assessment (focusing on vocabulary and comprehension) was 0.26, indicating that teachers had approximately a 56 percent chance of answering a typical meaning item correctly. 46 See section II of appendix J for more information about standardization of measures.

18
in teacher knowledge is averaged across teachers. Thus, the main effect of unreliability is to reduce the precision of the impact estimates.47
• Teachers’ use of research-based instructional practices. Outcome measures derived from the observations of reading instruction included scores for explicit teaching methods, independent student activity (i.e., guided student practice), and differentiation of instruction to address students’ diverse needs, three areas of teachers’ practice that the PD was intended to affect. Examples of explicit teaching methods include directly explaining the phonics patterns that are being practiced rather than expecting students to infer them independently, modeling the speed and smoothness of fluent reading and urging students to strive for the same qualities in their oral reading, and explaining how events in a story support a prediction of what will happen next. Independent student activity refers to giving students opportunities to apply what they have learned without direct support from the teacher—e.g., reading aloud a sequence of words in a phonics lesson or a passage in a story, or writing answers to questions about a story without benefit of hints from the teacher. Instruction was considered differentiated when the teacher worked with individuals or small groups of students using materials tailored to their reading level or instructional needs, different from those used with other students in the class. By contrast, undifferentiated instruction occurs when the whole class reads the same passage aloud, or the class is divided into small groups to complete the same task using identical materials.
The measures of explicit instruction and independent student activity were scaled in logits, paralleling the scaling of the teacher knowledge outcomes.48 Each teacher’s logit score represents the log of the odds of the teacher engaging in explicit instruction or independent student activity during each three-minute observation interval. The measure of differentiated instruction was based on the percent of intervals in which teachers engaged in differentiated instruction.49 For purposes of the impact analyses, we standardized the instructional practice measures, so the impact estimates can be interpreted as effect sizes. Each classroom instruction measure was standardized based on the control group mean and standard deviation. Thus, the control group teachers have a mean of zero and a standard deviation of one. The reliability of the classroom observations is a function of the agreement among raters, the consistency of the measures between three-minute intervals within class periods, and the consistency of teachers’ instruction across class periods in the same semester. The inter-rater reliability of the classroom observation measures (agreement among observers observing the same classroom) was 0.90 or higher in each observation wave. The internal consistency reliability was 0.80 for explicit instruction in the spring of the implementation year,
47 See sections IV and V of appendix D for more information about the scaling and reliability of the Reading Content and Practices Survey. Measurement error produces RCPS scores that are higher than the true scores for some teachers and lower for others. Thus, it operates to inflate the standard error of the mean for each treatment condition and reduce the statistical significance of estimated impacts. 48 Logits are commonly used in situations in which the purpose is to measure the proportion of occasions in which an event occurs; the logit represents the log of the odds of an event occurring per occasion. 49 See sections I and II of appendix F for more information about the scaling of the classroom observation measures. The differentiated instruction measure was not scaled in logits because the majority of teachers did not engage in differentiated instruction during the classroom observation; logits cannot be calculated for zero occurrences. See footnote 47 for more information on the implications of measurement error in the observation scores.

19
0.74 for independent student activity, and 0.89 for differentiated instruction. Because we observed each teacher just once each semester, we were unable to assess the degree of consistency among different class periods for the same teacher. Because the classroom observation measures are dependent variables in the impact analyses, the variation in instruction across class periods should be averaged across teachers. Thus, the main effect of this source of unreliability is to reduce the precision of the impact estimates.50
• Students’ reading achievement. Students’ reading achievement was the primary outcome measure for the study. The key measure was the standardized total reading score obtained from the district assessments. Because the tests used in the six study districts differed, there was no one consistent test metric. Hence the total scaled scores reported by the districts were standardized within each district so that they can be compared across districts.51 One of the properties of using this metric as an outcome measure is that the estimated impacts are in standardized effect sizes. The analysis based on this measure focuses on the impact of the treatment on average achievement. It is possible that the PD interventions might not have an impact on average achievement, but the interventions might affect the achievement distribution. For this reason, a secondary dichotomous measure was constructed. First, the average reading test score in the 2004–2005 school year (latest baseline year) for all second grade students in the study schools within each district was chosen as a cut-point. Each student’s implementation year and follow-up year test scores were compared to this cut-point, and each student was categorized as achieving above or below that cut-point in the implementation year as well as the follow-up year tests. This metric reflects the percentage of students who performed at or above the mean baseline performance level. The analysis based on this measure focused on the impact of the PD treatment on the proportion of students with above average achievement in the study schools.
Characteristics of the Study Sample at the Time of Random Assignment
Tables 2-7 and 2-8 summarize characteristics of the study sample of schools and teachers just prior to or soon after the random assignment of the schools to the three study groups.52 Consistent with the goal of the study to address the interventions’ effectiveness for a high poverty population, baseline measures from the 2004–2005 school year indicated that among the schools participating in the study:
50 See sections IV an V of appendix E for information on inter-rater reliability of the observation items, and section III of appendix F for information on the internal consistency reliability of the instructional practice scales. Measurement error produces estimates of the rate of use of instructional practices that are higher than the true rate for some teachers and lower for others. Thus, it operates to inflate the standard error of the mean for each treatment condition and reduce the statistical significance of estimated impacts. 51 The standardized scores were calculated by subtracting the second grade student reading test average for the district’s study schools in 2004–2005 from each student’s total reading score and then dividing it by the standard deviation for the second grade students in the district’s study schools in 2004–2005. 52 Background characteristics for the teachers included in the impact analysis (the spring implementation year, fall follow up year, and spring follow-up year samples described earlier) are presented in section III of appendix C. Demographic characteristics for the students included in the impact analysis are presented in section I of appendix G. Because the student impact analysis is cross-sectional rather than longitudinal, the student samples for the spring implementation year and follow-up year impact analyses include all second graders in the study schools in the spring of 2006 and 2007, whether they were enrolled all year or entered the school after the school-year began.

20
• 93 percent were Title I schools
• 78 percent of the students enrolled were eligible for free or reduced price lunch
Data on the 90 participating schools for the year prior to the study also indicate that:
• On average, the study schools served 478 students, of whom 69 were in the second grade
• 78 percent of the students enrolled were African American and 16 percent were white
• for the five districts (84 schools) that used nationally normed tests, second grade students in the study schools scored, on average, at the 40th national percentile53
See table 2-7 for more information about participating school characteristics.54
Data on teacher and classroom-level characteristics in the year prior to random assignment were not available, but teacher knowledge was measured prior to the implementation of the treatment, and data on teacher demographics were collected in the fall of the implementation year. As shown in table 2-8, as of the beginning of the study’s implementation (summer/fall 2005):
• 26 percent of the study teachers reported having more than 20 years of experience, and 15 percent reported 3 or fewer years of experience
• 53 percent of the teachers reported having a master’s degree
• On average, teachers scored 0.11 logits on the baseline test of teacher knowledge total score. Logits are a common metric for educational tests, providing information on a respondent’s likelihood of answering items correctly. A logit of 0.11 indicates that on average teachers had about a 53 percent chance of answering a typical item on the test correctly.
• 53 percent of the teachers reported having more than 4 years of experience implementing their core reading program, and 32 percent were in their first year of experience with the program
Baseline Equivalence of the Treatment Groups
The purpose of random assignment is to produce groups that are statistically equivalent on all characteristics at the start of the study. If groups are indeed equivalent at the beginning of a study, and any attrition from the sample over the course of the study is balanced across groups, one can be reasonably confident that any group differences in outcomes found later are due to the intervention. One or more measured characteristics may differ at baseline, but random assignment ensures that these are due to chance and not to systematic differences in how the group members were assigned.
53 This statement applies to the five districts that used nationally normed tests for second grade students. Schools in the sixth district used a state test that was not normed to a national population of test takers.
54 Additional information about the characteristics of the study samples is provided in appendices B, C, and G.

21
As intended, random assignment produced groups of schools that were very similar at the beginning of the study. Tables 2-7 and 2-8 show that the groups were equivalent across all measured school and teacher characteristics at the time of random assignment or early in the fall of 2005, except for the percentage of white students.55 The average percentage of white students was 13 percent in treatment group A, 21 percent in treatment group B, and 13 percent in the control group. We incorporated student ethnicity as a covariate in our impact models to take this difference into account (see the Estimation Methods section below for more information on the statistical models used).
Estimation Methods
Given the study design, the basic analytic strategy for assessing the impacts of the PD interventions was to compare outcomes for schools that were randomly assigned to each of the three study conditions—institute and seminar series only (treatment A), institute and seminar series plus coaching (treatment B), and business as usual (control group). The average outcome in the group of schools that did not receive one of the PD interventions represents an estimate of the achievement level that would have been observed in the treatment group schools if they had not received the intervention—and so the difference in outcomes between the treatment and control conditions provides an unbiased estimate of the impact of the PD interventions. In this report, PD impacts were estimated using data from spring 2006 and 2007.56
The impact analyses focused on the effect of the PD interventions on three outcome domains (teacher knowledge, teacher instructional practice, and student achievement). Given the nested structure of the data, multilevel models were used to estimate the impacts of professional development on different outcomes. For outcomes measured at the teacher level (teacher knowledge and practices), we used a two-level hierarchical model with teachers nested within schools. For outcomes measured at the student level, we used a three-level hierarchical model with students nested within teachers and teachers nested within schools.
For each outcome domain, impacts were estimated for three comparisons, corresponding to the three research questions discussed in chapter 1: the comparison between treatment groups A and C, which represents the impact of PD institutes and follow-up seminars alone; the comparison between treatment groups B and C, which represents the impact of PD institutes and follow-up seminars plus in-school coaching; and the comparison between treatment groups B and A, which represents the incremental impact of in-school coaching.
These comparisons were conducted using the full sample of teachers present in the study schools as of the spring 2006 and 2007 data collection periods, the students of these teachers, and a subsample of “stable” teachers who stayed in their original school for the entire study. The estimates based on the full sample provide an intent-to-treat analysis of the impact of the program
55 The model used to examine differences across treatment conditions depends on the level of analysis and the unit of measurement. All models included controls only for random assignment block and district. OLS regression was used for school-level continuous variables. Two-level linear models were used for continuous teacher characteristics, and two-level logit models were used for categorical teacher characteristics (e.g., teacher’s master’s degree status). Three-level linear models were used for continuous student characteristics. For each measured characteristic an F-test was used to test whether the three experimental groups differed more than might be anticipated by chance. P-values of the F-tests are reported in the last column of tables 2-7 and 2-8. 56 Additional information about estimation methods is provided in appendices B, C, and J. Note that in the district that tested third-grade students but not second-grade students, PD impacts on student achievement were estimated using third-grade test scores from fall 2006 and 2007.

22
Table 2-7. School Characteristics, by Group, Baseline Year (2004–2005)
Characteristics Overall
Institute Series Only
(Group A)
Institute Series Plus Coaching
(Group B) Control Group P-value
Title I Status (percent of schools) 93.3 93.3 96.7 90.0 0.54
Students Eligible for Free or Reduced-Price Lunch (percent of students) 77.6 77.2 79.1 76.6 0.76
Number of Teachers (All Grades) 29.4 32.1 27.8 28.2 0.11
Number of Second Grade Students 69.3 74.2 65.6 68.1 0.30
Total School Enrollment 477.6 514.3 456.2 462.4 0.27
Race/Ethnicity (percent of students)
White 15.6 13.1 20.6 13.0 0.05* Black or African American 78.4 80.9 74.0 80.4 0.20 Hispanic 3.9 4.3 3.4 4.1 0.81 Asian/Pacific Islander 1.5 1.2 1.6 1.8 0.88 Other 0.6 0.5 0.4 0.7 0.42
Female (percent of students) 49.2 50.9 47.9 48.8 0.12 Second Grade Reading Scores (Standardized based on study schools within each district) 0.00 -0.03 0.01 0.02 0.60
Number of Schools 90 30 30 30 SOURCE: 2004–2005 Common Core of Data (National Center for Education Statistics). Student test scores were obtained from the 2004–2005 study district records.
NOTES: Values in the columns represent unadjusted means for the groups.
Because the districts used different tests, it was necessary to translate the scores into a common metric to allow comparisons between districts. The scores were standardized by using the mean and standard deviation of second grade student test scores within each district for the 2004–2005 baseline year, including only the schools participating in the study. An F-test was used to determine whether the means for the study groups are equal, weighting each district by the number of schools in the study.
Statistics for study schools in tables 2-1 and 2-7 differ because data in table 2-7 are for the baseline year (2004–2005) while those in table 2-1 are for the implementation year (2005–2006).
Two-tailed statistical significance at the p < .05 level is indicated by an asterisk (*).

23
Table 2-8. Teacher Characteristics, by Group, Fall of Implementation Year (2005–2006)
Characteristics Overall
Institute Series Only
(Group A)
Institute Series Plus Coaching
(Group B) Control Group P-value
Teacher-Level Data (Fall 2005) Baseline Teacher Knowledge in Reading (logits)
Total Score 0.11 0.05 0.13 0.13 0.34 Word Score –0.05 –0.12 –0.06 0.04 0.31 Meaning Score 0.26 0.23 0.33 0.22 0.44
Years of Teaching Experience (percent) 0.70
3 years or less 14.9 13.3 17.1 14.3 4–10 years 35.5 39.8 36.6 29.9 11–20 years 23.6 24.1 20.7 26.0 More than 20 years 26.0 22.9 25.6 29.9
Years of Teaching Experience in Current School (percent) 0.19
3 years or less 34.2 29.6 41.0 32.0 4–10 years 32.1 38.3 29.5 28.1 11–20 years 13.5 8.6 12.8 19.2 More than 20 years 20.3 23.5 16.7 20.5
Years of Reading Program Experience (percent) 0.39
1 year or less 32.2 34.5 28.9 33.3 2–4 years 15.1 7.1 18.1 20.5 More than 4 years 52.6 58.3 53.0 46.2
Educational Level: M.A. and Above (percent) 53.1 48.8 54.2 56.4 0.72
Table continues on next page.

24
Table 2-8. Teacher Characteristics, by Group, Fall of Implementation Year (2005–2006) (continued)
Characteristics Overall
Institute Series Only
(Group A)
Institute Series Plus Coaching
(Group B) Control Group P-value
Teacher-Level Data (Fall 2005) Class Size Taught (number of students) 21.9 22.3 21.1 22.5 0.16 Estimated Percent of Teacher’s Students One or More Years Below Grade Level 41.1 37.6 45.4 40.6 0.10 Hours of PD in Year Prior to Study 26.3 25.9 32.6 19.8 0.65 Number of Teachers 270 91 88 91 SOURCE: Early Reading PD Interventions Study 2005 Teacher Background Survey and 2005 Reading Content and Practices Survey.
NOTES: Values in the columns represent unadjusted means for the groups. Values representing mean percents may not sum to 100 because of rounding.
Teacher knowledge was measured in summer 2005 (post-random assignment of schools, but before the PD was implemented) for teachers in treatment group A and treatment group B schools, and in fall 2005 for teachers in control group schools. Data on the remaining teacher characteristics came from the fall 2005 Teacher Background Survey for all groups. The number of teachers in the analysis equals the number of teachers in study schools in fall 2005.
The numbers of students per teacher reported in tables 2-1 and 2-8 differ because statistics in table 2-8 refer to second grade classrooms and are based on study teachers’ responses to the 2005 Teacher Background Survey while statistics in table 2-1 are based on counts of teachers and students across all grades as reported in the 2005-2006 CCD.
Pre-test data were unavailable for the second grade students in the study teachers’ classrooms during 2005–2006 because the study districts did not administer standardized reading tests to them when they were in first grade. Instead, we asked teachers to estimate the percent of their students reading one or more years below grade level. This estimate was used as a covariate in analyses of classroom observation data on teachers’ instructional practices to account for variations in the mix of student needs in the observed classrooms.
An F-test was used to determine whether the means for the study groups are equal, weighting each district by the number of schools in the study.
Two-tailed statistical significance at the p < .05 level is indicated by an asterisk (*).
because they reflect the PD interventions’ effects on the targeted (or “intended”) sample. However, not all teachers stayed in their original schools for the full two years of the study. As a result, some teachers and their students did not receive the full amount of “treatment” that they were supposed to receive. Looking at a stable subsample of teachers and their students provides estimates of the program impacts we might expect to see had there been no teacher turnover and helps to address questions about the magnitude of the impacts we observed. However, because the stable teacher analyses are based on a select subsample that was determined after the interventions were implemented, the analysis is non-experimental and the impact estimates should be interpreted with caution.
To increase the precision of the estimates in these analyses, we used a set of baseline characteristics of the teachers and students as covariates. The following covariates were included in the teacher outcomes analyses:
• Baseline scores for teacher knowledge
• Characteristics of teachers at the beginning of the study: educational level, years of teaching experience, and years of experience using the core reading program

25
• Class characteristics: the number of students enrolled and the teacher’s estimate of the percentage of students in the class who were reading one or more years below grade level in fall 2005 and fall 2006.57
The following covariates were included in the student achievement analyses:
• School-level achievement scores from one to two years prior to the delivery of the PD, depending on availability of the data
• Student-level demographic information: gender, age, race/ethnicity, and a separate poverty measure for each district
Treatment of Missing Data
The treatment of cases with missing data depended on the nature of the data that were missing. Teachers with missing outcome measures were dropped from the impact analysis for which they lacked data. However, in cases where covariate measures were missing, the missing data were imputed with the district means calculated from the sample of study schools in the teacher’s district.58 Students with missing test scores or background information or who could not be linked to a specific classroom were dropped from the analysis.
Weighting Used in Impact Analyses
Because random assignment was conducted separately within each of the six participating school districts, the study comprised six separate random assignment experiments. We obtained separate impact estimates for each study district and then computed an overall impact estimate by calculating an average of the six district estimates. Because the number of schools participating in the study varied by school district (from 6 to 24), we computed a weighted average of the district impact estimates, weighting by the number of schools in each district’s sample. Thus, the overall impact estimates reflect the relative contribution of each district to the overall sample of schools in the study.
Statistical Precision and Significance Testing
The statistical precision of an impact estimator reflects its ability to detect true intervention effects when they exist. A common way to represent precision is a minimum detectable effect (MDE), which is the smallest true effect that an estimator has a good chance of detecting (Bloom 1995). When the standard definition is used, the minimum detectable effect is the smallest true impact that has an 80 percent chance of being found to be statistically significant at the 5 percent level of statistical significance for a two-tailed test. When a minimum detectable effect is expressed 57 Individual-level pre-test scores in reading were not available for the second grade students in the study. Consequently, teachers’ reports of the number of their students (later converted into the proportion of students) whose reading skills were one or more years below grade level was the only available measure of the degree of disadvantage among students in each classroom. Formal and informal testing conducted by the study teachers (e.g., assessments embedded in the reading program and district-required progress monitoring) made data available to them that would allow them to make informed estimates of the numbers of below-grade readers in their classrooms. The reliability and validity of these estimates cannot be independently ascertained. However, we have no reason to believe that treatment and control teachers would respond differently in how they estimate students’ skills, and therefore including this variable in the regression model is unlikely to introduce bias although it may not enhance the precision of the impact estimates as much as other covariates. 58 Missing rates and baseline characteristics of remaining teachers do not statistically differ across the three treatment groups.

26
as a standardized effect size (in standard deviation units), it is referred to as a minimum detectable effect size (MDES). The Early Reading PD Interventions Study was designed to obtain an MDES of 0.40 for analyses of impact on teacher outcomes (teacher knowledge and practice) and 0.20 for analyses of impact on student outcomes. Based on the achieved sample size, the minimum detectable effect sizes ranged from 0.42 to 0.53 for teacher knowledge outcomes, from 0.36 to 0.45 for teacher practice outcomes, and from 0.22 to 0.28 for student achievement outcomes.
Two-tailed t-tests were used to assess the statistical significance of the average impact estimates. If an impact estimate is statistically significant, then one may conclude, with some confidence, that the Reading PD program had an effect on the outcome being assessed. If an impact estimate is not statistically significant, then the non-zero estimate may be a product of chance. In this report, statistical significance is indicated in the tables by an asterisk (*) when the p-value of the impact estimate is less than or equal to 0.05. Note that statistical significance does not represent the magnitude or meaning of an impact estimate, only the probability that an effect of the size observed might occur if the true impact were zero. This depends on the sample sizes, as small differences are statistically significant in large samples and only large differences are statistically significant in small samples. Statistically significant impacts may or may not be policy relevant, or may or may not be perceived as justifying the costs and effort to operate the program under study. As a result, statistically significant impact estimates can be better understood in terms of benchmarks and contexts, such as cost-effectiveness, achievement gaps, or performance standards, which help policy makers, practitioners and researchers gauge their importance or relevance. By the same token, a lack of statistical significance for an impact estimate does not mean that the impact being estimated equals zero. It only means that the estimate cannot be distinguished from zero reliably. This can be due to the small magnitude of the impact estimate, the limited statistical power of the study, or some combination of both.
Multiple Hypothesis Testing
The impact analyses focused on three distinct measurement domains (teacher knowledge, teacher practice, and student achievement) within which were a total of 8 outcome measures. Furthermore, for each outcome measure, we examined three comparisons (treatment group A vs. control group, treatment group B vs. control group, and treatment group A vs. treatment group B). Thus, the main impact analyses involved 24 separate statistical tests.59
For each individual impact estimate, there was a 5 percent chance of falsely obtaining a statistically significant result, if there was no true impact on the outcome. There was a much greater chance of falsely obtaining a statistically significant result across all 24 tests, even if there were no true effects. To reduce the problem of multiple hypothesis testing, we took the following steps.
First, we kept the number of primary impacts estimated to a minimum. Second, we divided the impact analyses into two tiers: confirmatory analyses, which provided answers to the key research questions, and exploratory analyses, which facilitated a deeper understanding of the findings and what they mean. A breakdown of the confirmatory and exploratory analyses is provided in section III of appendix J.
59 For the purposes of taking multiple comparisons into account, we considered the impact tests for the implementation year and the follow-up year to be separate analyses.

27
Third, to reduce the risk of drawing inappropriate conclusions on the basis of statistically significant results that may occur by chance alone, we also conducted a composite qualifying test for the confirmatory analyses in each of the three measurement domains. This qualifying F-test, conducted using an overall index or composite score that incorporated all the outcome measures in the domain, provided an assessment of the overall statistical significance of the group of impact estimates within the domain, taking into account the comparisons among the treatment groups (i.e., tests if outcome levels of the three study groups, as measured by the overall index or composite score, are statistically equivalent). A qualifying test that indicated that a group of findings are statistically significant overall would suggest that there are in fact statistically significant findings in some of the individual tests included in the domain and would thus add confidence to the interpretation of the individual findings. In contrast, a qualifying test that did not indicate overall statistical significance of a group of findings would call for careful interpretation of specific findings within that domain.


29
CHAPTER 3
IMPLEMENTATION OF THE PD INTERVENTIONS
The following sections describe the content and structure of each component of the PD interventions tested, examine the fidelity with which the PD interventions were delivered, and compare the reading PD received by treatment and control teachers during the implementation year.60 How, and how well, the PD interventions were implemented are important factors in understanding the impacts the interventions have on teachers and students.
Teacher Institute Series
After random assignment, the principal at each treatment group A and B school was contacted in summer 2005 and asked to provide the study staff with names of prospective institute and seminar participants. Participants invited to the institute series included all second grade teachers in each school, any special education teachers who might teach reading to second grade students, English Language Learner (ELL) or resource teachers who might support second grade reading instruction, and the school principal or assistant principal, with the idea that reading instruction is a collaborative effort in each school.
The institute and seminar series was then provided beginning in late summer 2005 and continuing through early winter 2006. The remainder of this section describes the content of the series, how the PD was delivered, and the extent to which it was delivered as intended.
Description of the Teacher Institute Series
As indicated in chapter 1, the teacher institute series was based on Language Essentials for Teachers of Reading and Spelling (LETRS) by Louisa Moats (2005). The full LETRS series consists of 12 modules that cover content intended to be consistent with the recommendations of the NRP for reading instruction in grades K–6. The study’s institute series was based on the content and accompanying trainer materials of the first six modules.61 Treatment group A and B teachers who attended the institutes and seminars received copies of the participant books for each of these modules in addition to other materials that addressed the NRP findings, vocabulary development, fluency-building strategies, and differentiated instruction.
The lead LETRS facilitator modified the typical LETRS presentations to give more emphasis to topics that were intended to be relevant for second grade reading instruction. The core of each day’s training agenda consisted of an ongoing presentation using PowerPoint slides. During the presentation, the LETRS facilitator alternated between a lecture and open-floor discussions of
60 Additional information about the PD interventions, the fidelity of delivery, and the amount of PD received by the study teachers is available in appendices A, H, and I. 61 Six LETRS modules were used in the study: Module 1: The Challenge of Learning to Read; Module 2: The Speech Sounds of English: Phonetics, Phonology, and Phoneme Awareness; Module 3: Spellography for Teachers: How English Spelling Works; Module 4: The Mighty Word: Building Vocabulary and Oral Language; Module 5: Getting Up to Speed: Developing Fluency; and Module 6: Digging for Meaning: Teaching Text Comprehension. According to the publisher, the modules provide conceptual underpinnings for each topic that are based on research and best practice. We did not use all 12 LETRS modules because each requires nearly a full day of PD and the later modules cover advanced and specialized topics that were of less direct relevance to second-grade classrooms.

30
content with the participating teachers. Opportunities for individual, small-group, and whole-group active learning experiences were interspersed between segments of the core presentation. These activities included discussions linking the institute series content to teachers’ own students, completing exercises to reinforce lessons (e.g., on spelling patterns and word morphology), summarizing articles about reading research and presenting them to the whole group, and practicing instructional strategies. The institute series also included daily bridging activities designed to explicitly link the conceptual material in LETRS and the instruction that teachers expected to implement in their own classrooms using their core reading program.62 Further, the institute series contained components and activities related to assessment, analysis of students’ work, and differentiated instruction. For instance, teachers were provided with a diagnostic test that provided an assessment of students’ developmental levels in phonics and given a “homework” assignment to administer the test to their students. They were also taught how to calculate students’ fluency rates and evaluate students’ performance relative to grade-level standards. Teachers brought samples of their students’ writing and performance on assessments to institute and seminar days. These samples were the basis for trainer-facilitated discussions about the student needs indicated by the work samples as well as strategies teachers might use to address them.
Four facilitators delivered the content of the institutes and seminars. All were certified national LETRS facilitators mentored by Louisa C. Moats and had years of experience in delivering LETRS PD to elementary school teachers as well as to other audiences. Three facilitators held a doctorate in reading or a related area and one held a master’s degree in education, with a specialization in reading difficulties. They had 12 to 26 years of experience teaching children and 6 to 15 years of training teachers or providing other types of technical assistance to educators. All had served as consultants or advisors on reading issues to state and/or national agencies. One had served as president of the International Dyslexia Association and two others had authored some of the LETRS materials. Each facilitator served as the lead in one district, providing most of the institute series PD to the assigned district(s). In some districts, a second facilitator filled in when the lead was unavailable. The number of districts assigned to each facilitator ranged from one to four, based on the facilitator’s availability.
The training groups taught by each facilitator consisted of the regular second grade teachers from the treatment A and B schools as well as an average of 1.3 additional teachers from each school who worked with second grade readers (e.g., as special education or resource teachers.). In four districts, all of these teachers were taught together in one training group while in the two districts that had the largest number of schools, the teachers were split into two groups. Thus, the institutes and seminars were delivered to a total of 8 training groups. The number of regular teachers in these groups ranged from 8 to 38 and averaged 20; the total number of teachers in the training groups averaged 30.
The institute series was delivered over eight days, each of which was designed to provide 6 hours of instruction, exclusive of breaks, for a planned total of 48 hours of PD. Five of the days were institutes that introduced content and gave participants practice in applying it. The other three days were follow-up seminars during which some new content was introduced, but they were 62 For example, the bridging activity that concluded institute day 4 (vocabulary development) called for the teachers to select important vocabulary words from a story in the students’ reader that they would be teaching soon and to create a series of vocabulary development activities around them based on the theory and teaching methods presented earlier in the day. The teachers from each school worked together to plan vocabulary instruction around one story and then modeled the activities for the entire group of institute participants. See section II of appendix A for more information on the reading programs used in the study districts.

31
also designed to review earlier content and check teachers’ understanding. To ensure the consistency of the institute series PD across districts and facilitators, each day’s content and activities were guided by a common syllabus, presentation schedule, and PowerPoint slides that were used in all locations.
The institute and seminar days were delivered in the following order:
• Institute days 1–3, focusing on the challenges of learning to read, phonemic awareness, and phonics, with an introduction to analysis of student work samples, were delivered prior to the beginning of the school year.
• Seminar day 1, focusing on fluency and a discussion of analyzing student work samples, was held near the beginning of the school year.
• Institute day 4, focusing on vocabulary, was held soon after seminar day 1 (usually the following day).
• Seminar day 2, focusing on a review of phonics, phonemic awareness, analysis of student work samples, and an introduction to differentiated instruction, occurred in mid-fall to early winter.
• Institute day 5, focusing on comprehension, was held soon after seminar day 2 (usually the following day).
• Seminar day 3, focusing on a review of vocabulary, comprehension, analysis of student work samples, and differentiated instruction, was delivered in early to late winter.63
Interspersing the seminar days among the institute days was intended to give teachers time after the institute days to practice what they had learned and then refresh their knowledge and deepen their understanding of the content in a seminar before moving on to new topics.
Implementation of the Teacher Institute Series
To document the fidelity with which the planned institute series PD was delivered in each district, study staff observed each event while completing a detailed, low-inference fidelity observation form tailored to the day’s training agenda topics and subtopics. Study staff used the form to record information about each agenda subtopic of the day’s PD. In addition, teachers marked their arrival and departure times on a daily sign-in sheet, allowing researchers to calculate the number of hours of teacher participation (dosage). Data from the fidelity observations and sign-in sheets suggest that overall, the institute series was delivered and received as intended.
Fidelity
Across days and districts (see table 3-1):
• The total amount of PD delivered in each district through the institute series averaged 45 hours—equal to 93 percent of the planned 48 hours.
63 One exception to this pattern was a district that preferred to hold as much of the institute series as possible during the summer. In this district, all five institute days were held in the summer and the three seminars took place during the school year. There were 6 treatment A, 6 treatment B, and 6 control schools in this district.

32
• For 88 percent of the agenda subtopics, the format as delivered matched the planned format (e.g., lecture, small-group activities); and for 93 percent of the agenda subtopics, the content as delivered matched the planned content.
• For 98 percent of the institute series agenda subtopics, 80 percent or more of the participating teachers were engaged in the PD.
Table 3-1. Fidelity of Teacher Institutes and Seminars: Percent of Planned Institute Series Time Delivered (Duration) and Percent of Agenda Subtopics in Which the Format Matched the Plan, the Content Matched the Plan, and in Which More than 80 Percent of Teachers Were Engaged, Averaged Across Day and District
Percent of Agenda Subtopics in Which: Percent of
Planned PD Time
Delivered (Duration)
PD Format Matched Plan
Content Essentially
Matched Plan
Content Substantially
Differed From Plan
Content Did Not Occur
More than 80 Percent of Teachers
Were Engaged
Mean (percent) 93.5 87.5 92.5 3.7 3.9 97.8 Standard Deviation (percent) 2.2 5.2 3.5 2.3 2.1 0.9 Number of Training Groups = 8; PD Days (Institutes and Seminars) = 64 SOURCE: Early Reading PD Interventions Study Fidelity Form.
NOTES: Each day’s agenda was divided into several subtopics corresponding to the institute series curriculum content and planned delivery formats. The fidelity analysis assessed the degree to which the delivery of each PD agenda subtopic conformed to the intended content, format, and duration specified in the institute series plan.
Institute series delivery formats included trainer presentation, videos, individual activities, small-group activities, and whole-group activities. An exact match had to occur (e.g., both the planned and actual format was a small-group activity) to be considered a match.
Institute series content match to plan was operationalized as the percentage of planned PowerPoint slides covered by the trainer. Observers coded content match as either “essentially matched plan” (20 percent or fewer slides were deleted or added), “substantially differed from plan” (more than a 20 percent increase or decrease in slides), or “did not occur” if an agenda subtopic was dropped.
Observers recorded their summary impression of the extent to which teachers were engaged during each subtopic of the PD by marking one of three coding options: fewer than 50 percent of the teachers were engaged, 50–80 percent of the teachers were engaged, or more than 80 percent of the teachers were engaged. Teachers were considered not to be engaged if they held side conversations about non-PD topics, text messaged, or read materials unrelated to the study PD.
Amount of PD Received During the Institute Series by Teachers
Based on institute and seminar attendance records, treatment group A and B teachers attended an average of 35 hours, or 78 percent of the 45 implemented hours and 73 percent of the 48 planned hours of the study-provided institute series.64 The actual distribution of PD that had been received in each institute series topic area by the teachers who were teaching in the schools
64 This analysis is based on the Implementation Year Spring Sample of teachers who were teaching in the study schools in spring 2006, the end of the school year in which the treatment was delivered. This is the sample of teachers that is included in the impact analyses for teacher knowledge and teacher practice. Of the 181 teachers in this sample, 94 percent were “original” teachers who had taught in the schools during the fall semester when much of the PD was delivered, and 6 percent were teachers who had entered the schools during spring 2006. Teachers’ participation in the PD could be less than 100 percent for a variety of reasons (e.g., vacation, illness, or being hired at the school in early fall after some institute days had already occurred).

33
during spring of the implementation year is shown in table 3-2. This sample includes 181 teachers of whom 171 (94 percent) were “original” teachers who had taught in the schools during the fall and 10 (6 percent) were “late entries” who took over classrooms during spring 2006. The results in table 3-2 indicate the following:
• The amount of PD received during the institute series for each of the five essential components of reading instruction (phonemic awareness, phonics, fluency, vocabulary, and comprehension) ranged from 4.7 hours for fluency to 6.1 hours for vocabulary.
• The amount of PD received during the institute series included 2.4 hours for differentiating instruction and 3.0 hours for assessing student work.
Table 3-2. Mean Hours of Participation in Institute Series by PD Topic Area [Implementation Year Spring Sample]
Institute Series Topics Mean Hours Standard Deviation
Minimum Maximum
Phonemic Awareness 6.0 3.1 0 8.7 Phonics 5.9 3.0 0 9.1 Fluency 4.7 1.8 0 6.5 Vocabulary 6.1 2.2 0 7.4 Comprehension 5.9 2.4 0 7.5 Differentiating Instruction 2.4 1.1 0 3.9 Assessing Student Work Samples 3.0 1.2 0 4.4 Other (Surveys, Administrative) 1.4 0.7 0 2.3 Total Hours Across Topic 35.3 13.3 0 46.5 Number of Teachers = 181 SOURCE: Early Reading PD Interventions Study Institute and Seminar Sign-In Sheets.
NOTES: Hours may not sum to total due to rounding. Means were calculated by multiplying the minutes of content coverage for each day of the institute series (as recorded in fidelity forms) by the percentage of time each teacher attended that event and then summing across days. The 181 teachers in the Implementation Year Spring Sample include 171 “original” teachers and 10 “late entry” teachers.
Coaching
Treatment B added a half-time coach to each participating school to work with second grade teachers in applying the content learned in the institute series within the context of implementing their core reading program. All second grade teachers in treatment group B schools participated in the coaching, which began in early fall 2005 and continued until the end of the school year in spring 2006.
Description of the Coaches and the Coaching Structure
The coaching provided by the study was conducted by current or former educators from the school districts in which the study was conducted.65 They were recruited and selected by the participating districts and trained by the Consortium on Reading Excellence (CORE), the study’s
65 This is similar to an approach to staffing coaches that was used in a sample of states implementing Reading First, according to data from a survey of coaches. Among Reading First coaches surveyed in Alaska, Arizona, Montana, Washington and Wyoming, 61 percent were former teachers hired as coaches from within the school they had previously taught (Deussen, Coskie, Robinson and Autio 2007).

34
coach training provider. To qualify for consideration, candidates were required to have relevant experience in reading instruction (a minimum of five years) and/or instructional coaching and knowledge of phonemic awareness, phonics, fluency, vocabulary development, and reading comprehension instruction. Qualified candidates were interviewed by a committee usually consisting of the study’s contact in the district office, principals from the schools in which the coaches would work, and a member of the study’s PD team. The district made the final selection and placement decisions. The 19 coaches selected through this process were either current or retired district staff at the time they were selected. Based on background information they provided:66
• All had completed four-year undergraduate degrees (79 percent in elementary education).
• The majority (89 percent) had earned a master’s degree, and about half (53 percent) had earned other advanced academic or professional degrees or certificates.
• Most were experienced teachers (20 years on average), and 12 of the 19 had previously taught second grade.
• Seventeen had served in one or more administrative roles, including 3 who had been school principals, 3 who had been district administrators, 13 who had been instructional specialists, and 13 who had previous experience as a coach.
• Coaches had a significantly higher average total score on the Reading Content and Practice Survey (RCPS) than did the study teachers; specifically, the probability that the coaches would produce correct responses to the RCPS was 13 percentage points higher than the probability that the control teachers would do so.67
Coaches were given the choice of working half-time with one school or splitting a full-time position between two schools. Among the 19 coaches in the study, 8 worked in one school and 11 worked in two schools. All 30 treatment group B schools had a coach assigned to work with their second grade teachers for the equivalent of half-time during the 2005–2006 school year.
As part of the study’s treatment B, coaches were expected to split their weekly hours between contact time with teachers and preparation time. Although it was acknowledged in the coach training that the amount of coaching needed by individual teachers would vary, 2 hours per week per teacher was provided as an approximate guideline. It was expected that each teacher would receive coaching for about 30 weeks, or a total of 60 hours on average.68 This level of coaching was set for the study because it was believed to be within the reach of school districts seeking to
66 Information about the coaches’ professional backgrounds was collected in a survey that all 19 coaches completed in spring 2006.
67 As a check on their content knowledge, coaches were asked to fill out a baseline RCPS along with the teachers they would be coaching. Based on results from 17 of the 19 coaches, the average standardized score for coaches was 0.77 when the scores were standardized using the mean and standard deviation of the control group teachers. In terms of the probability of producing a correct answer to a typical item on the RCPS, the average coach had a 66 percent probability of producing a correct answer on a typical test item while the average control group teacher had a 53 percent probability of answering the item correctly. This analysis is discussed in more detail in chapter 6. 68 The number of contract days per school year in the six districts ranged from 185 (37 weeks) to 195 (39 weeks). The estimate of 30 weeks of coaching was based on the assumption that coaching would not occur during the first two to three weeks of the school year while teachers were setting up their classrooms and becoming familiar with their students; the three days preceding Thanksgiving, Christmas and the end of the school year; and the two to three weeks just before and during state testing.

35
implement the treatment locally while providing more-intensive support than the typical PD being offered nationally.69
Summary of the Training Provided to Coaches
The coaching component of treatment B, supported by CORE, was designed to increase teachers’ understanding of the content learned in the institute series and to provide them with ongoing support for applying their new knowledge and implementing their core reading program effectively.70 The coaches participated in three types of training to prepare for their roles and responsibilities:
• The eight institute and seminar days with their assigned teachers to become familiar with the teacher PD content.
• A three-day coaching institute attended by all the coaches and delivered by CORE trainers that focused on research, practice, and resources for coaching second grade teachers on their reading instruction.
• Four on-site follow-up training sessions delivered by CORE trainers in the coaches’ districts during the 2005–2006 school year. Each on-site training session lasted one to two days (a total of six days per district) during which trainers met with the coaches as a group, accompanied them on observations in teachers’ classrooms, and supported the coaches’ practice in areas related to the coaching institute.
In the initial three-day institute presented by CORE in Washington DC, coaches from all six districts were introduced to:
• The coach’s role in implementing effective reading instruction in the classroom
• How to coach individual teachers using a multi-step coaching cycle of initiating and planning; executing; reflecting and giving feedback71
• Understanding the purpose and use of various student assessments and ways to analyze data; and guiding and encouraging teachers to periodically assess students and graph their progress, and to use the information to address individual students’ needs, drawing on materials in the core reading program72
69 Based on survey responses from coaches in national samples of Reading First and other Title I schools, the interim report of the Reading First implementation evaluation (U.S. Department of Education 2006) estimated that each Reading First coach in mature Reading First schools worked with an average of 22 grade K-3 teachers on a full-time basis. In schools in the Early Reading PD Interventions Study, a full time coach worked with six teachers, on average. The study schools are similar in socioeconomic composition to those participating in Reading First and Title I. 70 CORE provides technical assistance and professional development for K–12 literacy programs, with a focus on scientifically-based reading instruction. More information is available at http://www.corelearn.com/. For the purposes of the study, two trainers with expertise in literacy coaching and the reading programs used in the district were assigned to the study to conduct both the coach institute and on-site training. The two trainers had experience as classroom teachers (3 years and 16 years) and had 3 to 4 years of' prior experience training literacy coaches before joining the study. 71 Topics included effective methods for documenting classroom observations and for framing feedback, questions, and suggestions in discussions with teachers. 72 The coach institute gave particular emphasis to summarizing and displaying results of progress assessments with the goal of helping teachers identify patterns of need in classrooms and thus facilitate their planning and delivery of interventions to their students.

36
• How to use a five-step problem-solving and decision-making model to facilitate grade-level meetings with the teachers, focused on building teachers’ capacity to examine student work and plan instruction.
The institute included opportunities for coaches to discuss and practice strategies related to implementing their roles. The institute also included opportunities for coaches and CORE trainers to connect the lessons learned to the specific contexts of the coaches’ districts and the core curricula being implemented.73
The amount of time spent on each of these topics in the coaching institute is shown in table 3-3.
Table 3-3. Hours of Coaching Institute Delivered, by PD Topic Area
Topic Hours
The coach’s role in implementing effective reading instruction 6.0 How to coach using a multi-step coaching cycle 6.0 Methods for guiding and encouraging teachers to periodically assess students 4.5 Purposes and methods for facilitating grade-level meetings 1.5 Total coaching institute hours 18.0 SOURCE: Early Reading PD Interventions Study Fidelity Form.
The initial coach institute was complemented by four on-site PD sessions (totaling six days)
provided to all of the coaches in each district by the CORE trainers from the institute. Half of the follow-up sessions were scheduled between September and December 2005 and the other half were scheduled between January and March 2006. During the on-site PD days, the coach trainers and coaches conducted observations in study teachers’ classrooms to provide a sample of instruction upon which to base discussions of teacher needs and coaching strategies. The on-site days provided individual coaches an opportunity to obtain assistance with problems they had encountered in their work, and they were designed to include a common set of activities focused on the content of the LETRS material and the core reading programs used in the coaches’ districts. For example, activities for the first on-site PD session included a review of the LETRS modules on phonology and phonics and the reading program’s supplementary materials for delivering differentiated instruction. During a later follow-up session, a LETRS trainer was on-site to help coaches review and practice LETRS instructional activities and instructional routines from the reading program.
Implementation of the Coaching
Coaches worked with the teachers in the treatment B schools throughout the 2005–2006 school year, beginning within two to three weeks of a school’s opening and continuing through late May or early June. As described in chapter 2, they completed daily logs of their activities that were used to estimate the nature and amount of coaching they provided to individual 73 In particular, the training included break-out sessions during which coaches worked in groups based on the reading program adopted in their district. In these sessions, which were led by a CORE trainer who had experience with the program, the coaches analyzed the program’s content, organization, pacing, assessments, supplemental materials, and implementation checklists to identify opportunities for the coaches to support their teachers in applying what had been learned in the institutes.

37
group B teachers during the year. Table 3-4 summarizes the coaching reported for the 88 group B teachers in the implementation year spring sample.74
• As intended, teachers were provided with an average of 62 hours of coaching over the course of the year, with a range of 1 to 173 hours per teacher.
• Coaching time was divided among four major activity components emphasized in the CORE intervention—planning (14.8 hours), observing and providing feedback on teachers’ instruction (15.6 hours), working with the teacher in the classroom (20.5 hours), and conducting grade-level meetings (10.6 hours).75
• Almost 80 percent of the coaching hours (49 out of 62 hours) addressed topics that were a focus of the study’s PD. The remainder of the time was spent on topics that were less directly emphasized by the PD, such as writing (composition); selecting and administering assessments; handwriting; and classroom management.
• Emphasis on the five components of reading instruction ranged from 1.7 hours for phonemic awareness to 11.7 hours spent on coaching related to reading comprehension instruction. The hours spent on the other three components of reading instruction were 6.0 for phonics, 5.8 for fluency, and 5.6 for vocabulary.76
To shed light on potential reasons for the range in hours of coaching per teacher (1 to 173 hours), we explored the possibility that coaches had varied the intensity of their coaching in response to measurable characteristics of the teachers or their students that would indicate a greater need for support—for example, devoting more time to teachers who had fewer years of teaching experience or experience with second grade students, teachers who were less knowledgeable about reading (as measured by their baseline RCPS scores), or who had higher proportions of struggling readers in their classrooms. These analyses are exploratory, and due to their non-experimental nature we can not make any causal inferences about the results. There was no relationship between coaching time and teachers’ experience, knowledge of reading content, or classroom composition.
74 Eighty-four (95 percent) of the implementation year spring sample of treatment B teachers were “original” teachers who were teachers of record in both fall 2005 and spring 2006, and 4 (5 percent) were late-entry teachers who entered the study during spring 2006. Teachers who were teachers of record in fall 2005 but not in spring 2006 (“attriters”) are excluded from the analysis. 75 Examples of coaches working in a teacher’s classroom include teaching a demonstration lesson to the teacher’s students, co-teaching a lesson with the teacher, or examining and interpreting students’ assessment results with the teacher. 76 Table 3-4 indicates that one or more teachers received no coaching in particular topic areas. Instances of receiving no coaching in key topic areas included: phonics (4 teachers), fluency (4), comprehension (3), interpretation of assessments (1) and differentiation of instruction (2). A total of 7 teachers logged 0 hours of coaching in vocabulary, and 13 logged zero hours in phonemic awareness. All of the teachers included in this summary were teachers of record in spring of the implementation year. The hours of coaching received by treatment B teachers who attrited during the implementation year (i.e., left the study too soon to be counted as the teacher of record in spring 2006) are not included in this summary.

38
Table 3-4. Hours of Coaching Provided to Treatment Group B Teachers During the Implementation Year, Overall and by Activity and Topic [Implementation Year Spring Sample]
Coaching Topics Mean Hours Per Teacher
Standard Deviation
Minimum Maximum
Total Hours of Coaching Activity 61.6 39.3 1.2 173.1 Total Hours on Topics That Were a Focus of the PD Program 48.7 32.1 1.1 137.5 Hours by Activity Total Planning Activities 14.8 12.9 0.0 58.1 Total Hours of Observation and Feedback 15.6 13.6 0.0 87.3 Total Hours Working in Teacher’s Classroom 20.5 18.9 0.0 97.7 Total Hours of Grade-Level Meetings 10.6 8.3 0.0 30.3 Hours on Topics That Were a Focus of the Study PD Phonemic Awareness 1.7 2.4 0.0 11.0 Phonics 6.0 5.0 0.0 25.3 Fluency 5.8 5.0 0.0 21.0 Vocabulary 5.6 5.6 0.0 24.1 Comprehension 11.7 10.3 0.0 43.3 Spelling 2.1 3.3 0.0 18.0 Assessment: Interpretation of Results 5.8 4.2 0.0 18.6 Differentiation of Instruction 9.2 8.3 0.0 31.3 General Checking in 0.9 1.7 0.0 12.2 Hours on Topics That Were Not a Focus of the Study PD Writing 3.8 4.7 0.0 24.6 Assessments: Creation, Selection, or Administration 4.2 3.4 0.0 13.5 Other Topics 4.8 4.1 0.0 22.1 Number of Coaches = 19, Coaching Logs = 384 Total, Teachers Coached = 88 SOURCE: Coaching Activity Logs.
NOTES: The 19 coaches submitted a total of 384 bi-weekly logs. Seven coaches did not turn in 1 or more logs for recording periods between August 2005 and May 2006 (a total of 12 missing logs). For all but 5 of the missing logs, we determined that little or no coaching activity had occurred during the undocumented period (see section II of appendix H for details). For the 5 missing logs that should have been completed, we imputed coaching contact hours for each of the coach’s teachers by multiplying the teacher’s total annual hours of contact with the coach in each activity and topic category by the following quantity: (total number of documented periods + total number of undocumented periods) / (total number of documented periods). All 88 of the teachers in this analysis—including those with 0 hours of coaching on various topics—were teachers of record in spring of the implementation year; 84 (94 percent) of them had also been teachers of record in fall of the implementation year. Teachers who left the study before the spring (“attriters”) are excluded from the analysis.
However, we found three factors that were associated with the variations in teachers’
exposure to coaching:77
• The length of time the teacher worked in the coach’s assigned school during 2005–2006. Teacher turnover occurred throughout the school year: one eighth of the treatment B teachers in the implementation year spring sample taught fewer than nine months in 2005-2006 due to late entry into the school, an early departure, or taking time off from
77 To explore factors that might be associated with the hours the coaches worked with each teacher, we conducted OLS regressions in which the predictors for a teacher’s coaching contact hours included (1) the number of months the teacher was in the school during 2005–2006; (2) the number of teachers in the school served by the coach; (3) the teacher’s possession of a regular teaching credential; (4) the teacher’s score on the baseline teacher knowledge test; (5) years of experience teaching overall; (6) years teaching second grade; and (7) years using the reading program. The factors that were associated with the hours of coaching at a statistically significant level were the first three factors listed in the previous sentence.

39
teaching during the school year. Longer stays in the school were associated with more coaching hours.78
• The number of other teachers in the same school with whom the teacher shared the coach. Within-school coaching loads of the individual coaches ranged from two to six teachers. Sharing a coach with more colleagues was associated with fewer coaching hours.
• The teaching credential held by the teacher. A lack of a regular teaching credential was associated with more coaching contact hours, although only nine teachers self-reported having no teaching credential.
Other possible, but unmeasured factors could be hypothesized to have influenced the amount of time coaches spent with individual teachers:
• The teacher’s willingness to accept the coach’s offers of help and guidance;
• The availability of meeting times in the school schedule; and
• The coach’s estimation of the teacher’s needs relative to those of other teachers for whom he or she was responsible.
However, testing these hypotheses is outside the scope of the study.
Comparison of the Professional Development Experienced by Treatment and Control Groups
In addition to the PD interventions provided by the study to teachers in treatment A and B schools, teachers in all three groups could have participated in the business as usual PD provided by their district. Thus, it would be possible for teachers in the control group to seek out more non-study PD opportunities than treatment group teachers and thereby reduce the effective contrast between the treatment and control groups. To test whether the PD as implemented for the study resulted in the intended service contrast (i.e., difference in amount of PD experienced) between treatment and control groups, we used data on professional development from the fall 2006 and spring 2006 teacher surveys, which had been administered to teachers in all three treatment groups.
To determine whether treatment group A and B teachers did in fact participate in more reading PD than teachers in the control group, and whether treatment group B teachers participated in more coaching than treatment group A or control teachers, we conducted a two-level HLM analysis of teachers’ self-reported hours of participation in study-relevant PD. We used survey responses to create three PD participation variables: hours spent in workshops/institutes (lasting more than a half day) related to reading instruction during summer 2005, hours spent in workshops/institutes (lasting more than a half day) related to reading instruction during the 2005–2006 school year, and hours spent receiving coaching or mentoring related to reading
78 The teachers in the analysis of coaching hours were the 88 teachers of record in second grade classrooms in treatment B schools during spring 2006. Teachers of record did not necessarily teach continuously in their classrooms throughout the 2005-2006 school year: some were absent for part of the year due to illness or the birth of a child; others took over another teacher’s classroom after the school year had started; and others left their schools in late spring. The number of months these teachers were in the schools and thus available to work with a coach ranged from four to nine.
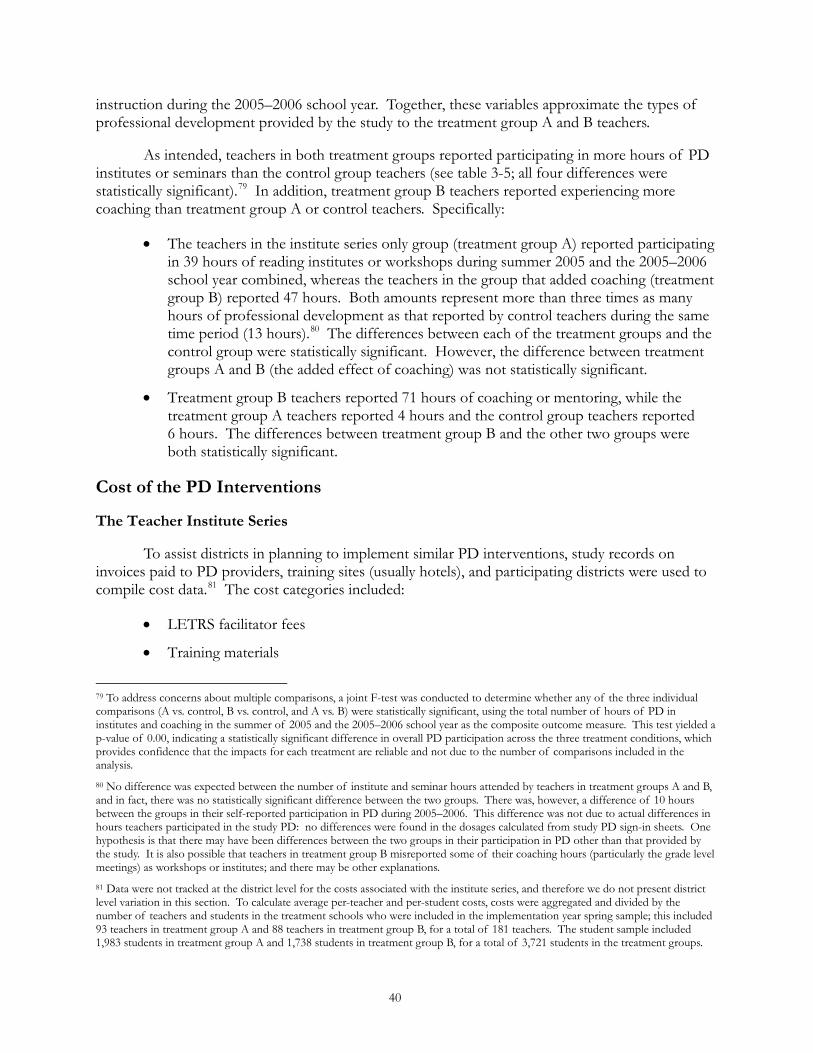
40
instruction during the 2005–2006 school year. Together, these variables approximate the types of professional development provided by the study to the treatment group A and B teachers.
As intended, teachers in both treatment groups reported participating in more hours of PD institutes or seminars than the control group teachers (see table 3-5; all four differences were statistically significant).79 In addition, treatment group B teachers reported experiencing more coaching than treatment group A or control teachers. Specifically:
• The teachers in the institute series only group (treatment group A) reported participating in 39 hours of reading institutes or workshops during summer 2005 and the 2005–2006 school year combined, whereas the teachers in the group that added coaching (treatment group B) reported 47 hours. Both amounts represent more than three times as many hours of professional development as that reported by control teachers during the same time period (13 hours).80 The differences between each of the treatment groups and the control group were statistically significant. However, the difference between treatment groups A and B (the added effect of coaching) was not statistically significant.
• Treatment group B teachers reported 71 hours of coaching or mentoring, while the treatment group A teachers reported 4 hours and the control group teachers reported 6 hours. The differences between treatment group B and the other two groups were both statistically significant.
Cost of the PD Interventions
The Teacher Institute Series
To assist districts in planning to implement similar PD interventions, study records on invoices paid to PD providers, training sites (usually hotels), and participating districts were used to compile cost data.81 The cost categories included:
• LETRS facilitator fees
• Training materials
79 To address concerns about multiple comparisons, a joint F-test was conducted to determine whether any of the three individual comparisons (A vs. control, B vs. control, and A vs. B) were statistically significant, using the total number of hours of PD in institutes and coaching in the summer of 2005 and the 2005–2006 school year as the composite outcome measure. This test yielded a p-value of 0.00, indicating a statistically significant difference in overall PD participation across the three treatment conditions, which provides confidence that the impacts for each treatment are reliable and not due to the number of comparisons included in the analysis. 80 No difference was expected between the number of institute and seminar hours attended by teachers in treatment groups A and B, and in fact, there was no statistically significant difference between the two groups. There was, however, a difference of 10 hours between the groups in their self-reported participation in PD during 2005–2006. This difference was not due to actual differences in hours teachers participated in the study PD: no differences were found in the dosages calculated from study PD sign-in sheets. One hypothesis is that there may have been differences between the two groups in their participation in PD other than that provided by the study. It is also possible that teachers in treatment group B misreported some of their coaching hours (particularly the grade level meetings) as workshops or institutes; and there may be other explanations. 81 Data were not tracked at the district level for the costs associated with the institute series, and therefore we do not present district level variation in this section. To calculate average per-teacher and per-student costs, costs were aggregated and divided by the number of teachers and students in the treatment schools who were included in the implementation year spring sample; this included 93 teachers in treatment group A and 88 teachers in treatment group B, for a total of 181 teachers. The student sample included 1,983 students in treatment group A and 1,738 students in treatment group B, for a total of 3,721 students in the treatment groups.

41
Table 3-5. Teacher-Reported Hours of Participation in Study-Relevant Professional Development During Summer 2005 and the 2005–2006 School Year, by Treatment Group [Implementation Year Spring Sample]
Outcome
Institute Series Only (Group A)
Institute Series Plus Coaching (Group B)
Control Group Difference P-value
Summer 2005 PD Institutes or Seminars in Reading (Hours)
Institute Series Only vs. Control 15.0 4.8 10.2* 0.01 Institute Series Plus Coaching vs. Control 13.2 4.8 8.4* 0.01 Institute Series Plus Coaching vs. Institute
Series Only 15.0 13.2 1.8 0.51
2005–2006 School Year PD Institutes or Seminars in Reading (Hours)
Institute Series Only vs. Control 24.0 8.1 15.8* 0.00 Institute Series Plus Coaching vs. Control 33.6 8.1 25.4* 0.00 Institute Series Plus Coaching vs. Institute
Series Only 24.0 33.6 9.6 0.08
Coaching (Hours)
Institute Series Only vs. Control 3.8 6.0 2.3 0.67 Institute Series Plus Coaching vs. Control 70.9 6.0 64.9* 0.00 Institute Series Plus Coaching vs. Institute
Series Only 3.8 70.9 67.2* 0.00
Sample Size: For Summer 2005 Analyses, N = 90 Schools, 238 Teachers (32 missing cases); for 2005–2006 School Year Analyses, N = 90 Schools, 248 Teachers (22 missing cases). SOURCE: Early Reading PD Interventions Study 2005 Teacher Background Survey and 2006 Teacher PD Survey.
NOTES: The treatment and control columns display regression-adjusted mean outcomes for all three groups, evaluated at the control group mean values for all covariates in the regression model.
Two-tailed statistical significance at the p < .05 level is indicated by an asterisk (*).
• Facility fees, including space and technology rental and food for participants
• Substitute teacher fees for PD events held on a school day, or teacher stipends for PD events held on weekends or during the summer (outside of regular contract hours)
The costs associated with the PD reflect costs that districts would incur if they implemented the PD themselves (i.e., the study did not receive any discounts on the PD) and did not have to pay for any development costs. One category of costs that may differ for districts, however, is facilities and food; districts may have their own training space within the district or school buildings, and be able to provide food at trainings at a cost that is below that of hotel catering.
The overall, per-teacher, and per-student costs associated with implementing the teacher institute series for both treatments are provided in table 3-6. The total cost across the six study districts was $868,259. The cost per teacher for the institute and seminar series was $4,797. Converting this number into a per student cost yielded $233.

42
Table 3-6. Cost of the Eight Day Institute Series Professional Development During Summer 2005 and the 2005–2006 School Year, Overall and by Cost Category
Cost Category Overall Cost Average Per
Teacher Cost Average Per Student Cost
LETRS Facilitator Fees $272,566 $1,506 $73 Training Materials $67,040 $370 $18 Facilities and Food $167,160 $924 $45 Substitute Teacher Fees or Teacher Stipends $361,493 $1,997 $97 Total Institute Series Cost $868,259 $4,797 $233 SOURCE: Early Reading PD Interventions Study records on invoices paid to PD providers, training sites, and districts.
Teacher Institute Series Plus Coaching
The treatment group B teachers participated in both the institutes and seminars (see above) and the in-school coaching. The costs associated with the coaching component of the intervention during the 2005–2006 school year include the following:
• The coaches’ salaries and benefits82
• CORE and LETRS facilitator fees for training the coaches (includes materials)
As shown in table 3-7, the overall cost of the coaching across the six districts was $1,368,758. The average cost per treatment group B teacher for the coaching was $15,554, with $12,547 of this cost comprised of the coaches’ salaries. The total cost per teacher for the full treatment B intervention (the combined cost of the coaching and the institutes and seminars) was $20,351. Similarly, the cost per treatment group B student for the coaching was $788, which added to the cost of the institute series totaled $1,021 per student for the treatment B intervention.
Table 3-7. Cost of Treatment B, Overall and by Cost Category
Cost Category Overall Cost Average Per
Teacher Cost Average Per Student Cost
Coach Salaries and Benefits $1,104,123 $12,547 $635 CORE/LETRS Facilitator Fees $264,635 $3,007 $152 Total Coaching Cost $1,368,758 $15,554 $788 Total Treatment B Cost (Coaching Plus Institute Series) $2,237,017 $20,351 $1,021 SOURCE: Early Reading PD Interventions Study records on invoices paid to PD providers, coaches, and districts.
82 The coaches’ loaded salaries ranged from $28,263 for a half-time coach working with one school to $104,450 for a full-time coach working with two schools. When half-time salaries are converted to full-time, the average loaded full-time salary for a study coach was $66,513 (s.d. = 20,458). In the Early Reading PD Interventions Study, the coach-to-teacher ratio is higher than is currently typical in low-performing districts (U.S. Department of Education 2006) and so the per-teacher cost is higher than it would be in situations where the coaching is less intensive.

43
CHAPTER 4
IMPACT OF THE TWO PD INTERVENTIONS DURING THE
IMPLEMENTATION YEAR
Chapter 3 described the PD interventions tested and showed that the two interventions were delivered as intended. This chapter examines whether the professional development that was provided had an impact on the three outcomes that were the focus of the study: teachers’ knowledge of reading content and pedagogy, teachers’ instructional practice, and student achievement.
Understanding the Impact Tables
The analyses in this chapter focus on the spring of the implementation year, to examine the immediate impact of the PD in the year it was delivered. As explained in chapter 2, we randomly assigned schools to treatment A, treatment B, and a business as usual control condition, and therefore data were collected on all teachers and students in the schools in the spring, even though teachers and students may have left or entered the schools during the year.83
Throughout the report, when a table is presented to report estimated impacts, the mean outcome levels for the institute series only (treatment group A), the institute series plus coaching (treatment group B), and the control group are reported to provide context for interpreting the estimated differences. The impacts were estimated using a regression model that utilizes all available observations from treatment A, treatment B, and the control group, including information on baseline covariates, and the mean outcome levels were calculated using the same model. 84,85
When calculating the regression-adjusted mean outcome levels for treatment group A, treatment group B, and the control group, the adjustments were made using the observed mean covariate values for the control group. In other words, means for all three groups are “regression adjusted” using this common set of baseline covariate values, the control group mean.
83 The original sample of participating teachers changed as some teachers departed (attrited) and others joined the study as “late entries.” The teacher impact analyses described in this chapter are based on semester-specific samples in which each regular second grade classroom is represented by one “teacher of record” of the students in the classroom. In cases where one teacher began the semester in a classroom and another teacher completed the semester there, the teacher of record is defined as the teacher who spent the greatest amount of time in the classroom during the semester. The teacher of record is included in the analysis sample and the other teacher is excluded. The 270 teachers in the analysis sample include 258 (96 percent) original teachers and 12 (4 percent) late-entry teachers. As shown in table 2-4 original (or “stable”) teachers comprised 94 percent of the treatment group A sample, 95 percent of the treatment group B sample, and 96 percent of the control group sample in spring 2006. The student impact analyses are based on all second grade students in the study schools in the spring of the implementation year. 84 Additional technical details on the psychometric properties of the outcome measures used in the impact analyses are presented in sections IV and V of appendix D (RCPS), sections IV and V of appendix E and section III of appendix F (classroom instruction). Appendix J provides details on estimation methods, and appendix L provides supporting tables. Tables reporting impact estimates and group means without covariate adjustment are provided in section I of appendix L. 85 See chapter 2 and section I of appendix J for a discussion of the covariates included in the impact regression model. Covariates were included to take into account variation among schools, teachers, and students at baseline and to improve the precision of the impact estimates.

44
By adjusting based on the observed mean covariate values for the control group, the tables report:
• The observed mean outcome levels for schools randomly assigned to the control group; and
• The regression adjusted mean outcome levels for schools randomly assigned to treatment group A and treatment group B, using the observed mean covariate values for the control group as the basis for the adjustments.
The reported treatment group A and B means represent how the schools in the control group would have performed had they been assigned to treatment group A or B.
Separate estimates of the impact of the treatments were obtained for each of the six districts included in the study. The impacts shown in the tables were obtained by averaging the estimated impacts across the six districts, weighting each district by the number of treatment schools included in the district sample. The treatment A, B, and control group means also were obtained by averaging the estimated means across the six districts.
The results presented in this chapter and in chapter 5 are based on an intent to treat (ITT) analysis that includes all teachers in the sample schools at the time of outcome data collection, along with their students. Thus, the impact estimates reflect the impact of assignment to the treatment conditions. However, not all teachers who taught in the treatment A and B schools at the time of outcome data collection had the opportunity to receive a full dose of the treatment. In chapter 6 and appendix M, we discuss a non-experimental analysis focusing only on teachers who were present throughout the period of the study.
To put the outcome variables in a common metric, we standardized the variables. For teachers’ knowledge and instructional practices, we used the teachers in the control group as the basis for standardization. Thus teachers in the control group have a mean of zero and a standard deviation of one. For student achievement, because the test in use differed across districts, scores were standardized within each district, using the scores in the 2004–2005 student baseline sample as the basis for standardization. This allows us to aggregate the test score results across districts.86
The tables report the standard error and p-value for each impact estimate. As a result of the random assignment of schools to treatment conditions, some differences in group means could have occurred simply due to chance. The standard error indicates the magnitude of the uncertainty about the true mean of each impact, given the number of schools, teachers, and students involved in the analysis. The p-value indicates the chance of obtaining an impact as large as the estimated impact, if in fact there were no true impact. Results are considered statistically significant if the p-value is .05 or lower, indicating that there would be no more than a 5 percent chance of obtaining an impact as the one if there were no true effect. Results that are not statistically significant may have occurred due to chance, and thus do not provide strong evidence about the impact of the treatments.
86 See section II of appendix J for details on the standardization of outcome variables.

45
Impacts on Teachers: Knowledge of Early Reading Content and Instruction and Use of Instructional Practices in the Classroom
Knowledge of Early Reading Content and Instruction (RCPS Scores)
As described in chapter 2, an assessment of teachers’ knowledge of reading content and instruction—the RCPS—was administered to all second grade teachers in study schools both at the outset and nearing the end of the implementation year (2005–2006).87 We examined the impact of the PD interventions on teachers’ overall scores on the assessment, as well as their scores on two subscales: word-level knowledge (phonemic awareness, phonics, and fluency) and meaning-level knowledge (vocabulary and comprehension).
A two-level hierarchical model with teachers nested within schools was used to estimate the impacts of the professional development on the three teacher knowledge measures. To improve the precision of the estimates, teachers’ baseline total knowledge scores, educational level, teaching experience, and experience with the reading program were included as covariates in the model.
Table 4-1 summarizes the results of these analyses.88 Specifically:
• Teachers in schools randomly assigned to the institute series either alone (treatment A) or in conjunction with coaching (treatment B) had significantly higher overall knowledge scores on the spring RCPS than did teachers who did not have access to the study PD (the control condition), with effect sizes of 0.37 and 0.38, respectively. To put these results into more practical terms, on average, 57 percent of the teachers in treatment groups A and B gave a correct answer to a typical item on the assessment, compared with 51 percent of teachers in the control group.89
• Teachers in the study’s two PD groups also had significantly higher scores on the word-level knowledge subscale than did control group teachers, with effect sizes of 0.35 for the institute series only group and 0.39 for the institute series plus coaching group.
• The estimated effect sizes for the impact of the PD treatments on the meaning-level subscale were not statistically significant (0.21 for the treatment A group and 0.26 for the treatment B group).
87 As described above, the analyses of the impact of the PD interventions on student outcomes for the implementation year included all second graders enrolled in the study schools in the spring of 2006, and the analysis for the follow-up year included all students enrolled in the spring of 2007. Demographic characteristics for these student samples are presented in section I of appendix G. Background characteristics for the teachers included in the impact analyses are presented in section III of appendix C. 88 To address concerns about multiple comparisons, a joint F-test was conducted to see whether any of the three individual comparisons (A vs. control, B vs. control, and A vs. B) are statistically significant for the total teacher knowledge score. This test yields a p-value of 0.02, indicating a statistically significant difference among this group of findings (three comparisons for one outcome measure). This finding provides confidence that the observed impacts for individual teacher knowledge outcomes is reliable, and not simply due to the number of tests conducted. 89 To put these results into context, chapter 6 provides norming data on how content experts, coaches, control group teachers, and nonexperts (research assistants with no teaching experience) scored on the RCPS. The range of probabilities for getting a typical item correct on the RCPS was 46 percent (for nonexperts) to 81 percent (for content experts). At baseline, the study coaches were within this range at 66 percent. To calculate the probabilities, logits were converted to percents using the formula ey/(1+ey), where y is the score in logits.

46
Table 4-1. Impact of the PD Interventions on Teacher Knowledge: Total Score, Word-Level Score, and Meaning-Level Score [Implementation Year Spring Sample]
Outcome
Institute Series Only (Group A)
Institute Series Plus Coaching (Group B)
Control Group
Impact (Effect Size)
Standard Error of the Estimated
Impact P-value
Total Score (standardized) Institute Series Only vs.
Control 0.35 –0.01 0.37 0.15 * 0.02
Institute Series Plus Coaching vs. Control
0.37 –0.01 0.38 0.15 * 0.01
Institute Series Plus Coaching vs. Institute Series Only
0.35 0.37 0.01 0.15
0.92
Word Score (standardized)
Institute Series Only vs. Control
0.35 0.00 0.35 0.15 * 0.03
Institute Series Plus Coaching vs. Control
0.39 0.00 0.39 0.15 * 0.01
Institute Series Plus Coaching vs. Institute Series Only
0.35 0.39 0.04 0.15
0.77
Meaning Score (standardized)
Institute Series Only vs. Control
0.19 –0.02 0.21 0.19
0.27
Institute Series Plus Coaching vs. Control
0.24 –0.02 0.26 0.19
0.17
Institute Series Plus Coaching vs. Institute Series Only
0.19 0.24 0.05 0.19
0.80
Sample Size: N = 90 schools, 248 teachers (22 missing cases).
SOURCE: Spring 2006 Early Reading PD Intervention Study Reading Content and Practice Survey.
NOTES: The teacher outcome variables were standardized by using the overall control group mean and standard derivation.
The treatment and control columns display regression-adjusted mean outcomes for all three groups, evaluated at the control group mean values for all covariates in the regression model.
Two-tailed statistical significance at the p < .05 level is indicated by an asterisk (*).

47
• As expected, the coaching component had no statistically significant effect on the measures of teacher knowledge, above and beyond the effect of the institute series alone (comparing treatments A and B).90
All the impacts above reflect an average across the six study districts. To the degree that there is variation in impacts across the districts, the overall average may mask differences in the effectiveness of the PD interventions under different conditions. We conducted an F-test to determine if the impact of the PD interventions on teacher knowledge outcomes differed by district and found that they did not. See section V of appendix L for details.91
Use of Explicit Instruction, Independent Student Activities, and Differentiated Instruction During Reading Instruction
Observations of classroom instruction in reading were conducted for second grade teachers in the study schools in the spring of the implementation year (2005–2006; see section V of appendix F for descriptive statistics on teacher practices). The three outcome measures derived from those observations focus on three types of practices that the PD interventions encouraged teachers to employ in the classroom: teacher-led explicit instruction, independent student activity, and differentiated instruction.
A two-level hierarchical model with teachers nested within schools was used to estimate the impacts of the PD interventions on the three teacher practice measures. To improve the precision of the estimates, teachers’ baseline total knowledge scores, educational level, teaching experience, experience with the reading program, class size, and percentage of students in the class one or more years below grade level were included as covariates in the model. Baseline scores for teacher practice outcomes were not available and hence could not be included as covariates.
Table 4-2 shows the impact of the PD interventions on the three measures of instructional practices in reading.92 According to the results:
• Teachers in schools randomly assigned to the institute series alone (treatment A) engaged in significantly more explicit instruction than did the control teachers who had no exposure to the study PD (effect size = 0.33). To put these results in more practical terms, on average, teachers in treatment group A engaged in explicit instruction during 51 percent of the 3-minute intervals in which observations were conducted, whereas control group teachers engaged in explicit instruction during 42 percent of the 3-minute observation intervals.
90 The lack of difference between the two treatment groups on the RCPS is consistent with the study’s hypotheses. Coaching, which was part of treatment B but not treatment A, was focused on changing practice rather than knowledge. Its primary function was to help teachers practice what they learned, not to increase the level of teacher knowledge per se. 91 We also conducted an exploratory analysis to determine whether the impact of the PD interventions on teacher knowledge differed for teachers who had a weak or strong knowledge of reading content and instruction (as measured by the RCPS) at the beginning of the study. To examine this possibility, we estimated a model in which the baseline teacher knowledge score was interacted with the treatment. No significant interactions were found. See section II of appendix L. 92 To address concerns about multiple comparisons, a joint F-test was conducted to determine whether any of the three individual comparisons (A vs. control, B vs. control, and A vs. B) are different from zero using an index that combines three teacher practice measures as the dependent variable. This test yields a p-value of 0.04, indicating that a statistically significant difference exists among groups on the composite outcome. This finding provides confidence that the observed impacts for individual teacher practice outcomes is reliable, and not simply due to the number of tests conducted.

48
Table 4-2. Impact of the PD Interventions on Teacher Practices in Reading Instruction: Teacher-Led Explicit Instruction, Independent Student Activity, and Differentiated Instruction [Implementation Year Spring Sample]
Outcome
Institute Series Only (Group A)
Institute Series Plus Coaching (Group B)
Control Group
Impact (Effect Size)
Standard Error of the Estimated
Impact P-value
Teacher-Led Explicit Instruction (standardized) Institute Series Only vs.
Control 0.34 0.01 0.33 0.14 * 0.03
Institute Series Plus Coaching vs. Control
0.54 0.01 0.53 0.14 * 0.00
Institute Series Plus Coaching vs. Institute Series Only
0.34 0.54 0.21 0.15
0.16
Independent Student Activity (standardized)
Institute Series Only vs. Control
0.05 0.00 0.05 0.15
0.74
Institute Series Plus Coaching vs. Control
0.22 0.00 0.22 0.15
0.15
Institute Series Plus Coaching vs. Institute Series Only
0.05 0.22 0.17 0.15
0.28
Differentiated Instruction (standardized)
Institute Series Only vs. Control
–0.03 0.01 –0.05 0.14
0.73
Institute Series Plus Coaching vs. Control
0.00 0.01 –0.02 0.13
0.89
Institute Series Plus Coaching vs. Institute Series Only
–0.03 0.00 0.03 0.13
0.82
Sample Size: N = 90 schools, 258 teachers (12 missing cases).
SOURCE: Spring 2006 Early Reading PD Intervention Study Classroom Observation Protocol.
NOTES: The teacher outcome variables were standardized by using the overall control group mean and standard derivation.
The treatment and control columns display regression-adjusted mean outcomes for all three groups, evaluated at the control group mean values for all covariates in the regression model.
Two-tailed statistical significance at the p < .05 level is indicated by an asterisk (*).

49
• Teachers in schools randomly assigned to the institute series plus coaching (treatment B) also engaged in significantly more explicit instruction than control group teachers (effect size = 0.53). On average, teachers in treatment group B engaged in explicit instruction during 57 percent of the observation intervals compared with 42 percent for the control teachers.93
• There were no statistically significant effects for treatment A or B on the use of independent student activity or differentiated instruction in the classroom. There was an estimated effect size of 0.22 for the impact of treatment B on the use of independent student activity, but this effect was not statistically significant, and so could be due to chance. All other effect sizes for those measures were close to zero.
• The coaching component had no statistically significant effect on our measures of teacher practice, above and beyond that of the institute series alone. For example, the difference in the impact of treatment B versus treatment A was 0.21 for the use of explicit instruction. This difference was not statistically significant and may be due to chance. On average, teachers in treatment group B engaged in explicit instruction in 57 percent of the observation intervals, compared with 51 percent for treatment group A teachers.
The impacts above reflect an average across the six study districts. To the degree that there is variation in impacts across the districts, the overall average may mask differences in the effectiveness of the PD interventions under different conditions. We conducted an F-test to determine if the impact of the PD interventions on the teacher practice outcomes differed by district and found no district differences in the impact of the treatments on explicit instruction or independent study activity. We found a statistically significant district difference in the impact of the treatments on differentiated instruction.94
Impact on Students: Reading Achievement
As described in chapter 2, the analysis of the impact of the PD interventions on reading achievement is based on the existing student achievement tests administered in the study schools, and these tests primarily measured reading comprehension. Student scores on these tests were compiled from the six districts in the study. The analysis focused on two measures based on these scores: a continuous standardized measure of reading achievement and a dichotomous measure indicating whether or not students scored above the average score for their district’s baseline year (2004–2005) cohort. The impacts of the PD interventions on student reading achievement were
93 In treatment group B, as described in chapter 3, some coaches worked with one school, and some worked with two. For cases in which two schools shared a coach, the outcomes for the schools are not statistically independent. To test the sensitivity of the results to this potential lack of independence among schools, we conducted a separate analysis in which we combined schools that shared a coach into “pseudo-schools.” The results from these analyses are essentially the same as the results from the model not incorporating coach clustering. See section III of appendix L for details. 94 In one district, there was a significant negative effect of treatment B versus treatment A on differentiated instruction; in the remaining districts, the treatment B versus A effect could not be reliably distinguished from 0. See section V of appendix L for details. We also conducted an exploratory analysis to determine whether the impact of the PD interventions on teachers’ instructional practice differed for teachers who had a weak or strong knowledge of reading content and instruction (as measured by the RCPS) at the beginning of the study. To examine this possibility, we conducted an interaction in which the baseline teacher knowledge score was interacted with the treatment. No significant interactions were found. See section II of appendix L for details.

50
estimated by using a three-level hierarchical model with students nested within teachers and teachers nested within schools.
Table 4-3 shows the impact of the PD interventions on the two measures of student achievement in reading for the full sample of students in the study: (1) mean total reading test scores (standardized in effect sizes), and (2) a dichotomous measure of the percentage of students who performed at or above the average reading score of the baseline cohort.95 Overall:
• There was no evidence of statistically significant impacts on second grade student reading achievement, as measured, for either the institute series alone (treatment A) or in combination with coaching (treatment B) when compared to the control group.
• Similarly, there were also no statistically significant differences in the average reading scores between second graders in treatment group A schools and second graders in treatment group B schools; that is, the study’s coaching intervention did not have an independent effect on district test scores.96
• None of the comparisons among the three study groups yielded statistically significant differences on the dichotomous outcome measure. On average, 55 percent of second grade students from treatment group A schools scored at or above the mean reading score of the baseline cohort, 50 percent of second grade students from treatment group B schools scored at or above that level, and 53 percent of second grade students from control group schools reached that level.
As in the analysis of the impact of the PD interventions on teacher knowledge and instructional practice, the impacts presented above reflect an average across the six study districts. An F-test confirmed that there were no statistically significant differences across the districts in the achievement impacts for either PD intervention.97
Although none of the estimated impacts on student reading achievement were statistically significant, it is worth putting the effect into context. Calculations based on national norming samples for seven major standardized tests show that during second grade, an average student’s reading achievement test score grows 0.57 standard deviations in effect size (Hill, Bloom, Black, and Lipsey 2007).98 Therefore, the impact experienced by the treatment group A students (0.08), though not statistically significant, represents 14 percent of the annual growth for a second grade student.99
95 A joint F-test using an index that combined the two achievement measures as the dependent variable confirmed that there was no statistically significant difference among the two treatment groups and the control group (p-value = 0.69). 96 Note that the average standardized scores for both treatment and control groups are above zero, indicating that, on average, all three groups performed better than the baseline cohort mean. 97 See section V of appendix L. We also conducted an exploratory analysis to determine whether the impact of the PD interventions on student achievement differed for students whose teachers had a weak or strong knowledge of reading content and instruction (as measured by the RCPS) at the beginning of the study. To examine this possibility, we conducted an interaction in which the baseline teacher knowledge score was interacted with the treatment. No significant interactions were found. See section II of appendix L for details. 98 The seven tests are the CAT5, SAT9, Terra Nova CTBS, Gates-MacGintie, MAT8, Terra Nova CAT, and SAT10. 99 For comparison purposes, the estimated impact of 0.08 standard deviations is equivalent to about 40 to 80 percent of the impacts derived from the Tennessee Class Size Experiment (0.10 to 0.20 standard deviations), which found that reducing elementary school classes from their standard size of 22 to 26 students to 13 to 17 students significantly increased average student performance (Nye, Konstantopoulos, and Hedges 1999).
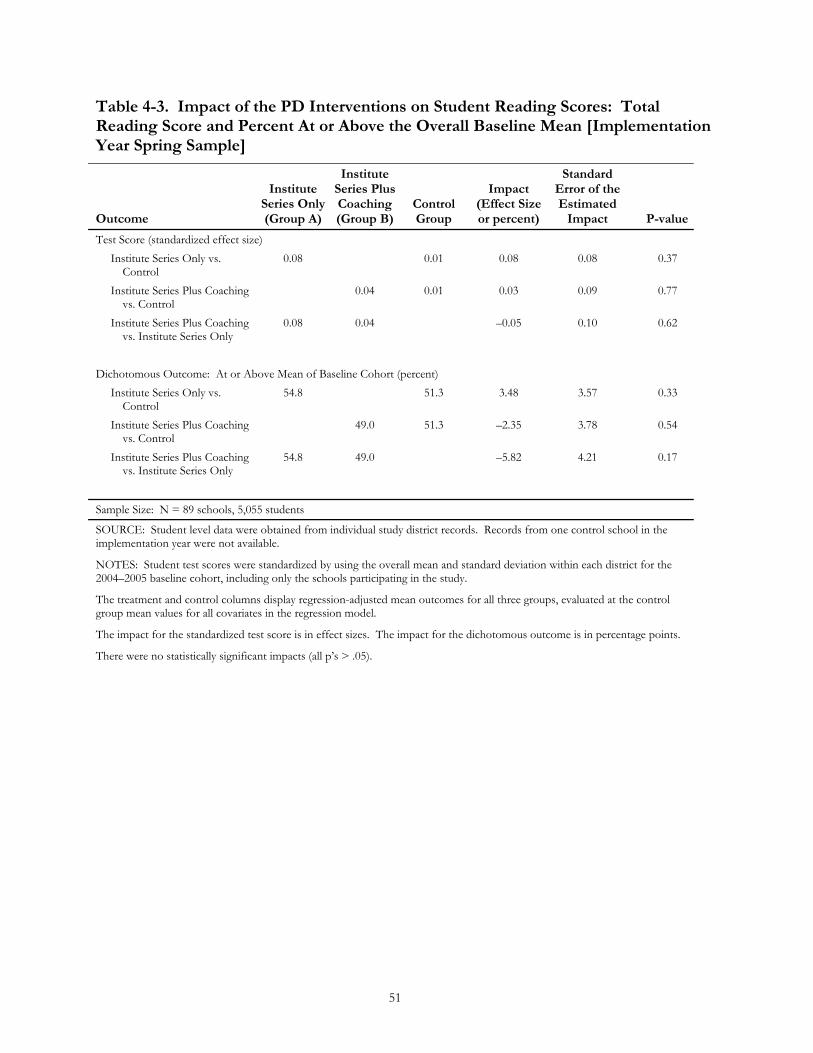
51
Table 4-3. Impact of the PD Interventions on Student Reading Scores: Total Reading Score and Percent At or Above the Overall Baseline Mean [Implementation Year Spring Sample]
Outcome
Institute Series Only (Group A)
Institute Series Plus Coaching (Group B)
Control Group
Impact (Effect Size or percent)
Standard Error of the Estimated
Impact P-value
Test Score (standardized effect size) Institute Series Only vs.
Control 0.08 0.01 0.08 0.08
0.37
Institute Series Plus Coaching vs. Control
0.04 0.01 0.03 0.09
0.77
Institute Series Plus Coaching vs. Institute Series Only
0.08 0.04 –0.05 0.10
0.62
Dichotomous Outcome: At or Above Mean of Baseline Cohort (percent)
Institute Series Only vs. Control
54.8 51.3 3.48 3.57
0.33
Institute Series Plus Coaching vs. Control
49.0 51.3 –2.35 3.78
0.54
Institute Series Plus Coaching vs. Institute Series Only
54.8 49.0 –5.82 4.21
0.17
Sample Size: N = 89 schools, 5,055 students
SOURCE: Student level data were obtained from individual study district records. Records from one control school in the implementation year were not available.
NOTES: Student test scores were standardized by using the overall mean and standard deviation within each district for the 2004–2005 baseline cohort, including only the schools participating in the study.
The treatment and control columns display regression-adjusted mean outcomes for all three groups, evaluated at the control group mean values for all covariates in the regression model.
The impact for the standardized test score is in effect sizes. The impact for the dichotomous outcome is in percentage points.
There were no statistically significant impacts (all p’s > .05).


53
CHAPTER 5
FINDINGS FROM THE FOLLOW-UP YEAR
In chapter 4, we examined the impact of the PD on teacher knowledge, teachers’ instructional practice, and student achievement in the spring of the year in which the PD was being implemented. In this chapter, we examine the impact on the same three outcomes in the year after the implementation of the interventions, to determine whether the impact of the interventions was sustained, increased or diminished with the passage of time, in the absence of ongoing PD. In the sections below, we briefly describe how the outcomes data for the follow-up year were analyzed and present the results of the follow-up impact analyses. We also provide a comparison of the impacts in the follow-up year with the results reported in chapter 4 for the implementation year.
Understanding the Impact Tables
The analyses in this chapter focus on data collected in the fall and spring of the follow-up year. At these time points, data were collected on all teachers and students in the study schools, even though teachers and students may have entered or left the study schools during the implementation year, between the implementation and follow-up years, or during the follow-up year.100
As in chapter 4, when a table is presented to report estimated impacts, the mean outcome levels for the institute series only (treatment group A), the institute series plus coaching (treatment group B), and the control group are reported to provide context for interpreting the estimated differences. The impacts were estimated using a regression model that utilizes all available observations from treatment A, treatment B, and the control group, including information on baseline covariates, and the mean outcome levels were calculated using the same model. 101,102
When calculating the regression-adjusted mean outcome levels for treatment group A, treatment group B, and the control group, the adjustments were made using the observed mean covariate values for the control group. In other words, means for all three groups are “regression adjusted” using this common set of baseline covariate values, the control group mean. The reported
100 The teacher impact analyses are based on semester-specific samples in which each regular second grade classroom is represented by one “teacher of record.” Of the 250 teachers in the follow-up year fall sample, 179 (72 percent) are original teachers of record from fall 2005 and 71 (28 percent) are late-entry teachers. Original (or “stable”) teachers comprised 66 percent of the treatment group A sample, 73 percent of the treatment group B sample, and 76 percent of the control group sample in fall 2006. Similarly, among the 254 teachers in the follow-up year spring sample, 171 (67 percent) are original teachers and 83 (33 percent) are late entries; and the percents of original teachers in the spring samples for treatment groups A and B and the control group are 65 percent, 68 percent, and 69 percent, respectively. The student impact analyses are based on all second grade students enrolled in the spring of the follow-up year. 101 Additional technical details on the psychometric properties of the outcome measures used in the impact analyses are presented in sections IV and V of appendix D (RCPS), sections IV and V of appendix E and section III of appendix F (classroom instruction), and H2 (student achievement. Appendix J provides details on estimation methods, and appendix L provides supporting tables. Tables reporting impact estimates and group means without covariate adjustment are provided in section I of appendix L. 102 See chapter 2 and section I of appendix J for a discussion of the covariates included in the impact regression model. Covariates were included to take into account variation among schools, teachers, and students at baseline and to improve the precision of the impact estimates.

54
treatment group A and B means represent how the schools in the control group would have performed had they been assigned to treatment group A or B.103
The results presented in this chapter, like those in chapter 4, are based on an “intent to treat” analysis that includes all teachers in the sample schools at the time of outcome data collection, along with their students. Thus, the impact estimates reflect the impact of assignment to the treatment conditions. However, not all teachers who taught in the treatment A and B schools at the time of outcome data collection had the opportunity to receive a full dose of the treatment. In chapter 6 and appendix M, we discuss a non-experimental analysis focusing only on teachers who were present throughout the period of the study.
The tables report the standard error and p-value for each impact estimate. As a result of the random assignment of schools to treatment conditions, some differences in group means could have occurred simply due to chance. The standard error indicates the magnitude of the uncertainty about the true mean of each impact, given the number of schools, teachers, and students involved in the analysis. The p-value indicates the chance of obtaining an impact as large as the estimated impact, if in fact there were no true impact. Results are considered statistically significant if the p-value is .05 or lower, indicating that there would be no more than a 5 percent chance of obtaining an impact as the one obtained if there were no true effect. Results that are not statistically significant may have occurred due to chance, and thus do not provide strong evidence about the impact of the treatments.
In addition to reporting results on the impact of treatment groups A and B in the follow-up year, we also report tests of the difference in impacts between the implementation and follow-up years. The p-value for these tests indicates the chance of obtaining a difference in impact across years as large as the estimated difference, if in fact the impacts were the same in both years. Results that are not significant do not provide strong evidence that there was a difference in impact between the implementation and follow-up years.
Impacts on Teachers: Knowledge of Early Reading Content and Instruction and Use of Instructional Practices in the Classroom
Knowledge of Early Reading Content and Instruction (RCPS Scores)
To analyze the impact of the PD interventions on teacher knowledge in the follow-up year, we drew on the assessment of teacher knowledge administered in the spring of 2007, the spring of the school year after the PD was administered. We report results for three measures based on the assessment, which parallel those used in the implementation year analyses reported in chapter 4: the knowledge total, a sub-score focusing on word-level knowledge (phonemic awareness, phonics, and fluency), and a sub-score focusing on meaning-level knowledge (vocabulary and comprehension). We employed the same analytical model used in the analysis of the implementation year data, as well as the same covariates.
The results for the follow-up year are presented in table 5-1, and the results for both the implementation and follow-up years are displayed graphically in figure 5-1.104 Specifically:
103 For more information on the means reported in the tables, see the discussion in chapter 4.

55
Table 5-1. Impact of the PD Interventions on Teacher Knowledge: Total Score, Word-Level Score, and Meaning-Level Score [Follow-Up Year Spring Sample]
Outcome
Institute Series Only
(Group A)
Institute Series Plus
Coaching (Group
B) Control Group
Impact (Effect Size)
Standard Error of the Estimated
Impact P-value
Total Score (standardized) Institute Series Only vs.
Control 0.08 -0.10 0.18 0.16 0.27 Institute Series Plus Coaching
vs. Control -0.03 -0.10 0.07 0.16 0.68 Institute Series Plus Coaching
vs. Institute Series Only 0.08 -0.03 -0.11 0.15 0.46 Word Score (standardized)
Institute Series Only vs. Control 0.11 -0.06 0.17 0.15 0.25
Institute Series Plus Coaching vs. Control 0.12 -0.06 0.18 0.14 0.21
Institute Series Plus Coaching vs. Institute Series Only 0.11 0.12 0.01 0.14 0.94
Meaning Score (standardized)
Institute Series Only vs. Control -0.09 -0.10 0.01 0.19 0.95
Institute Series Plus Coaching vs. Control -0.21 -0.10 -0.11 0.18 0.54
Institute Series Plus Coaching vs. Institute Series Only -0.09 -0.21 -0.13 0.18 0.49
Sample Size: N = 88 Schools, 232 Teachers (22 missing cases).
SOURCE: Spring 2007 Early Reading PD Interventions Study Reading Content and Practice Survey (RCPS).
NOTES: The teacher outcome variables were standardized using the overall control group mean and standard deviation.
The treatment and control columns display regression-adjusted mean outcomes for all three groups, evaluated at the control group mean values for all covariates in the regression model.
There were no statistically significant impacts or implementation year vs. follow-up year comparisons (all p’s > .05).
• There were no statistically significant effects of either the institute series alone (treatment
A) or the institute series plus coaching (treatment B) on the knowledge scales in the spring of the follow-up year. However, the differences between the implementation and follow-up year impacts also were not statistically significant.
104 A joint F-test using an index that combined the two achievement measures as the dependent variable confirmed that there was no statistically significant difference among the two treatment groups and the control group (p-value = 0.42).

56
Although both treatment A and B produced positive impacts on the total knowledge score and the word-level subscale score in the implementation year, the differences between the implementation and follow-up year impacts were not statistically significant. It may be that the treatments had an impact in the follow-up year, but we did not have adequate power to detect them; or it may be that there was no impact in the follow-up year, but we did not have adequate power to detect the difference in impacts between the two years. Thus, we cannot say conclusively that the effects declined without the ongoing PD. All the impacts above reflect an average across the six study sites. To the degree that there is variation in impacts across the districts, the overall average may mask differences in the effectiveness of the PD interventions under different conditions. We conducted an F-test to determine if the impact of the PD interventions on teacher knowledge outcomes differed by district and found that they did not. See section V of appendix L for details.
Figure 5-1. Impact of the PD on Teacher Knowledge Total Score, Word-Level Score, and Meaning-Level Score: Implementation vs. Follow-Up Year
Teacher Knowledge
SOURCE: Reading Content and Practices Survey (RCPS), Spring 2006 and 2007;
NOTES: Covariate measures were taken from baseline RCPS and teacher background survey, 2005 and 2006.
*Indicates an impact estimate found to be statistically significant (p < .05).
There were no statistically significant implementation year vs. follow-up year comparisons (all p’s > .05).

57
Use of Explicit Instruction, Independent Student Activities, and Differentiated Instruction During Reading Instruction
To examine the impact of the PD on instructional practice in the fall of the follow-up year, we drew on classroom observations conducted in the fall of 2006, the fall of the school year after the PD was implemented (see section V of appendix F for descriptive statistics on teacher practices). The analyses focus on three measures based on the observations, paralleling those used in the analysis of the implementation year: teacher-led explicit instruction, independent student activity, and differentiated instruction. The analysis methods and covariates are identical to those used in the implementation year analysis and reported in chapter 4.
The results for the follow-up year are shown in table 5-2, and the results for both the implementation and follow-up years are shown graphically in figure 5-2.105 Specifically:
• There were no statistically significant effects of either the institute series alone (treatment A) or the institute series plus coaching (treatment B) on any of the three teacher practice measures in the fall of the follow-up year.
• Although both treatment A and B produced positive impacts on teachers’ use of explicit instruction in the implementation year, the differences between the implementation and follow-up year impacts were not statistically significant. The impact of treatment A on teachers’ use of explicit instruction was 0.09 in the follow-up year and 0.33 in the spring of the implementation year, but this difference was not statistically significant. The estimated effect of treatment B on use of explicit instruction was, however, lower in the fall of the follow-up year (-0.03) than in the implementation year (0.53), and this difference was statistically significant.
• There were no statistically significant differences between the follow-up and implementation year impacts on the use of independent student activity or differentiated instruction.
The impacts above reflect an average across the six study sites. To the degree that there is variation in impacts across the districts, the overall average may mask differences in the effectiveness of the PD interventions under different conditions. We conducted an F-test to determine if the impact of the PD interventions on the teacher practice outcomes differed by district and found no district differences in the impact of the treatments on explicit instruction or independent study activity. We found a statistically significant district difference in the impact of the treatments on differentiated instruction.106
105 A joint F-test using an index that combined the two achievement measures as the dependent variable confirmed that there was no statistically significant difference among the two treatment groups and the control group (p-value = 0.51). 106 In one district, there was a significant negative effect of treatment A versus the control group on differentiated instruction; in the remaining districts, the treatment A versus control group effect could not be reliably distinguished from 0. See section V of appendix L for details.

58
Table 5-2. Impact of the PD Interventions on Teacher Practices in Reading Instruction: Teacher-Led Explicit Instruction, Independent Student Activity, and Differentiated Instruction [Follow-Up Year Fall Sample]
Outcome
Institute Series Only (Group A)
Institute Series Plus Coaching (Group B)
Control Group
Impact (Effect Size)
Standard Error of the Estimated
Impact P-value
Teacher-Led Explicit Instruction (standardized) Institute Series Only vs.
Control 0.08 -0.01 0.09 0.18 0.61
Institute Series Plus Coaching vs. Control
-0.04 -0.01 -0.03 0.17 0.87
Institute Series Plus Coaching vs. Institute Series Only
0.08 -0.04 -0.12 0.18 0.51
Independent Student Activity (standardized)
Institute Series Only vs. Control
-0.06 -0.01 -0.05 0.17 0.75
Institute Series Plus Coaching vs. Control
-0.03 -0.01 -0.03 0.16 0.87
Institute Series Plus Coaching vs. Institute Series Only
-0.06 -0.03 0.03 0.17 0.87
Differentiated Instruction (standardized)
Institute Series Only vs. Control
-0.19 0.01 -0.20 0.13 0.14
Institute Series Plus Coaching vs. Control
-0.09 0.01 -0.10 0.13 0.42
Institute Series Plus Coaching vs. Institute Series Only
-0.19 -0.09 0.09 0.13 0.47
Sample Size: N = 90 Schools, 228 Teachers (22 missing values).
SOURCE: Fall 2006 Early Reading PD Interventions Study Classroom Observation Protocol.
NOTES: The teacher outcome variables were standardized using the overall control group mean and standard deviation.
The treatment and control columns display regression-adjusted mean outcomes for all three groups, evaluated at the control group mean values for all covariates in the regression model.
There were no statistically significant impacts or implementation year vs. follow-up year comparisons (all p’s > .05).
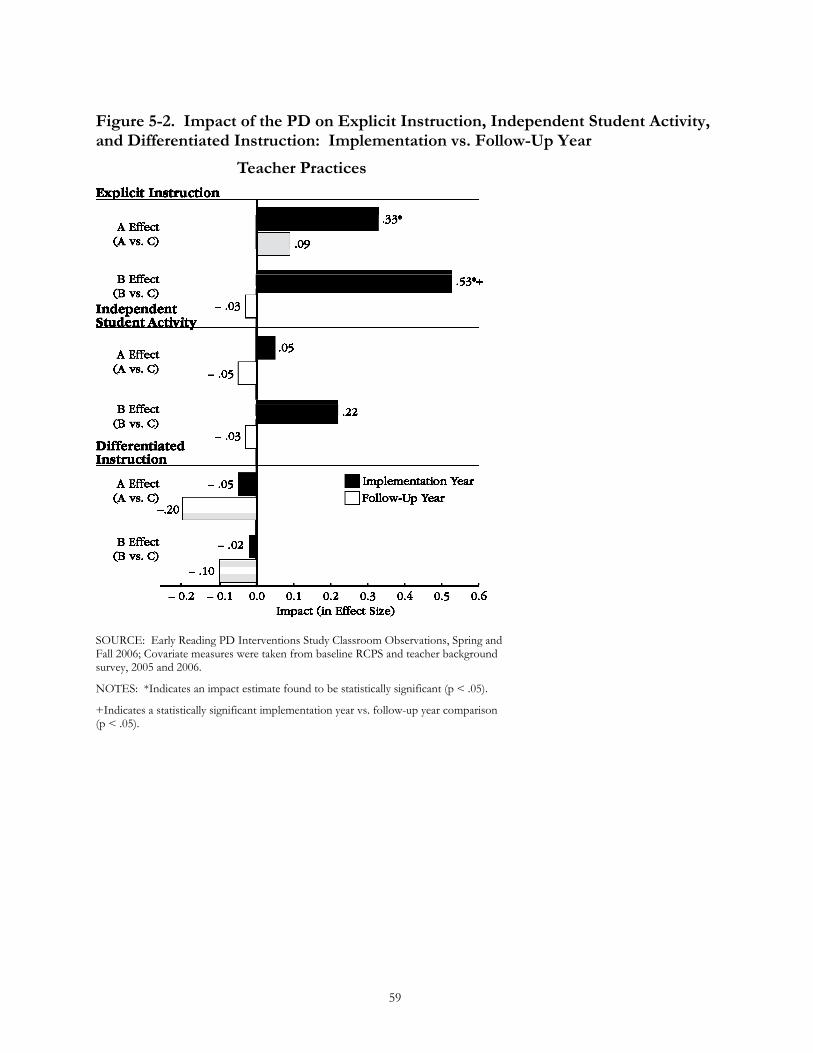
59
Figure 5-2. Impact of the PD on Explicit Instruction, Independent Student Activity, and Differentiated Instruction: Implementation vs. Follow-Up Year
Teacher Practices
SOURCE: Early Reading PD Interventions Study Classroom Observations, Spring and Fall 2006; Covariate measures were taken from baseline RCPS and teacher background survey, 2005 and 2006.
NOTES: *Indicates an impact estimate found to be statistically significant (p < .05).
+Indicates a statistically significant implementation year vs. follow-up year comparison (p < .05).

60
Impact on Students: Reading Achievement
To examine the impact of the PD interventions on student achievement in the spring of the follow-up year, we relied on student scores on achievement tests administered by the districts in which the study schools were located. The tests were the same as those we used in the analysis of achievement outcomes for the implementation year. The analysis focused on two measures based on these scores: a continuous standardized measure of reading achievement and a dichotomous measure indicating whether or not students scored above the average score for their district’s baseline year (2004–2005) cohort. The methods used were identical to those used in the implementation year.
The results for the follow-up year are summarized in table 5-3, and displayed graphically for both the implementation and follow-up years in figures 5-3 and 5-4.107
Specifically:
• The estimated effect of the institute series alone (treatment A) for the follow-up year was 0.10 on the standardized test score outcome and the effect of the institute series plus coaching (treatment B) was 0.01; neither was statistically significant.
• The effects of treatment A and treatment B were also not significant for the dichotomous outcome at follow-up.
• There were no statistically significant differences between the follow-up and implementation year impacts on either the standardized student test score or the dichotomous outcome.
As in the analysis of the impact of the PD interventions on teacher knowledge and instructional practice, the impacts presented above reflect an average across the six study districts. An F-test confirmed that there were no statistically significant differences across the districts in the achievement impacts for either PD intervention.108
107 A joint F-test using an index that combined the two achievement measures as the dependent variable confirmed that there was no statistically significant difference among the two treatment groups and the control group (p-value = 0.34). 108 See section V of appendix L.

61
Table 5-3. Impact of the PD Interventions on Student Reading Scores: Total Reading Score and Percent At or Above the Overall Baseline Mean [Follow-Up Year Spring Sample]
Outcome
Institute Series Only (Group A)
Institute Series Plus Coaching (Group B)
Control Group
Impact (Effect Size or percent)
Standard Error of the Estimated
Impact P-value Test Score (standardized effect size)
Institute Series Only vs. Control
0.14 0.04 0.10 0.09 0.25
Institute Series Plus Coaching vs. Control
0.05 0.04 0.01 0.09 0.93
Institute Series Plus Coaching vs. Institute Series Only
0.14 0.05 -0.09 0.10 0.36
Dichotomous Outcome: At or Above Mean of Baseline Cohort (percent)
Institute Series Only vs. Control
57.30 51.31 5.99 3.63 0.10
Institute Series Plus Coaching vs. Control
52.39 51.31 1.08 3.87 0.78
Institute Series Plus Coaching vs. Institute Series Only
57.30 52.39 -4.91 4.23 0.25
Sample Size: N = 88 Schools, 4,614 Students SOURCE: Student-level data were obtained from individual study district records.
NOTES: Student test scores were standardized using the overall mean and standard deviation within each district for the 2004–2005 baseline cohort, including only the schools participating in the study.
The treatment and control columns display regression-adjusted mean outcomes for all three groups, evaluated at the control group mean values for all covariates in the regression model.
There were no statistically significant impacts or implementation year vs. follow-up year comparisons (all p’s > .05).
Figure 5-3. Impact of the PD on Standardized Student Total Reading Scores: Implementation vs. Follow-Up Year
Reading Score
SOURCE: Student records from each individual school district for 2003–2004, 2004–2005, and 2006–2007 school years.
NOTE: There were no statistically significant impacts or implementation year vs. follow-up year comparisons (all p’s > .05).

62
Figure 5-4. Impact of the PD on Student Dichotomous Outcome: Implementation vs. Follow-Up Year
Dichotomous Outcome
SOURCE: Student records from each individual school district for 2003–2004, 2004–2005, and 2006–2007 school years.
NOTE: There were no statistically significant impacts or implementation year vs. follow-up year comparisons (all p’s > .05).

63
CHAPTER 6
EXPLORATORY ANALYSES
The results reported in chapters 4 and 5 describe the effects of the two PD interventions we studied—an institute series (treatment A) and the institute series plus coaching (treatment B). The two interventions produced an impact on some teacher knowledge and practice measures during the implementation year, but not on other aspects of teacher knowledge or practice, and not on student achievement. The effects on teacher knowledge and instructional practice that were observed during the implementation year were not observed during the follow-up year.
The sections below, through exploratory data analysis, examine potential hypotheses that might account for the observed pattern of impact results. The information is provided as possible avenues for further investigating PD programs like those evaluated in this study. But because the study was not designed to provide a rigorous test of the questions we explore, the results are only suggestive. 109
Student Achievement
Given that there were impacts on some measures of teacher knowledge and practice in the spring of the implementation year, what might explain why these impacts did not translate into impacts on student achievement?
The pattern of impacts raises several possible hypotheses that can be explored with the data available, although we lack data to test other possible hypotheses.
• Perhaps the achievement effect was influenced by student mobility, which limited the opportunity for students to receive a full year of instruction from teachers who experienced the study PD. Overall, 17 percent of students in the spring implementation year sample arrived in their school after the school year began. (See chapter 2.) Would the impact results be different if these mobile students were excluded from the impact analysis? Unfortunately, since the composition of who stays in a school and who does not could be affected by the treatment, any examination of this question is non-experimental. We re-ran the analysis for the subset of stable students who received a full year of instruction from “stable” teachers—those who were in the study schools in both the fall and spring of the implementation year and thus potentially received the full dose of their assigned PD. The results, shown in appendix M (table M-3) show no significant outcomes of the PD interventions for the self-selected group of stable students of stable teachers (ES = 0.06 for treatment A and 0.00 for treatment B for the standardized reading achievement outcome).
• Perhaps the specific knowledge and practices that were promoted by the PD, or our measures of them, are not good predictors of student achievement. The theory of action on which the study is based posits a causal chain leading from teachers’ participation in professional development to improved student achievement in reading.
109 Additional technical details for this chapter are provided in section VI of appendix L and sections I through IV of appendix M.

64
According to the theory, which was outlined in chapter 1 and appendix A, the chain involves three main links: participation in professional development is hypothesized to improve teacher knowledge. Teacher knowledge, in turn, is expected to improve classroom instruction. And improved classroom instruction should boost student achievement. Our study was designed to provide a rigorous test of the impact of two PD interventions on some aspects of the two intermediate outcomes—teacher knowledge and classroom instruction—as well as on the ultimate outcome, student achievement. These tests were the focus of the analyses reported in chapter 4.
Unfortunately, our study design does not permit a rigorous test of the causal links in the theory of action. Students were not randomly assigned to teachers with different levels (or types) of teacher knowledge, or who exhibit different practices in the classroom. We can, however, examine the degree to which the teacher variables that make up the links in the chain—our measures of teacher knowledge and classroom instruction—are associated with student achievement. If they are, it would provide some support for a hypothesis that at least the elements of the chain we tested are appropriate.
To examine this association, we estimated a set of multi-level regression models treating student achievement as the dependent variable and including four teacher-level variables as independent variables: the teacher knowledge total score, explicit instruction, independent student activity, and differentiated instruction. In addition to the four independent variables, the full set of teacher-level and student-level covariates included in the impact analyses for teacher knowledge, instructional practice, and student achievement were incorporated as control variables.110
We estimated separate models predicting the continuous reading score and the dichotomous reading outcome indicating whether students scored above the district cutpoint.111 The results for both the continuous reading outcome and the dichotomous outcome (shown in table 6-1) are displayed as standardized regression coefficients.112 Each coefficient represents the magnitude of the change in achievement in student-level standard deviation units associated with a one-standard deviation change in each of the independent variables, controlling for the other independent variables and covariates in the model.
The results indicate a statistically significant association between teacher knowledge and student achievement. For the continuous reading achievement outcome measure, the standardized regression coefficient for the teacher knowledge total score was 0.07, indicating that students in a classroom taught by a teacher scoring a standard deviation above average in reading content and pedagogy knowledge might be expected to score about 0.07 standard deviations above average on their reading test. For the dichotomous reading outcome, the association between knowledge and achievement was also
110 The results reported below were obtained using a two-level model, with teachers nested within schools and student achievement outcomes and student demographic covariates aggregated to the teacher level. A parallel model was estimated using a three-level model, with students nested in teachers within schools, and the results are nearly identical to those reported above. 111 As discussed in chapter 2 and appendix G, the achievement analyses are based on student reading test scores on assessments administered by the six participating districts. We scaled the test scores in two ways. First, we standardized the scores separately within districts. Second, we used a dichotomous variable indicating whether each student scored above the district mean. 112 We standardized the dichotomous variable separately within districts for purposes of the correlational analysis, to make the magnitude of the estimated regression coefficients for the continuous and dichotomous outcomes easier to compare.

65
statistically significant, with a standardized regression coefficient of 0.06. The associations between the other teacher variables and student achievement did not differ from zero by a statistically significant margin, although the association between differentiated instruction and achievement approached statistical significance (p < .10).
Table 6-1. Associations Between Teacher Variables and Student Reading Achievement
Teacher Variable
Student Reading Achievement
Teacher Knowledge
Teacher-led Explicit
Instruction Independent
Student Activity Differentiated
Instruction
Total score Word and
meaning intervalsWord and
meaning intervals All intervals
Test Score 0.07* (0.03)
0.01 (0.03)
0.03 (0.03)
0.07 (0.04)
Dichotomous Outcome
0.06* (0.03)
0.03 (0.02)
0.03 (0.02)
0.07* (0.03)
Word-level knowledge
Word intervals only
Word intervals only All intervals
Test Score 0.06* (0.03)
0.06 (0.03)
0.00 (0.03)
0.06 (0.04)
Dichotomous Outcome
0.05 (0.03)
0.08* (0.03)
0.00 (0.03)
0.07 (0.04)
Meaning-level
knowledge Meaning intervals
only Meaning intervals
only All intervals
Test Score 0.04
(0.03) 0.01
(0.03) 0.04
(0.02) 0.07
(0.04) Dichotomous Outcome
0.04 (0.03)
0.02 (0.02)
0.03 (0.03)
0.07* (0.03)
Sample Size: 83 schools and 234 teachers (36 missing cases).
SOURCE: Student-level data were obtained from each individual study district, classroom observation variables from fall 2005 and spring 2006 PD Impact Study Classroom Observation Protocols, teacher knowledge scores from fall 2005 and spring 2006 PD Impact Study Reading Content and Practice Surveys.
NOTES: Entries in table are standardized regression coefficients. For example, students in a classroom with a teacher scoring one standard deviation above average in knowledge would be expected to have spring achievement scores 0.07 standard deviations above average. Values in parentheses are standard errors.
Two-tailed statistical significance at the p<.05 level is indicated by an asterisk (*).
We also estimated similar models linking teachers’ word-level knowledge and practices with student achievement, or teachers’ meaning-level knowledge and practices with student achievement, and the results of these analyses are shown in the second and third panels of table 6-1. We found a significant association between word-level knowledge and the standardized achievement measure (standardized regression coefficient of 0.06) and between explicit instruction on word-level components of reading and the percent of students scoring above the district average (standardized regression coefficient of 0.08). Differentiated instruction during meaning-level components of reading (vocabulary and comprehension) is associated with the dichotomous outcome indicating whether students scored above the district average (ES = 0.07).

66
It should be emphasized that the results shown in the table are correlational and do not necessarily imply that a causal relationship exists between the variables involved. The results are consistent with the hypothesis that the teacher variables we measured may be related to student achievement, but the results should not be taken as more than suggestive.113 On the one hand, the estimated coefficients could overstate the magnitude and statistical significance of the true relationships between teacher knowledge, instruction, and reading achievement, if unmeasured factors affect both teacher knowledge or instruction and achievement. On the other hand, the estimated coefficients could underestimate the magnitude and statistical significance of the true effects because measurement error in the teacher variables will attenuate estimated associations.114
• Perhaps the change in teacher knowledge and classroom instruction produced by the interventions in the spring of the implementation year was not large enough to produce a meaningful change in student achievement. The largest effect sizes for the impact of the PD on teacher outcomes were 0.38 for teacher knowledge and 0.53 for explicit instruction during the implementation year. Strong research evidence is lacking on the magnitude of teacher impacts that might translate into improved student outcomes. Results from our correlational analysis, suggestive but not causal, indicate that students in a classroom taught by a teacher who is one standard deviation above average in his/her total knowledge score and use of explicit instruction, independent student activity, and differentiated instruction had standardized achievement scores 0.18 standard deviations above average.115 Because the magnitude of the impact of the PD on each of the four teacher-level variables was less than one standard deviation, we would expect the impact on teachers to translate into an impact on student achievement
113 The p-values shown in table 6-1 are not adjusted for multiple comparisons. As shown in table 6-1, we tested 24 standardized regression coefficients, and six (25 percent) were statistically significant, using a two-tailed t-test (p<.05). Because the 24 tests are based on the same achievement measures, and the word- and meaning-level variables are components of the total scores, the 24 tests are not independent. To assess the likelihood of false positive results, we conducted a joint test of the significance of the four independent variables in each of the six models. These tests were all statistically significant, supporting the conclusions based on the tests of individual coefficients. 114 As reported in section V of appendix D, the internal consistency reliability of the RCPS was 0.60 for the total score, 0.45 for the word-level score, and 0.49 for the meaning-level scale. The reliability of the classroom observations is a function of the agreement among raters, the consistency of the measures between three-minute intervals within class periods, and the consistency of teachers’ instruction across class periods in the same semester. As reported in section V of appendix E, the inter-rater reliability of the classroom observation measures (agreement among observers observing the same classroom) was 0.90 or higher in each observation wave. As reported in section III of appendix F, the internal consistency reliability was 0.80 for explicit instruction in the spring of the implementation year, 0.74 for independent student activity, and 0.89 for differentiated instruction. Because we observed each teacher just once each semester, we were unable to assess the degree of consistency among different class periods for the same teacher. 115 The value 0.18 was obtained by summing the standardized regression coefficients (effect sizes) for teacher knowledge (0.07), explicit instruction (0.01), independent student activity (0.03), and differentiated instruction (0.07). The sum of the four coefficients (0.18) is significantly different from zero (p<.01). The magnitude of a gain of 0.18 standard deviations in student achievement can be put in context by comparing it with the typical variation among teachers in their contribution to student achievement growth during a year of instruction. The available evidence is based on “value added” analyses, in which a teacher’s contribution is measured by the average gain in test scores achieved by students in his/her class. This research suggests that students who are taught by a teacher who is one standard deviation above average in value-added gain from 0.1 to 0.2 standard deviations more in reading achievement than students taught by an average teacher (Rockoff 2004; Kane, Rockoff, and Staiger 2006; Jacob and Lefgren 2008; or Nye, Konstantopoulos, and Hedges 2004, which has a somewhat higher estimate—0.25 standard deviations for teachers one standard deviation above average—but uses a single year of data for each teacher compared to multiple years of data used by the other researchers.) Thus, the value of 0.18 obtained by summing the standardized regression coefficients above is comparable in magnitude to the gain for a teacher a standard deviation above average in value-added.

67
of less than 0.18 standard deviations, smaller than the effect size of 0.20 the study was designed to detect.
• Perhaps the student achievement measures did not capture the range of student reading skills targeted by the study PD. Misalignment might account for the absence of an impact on student achievement, although the hypothesis cannot be directly tested statistically. As described in appendix G (exhibit G-1), the achievement outcome measures available for the study were based on the tests administered in the study districts. In five of the six districts, the available overall reading achievement measures focus on comprehension (meaning-level knowledge). The study PD placed relatively more emphasis on word-level components, based on research suggesting that many struggling second grade readers lack a strong foundation in these areas and improvements in these areas should help prepare students for instruction in comprehension (NICHD 2000). Comprehension is the ultimate goal of elementary reading instruction, and thus it is appropriate to assess the impact of the PD interventions on students’ achievement in comprehension. It is possible, however, that the PD interventions produced an improvement in students’ word-level skills (phonemic awareness, phonics, or fluency), but these skills did not lead to measurable improvements in comprehension during second grade. Because only one of the six study districts included a word-level subscale in its achievement measures, we were unable to examine whether the PD intervention had an impact on students’ word-level skills.
The impact analyses reported in chapter 4 indicated that the PD interventions had a statistically significant impact on teacher knowledge and on the use of explicit instruction in the spring of the implementation year, but it did not have a significant impact on student achievement. The exploratory analyses we conducted cast doubt on one potential hypothesis: it appears that student mobility is not a likely explanation for the absence of an impact on achievement. The exploratory analyses we conducted also indicate that the teacher outcomes targeted by the PD interventions might be associated with student achievement, but the impact of the interventions on the teacher outcomes may not have been substantial enough to translate into a detectable impact on achievement. These analyses are descriptive and correlational, however, and thus we cannot draw conclusions from them with any degree of certainty.
Teacher Knowledge and Instructional Practice
What might explain why the impacts found during the implementation year for teacher knowledge and explicit instruction were no longer statistically significant at follow-up?
The results presented in chapters 4 and 5 indicated that the PD interventions had a statistically significant impact on teacher knowledge and explicit instruction, one of the three measures of classroom instruction, in the spring of the implementation year, but there were no statistically significant impacts on teacher knowledge or classroom instruction in the spring of the follow-up year. One possible hypothesis for this pattern concerns teacher turnover.

68
• Perhaps the PD did not produce a significant impact on teacher outcomes in the follow-up year because some teachers left the intervention schools over the course of the study and were replaced by teachers who did not have an opportunity to participate fully in the PD interventions. As reported in chapter 2, 67 percent of the teachers who taught in the study schools in the spring of the follow-up year were in the schools for all four semesters (fall and spring of the implementation and follow-up years). The remaining 33 percent entered the study schools after the fall of the implementation year. As described in chapters 1 and 3, the PD interventions tested in the study were provided over a single summer and school year. Although teachers who arrived after the PD began were invited to attend the remaining sessions and coaching, “catch-up” sessions were not provided for these teachers. Thus, late entrants received less than a full dose of the PD treatments. The analyses of the impact of the PD in the follow-up year reported in chapter 5 are “intent to treat.” In other words, the impacts are based on all teachers who taught in the study schools in the spring of the follow-up year, regardless of whether they were in school during the implementation year and had the opportunity to be exposed to all of the study-provided PD. When we re-ran the impact analysis only for “stable” teachers, those who taught in the study schools all four semesters (from fall of the implementation year through spring of the follow-up year), we found no statistically significant outcomes in the spring of the follow-up year for teacher knowledge or the classroom practice measures (see tables M-1 and M-2 in section I of appendix M). These analyses are non-experimental, because the set of teachers who remained in the study schools for the full year is a selected subsample, and the selection process could, in theory, have been affected by the treatment.116
The exploratory analyses do not support the hypothesis that the lack of statistically significant impacts on teacher outcomes in the follow-up year is due to teacher turnover. A potential alternative explanation is that teachers in the treatment groups forgot some of what they learned in the professional development; another is that other reform efforts diverted teacher attention from the practices emphasized in the study’s professional development the prior year. We lack data to test these hypotheses.
What might explain why the PD interventions affected word- but not meaning-level knowledge of early reading in the spring of the implementation year?
The assessment instrument used to measure teacher knowledge included two subscales, one focusing on the word-level components of reading instruction (phonics, phonemic awareness, and fluency), and one focusing on the meaning-level components (vocabulary and comprehension). The results reported in chapter 4 indicated that treatment A and B had a significant positive impact on word-level knowledge, but not on meaning level knowledge. Understanding the reason for this pattern of outcomes may be useful in designing professional development that has more consistent
116 In section III of appendix M, we also present an exploratory longitudinal analysis of changes in teacher knowledge for teachers who have teacher knowledge scores at all three measurement occasions (fall of the implementation year, spring of the implementation year, and spring of the follow-up year). The results show statistically significant growth in word-level knowledge from baseline to the spring of the implementation year for teachers in treatment groups A and B, and a non-significant decline between the spring of the implementation and follow-up years. The results show no significant growth or decline in meaning-level knowledge during the implementation or follow-up years for teachers in treatment groups A and B.

69
effects on teacher knowledge. There are several possible hypotheses that might account for the observed patterns.
• Perhaps more time was spent during the study PD on word-level than meaning-level topics. During the institutes and seminars, teachers attended significantly more hours of word-level (16.6 hours) than meaning-level PD (12.0 hours; see table 6-2).
Table 6-2. Mean Hours of Attendance During Coverage of Word- and Meaning-Level Topics in Teacher Institute Series [Implementation Year Spring Sample]
Attendance during word-level topics
(hours)
Attendance during meaning-level topics
(hours)
Difference P-value
Mean 16.6 12.0 4.6* .00 Standard Deviation 7.4 4.3 Number of Teachers = 181 SOURCE: Early Reading PD Interventions Study Institute and Seminar Sign-In Sheets.
NOTES: Means were calculated by multiplying the minutes of content coverage for each day of the institute series (as recorded in fidelity forms) by the percentage of time each teacher attended that day and then summing across days. The word-level total was obtained by averaging teacher responses for phonemic awareness, phonics, and fluency agenda topics; the meaning-level total was obtained by averaging attendance for vocabulary and comprehension agenda topics.
Two-tailed statistical significance at the p<.05 level is indicated by an asterisk (*).
• Perhaps teachers in the treatment groups participated in PD with a greater
emphasis on word-level components of reading instruction than did teachers in the control group, taking into account both the study-provided PD and other PD teachers participated in, In the spring of 2006 survey, teachers were asked to report on their participation in workshops or institutes during the 2005–2006 school year, and the degree of emphasis the PD activities placed on specific reading content domains, including phonemic awareness, phonics, fluency, vocabulary, and comprehension, using a scale from 1 (not an emphasis) to 4 (major emphasis).
The results, displayed in table 6-3, indicate that the emphasis teachers in treatment groups A and B reported their PD placed on the word-level components of reading instruction was significantly greater than the emphasis teachers in the control reported their PD placed on the word-level components of reading instruction. The mean was 3.42 in treatment group A, 3.44 in treatment group B, and 2.68 in the control group, a difference of 0.74 and 0.76 on the 4-point scale. (See the first panel of table 6-3.) The emphasis teachers in treatment groups A and B reported their PD placed on the meaning-level components of reading instruction was also greater than the emphasis teachers in the control group reported, although only the difference for treatment group A was statistically significant. The mean was 3.37 in treatment group A, 3.21 in treatment group B, and 3.08 in the control group. (See the second panel of table 6-3.)
While teachers in treatment groups A and B reported that their PD placed more emphasis on the word than the meaning components of reading instruction, teachers in the control group reported that their PD placed more emphasis on the meaning than the
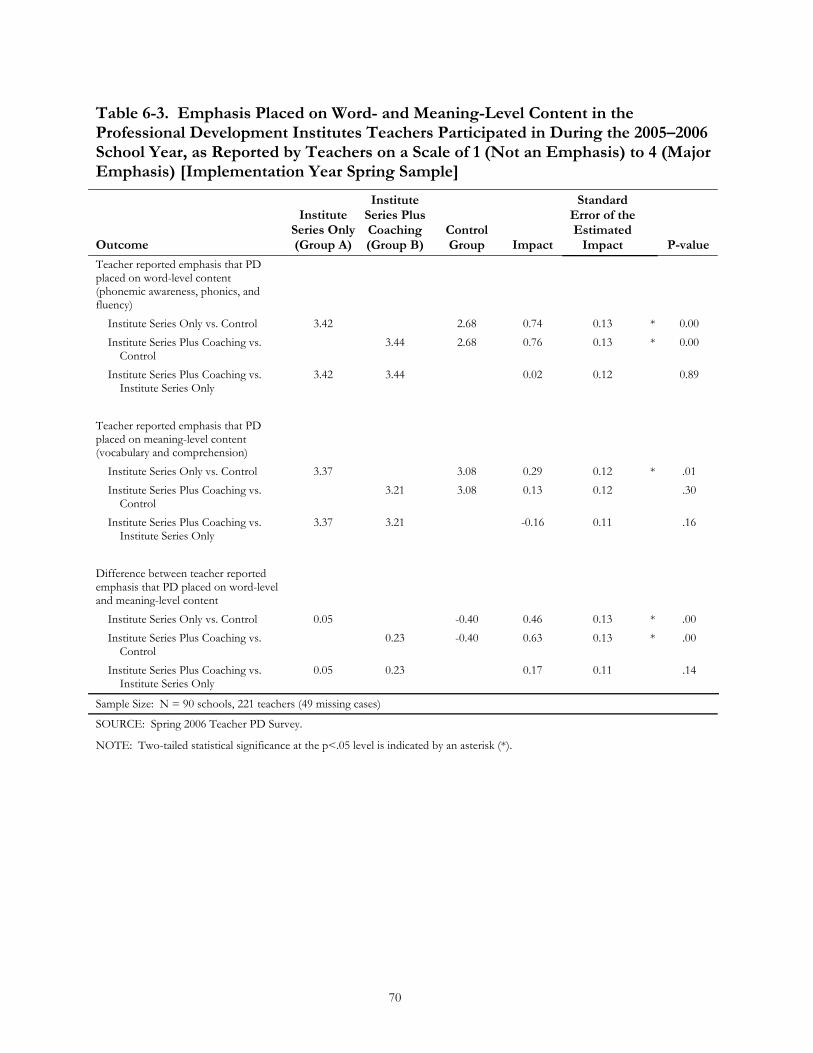
70
Table 6-3. Emphasis Placed on Word- and Meaning-Level Content in the Professional Development Institutes Teachers Participated in During the 2005–2006 School Year, as Reported by Teachers on a Scale of 1 (Not an Emphasis) to 4 (Major Emphasis) [Implementation Year Spring Sample]
Outcome
Institute Series Only (Group A)
Institute Series Plus Coaching (Group B)
Control Group Impact
Standard Error of the Estimated
Impact P-value
Teacher reported emphasis that PD placed on word-level content (phonemic awareness, phonics, and fluency)
Institute Series Only vs. Control 3.42 2.68 0.74 0.13 * 0.00 Institute Series Plus Coaching vs.
Control 3.44 2.68 0.76 0.13 * 0.00
Institute Series Plus Coaching vs. Institute Series Only
3.42 3.44 0.02 0.12 0.89
Teacher reported emphasis that PD placed on meaning-level content (vocabulary and comprehension)
Institute Series Only vs. Control 3.37 3.08 0.29 0.12 * .01 Institute Series Plus Coaching vs.
Control 3.21 3.08 0.13 0.12 .30
Institute Series Plus Coaching vs. Institute Series Only
3.37 3.21 -0.16 0.11 .16
Difference between teacher reported emphasis that PD placed on word-level and meaning-level content
Institute Series Only vs. Control 0.05 -0.40 0.46 0.13 * .00 Institute Series Plus Coaching vs.
Control 0.23 -0.40 0.63 0.13 * .00
Institute Series Plus Coaching vs. Institute Series Only
0.05 0.23 0.17 0.11 .14
Sample Size: N = 90 schools, 221 teachers (49 missing cases)
SOURCE: Spring 2006 Teacher PD Survey.
NOTE: Two-tailed statistical significance at the p<.05 level is indicated by an asterisk (*).

71
word components. For example, treatment group A teachers reported an emphasis of 3.42 on the word-level components of reading instruction and 3.37 on meaning components, a difference of 0.05 favoring word-level components, while teachers in the control group reported that their PD placed an emphasis of 2.68 on word level components and 3.08 on meaning-level components, a difference of 0.40 favoring meaning-level components. (See the third panel of table 6-3.) The difference between treatment and control teachers in the relative emphasis placed on word- and meaning-level components is statistically significant for both treatments A and B.
• Perhaps the word-level material was less familiar than the meaning-level material to teachers in the study sample, and so the word-level material provided a greater opportunity for making a difference between treatment and control conditions. As shown in table 6-4, the average baseline score on the meaning-level component of the teacher knowledge assessment was statistically significantly higher than the word-level scale score (0.26 vs. –0.05 logits, respectively), which provides some support for this last hypothesis.
Table 6-4. Baseline Teacher Knowledge Scores on the Reading Content and Practice Survey, by Word- and Meaning-Level Scales [Implementation Year Fall Sample]
Word-level knowledge (logits)
Meaning-level knowledge (logits)
Difference P-value
Mean -.05 .26 -.31* .00 Standard Deviation .82 .79 Sample Size: N = 253 teachers (17 missing cases). SOURCE: Fall 2005 Reading Content and Practices Survey.
NOTES: Teacher knowledge was measured in summer 2005 (post-random assignment of schools, but before the PD was implemented) for teachers in treatment group A and treatment group B schools, and in fall 2005 for teachers in control group schools. The number of teachers in the analysis equals the number of teachers in study schools in fall 2005. The word-level score is based on teacher responses to phonemic awareness, phonics, and fluency items; the meaning-level score is based on responses to vocabulary and comprehension items.
Two-tailed statistical significance at the p<.05 level is indicated by an asterisk (*).
The study found that the two PD interventions produced significant impacts on teachers’ word-level knowledge (phonemic awareness, phonics and fluency), but not on their knowledge of the meaning-level components of reading instruction (vocabulary and comprehension). Although the exploratory analyses reported above do not provide a rigorous test, they suggest that the impact on word-level knowledge might be related to the greater emphasis the study PD placed on the word-level components of reading instruction than did “business as usual” PD, and teachers were less familiar with the word-level components at baseline than they were with meaning-level components.
What might explain why the coaching intervention (treatment B compared to treatment A) did not produce greater impacts on instructional practice in the spring of the implementation year?
The coaching intervention was intended to help teachers translate knowledge into practice in the classroom. But, as reported in chapters 4 and 5, the study did not find a statistically significant impact of coaching on teachers’ instructional practice in the spring of the implementation year, over

72
and above the impact of the institute series alone, although the effect size for the net impact of coaching (treatment B compared with treatment A) was 0.21 for explicit instruction and 0.17 for independent student activity (neither statistically significant).
• Although, on average, treatment B teachers received 61.6 hours of coaching, perhaps a large share of teachers received substantially less than that. As indicated in chapter 3, on average, teachers in the spring implementation year sample received an average of 61.6 hours of coaching over the school year, as reported in logs completed by the coaches. When we examined the distribution of hours of coaching teachers received, 73 percent of the teachers received at least 40 hours of coaching.117
• Perhaps the coaches’ knowledge of reading content and pedagogy was not
sufficiently strong, relative to the knowledge of the teachers. To examine the knowledge of the coaches who providing the coaching for teachers in treatment B, we administered the Reading Content and Practices Survey (RCPS) to the coaches, the same measure of content knowledge administered to the study’s teacher sample. To provide context for the scores teachers and coaches obtained on the RCPS, we also administered the survey to 20 experienced professional development providers who provide training on reading instruction, and 15 novices. The experienced PD providers included the 4 LETRS trainers who provided the institute series for the study, as well as 16 other staff who provided reading PD as part of a large state technical assistance center in reading. The novices were recent college graduates with no experience as reading teachers. All 15 were working as research assistants for AIR.118 (See table 6-5.)
On the overall reading scale, the mean score for the coaches was statistically significantly higher than the score of the control group teachers (0.77 standard deviations above the control group mean), but also significantly below the experienced professional development providers (1.12 standard deviations below the experienced provider mean). On the word-level scale, the coach mean was significantly lower than the experienced provider mean (1.39 standard deviations below the experienced provider mean), but not significantly different from the teacher mean. On the meaning-level scale, the coach mean was not significantly lower than the experienced provider mean, but it was significantly higher than the control teacher mean (0.90 standard deviations above the control teacher mean).119
117 The number of hours of coaching received ranged from a minimum of 1.2 hours to a maximum of 173 hours. Nine percent of teachers received less than 20 hours; 18 percent received from 20 to 39 hours; 33 percent received from 40 to 59 hours; 17 percent received from 60 to 79 hours; 8 percent received from 80 to 99 hours; and 15 percent received more than 100 hours. 118 The RCPS was administered to the experienced PD providers and novices in the fall of 2007. To maximize the reliability of the score for the experienced PD providers and novices, each completed all 3 forms of the survey (90 items in total). Each coach completed a single form of the survey (30 items), either in the summer or fall of the implementation year, prior to the onset of their participation in the PD. 119 We also examined the distribution of coach knowledge. Of the 17 coaches for whom we have data, 12 had total knowledge scores higher than the teacher control group mean, and five had lower scores.

73
Table 6-5. Scores on the Reading Content and Practice Survey for Experienced Reading Professional Development Providers, Control Group Teachers, Coaches, and Novices
Group Mean Standard Deviation
Percent Correct on Typical Item
Overall Score Experienced professional development providers 1.89 0.89 0.81 Coaches 0.77 a,b 1.14 0.66 Control group teachers 0 1.00 0.53 Novices -0.41 0.35 0.46 Word-level Score Experienced professional development providers 1.87 0.85 0.85 Coaches 0.48 b 1.04 0.62 Control group teachers 0 1.00 0.51 Novices -0.42 0.35 0.42 Meaning-level Score Experienced professional development providers 1.25 0.77 0.78 Coaches 0.90 a 1.22 0.73 Control group teachers 0 1.00 0.55 Novices -0.23 0.49 0.50
Sample Size: N = 20 experienced PD providers, 17 PD Intervention Study Coaches, 88 control group teachers, and 15 novices
SOURCE: Reading Content and Practices Survey, administered to coaches and control group teachers in the fall of the implementation year, and administered to experienced professional development providers and novices in the fall of 2008.
NOTES: The scores were standardized using the mean and standard deviation for the control group teachers.
a Difference in means between coaches and teachers were statistically significant, p<.05, based on a two-tailed t-test.
b Difference in means between coaches and experienced professional development providers were statistically significant, p<.05, based on a two-tailed t-test.
Coaching is an increasingly common approach to PD (Taylor 2007), but little is known about its effectiveness or the factors that could make it effective. In our study, the coaches were, on average, more knowledgeable about reading content and pedagogical strategies than the teachers; but not all of them were, and not in all of the key reading component areas.


75
REFERENCES
American Institutes for Research (AIR). Coaching in the Professional Development Impact Study. Unpublished paper, January 2005.
Andrich, D. Rasch Models for Measurement. Beverly Hills, CA: Sage Publications, 1988.
Armbruster, B., Lehr, F. and Osborn, J. Put Reading First: The Research Building Blocks for Teaching Children to Read, K–3. Washington, DC: The Partnership for Reading: National Institute for Literacy; National Institute of Child Health and Human Development; and U.S. Department of Education, 2001.
Beck, I. L, McKeown, M.G. and Kucan, L. Bringing Words to Life: Robust Vocabulary Instruction. NY: The Guilford Press, 2002.
Ball, D. L. “Teacher Learning and the Mathematics Reforms: What We Think We Know and What We Need to Learn.” Phi Delta Kappan, 1996, 77(7): 500–508.
Bloom, H. S. “Minimum Detectable Effects: A Simple Way to Report the Statistical Power of Experimental Designs.” Evaluation Review, 1995, 19(5): 547–556.
Borko, H. “Professional Development and Teacher Learning: Mapping the Terrain.” Educational Researcher, 2004, 33(8): 3–15.
Carpenter, T. P., Fennema, E., Peterson, P. L., Chiang, C., and Loef, M. “Using Knowledge of Children’s Mathematics Thinking in Classroom Teaching: An Experimental Study.” American Educational Research Journal, 1989, 26(4):499-531.
Clewell, B. C., Campbell, P. B., and Perlman, L. Review of Evaluation Studies of Mathematics and Science Curricula and Professional Development Models. Submitted to the GE Foundation. Washington, DC: The Urban Institute, 2004.
Cohen, D. K., and Hill, H. C. Instructional Policy and Classroom Performance: The Mathematics Reform in California (RR-39). Philadelphia, PA: Consortium for Policy Research in Education, 1998.
Cohen, D. K., and Hill, H. C. Learning Policy: When State Education Reform Works. New Haven, CT: Yale University Press, 2001.
Cole, D. C. “The Effects of a One-Year Staff Development Program on the Achievement of Test Scores of Fourth-Grade Students.” Dissertation Abstracts International, 1992, 53(6): 1792A. (UMI No. 9232258).
Desimone, L., Porter, A. C., Garet, M., Yoon, K. S., and Birman, B. “Does Professional Development Change Teachers’ Instruction? Results From a Three-Year Study.” Educational Evaluation and Policy Analysis, 2002, 24(2): 81–112.
Deussen, T., Coskie, T., Robinson, L., and Autio, E. (2007). “Coach” Can Mean Many Things: Five Categories of Literacy Coaches in Reading First (Issues & Answers Report, REL 2007, No. 005). Washington, DC: U.S. Department of Education, Institute of Education Sciences, National Center for Education Evaluation and Regional Assistance, Regional Educational Laboratory Northwest. Available online at: http://ies.ed.gov/ncee/edlabs.

76
Duffy, G. G., Roehler, L. R., Meloth, M. S., Vavrus, L. G., Book, C., Putnam, J., and Wesselman, R. “The Relationship Between Explicit Verbal Explanations During Reading Skill Instruction and Student Awareness and Achievement: A Study of Reading Teacher Effects.” Reading Research Quarterly, 1986, 21(3): 237–252.
Elmore, R. Bridging the Gap Between Standards and Achievement: The Imperative for Professional Development in Education. Washington, DC: Albert Shanker Institute, 2002. Available online at: http://www.ashankerinst.org/Downloads/Bridging_Gap.pdf.
Fischer, G.H. and Molenaar, I.W. Rasch Models: Foundations, Recent Developments and Applications. NY: Springer-Verlag, 1995.
Fletcher, J. M. and Lyon, G. R. “Reading: A Research-Based approach.” In W. M. Evers (Ed.), What’s Gone Wrong in America’s Classrooms. Stanford, CA: Hoover Institute Press, 1998: 49–90.
Foorman, B.R., and Moats, L.C. “Conditions for Sustaining Research-Based Practices in Early Reading Instruction.” Remedial and Special Education, 2004, 25(1): 51–60.
Garet, M., Porter, A., Desimone, L., Birman, B., and Yoon, K. S. “What Makes Professional Development Effective? Results From a National Sample of Teachers.” American Educational Research Journal, 2001, 38(4): 915–945.
Grant, S. G., Peterson, P. L., and Shojgreen-Downer, A. “Learning to Teach Mathematics in the Context of Systemic Reform.” American Educational Research Journal, 1996, 33(2): 502–541.
Hargreaves, A. and Fullan, M. G. Understanding Teacher Development. London: Cassell, 1992.
Hays, W. L. Statistics for the Social Sciences. New York, NY: Holt, Rinehart, & Winston, 1973.
Hayes, J., and Hatch, J. “Issues in Measuring Reliability: Correlation Versus Percentage of Agreement.” Written Communication, 1999, 16(3): 354–367.
Hill, H. C. “Learning in the Teaching Workforce.” The Future of Children, 2007, 17(1): 111-127.
Hill, C. J., Bloom, H. S., Black, A. R. and Lipsey, M. W. Empirical Benchmarks for Interpreting Effect Sizes in Research. New York, NY: MDRC, 2007.
Hopkins, K. H. Educational and Psychological Measurement and Evaluation (Eighth ed.). Boston, MA: Allyn and Bacon, 1998.
Jacob, B. and Lefgren, L. “Can Principals Identify Effective Teachers? Evidence on Subjective Performance Evaluation in Education.” Journal of Labor Economics, 2008, 26(1): 101–136.
Kane, T.J., Rockoff, J.E., and Staiger, D.O. What Does Certification Tell Us About Teacher Effectiveness? Evidence from New York City. Cambridge, MA: Harvard School of Education, 2006.
Kennedy, M. M. Form and substance in in-service teacher education (Research monograph no. 13). Arlington, VA: National Science Foundation, 1998.
Knapp, M. S. “Between Systemic Reforms and the Mathematics and Science Classroom: The Dynamics of Innovation, Implementation, and Professional Learning. Review of Educational Research, 1997, 67(2): 227–266.
Lieberman, A. (Ed.). “Practices that Support Teacher Development: Transforming Conceptions of Professional Learning.” In M. W. McLaughlin and I. Oberman (Eds.), Teacher Learning: New Policies, New Practices. New York, NY: Teachers College Press, 1996: 185-201.

77
Lieberman, A., and McLaughlin, M. W. “Networks for Educational Change: Powerful and Problematic.” Phi Delta Kappan, 1992, 73: 673–677.
Linacre, J.M. A User's Guide to W I N S T E P S® M I N I S T E P Rasch-Model Computer Programs Program Manual. Available at http://www.winsteps.com, 2007.
Little, J. W. “Teachers’ Professional Development in a Climate of Educational Reform.” Educational Evaluation and Policy Analysis, 1993, 15(2): 129–151.
Loucks-Horsley, S., Hewson, P. W., Love, N., and Stiles, K. E. Designing Professional Development for Teachers of Science and Mathematics. Thousand Oaks, CA: Corwin Press, Inc., 1998.
McCutchen, D., Abbott, R. D., Green, L. B., Beretvas, S. N., Cox, S., Potter, N. S., Quiroga, T., and Gray, A. “Beginning Literacy: Links Among Teacher Knowledge, Teacher Practice, and Student Learning.” Journal of Learning Disabilities, 2002, 35: 69–86.
McGill-Franzen, A., Allington, R. L., Yokoi, L., and Brooks, G. “Putting Books in the Classroom Seems Necessary But Not Sufficient.” Journal of Educational Research, 1999, 93(2): 67–74.
Moats, L. C. Teaching Reading IS Rocket Science: What Expert Teachers of Reading Should Know and Be Able To Do. Washington, DC: American Federation of Teachers, 2002.
Moats, L.C. Language Essentials for Teachers of Reading and Spelling (LETRS). Longmont, CO: Sopris West Educational Services, 2005.
Moats, L. C. “How Spelling Supports Reading.” American Educator, 2005, Winter: 12–43.
Moats, L. C., and Foorman, B. R. “Measuring Teachers’ Content Knowledge of Language and Reading.” Annals of Dyslexia, 2003, 53: 23–45.
National Institute of Child Health and Human Development. Report of the National Reading Panel. Teaching Children to Read: An Evidence-Based Assessment of the Scientific Research Literature on Reading and its Implications for Reading Instruction: Reports of the Subgroups (NIH Publication No. 00-4754). Washington, DC: U.S. Government Printing Office, 2000.
Nye, B., Konstantopoulos, S., and Hedges, L. “How Large are Teacher Effects?” Educational Evaluation and Policy Analysis, 2004, 26(3): 237–257.
O’Connor, R. E. “Teachers Learning Ladders to Literacy.” Learning Disabilities Research and Practice, 1999, 14: 203–214.
Raudenbush, S. W., Johnson, C., and Sampson, R. J. “A Multivariate, Multilevel Rasch Model with Application to Self-Reported Criminal Behavior.” Sociological Methodology, 2003, 33(1): 169–211.
Richardson, V., and Placier, P. “Teacher Change.” In V. Richardson (Ed.), Handbook of Research on Teaching (4th Ed.). New York: Macmillan, 2001: 905-947.
Rockoff, J.E. “The Impact of Individual Teachers on Student Achievement: Evidence from Panel Data.” The American Economic Review, 2004, 94(2): 247–252.
Rockoff, J. E. Does Mentoring Reduce Turnover and Improve Skills of New Employees? Evidence from Teachers in New York City. Working Paper W13863. Washington, DC: National Bureau of Economic Research, March 2008.
Stemler, S. E. “A Comparison of Consensus, Consistency, and Measurement Approaches to Estimating Interrater Reliability.” Practical Assessment, Research and Evaluation, 2004, 9: 1–14.

78
Sloan, H. A. “Direct Instruction in Fourth and Fifth Grade Classrooms.” Unpublished Doctoral Dissertation. Dissertation Abstracts International, 1993, 54(08): 2837A. (UMI No. 9334424).
Stiles, K., Loucks-Horsley, S., and Hewson, P. Principles of Effective Professional Development for Mathematics and Science Education: A Synthesis of Standards (NISE Brief, Vol. 1). Madison, WI: National Institutes for Science Education, 1996.
Supovitz, J. A. “Translating Teaching Practice into Improved Student Performance.” In S. H. Fuhrman (Ed.), From the Capitol to the Classroom: Standards-Based Reform in the States (100th Yearbook of the National Society for the Study of Education, Part II). Chicago: University of Chicago Press, 2001: 81-98.
Talbert, J. E., and McLaughlin, M. W. “Understanding Teaching In Context.” In D. K. Cohen, M. W. McLaughlin, and J. E. Talbert (Eds.), Teaching for Understanding: Challenges for Policy and Practice. San Francisco, CA: Jossey-Bass, Inc., 1993: 167-206.
Taylor, J. (2007). “Instructional Coaching: The State of the Art,” in Effective Teacher Leadership: Using Research to Inform and Reform (eds. M. M. Mangin and S. R. Stoelinga). New York, NY: Teachers’ College Press.
Tienken, C. H. “The Effect of Staff Development in the Use of Scoring Rubrics and Reflective Questioning Strategies on Fourth-Grade Students’ Narrative Writing Performance.” Dissertation Abstracts International, 2003, 64(2): 388A (UMI No. 3081032).
U.S. Department of Education, Office of the Under Secretary, Policy and Program Studies Service. Improving Teacher Quality in U.S. School Districts: Districts’ Use of Title II, Part A, Funds in 2002-2003. Washington, DC, 2005.
U.S. Department of Education, Office of Planning, Evaluation and Policy Development, Policy and Program Studies Service. Reading First Implementation Evaluation: Interim Report. Washington, DC, 2006.
U.S. Department of Education, Office of Planning, Evaluation and Policy Development, Policy and Program Studies Service. State and Local Implementation of the No Child Left Behind Act, Volume I—Teacher Quality Under NCLB: Interim Report, Washington, DC, 2007.
Wright, B. D., and Linacre, J. M. “Reasonable Mean-Square Fit Values.” Rasch Measurement Transactions, 1994, 8(3): 370. Available online at: http://www.rasch.org/rmt/rmt83b.htm.
Yoon, K. S., Duncan, T., Lee, S. W.-Y., Scarloss, B., and Shapley, K. Reviewing The Evidence On How Teacher Professional Development Affects Student Achievement (Issues & Answers Report, No. 033), Washington, DC: U.S. Department of Education, Institute of Education Sciences, National Center for Education Evaluation and Regional Assistance, Regional Educational Laboratory Southwest, 2007.
Yoon, K. S., Garet, M., and Birman, B. Examining the Effects of Mathematics and Science Professional Development on Teachers’ Instructional Practice: Using Professional Development Activity Log. Washington, DC: Council of Chief State School Officers, 2007.

APPENDIX A THEORY OF ACTION AND DEVELOPMENT OF
THE PD INTERVENTIONS FOR THE EARLY
READING PD INTERVENTIONS STUDY


A-1
APPENDIX A
THEORY OF ACTION AND DEVELOPMENT OF THE PD
INTERVENTIONS FOR THE EARLY READING PD
INTERVENTIONS STUDY
As discussed in chapter 1, there are few rigorous studies of the impact of professional development on teacher and student outcomes (a total of nine, of which six examined English language arts outcomes, according to Yoon et al. 2007), and there is even less evidence on the importance of specific features of PD. Although the evidence is limited, there is some correlational support for specific features of PD that might improve teacher knowledge, classroom instruction, and student achievement and might produce sustained change over time. These features, and how the PD literature suggests that they fit within the study’s theory of change, are described in the first section below. The remainder of the appendix provides in-depth details on the two specific PD interventions that were selected in accordance with this theory of change.
I. Theory of Action for the Early Reading PD Interventions Study
Overview
The theoretical model of professional development that guided the selection of the PD interventions tested in the study is grounded in the relationships among three structural features and three core features of professional development. (See exhibit A-1.) The three structural features—form, duration, and collective participation—describe the basic organization of the PD. These structural features are enabling conditions, which are theorized to set up the arrangements necessary for the core features of the professional development to be implemented. The three core features—content focus, active learning, and coherence—characterize the work that takes place during the PD. (See the section that follows for more detail on the structural and core features.)
We expect PD that incorporates the structural and core features to improve teachers’ knowledge and skills concerning the content they teach, as well as their knowledge, skills, and beliefs about how students learn this content. These changes in knowledge are expected to change teachers’ classroom instruction, and these changes in classroom instruction are expected to improve student academic outcomes.

Exhibit A-1. Theory of Action for the Early Reading PD Interventions Study
Key Features of Promising Professional Development
Form of Activity Linked to practice
Duration Long time span
Many hours
Collective Participation
Teachers Others in school
Focus on Content Content students learn
How students learn
Active Learning Practice
Feedback Reflection
Coherence Aligned with standards Consistent with teacher
goals Consistent communications
Teacher and Student Outcomes
Teacher characteristics
Background, training, experience, prior
professional development
Teacher practice
Student academic outcomes
Teacher knowledge
Student characteristics
Background, prior achievement
A-2

A-3
Core Features
The three key core features are a focus on the content of what teachers teach; opportunities for teachers to learn and connect their learning to practice; and coherence among professional development goals, teachers’ own goals, and the standards and assessments that should guide teachers’ practice (Garet et al. 2001).
Focus on content to be taught students. Professional development content that focuses on what students are expected to learn and how students learn the subject matter may support teacher knowledge and practice in ways that improve student achievement (Cohen and Hill 2001; Garet et al. 2001; Kennedy 1998; Carpenter et al. 1989). For example, in a small experimental study, McCutchen and colleagues (2002) found that a professional development intervention that focused on content knowledge about the structure of the English language and how children learn to read produced effects on teacher knowledge, practice, and student achievement in kindergarten and first grade.
Opportunities for active learning. Active learning refers to the engagement of teachers in the learning process through observation, discussion, practice, and reflection. Teachers may benefit through opportunities to observe and be observed by expert teachers; opportunities to integrate learning into classroom practice; opportunities to review student work with others; and opportunities to reflect on, discuss, and write about their learning (Garet et al. 2001; Lieberman 1996; Loucks-Horsley et al. 1998).
Coherence of professional development activities with other aspects of teachers’ professional work. Professional development may be more effective when the activities and goals involved are aligned with other initiatives designed to change instruction, including standards and assessments and curriculum adoptions; when they are consistent with teachers’ personal goals for their development; and when they afford opportunities for teachers to communicate with others involved in professional development activities (Cohen and Hill 1998; Garet et al. 2001; Grant, Peterson, and Shojgreen-Downer 1996; Lieberman and McLaughlin 1992).
Structural Features
The three core features are theorized to be supported by three key structural features:
Form of the activity (how it is organized). Traditionally, teacher professional development has consisted largely of short-term workshops (four or fewer hours) that are separated from the daily practice of teachers. Some evidence suggests that professional development activities that are incorporated in teachers’ daily school work—activities such as coaching and mentoring and in-school discussion groups—provide more opportunities for active learning and encourage greater coherence of activities with teachers’ and schools’ larger goals and teachers’ communications with others than professional development not incorporated in their school work. Further, when these activities are incorporated in teachers’ work, it may help sustain professional development over time (see duration, below) (Garet et al. 2001; see also Hargreaves and Fullan 1992; Little 1993; and Stiles, Loucks-Horsley, and Hewson 1996 for associations between form of activity and active learning).
Duration of the activity. Duration refers both to the time span of the effort and to the number of hours committed to the effort. Duration may be related to the form of the activity (e.g., in-school coaching tends to be of greater duration than workshops). In turn, both span and number

A-4
of hours of professional development have been shown to be associated with opportunities for active learning (Garet et al. 2001; Cohen and Hill 2001; O’Connor 1999.)
Collective participation of groups of teachers. Including teachers from the same school, the same department within the school, or ideally, the same grade level in the school is thought to foster opportunities for collegial development that may improve professional development in the short-term and help sustain it over the long-term. Teachers engaged in a difficult learning process may benefit from the support of others who influence their practice—school administrators, fellow teachers, and parents (Ball 1996; Knapp 1997; Talbert and McLaughlin 1993; Elmore 2002).
II. Details on the Institute and Seminar Series
Selection and Development of the Intervention
In selecting the content, delivery, and themes for the teacher PD, the project staff based the specification on the three core features laid out in the study theory of change model shown in exhibit A-1 (content focus, active learning, and coherence).
The selection of the institute series tested in the study prioritized interventions that focused on the content of early reading instruction, and specifically, the components of reading instruction recommended by the National Reading Panel (NICHD 2000). During the process of preparing its initial proposal to the Institute of Education Sciences (IES), AIR conducted a review of available interventions to identify PD providers with materials explicitly referencing rigorous research on reading and capable of delivering an institute series on a national scale. Based on this review, the principal authors of the proposal (who became the project leadership team when the project began) selected the LETRS program (Language Essentials for Teachers of Reading and Spelling), a series of 12 content and activity modules grounded in scientifically based research.120 LETRS is designed to provide participants with a core understanding of relevant research and theory, as well as instructional information that complements their everyday teaching practices. Three topics in the LETRS modules were expanded for this study: the assessment of students’ reading skills; instructional interventions for readers who are having difficulties, including differentiated instruction; and vocabulary instruction.121 The lead LETRS trainer, with logistical support from the Early Reading PD Interventions Study intervention team, worked to design eight institute and seminar days emphasizing content relevant to second grade reading instruction, relying primarily on the LETRS modules and accompanying trainer materials.122
To address the second criterion for our professional development intervention, active learning, the PD selected complemented the presentation of information by the trainer with exercises each day for the participants. Active learning was operationalized as activities that asked participants to 120 For more information on the content of each module referenced in this report, please visit the publisher’s website: http://store.cambiumlearning.com/ProgramPage.aspx?parentId=074003176&functionID=009000008&site=sw. 121 As an additional resource for teachers, our lead LETRS trainer recommended the book Bringing Words to Life: Robust Vocabulary Instruction (Beck, McKeown, and Kucan 2002). Along with this book, teachers received a guide to the book’s contents that were integrated into institute day 4 (focusing on vocabulary learning). This resource provided additional information for teachers about introducing new words through a tiered model and developing student-friendly definitions. 122 The term “institute” was used primarily to describe a day that was focused on delivering content for the first time. The term “seminar” was used to describe a day that usually focused on reviewing content from past institutes and discussing the application of the content since it was introduced. In reality, all institute days briefly reviewed content from previous days, and seminars introduced some amount of new content.

A-5
analyze sections of text and examples of student work, develop strategies for classroom instruction, or analyze assessment data and develop related instructional plans: these opportunities allowed teachers to apply what they have learned in situations that are proxies for classroom use. Other activities asked participants to assume the role of their students by applying the skills that they themselves would be teaching their students to use.
To address the third criterion, coherence, the PD selected was designed to promote alignment with the reading programs used in the study schools (see textbox on next page for a description of the programs’ features and how they were selected), with district/state policy and content standards, and with teachers’ prior knowledge about reading instruction. One feature of the two comprehensive reading programs used in the study districts was the detailed manuals for teachers that accompany each lesson. The content of the PD selected was designed to be consistent with these manuals, and teachers were asked to refer to the manuals during PD activities. The PD materials incorporated the state and district content standards relevant to second grade, and teachers referred to the standards during PD activities. To promote coherence, the PD used specific activities to build these connections among the general content of the PD, state and district standards, and recommendations offered in the manuals of the selected reading series.
The institutes and seminars were designed to be consistent with the three structural features of promising PD: connections to teachers’ daily work (form), extended duration and collective participation. With respect to form, the institutes and seminars were organized as a traditional course, but had built in “bridging activities” to connect what was learned to the teachers’ classroom instruction. The coaching intervention in treatment B was designed to test the impact of PD embedded in teachers’ daily work.
To address the need for duration, the institutes and seminars were designed to have 6 hours of instruction per day for eight days, exclusive of breaks (48 hours total). The first three days were scheduled in the summer and the remaining five approximately once a month during the school year.
Finally, with respect to collective participation, all second grade teachers in each participating school were invited to attend together, along with any special education teachers and teachers of students with limited English proficiency who support second grade reading instruction, the reading specialist at the school, and the principal. (Although staff members other than regular teachers were invited to attend, regular second grade teachers and their students were the focus of the impact analysis.)
The Content and Structure of the Teacher Institute and Seminar Intervention
The following outline indicates the main focus for each of the five institute days for teachers:
Institute Day 1: The Challenge of Learning to Read
• Brief overview of the study • Participation in the Survey of Reading Content and Practices • Introduction to LETRS Module 1 • Learning to read is not natural • What the mind does when it reads (the four processor system)

A-6
Selection and Description of Reading Programs
The purpose of the study’s interventions was to provide PD on reading instruction, not to train teachers on how to implement their reading programs. However, to ensure compatibility between the content of the PD and the instructional context in which the content would be applied, and to minimize variability in the reading curriculum while still providing a test of the PD in multiple settings, we focused on recruiting schools that used one of two core reading programs. Details on the selection of the programs and an overview of the programs selected are provided below. Program Selection. The process of selecting the two reading programs involved four steps:
• Identifying Potential Programs: To determine which programs were being used in enough potentially eligible districts to support the study, we contacted major publishers to get a list of districts where their programs were being implemented as part of the study recruitment and screening process. We initially identified five programs in wide enough use to support the study.
• Determining Compatibility of the Program with the Recommendations of the National Reading Panel (NRP): We compared the programs’ content with the recommendations of the NRP (NICHD 2000) on research-based reading-instruction. All five programs provided content on the five “essential” components of reading instruction: phonemic awareness, phonics, and fluency (“word-level” content), and vocabulary and comprehension (“meaning-level” content).
• Ensuring Compatibility with the Selected Teacher PD: We analyzed compatibility of the programs with the content of the planned PD to narrow the list of programs—a focus on the five “essential” components of reading instruction; how children learn to read; formal and informal ongoing assessment; and differentiating instruction to meet individual learner needs.
• Final Selection of Programs: Independent, external advisors to the study reviewed our recommendations and agreed on two reading programs suggested by study staff. These two reading programs were being used by enough districts and schools to make the study possible, and they were compatible with both the research base on reading instruction and the planned PD.123
Description of Programs Selected. The two reading programs used by participating school districts shared the following characteristics:
• An organization based on topical themes, with each lesson paced over 5 days and each topical theme paced over approximately 30 days. Each day’s instruction is split up into pre-reading, reading and comprehension, and writing activities.
• Instructional materials that include decodable texts; reading anthologies; support for phonics instruction, such as sound-spelling cards; and materials for readers who need extra practice or specialized materials (e.g., English language learners). Materials include both narrative and expository texts, with ties made to other subject areas like science and social science.
123 The names of the reading programs have been withheld to protect the identities of the publishers. The Early Reading PD Interventions Study is a test of specific PD interventions; it is not designed to test the effectiveness of the reading programs used in participating schools.
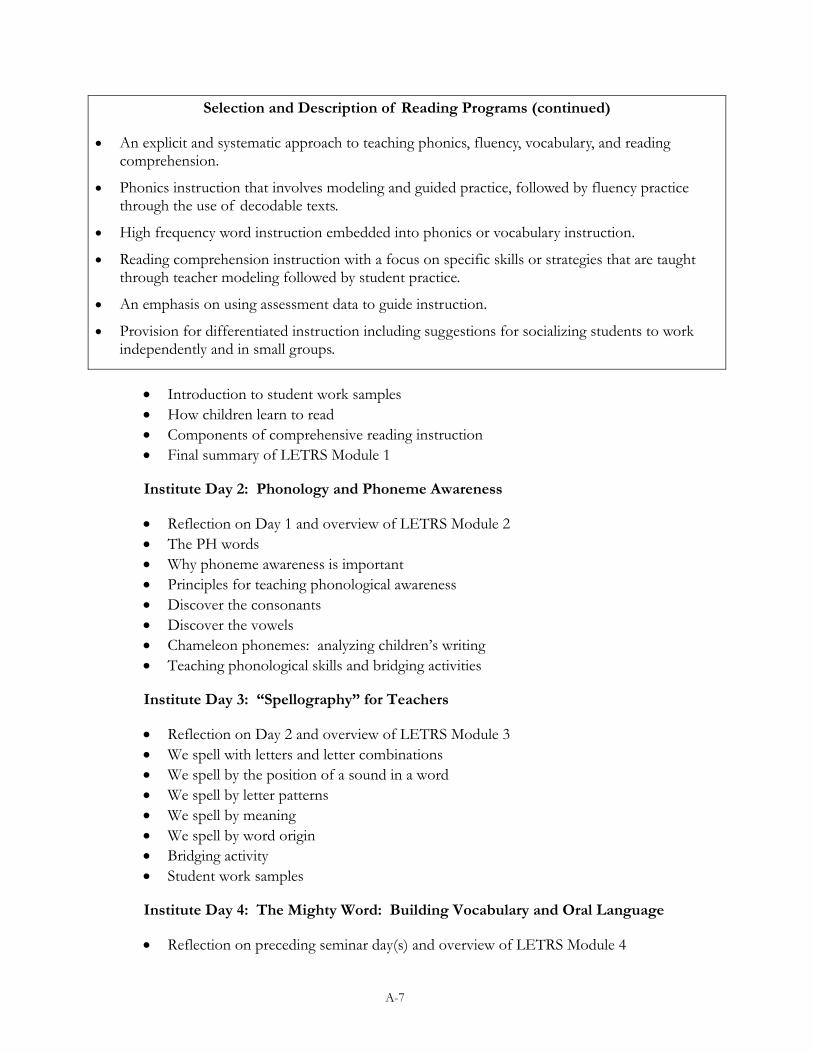
A-7
Selection and Description of Reading Programs (continued)
• An explicit and systematic approach to teaching phonics, fluency, vocabulary, and reading comprehension.
• Phonics instruction that involves modeling and guided practice, followed by fluency practice through the use of decodable texts.
• High frequency word instruction embedded into phonics or vocabulary instruction.
• Reading comprehension instruction with a focus on specific skills or strategies that are taught through teacher modeling followed by student practice.
• An emphasis on using assessment data to guide instruction.
• Provision for differentiated instruction including suggestions for socializing students to work independently and in small groups.
• Introduction to student work samples • How children learn to read • Components of comprehensive reading instruction • Final summary of LETRS Module 1
Institute Day 2: Phonology and Phoneme Awareness
• Reflection on Day 1 and overview of LETRS Module 2 • The PH words • Why phoneme awareness is important • Principles for teaching phonological awareness • Discover the consonants • Discover the vowels • Chameleon phonemes: analyzing children’s writing • Teaching phonological skills and bridging activities
Institute Day 3: “Spellography” for Teachers
• Reflection on Day 2 and overview of LETRS Module 3 • We spell with letters and letter combinations • We spell by the position of a sound in a word • We spell by letter patterns • We spell by meaning • We spell by word origin • Bridging activity • Student work samples
Institute Day 4: The Mighty Word: Building Vocabulary and Oral Language
• Reflection on preceding seminar day(s) and overview of LETRS Module 4

A-8
• Vocabulary and learning to read • Shallow and deep word knowledge • Features of words • Teaching vocabulary • Instructional sequence • Bridging activity
Institute Day 5: Digging for Meaning: Teaching Text Comprehension
• Reflection on prior PD and overview of LETRS Module 6 • Research on comprehension • The text, reader, task, and context • Difficulties at the sentence level • Anticipating comprehension problems • Narrative and expository text structure • Reading comprehension strategies that work • Bridging activity
The following outline indicates the main focus for each of the three seminar days:
Seminar Day 1: Getting Up to Speed: Developing Fluency
• Overview of LETRS Module 5 • Introduction to reading fluency • Definitions of fluency • Causes of dysfluent reading • Measurement of reading fluency • Strategies to improve fluency • Bridging activity • Discussion of student work samples • Grouping for instruction: analysis leads instruction • Responses to questions and concerns
Seminar Day 2: Reviewing and Extending Phonemic Awareness: Review of LETRS Modules 2 and 3 and Introduction to Differentiated Instruction
• Overview of day • Discussion of student work samples • Review of LETRS Modules 2 and 3 • Introduction to differentiated instruction • Responses to questions and concerns

A-9
Seminar Day 3: Reviewing Institute and Seminar Topics and Implementing Differentiated Instruction
• Overview of day • Analyzing student work • Review the four processing systems model • Review Module 2 • Review Module 3 • Review Module 4 • Review Module 5 • Review Module 6 • Implementing differentiated instruction • Planning for the future • Thank you and seminar evaluation
III. Details on the Coaching Intervention
Selection and Development of the Intervention
The coaching intervention selected was designed to support teachers in implementing what they learned in the institutes and seminars. The coaching component focused on the same content as the institutes and seminars, but it differed in form by providing PD embedded in the daily work of classroom instruction.
As part of the process of soliciting a coaching provider for the study, the study team conducted a review of the available literature on coaching. Although literature is emerging on features of coaching, we could not locate any rigorous evidence on the impact of coaching on student achievement.124 For example, the Yoon et al. (2007) research synthesis identified nine rigorous studies of the impact of PD on achievement; of these, all nine focused on PD organized as workshops and institutes; none focused on coaching.
The literature on coaching included evaluations of coaching models, technical guides to preparing coaches, policy statements about coach roles, and descriptive examples of coaching (for reviews see American Institutes for Research 2006 and Taylor 2007). This review revealed that the term “coaching” is used alternatively to describe the forms of coaching, the focus of coaching, and the practices of coaching. Four types of coaching were identified in the literature review conducted for the study: technical, problem solving, reflective practice, and collegial/team building:
• Technical coaching: The coach’s role is to help the teacher learn to apply specific new teaching practices and strategies.
• Coaching as problem solving: The coach’s role is to help the teacher (or a group of teachers) identify and solve a specific problem.
124 Studies of the impact of mentoring programs for new teachers are in progress. For example, a rigorous study of the impact of mentoring programs in the initial year of teaching on student achievement is currently being conducted by Mathematica Policy Research, with support from IES and a correlational study of the relationship between participation in an induction program and achievement was recently completed (Rockoff 2008).

A-10
• Coaching as reflective practice: The coach’s role is to facilitate teachers’ development as professionals who engage in inquiry about teaching practice.
• Coaching as team building: The coach’s role is to help teachers collaborate and develop into a community of learners.
Although these types seem distinct, coaching models in the literature draw on elements of more than one type. The intervention used in this study drew on two types: technical coaching and collegial/team building. On the basis of our review of the literature about coaching, we specified a coaching intervention that was designed to be technical in its approach but that also sought to build communities of learners who might sustain the benefits of a year of participation in the study.
The coaching was designed to achieve two main goals: to help teachers more fully understand and use the content of the LETRS training and to increase their ability to use the core reading program effectively. In particular, the coaching was designed to increase teachers’ ability to integrate new practices into their repertoire, exercise new practices at the right times with the right students, and find the right materials to use in the curriculum. Additionally, the coaching was designed to help teachers better understand and use assessment data and differentiate instruction for all their students. In the technical coaching model, coaches are expected to be well versed in relevant research, familiar with the core reading program, and able to help teachers use assessment data.
The secondary component of the coaching intervention—coaching to build a community of learners—was intended to help sustain change in practice once the coaching intervention ended. To meet the secondary goal of building community, coaches were expected to have skills at facilitation, active listening, and building the kind of “common language” and peer support that would encourage teachers to continue to work together around common issues of instructional practice.
Based on this specification, we conducted a review of 30 available coaching providers, and invited proposals from three potential providers. We invited the three to present in Washington, DC, and ultimately selected the Consortium for Reading Excellence (CORE). At the time of its selection, CORE had already been delivering a coach seminar and offering a schedule of varying amounts of classroom teacher coaching in school districts. CORE materials reflected the same principles that were integral to the Early Reading PD Interventions Study coach conceptual model; the materials also shared the conceptual foundation of the LETRS materials. In addition, the company demonstrated a commitment to evaluation and continuous improvement that met the study standards for high-quality professional development.
Training the Coaches
The half-time coaches were prepared for their work in the study schools by coach training provided by the Consortium for Reading Excellence (CORE). The CORE curriculum consisted of a three-day institute, on-site follow-up training, and a resource binder. The curriculum was presented by two CORE trainers who were former teachers with coaching and teacher training experience. Each specialized in supporting the implementation of one of the two core reading curricula being used in the study districts by reinforcing specific instructional routines used by each curriculum. The strategies and tools the training emphasized were informed by recommendations of the National Reading Panel (NRP). During the implementation year, each trainer was responsible for supporting the coaches in the three districts using the reading curriculum that was her specialty.

A-11
During the summer of the implementation year, the CORE coach trainers collaborated in presenting the three-day institute, which was attended by all coaches from the six participating districts. After the institute, the coaches returned to their districts, where they became acquainted with the teachers and students in their assigned study schools. The coaches assisted the teachers as they prepared their classrooms for the new school year and gathered and organized full sets of core reading curriculum materials (i.e., Teachers’ Editions, student books, and supplementary guides and workbooks for assisting struggling readers). During the school year, the CORE trainers participated in monthly conference calls with the coaches in each district, planned and implemented the schedule of on-site follow-up visits, developed individual goals for the coaches, and assessed each coach’s progress over the year.
The Summer Coaching Institute
The coach institute addressed the following topics:
• The coach’s role in implementing effective reading instruction in the classroom;125
• How to coach individual teachers using a multi-step coaching cycle that includes initiating and planning; executing; reflecting and giving feedback;126
• Understanding the purpose and use of various student assessments and ways to analyze data; and guiding and encouraging teachers to assess students and graph their progress, and use the information to address individual students’ needs drawing on materials in the core reading program;127 and
• How to use a five-step problem-solving and decision-making model to facilitate grade-level meetings focused on building teachers’ capacity to examine student work and plan instruction.
The institute built in opportunities each day for coaches to discuss and practice strategies related to implementing their roles and for coaches and trainers to connect the lessons learned to the contexts of specific districts and core reading curricula.128 One afternoon was set aside for coaches to meet with the CORE trainer assigned to their district. This session focused on the pacing of the
125 In preparing the coach training for the study, CORE adapted materials used in their coach training program. CORE envisions reading coaches as fulfilling specific roles within the school’s overall implementation of a core reading program. The CORE model of reading program implementation involves six steps: (1) implement a research-based program (i.e., acquire and distribute materials, provide professional development for teachers, and familiarize site administrators with expectations for program implementation); (2) create a timeline (pacing guide and calendar) for implementing the program; (3) evaluate progress by assessing students’ reading skills; (4) analyze the data (understand individual students’ performances and patterns of strength and need within classrooms, schools, and the district); (5) intervene by developing intervention plans for students and struggling teachers; and (6) validate, recalibrate (based on results of achievement tests), and refine delivery of the program to address teacher needs—for example, revise the pacing plan, or add supplementary materials. In the training provided for the study, CORE introduced all six steps but focused on steps (1), (2), (4), and (5). 126 Topics included methods for documenting classroom observations and for framing feedback, questions, and suggestions in discussions with teachers. 127 The coach institute gave emphasis to summarizing and displaying results of progress assessments with the goal of helping teachers identify patterns of need in classrooms and thus facilitate their planning and delivery of interventions to their students. 128 In particular, the training included break-out sessions during which coaches worked in groups based on the reading program adopted in their district. In these sessions, which were led by a CORE trainer who had extensive experience with the program, the coaches analyzed the program’s content, organization, pacing, assessments, and supplemental materials, as well as rubrics for assessing how fully the program was being implemented in individual classrooms.

A-12
district-adopted reading curriculum and the use of curriculum-embedded and other assessments used in the school.
The topics and activities during each day of the coach summer institute are described below.
Coach Summer Institute Day 1: Coach Role and Coaching Cycle
On day 1, coaches discussed materials to be used during the coaching interaction with teachers, including templates for planning, conducting observations, and providing feedback. Using a CORE-developed training video about program routines in phonics, the coaches practiced the skills modeled for each of the three phases of the coaching cycle. The topics for day 1 were:
• Introduction to the coaching institute and expected outcomes for participants • Skills and practices of effective reading coaches • Coach roles and responsibilities and interaction with school principals and district
administrators • Coach schedule management: developing a calendar • Three phases of coaching
— Initiating and planning — Executing — Reflecting and giving feedback
• Steps in implementing a comprehensive reading instruction program
Coach Summer Institute Day 2: Implementation of the Core Reading Program and Student and Class Assessment
On day 2, the CORE trainers led coaches in discussing and practicing two topics: observing and identifying teachers’ strengths and difficulties in implementing the reading program with the structure and pacing specified by the program developers; and supporting teachers in interpreting and using student performance data to differentiate instruction. The topics for day 2 were:
• Addressing teacher concerns about implementation of the reading program — Identifying teacher difficulties in implementation — Intervention strategies to address teacher implementation concerns — Conducting classroom observations using an observation checklist for second grade — Using the study’s coach activity log to document coach/teacher interaction — Using the study’s coach time allocation log
• Interpreting assessment data at the individual and class levels — Understanding assessment data from the reading program (unit and theme
assessments) — Understanding assessment data from progress monitoring tests (DIBELS, Oral
Reading Fluency) — Using forms to summarize and interpret classroom data — Facilitating data discussions using CORE guidelines for conducting team meetings

A-13
Coach Summer Institute Day 3: Review of Day 1 and Day 2 Concepts and Strategies; Differentiating Instruction; and Facilitating Team Meetings
On day 3, the CORE trainers conducted a review and then led coaches in discussing and practicing two new topics: differentiation of reading instruction, especially through use of materials for special populations of students provided in the core reading programs; and planning and facilitating grade level meetings. The topics for day 3 were:
• Developing the coach’s program review agenda — Using CORE’s assessment framework to anticipate availability of assessment data — Using a school calendar and pacing template
• Supporting differentiated instruction during program implementation — Understanding the materials available in the program — Guiding questions to use with teachers — Guidelines for planning differentiated instruction
• Managing team-level meetings — Purpose of team meetings — Process of team meetings — Creating an agenda and focus — Steps in problem solving and decision making — Generating solution-based ideas and actions
Follow-up Coach Training during the 2005–2006 School Year
Each coach trainer visited her districts four times during the implementation year to provide an additional six days of on-site professional development for the coaches. Three of the sessions were led by the CORE trainer and the other, a one-day meeting, was facilitated jointly by the CORE and LETRS trainers for the district. The on-site professional development was also observed by member of the study’s staff.
Each on-site visit to the study districts had three components:
• Coach cycle practice;
• Review of LETRS concepts and research on reading instruction; and
• Use of CORE and LETRS resources for observation, instruction, assessment, differentiated instruction, and team meetings
When possible, teacher observations were conducted in one or more classrooms at the school hosting the CORE visit. CORE trainers met with coaches individually to observe them practice coaching cycle skills, give feedback, and respond to their questions about teacher practice, student difficulties, and the core reading curriculum itself. CORE trainers also produced written summaries of the day’s activities and the progress that coaches were making in their schools.
Printed Resources
The materials in the coaches’ resource binders included literature on coaching and program implementation, and a set of tools and strategies for literacy coaches to use in implementing the

A-14
coaching cycle, planning teacher meetings, and developing teachers’ practice in assessment and differentiated instruction. In addition to the resource binder, coaches received documents developed collaboratively by the trainers from CORE and LETRS, the provider of the teacher PD, that specified the connections between institute and seminar content and the core reading curriculum presented in the Teacher’s Editions.

APPENDIX B DETAILS ON THE STUDY DESIGN AND
IMPLEMENTATION


B–1
APPENDIX B
DETAILS ON THE STUDY DESIGN AND IMPLEMENTATION
This appendix provides additional details related to the design and implementation of the Early Reading PD Interventions Study, including comparisons of the teacher samples with similar national populations; teacher-level exit and entry into the study schools during the study; definitions for samples referred to in the report; and estimates of the study’s statistical precision based on data used in the analysis.
I. Similarity of the Teacher Sample to National Populations
Table B-1 summarizes the characteristics of teachers participating in the study and the national population of teachers from urban or urban fringe elementary schools. On average, the percent of teachers who reported holding a master’s degree or above was 52 for the national urban/urban fringe sample and 53 for the implementation year spring study sample. The percent of teachers who reported three years of experience or less was 18 for the national sample and 15 for the study sample. Ten percent of the national sample teachers were African American, and 10 percent were Hispanic. Among the study sample teachers, 42 percent were African American and 2 percent were Hispanic.
Table B-1. Characteristics of Average Urban or Urban Fringe U.S. Second Grade Teachers and Study Teachers [Implementation Year Spring Sample]
Characteristics Average Urban/Urban Fringe
U.S. School Study Teachers Level of Education (percent) Master’s or above 51.8 53.1
Years of Experience (percent) 3 years or less 17.9 14.9 4–10 years 29.3 35.5 11–20 years 27.0 23.6 More than 20 years 25.8 26.0 Race/Ethnicity (percent) White 76.2 54.9 African American 9.9 41.6 Hispanic 10.4 2.0 Asian 1.9 0.8 Native American Low n 2.4 Number of Teachers 244,100 270 SOURCE: U.S. Department of Education, National Center for Education Statistics (NCES) Schools and Staffing Survey (SASS) Public School Teacher Questionnaire 2003–2004; and PD Impact Teacher Background Survey.
NOTES: SASS data filtered by Main Assignment (Regular full time), Grade (second grade), and Census school locales that were similar to the study schools (Large City, Mid-Size City, and Urban Fringe of Large City).

B–2
II. Post-Random Assignment Teacher Exit and Entry
As explained in chapter 2, all 90 schools were randomly assigned to condition in spring 2005 and remained in the sample throughout the study. In the spring of 2005, prior to random assignment, we obtained preliminary rosters from each of the 90 schools, listing the teachers school administrators then anticipated would be assigned to teach second grade in the sample schools in the coming fall. School administrators expected these initial rosters to change by fall 2005 as teachers decided whether to return in the fall, school enrollment numbers were finalized, new teachers were hired, and other decisions were made about class sizes and teaching assignments.
We obtained updated rosters from the treatment group schools during summer 2005 so that teachers could be invited to the institutes. These rosters reflected administrators’ expectations just prior to the summer institutes about who would be staffed in their schools for the 2005–2006 school year. Updated rosters were obtained from the control schools when school opened in the fall of 2005.
Because the projected second grade staffing for each study school was uncertain throughout the spring and summer of 2005, and because the information on the preliminary rosters was not found to be accurate, we did not begin to track teacher movement in and out of the schools until the opening of school in fall 2005, when staffing decisions for the school year began to stabilize and data collection began in the control schools.
At each wave of data collection we included all regular second grade teachers teaching reading in the 90 schools at the time of the data collection. Exhibit B-1 summarizes participation rates of the teachers included in the implementation and follow-up year analysis samples. These teachers taught second grade in study schools between September 2005 and June 2006 and/or between September 2006 and June 2007. The teachers eligible to participate in the fall and spring data collections did not completely overlap because of personal and professional circumstances such as medical/maternity leaves, changes in teaching assignments, and reductions in force.
It is possible that teacher participation in the PD could have influenced teacher retention rates, and retention or turnover in teaching staff during the school year could have affected students’ academic outcomes. Thus, teacher retention could distort the apparent impact of the PD if it were unevenly distributed among treatment groups. Accordingly, we conducted tests of equivalence in retention rates across the three study groups by using records of teachers’ arrivals and departures that we maintained throughout the 2005–2006 and 2006–2007 school years. Table B-2 shows that over the implementation year (the fall 2005 and spring 2006 semesters), the overall retention rate was 96 percent. When we looked across the two years of the study (fall 2005 through spring 2007), the overall retention rate was 63 percent (see table B-3). There were no statistically significant differences in retention between the study groups within any district or overall, for either the implementation year or across the two years of the study.129 The reasons for teacher departures (e.g., frequently maternity leave and illness) appear to be unrelated to participation in the study.
129 Equivalence between groups on teacher retention across the two years of the study was tested by means of a simple Chi-square test using total numbers of teachers retained in each group (p = 0.81).

B–3
A related concern was the possibility for teacher crossover (i.e., teachers moving from one treatment group to another or to the control group); however, during either the implementation or follow-up year, no crossover occurred. Similarly, there was no school-level crossover.
Table B-2. Number and Percent of Implementation Year Fall Sample Teachers Who Were Also in the Implementation Year Spring Sample, Overall and by District and Group
District Institute Series Only (Group A)
Institute Series Plus Coaching (Group B)
Control Group
Total
N Percent N Percent N Percent N Percent 1 12 100.0 16 100.0 18 90.0 46 95.8 2 18 94.7 18 85.7 16 100.0 52 92.9 3 5 100.0 4 100.0 5 100.0 14 100.0 4 19 86.4 23 100.0 25 92.6 67 93.0 5 9 100.0 5 100.0 6 100.0 20 100.0 6 24 100;0 18 94.7 17 100.0 59 98.3 Total Number/ Percent 87 95.6 84 95.5 87 95.6 258 95.6 Number of Teachers at Baseline = 270; Number of Teachers in Implementation Year Spring Sample = 270.
Table B-3. Number and Percent of Implementation Year Fall Sample Teachers Who Were Also in Both the Fall and Spring Follow-up Year Samples, Overall and by District and Group
District Institute Series Only (Group A)
Institute Series Plus Coaching (Group B)
Control Group
Total
N Percent N Percent N Percent N Percent 1 7 58.3 11 68.8 13 65.0 31 64.6 2 12 63.2 14 66.7 11 68.8 37 64.2 3 3 60.0 4 100.0 5 100.0 12 85.7 4 11 50.0 16 69.5 17 63.0 44 61.1 5 6 66.7 4 80.0 3 50.0 13 65.0 6 16 66.7 10 52.6 9 52.9 35 58.3 Total Number/ Percent 55 58.2 58 65.9 58 61.5 171 63.3 Number of Teachers at Baseline = 270; Number of Teachers in Follow-up Year Spring Sample = 254.

B–4
Exhibit B-1. Flowchart of Teacher Sample Exit and Entry
Institute Series Only (Group A) Institute Series Plus Coaching
(Group B) Control Group
Fall 2005: 91 participants Fall 2005: 88 participants Fall 2005: 91 participants
Spring 2006: 93 participants (87 original participants)
Spring 2006: 88 participants (84 original participants)
Spring 2006: 89 participants (87 original participants)
late entries: 6 late entries: 4 late entries: 2
departures: 4 original
(4) departures: 4 original
(4) departures: 4 original
(4)
changed grades 1 changed jobs 1 long-term leave/left school 4
changed jobs 1 transferred/left school 1 transferred/left school 1 resigned/retired 2 retired 1
Fall 2006: 85 participants (56 original participants)
Fall 2006: 84 participants (61 original participants)
Fall 2006: 81 participants (62 original participants)
late entries: 28 late entries: 22 original participant re-entry: 1
departures: 36 original
(31)
late arrivals
(5) departures: 26 original
(23)
late entries
(3) late entries: 18
changed grades 20 4 changed grades 11 1 departures: 27 original
(26)
late entries
(1) transferred/left school 7 0 transferred/left school 10 1 changed grades 15 1 retired 2 0 resigned/retired 1 1 changed jobs 4 0 reason unknown 2 1 deceased 1 0 transferred/left school 6 0 retired 1 0
Spring 2007: 85 participants (55 original participants)
Spring 2007: 85 participants (58 original participants)
Spring 2007: 84 participants (58 original participants)
late entry: 1 late entries: 6 late entries: 7
departure: 1 original
(1)
late arrivals
(0) departures: 5 original
(3)
late entries
(2) departures: 4 original
(3)
late entries
(1)
changed grades 2 0 changed grades 1 0 changed grades 1 0
leave/transferred/left school 2 1 changed job 1 0
reason unknown 0 1 long-term leave/left school 1 1
Number of Teachers in Study in Implementation Year Fall Sample
(N = 270)

B–5
III. Samples Referenced in the Report
Throughout this report, references are made to six samples of teachers and three samples of students defined by the semesters during which they participated in the study.
Teacher Samples
• The implementation year fall sample consisted of 270 treatment and control group teachers who were the “teacher of record” in regular second grade classrooms in the study schools in fall 2005 after the districts had completed staffing adjustments during the first month of school.130 This sample was defined to compare teachers as close to baseline as possible.
• The implementation year spring sample consisted of 270 treatment and control group teachers who were the teachers of record in treatment A, B, or business as usual (control) schools in spring 2006. This sample represents the primary impact sample for the study—the teachers for whom both knowledge and practice outcomes data were collected and included in the main impact analyses. Among these 270 teachers, 258 (96 percent) were “original” teachers—surviving members of the implementation year fall sample—and 12 (4 percent) were “late entries” who joined the study after fall 2005. 131
• The follow-up year fall sample consisted of 250 treatment and control group teachers who were teachers of record in the study schools in fall 2006 after the districts had completed staffing adjustments during the first month of school. This sample represents the teacher practices follow-up impact sample for the study—the teachers for whom practice outcomes data were collected and included in the follow-up impact analyses. This sample was comprised of 179 (72 percent) original teachers and 71 (28 percent) late-entries who joined the study after fall 2005.
• The follow-up year spring sample consisted of 254 treatment and control group teachers who were teachers of record in the study schools in spring 2007. This sample represents the teacher knowledge follow-up impact sample for the study—the teachers for whom knowledge outcomes data were collected and included in the follow-up impact analyses. This sample was comprised of 171 (67 percent) original teachers and 83 (33 percent) late entries who joined the study after fall 2005.
• The follow-up year fall stable sample consisted of the 179 treatment and control group teachers in the fall 2006 sample who had also been members of the implementation year fall and spring samples. This sample is used to investigate the relationship between the treatments and teacher practices outcomes among the teachers who were present from fall 2005 through fall 2006.
130 We use “teacher of record” to describe the teacher who spent the most time teaching in a classroom during a semester. In most cases, the teacher of record is the only teacher who taught in the classroom during the semester; but when one teacher was present in a classroom at the beginning of a semester and a second teacher was present at the end, the teacher of record was defined as the individual who spent the greater part of the semester in the classroom. 131 Note that students of teachers who leave the school early in a semester become the students of a (late entry) replacement teacher. Thus, while the departing teacher was excluded from impact analyses for that semester, their former students remained in the impact analyses as the students of replacement teachers.

B–6
• The follow-up year spring stable sample consisted of the 171 treatment and control group teachers in the spring 2007 sample who had also been members of the implementation year fall and spring samples as well as the follow-up year fall sample. This sample is used to investigate the relationship between the treatments and teacher knowledge outcomes among the teachers who were present from fall 2005 through spring 2007.
Student Samples
• The implementation year spring sample consisted of 5,530 second grade students who were in the study schools at the time of the spring 2006 student outcomes data collection (approximately February through May 2006).
• The implementation year stable students of stable teachers sample consisted of 4,012 students who remained in the study school throughout the implementation year and who were taught by teachers who also remained in the study school throughout this same year. This sample is used to investigate the relationship between the treatments and student outcomes among the teachers and students who were present for the full length of the implementation year. A similar sample for the follow-up year was not available, due to unavailable student attendance data in one of the study districts for that year.
• The follow-up year spring sample consisted of 5,297 second grade students who were in the study schools at the time of the spring 2007 student outcomes data collection (approximately February through May 2007).
IV. Estimates of Statistical Precision Based on Data Used in Analyses
As indicated in chapter 2, we designed the study to obtain a minimum detectable effect size (MDES) of 0.40 for teacher outcomes and 0.20 for student achievement. Intuitively, a minimum detectable effect is the smallest program impact that could be estimated with confidence given random sampling and estimation error.132 This metric, which is used for measuring the impacts of educational programs, is defined in terms of the underlying population standard deviation of student achievement. For example, a minimum detectable effect size of 0.20 indicates that an impact estimator can reliably detect a program-induced increase in student achievement that is equal to or greater than 0.20 standard deviations of the student distribution. This is equivalent to approximately four Normal Curve Equivalent (NCE) points on a nationally norm-referenced achievement test and translates roughly into the difference between the 25th and the 31st percentile.
Table B-4 lists the minimum detectable effect size (MDES) for the estimates of program impacts on all study outcomes during the implementation year. These minimum detectable effects are based on the actual numbers of students, teachers, and schools in the implementation year spring sample and not on the initial assumptions that guided the study design. Hence, the findings in table B-4 represent the actual precision of the present design as it materialized in the field during
132 A minimum detectable effect is defined as the smallest true program impact that would have an 80 percent chance of being detected using a two-tailed hypothesis test at the 0.05 level of statistical significance.

B–7
the first year of the study.133 These findings indicate that the MDES’s for the present study design and impact estimation model range from 0.42 to 0.53 for teacher knowledge outcomes, from 0.36 to 0.45 for teacher practice outcomes, and from 0.22 to 0.28 for the student achievement test scores. Table B-5 shows the MDES for the impact estimates at follow-up, which ranged from 0.23 to 0.27 for the student achievement test scores and 0.35 to 0.53 for teacher outcomes.
The MDES’s for the teacher knowledge subgroup and stable student and teacher analyses reported on in chapters 4 and 5 are provided in tables B-6 through B-8. The MDES’s for the interaction of baseline teacher knowledge scores with treatment group ranged from 0.53 to 0.95 for teacher knowledge outcomes, from 0.59 to 1.09 for teacher practice outcomes, and from 0.36 to 0.42 for the student achievement test scores (table B-6).
Table B-7 shows the MDES for the stable students of stable teachers implementation year sample estimates, which ranged from 0.25 to 0.28 for the student achievement test scores. The MDES’s for the stable teacher follow-up sample estimates were 0.39 to 0.50 for the teacher knowledge outcomes reported, and 0.64 to 0.67 for the teacher practice outcome reported (table B-8).
Table B-4. Minimum Detectable Effects for Implementation Year Spring Sample Impact Estimates
Outcomes Institute Series
Only vs. Control
Institute Series Plus Coaching vs.
Control
Institute Series Plus Coaching vs.
Institute Series Only
Teacher Knowledge Total Score (MDES) 0.42 0.42 0.42 Word Score (MDES) 0.42 0.42 0.42 Meaning Score (MDES) 0.53 0.53 0.53
Teacher Practice
Teacher-Led Explicit Instruction (MDES) 0.39 0.39 0.42 Independent Student Activity (MDES) 0.42 0.42 0.45 Differentiated Instruction (MDES) 0.39 0.36 0.36
Student Achievement
Test Score (MDES) 0.22 0.25 0.28 Dichotomous Outcome: At or Above Mean of Baseline Cohort (MDE in percent) 10.08 10.64 11.76
133 For the full sample, the number of degrees of freedom for estimating the standard error of an impact estimator is greater than 30. Thus, the minimum detectable effect size for an outcome is approximately 2.8 times the standard error of the estimate. For further discussion see Bloom (1995).

B–8
Table B-5. Minimum Detectable Effects for Follow-Up Year Sample Impact Estimates
Outcomes Institute Series
Only vs. Control
Institute Series Plus Coaching vs.
Control
Institute Series Plus Coaching vs.
Institute Series Only
Teacher Knowledge Total Score (MDES) 0.45 0.45 0.42 Word Score (MDES) 0.42 0.39 0.39 Meaning Score (MDES) 0.53 0.50 0.50
Teacher Practice
Teacher-Led Explicit Instruction (MDES) 0.50 0.48 0.50 Independent Student Activity (MDES) 0.48 0.45 0.48 Differentiated Instruction (MDES) 0.36 0.36 0.36
Student Achievement
Test Score (MDES) 0.23 0.24 0.27 Dichotomous Outcome: At or Above Mean of Baseline Cohort (MDE in percent) 10.00 10.59 11.79
Note: Impact analyses for teacher knowledge and student achievement are based on the follow-up year spring sample while impact analyses for teacher practice are based on the follow-up year fall sample.
Table B-6. Minimum Detectable Effects for Implementation Year Sample RCPS Baseline Interaction Effects
Outcomes Institute Series
Only vs. Control
Institute Series Plus Coaching vs.
Control
Institute Series Plus Coaching vs.
Institute Series Only
Teacher Knowledge Total Score (MDES) 0.76 0.78 0.84 Word Score (MDES) 0.53 0.64 0.67 Meaning Score (MDES) 0.95 0.81 0.90
Teacher Practice
Teacher-Led Explicit Instruction (MDES) 0.73 0.81 0.84 Independent Student Activity (MDES) 0.95 1.04 1.09 Differentiated Instruction (MDES) 0.59 0.64 0.70
Student Achievement
Test Score (MDES) 0.36 0.36 0.42 Dichotomous Outcome: At or Above Mean of Baseline Cohort (MDE in percent) 15.93 16.27 17.58
Note: Impact analyses for teacher knowledge and student achievement are based on the follow-up year spring sample while impact analyses for teacher practice are based on the follow-up year fall sample.

B–9
Table B-7. Minimum Detectable Effects for Implementation Year Stable Students of Stable Teachers Sample Impact Estimates
Outcomes Institute Series
Only vs. Control
Institute Series Plus Coaching vs.
Control
Institute Series Plus Coaching vs.
Institute Series Only
Student Achievement Test Score (MDES) 0.25 0.25 0.28 Dichotomous Outcome: At or Above Mean of Baseline Cohort (MDE in percent) 10.95 11.45 12.71
Table B-8. Minimum Detectable Effects for Follow-Up Year Stable Teachers Sample Impact Estimates
Outcomes Institute Series
Only vs. Control
Institute Series Plus Coaching vs.
Control
Institute Series Plus Coaching vs.
Institute Series Only
Teacher Knowledge Total Score (MDES) 0.42 0.39 0.42 Word Score (MDES) 0.50 0.45 0.48
Teacher Practice
Teacher-Led Explicit Instruction (MDES) 0.67 0.64 0.64 Note: Impact analyses for teacher knowledge are based on the follow-up year stable spring sample while impact analyses for teacher practice are based on the follow-up year stable fall sample.


APPENDIX C DETAILS ON TEACHER DATA AND TEACHER
SAMPLE CHARACTERISTICS


C–1
APPENDIX C
DETAILS ON TEACHER DATA
AND TEACHER SAMPLE CHARACTERISTICS
As described in chapter 2, the study included three main data collections from teachers: the teacher background and PD surveys, the Reading Content and Practices Survey, and classroom observations. These data collections were conducted during the year the PD interventions were implemented and also during the follow-up year. 134 In this appendix, we provide more information on response rates for those teacher data collections during the implementation and follow-up years. Then we discuss the scaling of variables from the surveys used in the descriptive analyses in chapter 2 and as covariates in the impact analyses discussed in chapter 4. Finally we discuss the rate of missing data for the covariates and examine equivalence across groups on these variables for the teachers included in the outcomes analyses.135
As explained in chapter 2 and appendix B, we administered each data collection to all teachers who were teachers of record during the relevant semester and who were present during the study’s data collection window, which typically lasted two months. Teachers who entered one or more semesters after the study began were administered all subsequent data collections, but they were not administered those that had been given in prior semesters, with the exception of the fall background survey, which was administered as part of the spring PD survey if teachers did not have the opportunity to complete the background survey in the fall.
Teachers were directed to answer all questions about their background and characteristics of their class in terms of the current school year (2005–2006 for the implementation year background survey, and 2006–2007 for the follow-up year background survey). Teachers were directed to answer all questions about their participation in PD with reference to specific time periods relevant to the purpose of each collection. The fall implementation year survey asked about PD during the prior summer, to provide data to examine the service contrast across the three treatment conditions. It also asked about PD participation during the prior year, to provide baseline information. The spring implementation year, fall follow-up year, and spring follow-up year PD surveys were designed to provide data to examine the service contrast.
I. Summary of Teacher Response Rates
The overall response rates across the three treatment conditions in the fall of the implementation year was 97 percent for the RCPS, 91 percent for the teacher background survey, and 93 percent for the classroom observations. (See table C-2.) Response rates were above 90 percent for all remaining data collections, except the fall background survey in the fall of the follow-up year, which was 86 percent, and the PD survey in the spring of the follow-up year, which was 85 percent. We employed a chi-square test to examine whether there were significant differences in 134 In the fall of the implementation and follow-up years, the PD survey was included as a component of the background survey; in the spring of the implementation and follow-up years, the background survey was not administered and the PD survey was administered as a stand-alone instrument. 135 The scaling for the teacher outcome measures (teacher knowledge and classroom instructional practice) is discussed in detail in section IV of appendix D and sections I and II of appendix F.

C–2
response rates between the groups for the 10 data collections. Of the 30 tests, six were statistically significant.136 In the fall of the implementation year, there a statistically significant difference in response rates between treatment group B and the control group for the teacher background survey. (See table C-2.) There were no significant differences in response rates in the spring implementation year data collections. In the fall of the follow-up year, there was a significant difference in response rates between treatment group A and the control group, and between treatment groups A and B. Finally, in the spring of the follow-up year, there was a significant difference between treatment groups A and B, and between treatment group B and the control group, for both the PD survey and the RCPS.
II. Teacher Variables Used in the Analysis of Baseline Characteristics
The following variables were created from teacher background survey items to: (1) test whether statistically significant differences existed among the three study conditions at baseline, (2) use as covariates in the impact models, and (3) use as outcome measures. The description includes the definition of the variable and any manipulation done to create the variable. The population for these variables includes all second grade teachers in the study schools at the time of data collection. All variables created from the background survey are based on self-reported data (e.g., hours of prior PD).
Teacher Baseline Knowledge in Reading. (Reading Content and Practices Survey). The baseline Reading Content and Practice Survey (RCPS) was scaled together with the spring implementation year RCPS, to provide a common metric for the two waves. The scaling methods and interpretation of the scales is discussed in appendix D.137
136 These are not independent tests; if a group had an unusually high or low response rate on one instrument in a particular wave of data collection, it was likely to be high or low on the others. 137 Of the 2007 spring sample teachers who contributed teacher knowledge data for the follow-up impact analyses, 82 teachers (33.1 percent) did not have baseline teacher knowledge scores, and thus their values on this covariate were set to their districts’ means.

Table C-1. Response Rates for Teacher Data Collections, by Group
Institute Series Only (Group A)Institute Series Plus Coaching
(Group B) Control Group Total
Sample size (N)
Participated(N)
ResponseRate
(percent)
Sample
size (N)
Participated(N)
ResponseRate
(percent)
Sample size (N)
Participated(N)
ResponseRate
(percent)
Sample size (N)
Participated(N)
ResponseRate
(percent)Fall 2005 Teacher Reading Content and Practices Survey (Baseline) 91 88 96.7 88 87 98.8 91 88 96.7 270 263 97.4 Teacher Background Survey 91 84 89.2 88 84 95.5 91 78 85.7 270 246 91.1 Classroom Observations 91 86 94.5 88 83 94.3 91 84 92.3 270 253 93.7
Spring 2006 Teacher Reading Content and Practices Survey 93 84 90.3 88 84 95.5 89 80 89.9 270 248 91.9 Teacher PD Survey 93 86 92.5 88 82 93.2 89 80 90.9 270 248 91.9 Classroom Observations 93 89 95.7 88 85 96.6 89 84 94.4 270 258 95.6
Fall 2006 Teacher Background Survey 85 72 84.7 84 73 86.9 81 70 86.4 250 215 86.0 Classroom Observations 85 71 83.5 84 80 95.2 81 77 95.1 250 228 91.2
Spring 2007 Teacher PD Survey 85 69 85.2 85 78 92.9 84 68 81.9 254 215 84.6 Teacher Reading Content and Practices Survey 85 76 89.4 85 82 96.4 84 74 88.1 254 232 91.3
C-3

Table C-2. Chi-Square Test of Equal Proportions for Response Rates Between Study Groups
Institute Series Only (Group A)
vs. Control Group Institute Series Plus Coaching (Group B) vs. Control Group
Institute Series Only (Group A) vs. Institute Series Plus
Coaching (Group B) Chi-square P-value Chi-square P-value Chi-square P-value
Fall 2005 Teacher Reading Content and Practices Survey (Baseline) 0 1.00 0.96 0.33 0.96 0.33 Teacher Background Survey 2.02 0.16 4.94 0.03* 0.79 0.38 Classroom Observations 0.94 0.33 0.29 0.59 0.18 0.67 Spring 2006 Teacher Reading Content and Practices Survey 0.01 0.92 2.02 0.15 1.79 0.18 Teacher PD Survey 0.38 0.54 0.62 0.43 0.03 0.86 Classroom Observations 0.17 0.68 0.50 0.48 0.10 0.75 Fall 2006 Teacher Background Survey 0.10 0.75 0.01* 0.92 0.17 0.68 Classroom Observations 5.71 0.02* 0.10 0.75 6.09 0.01* Spring 2007 Teacher PD Survey 0.01 0.86 4.20 0.04* 4.07 0.04* Teacher Reading Content and Practices Survey 0.07 0.79 4.17 0.04* 3.23 0.07 Note: Two-tailed statistical significance at the p > .05 level is indicated by an asterisk (*).
C-4

C–5
Years of Teaching Experience (Teacher Background Survey). An originally continuous variable was recoded as a categorical variable because of the non-linearity and skew of the original variable. The following categories were created:
• 3 years or less • 4–10 years • 11–20 years • More than 20 years
Years of Teaching Experience in Current School (Teacher Background Survey). An originally continuous variable was recoded as a categorical variable because of the non-linearity and skew of the original variable. The following categories were created:
• 3 years or less • 4–10 years • 11–20 years • More than 20 years
Years of Reading Program Experience (Teacher Background Survey). An originally continuous variable was recoded as a categorical variable because of the non-linearity and skew of the original variable. The following categories were created:
• 1 year or less • 2–4 years • More than 4 years
Level of Education (Teacher Background Survey). Because all the teachers had a bachelor’s degree, the level of education is measured by an indicator variable identifying teachers who had a master’s degree or above:
• Level of Education: M.A. or above = 1; else 0
Percent of Students 1 or More Years Below Grade Level (Teacher Background Survey). This variable was created by dividing the number of students that teachers reported to be 1 or more years below grade level by the number of students in classroom. Both variables used to create this variable were teacher reported.138
138 The item was phrased as follows: “In answering 2a-2g, include ALL of the students to whom you teach reading, whether you teach reading on your own in a self-contained classroom, to a group that includes students from other classes, or to more than one group of students. (a) What is the total number of students to whom you currently teach reading? (b) How many of your reading students receive intervention services in reading from you or another teacher or tutor? Reading Intervention is a program designed for struggling readers to be used only with struggling readers in addition to the core reading program. (c) How many of your students are reading at or above the approximate level expected for their grade? (d) How many of your students are reading one year below grade level? (e) How many of your students are reading two or more years below the grade level?” Teachers were not provided any guidance other than what was stated in the question. The item was used as a covariate in all teacher models, including the exploratory analyses of the relationship between teacher characteristics and student achievement reported in chapter 6, and it had a statistically significant negative association with achievement. In the model reported in table 6-1predicting the standardized continuous student achievement score, for example, the coefficient for percent of students one or more years below grade level was -0.61 (p<.001).

C–6
Class Size (Teacher Background Survey). This variable is a continuous variable capturing the number of students in a classroom (teacher reported).
Hours of Professional Development in Years Prior to the Study (Teacher Background Survey). This variable captures the reading-related professional development in which teachers participated during school year 2004–2005 and during summer 2004. The variable sums the number of hours of professional development in different categories:
• Attended short, stand-alone training or workshop in reading (half-day or less) • Attended longer institute or workshop in reading (more than half-day) • Attended a college course in reading (include any courses you are currently attending) • Attended a conference about reading (might include multiple short offerings) • Received coaching or mentoring related to reading instruction • Acted as a coach or mentor related to reading instruction • Other (e.g., participated in teacher study group, network or collaboration supporting PD
in reading; participated in committee or task force related to reading; visited or observed reading instruction in other schools)
III. Group Equivalence for Teachers Included in the Impact Analyses
Tables C-3 and C-4 compare teacher background characteristics across the three treatment conditions (treatment A, B, and the control group) for teachers included in the teacher knowledge impact analyses in the spring of the implementation and follow-up years. Tables C-5 and C-6 provides similar information for teachers included in the classroom practice impact analyses in the spring of the implementation year and the fall of the follow-up year. The teacher knowledge results in all four tables pertain to the baseline administration of the RCPS. The teacher background, classroom characteristics, and PD participation variables in tables C-3 and C-5 are based on the fall implementation year background survey. The parallel variables in tables C-4 and C-6 are based on the fall follow-up year survey. In all cases, there were no statistically significant differences across groups for any of the background variables examined.
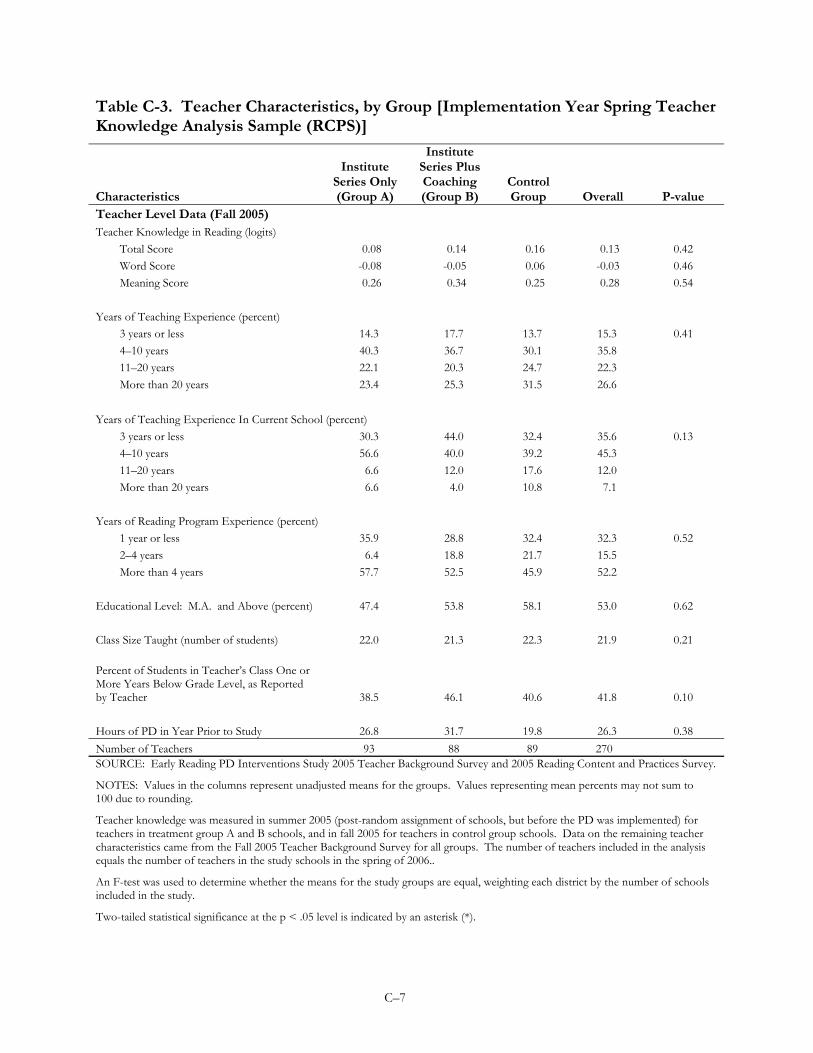
C–7
Table C-3. Teacher Characteristics, by Group [Implementation Year Spring Teacher Knowledge Analysis Sample (RCPS)]
Characteristics
Institute Series Only (Group A)
Institute Series Plus Coaching (Group B)
Control Group Overall P-value
Teacher Level Data (Fall 2005) Teacher Knowledge in Reading (logits)
Total Score 0.08 0.14 0.16 0.13 0.42 Word Score -0.08 -0.05 0.06 -0.03 0.46 Meaning Score 0.26 0.34 0.25 0.28 0.54
Years of Teaching Experience (percent)
3 years or less 14.3 17.7 13.7 15.3 0.41 4–10 years 40.3 36.7 30.1 35.8 11–20 years 22.1 20.3 24.7 22.3 More than 20 years 23.4 25.3 31.5 26.6
Years of Teaching Experience In Current School (percent)
3 years or less 30.3 44.0 32.4 35.6 0.13 4–10 years 56.6 40.0 39.2 45.3 11–20 years 6.6 12.0 17.6 12.0 More than 20 years 6.6 4.0 10.8 7.1
Years of Reading Program Experience (percent)
1 year or less 35.9 28.8 32.4 32.3 0.52 2–4 years 6.4 18.8 21.7 15.5 More than 4 years 57.7 52.5 45.9 52.2
Educational Level: M.A. and Above (percent) 47.4 53.8 58.1 53.0 0.62
Class Size Taught (number of students) 22.0 21.3 22.3 21.9 0.21
Percent of Students in Teacher’s Class One or More Years Below Grade Level, as Reported by Teacher 38.5 46.1 40.6 41.8 0.10
Hours of PD in Year Prior to Study 26.8 31.7 19.8 26.3 0.38 Number of Teachers 93 88 89 270 SOURCE: Early Reading PD Interventions Study 2005 Teacher Background Survey and 2005 Reading Content and Practices Survey.
NOTES: Values in the columns represent unadjusted means for the groups. Values representing mean percents may not sum to 100 due to rounding.
Teacher knowledge was measured in summer 2005 (post-random assignment of schools, but before the PD was implemented) for teachers in treatment group A and B schools, and in fall 2005 for teachers in control group schools. Data on the remaining teacher characteristics came from the Fall 2005 Teacher Background Survey for all groups. The number of teachers included in the analysis equals the number of teachers in the study schools in the spring of 2006..
An F-test was used to determine whether the means for the study groups are equal, weighting each district by the number of schools included in the study.
Two-tailed statistical significance at the p < .05 level is indicated by an asterisk (*).

C–8
Table C-4. Teacher Characteristics, by Group [Follow-Up Year Spring Teacher Knowledge Analysis Sample (RCPS)]
Characteristics
Institute Series Only (Group A)
Institute Series Plus Coaching (Group B)
Control Group
Overall P-value
Teacher Level Data Baseline Teacher Knowledge in Reading (logits)
Total Score 0.09 0.16 0.20 0.15 0.70 Word Score -0.05 -0.03 0.00 -0.03 0.98 Meaning Score 0.24 0.35 0.41 0.34 0.55
Years of Teaching Experience (percent) 3 years or less 19.4 16.0 17.1 17.5 0.80 4–10 years 34.7 28.0 31.4 31.3 11–20 years 20.8 28.0 20.0 23.0 More than 20 years 25.0 28.0 31.4 28.1
Years of Teaching Experience In Current School (percent)
3 years or less 35.2 30.7 34.9 33.5 0.49 4–10 years 49.3 49.3 33.3 44.3 11–20 years 7.0 14.7 19.7 13.7 More than 20 years 8.5 5.3 12.1 8.5
Years of Reading Program Experience (percent)
0–4 years 42.3 37.8 38.0 34.4 0.72 More than 4 years 57.8 62.2 62.0 60.7
Educational Level: M.A. and Above (percent) 57.4 63.4 56.9 59.4 0.56
Class Size Taught (number of students) 21.3 21.0 22.6 21.6 0.96
Percent of Students in Teacher’s Class One or More Years Below Grade Level, as Reported by Teacher 34.8 44.0 36.9 38.6 * 0.04 Number of Teachers 85 85 84 254 SOURCE: Early Reading PD Interventions Study 2006 Teacher Background Survey and 2005 Reading Content and Practices Survey.
NOTES: Values in the columns represent unadjusted means for the groups. Values representing mean percents may not sum to 100 due to rounding.
Teacher knowledge was measured in summer 2005 (post-random assignment of schools, but before the PD was implemented) for teachers in treatment group A and B schools, and in fall 2006 for teachers in control group schools. Data on the remaining teacher characteristics came from the Fall 2006 Teacher Background Survey for all groups. The number of teachers included in the analysis equals the number of teachers in the study schools in the spring of 2007.
An F-test was used to determine whether the means for the study groups are equal, weighting each district by the number of schools included in the study.
Two-tailed statistical significance at the p < .05 level is indicated by an asterisk (*).

C–9
Table C-5. Teacher Characteristics, by Group [Implementation Year Spring Teacher Practices Analysis Sample]
Characteristics
Institute Series Only (Group A)
Institute Series Plus Coaching (Group B)
Control Group Overall P-value
Teacher Level Data (Fall 2005) Teacher Knowledge in Reading (logits)
Total Score 0.08 0.14 0.17 0.13 0.43 Word Score -0.09 -0.04 0.08 -0.02 0.47 Meaning Score 0.24 0.33 0.25 0.27 0.53
Years of Teaching Experience (percent)
3 years or less 13.8 17.7 14.2 15.3 0.62 4–10 years 42.5 34.2 29.0 35.3 11–20 years 20.0 21.5 26.3 22.6 More than 20 years 23.8 26.6 30.3 26.8
Years of Teaching Experience In Current School (percent)
3 years or less 29.1 42.7 32.5 34.6 0.13 4–10 years 55.7 40.0 37.7 44.6 11–20 years 8.9 13.3 19.5 13.9 More than 20 years 6.3 4.0 10.4 6.9
Years of Reading Program Experience (percent)
1 year or less 34.6 28.8 33.8 32.4 0.36 2–4 years 7.4 17.5 19.5 14.7 More than 4 years 58.0 53.8 46.8 52.9
Educational Level: M.A. and Above (percent) 48.1 56.3 57.1 53.8 0.78 Class Size Taught (number of students) 22.1 21.3 22.4 21.9 0.15 Percent of Students in Teacher’s Class One or More Years Below Grade Level, as Reported by Teacher 37.5 45.8 40.3 41.2 0.09 Hours of PD in Year Prior to Study 26.9 31.7 20.1 26.4 0.39 Number of Teachers 93 88 89 270 SOURCE: Early Reading PD Interventions Study 2005 Teacher Background Survey and 2005 Reading Content and Practices Survey.
NOTES: Values in the columns represent unadjusted means for the groups. Values representing mean percents may not sum to 100 due to rounding.
Teacher knowledge was measured in summer 2005 (post-random assignment of schools, but before the PD was implemented) for teachers in treatment group A and B schools, and in fall 2005 for teachers in control group schools. Data on the remaining teacher characteristics came from the Fall 2005 Teacher Background Survey for all groups. The number of teachers included in the analysis equals the number of teachers in the study schools in the spring of 2006.
An F-test was used to determine whether the means for the study groups are equal, weighting each district by the number of schools included in the study.
Two-tailed statistical significance at the p < .05 level is indicated by an asterisk (*).

C–10
Table C-6. Teacher Characteristics, by Group [Follow-Up Year Fall Teacher Practices Analysis Sample]
Characteristics
Institute Series Only (Group A)
Institute Series Plus Coaching (Group B)
Control Group
Overall P-value
Teacher Level Data (Fall 2005)
Teacher Knowledge in Reading (logits) Total Score 0.06 0.15 0.17 0.13 0.48 Word Score -0.06 -0.03 -0.02 -0.04 0.99 Meaning Score 0.18 0.33 0.35 0.29 0.33
Years of Teaching Experience (percent) 3 years or less 19.4 15.1 15.9 16.8 0.76 4–10 years 34.7 30.1 30.4 31.8 11–20 years 20.8 26.0 23.2 23.4 More than 20 years 25.0 28.8 30.4 28.0
Years of Teaching Experience In Current School (percent)
3 years or less 35.2 28.8 32.3 32.1 0.37 4–10 years 49.3 52.1 35.4 45.9 11–20 years 7.0 13.7 20.0 13.4 More than 20 years 8.5 5.5 12.3 8.6
Years of Reading Program Experience (percent)
0–4 years 42.3 36.1 38.5 38.9 0.85 More than 4 years 57.8 63.9 61.4 61.0
Educational Level: M.A. and Above (percent) 57.4 62.3 56.3 58.8
0.42
Class Size Taught (number of students) 21.3 20.8 23.2 21.8 0.47 Percent of Students in Teacher’s Class One or More Years Below Grade Level, as Reported by Teacher 34.9 43.8 36.3 38.3 * 0.04 Number of Teachers 85 84 81 250 SOURCE: Early Reading PD Interventions Study 2006 Teacher Background Survey and 2005 Reading Content and Practices Survey.
NOTES: Values in the columns represent unadjusted means for the groups. Values representing mean percents may not sum to 100 due to rounding.
Teacher knowledge was measured in summer 2005 (post-random assignment of schools, but before the PD was implemented) for teachers in treatment group A and B schools, and in fall 2005 for teachers in control group schools. Data on the remaining teacher characteristics came from the Fall 2006 Teacher Background Survey for all groups. The number of teachers included in the analysis equals the number of teachers in the study schools in the fall of 2006.
An F-test was used to determine whether the means for the study groups are equal, weighting each district by the number of schools included in the study.
Two-tailed statistical significance at the p < .05 level is indicated by an asterisk (*).

APPENDIX D READING CONTENT AND PRACTICES SURVEY
DESIGN AND SCALES


D–1
APPENDIX D
READING CONTENT AND PRACTICES SURVEY DESIGN
AND SCALES
Teacher knowledge was measured three times during the study with the Reading Content and Practices Survey (RCPS), a multiple-choice and short constructed response assessment that was created for this study.139
I. Overall Design of the RCPS
To increase efficiency and minimize burden, the RCPS was designed to be completed in about 30 minutes. Thus, each version of the test consisted of 30 items, 27 to 29 of which used a multiple choice format. To eliminate the possibility that teachers’ performance on the test would improve over time due to repeated encounters with the same items, six versions of the RCPS (designed to be equivalent) were prepared, and each teacher completed a different form at each administration.
Because the various forms contain different items, estimates of teacher knowledge based on the proportion of 30 items answered correctly are not comparable across forms. In order to generate comparable estimates, we used Rasch modeling to generate scores that take account of the difficulty of the items in each form relative to those in all other forms.140
II. Characteristics of the RCPS Item Bank and Construction of Multiple Test Forms
The item bank underlying the RCPS test forms consists of 84 multiple choice items and 6 items requiring a short constructed response.141 The test addresses knowledge in the five major components of reading instruction that were covered in the study’s professional development program. These are also the topics emphasized in the federal Reading First program: phonemic awareness, phonics, fluency, vocabulary, and comprehension. The distribution of item topics in the RCPS was intended to reflect the relative emphasis they would be accorded in second grade reading instruction in the two reading programs used in the study schools. Table D-1 shows the distribution of item topics and formats in the RCPS item bank.
139 As will be explained below, we originally expected to use pre-existing assessments to measure study participants’ knowledge. However, a review of these instruments determined that they did not provide the required number of items needed to field the required number of parallel forms of the test, so the study developed new items with the format and grade-level focus needed to assess the impact of the PD on teacher knowledge. 140 For a discussion of Rasch modeling, see Andrich (1988) and Fischer & Molenaar (1995). 141 The items in the RCPS were informed by items developed for other studies by other researchers and agencies including Louisa Moats, Barbara Foorman, the University of Michigan’s Study of Instructional Improvement (SII) team, and the California Commission on Teacher Credentialing; and by current scientifically based reading research findings reviewed in the NRP (NICHD 2000) and professional development materials.

D–2
Table D-1. Summary of Item Topics and Formats in the RCPS Item Bank
Topic Number of Multiple
Choice Items Number of Short
Answer Items Total
Phonemic Awareness 12 0 12 Phonics/Spelling 17 0 17 Fluency 13 3 16 Vocabulary 20 1 21 Comprehension 22 2 24 Total 84 6 90
The items in each topic area may also be characterized in terms of the type of knowledge
about the topic they represent: foundational knowledge includes components of reading instruction (e.g., identifying the phonemes of English and understanding the phonics patterns that govern written English) and theory (e.g., the role of rapid word identification in developing fluency) while pedagogical knowledge includes familiarity with effective teaching strategies and methods for assessing students’ reading skills and difficulties. Table D-2 presents the breakdown of items across the types of knowledge they were designed to measure.
Table D-2. Matrix of Topics Covered by RCPS Items (Number of Items in Each Category)
Type of Knowledge
Topic Foundational Pedagogical
Phonemic Awareness 10 2 Phonics/Spelling 12 5 Fluency 9 7 Vocabulary 10 11 Comprehension 5 19 Total 46 44
To construct the six RCPS forms, the 90 items in the item bank were grouped into six blocks
of 15 items each (called A, B, C, D, E, and F) that were balanced by topic and approximate difficulty. These blocks were paired to form six overlapping test forms of 30 items each (AB, CD, EF, BC, DE, and FA). During each RCPS administration, each of the forms was distributed to one-sixth of the teachers (balanced by district and treatment condition) in such a way that over three administrations, each teacher encountered three forms that together contained all 90 items (each administered once). For instance, as shown in table D-3, teachers in the first group completed form AB in fall 2005, CD in spring 2006, and EF in spring 2007, while teachers in the fourth group completed form BC first, followed by form DE, then FA. This “spiraling” of items through test

D–3
versions was required by the Rasch modeling procedure that generated item difficulties and test scores.142
Table D-3. Distribution of Item Blocks among RCPS Forms and Administrations
Administration Group
Form Completed in Summer/Fall 2005
Form Completed in Spring 2006
Form Completed in Spring 2007
1 AB CD EF 2 CD EF AB 3 EF AB CD 4 BC DE FA 5 DE FA BC 6 FA BC DE
III. Administration During the Implementation and Follow-Up Years
To measure teachers’ knowledge in the spring of the implementation and follow-up years, the survey was administered to all regular second grade teachers in a proctored setting. Data were available from 92 percent of the implementation year spring sample (2006 outcome scores) and 91 percent of the follow-up year spring sample.143
IV. Scaling
Three scores were generated from the RCPS: A total reading knowledge score, a word-level score (combining items on phonemic awareness, phonics, and fluency,144 which represent 50 percent of the items in each form), and a meaning-level score (combining items on vocabulary development and reading comprehension, which represent the other 50 percent of items in each form). All three scores represent teacher knowledge of both foundational (content) knowledge and pedagogical knowledge (instructional approaches or practices).145
142 To locate all the items along a single difficulty scale, it is necessary that items be completed in association with each other (i.e., in the same sitting) by the same test-takers. Theoretically, the ideal manner to accomplish this is to administer all 90 of the items in a single form to all participants. However, this strategy would have created a burdensome test and exposed the test-takers to the same items three times over two years. The alternative strategy, item spiraling, ensured that every item in the item bank was directly associated with half of the other items in the RCPS item bank and indirectly linked to the other half of the items. For instance, each of the 15 items in block A is directly associated with the other 14 items in block A as well as the 15 items in block B in Form AB and the 15 items in F in form FA (a total of 44 of the 90 items). The items in block A are indirectly associated with items in block C because the block B items are associated with block C in form BC, and with items in block E because block F items are associated with block E items in form EF. 143 The spring 2006 sample of 270 teachers included 258 (96 percent) “stable” teachers who had also been members of the original (fall 2005) sample and 12 (4 percent) late-entry teachers. The spring 2007 sample of 254 teachers included 171 (67 percent) teachers from the original sample and 83 (33 percent) late entrants. Of the 2007 spring sample teachers who contributed teacher knowledge data for the follow-up impact analyses, 82 teachers (33.1 percent) did not have baseline teacher knowledge scores, and thus their values on this covariate were set to their districts’ means. 144 Theoretically, fluency is thought to reflect both mechanical aspects (the development of rapid, accurate word recognition) and comprehension aspects (reading with appropriate phrasing, intonation, and emphasis implies understanding of the structure and meaning of sentences being read). We include fluency in the word-level subscale because the study’s PD and the fluency items in the test emphasize the more mechanical aspects of fluency development. 145 The word and meaning-level subscales were defined at the time of test construction. A confirmatory factor analysis showed that a two-factor model fit the data better than a single-factor model, based on a statistically significant likelihood ratio test of fit (p<.05).

D–4
We used Rasch model analysis to obtain scale scores for each individual teacher who participated in the study. Taking a form of logistic regression, the Rasch model predicts the occurrence of a correct response as opposed to a wrong response to an individual test item, as a function of two attributes: a person measure, indicating the person’s underlying latent achievement, (expressed as beta below) and the test item difficulty measures (expressed as delta below).
jiijij δβππ −=− )1/log(
Where:
βi is the reading knowledge level of teacher i;
δj is the difficulty of item j; and
πij is the probability that a teacher with knowledge level βi gets a correct answer, when answering a test item with difficultyδj.
We estimated the parameters of the model by maximum likelihood using Winsteps, a program widely used for test scaling. 146 To estimate the parameters, we pooled data from the fall and spring test administrations, and we treated teachers and test items as categorically coded independent variables. The logit coefficients derived for each teacher are the measures of teacher knowledge. The larger the coefficient βi, the more likely teacher i is of arriving at correct responses to the items on the assessment, and thus the higher the teacher’s level of knowledge in the subject area being tested. The larger the coefficient δj, the less likely teachers are of arriving at a correct response to item j. In the estimation of teacher scores, the influence of items is controlled for; therefore, person measures are net of the difficulty levels of the items on the test form the teacher received. To identify the model, we assume that the mean value of δ across items is zero.
The estimated βi for teacher i was used as the knowledge scale score for teacher i in the impact analysis. The estimated standard error for βi is the standard error of measurement for teacher i. In general, the standard error varies across teachers, and is lower for teachers who answered about half the items on the test correctly. The variance among the βi is a measure of the total observed variation, combining true variation in teacher knowledge as well as measurement error. The average across teachers of the square of the standard error of measurement provides an estimate of the average error variance. Subtracting this from the total observed variance provides an estimate of the true variation in knowledge among teachers.
V. Outcome Measure Properties
Outcome measures generated from the RCPS included a total score based on all 30 items for each teacher, as well as sub-scores in word-level (phonemic awareness, phonics, fluency) and meaning-level (vocabulary, reading comprehension) knowledge.147
146 See Linacre (2007) for more information about Winsteps. 147 Word-level sub-scores were based on items measuring teachers’ knowledge of phonemic awareness (13 percent of items), phonics (19 percent), and fluency (18 percent). Meaning-level sub-scores were based on items that measured knowledge of vocabulary development (23 percent) and reading comprehension (27 percent).

D–5
The observed correlation between the word and meaning sub-scores, as measured by Pearson’s r, was .38 for the implementation year and .32 for the follow-up year, while the true correlation, derived using an IRT model that corrects for test reliability, was .83 and .73 for the two years, respectively. Although the word- and meaning-level subscales are correlated, we retained both subscores in the analysis because the two domains are conceptually distinct and might be differentially affected by the PD interventions.
According to misfit statistics, the purpose of which is to show the fit of the item responses to the expected responses based on the Rasch model (an indicator of internal coherence), two of the implementation year items in the meaning-level scale had misfit statistics greater than 1.3 (i.e., too high; unexpected patterns detected) or less than 0.7 (i.e., too low; conforming to the expected pattern too deterministically) (Wright and Linacre 1994). For the follow-up year, two of the items in the word-level scale, four of the items in meaning-level scale and seven of the items in the overall scale had misfit statistics greater than 1.3 or less than 0.7. The decision was made not to exclude the items because (a) the earlier waves included all test items (even the small number of misfitting items), and (b) upon inspection of the items, we found them to be theoretically important in the construction of the scales.
The reliability, which is defined as the ratio of true variance to observed variance, was 60 percent for the total scale, 45 percent for the word-level scale, and 49 percent for the meaning-level scale for the implementation year.148 At follow-up, the reliability was 56 percent for the total scale, 46 percent for the word-level scale, and 42 percent for the meaning-level scale. One reason for the relatively low reliability may be the fact that the teachers in the study sample are relatively homogeneous. In particular, they all teach second grade, use similar reading programs, and teach in high poverty urban schools. Reliability can be defined as the ratio of the true variation across teachers to the sum of the true and error variation, and thus the reliability will be low if the true variation is low, even if the error variance is modest.
Low reliability would be a concern if the purpose of the scales were to compare individual scores; however, study comparisons were made at the level of treatment group. Because we are using teacher knowledge as a dependent variable in the analysis, the measurement error in teacher knowledge is averaged across teachers in the analysis. Our analyses of the test data indicate that the reliability of the teacher knowledge measure is similar in the three treatment conditions. Thus, the main effect of unreliability is to reduce the precision of the impact estimates.149
148 The reliabilities reported were computed by averaging across the sample of teachers. Because the standard error of measurement for Rasch scale scores differs for scores at different points along the score distribution, teachers with different scale scores had different reliabilities. The average reliability was computed by squaring the standard error of measurement for each teacher and averaging the resulting error variances. The true score variance was estimated by computing the difference between the total observed variance in teachers’ scores and the average error variance. Finally, the reliability was computed as the ratio of the true variance to the error variance. 149 Measurement error produces RCPS scores that are higher than the true scores for some teachers and lower for others. Thus, it operates to inflate the standard error of the mean for each treatment condition and reduce the statistical significance of estimated impacts. As a result of averaging, the measurement error for the group means will be smaller than the typical error for individual teachers.


APPENDIX E CLASSROOM OBSERVER TRAINING AND
INTER-RATER RELIABILITY


E–1
APPENDIX E
CLASSROOM OBSERVER TRAINING AND INTER-RATER
RELIABILITY
I. Development of the Protocol
Development of the classroom protocol began with a review of existing classroom observation protocols used in large-scale studies. The number and the complexity of the observations required by the Early Reading PD Interventions Study (approximately 270 teachers in six school districts observed multiple times over two years) ruled out qualitative approaches in which observers write running notes that are coded afterward. Consequently, the search focused on protocols that are coded in real time while the observation is being conducted, and that consisted of low-inference teacher or student behaviors that would allow for high inter-rater reliability.
A number of protocols that have been used in large-scale quantitative studies of early reading were identified, including the protocols developed by Abt Associates for the Reading First Implementation Study and the Timed Observation/Student Engagement (TO/SE) Instrument developed by Barbara Foorman and her colleagues at the Center for Academic and Reading Skills, (CARS), University of Texas, Houston. Although these protocols were designed to measure the components of reading instruction that were the focus of the Early Reading PD Interventions Study, they were not completely aligned with the instructional practices on which the PD was focused. Thus, a decision was made to develop a new observation protocol, drawing where possible on features of existing instruments.
The observation protocol was designed to align with the study’s professional development curriculum (based on Moats 2005) and consequently with instructional strategies grounded in scientifically based reading research (as summarized in Armbruster, Lehr, and Osborn 2001). The curriculum presented by our professional development provider (Sopris West’s LETRS team) was mapped out, after which a list of observable teacher and student strategies consistent with the recommendations of the NRP were identified that represented the theoretical and pedagogical knowledge the PD provided. During 2004, a prototype of the protocol was developed and piloted for usability in approximately 10 classrooms. The revised observation protocol was reviewed and approved by experts on the Early Reading PD Interventions Study’s Technical Working Group and was re-piloted in May 2005.
Early Reading PD Interventions Study observations were conducted during one day’s entire reading instruction period (reading block). During this block, teachers were expected to provide instruction in phonics, fluency, vocabulary, and comprehension strategies using teacher and student materials from the two core reading programs used in study districts. Teachers could also work on students’ phonemic awareness skills and use a variety of supplemental materials to address the varying needs of their particular students.
The protocol had four parts. PART I was a checklist that the observer completed just prior to the lesson. It was used to collect information about the lesson to be observed—the materials used in the classroom, student groupings, and the potential role of reading specialists or other

E–2
support personnel during instruction. PART II was used during the lesson to record instructional activities, the use of specific instructional materials, the instructional format, and student engagement during reading instruction. PART III was a reading program implementation checklist, and in PART IV, observers recorded their subjective opinion of the instruction observed.
Part II of the observation protocol was divided into 3-minute intervals. The protocol included space to record 60 intervals (180 minutes) of reading instruction. A typical observation lasted 40 intervals (120 minutes). During each interval, the observer recorded the following information:
• Reading instruction content area: whether the observed instruction involved phonemic awareness, phonics, fluency, vocabulary, reading comprehension, or other instruction
• Specific teacher and/or student instructional strategies within the content area(s) that were being used (e.g., teacher previews the text with the children; teacher measures and/or graphs fluency; students practice decoding independently)
• Specific instructional materials that were being used
• Instructional format (whole class, small groups, pairs, teacher providing individualized lesson to a group of students/an individual student)
• Whether instructional materials used by students were identical or differentiated (based on student’s performance/skills/achievement)
• The content area of instruction for the rest of the class when the teacher worked with a small group of children/individual child
• Number of off-task students, with off-task defined as bothering other students, interrupting the teacher for non-instructional reasons, or being engaged in activities other than what was assigned, such as reading a comic book instead of writing in a journal
II. Selection and Assignment of Observers
Because of the geographic distribution of the participating school districts and the varying number of teachers in each district, a decision was made to employ local classroom observers (graduate students) in one large school district; the rest of the observations were conducted by study personnel from the American Institutes for Research and REDA International, Inc.
The following criteria were used to identify and select observers for training:
• Education: bachelor’s degree or higher.
• Research training: either as part of their current AIR/REDA employment or through their graduate training.
• Reading related background: No extensive reading related background that could conflict with the provided reading content training. The goal was to train all observers to code consistently.
• Other: must have a driving license and clear a background check.

E–3
We assigned observers to one of two groups. One group, called gold standard or lead observers, received additional training beyond the standard observer training, and had duties in addition to observing classrooms, such as conducting inter-rater reliability observations and making sure the observations in their assigned district were completed. There were seven gold standard observers assigned so that each district had one or more gold standard observers. A second group of observers, regular observers, conducted the remaining classroom observations. Between fall 2005 and spring 2006 observations, there were 26 to 29 regular observers.
III. Training Workshops
We addressed the complexity of the protocol and knowledge requirements by providing 5 to 10 days of training to our observers. Gold standard (lead) observers received 10 days of training: 6 days related to reading instruction content and the use of the protocol and 4 practice days in classrooms. Regular observers received 5 days of training, including 2 practice days in classrooms.
The first training occurred early in the fall of 2005. The training covered all five components of reading instruction represented in the protocol (phonemic awareness, phonics, fluency, vocabulary, and reading comprehension), discussions and examples of the strategies coded in the observation protocol, and the roles and responsibilities of classroom observers in the study. In addition, the training included multiple practice codings from both videotape and real second grade classrooms. The training materials included a PD Impact Classroom Observation Training Manual (74 pages) that included the information covered during the training (scheduling of observations, use of the observation protocol, reading content information, etc.), copies of PowerPoint presentations, and handouts giving examples of the instructional strategies listed in the observation protocol.
A follow-up training was provided before the spring and fall 2006 waves of observations. During the follow-up training, specific coding scenarios were revisited. The scenarios were selected on the basis of feedback from the protocol cleaning process and meetings held with observers during the first wave of observation to target inconsistent coding practices. In addition, these meetings were used to brainstorm solutions to problems that observers had faced on the field, for example, scheduling the observations. In essence, the follow-up trainings were used to re-enforce consistent coding decisions.
Although the core group of observers (90 percent of regular observers, and all lead observers) stayed the same throughout the study, we needed to train new observers to replace the ones who were no longer available. The training of the replacement observers used the same materials as the original training. The only difference in the training of new observers was the implementation of the practice observations. The newly trained observers conducted two practice observations with a lead observer in the classrooms participating in the study. After each practice observation, the new observers were debriefed by the lead observer and the lead observers explained the rationale behind their coding, if disagreements existed.
IV. Approach to Inter-Rater Reliability
To collect data on inter-rater reliability (IRR), 10 percent of all observations were double-coded by a regular observer paired with a gold standard observer. Data from these paired observations were used to assess the observation protocol and the need for observer retraining.

E–4
The inter-rater reliability calculations for the Early Reading PD Interventions Study observation protocol were complicated by the fact that the observations were coded within 3-minute intervals. This, together with the large number of potential codes used for each interval, creates a problem of empty protocol cells (e.g., cells left unmarked, indicating that the specified practices did not occur within the interval during a particular observation). For instance, during phonics instruction in a particular interval and classroom observation, observers would agree that none of the vocabulary-related practices had occurred, but they might disagree on which phonics strategies to code as having taken place. An IRR calculation that weights coded and empty cells equally will overestimate the degree of agreement between two observers. (See Hayes and Hatch 1999 for a discussion related to inflated inter-rater reliability measures because of empty protocol cells.)
To deal with the problem of empty protocol cells, cells were weighted differently depending on whether they were coded as having taken place by one or both of the observers or whether both observers left the cells empty. All sections of the observation protocol in which both observers agreed that instruction did not take place during the interval were excluded from the IRR calculations for that interval. For example, if both observers agreed that phonemic awareness instruction did not take place during the observed interval, all cells in the observation protocol related to phonemic awareness were excluded from the IRR calculation. In other words, empty cells were included only for components of instruction that one or both observers coded as having taken place. This approach reduced the number of empty cells used in the IRR calculation, but still allowed for a meaningful interpretation of results: percentage of agreement on observed and unobserved instruction in components of instruction that took place (according to one or both observers) (Hayes and Hatch 1999).
Once we determined which cells to include in the IRR calculations, we used percent agreement as the measure of reliability.150 In the next section, we present inter-rater reliability results for the fall 2005 and spring 2006 observation waves.
During fall 2005, 255 teachers were observed, and during spring 2006, 258 teachers were observed. The final wave of observations in fall 2006 included 228 teachers. To collect data on inter-rater reliability, the goal was to double-code 10 percent of all observations, but minimally to make sure that each regular observer was paired with a gold standard observer in each participating school district. Because of last-minute cancellations and rescheduling, we could not conduct three inter-rater reliability observations in one district during fall 2005. As a result, 25 pairs of co-observations were available from the fall 2005 data collection instead of the originally intended 28 observation pairs. For the spring 2006 data collection, 26 co-observations were conducted, and for fall 2006 22 co-observations were conducted.
150 Percent agreement provides an interpretable measure of reliability for dichotomous items of the kind included in the observation protocol. For a discussion of other types of measures and the rationale for choosing among them, see Stemler (2004) and Hopkins (1998). An approach based on the intra-class correlation (ICC) was considered, but this approach is not feasible for the observation data because of the limited number of observations per rater pair (e.g., limited crossing of observers and observations).

E–5
V. Inter-Rater Reliability Results
The overall agreement across the three administrations ranged from 90 to 91 percent (see table E-1). These results suggest that observers maintained their skills over time.151
Table E-1. Percentage Agreement for the Overall Observation Protocol, Fall 2005, Spring 2006, and Fall 2006
Fall 2005 Spring 2006 Fall 2006 Average 90.4 91.0 91.0 Standard Deviation 2.9 3.9 5.7 Minimum 83.0 79.9 74.0 Maximum 95.1 95.8 98.6
SOURCE: Early Reading PD Interventions Study Classroom Observations, Fall 2005, Spring 2006, and Fall 2006.
151 It is not surprising to see the maintenance and improvement of coding skills because we would expect coders to become more consistent through practice and repeated follow-up trainings. For example, one mistake coders made in fall 2005 was a misunderstanding of the difference between teacher-directed and small-group instructional formats. With additional training, this had ceased to be a problem in spring 2006.


APPENDIX F CLASSROOM OBSERVATION SCALES AND
DESCRIPTIVE STATISTICS


F–1
APPENDIX F
CLASSROOM OBSERVATION SCALES AND DESCRIPTIVE
STATISTICS
Observers coded teacher instruction in 3-minute intervals. For each 3-minute interval, an observer marked the component of reading instruction (phonemic awareness, phonics, fluency, vocabulary, reading comprehension, other instruction) and also marked whether certain component-specific instructional practices were used during the interval. In addition, for each interval, the observer marked the instructional format (whole class, small groups, pairs, teacher working with particular child/group of children, break) and the number of students off-task. On the basis of the specific instructional practices marked by an observer, each 3-minute interval was classified to indicate whether it included explicit instruction, independent student activity, and/or differentiated instruction. The maximum length of the observation was sixty 3-minute intervals (three hours).
For each teacher, the data were aggregated over intervals to obtain three scale scores: explicit instruction, independent student activity, and differentiated instruction. Because the purpose of the explicit instruction and independent student activity scales was to characterize a teacher’s instructional practice in reading, only those intervals that covered one of the five components of reading instruction were included (phonemic awareness, phonics, fluency, vocabulary, or comprehension). Intervals that covered other language arts components (e.g., writing) or that lacked an instructional focus were excluded. The differentiated instruction scale was created using all intervals observed during the lesson.
The sections below provide more information on the construction and reliability of the scales and display basic descriptive statistics on teachers’ instructional practice.
I. Explicit Instruction/Independent Student Activity
The main goal in developing the explicit instruction and independent student activity scales was to estimate the frequency with which teachers engaged in specific, identified practices while controlling for potential differences across teachers in the proportion of time teachers spent in different components of reading instruction. Because it may be more or less difficult to engage in explicit instruction or independent study activity in different components of reading instruction and also because the sensitivity of the observation protocol might differ across components, failure to adjust for differences in time spent in different components could result in confounding time in content with degree of explicitness or independent student activity.
Because the explicit instruction and independent student activity scales were created using the same methods, we discuss the two together, using explicit instruction as an illustration.
The explicit instruction scale was created using a logit regression model, in which a teacher’s log odds of engaging in explicit instruction during a 3-minute interval is modeled as a function of reading instruction component—phonemic awareness, phonics, fluency, vocabulary, comprehension, and a mixed component (more than one reading instruction component)—and a teacher’s latent propensity to engage in explicit instruction. The statistical model includes six indicator variables

F–2
(analogous to item difficulties in a traditional Rasch model) and indicator variables for teachers (N-1 teacher indicator variables). Thus, teachers are treated as fixed effects, and the approach adjusts for possible differences in the average propensity to engage in explicit instruction in different components of reading instruction. A teacher’s scale score represents the teacher’s predicted log odds of engaging in explicit instruction during an interval, controlling for the component of instruction. The logit regression approach parallels the Rasch model used in the RCPS survey analysis (Raudenbush, Johnson, and Sampson 2003).152
We used effects coding for the components of reading instruction and the teacher fixed effects. Thus, each teacher’s effect can be viewed as the teacher’s log odds of engaging in explicit instruction, averaging across the five components of instruction:
11...
))1/(ln(
−−++
++++++=−
nnii
ijmixijcmijvoijfkijphijij
TeacherBTeacherB
MixCMVOFLPHIntercept γγγγγππ
Where: ijπ is the probability that interval j for teacher i is coded as explicit.
phγ is a coefficient representing the effect of the phonics component relative to the average across all teachers and all components of reading instruction. The effects of fluency, vocabulary, comprehension, and mixed components are defined similarly.
ijPH is an indicator variable coded =1 if interval j for teacher i is phonics, 0 if interval j for teacher i is fluency, vocabulary, comprehension, or mixed. Indicator variables for fluency, vocabulary, comprehension, and mixed components of instruction are defined similarly. Intervals in which the teacher taught phonemic awareness are coded -1 on all five indicator variables.
Teacheri is an indicator variable coded =1 for teacher i and 0 otherwise. The indicator variables for teacher N are coded -1 for all N-1 teacher variables.
iΒ is the relative explicitness score for teacher i. Adding the model intercept gives the teacher’s log odds of being explicit in a typical interval averaged across the reading instruction components.
152 See section IV of appendix D for details.

F–3
One drawback of the fixed effects logit approach is that scale scores for teachers who are always explicit or not explicit at all cannot be directly estimated by the model. We created proxy scores for these cases.153
II. Differentiated Instruction
Because the majority of teachers (e.g., 52 percent of teachers observed in spring 2006; see table F-1) did not engage in differentiated instruction during any of the intervals observed, the logit regression approach was not suitable to create scale scores for differentiated instruction. Thus, we created a scale score for each teacher by computing a simple percentage of intervals in which differentiated instruction took place, adjusting for the relative prevalence of differentiated instruction across the sample in the particular components in which the teacher provided instruction.
Table F-1. Percent and Number of Teachers Who Did Not Engage in Differentiated Instruction During Any Interval in Spring of the Implementation Year, by District
Percent of Teachers Engaging in
No Differentiated Instruction Number of Teachers Engaging in
No Differentiated Instruction Overall 52.3 135
District 1 31.2 19 District 2 31.5 17 District 3 43.8 21 District 4 64.3 9 District 5 82.0 50 District 6 95.0 19
Sample Size: N = 258 teachers (12 missing cases).
SOURCE: Spring 2006 Early Reading PD Interventions Study Classroom Observation Protocol.
NOTE: Districts are ordered by the percent of teachers engaging in no differentiated instruction.
As a first step in creating the scale, the average proportion of intervals in which teachers in the sample engaged in differentiated instruction was calculated separately for each component of reading instruction (phonemic awareness, phonics, fluency, vocabulary, reading comprehension) and other instructional areas, including all teachers who provided instruction in the component. Second, an adjusted proportion of intervals in which each teacher engaged in differentiated instruction was calculated separately for each component in which the teacher provided instruction by subtracting the component-specific average proportion of intervals in which teachers in the sample differentiated instruction (computed in the first step) from the proportion of intervals in the component of reading instruction in which the teacher differentiated. Finally, the scale score for 153 The scores created for these cases are based on the idea that teachers who are, for instance, engaged in explicit instruction during each interval will have a higher score than teachers who were explicit during all intervals except one (while accounting for the total number for intervals). We considered two different approaches for creation of proxy scores: matching and data augmentation. In the matching approach, a teacher needing a proxy score would be matched to a teacher who has a similar profile (length of the observation, almost requiring a proxy score themselves) and would receive that teacher’s score. In the data augmentation approach, one of the values of the teacher’s intervals is changed, in essence changing the teacher to score similar to the teachers who almost needed a proxy score. We decided to use the data augmentation approach because we could not find good appropriate matches for each teacher and because the data augmentation allows a systematic way to include all teachers in the logistic regression model. The spring 2006 data set includes 6 proxy scores for explicit instruction and 17 for independent student activity. The fall 2006 data set includes 5 proxy scores for explicit instruction and 9 for independent student activity.

F–4
each teacher was obtained by computing a weighted average of the adjusted proportion of intervals in which the teacher differentiated instruction, weighting by the number of intervals in which the teacher provided instruction in the component. The steps are summarized in the following equation:
Differentiated Instruction = [npa*(pascore-xbarpa)+nph*(phscore-xbarph)+nfl*(flscore-xbarfl)+nvo*(voscore-xbarvo)+ncm*(cmscore-xbarcm) +nother*(xbarother)/(npa+nph+nfl+nvo+ncm+nother)]
Where:
xbarpa, xbarph, xbarfl, xbarvo, xbarcm, and xbarother = mean proportion of intervals in which differentiated instruction took place in each of the 5 components of reading and other instruction areas (e.g., pa refers to phonemic awareness instruction);
npa= number of intervals in which the teacher engaged in phonemic awareness, etc.;
pascore = the proportion of phonemic awareness intervals during which the teacher engaged in explicit instruction, etc.
The resulting scale scores make use of the available data by weighting the components of reading instruction in proportion to the frequency with which they occur, while adjusting for the relative propensity to engage in differentiated instruction in each component.
III. Reliability of the Scales
Reliability can be defined as (true variance among teachers)/(total variance in teachers), where total variance in teachers equals (true variance among teachers + error variance). The total variance among teachers can be estimated by computing the variation among the estimated scale scores. The average error variance can be obtained from the standard errors of the estimated teacher effects:
nes∑ 2..
where the s.e. is the standard error of the estimated teacher coefficient and n is the number of teachers. The estimated true variance can be obtained by subtracting the error variance from the total variance.
When these estimates of the true and total variance are used, the reliability for the explicit instruction measure was 0.83, 0.80, and 0.78 for fall 2005, spring 2006, and fall 2006, respectively. The reliability for the independent student activity measure was 0.81 for fall 2005, 0.74 for spring 2006, and 0.72 for fall 2006. These are reliabilities for one day, based on the internal consistency among the observed intervals with the single day. They do not take into account whatever variation existed in teacher explicitness/student activity across days.
Reliability for the differentiated instruction scale is more difficult to estimate because the majority of the teachers did not engage in differentiated instruction. We estimated the reliability using the subset of teachers for whom we had data on differentiated instruction and who were

F–5
included in the outcomes analysis samples: 253 teachers in fall 2005; 248 teachers in spring 2006; and 228 teachers in fall 2006.
The error variance for the differentiated instruction scale can be approximated as
2
1/)1(*n
npp∑ −
where p is the percent differentiated instruction for a specific teacher, n1 is the total number of intervals in which the teacher provided instruction in reading, and n2 is the number of teachers.154 The error variance was subtracted from the observed total variance to estimate the true variance.
Using this approach, the reliability for the differentiated instruction scale was 0.88 for fall 2005, 0.89 for spring 2006, and 0.90 for fall 2006.
IV. Items Used to Create the Explicit Instruction, Independent Student Activity, and Differentiated Instruction Scales
Items in the teacher-led explicit instruction scale
1. Phonemic awareness: Teacher models oral production of sounds and words (in the absence of letter names). Teacher explains how the mouth/throat/ears feel when teaching specific sounds or differences between sounds. Teacher uses model-lead, observe/evaluate sequence. Teacher uses multi-sensory approaches (checkers, cards, hand movements).
2. Phonics: Teacher uses model, lead, observe/evaluate sequence in teaching sound-symbol correspondences. Teacher models oral production of sounds and/or words in a decoding or spelling lesson. Teacher provides examples while demonstrating and modeling. Teacher provides non-examples while demonstrating and modeling. Teacher uses multi-sensory methods to teach decoding or spelling.
3. Fluency: Teacher explains the purpose of fluency skills to students. Teacher measures and/or graphs fluency. Teacher explicitly models expressive reading.
4. Vocabulary: Teacher gives student friendly explanations of words, using typical everyday language. Teacher models using other information in the text (context) to figure out a word’s meaning. Teacher engages in an interactive process in which children figure out the meaning of words. Teacher associates new words with other words whose meaning students already know.
154 Assuming that differentiated instruction for a particular teacher is a binomial process, in which the teacher engages in differentiated instruction in a given interval with probability p, the error variance for the estimated proportion of intervals in which a single teacher engages in differentiated instruction can be computed as p*(1-p)/n1, where n1 is the number of intervals in which the teacher was observed. The average error variance can then be obtained by averaging the error variance for teachers across the n2 teachers in the sample.

F–6
5. Comprehension: Teacher activates/builds students’ background knowledge (before reading). Teacher previews the text with the children. Students and the teacher together establish the type/structure of the text. Teacher and students discuss and explain unfamiliar words when they are encountered during the reading. Teacher reads the text aloud to students. Teacher engages in dialogue reading. Teacher stops to discuss and explain unfamiliar word when they are encountered during the reading. Teacher aids discussion by providing additional context/other relevant information regarding the text (during reading). Teacher models specific comprehension strategies Teacher asks literal recall questions about specific details in the text (IPRI item). Teacher asks inferential questions.
Items in the independent student activity scale
1. Phonemic awareness: Students practice modeling separate sounds. Students blend or segment speech sounds heard in words.
2. Phonics: Students practice decoding independently. Students practice dictation/spelling independently. Teacher provides the correct spelling and students correct their work.
3. Fluency: Students do simultaneous reading with teacher. Students repeatedly read the same text. Students measure or graph fluency. Students read aloud as a group with an adult fluent reader. Students listen to a tape and/or read aloud with the tape. Students repeatedly practice on subskills.
4. Vocabulary: Students give meaning of words. Students apply the newly learned words in different context. Students practice word learning strategies.
5. Comprehension: Students preview the text. Students go back to the text for clarification. Students ask questions. Students complete graphic organizer. Students write summary of what was learned. Students retell a narrative or sequence of events. Students respond to key questions in writing. Students apply other comprehension strategies. All students read the text silently.

F–7
Students read the text aloud, with the teacher not reading. Students read the text aloud with the teacher.
Differentiated Instruction
Intervals in which both of the following items were marked by the observer were considered to represent differentiated instruction:
1. Differentiated instructional materials are used. 2. Teacher works with a particular small group of children or a particular individual child.

V. Descriptive Statistics for Classroom Observations
Fall, Implementation Year
Table F-2a. Percent of Intervals Spent in Different Classroom Formats, Fall of the Implementation Year Content Area Institute Series Only
(Group A; n = 86) Institute Series Plus Coaching
(Group B; n = 83) Control Group
(n = 84) Total
(n = 253) Mean Std
Dev Min Max Mean Std
Dev Min Max Mean Std
Dev Min Max Mean Std
Dev Min Max
Whole-class instruction
69.8 23.1 0 100.0 71.2 19.1 31.5 100.0 74.5 21.7 8.0 100.0 71.8 21.4 0 100.0
Small-group instruction
1.9 5.0 0 31.9 2.9 7.2 0 37.8 2.4 7.2 0 48.9 2.3 6.5 0 48.9
Differentiated instruction
10.1 16.6 0 88.4 8.5 15.7 0 63.6 11.6 19.3 0 88.0 10.1 17.3 0 88.4
Students working in pairs
2.0 4.6 0 24.3 2.0 4.1 0 20.0 2.2 6.2 0 41.4 2.1 5.0 0 41.3
Break in instruction
21.5 10.6 0 44.7 21.8 9.4 0 53.8 22.3 11.8 0 60.0 21.9 10.6 0 60.0
Table F-2b. Percent of Intervals Spent in Different Components of Reading Instruction and Other Content Areas, Fall of the Implementation Year
Content Area Institute Series Only (Group A; n = 86)
Institute Series Plus Coaching (Group B; n = 83)
Control Group (n = 84)
Total (n = 253)
Mean Std Dev
Min Max Mean Std Dev
Min Max Mean Std Dev
Min Max Mean Std Dev
Min Max
Phonemic Awareness
1.2 3.0 0 19.4 1.5 3.7 0 20.4 0.4 1.4 0 7.3 1.0 2.9 0 20.4
Phonics 17.9 14.0 0 61.0 21.2 14.3 0 67.4 17.3 13.1 0 58.8 18.8 13.9 0 67.4 Fluency 8.4 13.6 0 88.5 6.5 9.7 0 43.2 5.1 9.2 0 50.0 6.7 11.1 0 88.5 Vocabulary 9.4 10.9 0 39.3 8.5 10.6 0 45.2 9.2 12.2 0 79.3 9.0 11.2 0 79.3 Comprehension 40.0 17.1 0 83.0 38.1 17.0 0 75.0 41.7 19.3 0 100.0 39.9 17.8 0 100.0 Other (e.g., mathematics)
2.5 5.2 0 29.2 1.6 3.5 0 15.6 2.4 5.2 0 25.0 2.2 4.7 0 29.2
Spelling—not phonics
2.8 4.8 0 19.9 3.0 5.8 0 25.9 2.5 5.4 0 29.3 2.8 5.3 0 29.3
Grammar 3.9 8.1 0 42.9 3.5 6.5 0 35.4 3.7 6.8 0 33.3 3.7 7.2 0 42.9 Writing 7.8 12.9 0 52.5 4.5 0.1 0 29.5 5.9 8.9 0 35.3 6.0 10.2 0 52.5
F-8

Table F-2c. Percent of Intervals Spent in Type of Instruction, Fall of the Implementation Year Content Area Institute Series Only
(Group A; n = 86) Institute Series Plus Coaching
(Group B; n = 83) Control Group
(n = 84) Total
(n = 253) Mean Std
Dev Min Max Mean Std
Dev Min Max Mean Std
Dev Min Max Mean Std
Dev Min Max
Explicit Instruction
51.8 19.8 7.1 100.0 52.0 19.0 9.0 90.9 48.8 19.5 8.7 86.4 50.9 19.4 0.07 100.0
Independent Student Activity
60.1 18.0 15.0 100.0 60.0 18.8 0 97.7 62.9 17.7 5.9 95.7 61.2 18.1 0 100.0
Differentiated Instruction
10.1 16.6 0 60.7 8.5 15.7 0 63.6 11.6 19.3 0 88.0 10.1 17.3 0 88.0
Sample Size: N = 90 schools, 254 teachers (16 missing cases).
SOURCE: Fall 2005 Early Reading PD Intervention Study Classroom Observation Protocol.
Spring, Implementation Year
Table F-3a. Average Length of Observations, in Three Minute Intervals, Spring of the Implementation Year Variable Institute Series Only
(Group A; n = 89) Institute Series Plus Coaching
(Group B; n = 85) Control Group
(n = 84) Total
(n = 258) Mean Std
Dev Min Max Mean Std
Dev Min Max Mean Std
Dev Min Max Mean Std
Dev Min Max
Length of Observation
40.4 10.3 17.0 60.0 43.1 10.0 19.0 60.0 40.3 9.1 16.0 60.0 41.2 9.9 16.0 60.0
Table F-3b. Percent of Intervals in Different Classroom Formats, Spring of the Implementation Year Variable Institute Series Only
(Group A; n = 89) Institute Series Plus Coaching
(Group B; n = 85) Control Group
(n = 84) Total
(n = 258) Mean Std
Dev Min Max Mean Std
Dev Min Max Mean Std
Dev Min Max Mean Std
Dev Min Max
Whole Class 72.7 23.8 12.9 100.0 71.1 21.4 14.3 100.0 72.3 23.0 0 100.0 72.0 22.7 0 100.0 Small Groups 1.6 5.1 0 35.3 1.9 4.8 0 22.9 2.2 6.2 0 34.7 1.9 5.4 0 35.2 Differentiated Instruction
14.5 20.4 0 71.0 15.0 20.1 0 85.0 15.0 22.3 0 96.0 14.8 20.8 0 96.4
Pairs 2.4 5.4 0 34.2 1.4 3.0 0 11.4 2.5 6.3 0 28.6 2.1 5.1 0 34.2 Break 19.6 12.1 0 58.1 17.8 10.0 0 46.7 18.1 11.3 0 45.9 18.6 11.2 0 58.1
F-9

Table F-3c. Percent of Intervals in Different Components or Content Areas, Spring of the Implementation Year Variable Institute Series Only
(Group A; n = 89) Institute Series Plus Coaching
(Group B; n = 85) Control Group
(n = 84) Total
(n = 258) Mean Std
Dev Min Max Mean Std
Dev Min Max Mean Std
Dev Min Max Mean Std
Dev Min Max
Phonemic Awareness
0.7 2.2 0 14.0 0.1 3.4 0 23.8 0.1 2.6 0 22.2 0.7 2.7 0 23.8
Phonics 15.0 13.9 0 63.9 14.5 13.3 0 57.8 14.5 14.6 0 88.2 14.6 13.9 0 88.2 Fluency 7.1 10.0 0 42.2 6.8 9.0 0 41.0 8.2 11.5 0 53.1 7.4 10.2 0 53.1 Vocabulary 9.0 11.4 0 54.2 10.2 10.9 0 54.2 5.3 7.3 0 40.0 8.2 10.2 0 54.2 Comprehension 39.7 19.8 0 100.0 42.4 18.8 0 94.7 40.1 21.2 0 84.0 40.7 20.0 0 100.0 Other (e.g., mathematics)
1.8 5.5 0 31.6 1.7 4.9 0 22.5 3.1 8.2 0 43.2 2.2 6.4 0 43.2
Spelling—not phonics
3.6 6.6 0 31.2 3.5 7.1 0 42.8 3.9 6.7 0 35.3 3.7 6.8 0 42.8
Grammar 5.3 13.0 0 100.0 5.0 7.9 0 27.6 4.6 9.0 0 40.0 5.0 10.3 0 100.0 Writing 5.7 9.8 0 48.2 5.2 8.9 0 43.3 4.4 8.4 0 32.7 5.0 9.1 0 48.2
Table F-3d. Percent of Intervals Spent in Type of Instruction, Spring of the Implementation Year Content Area Institute Series Only
(Group A; n = 89) Institute Series Plus Coaching
(Group B; n = 85) Control Group
(n = 84) Total
(n = 258) Mean Std
Dev Min Max Mean Std
Dev Min Max Mean Std
Dev Min Max Mean Std
Dev Min Max
Explicit Instruction
50.8 20.3 6.0 100.0 56.5 15.5 25.0 90.0 44.3 23.9 0 100.0 50.6 20.7 0 100.0
Independent Student Activity
66.8 20.1 8.0 100.0 68.7 18.1 28.0 100.0 65.9 24.2 0 100.0 67.1 20.8 0 100.0
Differentiated Instruction
14.5 20.4 0 71.0 15.0 20.1 0 85.0 15.0 22.3 0 96.0 14.8 20.8 0 96.0
Sample Size: N = 90 schools, 258 teachers (12 missing cases). SOURCE: Spring 2006 Early Reading PD Intervention Study Classroom Observation Protocol.
F-10

Fall, Follow-Up Year
Table F-4a. Average Length of Observations, in Three Minute Intervals, Fall of the Follow-Up Year Variable Institute Series Only
(Group A; n = 71) Institute Series Plus Coaching
(Group B; n = 80) Control Group
(n = 77) Total
(n = 228) Mean Std
Dev Min Max Mean Std
Dev Min Max Mean Std
Dev Min Max Mean Std
Dev Min Max
Length of Observation
39.8 8.0 25.0 60.0 39.1 9.2 19.0 60.0 39.5 10.8 20.0 60.0 39.4 9.4 19.0 60.0
Table F-4b. Percent of Intervals in Different Classroom Formats, Fall of the Follow-Up Year Variable Institute Series Only
(Group A; n = 71) Institute Series Plus Coaching
(Group B; n = 80) Control Group
(n = 77) Total
(n = 228) Mean Std
Dev Min Max Mean Std
Dev Min Max Mean Std
Dev Min Max Mean Std
Dev Min Max
Whole Class 69.7 20.2 22.6 100.0 73.4 23.0 18.8 100.0 72.5 25.8 0 100.0 71.9 23.1 0 100.0 Small Groups 1.4 5.2 0 37.5 2.1 5.5 0 23.3 1.5 4.3 0 22.0 1.7 5.0 0 37.5 Differentiated Instruction
17.3 23.4 0 80.0 16.4 23.0 0 79.4 18.9 27.1 0 100.0 17.5 24.5 0 100.0
Pairs 2.4 5.9 0 32.0 0.5 2.3 0 14.3 1.8 4.6 0 22.7 1.5 4.5 0 32.0 Break 20.5 11.4 2.8 51.1 18.7 10.6 0 52.3 18.1 11.3 0 58.1 19.1 11.1 0 58.1
Table F-4c. Percent of Intervals in Different Components or Content Areas, Fall of the Follow-Up Year Variable Institute Series Only
(Group A; n = 71) Institute Series Plus Coaching
(Group B; n = 80) Control Group
(n = 77) Total
(n = 228) Mean Std
Dev Min Max Mean Std
Dev Min Max Mean Std
Dev Min Max Mean Std
Dev Min Max
Phonemic Awareness
0.7 2.9 0 20.0 1.3 3.9 0 20.0 0.7 2.0 0 10.6 0.9 3.1 0 20.0
Phonics 22.1 13.7 0 61.5 21.9 14.3 0 71.4 18.6 17.2 0 71.4 20.8 15.2 0 71.4 Fluency 7.2 12.6 0 58.1 5.4 9.4 0 47.8 5.5 8.3 0 40.9 6.0 10.2 0 58.1 Vocabulary 9.2 11.8 0 65.9 11.4 16.5 0 96.0 9.6 11.3 0 54.8 10.1 13.5 0 96.0 Comprehension 36.8 19.5 0 72.7 39.2 20.5 0 100.0 43.2 22.6 0 100.0 39.8 21.0 0 100.0 Other (e.g., mathematics)
26.8 22.2 0 88.2 23.5 17.5 0 66.7 24.1 20.0 0 88.9 24.7 19.9 0 88.9
Spelling—not phonics
2.2 5.0 0 20.0 2.4 4.6 0 18.6 2.7 5.7 0 25.0 2.4 5.1 0 25.0
Grammar 4.0 7.5 0 32.3 3.5 7.4 0 27.5 4.4 8.7 0 34.9 4.0 7.9 0 34.9 Writing 4.5 9.7 0 47.1 4.4 8.2 0 30.0 5.4 9.4 0 44.0 4.8 9.0 0 47.1
F-11

Table F-4d. Percent of Intervals Spent in Type of Instruction, Fall of the Follow-Up Year Content Area Institute Series Only
(Group A; n = 71) Institute Series Plus Coaching
(Group B; n = 80) Control Group
(n = 77) Total
(n = 228) Mean Std
Dev Min Max Mean Std
Dev Min Max Mean Std
Dev Min Max Mean Std
Dev Min Max
Explicit Instruction
48.4 18.6 4.5 100.0 50.8 21.0 0 100.0 52.4 20.8 4.8 100.0 50.6 20.2 0 100.0
Independent Student Activity
69.1 17.5 25.0 100.0 68.8 17.9 14.8 100.0 71.1 18.9 11.8 100.0 69.7 18.1 11.8 100.0
Differentiated Instruction
17.3 23.4 0 80.0 16.4 23.0 0 79.4 18.9 27.1 0 100.0 17.5 24.5 0 100.0
Sample Size: N = 90 Schools, 228 Teachers (22 missing values).
SOURCE: Fall 2006 Early Reading PD Interventions Study Classroom Observation Protocol.
F-12

APPENDIX G DETAILS ON STUDENT DATA, SAMPLE
CHARACTERISTICS, AND ACHIEVEMENT
MEASURES


G–1
APPENDIX G
DETAILS ON STUDENT DATA, SAMPLE CHARACTERISTICS,
AND ACHIEVEMENT MEASURES
This appendix reports on the characteristics of the student samples included in the implementation year and follow-up year impact analyses. It also presents an overview of the reading achievement tests used in each of the study districts.
I. Analysis Sample Description
In addition to baseline data, demographic information and achievement data reflecting the second grade students in the implementation year (2005–2006 school year) and the follow-up year (2006–2007 school year) were collected from participating districts. Because the unit of random assignment of the study was schools, the analysis of impact on student achievement focused on consecutive cohorts of second graders, rather than a single cohort followed longitudinally. Analyses reported in chapter 2 demonstrated that there were no statistically significant differences across treatment A, B, and the control schools in student demographic characteristics or achievement during the 2004–2005 school year, the year prior to the implementation of the interventions. We conducted similar analyses focusing on second grade students enrolled in the schools in 2005–2006 and 2006-2007, the years in which the impact analyses were conducted. The results indicate that there are no statistically significant differences across treatment group A, B, and control schools in the measured student demographic characteristics for the implementation year spring student sample. (See tables G-1 and G-2.)155
II. Student Achievement Tests
Exhibit G-1 summarizes the tests used by each district in the study sample, in particular the norming sample and psychometric properties of the tests and the content they emphasize. In four of the six sites, the Terra Nova reading test was used, although the specific version of the test differs among the four districts; in one district, the Stanford Achievement Test, version 10 (SAT-10) was used; and in one district, a criterion-referenced state test was used.
155 There was a significant group difference by age during the implementation year, although all three groups had an average age of 7.6 years after rounding. Significance in this case is due to the student sample size of 5,055 and the low variability in age among second grade students.

G–2
Table G-1. Student Characteristics, by Group [Implementation Year Spring Sample]
Characteristics
Institute Series Only (Group A)
Institute Series Plus Coaching (Group B) Control Group Overall
P-value for F-test
Race/ethnicity (percent)
Black 76.9 73.8 78.1 76.3 0.27 White 13.9 17.3 12.8 14.6 0.08 Hispanic 5.0 4.7 4.9 4.9 0.88 Asian 1.9 2.1 2.6 2.2 0.86 Other 2.3 2.1 1.6 2.0 0.75
Gender (percent)
Male 51.2 50.4 49.9 50.5 0.92 Female 48.8 49.6 50.1 49.5
Average age (years) 7.6 7.6 7.6 7.6 * 0.03 Poverty measure (percent) 76.6 77.1 80.5 78.0 0.21
Student sample size 1,789 1,605 1,661 5,055 (475 missing
cases)
School sample size 30 30 29 89 (1 missing
case)
SOURCE: Student level data were obtained from each individual study district.
NOTES: The measure of poverty status differs across districts. In 5 districts, it is measured by students’ free or reduced-price lunch status, but in one district, it was measured by free textbook status.
A separate regression model was estimated for each characteristic, including indicator variables for the random assignment blocks as well as the interaction of indicators for the six districts and two indicators for treatment status (representing treatment groups A and B vs. control). The F-test is a composite test of the significance of the district by treatment interaction terms.
Values in the columns represent unadjusted means for the groups.
There was a significant group difference by age during the implementation year, although all three groups had an average age of 7.6 years after rounding. Significance in this case is due to the sample size of 5,055 and the low variability in age among second grade students.
The sample includes all second graders enrolled in the study schools in the spring of the 2005-2006 school year., whether or not they were enrolled for the full year or entered the study schools after the school year began.
Two-tailed significance at the p < .05 level is indicated by an asterisk (*).

G–3
Table G-2. Student Characteristics, by Group [Follow-Up Year Spring Sample]
Characteristics
Institute Series Only (Group A)
Institute Series Plus Coaching (Group B) Control Group Overall
P-value for F-test
Race/ethnicity (percent)
Black 74.8 73.5 81.9 76.7 0.25 White 14.3 16.8 11.0 14.1 0.18 Hispanic 6.9 5.9 3.5 5.5 0.79 Asian 1.8 2.3 2.0 2.0 0.73 Other 2.2 1.5 1.6 1.8 0.74
Gender (percent)
Male 51.8 49.4 50.5 50.6 0.42 Female 48.2 50.6 49.5 49.4
Average age (years) 7.6 7.7 7.7 7.6 0.15 Poverty measure (percent) 76.4 81.6 79.8 79.2 0.40
Student sample size 1,559 1,533 1,522 4,614 (683 missing
cases)
School sample size 29 30 29 88 (2 missing cases)
NOTES: The measure of poverty status differs across districts. In 5 districts, it is measured by students’ free or reduced-price lunch status, but in one district, it was measured by free textbook status,
A separate regression model was estimated for each characteristic, including indicator variables for the random assignment blocks as well as the interaction of indicators for the six districts and two indicators for treatment status (representing treatment groups A and B vs. control). The F-test is a composite test of the significance of the district by treatment interaction terms.
Values in the columns represent unadjusted means for the groups.
The sample includes all second graders enrolled in the study schools in the spring of the 2006-2007 school year., whether or not they were enrolled for the full year or entered the study schools after the school year began.
Two-tailed significance at the p < .05 level is indicated by an asterisk (*).

Exhibit G-1. Descriptive Characteristics and Properties of Student Reading Achievement Tests
Number of Districts Using
Test Grade Test Used Metric Reading Content Emphasized Norming Sample and Psychometric Information Reading Total • word study skills (scaled score) • reading vocabulary
1 2 Spring SAT-10 Complete Battery
• reading comprehension
Normed on a national sample of approximately 250,000 students from April 1, 2002 to April 26, 2002.1 The internal consistency (KR-20) reliability coefficient was 0.95 for complete battery Total Reading test.2
Reading Total • word analysis (scaled score) • vocabulary
1 2 Spring Terra Nova First Edition / CTBS (Complete Battery Plus) • reading comprehension in the
following categories: basic understanding (literal meaning); analyzing text (drawing conclusions); evaluating and extending meaning; and identifying comprehension strategies
Normed on a national sample of 100,650 students in April 1996.3 Internal consistency coefficients ranged from 0.76 to 0.97 for the complete battery test.4
Reading Total • reading comprehension 1 2 Spring Terra Nova First Edition / CTBS (Survey without Plus)
(scaled score) • vocabulary
Normed on a national sample of more than 300,000 students in October 1999, January 2000, and April 2000.5 Internal consistency coefficients ranged from 0.72 to 0.94 for the subtests of the survey battery.4
Reading Total • reading comprehension 2 2 Spring Terra Nova Second Edition / CAT/6 (Survey without Plus)
(scaled score) • vocabulary
Normed on a national sample of more than 300,000 students in October 1999, January 2000, and April 2000.5 Internal consistency coefficients ranged from 0.72 to 0.94 for the subtests of the survey battery.4
1 3 Criterion-Referenced State Test
Reading Comprehension and Reading Vocabulary Subscores
• vocabulary Criterion-referenced test that calculates students’ scores as a difference from a cut score determined by the Pass level of current year students in the state according to the state’s academic standards.6 Internal consistency coefficients ranged from 0.90 to 0.94 for the ELA portion of the test for grades 3-10 in fall 2003.7
Notes: 1 Harcourt Assessment, Stanford Achievement Test Series, Tenth Edition Technical Data Report, 2004, p. 26. 2 Harcourt Assessment, Stanford Achievement Test Series, Tenth Edition Technical Data Report, 2004, p. 94. 3 TerraNova Technical Report. CTB/McGraw-Hill. 4 Salvia, John and James Ysseldyke, “Assessment: Eighth Edition,” Houghton Mifflin Company. 2001, p. 408. 5 TerraNova, The Second Edition Frequently Asked Questions. 2000, p. 10. 6 Guide to Test Interpretation: Grades 3–10 and the GQE Retest, Fall 2007, School Year 2007–2008. State Department of Education and CTB/McGraw-Hill LLC, 2007. 7 State Test Program Manual 2007–2008. State Department of Education, Division of School Assessment. 2007, p. 115.
G-4

APPENDIX H DETAILS ON IMPLEMENTATION OF THE PD
INTERVENTIONS


H–1
APPENDIX H
DETAILS ON IMPLEMENTATION OF THE PD
INTERVENTIONS
I. Fidelity of the Institutes and Seminars
As discussed in chapter 3, evaluation staff observed every institute and seminar session offered as part of the PD and used a low-inference fidelity form to provide data on the degree to which the PD was implemented as planned. This section describes how fidelity and dosage (teachers’ participation in the study PD) were calculated for the treatment groups.
Calculating Fidelity
The sections of the fidelity form for each institute and seminar day represented the planned agenda topics for those days, and subsections of the form represented subtopics and expected transitions in PD delivery format (e.g., moving from a presentation format to a small-group activity). See exhibit H-1 for a sample from the fidelity coding form for institute day 3. Coding took place at the agenda subtopic level. For each agenda subtopic, observers documented the start and end times, break times, number of PowerPoint slides covered, format of delivery, similarity of actual PD content to the planned content, and level of teacher engagement. Start and end times were used to calculate the duration of each subsection. Any break time that occurred during a subsection was subtracted from the duration. The format of delivery included presentation, video, individual activity, small-group activity, and whole-group activity.
Similarity of actual PD content to planned content was operationalized as the percentage of planned slides covered by the trainer. Observers coded the similarity of the delivered content to what had been planned as either “essentially as planned” (20 percent or fewer PowerPoint slides were deleted or added), “substantial differences” (more than a 20 percent increase or decrease in slides), or “did not occur” if a subtopic was dropped. Subtopics with planned changes could then be coded as being implemented essentially as planned, with substantial differences, or as not occurring. Level of engagement was operationalized as the percentage of participants who appeared to be on-task (e.g., not using cell phones or having unrelated conversations with other participants). Observers coded level of engagement as being either high (more than 80 percent of participants on-task), medium (50 to 80 percent of participants on task), or low (less than 50 percent of participants on task).
Calculating Amount of PD Received in Each Topic Area
The total amount of PD received by a teacher in each of the main PD topics was calculated by multiplying the total hours of PD the teacher attended each day by the percentage of the day devoted to each content area (as documented in the fidelity forms) and then summing across days.

2
Exhibit H-1. Sample from Fidelity Coding Form, Institute Day 1
H-2

H–3
II. Coaching
Calculating the Amount of Coaching Received in Each Activity and Topic Area
The total amount of coaching received by each teacher reported in chapter 3 was calculated by summing the durations of the events in which the coach and teacher participated together. The activity (e.g., planning) and topic (e.g., differentiated instruction) codes associated with each event allowed calculation of coaching hours devoted to each category. If coaches used a single log entry to record a series of individual encounters with different teachers during a particular day, the time covered by these encounters was divided evenly among the teachers mentioned in the log. Coaches could use multiple activity and content codes to characterize a particular event. In these cases, the time covered by the event was divided equally among the indicated topics and the activities.


APPENDIX I VALIDATION OF THE SURVEY DATA ON
PROFESSIONAL DEVELOPMENT
PARTICIPATION


I–1
APPENDIX I
VALIDATION OF THE SURVEY DATA ON PROFESSIONAL
DEVELOPMENT PARTICIPATION
As discussed in chapter 2, we collected data on teachers’ participation in PD in two ways. For all teachers, we administered a survey asking teachers for information on all PD in which they participated. Teachers were instructed to include both study PD and PD provided through other sources.156 In addition, for treatment A and B teachers, we collected sign-in sheet information for the institutes and seminars. The sign-in sheets maintained for Early Reading PD Interventions Study professional development institutes and seminars were used to evaluate the accuracy of teachers’ self-reported participation in professional development (survey items) In addition, the sign-in sheets make it possible to compare the dosage of professional development received by group A and group B teachers. We also collected detailed data from coaches on the amount of coaching each treatment B teacher received, which we used to compare with the B group teachers’ responses to the survey items on coaching.
I. Participation in Institutes and Seminars
To validate the survey data on institute and seminar participation, we compared survey data with actual attendance data at the institutes and seminars for group A and B teachers. To compare the survey-based measure with the sign-in sheets, we combined two survey items to get the full teacher reported dosage for the relevant time period of summer 2005 and school year 2005–2006:
During the summer of 2005, what is the total number of hours you spent in the following professional development activities?
Write the total number of hours you spent in these activities. Mark ‘0’ if you participated in none.
Summer of 2005 Number of hours
b. Attended longer institute or workshop in reading (more than half-day).
During the 2005–2006 school year, what is the total number of hours you spent in the following professional development activities?
Write the total number of hours you spent in these activities. Mark ‘0’ if you participated in none.
School year 2005–2006 Number of hours
b. Attended longer institute or workshop in reading (more than half-day).
156 Therefore the PD data could not be disaggregated into study PD and non-study PD hours.

I–2
To determine the similarity between the two sources of PD participation data, we calculated the correlation between self-reported hours in longer institute and seminar workshops and the hours from the sign-in sheets.
For the teachers in the treatment groups, combined summer 2005 and 2005–2006 school year hours of study-relevant PD was 35.3 hours (s.d. = 13.3) as recorded in study records (this includes time spent on surveys and administrative announcements during the study PD) and 41.6 hours (s.d. = 31.7) as reported in teacher surveys. The correlation between responses on the teacher PD survey, which asked about all reading-related PD teachers had participated in during the study period (including the study PD), and the teacher institute-specific PD hours as recorded by attendance sheets was 0.39 (N = 175; p < .0001).
A supplementary analysis using the sign-in sheets was conducted to see whether the participation in study-provided professional development differed for group A and group B teachers. The analytical model parallels the model used to testing potential baseline differences between study conditions. However, only teachers in A and B conditions have been included in the analysis. The analysis shows that the dosage of study-provided institutes and seminars received by teachers in study conditions A and B did not differ by a statistically significant margin (see table I-1).
Table I-1. Difference in Institute and Seminar Participation Between Teachers in Conditions A and B (PD Seminars/Institutes)
Estimates in Hours Label Estimate Standard
Error DF t Value Pr > |t|
Difference between condition A and B teachers
–0.74 1.60 39 –0.46 0.64
II. Participation in Coaching
To validate the survey data on participation in coaching, we compared survey data with data from the coaches’ logs for group B teachers. To compare the survey-based measure with the coach logs, we combined two survey items to get the full teacher reported dosage for the relevant time period of summer 2005 and school year 2005–2006:
During the summer of 2005, what is the total number of hours you spent in the following professional development activities?
Write the total number of hours you spent in these activities. Mark ‘0’ if you participated in none.
Summer of 2005
Number of hours
e. Received coaching or mentoring related to reading instruction.

I–3
During the 2005–2006 school year, what is the total number of hours you spent in the following professional development activities?
Write the total number of hours you spent in these activities. Mark ‘0’ if you participated in none.
School year 2005–2006
Number of hours
e. Received coaching or mentoring related to reading instruction.
The mean total coaching hours experienced by the treatment group B teachers during the
2005–2006 school year was 61.6 (s.d. = 39.3) as reported in coaches’ logs and 62.5 hours (s.d. = 101.7) as reported in the teacher surveys.157 The correlation between coach logs and teacher survey recorded coaching hours was 0.50 (N = 82, p = 0.001). These average figures correspond to the expected dosage of coaching, which was 2 hours/week over the approximately 30-week-long study period.
157 The mean of 62.5 hours reported here represents the raw mean, whereas the estimate of 70.9 hours reported in table 3-5 is an adjusted mean.


APPENDIX J ESTIMATION METHODS AND HYPOTHESIS
TESTING

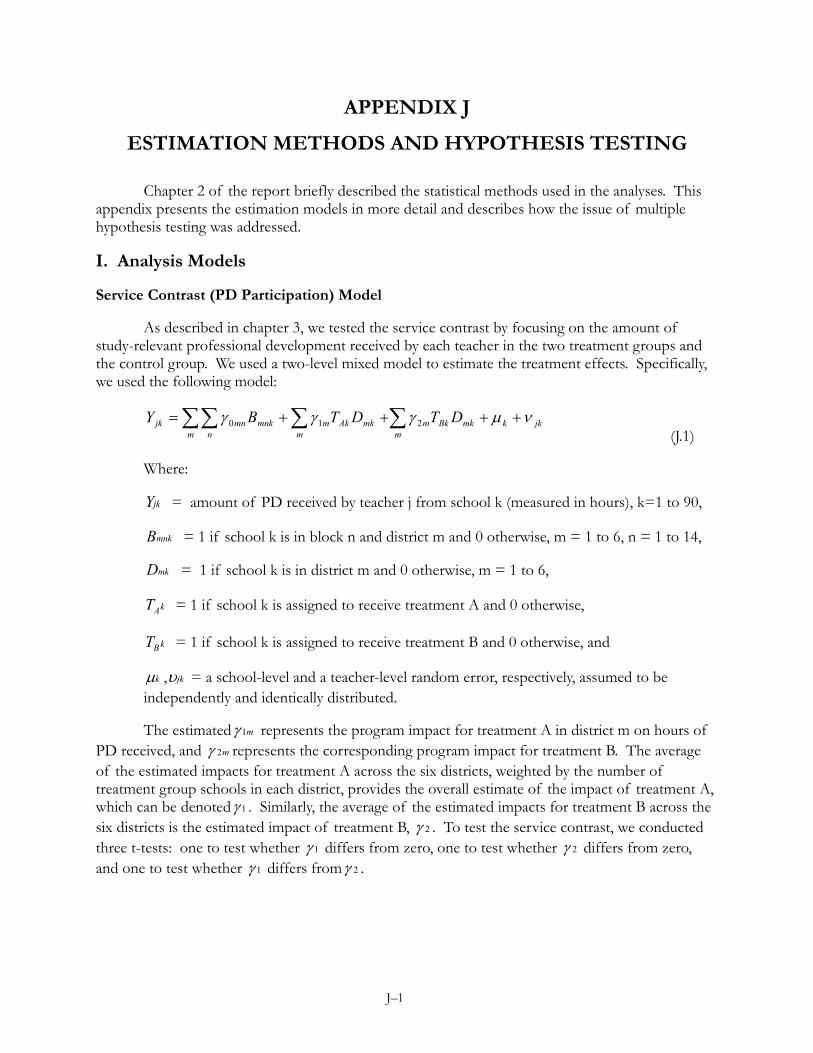
J–1
APPENDIX J
ESTIMATION METHODS AND HYPOTHESIS TESTING
Chapter 2 of the report briefly described the statistical methods used in the analyses. This appendix presents the estimation models in more detail and describes how the issue of multiple hypothesis testing was addressed.
I. Analysis Models
Service Contrast (PD Participation) Model
As described in chapter 3, we tested the service contrast by focusing on the amount of study-relevant professional development received by each teacher in the two treatment groups and the control group. We used a two-level mixed model to estimate the treatment effects. Specifically, we used the following model:
jkkm
mkBkmm m
mkAkmn
mnkmnjk DTDTBY νμγγγ ++++= ∑∑ ∑∑ 210 (J.1)
Where:
jkY = amount of PD received by teacher j from school k (measured in hours), k=1 to 90,
mnkB = 1 if school k is in block n and district m and 0 otherwise, m = 1 to 6, n = 1 to 14,
mkD = 1 if school k is in district m and 0 otherwise, m = 1 to 6,
kAT = 1 if school k is assigned to receive treatment A and 0 otherwise,
kBT = 1 if school k is assigned to receive treatment B and 0 otherwise, and
kμ , jkυ = a school-level and a teacher-level random error, respectively, assumed to be independently and identically distributed.
The estimated m1γ represents the program impact for treatment A in district m on hours of PD received, and m2γ represents the corresponding program impact for treatment B. The average of the estimated impacts for treatment A across the six districts, weighted by the number of treatment group schools in each district, provides the overall estimate of the impact of treatment A, which can be denoted 1γ . Similarly, the average of the estimated impacts for treatment B across the six districts is the estimated impact of treatment B, 2γ . To test the service contrast, we conducted three t-tests: one to test whether 1γ differs from zero, one to test whether 2γ differs from zero, and one to test whether 1γ differs from 2γ .

J–2
Impact Analysis Models
The evaluation focuses on the effect of professional development on three types of outcomes: teacher knowledge, teachers’ classroom instruction, and student achievement. We discuss the model for student achievement in detail and then describe the models for teacher knowledge and instructional practice together, because the issues specific to these two outcome domains are similar.
Student Achievement Impact
To conduct the analysis, we pooled student achievement data from the six districts in the study sample, using dummy variables for blocks to control for block differences.158 This approach uses the whole data set in a single analysis, providing a common error term to test the six district effects and allowing us to see how districts differ from one another and whether these differences are statistically significant.
We estimated the following equation, treating blocks as fixed effects:
∑∑∑∑ ++=m
mkkBmm
mkkAmm n
mnkmnijk DTDTBY 210 γγγ
ijkjkkl
lijklm
mkkmm
mkkm XDYDY ευμαγγ +++++ +−− ∑∑∑ 2413 (J.2)
Where:
jkYi = achievement measurement for student i in the classroom of teacher j in school k, k=1 to 90
mnkB = 1 if school k is in block n in district m and 0 otherwise, m = 1 to 6, n = 1 to 14,
mkD = 1 if school k is in district m and 0 otherwise, m = 1 to 6,
kAT = 1 if school k is assigned to receive treatment A and 0 otherwise,
kBT = 1 if school k is assigned to receive treatment B and 0 otherwise,
kY 1− = the mean pretest score for school k one year before random assignment,
kY 2− = the mean pretest score for school k two years before random assignment,
lijkX = student-level covariate l for student i from teacher j in school k, and
kμ , jkυ , ijkε = a school-level, teacher-level, and student-level random error, respectively, assumed to be independently and identically distributed.
158 Two levels of blocking were used for random assignment. The first level is school district and the second level varied by district.

J–3
As in the service contrast model, the estimated m1γ represents the program impact for treatment A in district m, and m2γ represents the corresponding program impact for treatment B. The average of the estimated impacts for treatment A across the six districts, weighted by the number of treatment group schools in each district, provides the overall estimate of the impact of treatment A, which can be denoted 1γ . Similarly, the average of the estimated impacts for treatment B across the six districts is the estimated impact of treatment B, 2γ .
To test our main hypotheses, we conducted three t-tests: one to test whether 1γ differs from zero, one to test whether 2γ differs from zero, and one to test whether 1γ differs from 2γ . This last test answers the research question concerning whether there is an added effect of in-school coaching on student reading achievement.
The covariates included in the model (in addition to the block dummies) include school-level baseline achievement scores for one or two prior years,159 as well as student-level demographic information such as gender, age, poverty status, and race/ethnicity from student record data.160
The error term structure reflects the “hierarchical” or “nested” structure of the data, which has students nested within classrooms or teachers, and teachers and classrooms nested within schools. This model is estimated as a three-level hierarchical model with the MIXED procedure in SAS.
Teacher Knowledge and Instructional Practice
We estimated the following teacher-level model, which parallels the student-level achievement model (J.2, above).
jkkjkjkm
mkBkmm m
mkAkmn
mnkmnjk ZYDTDTBY νμγγγγγ ++++++= −∑∑ ∑∑ 413210 (J.3)
Where:
jkY = outcome measurement for teacher j from school k, k=1 to 90,
mnkB = 1 if school k is in block n and district m and 0 otherwise, m = 1 to 6, n = 1 to 14,
mkD = 1 if school k is in district m and 0 otherwise, m = 1 to 6,
kAT = 1 if school k is assigned to receive treatment A and 0 otherwise,
kBT = 1 if school k is assigned to receive treatment B and 0 otherwise,
159 For four of the six districts, the baseline school achievement covariates were computed by averaging individual second-grade student test scores for the two baseline years separately. For the two districts with six schools in the sample, the two years were averaged together to preserve the degrees of freedom in those districts. Because baseline tests differ across districts, the baseline score variables were interacted with district indicators. 160 The measure of poverty status differs across districts. In 5 districts, it is measured by students’ free or reduced-price lunch status, but in one district, it was measured by free textbook status, and thus it is interacted with district indicators. The other student-level covariates have consistent measures across districts and are not interacted with district indicators.

J–4
jkY 1− = baseline measurement of outcome Y,
jkZ = baseline characteristics for teacher j from school k, and
kμ , jkυ = a school-level and a classroom-level random error, respectively, assumed to be independently and identically distributed.
As in the student achievement analysis, we computed the overall impact estimate by averaging impact estimates across the six districts, weighting by the number of treatment schools in the sample in each districts. We also report the effect size of the impact for each impact estimate. The effect size is based on the standard deviation for the control group (pooled across districts) from the first follow-up data collection.
The covariates included in this model (in addition to the block dummies) are baseline characteristics of the teachers. We have baseline scores for teacher knowledge, but similar baseline measures for the teacher instruction variable do not exist. We also include other teacher characteristics at baseline to improve the precision of the estimates for treatment effects: teacher’s education level, total years of teaching experience, and years of experience with reading program. In the analysis of instructional practice, we also include class size and percentage of students in the class that are one or more years below grade level. For cases with missing covariate values, district mean values are used to impute for the missing cases and a missing indicator is included in the model.161
The error term structure reflects the hierarchical or nested structure of the data, which has teachers and classrooms nested within schools. This model is estimated as a two-level hierarchical model with the MIXED procedure in SAS.
Baseline Teacher Knowledge Interaction Models
To examine whether the impact of the PD interventions varied depending on the teachers’ initial level of reading content knowledge, we re-estimated the basic impact models discussed above, including the interaction of baseline teacher knowledge and the treatment indicators. Because our basic impact models included separate treatment effects for each of the six districts, we included baseline knowledge by district interaction terms, as well as baseline knowledge by district by treatment interaction terms in the interaction models. In addition, we included all of the block dummy variables and covariates included in the basic impact models.
As in the basic impact models, we computed a weighted average of the six district treatment effects to obtain an overall estimate of the main effect of the treatment, weighting by the number of treatment schools in each district. Similarly, we computed a weighted average of the six districts by teacher knowledge by treatment interaction terms to obtain an overall estimate of the interaction effect. The results of the analysis appear in section II of appendix L.
161 Less than 10 percent of teachers in the analysis sample had missing values, and the missing rates are comparable across the three experiment groups.

J–5
II. Standardization of Outcome Measures
As described in chapter 4, to put the outcome variables in a common metric, we standardized the variables. For teachers’ knowledge and instructional practices, we used the teachers in the control group as the basis for standardization. Thus teachers in the control group have a mean of zero and a standard deviation of one. For student achievement, because the test in use differed across districts, scores were standardized within each district, using the scores in the 2004–2005 student baseline sample as the basis for standardization. This allows us to aggregate the test score results across districts
We chose different groups as the basis for the standardization of the teacher and student variables because the timing of the available data differed for teachers and students. For teachers, data were collected during the implementation and follow-up years. Although the initial wave of the Reading Content and Practice Survey (RCPS) was conducted prior to the initiation of the PD, and thus the baseline RCPS could have been used as the basis of standardization, all three waves of classroom observations were conducted after the PD was underway. To maintain consistency across teacher measures, we chose the control group as the basis for standardization for the teacher variables.
Each teacher’s RCPS or observation score was standardized as follows:
)(..)(
iC
Cii Yds
YYZ −=
Where
iZ is the standardized score for teacher i;
iY is the outcome for teacher i;
CY is the average of Y for teachers in the control group; and
)(.. iC Yds is the standard deviation of Y for teachers in the control group.
Each student’s test score was standardized in the following way:
)(..)(
ijj
jijij Yds
YYZ
−=
Where
ijZ is the standardized score for student i from district j;
ijY is the total reading score for student i from district j on the district-administered test;

J–6
jY is the average raw score of second graders in all study schools for district j on the district administered test in school year 2004–2005; and
)(.. ijj Yds is the standard deviation of second graders in all study schools for district j on the district administered test in school year 2004–2005.
This standardized measure was used as an outcome in the achievement analyses. Since it is a linear transformation of the student test scores within each district, it does not affect the significance of the difference between treatment and control groups within each district.
III. Approach to Multiple Hypothesis Testing
As discussed in chapter 2, we took several steps to reduce the potential problems associated with multiple hypothesis testing. The first step in this process is to divide the impact analyses into two tiers: confirmatory analyses, which provide answers to our key research questions, and exploratory analyses, which facilitate a deeper understanding of our findings and what they mean. The designation for each impact analysis is listed in the last column of exhibit J-1. For confirmatory analyses, we report the unadjusted p-value for each hypothesis test but also qualify our findings by taking the multiple comparisons issue into consideration. For exploratory outcomes, we report only unadjusted p-values.
The second step involves using composite “qualifying” tests to assess the overall statistical significance of a set of impact estimates within a measurement domain. The qualifying test uses a composite index averaging the individual measures included in a domain, and it tests the null hypothesis that all three groups are equal (A = B = C) against the alternative that one or more groups differ(s) from the others (Hays, 1973). When a qualifying test indicates a statistically significant difference between groups, it suggests that there are in fact statistically significant findings in one or more of the individual tests included and hence adds confidence to the interpretation of the individual findings. However, when a qualifying test does not indicate a statistically significant difference between groups, it calls into question the interpretation of specific findings within that group.
The qualifying tests for each outcome domain were specified as follows:
• For the “teacher knowledge” domain, there are three outcome measures: a reading total score and two subscores—word level and meaning level reading. We considered the total score results as “qualifier” for the subtest scores. To qualify the individual findings for the three pairs of comparisons (A vs. C, B vs. C, and A vs. B) and for the two subtest scores, a joint F-test was conducted using the total score as the dependent variable. This analysis tests the hypothesis that the means for group A, B, and C are equal, against the alternative that one or more group differs from the others.
• For the “teacher practice” domain, there are three outcome measures: explicit instruction, independent student activity, and differentiated instruction. An “index” was constructed by averaging standardized versions of these three measures, and a joint F-test was conducted using the composite index as the dependent variable.

J–7
• For the “student achievement” domain, there are two outcome measures: the achievement scale score and a dichotomous outcome (scoring above the district median). An “index” was constructed by averaging standardized versions of the measures, and a joint F-test was conducted using the composite index as the dependent variable.
Results of these composite tests are reported in tables J-1 and J-2.
Exhibit J-1. Outcome Domains, Measures, Subgroups, and Types of Tests for Early Reading PD Interventions Study
Domain Outcome Measure Data Source Subgroup Type of Test Teacher Knowledge
Meaning Level Teacher Knowledge Survey
Full Sample Confirmatory
(3 outcomes)
Word Level Teacher Knowledge Survey
Full Sample Confirmatory
Total Level Teacher Knowledge Survey
Full Sample Confirmatory
Instructional Practice
Total Explicit Instruction Classroom Observations
Full Sample (fall, spring)
Confirmatory
(3 outcomes) Stable Teachers Exploratory Differentiated Instruction Classroom
Observations Full Sample (fall, spring)
Confirmatory
Stable Teachers Exploratory Student Engagement/Active Learning Classroom
Observations Full Sample (fall, spring)
Confirmatory
Stable Teachers Exploratory
Student Achievement
Total reading score from state tests District Records Full Sample Confirmatory
(2 outcomes) Students of Stable Teachers
Exploratory
Dichotomous variable indicating performance above or below a
cut-point District Records Full Sample Confirmatory
Students of Stable Teachers
Exploratory

J–8
Table J-1. Results of Implementation Year Composite Tests
Impact
Outcome Measure
Institute Series Only vs. Control
Institute Series Plus Coaching
vs. Control
Institute Series Plus Coaching
vs. Institute Series Only
Composite Test
(p-value) Service Contrast
Index 0.73 2.32 1.58 0.00 *(p-value of impact estimate) (0.10) (0.00) (0.00)
Teacher Knowledge Total Score (Index) 0.37 0.38 0.01 0.02 *(p-value of impact estimate) (0.02) (0.01) (0.92)
Teacher Practice Index 0.1 0.23 0.13 0.04 *(p-value of impact estimate) (0.26) (0.01) (0.15)
Student Achievement Index 0.04 –0.04 –0.07 0.64 (p-value of impact estimate) (0.60) (0.67) (0.40)
NOTE: The composite test tests the null hypothesis that all three groups are equal (A = B = Control) against the alternative that one or more group differs from the others.
Table J-2. Results of Follow-Up Year Composite Tests
Impact
Outcome Measure
Institute Series Only vs. Control
Institute Series Plus Coaching
vs. Control
Institute Series Plus Coaching
vs. Institute Series Only
Composite Test
(p-value) Teacher Knowledge
Total Score (Index) 0.18 0.07 -0.11 0.43 (p-value of impact estimate) (0.27) (0.68) (0.46)
Teacher Practice Index -0.07 -0.07 0.00 0.51 (p-value of impact estimate) (0.48) (0.42) (0.97)
Student Achievement Index 0.11 0.01 -0.09 0.337 (p-value of impact estimate) (0.15) (0.86) (0.29)
NOTE: The composite test tests the null hypothesis that all three groups are equal (A = B = Control) against the alternative that one ore more group differs from the others.

APPENDIX K FALL 2005 SHORT-TERM TEACHER PRACTICE
OUTCOMES


K–1
APPENDIX K
FALL 2005 SHORT-TERM TEACHER PRACTICE OUTCOMES
We conducted classroom observations three times over the course of the study: in the fall of 2005, early in the year the professional development was being implemented; in the spring of 2006, at the end of the implementation year; and in the fall of 2006, during the school year after the PD was implemented. In chapter 4, we reported the impact of the interventions on classroom instruction in the spring of the implementation year; and in chapter 5, we reported the impact in the fall of the follow-up year. Table K-1, below, presents results on the short-term impact of the PD interventions on the teacher practices, based on data collected in the fall of 2005, early in the implementation year when the PD had been partially implemented. None of the effects reached statistical significance as of the beginning of the implementation year.

K–2
Table K-1. Short-Term Impact of the PD Interventions on Teacher Practices in Reading Instruction: Teacher-Led Explicit Instruction, Independent Student Activity, and Differentiated Instruction [Implementation Year Fall Sample]
Outcome
Institute Series Only (Group A)
Institute Series Plus Coaching (Group B)
Control Group
Short-Term Impact
(Effect Size)
Standard Error of the Estimated
Impact P-value
Teacher-Led Explicit Instruction (standardized) Institute Series Only vs.
Control 0.21 0.04 0.28 0.17
0.10
Institute Series Plus Coaching vs. Control
0.33 0.04 0.16 0.17
0.33
Institute Series Plus Coaching vs. Institute Series Only
0.21 0.33 –0.12 0.17
0.48
Independent Student Activity (standardized)
Institute Series Only vs. Control
–0.16 –0.03 –0.13 0.18
0.48
Institute Series Plus Coaching vs. Control
–0.13 –0.03 –0.10 0.18
0.58
Institute Series Plus Coaching vs. Institute Series Only
–0.16 –0.13 0.03 0.18
0.87
Differentiated Instruction (standardized)
Institute Series Only vs. Control
–0.15 0.07 –0.22 0.14
0.12
Institute Series Plus Coaching vs. Control
–0.16 0.07 –0.23 0.14
0.11
Institute Series Plus Coaching vs. Institute Series Only
–0.15 –0.16 0.01 0.14
0.96
Sample Size: N = 90 schools, 253 teachers (17 missing cases).
SOURCE: Fall 2005 PD Impact Study Classroom Observation Protocol.
NOTES: The estimates presented in this table represent the short-term impact of the PD interventions on the teacher practices, based on data collected in the fall of 2005, early in the implementation year when the PD had been partially implemented.
The teacher outcome variables were standardized using the overall control group mean and standard derivation.
The treatment and control columns display regression-adjusted mean outcomes for all three groups, evaluated at the control group mean values for all covariates in the regression model.
Two-tailed statistical significance at the p < .05 level is indicated by an asterisk (*).

APPENDIX L SUPPORTING TABLES AND FIGURES FOR
IMPACT ANALYSES


L–1
APPENDIX L
SUPPORTING TABLES AND FIGURES FOR IMPACT
ANALYSES
I. Unadjusted Means
In chapters 4 and 5 we presented impact estimates and group means based on models that adjusted for student and teacher or classroom-level characteristics. Tables L-1 through L-6 provide impact estimates and group means that are not adjusted for these characteristics. Unadjusted means were calculated using the same models used in chapters 4 and 5, excluding the student and teacher-level covariates.
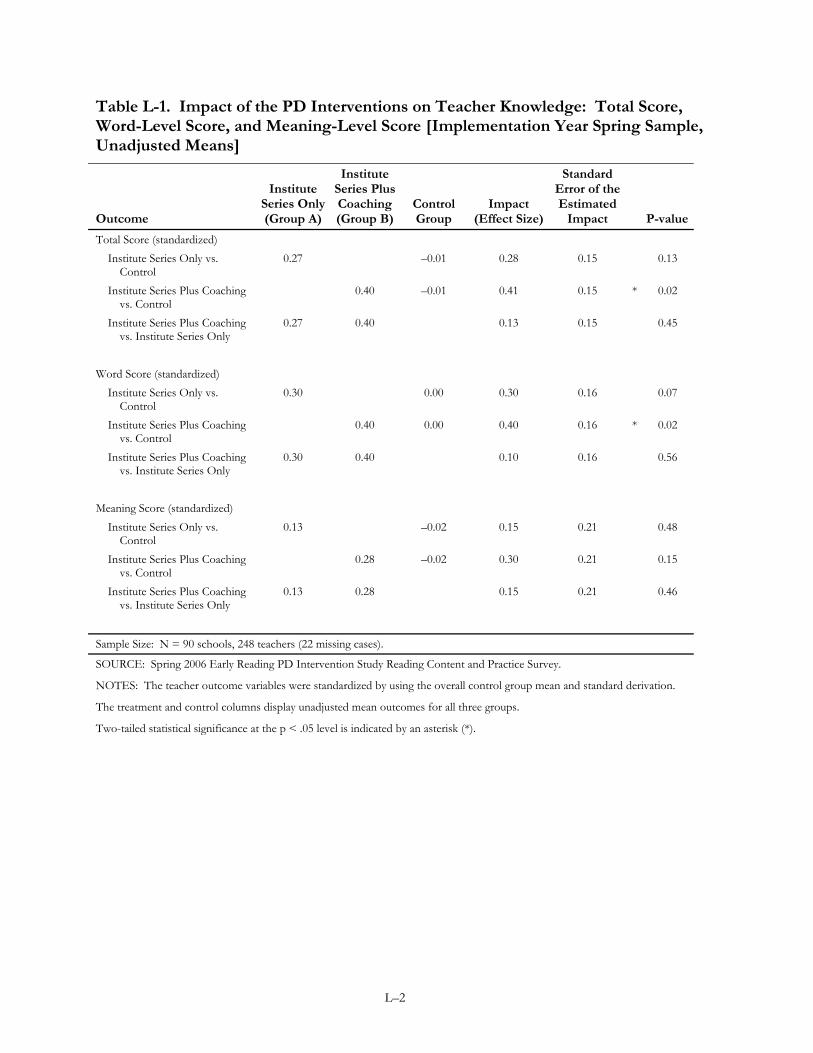
L–2
Table L-1. Impact of the PD Interventions on Teacher Knowledge: Total Score, Word-Level Score, and Meaning-Level Score [Implementation Year Spring Sample, Unadjusted Means]
Outcome
Institute Series Only (Group A)
Institute Series Plus Coaching (Group B)
Control Group
Impact (Effect Size)
Standard Error of the Estimated
Impact P-value
Total Score (standardized) Institute Series Only vs.
Control 0.27 –0.01 0.28 0.15
0.13
Institute Series Plus Coaching vs. Control
0.40 –0.01 0.41 0.15 * 0.02
Institute Series Plus Coaching vs. Institute Series Only
0.27 0.40 0.13 0.15
0.45
Word Score (standardized)
Institute Series Only vs. Control
0.30 0.00 0.30 0.16
0.07
Institute Series Plus Coaching vs. Control
0.40 0.00 0.40 0.16 * 0.02
Institute Series Plus Coaching vs. Institute Series Only
0.30 0.40 0.10 0.16
0.56
Meaning Score (standardized)
Institute Series Only vs. Control
0.13 –0.02 0.15 0.21
0.48
Institute Series Plus Coaching vs. Control
0.28 –0.02 0.30 0.21
0.15
Institute Series Plus Coaching vs. Institute Series Only
0.13 0.28 0.15 0.21
0.46
Sample Size: N = 90 schools, 248 teachers (22 missing cases).
SOURCE: Spring 2006 Early Reading PD Intervention Study Reading Content and Practice Survey.
NOTES: The teacher outcome variables were standardized by using the overall control group mean and standard derivation.
The treatment and control columns display unadjusted mean outcomes for all three groups.
Two-tailed statistical significance at the p < .05 level is indicated by an asterisk (*).

L–3
Table L-2. Impact of the PD Interventions on Teacher Practices in Reading Instruction: Teacher-Led Explicit Instruction, Independent Student Activity, and Differentiated Instruction [Implementation Year Spring Sample, Unadjusted Means]
Outcome
Institute Series Only (Group A)
Institute Series Plus Coaching (Group B)
Control Group
Impact (Effect Size)
Standard Error of the Estimated
Impact P-value
Teacher-Led Explicit Instruction (standardized) Institute Series Only vs.
Control 0.36 0.01 0.35 0.14 * 0.01
Institute Series Plus Coaching vs. Control
0.58 0.01 0.57 0.14 * 0.00
Institute Series Plus Coaching vs. Institute Series Only
0.36 0.58 0.22 0.14
0.12
Independent Student Activity (standardized)
Institute Series Only vs. Control
0.06 0.00 0.06 0.15
0.69
Institute Series Plus Coaching vs. Control
0.19 0.00 0.19 0.15
0.20
Institute Series Plus Coaching vs. Institute Series Only
0.06 0.19 0.13 0.15
0.37
Differentiated Instruction (standardized)
Institute Series Only vs. Control
–0.05 0.01 –0.06 0.16
0.70
Institute Series Plus Coaching vs. Control
-0.01 0.01 –0.02 0.16
0.89
Institute Series Plus Coaching vs. Institute Series Only
–0.05 -0.01 0.04 0.15
0.80
Sample Size: N = 90 schools, 248 teachers (22 missing cases).
SOURCE: Spring 2006 Early Reading PD Intervention Study Reading Content and Practice Survey.
NOTES: The teacher outcome variables were standardized by using the overall control group mean and standard derivation.
The treatment and control columns display unadjusted mean outcomes for all three groups.
Two-tailed statistical significance at the p < .05 level is indicated by an asterisk (*).

L–4
Table L-3. Impact of the PD Interventions on Student Reading Scores: Total Reading Score and Percent At or Above the Overall Baseline Mean [Implementation Year Spring Sample, Unadjusted Means]
Outcome
Institute Series Only (Group A)
Institute Series Plus Coaching (Group B)
Control Group
Impact (Effect Size)
Standard Error of the Estimated
Impact P-value
Test Score (standardized) Institute Series Only vs.
Control -0.03 0.01 -0.04 0.09 0.68
Institute Series Plus Coaching vs. Control
0.00 0.01 -0.01 0.09 0.92
Institute Series Plus Coaching vs. Institute Series Only
-0.03 0.00 0.03 0.09 0.75
Dichotomous Outcome: At or Above Mean of Baseline Cohort (percent)
Institute Series Only vs. Control
48.20 51.30 -3.10 3.85
0.42
Institute Series Plus Coaching vs. Control
49.33 51.30 -1.97 3.89
0.61
Institute Series Plus Coaching vs. Institute Series Only
48.20 49.33 1.13 3.82
0.77
Sample Size: N = 89 schools, 5,055 students
SOURCE: Student level data were obtained from individual study district records. Records from one control school in the implementation year were not available.
NOTES: Student test scores were standardized by using the overall mean and standard deviation within each district for the 2004–2005 baseline cohort, including only the schools participating in the study.
The treatment and control columns display unadjusted mean outcomes for all three groups.
The impact for the standardized test score is in effect sizes. The impact for the dichotomous outcome is in percentage points.
Two-tailed statistical significance at the p < .05 level is indicated by an asterisk (*).

L–5
Table L-4. Impact of the PD Interventions on Teacher Knowledge: Total Score, Word-Level Score, and Meaning-Level Score [Follow-Up Year Spring Sample, Unadjusted Means]
Outcome
Institute Series Only
(Group A)
Institute Series Plus
Coaching (Group
B) Control Group
Impact (Effect Size)
Standard Error of the Estimated
Impact P-value
Total Score (standardized) Institute Series Only vs.
Control 0.04 -0.10 0.14 0.18
0.46
Institute Series Plus Coaching vs. Control
0.00 -0.10 0.10 0.18
0.57
Institute Series Plus Coaching vs. Institute Series Only
0.04 0.00 -0.04 0.18
0.85
Word Score (standardized)
Institute Series Only vs. Control
0.09 -0.06 0.15 0.16
0.37
Institute Series Plus Coaching vs. Control
0.16 -0.06 0.22 0.16
0.18
Institute Series Plus Coaching vs. Institute Series Only
0.09 0.16 0.07 0.15
0.66
Meaning Score (standardized)
Institute Series Only vs. Control
-0.08 -0.10 0.02 0.19
0.91
Institute Series Plus Coaching vs. Control
-0.18 -0.10 -0.08 0.18
0.68
Institute Series Plus Coaching vs. Institute Series Only
-0.08 -0.18 -0.10 0.18
0.59
Sample Size: N = 88 Schools, 232 Teachers (22 missing cases).
SOURCE: Spring 2007 Early Reading PD Interventions Study Reading Content and Practice Survey (RCPS).
NOTES: The teacher outcome variables were standardized using the overall control group mean and standard deviation.
The treatment and control columns display unadjusted mean outcomes for all three groups.
Two-tailed statistical significance at the p < .05 level is indicated by an asterisk (*).
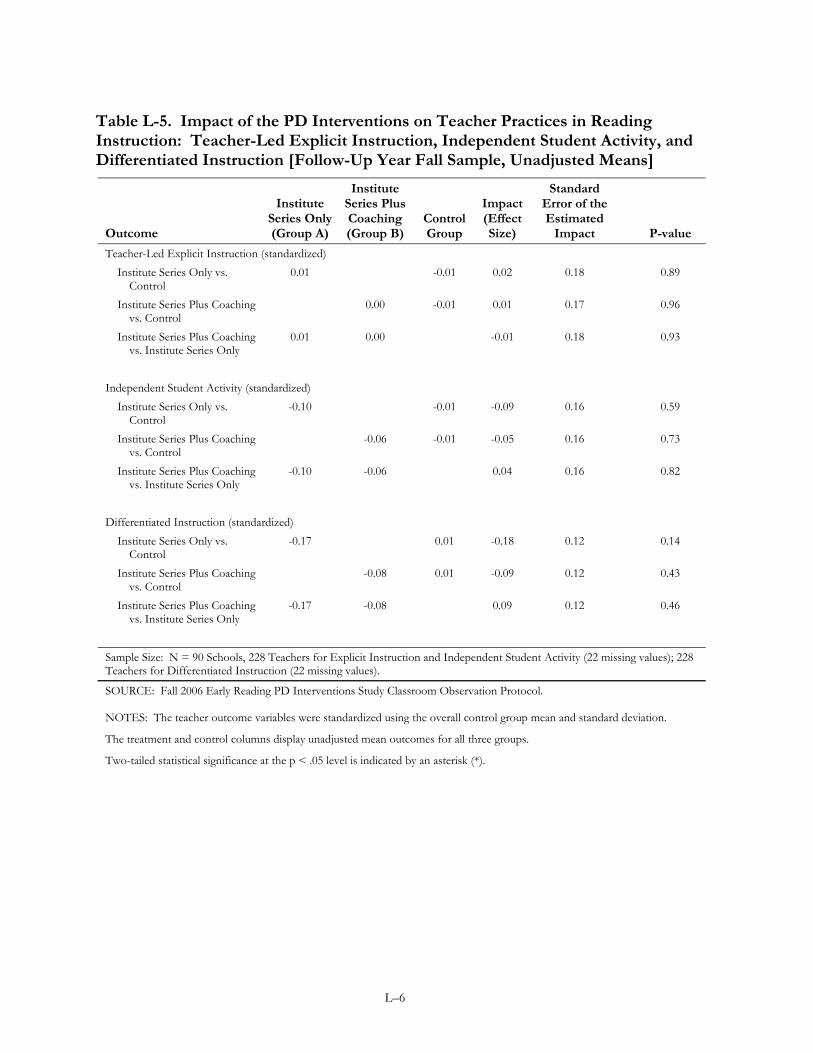
L–6
Table L-5. Impact of the PD Interventions on Teacher Practices in Reading Instruction: Teacher-Led Explicit Instruction, Independent Student Activity, and Differentiated Instruction [Follow-Up Year Fall Sample, Unadjusted Means]
Outcome
Institute Series Only (Group A)
Institute Series Plus Coaching (Group B)
Control Group
Impact (Effect Size)
Standard Error of the Estimated
Impact P-value
Teacher-Led Explicit Instruction (standardized) Institute Series Only vs.
Control 0.01 -0.01 0.02 0.18 0.89
Institute Series Plus Coaching vs. Control
0.00 -0.01 0.01 0.17 0.96
Institute Series Plus Coaching vs. Institute Series Only
0.01 0.00 -0.01 0.18 0.93
Independent Student Activity (standardized)
Institute Series Only vs. Control
-0.10 -0.01 -0.09 0.16 0.59
Institute Series Plus Coaching vs. Control
-0.06 -0.01 -0.05 0.16 0.73
Institute Series Plus Coaching vs. Institute Series Only
-0.10 -0.06 0.04 0.16 0.82
Differentiated Instruction (standardized)
Institute Series Only vs. Control
-0.17 0.01 -0.18 0.12 0.14
Institute Series Plus Coaching vs. Control
-0.08 0.01 -0.09 0.12 0.43
Institute Series Plus Coaching vs. Institute Series Only
-0.17 -0.08 0.09 0.12 0.46
Sample Size: N = 90 Schools, 228 Teachers for Explicit Instruction and Independent Student Activity (22 missing values); 228 Teachers for Differentiated Instruction (22 missing values).
SOURCE: Fall 2006 Early Reading PD Interventions Study Classroom Observation Protocol.
NOTES: The teacher outcome variables were standardized using the overall control group mean and standard deviation.
The treatment and control columns display unadjusted mean outcomes for all three groups.
Two-tailed statistical significance at the p < .05 level is indicated by an asterisk (*).

L–7
Table L-6. Impact of the PD Interventions on Student Reading Scores: Total Reading Score and Percent At or Above the Overall Baseline Mean [Follow-Up Year Spring Sample, Unadjusted Means]
Outcome
Institute Series Only (Group A)
Institute Series Plus Coaching (Group B)
Control Group
Impact (Effect Size)
Standard Error of the
Estimated Impact P-value
Test Score (standardized)
Institute Series Only vs. Control
0.04 0.04 -0.01 0.08 0.95
Institute Series Plus Coaching vs. Control
0.02 0.04 -0.03 0.08 0.74
Institute Series Plus Coaching vs. Institute Series Only
0.04 0.02 -0.02 0.08 0.79
Dichotomous Outcome: At or Above Mean of Baseline Cohort (percent)
Institute Series Only vs. Control
52.71 51.31 1.40 3.54 0.69
Institute Series Plus Coaching vs. Control
49.54 51.31 -1.76 3.52 0.62
Institute Series Plus Coaching vs. Institute Series Only
52.71 49.54 -3.17 3.50 0.37
Sample Size: N = 88 Schools, 4,614 Students SOURCE: Student-level data were obtained from individual study district records.
NOTES: Student test scores were standardized using the overall mean and standard deviation within each district for the 2004–2005 baseline cohort, including only the schools participating in the study.
The treatment and control columns display unadjusted mean outcomes for all three groups.
Two-tailed statistical significance at the p < .05 level is indicated by an asterisk (*).
II. Interaction of the Impact of the Treatment and Baseline Teacher Knowledge
To explore whether the PD interventions had differential effects on teachers who had higher/lower content and pedagogical knowledge at baseline, the main impact models from chapter 4 were re-estimated, incorporating interactions between teacher knowledge at baseline and the treatment indicators. The results, in tables L-7 through L-9, show one statistically significant interaction; the impact of the institute series alone (treatment A) on the use of independent student activities was more positive for teachers who started low in teacher knowledge than it was for teachers who started high in teacher knowledge (p = 0.04; table L-8).

L–8
Table L-7. Interaction of Baseline Teacher Knowledge and the Treatment Effect, Teacher Knowledge Outcomes [Implementation Year Spring Sample]
Main Treatment Effect RCPS Baseline Interaction Effect
Outcome Estimate Standard
Error P-value Estimate Standard
Error P-valueTotal Score (standardized)
Institute Series Only vs. Control 0.37 0.17 * 0.03 –0.17 0.27 0.52 Institute Series Plus Coaching vs.
Control 0.50 0.17 * 0.00 0.10 0.28 0.71 Institute Series Plus Coaching vs.
Institute Series Only 0.14 0.17 0.42 0.28 0.30 0.37 Word Score (standardized)
Institute Series Only vs. Control 0.32 0.17 * 0.06 0.04 0.19 0.85 Institute Series Plus Coaching vs.
Control 0.43 0.17 * 0.01 0.12 0.23 0.59 Institute Series Plus Coaching vs.
Institute Series Only 0.11 0.17 0.53 0.09 0.24 0.71 Meaning Score (standardized)
Institute Series Only vs. Control 0.23 0.22 0.29 –0.46 0.34 0.18 Institute Series Plus Coaching vs.
Control 0.43 0.21 * 0.05 0.06 0.29 0.84 Institute Series Plus Coaching vs.
Institute Series Only 0.19 0.21 0.37 0.51 0.32 0.11 Sample Size: N = 90 schools, 248 teachers (22 missing cases). SOURCE: Spring 2006 Early Reading PD Interventions Study Reading Content and Practice Survey.
NOTES: Two-tailed statistical significance at the p < .05 level is indicated by an asterisk (*).

L–9
Table L-8. Interaction of Baseline Teacher Knowledge and the Treatment Effect, Teacher Practice Outcomes [Implementation Year Spring Sample]
Main Treatment Effect RCPS Baseline Interaction Effect
Outcome Estimate Standard
Error P-value Estimate Standard
Error P-value Teacher-Led Explicit Instruction (standardized)
Institute Series Only vs. Control 0.31 0.16 * 0.05 0.12 0.26 0.63 Institute Series Plus Coaching vs.
Control 0.54 0.16 * 0.00 0.45 0.29 0.12 Institute Series Plus Coaching vs.
Institute Series Only 0.23 0.16 0.15 0.33 0.30 0.28 Independent Student Activity (standardized)
Institute Series Only vs. Control 0.16 0.20 0.44 –0.69 0.34 * 0.04 Institute Series Plus Coaching vs.
Control 0.29 0.21 0.16 –0.34 0.37 0.36 Institute Series Plus Coaching vs.
Institute Series Only 0.13 0.21 0.52 0.35 0.39 0.38 Differentiated Instruction (standardized)
Institute Series Only vs. Control –0.07 0.16 0.69 0.04 0.21 0.85 Institute Series Plus Coaching vs.
Control –0.11 0.17 0.51 –0.09 0.23 0.72 Institute Series Plus Coaching vs.
Institute Series Only –0.04 0.17 0.79 –0.13 0.25 0.60 Sample Size: N = 90 schools. 255 teachers for Explicit Instruction and Independent Student Activity (15 missing values); 258 teachers for Differentiated Instruction (12 missing values). NOTES: The teacher outcome variables were standardized by using the overall control group mean and standard deviation. The fall teacher knowledge score was standardized by using the grand mean.
Two-tailed statistical significance at the p < .05 level is indicated by an asterisk (*).

L–10
Table L-9. Interaction of Baseline Teacher Knowledge and the Treatment Effect, Student Achievement Outcomes [Implementation Year Spring Sample]
Main Treatment Effect RCPS Baseline Interaction Effect
Outcome Estimate Standard
Error P-value Estimate Standard
Error P-value Test Score (Effect Size)
Institute Series Only vs. Control 0.10 0.10 0.31 0.08 0.13 0.52 Institute Series Plus Coaching vs.
Control –0.02 0.10 0.87 0.01 0.13 0.93 Institute Series Plus Coaching vs.
Institute Series Only –0.12 0.12 0.32 –0.07 0.15 0.62 Dichotomous Outcome: At or Above Mean of Baseline Overall Distribution (percent)
Institute Series Only vs. Control 4.54 4.14 0.28 3.11 5.69 0.59 Institute Series Plus Coaching vs.
Control –4.54 4.33 0.30 0.45 5.81 0.94 Institute Series Plus Coaching vs.
Institute Series Only –9.08 4.86 0.07 –2.66 6.28 0.67 Sample Size: N = 84 schools (6 missing cases), 4661 students (869 missing cases). SOURCE: Student-level data were obtained from each individual study district. Six schools were dropped from this analysis because there was not enough information to identify students’ classrooms, or because of missing data.
NOTES: Two-tailed statistical significance at the p < .05 level is indicated by an asterisk (*).
III. Coach Clustering Sensitivity Analysis
Each of the 30 treatment group B schools had access to a study-provided coach to work half-time on the school. In total, 19 coaches worked across the 30 schools. Eight of the coaches each worked with one treatment group B school; the other 11 coaches each worked with two schools. Because the 30 treatment group B schools worked with 19 coaches in total, it could be argued that the 30 schools do not represent 30 independent instances of the coaching treatment. The outcomes for schools that shared a common coach may have been affected in similar ways by the specific qualities and background of the coach (for example, the coach’s knowledge or experience), and thus the schools are not strictly speaking independent.
To examine the sensitivity of the estimates of the impact of the PD on classroom instruction to the potential dependence among schools sharing a coach, we re-estimated the main impact model, combining the 22 schools that shared a coach into 11 “pseudo-schools.”162 In all districts except one where coaches were shared between schools, the schools sharing a coach belonged to different blocks used in randomization. As a result, the blocks that shared a coach were combined for these analyses. The impact estimates taking coaching into account are shown in table L-10. As was true for the main impacts reported in chapter 4, statistically significant effects were found for treatment A and treatment B on teachers’ use of explicit instruction, and no significant effects were found for teachers’ use of independent student activity or differentiated instruction.
162 The coach clustering analysis focused on the classroom instruction outcomes because those outcomes were the primary focus of the coaching condition.

L–11
Table L-10. Impact of the PD Interventions on Teacher Practices in Reading Instruction: Teacher-Led Explicit Instruction, Independent Student Activity, and Differentiated Instruction [Implementation Year Spring Sample, Accounting for Coach Clustering]
Outcome
Institute Series Only (Group A)
Institute Series Plus Coaching (Group B)
Control Group
Impact (Effect Size)
Standard Error of the Estimated
Impact P-value
Teacher-Led Explicit Instruction (standardized) Institute Series Only vs.
Control 0.34 0.01 0.33 0.14 * 0.03
Institute Series Plus Coaching vs. Control
0.56 0.01 0.55 0.15 * 0.00
Institute Series Plus Coaching vs. Institute Series Only
0.34 0.56 0.18 0.12
0.14
Independent Student Activity (standardized)
Institute Series Only vs. Control
0.07 0.00 0.07 0.19
0.69
Institute Series Plus Coaching vs. Control
0.18 0.00 0.18 0.16
0.25
Institute Series Plus Coaching vs. Institute Series Only
0.07 0.18 0.17 0.16
0.29
Differentiated Instruction (standardized)
Institute Series Only vs. Control
–0.04 0.01 –0.05 0.15
0.74
Institute Series Plus Coaching vs. Control
–0.02 0.01 –0.03 0.14
0.80
Institute Series Plus Coaching vs. Institute Series Only
–0.04 –0.02 0.02 0.14
0.87
Sample Size: N = 79 schools of which 11 are combinations of two schools sharing a reading coach; 255 teachers for Explicit Instruction and Independent Student Activity (15 missing values); 258 teachers for Differentiated Instruction (12 missing values).
SOURCE: Spring 2006 Early Reading PD Interventions Study Classroom Observation Protocol.
NOTES: The teacher outcome variables were standardized by using the overall control group mean and standard deviation.
Values in the control group column represent the average of the unadjusted control group means for each of the six districts, weighted by the number of schools in each district.
Values in the treatment group columns represent adjusted means. Means for the treatment groups were calculated by adding their impact estimates to the unadjusted mean of the control group.
Two-tailed statistical significance at the p < .05 level is indicated by an asterisk (*).
IV. Teacher Knowledge Measure Misfit Exclusion Sensitivity Analysis
As noted in the discussion of the teacher knowledge scale properties in appendix D, two of the implementation year items in the meaning-level teacher knowledge scale had misfit statistics greater than 1.3 (i.e., too high; unexpected patterns detected) or less than 0.7 (i.e., too low;

L–12
conforming to the expected pattern too deterministically; Wright and Linacre 1994). For the follow-up year, two of the items in the word-level scale, four of the items in meaning-level scale and seven of the items in the overall scale had misfit statistics greater than 1.3 or less than 0.7. The decision was made not to exclude the items because (a) the earlier waves retained all test items (including the small number of misfitting items), and (b) upon inspection of the items, we found them to be theoretically important in the construction of the scales. To check that the results based on the teacher knowledge scales were not artifacts of misfitting items, we conducted a sensitivity analysis by re-running the teacher knowledge impact analyses after excluding one item that would be considered a severe misfit according to the Rasch modeling literature (i.e., an item having a misfit statistic less than 0.5 or greater than 1.5; see http://www.winsteps.com/winman/index.htm?diagnosingmisfit.htm). The excluded item was a fluency item, and therefore results are presented for total score and word-level score, the two scores that include the fluency item (tables L-11 and L-12). The results show the same pattern of significance as the main impact tables (see chapters 4 and 5). The impact effect sizes for the sensitivity analysis are within 0.05 standard deviations of the original estimates.
Table L-11. Impact of the PD Interventions on Teacher Knowledge: Total Score and Word-Level Score [Implementation Year Spring Sample, Excluding Misfitting Word-Level Item]
Outcome
Institute Series Only (Group A)
Institute Series Plus Coaching (Group B)
Control Group
Impact (Effect Size)
Standard Error of the Estimated
Impact P-value
Total Score (standardized) Institute Series Only vs.
Control 0.38 -0.01 0.39 0.16 * 0.02
Institute Series Plus Coaching vs. Control
0.35 -0.01 0.36 0.15 * 0.02
Institute Series Plus Coaching vs. Institute Series Only
0.38 0.35 -0.03 0.16 0.85
Word Score (standardized)
Institute Series Only vs. Control
0.40 0.00 0.40 0.16 * 0.02
Institute Series Plus Coaching vs. Control
0.39 0.00 0.39 0.16 * 0.02
Institute Series Plus Coaching vs. Institute Series Only
0.40 0.39 -0.01 0.16 0.97
Sample Size: N = 90 schools, 248 teachers (22 missing cases).
SOURCE: Spring 2006 Early Reading PD Intervention Study Reading Content and Practice Survey.
NOTES: The teacher outcome variables were standardized by using the overall control group mean and standard derivation.
The treatment and control columns display regression-adjusted mean outcomes for all three groups, evaluated at the control group mean values for all covariates in the regression model.
Two-tailed statistical significance at the p < .05 level is indicated by an asterisk (*).

L–13
Table L-12. Impact of the PD Interventions on Teacher Knowledge: Total Score and Word-Level Score [Follow-Up Year Spring Sample, Excluding Misfitting Word-Level Item]
Outcome
Institute Series Only (Group A)
Institute Series Plus Coaching (Group B)
Control Group
Impact (Effect Size)
Standard Error of the Estimated
Impact P-value
Total Score (standardized) Institute Series Only vs.
Control 0.12 -0.10 0.22 0.16
0.18
Institute Series Plus Coaching vs. Control
-0.01 -0.10 0.09 0.16
0.57
Institute Series Plus Coaching vs. Institute Series Only
0.12 -0.01 -0.13 0.16
0.41
Word Score (standardized)
Institute Series Only vs. Control
0.17 -0.06 0.23 0.15
0.14
Institute Series Plus Coaching vs. Control
0.16 -0.06 0.22 0.15
0.13
Institute Series Plus Coaching vs. Institute Series Only
0.17 0.16 -0.01 0.14
0.96
Sample Size: N = 88 Schools, 232 Teachers (22 missing cases).
SOURCE: Spring 2007 Early Reading PD Interventions Study Reading Content and Practice Survey (RCPS).
NOTES: The teacher outcome variables were standardized using the overall control group mean and standard deviation.
The treatment and control columns display regression-adjusted mean outcomes for all three groups, evaluated at the control group mean values for all covariates in the regression model.
Two-tailed statistical significance at the p < .05 level is indicated by an asterisk (*).
V. Analysis of District Variation in the Impact of the Treatments
In the impact analyses reported in chapters 4 and 5, the six participating districts were treated as fixed effects, and separate treatment effects were estimated for each of the six districts. F-tests were conducted to determine whether there was statistically significant variation in the impact of the treatment across districts. The results, shown in tables L-13 through L-18 and figures L-1 through L-16, indicate that there was statistically significant variation in impacts across districts for two of the group comparisons. The statistically significant district effects were both for the differentiated instruction outcome. In the implementation year, there was significant district variation in the impact of the institute series plus coaching compared to the institute series only (treatment B vs. treatment A; table L-14); and in the follow-up year, there was significant district variation in the impact of the institute series only compared the control (treatment A vs. control; table L-17).

L–14
Table L-13. Results of F-test for Variation in District-Level Impacts, Teacher Knowledge Outcomes [Implementation Year Spring Sample]
P-value of F-test Outcome
Institute Series Only vs. Control Group
Institute Series Plus Coaching vs. Control Group
Institute Series Only vs. Institute Series Plus
Coaching Total Score (standardized) 0.63 0.18 0.45 Word Score (standardized) 0.71 0.33 0.73 Meaning Score (standardized) 0.81 0.63 0.61 Sample Size: N = 90 schools, 248 teachers (22 missing cases). SOURCE: Spring 2006 Early Reading PD Interventions Study Reading Content and Practice Survey.
NOTES: The teacher outcome variables were standardized by using the overall control group mean and standard deviation. The fall teacher knowledge score was standardized by using the grand mean.
A composite F-test is used to test whether the district-by-district variation in impacts is statistically significant.
Table L-14. Results of F-test for Variation in District-Level Impacts, Teacher Practice Outcomes [Implementation Year Spring Sample]
P-value of F-test Outcome Institute Series Only vs.
Control Group Institute Series Plus Coaching vs. Control
Group
Institute Series Plus Coaching vs. Institute
Series Only Teacher-Led Explicit Instruction (standardized)
0.60 0.86 0.83
Independent Student Activity (standardized)
0.32 0.75 0.24
Differentiated Instruction (standardized)
0.74 0.06 0.01*
Sample Size: N = 90 schools, 255 teachers for Explicit Instruction and Independent Student Activity (15 missing values), 258 teachers for Differentiated Instruction (12 missing values). SOURCE: Spring 2006 Early Reading PD Interventions Study Classroom Observation Protocol.
NOTES: The teacher outcome variables were standardized by using the overall control group mean and standard deviation. The fall teacher knowledge score was standardized by using the grand mean.
A composite F-test is used to test whether the district-by-district variation in impacts is statistically significant.

L–15
Table L-15. Results of F-test for Variation in District-Level Impacts, Student Achievement Outcomes [Implementation Year Spring Sample]
P-value of F-test Outcome Institute Series Only vs.
Control Group Institute Series Plus
Coaching vs. Control GroupInstitute Series Plus
Coaching vs. Institute Series Only
Reading Achievement Standardized Score
0.82 0.86 0.35
Dichotomous Outcome: At or Above Mean of Baseline Overall Distribution (percent)
0.67 0.95 0.35
Sample Size: N = 89 schools, 5,055 students. SOURCE: Student level data were obtained from each individual study district.
NOTES: A composite F-test is used to test whether the district-by-district variation in impacts is statistically significant.
Table L-16. Results of F-test for Variation in District-Level Impacts, Teacher Knowledge Outcomes [Follow-Up Year Spring Sample]
P-value of F-test Outcome
Institute Series Only vs. Control Group
Institute Series Plus Coaching vs. Control Group
Institute Series Only vs. Institute Series Plus
Coaching Total Score (standardized) 0.21 0.29 0.40 Word Score (standardized) 0.41 0.26 0.41 Meaning Score (standardized) 0.39 0.90 0.54 Sample Size: N = 88 schools, 232 teachers (22 missing values). SOURCE: Spring 2007 Early Reading PD Interventions Study Reading Content and Practice Survey.
NOTES: The teacher outcome variables were standardized by using the overall control group mean and standard deviation. The fall teacher knowledge score was standardized by using the grand mean.
A composite F-test is used to test whether the district-by-district variation in impacts is statistically significant.

L–16
Table L-17. Results of F-test for Variation in District-Level Impacts, Teacher Practice Outcomes [Follow-Up Year Fall Sample]
P-value of F-test Outcome Institute Series Only vs.
Control Group Institute Series Plus
Coaching vs. Control GroupInstitute Series Plus
Coaching vs. Institute Series Only
Teacher-Led Explicit Instruction (standardized)
0.54 0.90 0.87
Independent Student Activity (standardized)
0.55 0.88 0.89
Differentiated Instruction (standardized)
0.02* 0.38 0.53
Sample Size: N = 90 schools, 228 Teachers for Explicit Instruction and Independent Student Activity (22 missing values), 228 teachers for Differentiated Instruction (22 missing values). SOURCE: Fall 2006 Early Reading PD Interventions Study Classroom Observation Protocol.
NOTES: The teacher outcome variables were standardized by using the overall control group mean and standard deviation. The fall teacher knowledge score was standardized by using the grand mean.
A composite F-test is used to test whether the district-by-district variation in impacts is statistically significant.
Table L-18. Results of F-test for Variation in District-Level Impacts, Student Achievement Outcomes [Follow-Up Year Spring Sample]
P-value of F-test Outcome Institute Series Only vs.
Control Group Institute Series Plus
Coaching vs. Control GroupInstitute Series Plus
Coaching vs. Institute Series Only
Reading Achievement Standardized Score
0.74
0.77
0.28
Dichotomous Outcome: At or Above Mean of Baseline Overall Distribution (percent)
0.63
0.53
0.31
Sample Size: N = 88 schools (2 missing cases), 4,614 students (683 missing cases). SOURCE: Student level data were obtained from each individual study district.
NOTES: A composite F-test is used to test whether the district-by-district variation in impacts is statistically significant.

L–17
Figure L-1. Impact of the PD Interventions on Teacher Knowledge: Total Score, by District [Implementation Year Spring Sample]
A Effect (A vs Control)
0.780.95
1.37
0.951.21
2.68
-0.55-0.39
-0.73
-0.28 -0.23
0.110.110.28 0.32 0.33
0.49
1.40
-4.00
-3.00
-2.00
-1.00
0.00
1.00
2.00
3.00
4.00
Districts
Impa
ct E
stim
ate
(Effe
ct S
ize)
B Effect (B vs Control)
0.77
1.08
2.26
0.53
1.22
2.98
-0.43-0.26
-0.05
-0.73
-0.14
0.370.17
0.41
1.10
-0.10
0.54
1.68
-4.00
-3.00
-2.00
-1.00
0.00
1.00
2.00
3.00
4.00
Districts
Impa
ct E
stim
ate
(Effe
ct S
ize)
SOURCE: Reading Content and Practices Survey (RCPS), Spring 2006. Covariate measures were taken from the fall 2005 RCPS and teacher background surveys.
NOTE: Impact estimates for districts’ treatment A and treatment B effects are ordered by the magnitude of the districts’ treatment A effects.

L–18
Figure L-2. Impact of the PD Interventions on Teacher Knowledge: Word-Level Score, by District [Implementation Year Spring Sample]
A Effect (A vs Control)
0.640.95 1.00
1.48 1.39
2.00
-0.67
-0.27 -0.32-0.59
-0.02
-0.51
-0.010.34 0.34 0.44
0.68 0.74
-4.00
-3.00
-2.00
-1.00
0.00
1.00
2.00
3.00
4.00
Districts
Impa
ct E
stim
ate
(Effe
ct S
ize)
B Effect (B vs Control)
0.73 0.65
1.05
2.16
1.39
2.39
-0.45 -0.60-0.27
-0.110.05
-0.190.14 0.03
0.39
1.020.72
1.10
-4.00
-3.00
-2.00
-1.00
0.00
1.00
2.00
3.00
4.00
Districts
Impa
ct E
stim
ate
(Effe
ct S
ize)
SOURCE: PD Impact Study Reading Content and Practices Survey (RCPS), Spring 2006. Covariate measures were taken from fall 2005 RCPS and teacher background surveys.
NOTE: Impact estimates for districts’ treatment A and treatment B effects are ordered by the magnitude of the districts’ treatment A effects.

L–19
Figure L-3. Impact of the PD Interventions on Teacher Knowledge: Meaning-Level Score, by District [Implementation Year Spring Sample]
A Effect (A vs Control)
0.86
1.311.01 1.05 1.05
2.62
-0.92
-1.29
-0.64 -0.61 -0.48 -0.60
-0.03 0.010.18 0.22 0.29
1.01
-4.00
-3.00
-2.00
-1.00
0.00
1.00
2.00
3.00
4.00
Districts
Impa
ct E
stim
ate
(Effe
ct S
ize)
B Effect (B vs Control)
1.00
1.97
0.971.27
0.64
3.10
-0.68-0.91
-0.52 -0.39
-0.94
-0.190.16
0.530.22
0.44
-0.15
1.45
-4.00
-3.00
-2.00
-1.00
0.00
1.00
2.00
3.00
4.00
Districts
Impa
ct E
stim
ate
(Effe
ct S
ize)
SOURCE: Reading Content and Practices Survey (RCPS), Spring 2006. Covariate measures were taken from the fall 2005 RCPS and teacher background surveys.
NOTE: Impact estimates for districts’ treatment A and treatment B effects are ordered by the magnitude of the districts’ treatment A effects.

L–20
Figure L-4. Impact of the PD Interventions on Teacher Practices in Reading Instruction: Explicit Instruction, by District [Implementation Year Spring Sample]
A Effect (A vs Control)
1.10
0.56
0.99 1.00 1.07
1.85
-1.29
-0.67-0.36
-0.18 -0.14 -0.06-0.09 -0.05
0.32 0.41 0.46
0.89
-4.00
-3.00
-2.00
-1.00
0.00
1.00
2.00
3.00
4.00
Districts
Impa
ct E
stim
ate
(Effe
ct S
ize)
B Effect (B vs Control)
1.68
1.01
1.40
1.03 1.04
2.21
-0.96
-0.220.09
-0.19 -0.10 0.000.36 0.40
0.740.42 0.47
1.10
-4.00
-3.00
-2.00
-1.00
0.00
1.00
2.00
3.00
4.00
Districts
Impa
ct E
stim
ate
(Effe
ct S
ize)
SOURCE: Early Reading PD Interventions Study Classroom Observations, Spring 2006. Covariate measures were taken from fall 2005 RCPS and teacher background surveys.
NOTE: Impact estimates for districts’ treatment A and treatment B effects are ordered by the magnitude of the districts’ treatment A effects.

L–21
Figure L-5. Impact of the PD Interventions on Teacher Practices in Reading Instruction: Independent Student Activity, by District [Implementation Year Spring Sample]
A Effect (A vs Control)
0.24 0.35
0.76
1.290.94 1.01
-2.30
-1.09
-0.50-0.75
-0.37 -0.28
-1.03
-0.37
0.13 0.27 0.29 0.36
-4.00
-3.00
-2.00
-1.00
0.00
1.00
2.00
3.00
4.00
Districts
Impa
ct E
stim
ate
(Effe
ct S
ize)
B Effect (B vs Control)
1.66
0.83 0.82
2.10
1.13
0.59
-1.15
-0.56 -0.47-0.25 -0.18
-0.62
0.25 0.14 0.18
0.92
0.47
-0.01
-4.00
-3.00
-2.00
-1.00
0.00
1.00
2.00
3.00
4.00
Districts
Impa
ct E
stim
ate
(Effe
ct S
ize)
SOURCE: Early Reading PD Interventions Study Classroom Observations, Spring 2006. Covariate measures were taken from fall 2005 RCPS and teacher background surveys.
NOTE: Impact estimates for districts’ treatment A and treatment B effects are ordered by the magnitude of the districts’ treatment A effects.

L–22
Figure L-6. Impact of the PD Interventions on Teacher Practices in Reading Instruction: Differentiated Instruction, by District [Implementation Year Spring Sample]
A Effect (A vs Control)
0.360.57 0.46
0.21
0.610.78
-1.52
-0.82
-0.45-0.18
-0.39 -0.26-0.58
-0.13 0.00 0.01 0.110.26
-4.00
-3.00
-2.00
-1.00
0.00
1.00
2.00
3.00
4.00
Districts
Impa
ct E
stim
ate
(Effe
ct S
ize)
B Effect (B vs Control)
0.880.70 0.72
0.28
-0.20
0.26
-1.14
-0.62-0.42
-0.14
-0.93
-0.29-0.13
0.04 0.15 0.07
-0.57
-0.01
-4.00
-3.00
-2.00
-1.00
0.00
1.00
2.00
3.00
4.00
Districts
Impa
ct E
stim
ate
(Effe
ct S
ize)
SOURCE: Early Reading PD Interventions Study Classroom Observations, Spring 2006. Covariate measures were taken from fall 2005 RCPS and teacher background surveys.
NOTE: Impact estimates for districts’ treatment A and treatment B effects are ordered by the magnitude of the districts’ treatment A effects.

L–23
Figure L-7. Impact of the PD Interventions on Student Reading Scores: Total Reading Score, by District [Implementation Year Spring Sample]
A Effect (A vs Control)
0.64
0.300.45 0.43
0.56
0.89
-1.23
-0.39-0.21 -0.15 -0.21 -0.30-0.30
-0.050.12 0.14 0.17
0.30
-3.00
-2.00
-1.00
0.00
1.00
2.00
3.00
Districts
Impa
ct E
stim
ate
(Effe
ct S
ize)
B Effect (B vs Control)
1.37
0.340.21 0.27
0.48
1.05
-0.92
-0.32 -0.40 -0.37-0.14
-1.00
0.220.01 -0.10 -0.05
0.170.02
-3.00
-2.00
-1.00
0.00
1.00
2.00
3.00
Districts
Impa
ct E
stim
ate
(Effe
ct S
ize)
SOURCE: Student records from each school district for 2003–2004, 2004–2005, and 2005–2006 school years.
NOTE: Impact estimates for districts’ treatment A and treatment B effects are ordered by the magnitude of the districts’ treatment A effects.

L–24
Figure L-8. Impact of the PD Interventions on Student Achievement: Percent At or Above Overall Baseline Mean, by District [Implementation Year Spring Sample]
A Effect (A vs Control)
22.2
12.419.1
32.2
18.9
-58.6
-17.0-9.1
-20.4
-6.0-18.2
-2.35.0 5.9 6.4
-100.0
-80.0
-60.0
-40.0
-20.0
0.0
20.0
40.0
60.0
80.0
100.0
Districts
Impa
ct E
stim
ate
(%)
B Effect (B vs Control)
43.5
13.1 11.3
32.7
9.016.8
-55.8
-15.5 -15.0
-58.3
-19.0
-9.8
-6.2-1.2 -1.9
-12.8-5.0
3.5
-100.0
-80.0
-60.0
-40.0
-20.0
0.0
20.0
40.0
60.0
80.0
100.0
Districts
Impa
ct E
stim
ate
(%)
SOURCE: Student records from each school district for 2003–2004, 2004–2005, and 2005–2006 school years.
NOTE: Impact estimates for districts’ treatment A and treatment B effects are ordered by the magnitude of the districts’ treatment A effects.
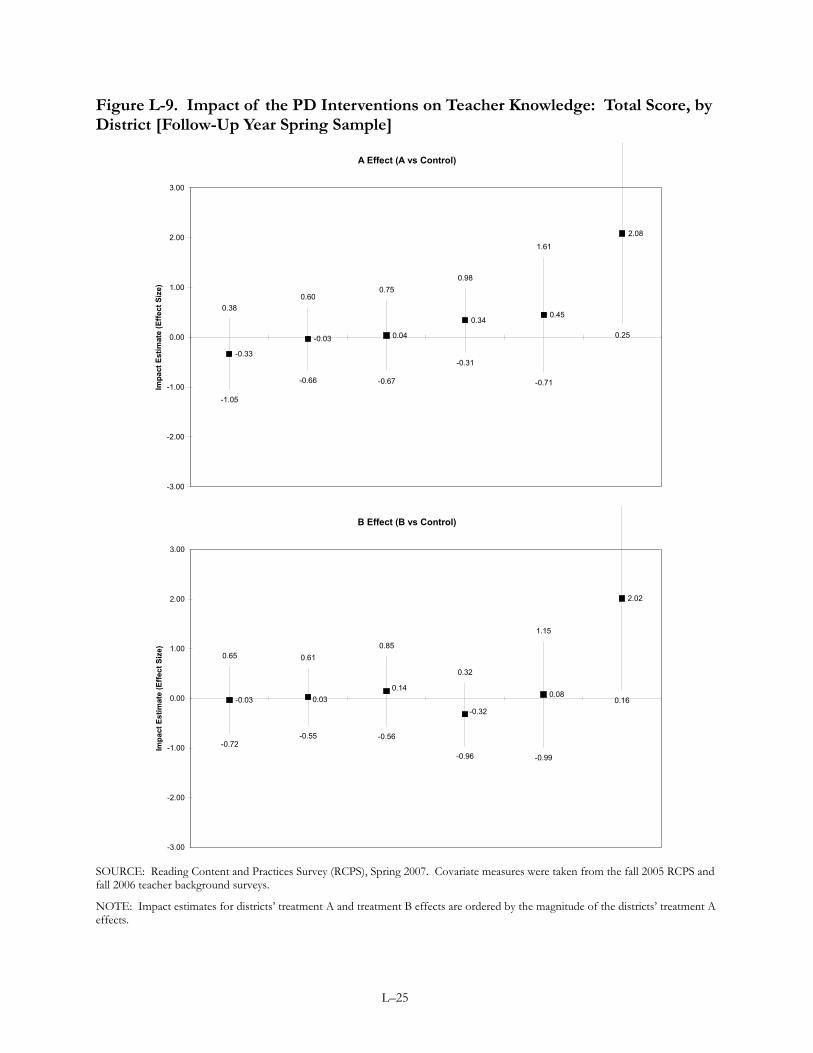
L–25
Figure L-9. Impact of the PD Interventions on Teacher Knowledge: Total Score, by District [Follow-Up Year Spring Sample]
A Effect (A vs Control)
0.380.60
0.750.98
1.61
-1.05
-0.66 -0.67
-0.31
-0.71
0.25
-0.33
-0.03 0.04
0.340.45
2.08
-3.00
-2.00
-1.00
0.00
1.00
2.00
3.00
Impa
ct E
stim
ate
(Effe
ct S
ize)
B Effect (B vs Control)
0.65 0.610.85
0.32
1.15
-0.72-0.55 -0.56
-0.96 -0.99
0.16-0.030.08
2.02
-0.32
0.140.03
-3.00
-2.00
-1.00
0.00
1.00
2.00
3.00
Impa
ct E
stim
ate
(Effe
ct S
ize)
SOURCE: Reading Content and Practices Survey (RCPS), Spring 2007. Covariate measures were taken from the fall 2005 RCPS and fall 2006 teacher background surveys.
NOTE: Impact estimates for districts’ treatment A and treatment B effects are ordered by the magnitude of the districts’ treatment A effects.

L–26
Figure L-10. Impact of the PD Interventions on Teacher Knowledge: Word-Level Score, by District [Follow-Up Year Spring Sample]
A Effect (A vs Control)
0.26
0.630.80 0.80
1.64
-1.04
-0.61-0.38 -0.32 -0.42 -0.44
-0.39
0.010.21 0.24
0.61
1.36
-3.00
-2.00
-1.00
0.00
1.00
2.00
3.00
Impa
ct E
stim
ate
(Effe
ct S
ize)
B Effect (B vs Control)
0.75 0.680.56
0.81
1.15
2.77
-0.48 -0.55 -0.60
-0.21
-0.99-0.88
0.13 0.08
0.95
0.30
-0.020.06
-3.00
-2.00
-1.00
0.00
1.00
2.00
3.00
Impa
ct E
stim
ate
SOURCE: PD Impact Study Reading Content and Practices Survey (RCPS), Spring 2007. Covariate measures were taken from fall 2005 RCPS and fall 2006 teacher background surveys.
NOTE: Impact estimates for districts’ treatment A and treatment B effects are ordered by the magnitude of the districts’ treatment A effects.

L–27
Figure L-11. Impact of the PD Interventions on Teacher Knowledge: Meaning-Level Score, by District [Follow-Up Year Spring Sample]
A Effect (A vs Control)
1.02
0.43 0.52
0.91 0.95
-1.66
-1.04 -1.13
-0.76-0.54
-0.33-0.32 -0.31 -0.31
0.070.21
1.75
-3.00
-2.00
-1.00
0.00
1.00
2.00
3.00
Impa
ct E
stim
ate
(Effe
ct S
ize)
B Effect (B vs Control)
0.80
0.380.64
0.95
0.25
-1.93
-0.97 -0.95-0.71
-1.23
-0.18-0.57 -0.49
1.92
0.12
-0.16-0.29
-3.00
-2.00
-1.00
0.00
1.00
2.00
3.00
Impa
ct E
stim
ate
(Effe
ct S
ize)
SOURCE: Reading Content and Practices Survey (RCPS), Spring 2007. Covariate measures were taken from the fall 2005 RCPS and fall 2006 teacher background surveys.
NOTE: Impact estimates for districts’ treatment A and treatment B effects are ordered by the magnitude of the districts’ treatment A effects.

L–28
Figure L-12. Impact of the PD Interventions on Teacher Practices in Reading Instruction: Explicit Instruction, by District [Follow-Up Year Fall Sample]
A Effect (A vs Control)
0.50 0.59
1.45
0.98 1.03
2.43
-1.01 -0.91
-1.38
-0.73-0.50
-0.18-0.26 -0.160.03 0.13
0.27
1.13
-4.00
-3.00
-2.00
-1.00
0.00
1.00
2.00
3.00
4.00
Impa
ct E
stim
ate
(Effe
ct S
ize)
B Effect (B vs. Control)
0.750.48
1.53
0.810.60
1.97
-0.77-1.02
-1.22
-0.76 -0.75 -0.71
-0.01-0.27
0.16 0.02 -0.08
0.63
-4.00
-3.00
-2.00
-1.00
0.00
1.00
2.00
3.00
4.00
Impa
ct E
stim
ate
(Effe
ct S
ize)
SOURCE: Early Reading PD Interventions Study Classroom Observations, Fall 2006. Covariate measures were taken from fall 2005 RCPS and fall 2006 teacher background surveys.
NOTE: Impact estimates for districts’ treatment A and treatment B effects are ordered by the magnitude of the districts’ treatment A effects.

L–29
Figure L-13. Impact of the PD Interventions on Teacher Practices in Reading Instruction: Independent Student Activity, by District [Follow-Up Year Fall Sample]
A Effect (A vs Control)
0.41
0.96
0.49
0.76 0.86
2.10
-1.18
-1.66
-0.92
-0.62 -0.53-0.32
-0.38 -0.35-0.21
0.07 0.17
0.89
-3.00
-2.00
-1.00
0.00
1.00
2.00
3.00
Impa
ct E
stim
ate
(Effe
ct S
ize)
B Effect (B vs Control)
0.41
1.41
0.64 0.64 0.67
1.84
-1.04 -1.13
-0.61-0.74 -0.72 -0.64
-0.32
-0.02
0.60
-0.050.020.14
-3.00
-2.00
-1.00
0.00
1.00
2.00
3.00
Impa
ct E
stim
ate
(Effe
ct S
ize)
SOURCE: Early Reading PD Interventions Study Classroom Observations, Fall 2006. Covariate measures were taken from fall 2005 RCPS and fall 2006 teacher background surveys.
NOTE: Impact estimates for districts’ treatment A and treatment B effects are ordered by the magnitude of the districts’ treatment A effects.

L–30
Figure L-14. Impact of the PD Interventions on Teacher Practices in Reading Instruction: Differentiated Instruction, by District [Follow-Up Year Fall Sample]
A Effect (A vs Control)
0.27
-0.140.18
0.47
1.11
0.77
-1.73
-1.29-1.03
-0.59-0.78
-0.32-0.73 -0.72-0.42
-0.060.17 0.22
-4.00
-3.00
-2.00
-1.00
0.00
1.00
2.00
3.00
4.00
Impa
ct E
stim
ate
(Effe
ct S
ize)
B Effect (B vs Control)
0.57
0.090.42 0.46
1.07
0.66
-1.39-1.06
-0.72 -0.61-0.85
-0.32-0.41 -0.49
-0.15 -0.070.11 0.17
-4.00
-3.00
-2.00
-1.00
0.00
1.00
2.00
3.00
4.00
Impa
ct E
stim
ate
(Effe
ct S
ize)
SOURCE: Early Reading PD Interventions Study Classroom Observations, Fall 2006. Covariate measures were taken from fall 2005 RCPS and fall 2006 teacher background surveys.
NOTE: Impact estimates for districts’ treatment A and treatment B effects are ordered by the magnitude of the districts’ treatment A effects.

L–31
Figure L-15. Impact of the PD Interventions on Student Reading Scores: Total Reading Score, by District [Follow-Up Year Spring Sample]
A Effect (A vs Control)
0.460.62
0.45 0.44 0.490.60
-1.32
-0.74
-0.37-0.26
-0.13 -0.09
-0.43
-0.06 0.04 0.09 0.18 0.26
-3.00
-2.00
-1.00
0.00
1.00
2.00
3.00
Districts
Impa
ct E
stim
ate
(Effe
ct S
ize)
B Effect (B vs Control)
1.83
1.10
0.360.21
0.380.23
-0.40
-1.27
-0.28-0.44 -0.35 -0.42
0.71
-0.080.04
-0.120.01
-0.10
-3.00
-2.00
-1.00
0.00
1.00
2.00
3.00
Districts
Impa
ct E
stim
ate
(Effe
ct S
ize)
SOURCE: Student records from each school district for 2003–2004, 2004–2005, and 2006–2007 school years.
NOTE: Impact estimates for districts’ treatment A and treatment B effects are ordered by the magnitude of the districts’ treatment A effects.

L–32
Figure L-16. Impact of the PD Interventions on Student Achievement: Percent At or Above Overall Baseline Mean, by District [Follow-Up Year Spring Sample]
A Effect (A vs Control)
13.0
34.1
22.3 21.6 24.3
-62.5
-25.3
-12.4-7.5 -4.9
-24.8
4.4 5.0 7.0 9.7
-100.0
-80.0
-60.0
-40.0
-20.0
0.0
20.0
40.0
60.0
80.0
100.0
Districts
Impa
ct E
stim
ate
(%)
B Effect (B vs Control)
86.5
53.1
14.68.3 7.4
18.2
-8.7
-50.1
-12.1-18.9 -19.7
-12.6
38.9
1.5 1.3-5.3 -6.1
2.8
-100.0
-80.0
-60.0
-40.0
-20.0
0.0
20.0
40.0
60.0
80.0
100.0
Districts
Impa
ct E
stim
ate
(%)
SOURCE: Student records from each school district for 2003–2004, 2004–2005, and 2006–2007 school years.
NOTE: Impact estimates for districts’ treatment A and treatment B effects are ordered by the magnitude of the districts’ treatment A effects.

L–33
VI. Analysis of the Impact of the PD Interventions on Classroom Instruction Separately for Word- and Meaning-Level Instruction
To examine the implementation year impacts of the PD interventions separately for word- (phonemic awareness, phonics, and fluency) and meaning-level instruction (vocabulary and reading comprehension), we conducted analyses by rescaling explicit instruction and independent study activity separately for intervals in which instruction focused on word-level components of reading instruction (phonemic awareness, phonics, or fluency) and meaning-level components (vocabulary or comprehension). The scales were generated using a logit model similar to those employed in generating the overall scales for explicit instruction and student activity, described in chapter 2 and appendix F. For the explicit instruction and independent study activity scales used in the main impact analysis, teachers were treated as fixed effects. To estimate the teacher scores separately for word and meaning, a multilevel logit model was used, in which teachers were treated as random effects. For some teachers, the number of intervals of word or meaning instruction was relatively small, and in some cases, teachers engaged in either explicit instruction or independent study activity for all the intervals observed or for none of the intervals. These cases would have had to be excluded in a fixed effects approach but could be retained in a random effects model. Each teacher’s score was estimated using the “best linear unbiased prediction” of the teacher’s random effect.
During the lesson observed, some teachers engaged in word-level instruction but not meaning or in meaning-level instruction but not word. For these teachers, scale scores were generated for only one of the two components of reading.
As can be seen in table L-19, statistically significant impacts on explicit instruction during word-level intervals were obtained for the treatment A vs. control group comparison and the treatment B vs. control group comparison, but not for the comparison between the two treatment groups. This pattern is similar to the results obtained in the overall analysis (chapter 4, table 4-2). Significant impacts on explicit instruction during meaning level intervals were obtained for the treatment A vs. control group comparison. For independent student activity (table L-20), there were no statistically significant impacts for word or meaning-level intervals.
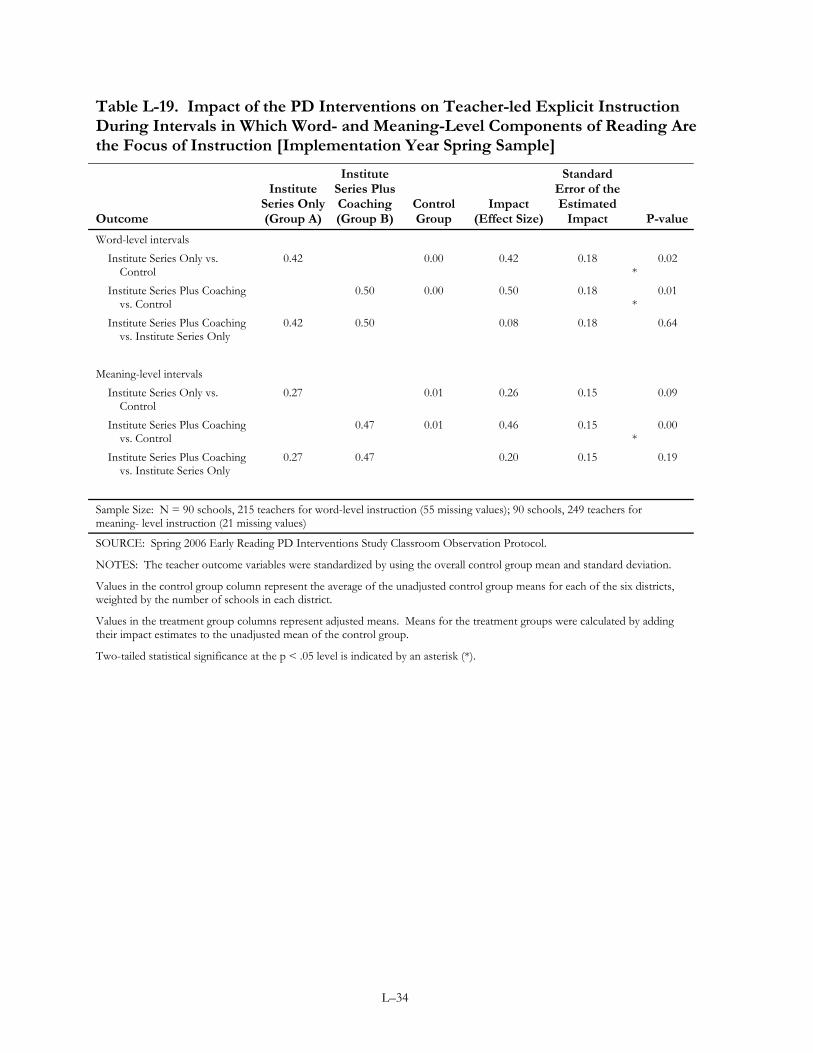
L–34
Table L-19. Impact of the PD Interventions on Teacher-led Explicit Instruction During Intervals in Which Word- and Meaning-Level Components of Reading Are the Focus of Instruction [Implementation Year Spring Sample]
Outcome
Institute Series Only (Group A)
Institute Series Plus Coaching (Group B)
Control Group
Impact (Effect Size)
Standard Error of the Estimated
Impact P-value
Word-level intervals Institute Series Only vs.
Control 0.42 0.00 0.42 0.18
* 0.02
Institute Series Plus Coaching vs. Control
0.50 0.00 0.50 0.18 *
0.01
Institute Series Plus Coaching vs. Institute Series Only
0.42 0.50 0.08 0.18
0.64
Meaning-level intervals
Institute Series Only vs. Control
0.27 0.01 0.26 0.15
0.09
Institute Series Plus Coaching vs. Control
0.47 0.01 0.46 0.15 *
0.00
Institute Series Plus Coaching vs. Institute Series Only
0.27 0.47 0.20 0.15
0.19
Sample Size: N = 90 schools, 215 teachers for word-level instruction (55 missing values); 90 schools, 249 teachers for meaning- level instruction (21 missing values)
SOURCE: Spring 2006 Early Reading PD Interventions Study Classroom Observation Protocol.
NOTES: The teacher outcome variables were standardized by using the overall control group mean and standard deviation.
Values in the control group column represent the average of the unadjusted control group means for each of the six districts, weighted by the number of schools in each district.
Values in the treatment group columns represent adjusted means. Means for the treatment groups were calculated by adding their impact estimates to the unadjusted mean of the control group.
Two-tailed statistical significance at the p < .05 level is indicated by an asterisk (*).

L–35
Table L-20. Impact of the PD Interventions on Independent Student Activity During Intervals in Which Word- and Meaning-Level Components of Reading Are the Focus of Instruction [Implementation Year Spring Sample]
Outcome
Institute Series Only (Group A)
Institute Series Plus Coaching (Group B)
Control Group
Impact (Effect Size)
Standard Error of the Estimated
Impact P-value
Word-level intervals Institute Series Only vs.
Control 0.03 0.00 0.03 0.18
0.87
Institute Series Plus Coaching vs. Control
0.25 0.00 0.25 0.18
0.15
Institute Series Plus Coaching vs. Institute Series Only
0.03 0.25 0.22 0.18
0.20
Meaning-level intervals
Institute Series Only vs. Control
–0.06 0.00 –0.06 0.17
0.73
Institute Series Plus Coaching vs. Control
0.00 0.00 0.00 0.17
1.00
Institute Series Plus Coaching vs. Institute Series Only
–0.06 0.00 0.06 0.17
0.73
Sample Size: N = 90 schools, 215 teachers for word-level instruction (55 missing values); 90 schools, 249 teachers for meaning-level instruction (21 missing values)
SOURCE: Spring 2006 Early Reading PD Interventions Study Classroom Observation Protocol.
NOTES: The teacher outcome variables were standardized by using the overall control group mean and standard deviation.
Values in the control group column represent the average of the unadjusted control group means for each of the six districts, weighted by the number of schools in each district.
Values in the treatment group columns represent adjusted means. Means for the treatment groups were calculated by adding their impact estimates to the unadjusted mean of the control group.
Two-tailed statistical significance at the p < .05 level is indicated by an asterisk (*).


APPENDIX M SUPPLEMENTARY ANALYSES


M–1
APPENDIX M
SUPPLEMENTARY ANALYSES
I. Outcomes for Stable Teachers
The teacher impact analyses reported in chapters 4 and 5 are “intent to treat” analyses. Thus, for example, the impact of the interventions on teacher knowledge reported in chapter 5 is based on all teachers who taught in the study schools in the spring of the follow-up year, regardless of whether the teachers taught in the schools during the implementation year and had an opportunity to participate in all of the study-provided PD.
To take teacher mobility into account in the impact analyses, we conducted analyses of the outcomes for “stable teachers.” These analyses are non-experimental, because the set of teachers who remained in the study schools for the full year is a selected subsample, and the selection process could, in theory, have been affected by the treatment.
As discussed in chapter 2, we defined “stable teachers” for the spring of the implementation year as teachers who taught in the study schools in both the fall and the spring of the implementation year. Similarly, we defined “stable teachers” for the fall of the follow-up year who taught in the fall and spring of the implementation year and also the fall of the follow-up year. Finally, we defined “stable teachers” for the spring of the follow-up year as teachers who taught in the fall and spring of both the implementation and follow-up years.
Overall, of the teachers in the sample, 96 percent of the teachers in the spring of the implementation year were stable; 72 percent of the teachers in the fall of the follow-up year were stable; and 67 percent of the teachers in the spring of the follow-up year were stable.
Tables M-1 and M-2 below show the results for stable teachers in the follow-up year for the three teacher outcomes that were found to be statistically significant in the implementation year, as reported in chapter 4 (teacher knowledge total and word-level scores and explicit instruction). As shown in the tables, there were no statistically significant treatment effects for teachers who remained in the study schools throughout the study. The results are similar to those observed in the full sample of teachers.163
163 We conducted parallel analyses for stable teachers for the implementation year. Because almost all of the teachers were stable in the implementation year, the results are similar to the results reported in chapter 4 and are not shown.

M–2
Table M-1. Teacher Knowledge Outcomes at Follow-Up: Total Score and Word-Level Score [Follow-Up Year Spring Stable Teacher Sample]
Outcome
Institute Series Only (Group A)
Institute Series Plus Coaching (Group B)
Control Group Effect Size
Standard Error of the Estimated Effect Size P-value
Total Score (standardized) Institute Series Only vs.
Control 0.04 -0.08 0.12 0.16
0.44
Institute Series Plus Coaching vs. Control
0.09 -0.08 0.17 0.15
0.27
Institute Series Plus Coaching vs. Institute Series Only
0.04 0.09 0.05 0.15
0.79
Word Score (standardized)
Institute Series Only vs. Control
0.05 0.02 0.03 0.18
0.85
Institute Series Plus Coaching vs. Control
0.28 0.02 0.26 0.17
0.12
Institute Series Plus Coaching vs. Institute Series Only
0.05 0.28 0.23 0.17
0.18
Sample Size: N = 83 Schools, 161 teachers; 10 teachers have missing outcome data
SOURCE: Spring 2007 Early Reading PD Interventions Study Reading Content and Practice Survey.
NOTES: The teacher outcome variables were standardized by using the overall control group mean and standard deviation.
Values in the control group column represent the average of the unadjusted control group means for each of the six districts, weighted by the number of schools in each district.
Values in the treatment group columns represent adjusted means. Means for the treatment groups were calculated by adding their impact estimates to the unadjusted mean of the control group.
There were no statistically significant outcomes (all p’s > .05).
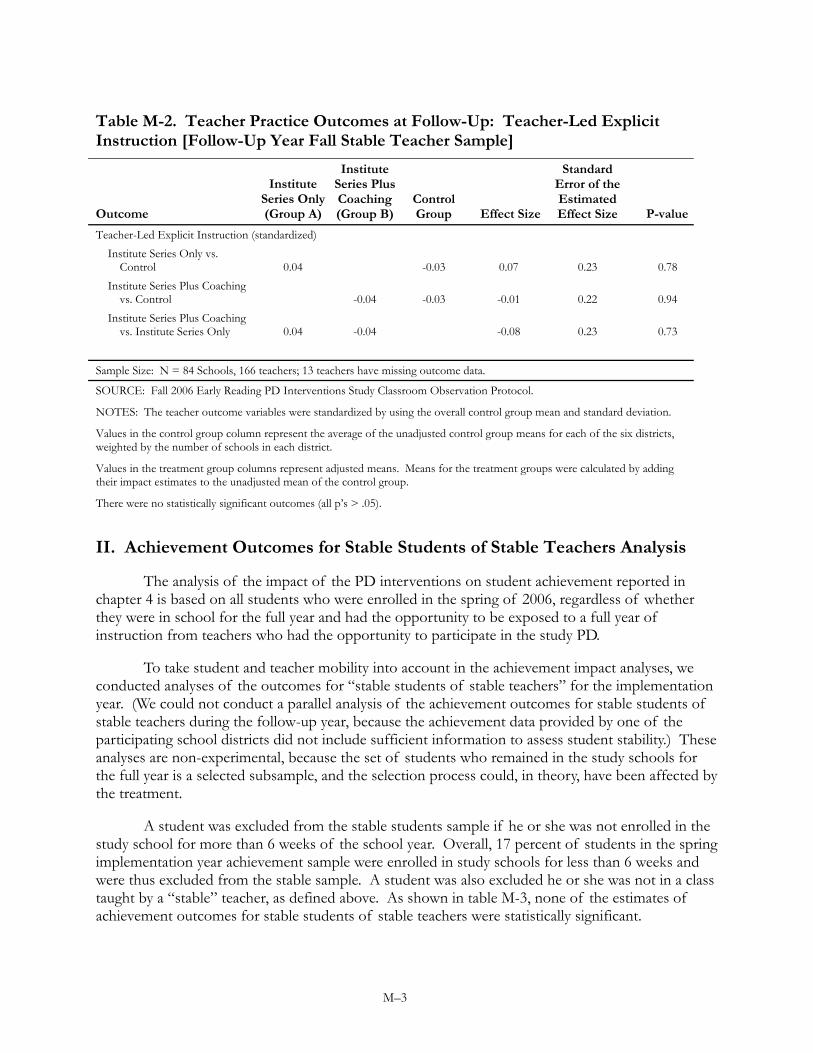
M–3
Table M-2. Teacher Practice Outcomes at Follow-Up: Teacher-Led Explicit Instruction [Follow-Up Year Fall Stable Teacher Sample]
Outcome
Institute Series Only (Group A)
Institute Series Plus Coaching (Group B)
Control Group Effect Size
Standard Error of the Estimated Effect Size P-value
Teacher-Led Explicit Instruction (standardized) Institute Series Only vs.
Control 0.04 -0.03 0.07 0.23 0.78 Institute Series Plus Coaching
vs. Control -0.04 -0.03 -0.01 0.22 0.94 Institute Series Plus Coaching
vs. Institute Series Only 0.04 -0.04 -0.08 0.23 0.73
Sample Size: N = 84 Schools, 166 teachers; 13 teachers have missing outcome data.
SOURCE: Fall 2006 Early Reading PD Interventions Study Classroom Observation Protocol.
NOTES: The teacher outcome variables were standardized by using the overall control group mean and standard deviation.
Values in the control group column represent the average of the unadjusted control group means for each of the six districts, weighted by the number of schools in each district.
Values in the treatment group columns represent adjusted means. Means for the treatment groups were calculated by adding their impact estimates to the unadjusted mean of the control group.
There were no statistically significant outcomes (all p’s > .05).
II. Achievement Outcomes for Stable Students of Stable Teachers Analysis
The analysis of the impact of the PD interventions on student achievement reported in chapter 4 is based on all students who were enrolled in the spring of 2006, regardless of whether they were in school for the full year and had the opportunity to be exposed to a full year of instruction from teachers who had the opportunity to participate in the study PD.
To take student and teacher mobility into account in the achievement impact analyses, we conducted analyses of the outcomes for “stable students of stable teachers” for the implementation year. (We could not conduct a parallel analysis of the achievement outcomes for stable students of stable teachers during the follow-up year, because the achievement data provided by one of the participating school districts did not include sufficient information to assess student stability.) These analyses are non-experimental, because the set of students who remained in the study schools for the full year is a selected subsample, and the selection process could, in theory, have been affected by the treatment.
A student was excluded from the stable students sample if he or she was not enrolled in the study school for more than 6 weeks of the school year. Overall, 17 percent of students in the spring implementation year achievement sample were enrolled in study schools for less than 6 weeks and were thus excluded from the stable sample. A student was also excluded he or she was not in a class taught by a “stable” teacher, as defined above. As shown in table M-3, none of the estimates of achievement outcomes for stable students of stable teachers were statistically significant.

M–4
Table M-3. Student Achievement Outcomes in the Implementation Year [Stable Students of Stable Implementation Year Teacher Sample]
Outcome
Institute Series Only (Group A)
Institute Series Plus Coaching (Group B)
Control Group Effect Size
Standard Error of the Estimated Effect Size P-value
Test Score (Effect Size) Institute Series Only vs.
Control 0.13 0.08 0.06 0.09
0.53
Institute Series Plus Coaching vs. Control
0.08 0.08 0.00 0.09
1.00
Institute Series Plus Coaching vs. Institute Series Only
0.13 0.08 –0.06 0.10
0.59
Dichotomous Outcome: At or Above Mean of Baseline Overall Distribution (percent)
Institute Series Only vs. Control
57.32 54.18 3.14 3.91
0.43
Institute Series Plus Coaching vs. Control
50.19 54.18 –3.99 4.09
0.33
Institute Series Plus Coaching vs. Institute Series Only
57.32 50.19 –7.13 4.54
0.12
Sample Size: N = 89 schools, 4,012 students.
SOURCE: Student level data were obtained from each individual study district. The sample includes a subsample of students who stayed in the same school and whose teacher stayed in the same school for the program year.
NOTES: The outcome variables were standardized by overall mean and standard deviation within each district for 2004–2005, only including the schools participating in the study.
Values in the control group column represent the average of the unadjusted control group means for each of the six districts, weighted by the number of schools in each district.
Values in the treatment group columns represent adjusted means. Means for the treatment groups were calculated by adding their impact estimates to the unadjusted mean of the control group.
There were no statistically significant outcomes (all p’s > .05)

M–5
III. Level of Teacher Knowledge at Baseline, Spring of Implementation Year, and Spring of Follow-Up Year
While the analysis for the follow-up year stable teacher sample reported in the previous section allows for a comparison of outcomes at the end of the implementation and follow-up years, the analysis does not support an examination of how much teachers learned or forgot over time, because the estimated effect sizes for the implementation and follow-up years were based on different means and standard deviations. The standardization for the implementation year analysis was based on the mean and standard deviation for the control group in the implementation year, while the standardization for the follow-up year analysis was based on the mean and standard deviation for the control group in that year.164
One way to assess the degree of learning or forgetting over time is to examine the results in logits, which provide a consistent metric. Figure M-1 displays the average teacher knowledge scores for the follow-up year stable teacher sample for all three time points at which the RCPS was administered: fall 2005 (the fall of the implementation year), spring 2006 (the spring of the implementation year), and spring 2007 (the spring of the follow-up year).
For word-level knowledge, the teachers in treatment group A experienced a statistically significant rise in word-level knowledge from -0.12 logits at baseline to 0.25 logits at the end of the implementation year and a non-significant fall to 0.10 logits at the end of the follow-up year. This represents an increase in performance from 47 percent correct on the typical item at baseline to 56 percent correct at the end of the implementation year, and a decline to 52 percent correct at the end of the follow-up year.165 The results for treatment group B also show a significant increase in word-level knowledge over the implementation year, and a non-significant decline over the follow-up year.
The trajectory for meaning-level knowledge shows no statistically significant change over time for treatment groups A or B.
164 We standardized the teacher outcome measures using the control group mean and standard deviation at the time each outcome variable was measured, so effect sizes can be interpreted in terms of control group outcomes. 165 A repeated measures analysis of variance, with measurement occasions nested within teachers and teachers nested in schools, indicates that the growth in word-level knowledge from baseline to the end of the implementation year was statistically significant for both treatment groups A and B. The decline from the end of the implementation year to the end of the follow-up year was not statistically significant. The net growth from the baseline to the end of the follow-up year also was not statistically significant, although it approached significance (p = 0.10). A similar repeated measures analysis of variance for meaning-level knowledge showed no statistically significant growth or decline over time for the implementation or follow-up year.

M–6
Figure M-1. Level of Teacher Knowledge at Baseline, Spring of Implementation Year, and Spring of Follow-up Year [Follow-up Year Stable Teacher Sample]
Word Score
-0.20
-0.10
0.00
0.10
0.20
0.30
0.40
0.50
0.60
Baseline Spring 2006 Spring 2007
Log
its A
BC
Meaning Score
-0.20
-0.10
0.00
0.10
0.20
0.30
0.40
0.50
0.60
Baseline Spring 2006 Spring 2007
Log
its A
BC
SOURCE: Reading Content and Practices Survey: Baseline (fall of implementation year); Spring 2006 (spring of implementation year); and Spring 2007 (spring of follow-up year).

M–7
IV. Variation in the Use of Explicit Instruction, Independent Study Activity, and Differentiated Instruction
To gain further insight into the patterns of impact results for the three instructional practice measures, we conducted an exploratory analysis of the extent to which use of the practices in the spring of the implementation year varied across districts, schools within districts, and teachers within schools. To test the variation across districts, we tested the significance of the main district effect in the impact models. Results showed significant between-district use of differentiated instruction (p<.001), but not for explicit instruction or independent student activity. As shown in table M-4, the percent of teachers who engaged in differentiated instruction for one or more interval varied from 5 to 69 percent and the mean percent of intervals during which differentiated instruction was observed ranged from 1 to 31 percent across the six districts.
Table M-4. Percent of Teachers who Engaged in Differentiated Instruction and Mean Percent of Intervals During Which Teachers Engaged in Differentiated Instruction, by District [Implementation Year Spring Sample]
District 1 District 2 District 3 District 4 District 5 District 6
Percent of teachers who engaged in differentiated instruction for one or more observation interval 5.0 18.0 35.7 56.3 68.5 68.9 Mean percent of intervals in which teachers engaged in differentiated instruction
0.1 3.9 8.5 9.2 20.8 31.2
SOURCE: Spring 2006 Early Reading PD Interventions Study Classroom Observation Protocol. NOTES: District estimates are presented in order of magnitude.
To examine variation across schools, we focused on the school-level random terms in the main multi-level impact model. The multi-level model estimated for the main impact analysis reported in chapter 4 indicated that 27 percent of the variation in the use of differentiated instruction was between schools within district (p<.003), with blocking factors, treatment by district interaction terms, and teacher covariates were included in the model. By contrast, there was no statistically significant between-school variation in the use of explicit instruction or independent student activities once blocking factors, treatment by district interaction terms, and teacher covariates were taken into account.
To describe the degree of variation across districts and schools in the use of differentiated instruction, we calculated the percent of study schools in each district in which all, some, or no teachers engaged in differentiated instruction during the spring observations. As shown in figure M-2, the percent of study schools in which all of the second grade teachers were observed engaging in differentiated instruction varied across districts, ranging from 0 percent in one district to 38 percent in another. Similarly the percent of schools in which none of the second grade teachers were observed using this practice ranged from 5 percent to 83 percent.
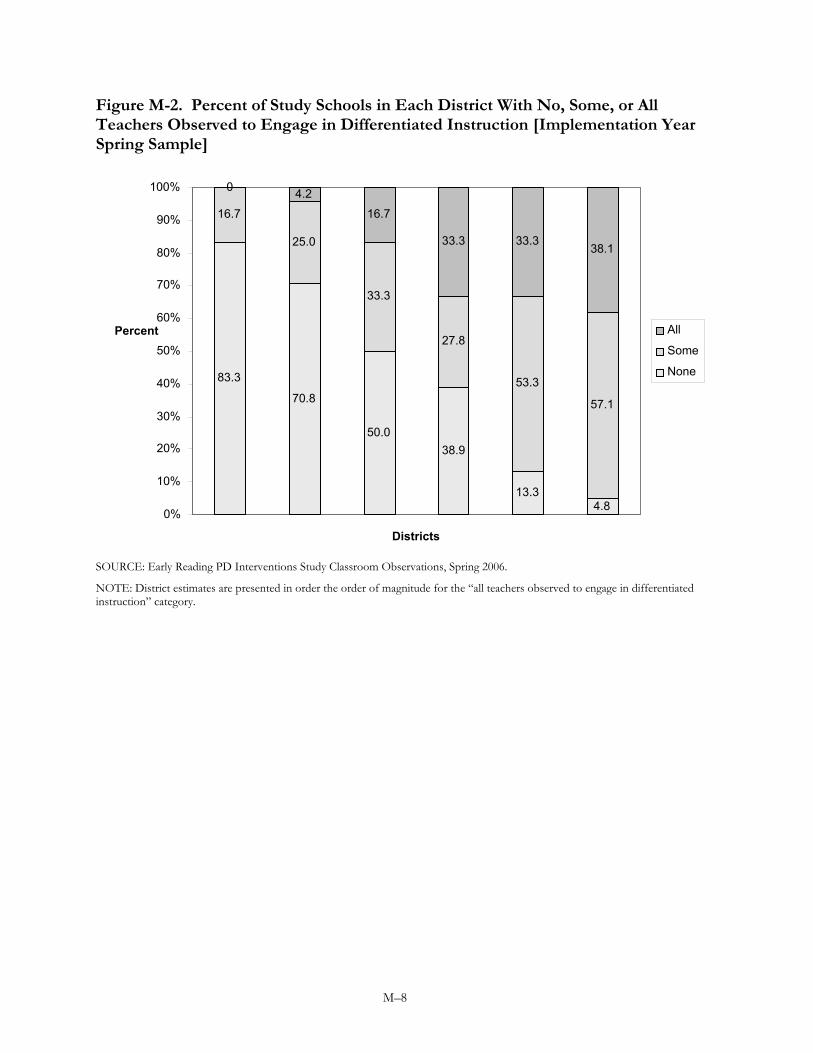
M–8
Figure M-2. Percent of Study Schools in Each District With No, Some, or All Teachers Observed to Engage in Differentiated Instruction [Implementation Year Spring Sample]
SOURCE: Early Reading PD Interventions Study Classroom Observations, Spring 2006.
NOTE: District estimates are presented in order the order of magnitude for the “all teachers observed to engage in differentiated instruction” category.
83.3 70.8
50.038.9
13.34.8
16.7
25.0
33.3
27.8
53.3
57.1
0 4.2
16.7
38.1 33.333.3
0%
10%
20%
30%
40%
50%
60%
70%
80%
90%
100%
Districts
Percent All
Some
None


www.ed.gov ies.ed.gov