THE IMPACT OF TECHNOLOGY ON THE …. Bansal Final Report.pdfTHE IMPACT OF TECHNOLOGY ON THE...
112
FINAL REPORT MACRO Research Proposals for the year 2014-15 Submitted to Indian Institute of Banking & Finance THE IMPACT OF TECHNOLOGY ON THE PERFORMANCE OF INDIAN BANKING INDUSTRY: AN EMPIRICAL STUDY Submitted By: Dr. Sanjeev Bansal Professor & Chairman, Department of Economics, Kurukshetra University Kurukshetra
-
Upload
nguyenduong -
Category
Documents
-
view
215 -
download
0
Transcript of THE IMPACT OF TECHNOLOGY ON THE …. Bansal Final Report.pdfTHE IMPACT OF TECHNOLOGY ON THE...
FINAL REPORT
MACRO Research Proposals for the year 2014-15
Submitted to
Indian Institute of Banking & Finance
THE IMPACT OF TECHNOLOGY ON THE PERFORMANCE OF INDIAN BANKING
INDUSTRY: AN EMPIRICAL STUDY
Submitted By: Dr. Sanjeev Bansal
Professor & Chairman, Department of Economics,
Kurukshetra University Kurukshetra

List of Abbreviations used in the Study
IT INFORMATION TECHNOLOGY ECS ELECTRONIC CLEARING SERVICES INFINET INDIAN FINANCIAL NETWORK EFT ELECTRONIC FUNDS TRANSFER ATM AUTOMATED TELLER MACHINE RTGS REAL-TIME GROSS SETTLEMENT CFMS CENTRALIZED FUNDS MANAGEMENT SYSTEM NDS NEGOTIATED DEALING SYSTEM SFMS STRUCTURED FINANCIAL MESSAGING SYSTEM ICT INFORMATION AND COMMUNICATION TECHNOLOGY ALPM ADVANCED LEDGER POSTING MACHINES TBA TOTAL BANK AUTOMATION MICR MAGNETIC INK CHARACTER RECOGNITION ROA RETURN ON ASSETS ROE RETURN ON EQUITY DEA DATA ENVELOPMENT ANALYSIS TFP TOTAL FACTOR PRODUCTIVITY BSC BALANCED SCORE CARD NIM NET INTEREST MARGIN SBBJ STATE BANK OF BIKANER AND JAIPUR SBI STATE BANK OF INDIA SBH STATE BANK OF HYDRABAD SBP STATE BANK OF PATIALA SBT STATE BANK OF TRAVANCORE CBI CANARA BANK BOB BANK OF BARODA BOI BANK OF INDIA PNB PUNJAB NATIONAL BANK PSB PUNJAB & SIND BANK UBI UNION BANK OF INDIA AB ALLAHABAD BANK IOB INDIAN OVERSEAS BANK OBC ORIENTAL BANK OF COMMERCE CBI CENTRAL BANK OF INDIA FB FEDERAL BANK JKB J & K BANK ING ING VYASA BANK KB KARNATKA BANK

SIB SOUTH INDIAN BANK AXIS AXIS BANK ICICI ICICI BANK HDFC HDFC BANK IIB INDUSIND BANK KMB KOTAK MAHINDRA BANK SCB STANDARD CHARTERED BANK RBS ROYAL BANK OF SCOTLAND DB DEUTSCHE BANK HSBC HSBC LTD. CITIB CITI BANK SB STATE BANK GROUP NB NATIONALISED BANK GROUP OPS OLD PRIVATE SECTOR BANK GROUP NPS NEW PRIVATE SECTOR BANK GROUP FB FOREIGN BANK GROUP DMU DECISION MAKING UNIT VRS VARIABLE RETURNS TO SCALE TE TECHNICAL EFFICIENCY PTE PURE TECHNICAL EFFICIENCY SE SCALE EFFICIENCY LPP LINEAR PROGRAMMING PROBLEM PI PERFORMANCE INDEX

List of Tables
Table 1.1 Computerised Branches to Total Branches (Bank Group Wise)
Table 1.2 Computerised Branches to Total Branches (Bank Wise)
Table 1.3 Number of ATMs Per Branch ((Bank Group Wise)
Table 1.4 Number of ATMs Per Branch ((Bank Wise)
Table 1.5 Number of Credit Cards Per Branch ((Bank Group Wise)
Table 1.6 Number of Credit Cards Per Branch ((Bank Wise)
Table 1.7 Internet Branches to Total Branches ((Bank Group Wise)
Table 1.8 Internet Branches to Total Branches ((Bank Wise)
Table 1.9 Mobile Banking Branches to Total Branches ((Bank Group Wise)
Table 1.10 Mobile Banking Branches to Total Branches (Bank Wise)
Table 1.11 Tele banking Branches to Total Branches ((Bank Group Wise)
Table 1.12 Tele banking Branches to Total Branches ((Bank Wise)
Table 1.13 Information Technology Index ( Bank group Wise)
Table 1.14 Information Technology Index ( Bank Wise)
Table 1.15 Credit-Deposit Ratio (Bank Group Wise)
Table 1.16 Credit- Deposit Ratio (Bank Wise)
Table 1.17 Business Per Branch ( Bank Group Wise)
Table 1.18 Business Per Branch ( Bank Wise)
Table 1.19 Business Per Employee (Bank Group Wise)
Table 1.20 Business Per Employee (Bank Wise)
Table 1.21 Profit Per Employee (Bank Group Wise)
Table 1.22 Profit Per Employee (Bank Wise)
Table 1.23 NIM to Total Assets (Bank Group Wise)
Table 1.24 NIM to Total Assets (Bank Wise)
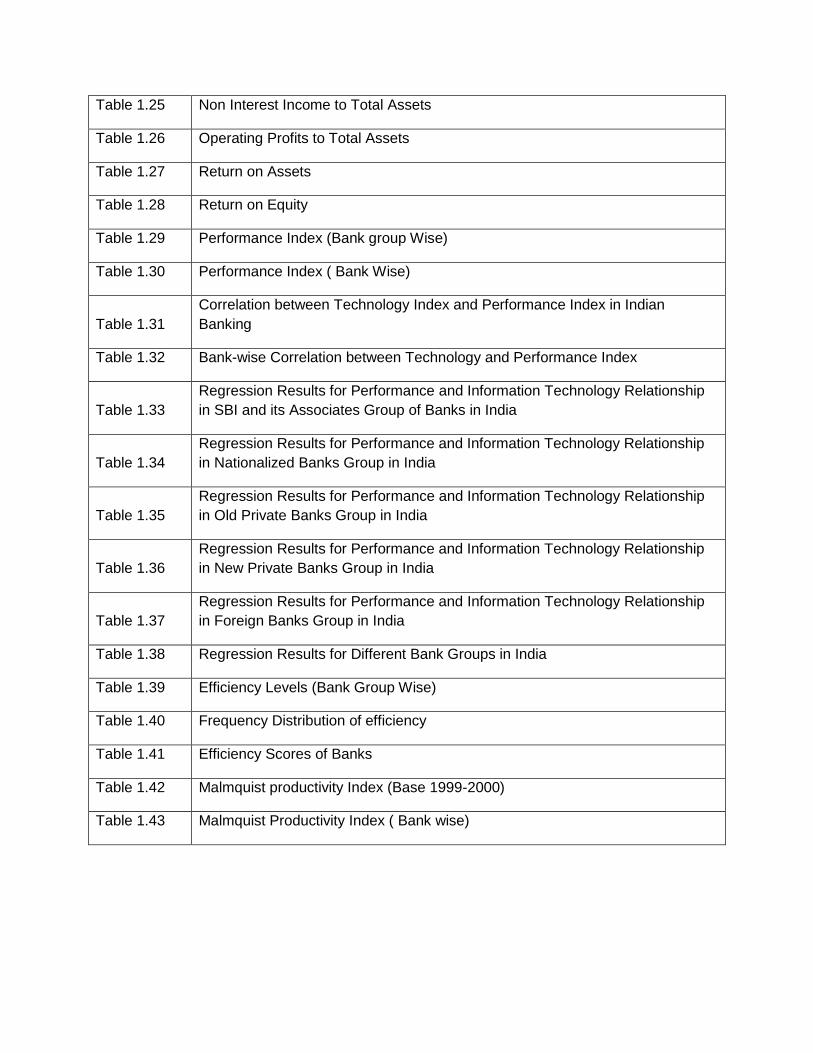
Table 1.25 Non Interest Income to Total Assets
Table 1.26 Operating Profits to Total Assets
Table 1.27 Return on Assets
Table 1.28 Return on Equity
Table 1.29 Performance Index (Bank group Wise)
Table 1.30 Performance Index ( Bank Wise)
Table 1.31 Correlation between Technology Index and Performance Index in Indian Banking
Table 1.32 Bank-wise Correlation between Technology and Performance Index
Table 1.33 Regression Results for Performance and Information Technology Relationship in SBI and its Associates Group of Banks in India
Table 1.34 Regression Results for Performance and Information Technology Relationship in Nationalized Banks Group in India
Table 1.35 Regression Results for Performance and Information Technology Relationship in Old Private Banks Group in India
Table 1.36 Regression Results for Performance and Information Technology Relationship in New Private Banks Group in India
Table 1.37 Regression Results for Performance and Information Technology Relationship in Foreign Banks Group in India
Table 1.38 Regression Results for Different Bank Groups in India
Table 1.39 Efficiency Levels (Bank Group Wise)
Table 1.40 Frequency Distribution of efficiency
Table 1.41 Efficiency Scores of Banks
Table 1.42 Malmquist productivity Index (Base 1999-2000)
Table 1.43 Malmquist Productivity Index ( Bank wise)

List of Figures
FIGURE I INFORMATION TECHNOLOGY INDEX IN PERIOD-I
FIGURE II INFORMATION TECHNOLOGY INDEX IN PERIOD-II
FIGURE III IT INDEX SB GROUP
FIGURE IV IT INDEX NB GROUP
FIGURE V IT INDEX OPS GROUP
FIGURE VI IT INDEX NPS GROUP
FIGURE VII IT INDEX FB GROUP
FIGURE VIII PI PRE E BANKING ERA
FIGURE IX PI POST E BANKING ERA
FIGURE X SB PERFORMANCE INDEX
FIGURE XI NB PERFORMANCE INDEX
FIGURE XII OPS PERFORMANCE INDEX
FIGURE XIII NPS PERFORMANCE INDEX
FIGURE XIV FB PERFORMANCE INDEX
FIGURE XV MALMQUIST PRODUCTIVITY INDEX SB GROUP
FIGURE XVI MALMQUIST PRODUCTIVITY INDEX NB GROUP
FIGURE XVII MALMQUIST PRODUCTIVITY INDEX OPS GROUP
FIGURE XVIII MALMQUIST PRODUCTIVITY INDEX NPS GROUP
FIGURE XIX MALMQUIST PRODUCTIVITY INDEX FB GROUP
FIGURE XX MALMQUIST PRODUCTIVITY INDEX INDIAN BANKING INDUSTRY
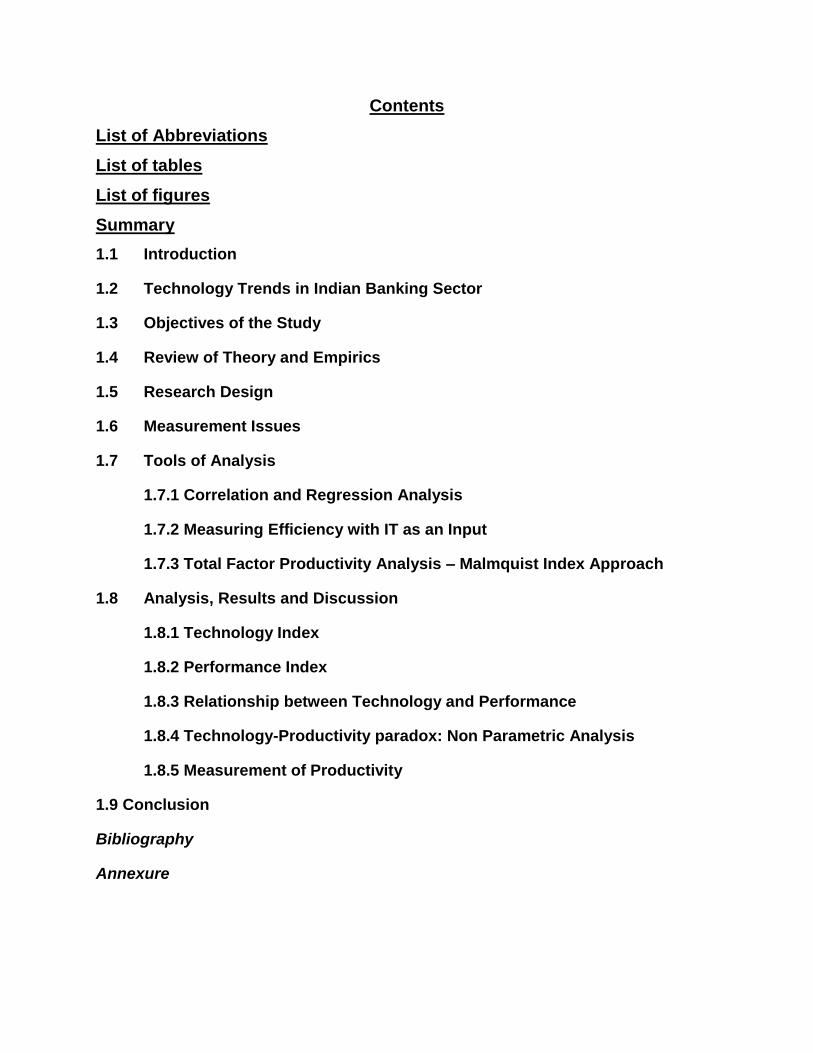
Contents
List of Abbreviations
List of tables
List of figures
Summary
1.1 Introduction
1.2 Technology Trends in Indian Banking Sector
1.3 Objectives of the Study
1.4 Review of Theory and Empirics
1.5 Research Design
1.6 Measurement Issues
1.7 Tools of Analysis
1.7.1 Correlation and Regression Analysis
1.7.2 Measuring Efficiency with IT as an Input
1.7.3 Total Factor Productivity Analysis – Malmquist Index Approach
1.8 Analysis, Results and Discussion
1.8.1 Technology Index
1.8.2 Performance Index
1.8.3 Relationship between Technology and Performance
1.8.4 Technology-Productivity paradox: Non Parametric Analysis
1.8.5 Measurement of Productivity
1.9 Conclusion
Bibliography
Annexure
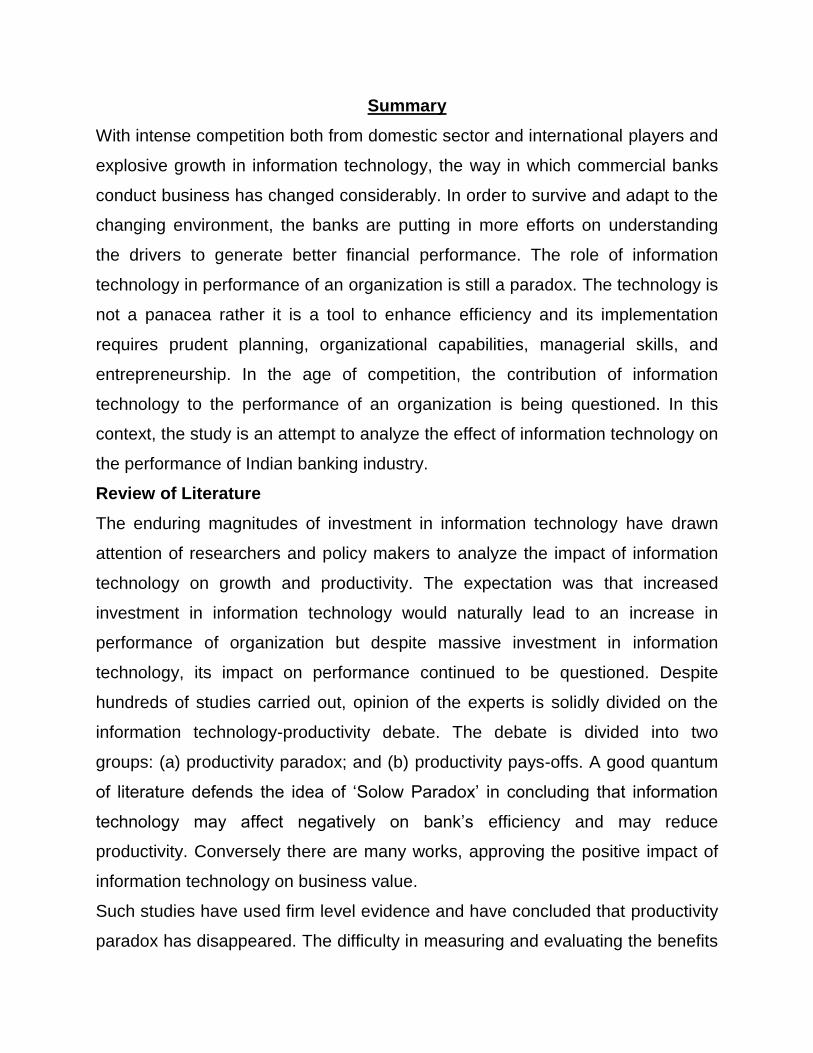
Summary
With intense competition both from domestic sector and international players and
explosive growth in information technology, the way in which commercial banks
conduct business has changed considerably. In order to survive and adapt to the
changing environment, the banks are putting in more efforts on understanding
the drivers to generate better financial performance. The role of information
technology in performance of an organization is still a paradox. The technology is
not a panacea rather it is a tool to enhance efficiency and its implementation
requires prudent planning, organizational capabilities, managerial skills, and
entrepreneurship. In the age of competition, the contribution of information
technology to the performance of an organization is being questioned. In this
context, the study is an attempt to analyze the effect of information technology on
the performance of Indian banking industry.
Review of Literature
The enduring magnitudes of investment in information technology have drawn
attention of researchers and policy makers to analyze the impact of information
technology on growth and productivity. The expectation was that increased
investment in information technology would naturally lead to an increase in
performance of organization but despite massive investment in information
technology, its impact on performance continued to be questioned. Despite
hundreds of studies carried out, opinion of the experts is solidly divided on the
information technology-productivity debate. The debate is divided into two
groups: (a) productivity paradox; and (b) productivity pays-offs. A good quantum
of literature defends the idea of ‘Solow Paradox’ in concluding that information
technology may affect negatively on bank’s efficiency and may reduce
productivity. Conversely there are many works, approving the positive impact of
information technology on business value.
Such studies have used firm level evidence and have concluded that productivity
paradox has disappeared. The difficulty in measuring and evaluating the benefits

of information technology has generated an extensive literature, both on
quantitative and qualitative plane. There are very few studies that quantitatively
index both, ‘information technology’ and the ‘performance’ of a service
organization and relate the two. In this respect, the lack of good quantitative
measure for the output and value created by information technology has made
the studies on justifying information technology investment, particularly difficult.
In this setting of argument, this work is an attempt to fill this research gap by
investigating the relationship between information technology investments and
performance in the Indian banking sector.
Objectives of the Study
The present study has the following objectives:
1. To evaluate the status of technology implementation in Indian banking
sector.
2. To analyze the impact of Information technology adoption on the
performance of Indian banking sector.
3. To estimate the relative efficiency and productivity of Indian banking sector
in pre and post e banking revolution period.
4. To draw some policy implications based on the findings emanated from the
study
Data and Methodology
The present study is based upon the time-series data from 1999-2000 to 2014-
15. The time period has been deliberately selected because the information
technology has been introduced only during this time period and many private
sector banks have got their licenses from RBI only during this period. The data
have been obtained from the public data sources on bank’s financial statements
and income expenses reports. The secondary data and information have been
collected from the publications of the Reserve Bank of India: ‘Report on Trend
and Progress of Banking in India’, ‘Handbook of Statistics on Indian Economy’,

‘RBI Bulletin (monthly)’, Annual Reports of respective banks and other valuable
publications of public sector banks, private and foreign banks in India. Various
websites have also been used for the data mining. Data published by Indian
Banking Association in monthly bulletins, in special issues and annual
publications on ‘Performance Highlights of Banks’ have also been used. For
present research work, various journals, magazines and newspapers like ‘Indian
Journal of Commerce’, ‘Economic Survey of India’, ‘Economic and Political
Weekly’, ‘Financial Express’, ‘Economic Times’ have also been considered.
To make the work manageable and effective, it has been confined to 31 banks
only. The sample represents all categories of banks: State Bank of India and its
associates; nationalized banks; old private banks; new private banks; and foreign
banks. By using a meaningful denominator, technology parameters have been
normalized. To derive the overall technology parameter, a technology index has
been derived using the discrete technology parameters. Performance analysis
has been done by computing a performance index which takes into consideration
different variables. The relation of technology index and performance index has
been analyzed by using correlation and regression technique on both time series
and panel data. Wherever needed, appropriate price adjustments have been
made. The study makes an attempt to study the efficiency and productivity
aspects of Indian banking industry at a disaggregated level. To measure
efficiency of bank groups and individual banks, DEA has been used and to
measure the productivity, Malmquist index has been used.
Main Conclusion of the Study
The overall conclusion that emerges from the analysis is that in banking industry,
performance is a positive function of information technology. The findings confirm
that contribution of technology to bank’s performance has a differential behavior.
Information technology led performance is a promising strategy for many banks
to accelerate the development process. However it does not guarantee success
for all banks, as their backgrounds and capabilities to produce and use

information technology differs. This is what explains the productivity paradox in
service sector in general, and in banking sector in particular.
Main Recommendation of the Study
The information technology expenditure data for new private banks suggest that
banking industry has been engaged in arbitrary information technology budgeting
during the period under study. Over budgeting of information technology
spending is noticeable among banks, suggesting managements’ eagerness to
approve information technology budget irrespective of its contribution to
performance. The results of current study show that there is no relationship
between information technology budget and performance of new private sector
banks and foreign banks. The banks’ management and information technology
practitioners need to focus on higher information technology resources utilization
and efficiency. Information technology budgeting should focus on planning,
monitoring and controlling future operation. The results of current study suggest
evidence of information technology productivity paradox in the Indian banking
industry, evidence that could fade if information technology solution aligns well
with business strategies. The existence of productivity paradox indicates the
need for information technology managers and organization leaders to justify
their information technology spending in terms of performance.
------------------------

1.1 INTRODUCTION
In recent times, Indian banking industry is consistently working towards
implementing technological changes in the banking operations. Indian banks are
continuously encouraging investment in information technology, i.e. ATMs,
internet banking, mobile and tele-banking, computerization in banks, plastic
money, establishment of call centers, etc. RBI has also adopted IT in endorsing
the payment system’s functionality and modernization on an ongoing basis
through Electronic Clearing Services (ECS), Electronic Funds Transfer (EFT),
Indian Financial Network (INFINET), Real-Time Gross Settlement (RTGS)
System, Centralized Funds Management System (CFMS), Negotiated Dealing
System (NDS), Structured Financial Messaging System (SFMS) and India Card.
Consequently, Indian banking environment has become more compatible as
compared to the standards of international financial system. This explosive
growth in information technology has considerably changed the way in which
commercial banks conduct business. In order to survive and adapt to the
changing environment, the banks are putting more stress on understanding the
drivers of success to generate superior financial performance. The impact of
information technology on the performance of an organization is still a paradox.
Hence, the present study makes an attempt to map the impact of IT on the
performance of banking sector for scheduled commercial banks operating in
India including public, private and foreign sector banks.
1.2 TECHNOLOGY TRENDS IN INDIAN BANKING SECTOR
Information and Communication Technology (ICT) has changed the functioning
of banks worldwide. The foremost breakthrough started with the use of Advanced
Ledger Posting Machines (ALPM) in 1980s. The enormous automation at branch
level reduced errors which resulted in customers receiving error free services. In
late 1980s Total Bank Automation (TBA) was introduced both for the front-end
and back-end operations within the same branch followed by the establishment
of mechanized cheque processing systems which used the Magnetic Ink

Character Recognition (MICR) technology. Financial sector reforms and the
emergence of internet facilitated banks in opting for centralized database for all
their branches which resulted in low cost networks. New private sector banks and
foreign banks employed ATMs, phone banking and internet banking pretty early
followed enthusiastically by the public sector banks.
Technology adoption helped banks in crafting their own web pages which
customers can access through the web browsers from their homes/workplaces.
This kicked off online banking way back in 1996, however, the usage rate
increased subsequent to 1999 due to lower ISP online charges, increased PC
penetration and technology stabilization (Shroff, 2004). Some of the important
electronic delivery channels include the ATMs, debit/credit cards, mobile
banking, and tele-banking where banking facilities are available on 24/7 basis
across the world. Establishment of the INFINET in 1999 resulted in introduction
of Real Time Gross Settlement (RTGS) system. Internet has thus ushered the
concept of anytime - anywhere banking. It resulted in compliance with the core
principles for systemically important payment systems of the Bank of
International settlements (BIS), and has also provided the way for risk free, credit
push-based fund transfers settled on a real time basis. Data warehousing is
another development which effectively generates strategic information required
by the management for continuous strategic decision making like branch
expansion, product line expansion, market strengthening, credit risk assessment
etc. (Paulraj, 2001).
The year 2006-07 witnessed the consolidation of IT based efforts by the financial
sector in general and by the commercial banks in particular. The major
developments during this year include the establishment of data centers, a shift
towards centralized systems and large scale implementation of core banking
systems across bank branches. The Payment and Settlement Systems Act, 2007
(PSS Act) was also legislated in December 2007. Reserve Bank has since
authorized payment system operators of pre-paid payment instruments, card

schemes, cross-border in-bound money transfers, Automated Teller Machine
(ATM) networks and centralized clearing arrangements. The payment system
initiatives taken by the Reserve Bank of India have resulted in deeper
acceptance and penetration of non-cash payment modes. In the present study,
the year 2006-07 is taken as the reference year for dividing the total study period
into two parts i.e. Pre e banking revolution period (1999-2000 to 2006-07 ) and
Post e banking revolution period (2006-07 to 2014-15). These periods are
referred to as Period-I and Period-II respectively in the present study.
1.3 OBJECTIVES OF THE STUDY
The present study has the following objectives:
1. To evaluate the status of technology implementation in Indian banking
sector.
2. To analyze the impact of Information technology adoption on the
performance of Indian banking sector.
3. To estimate the relative efficiency and productivity of Indian banking sector
in pre and post e banking revolution period.
4. To draw some policy implications based on the findings emanated from the
study
1.4 REVIEW OF THEORY AND EMPIRICS
Worldwide, in the last few years, a massive investment has been done in the
banking sector and its impact on performance is still a paradox. Numerous
studies, using alternative methodologies, have been done on different country
banking systems. Following section is a synoptic view of some representative
banking sector related studies.
Negative/No relationship in profitability and IT
Beccalli (2006) used data from 737 banks covering the period from 1993 through
2000 to study the impact of increased information technology investment on the
profitability performance of banks in France, Germany, Italy, Spain and United
Kingdom. The study used balance sheet and income statement data, giving a
pooled total of 4414 observations. ROA and ROE have been used as
performance variables and hardware cost, software costs and services cost as
the investment variables. The study found no significant relationship between
total information technology expenditure and improvement in profitability. Carlson
(2001) reached the same conclusion after investigating the same issue in the US
banking market by regressing a bank's ROE on a set of controlled variables
including an explanatory binary variable for the presence or absence of internet
banking. Shirley and Mallick (2008) tested the cost effect and network effect of IT
by applying a differentiated model in 68 US banks using 20 years data and
concluded that bank profits decline due to adoption and diffusion of IT
investment, reflecting negative network effects in this industry. Mittal and
Dhingra (2007) evaluated the impact of computerization on the performance of
Indian banks using Data Envelopment Analysis (DEA) and found that the benefits
of computerization in boosting productivity and performance of banks is difficult
to quantify. Some researchers have used correlation to study the impact of IT
expenditure on the banking sector performance (Dos Santos et al. 1993) and
found that IT spending is unproductive. Another researcher also found the same
insignificant contribution of IT expenditure to the output in banks (Loveman,
1994). Similarly, Prasad & Harker (1997) studied US retail banking sector to
assess the effect of IT and concluded that no real benefits have accrued due to
additional investment in IT.
Positive relationship in profitability and IT
A lot of studies have found positive impact of IT on the performance of banking
sector. Shaukat (2009) examined the impact of IT investments on profitability and
employee productivity in Pakistani banking sector over a period of 1994-2005.
They found that IT has a positive impact on performance of the banking sector.
Parsons, Gotlieb and Denny (1993) reached at the same conclusion after
studying the impact of IT on banking productivity in Canadian banking industry.
Using data from 1974-1988, a trans-log cost model has been estimated. The
research found a 17-23 percent increase in productivity with the use of IT. Cooke
(1998) studied some new and fast growing financial innovations linked to IT
investment, e.g., assets securitization and derivatives in US banking sector. The
study found that IT has enabled the banks to offer new products, expand into
nontraditional areas, operate more efficiently and minimize risks. Deyoung, R.
(2006), analyzed the impact of investment in information technology (IT) systems
on bank’s profitability in UK. Using panel data the study supported the view that
IT has a positive impact on bank’s profitability through several factors such as
reducing the labour costs and transactions costs. Claudia et al. (2002),
empirically examined Italian banks based on univariate and multivariate
regression models and found a significant relationship between offering of
internet banking activities and bank’s profitability. Betterymarch (2003) used a
panel of 600 Italian banks over the period 1989-2000 and stochastic cost and
profit functions have been estimated. The results show that both cost and profit
frontier shifts are strongly correlated with IT capital accumulation. Banks adopting
information technology capital intensive techniques are also more efficient.
Nurwani Amaratunga and Mukrima (2003) examined Sri Lankan banks and found
that the strategic use of IT plays a vital role in retaining the existing customers
and attracting new customers. Jun, S. (2006) investigated the impact of
information technology expenditure on business performance in Korean banking
using a BSC model. The results indicated a significant association between the
levels of information technology adoption and the financial performance of the
banks. Eyadat and Kozak (2005) investigated the impact of IT on the profit and
cost efficiencies in U.S. banking sector during 1992-2003. They found a positive
and significant correlation between the levels of implemented IT and both,
profitability and cost savings. Hung Viet Ngugen (2005) studied Vietnamese
commercial banks in terms of their efficiency change, productivity growth and
technological change during the period 2001-03. The Study used Data

Envelopment Analysis (DEA) and Malmquist Index with four inputs (labour,
capital, technology and deposits) and two outputs (interest income and
noninterest income). It shows that total factor productivity increased by 5.7
percent in 2003 relative to 2001. Aghdassi, M. (2008) analyzed the strategic
value of e-banking for Iranian banks and revealed that bank manager’s
performance through e-banking is quite positive and effective. They also
concluded that information technology stock contributes to value added growth
significantly and use of information network shows positive impacts on TFP.
Rahman, I.U. (2007) analyzed the financial statements for 26 banks from 1991
through 2001. They used ROA, ROE and net profit as performance variables,
and computer budget ratio and capital budget ratio as the information technology
investment variables. The results revealed the strongest relationship between
computer budget ratio and ROE/ROA. Similarly Malhotra and Singh (2006), M.
Chandrasekhar (2010) analyzed the implications of internet banking for the
Indian banking industry for the period 1998-2005 and found that internet banks
are larger banks and have better operating efficiency and profitability as
compared to non-internet banks. Casolaro and Gobbi (2007) analyzed the
relationship between information technology investment and productivity in Italian
banking industry using unbalanced panel data from 618 banks collected for 1989
through 2000. With information technology use and total factor productivity as
output, the researcher employed stochastic cost and profit frontier techniques.
They used hardware capital stock, software capital stock, information technology
capital stock for an employee, and the number of ATMs as the information
technology investment measures. For the performance measures, the authors
used the ratio of services to gross income and capital, and the ratio of reserves
to total assets. The results revealed that banks with higher information
technology investment were more efficient. Agboola (2007) used Likert-type
ratings to measure and analyze the degree of utilization of identified technologies
and the variations in their adoption rate in Nigerian banks. The study revealed
that the adoption of ICT in banks has improved customer services, facilitated
accurate records, provided home and office banking services and enhanced
faster services. Illyas-Ur Rahman (2007) examined the role of information
technology in banks and studied the perception of bank employees towards the
implementation of information technology. The study considered different
information technology variables like net banking, credit cards, mobile banking,
electronic funds transfer, phone banking, card to card funds transfer. The study
found a positive relation between implementation of information technology and
delivery of services. Ahmad Mashnour (2009) investigated the way in which
information technology investment created value in the Jordanian banks. The
study measured some variables which determine financial information system
performance i.e. (a) IT integrated in IS; (b) software quality; (c) investment in
training; (d) customer services; (e) productivity; (f) user satisfaction; and (g) cost
benefit analysis. The study concluded that information system provides a
competitive advantage to the banking industry and the effectiveness of
information systems has a positive impact on Jordan banks. Ombati and Magutu
(2010), analyzed the relationship between technology and service quality in the
banking industry in Kenya. The research is a cross-sectional survey and the
respondents of the study are customers of banks using e-banking services
(internet banking, mobile banking and ATM). The findings revealed that e
banking has improved the service quality of banks. Madume Stella (2010)
analysed the impact of information and communication technology on the
productivity of the Nigerian banking sector using CAMEL and the transcendental
logarithmic production function also called Translog. The study found that bank
output such as loans and other assets increase significantly due to increase in
expenditure on information and communication technologies. Leckson and
Leckey (2011) ascertained and documented the extent to which investment in
information technology may affect profitability in Ghana banking sector. The
study used an enhanced Balanced Scored Card (BSC) approach proposed by
Kaplan and Norton and used the extensive panel data set of 15 banks over a 10
year period (1998-2007). The study found that higher IT level banks have the
tendencies of increased profitability. Alpar and Kim (1990) studied 759 US banks
during 1979-1986 to analyze the impact of IT on economic performance.
Applying cost function approach they found that IT was able to reduce operating
costs, increase capital expenditures of banks, save personnel costs, reduce
demand deposits, and increase time deposits. Ekata, G.E. (2012), examined
technological change, its relationship to firm size, and its impact on the efficient
scale of output and product mix for large US commercial banks. The results
suggest that technological change lowered real costs by about 1 percent per
year, increased the cost minimizing scale of outputs, and affected product mix.
To study the efficiency and productivity of banks, many researchers used DEA
model. Das et al., (2000) used DEA approach for all the three types of
ownership— public, private and foreign. Kamakura & Ratchford, (1996) used
DEA with translog cost function to measure efficiency of multiple retail stores.
While applying DEA, different IT related input specifications have been noticed.
Some studies used computer (hardware) as input measure (Oral and Yolalan,
1990; Vassiloglon & Giokas, 1990) whereas some others have taken Number of
ATMs (Zenios et al., 1999). Choudhari & Tripathy, (2004) used DEA with a lot of
variables like profitability, financial management, growth, productivity, and
liquidity. Many other users of this approach were Mukherjee et al. 2002; Kumar &
Verma 2003; Sathye 2003; Gunjan M.Sanjeev; 2006; Gupta et al., 2008;
Rezvanian et al., 2008; Awdeh & Moussawi, 2009; Sunil & Rachita, 2010 etc.
Review of studies is indicative of the fact that the relation of information
technology input and performance is a tricky one. It needs proper metrics or
quantification of the two prime variables, the IT and performance. There are very
few studies that quantitatively indexed both the information technology and the
performance of banks. This work is a step ahead to fill this gap.

1.5 Research Design
The present study is based upon the time-series data from 1999-2000 to 2014-
15. The time period has been purposely selected because the information
technology has been introduced only during this time period and many private
sector banks have got their licenses from RBI only during this period. The data
have been obtained from the public data sources on bank’s financial statements
and income expenses reports. The secondary data and information have been
collected from the publications of the Reserve Bank of India: ‘Report on Trend
and Progress of Banking in India’, ‘Handbook of Statistics on Indian Economy’,
‘RBI Bulletin (monthly)’, Annual Reports of respective banks and other valuable
publications of public sector banks, private and foreign banks in India. Various
websites have also been used for data mining. Data published by Indian Banking
Association in monthly bulletins, in special issues and annual publications on
‘Performance Highlights of Banks’ have also been used. For present research
work, various journals, magazines and newspapers like ‘Indian Journal of
Commerce’, ‘Economic Survey of India’, ‘Economic and Political Weekly’,
‘Financial Express’, ‘Economic Times’ have also been considered.
The population of this study comprises of all the commercial banks listed in RBI
directory. Out of this, 31 banks turn out to be the sample of the study over the
period 1999-2000 to 2014-15. These 31 banks represent all categories of banks.
They are State Bank of India and its associates, nationalized banks, old private
banks, new private banks and foreign banks. Banks have been selected on the
basis of their consistent record. First category consists of State Bank of India and
its associates. They are State Bank of India, State Bank of Patiala, State Bank of
Hyderabad, State Bank of Bikaner & Jaipur and State Bank of Travancore.
Second category consists of eleven nationalized banks. They are Canara Bank,
Bank of Baroda, Bank of India, Punjab National Bank, Dena Bank, Punjab and
Sind Bank, Union Bank of India, Allahabad Bank, Indian Overseas Bank, Oriental
Bank of Commerce and Central Bank of India. In the same way, old generation
private sector banks are banks with their reasonable large branch network and
stable performance over the years. They are Federal Bank, Jammu & Kashmir
Bank, Karnataka Bank, South Indian Bank and ING Vysya Bank. In 1994-95, RBI
issued banking license to ten new private banks. Five new private sector banks
have been selected for this study whose branch work and profits are
continuously increasing. They are ICICI Bank, HDFC Bank, IndusInd Bank, Axis
Bank (erstwhile UTI Bank) and Kotak Mahindra Bank. Foreign banks with a long
association/ presence in India and with highest branch network have been
selected for study. They are Standard Chartered Bank, Citibank, HSBC,
Deutsche Bank and Royal Bank of Scotland (erstwhile Amro Bank). Since many
of the foreign banks operate with a single branch in India or with only a
representative office as a result of which, their performance is not comparable to
that of Indian banks and hence they are not chosen for study though the data
speaks volumes about their exemplary performance. The regional rural banks
have also been excluded from the present study as their operations are confined
to target groups in rural and semi-urban areas. Private Banks with data gaps
have also been excluded. For analysis, data have been used both in time series
and panel data format.
By using a meaningful denominator, technology parameters have been
normalized. To obtain the overall technology parameter, a technology index has
been derived using the discrete technology parameters. These are:
1. Number of ATMs
2. Number of Computerised Branches
3. Number of Credit Cards
4. Number of Internet Bank branches
5. Number of Mobile Bank branches
6. Number of tele Bank branches

Performance analysis has been done by computing a performance index which
takes into consideration different variables. These are:
1. Credit deposit ratio,
2. Business per branch,
3. Profit per branch,
4. Profit per employee,
5. NIM to total assets,
6. Non-interest income to total assets,
7. Operating profits to total assets ,
8. Return on assets
9. Return on equity
1.6 Measurement Issues
As already said, the main objective of the work is to explore the relationship of
technology input with performance output at a disaggregate level in Indian
banking sector. For both technology and performance, a variety of discrete non-
comparable parameters are available with different scales and origins. Before
setting up a model to explore the relation, the pre-requisite is to arrive at the
technology index and performance index that combines all such variables in an
objective way. Following is the methodological brief relating to derivation of
technology and performance indices.
Technology Index: To develop an overall technology parameter, a technology
index has been derived using the discrete technology parameters for 5 bank
groups i.e. SB, NB, OPS, NPS and FB group as well as for 31 banks for the
period 1999-2000 to 2014-15. These are number of ATMs, number of credit
cards, number of computerized branches, number of mobile banking branches,
number of internet banking branches and number of tele banking branches.
Since absolute values may not provide meaningful standards until and unless

they are related to some other relevant information, therefore different ratios are
used while constructing the technology index. Ratios, due to their conciseness
and comparability help to summarize large data. The selected ratios are: (a)
number of ATMs per Branch; (b) number of credit cards per branch; (c) number
of computerized branches as a percentage to total branches; (d) number of
internet banking branches as a percentage to total branches; (e) number of
mobile banking branches as a percentage to total branches; and (f) number of
tele-banking branches as a percentage to total branches. By using a meaningful
denominator, above technology parameters have been used to arrive at
normalized technology variables. Normalization is required prior to any data
aggregation, as indicators in a data set tend to have different measurement units.
Normalization refers to the division of multiple sets of data by a common variable
in order to negate variable’s effect on the data, thus allowing underlying
characteristics of the data set to be compared. Normalization through rescaling is
considered as the best option because it makes all the elements to lie between
zero and one. It uses all the available information and is easy to express and
communicate.
Performance index: The performance of the banks has become more market
driven with the growing emphasis on better efficiency. Many studies have
attempted to evaluate the overall economic performance of banking sector by
applying the profitability criteria but the Indian banking industry dominated by
public sector banks is not operated by profitability objective alone. Some of the
studies done so far on Indian banking have analyzed only productivity by taking
time series data and others have evaluated the economic efficiency. Since banks
are partners in development and financing programme of the country, it has led
to increase in their branches. Hence, in addition to profitability parameter,
efficiency and productivity needs to be judged by developing some
comprehensive index of performance. Initially ten performance variables such as
credit deposit ratio, business per branch, return on assets, return on equity, profit
per branch, profit per employee, spread per branch, spread per employee,
business per employee, burden per branch, NIM to total assets, Non interest
income to total assets, capital adequacy ratio, overhead ratio, Non-interest
expenses to total income ratio, liquid assets to total deposits ratio. On the basis
of sensitivity analysis, 9 indicators have been shortlisted to construct the
performance index. The selected parameters have been standardized to
generate variables for constructing the performance index. The selected
variables are credit deposit ratio, business per branch, profit per branch, profit
per employee, NIM to total assets, Non interest income to total assets, operating
profits to total assets, return on assets and return on equity.
By using these discrete variables, an index has been framed by following a two
step procedure. First step is to arrive at the sub-indices by normalizing the raw
data variables, so as to take care of differences of scale and origin. Second step
is to arrive at the average index. If VLUj is the number of discrete raw variables
for an index, then Ij is the normalized value of such variables which can be
calculated as follows.
Ij = VLUj / VLUmax
Where VLUj is value in the series and VLUmax is the maximum value in the series.
It is done to wipe out the differences in the scale of banks as normalization
allows data on different scales to be compared by bringing them to a common
scale. Then an index can be generated by computing the simple average of
normalized variables as:
NDX = (∑Ij / N),
Where j varies from 1 to N. Using this methodology, technology index and
performance index have been computed.

1.7 Tools of Analysis
1.7.1 Correlation and Regression Analysis
Empirical exploration of the relation between technology index and performance
index has been done by using time series and cross section correlation analysis
which is a statistical tool to describe the degree to which one variable is linearly
related to another. In the present study, to better investigate the above
preliminary evidences and to gain a deeper understanding of the relationship
between technology index and performance index, the set of regressions have
been estimated. Technology index is treated as independent (exogenous)
variable and performance index is treated as dependent (endogenous) variable.
The mathematical representation of regression equation is written as follows.
Y = a + bx + Ԑ
Where Y is the performance index; a is the constant intercept; b is the regression
coefficient that represents the estimated change in the value of dependent
variable for each unit change in independent variable values; and X is the
technology index. To further refine the relationship, technology is taken in
conjunction with other inputs: labour and capital. Performance is studied
collectively through multi-variate regression analysis. The following multiple
regression model has been used:
Yi = a + b1x1 + b2x2 + b3x3 + Ԑ
Where Yi is the performance of bank group i;
X1 is the capital;
X2 is the labour; and
X3 is the technology index.

Further b1 to b3 are the regression coefficients that represent the estimated
change in the value of dependent variable for each unit change in independent
variable values. The regression coefficients have been computed by ordinary
least square method. This analysis has been carried out in cross section, time
series and panel data dimensions. The regression model used to measure this
relationship is the joint regression (pooled data regression). Significance of
regression is tested at five percent and one percent level of significance. All
these results are derived by using SPSS 20 version.
1.7.2 Measuring Efficiency with IT as an Input
Data envelopment analysis (DEA) is a non-parametric method of measuring
efficiency of a decision making unit (DMU) such as bank / firm. DEA employs
mathematical programming to construct a best practice frontier from the
observed data and to measure efficiency relative to the constructed frontier. The
DEA frontier is formed by connecting the set of best practice observations (the
piece-wise linear combination). Thus, the DEA efficiency score for a DMU or
bank is not defined by an absolute standard but is defined relative to other banks.
For an industry where one output is produced using two inputs, it can also be
represented by a unit isoquant.
The best way to explain DEA is by way of ratio form. For each DMU, we would
like to obtain a measure of the ratio of all outputs (y) over all inputs (x), such as
u’y/v’x, where u is output weight and v is input weight. To select optimal weights,
we specify the mathematical programming problem:
Max (u’y/v’x)
s.t. u’y/v’x < 1, j=1,2…………..N
u, v > 0

This involves finding values for u and v, such that the efficiency measure of the
ith DMU is maximized, subject to the constraint that all efficiency measures must
be less than or equal to one. One problem with this particular ratio formulation is
that it has an infinite number of solutions. To avoid this, an equivalent
envelopment form of this problem is estimated, i.e.,
Minimize with respect to
Subject to:
Where there are N organizations in the sample producing I different outputs (
denotes the observed amount of output i for organization n) and using K different
inputs ( denotes the observed amount of input k for organization n). are the
weights applied across the N organizations. When the nth linear program is
solved, these weights allow the most efficient method of producing organization
n’s outputs. The efficiency score for the nth organization, , is the smallest
number which satisfies the three sets of constraints listed above. For a full set
of efficiency scores, this problem has to be solved N times — once for each
organization in the sample.
DEA analysis is usually undertaken with absolute numerical data, which among
other things reflect the size of the units. There are some cases reported in the
literature (Emrouznejad et al 2008; Hollingsworth and Smith 2003) that the

authors used ratio variables rather than absolute numbers as input (input-ratio)
and/or output (output-ratio).
One simple addition to the DEA formulae above enables the change to variable
returns scale (VRS). This change relaxes the simplistic assumption that inputs
normally will move in exact proportions to the scale of operations: it allows for the
existence of economies and diseconomies of scale. The additional constraint is
that the weights in the DEA formula must sum to one. The variable returns to
scale DEA linear program is given by:
Minimize with respect to
Subject to:
The estimation of technical efficiency with CRS assumptions allows the overall
technical efficiency (TE) to be decomposed into two collectively exhaustive
components: pure technical efficiency (PTE) and scale efficiency (SE) i.e.,
. The former relates to the capability of managers to utilize firms’
given resources, whereas the latter refers to exploiting scale economies by
operating at a point where the production frontier exhibits constant returns to
scale. DEA assigns values between 0 and 1 to each efficiency measure. A DMU
receiving score 1, is regarded as 100 per cent efficient.
Specification of Inputs and Outputs
In the present study the following inputs and outputs are taken both for bank
group wise analysis and individual bank level analysis.
Inputs
Deposits
Number of Employees
Number of ATMs
Number of Computerised Branches
Number of Credit Cards
Number of Internet Bank branches
Number of Mobile Bank branches
Number of tele Bank branches
Outputs
Credit deposit ratio,
Business per branch,
Profit per branch,
Profit per employee,
NIM to total assets,
Non-interest income to total assets,
Operating profits to total assets ,
Return on assets
Return on equity

1.7.3 Total Factor Productivity Analysis – Malmquist Index Approach
Malmquist Total Factor Productivity is a technique depending on The Data
Envelopment Analysis (DEA). It measures the productivity change of a specific
value (increase/decrease rate) between two timeframe (Berg et.al., 1992:213).
Change indexes in total factor productivity for the banks are calculated
separately for both banks and bank groups via applying panel data for the period
1999-2014. Temporal development of banks’ productivity and its sources are
presented by Malmquist total factor productivity index. DEAP 2.1 program
produced by Coelli (1996) is employed for the measurement of indexes. Constant
returns to scale hypothesis is applied over technology in order to estimate the
distance functions that are used in the measurement of Malmquist total factor
productivity index. For that reason, constant returns to scale hypothesis is
deemed.
This index that is defined in terms of distance functions developed by Malmquist
(1953) measures the change in the total factor productivity between two variables
by calculating each variable’s relative distance rate to common technology.
Distance functions might be seen as both input and output based distance
functions (Deliktas, 2002). In input based approach, the least input amount used
for the production of output (input minimization); as for output based approach,
the maximum production of output with a definite input (output maximization)
should be predicated on. The solution of the two optimization problem is able to
give effective edge; notwithstanding, differences occasionally would emanate in
nonimpact units. The present study seize upon input based approach.
By means of Malmquist total productivity change index the change in the bank’s
productivity from the (t) period to (t+1) is measured. Malmquist total productivity
change index which belongs to the input between (t) period and the following

(t+1) period is measured via the below formula (Worthington, 2000, Oncu and
Aktas, 2007).
(1)
Mo(xt+1,yt+1, x t,y t) =2
1
1111
11111
),(
),(
),(
),(
),(
),(
ttto
ttto
ttto
ttto
ttto
ttto
yxD
yxD
yxD
yxD
yxD
yxD (2)
The ratio written outside of the square brackets in the second formula measures
the change in the input-based technical efficiency between (t) and (t+1) years.
The efficiency change is the ratio of efficiency in (t+1) period in proportion to
efficiency in (t) period. Geometric average of the two ratios in square brackets
delineates the change in technology between two periods. That is to say; the
changes in total factor productivity and components are measured as the
geometrical average of Malmquist productivity indexes (Fare et. al., 1994).
Malmquist total productivity index might be divided into two as the change in
technical efficiency and technological change. When we split the equation (2) into
two by this way, we can measure the change in efficiency and technological
change asunder.
Where, Efficiency change = ),(
),( 111
ttto
ttto
yxD
yxD
(3)
Technical change =
2/1
1111
11
),(
),(
),(
),(
ttto
ttto
ttto
ttto
yxD
yxD
yxD
yxD (4)

The change in technical efficiency is described as the efficiency in reaching to
the production limit and technological change as the curve shift in productivity
limit (Mahadevan, 2002). On the other hand, multiplication of the change in
technical efficiency and technological change yields the change in the total factor
productivity. Total factor productivity index’s being more than 1 shows that total
factor productivity increased during the period between (t) and (t+1). Its being
less than 1 asserts the contrary (Coelli, 1996a:28).
In order to measure Malmquist total factor productivity change index, a range of
linear programming problem (LPP) should be measured. The LPP; which is used
in Malmquist total factor productivity change index depended on the constant
returns to scale hypothesis and input-based approach, is given (Worthington;
2000).
[ (yt, xt)]-1 = min θ, λ θ s.t - yit + Ytλ ≥ 0 (1) θxit - Xtλ ≥ 0 λ ≥ 0
(yt+1, xt+1)]-1 = min θ, λ θ
s.t - yi,t+1 + Yt+1λ ≥ 0 (2) θxi,t+1-Xt+1λ ≥ 0 λ ≥ 0
(yt, xt)]-1 = min θ, λ θ
s.t - yit + Yt+1λ ≥ 0 (3) θxit - Xt+1λ ≥ 0 λ ≥ 0
(yt+1, xt+1)]-1 = min θ, λ θ
s.t - yi,t+1 + Ytλ ≥ 0 (4) θxi,t+1 - Xtλ ≥ 0
λ ≥ 0 The first two linear programming models are evaluated by using the efficient limit
of the given period as the base. While Model (3) compares the datum of (t)
period with the efficient limit of (t+1) period; model (4) compares the datum of
(t+1) period with (t) period’s efficient limit.
Each of the four linear programming models should be solved for each period
and observation in the example so as to measure the Malmquist total factor
productivity. Thus; Nx(3T-2) number of problem should be solved to depict the T
period number and N observation number.
1.8 Analysis, Results and Discussion
The present study explores the relation of information technology and
performance in Indian banking industry at a bank group level as well as individual
bank level of disaggregation. It is divided into five sections. First section
delineates the main trends in information technology in different bank
groups/banks and develops an information technology index. Next section covers
the performance of commercial banks at disaggregate level of bank
groups/banks and develops a performance index. Third section explores the
nature and dynamics of relationship between information technology and
performance. Fourth section and fifth section deals with efficiency measurement
and productivity analysis respectively.
1.8.1 Technology Index
This section analyzes various forms of technological innovations or electronic
delivery channels adopted by banks. The entire approach towards technology
based banking has shown significant improvement since the year 1999-2000 and
it has resulted into a paradigm shift in Indian banking industry. There are many
indicators of technology adoption but given the objective and data availability
considerations, the following electronic delivery channels have been identified to
form variables for framing a comprehensive technology index for various bank

groups/banks under consideration. These electronic delivery channels are: (a)
number of ATMs per branch (b) computerized branches to total branches (c)
number of credit cards per branch (d) internet banking branches to total branches
(e) mobile banking branches to total branches (f) tele - banking branches to total
branches.
To draw some meaningful conclusions about the impact of information
technology on the banking sector performance, the study period has been
divided into two parts (1999-2000 to 2006-07 and 2006-07 to 2014-15) taking
2007 as the dividing year. In India, the payment and settlement systems are
regulated by the Payment and Settlement Systems Act, 2007 (PSS Act) which
was legislated in December 2007. Reserve Bank has since authorized payment
system operators of pre-paid payment instruments, card schemes, cross-border
in-bound money transfers, Automated Teller Machine (ATM) networks and
centralized clearing arrangements. The payment system initiatives taken by the
Reserve Bank of India have resulted in deeper acceptance and penetration of
non-cash payment modes. Following is the spatial and temporal analysis of
electronic delivery channels.
1. Computerized Branches to total branches
Narasimahm Committee-II has recommended full computerization of the
branches in 1998. Table 1.1 depicts that in period-I, the percentage of
computerized branches was quite low however commendable growth in these
branches is recorded in Period-II. FB group has taken the lead followed by NPS
and SB group in period-II as is evident from the average productivity gap figures.
The significant paired t values also support these results. The analysis at three
different points of time reveals that SB and NB group made significant progress
from 2006-2014 as against OPS, NPS and FB group which started early
computerization and hence heavy growth is noticed during 1999-2006.
Table 1.1 Computerised Branches to Total Branches (Bank Group Wise)
Bank 1999- 2006- 2014- Growth Growth Pre E-Banking Pre E-Banking Average t-
Group 2000 07 15 Rate (from 1999-2006) %
Rate (from 2007-2014) %
Revolution Period Average (1999-2006)
Revolution Period Average (2007-2014)
Productivity Gap
Value
NB 0.008 0.049 0.692 512.50 1312.24 0.167 0.195 0.049 -
3.732*
SBI 0.011 0.086 0.992 681.82 1053.49 0.254 0.290 0.132 -
3.062*
OPS 0.002 0.054 0.737 2600.00 1264.81 0.189 0.211 0.054 -
2.672*
NPS 0.019 0.178 0.989 836.84 455.62 0.281 0.318 0.178 -
2.431*
FB 0.055 0.375 0.995 581.82 165.33 0.290 0.323 0.147 -
3.990* Source: Computed by the researcher Note: * indicates significant values at 5% level of significance
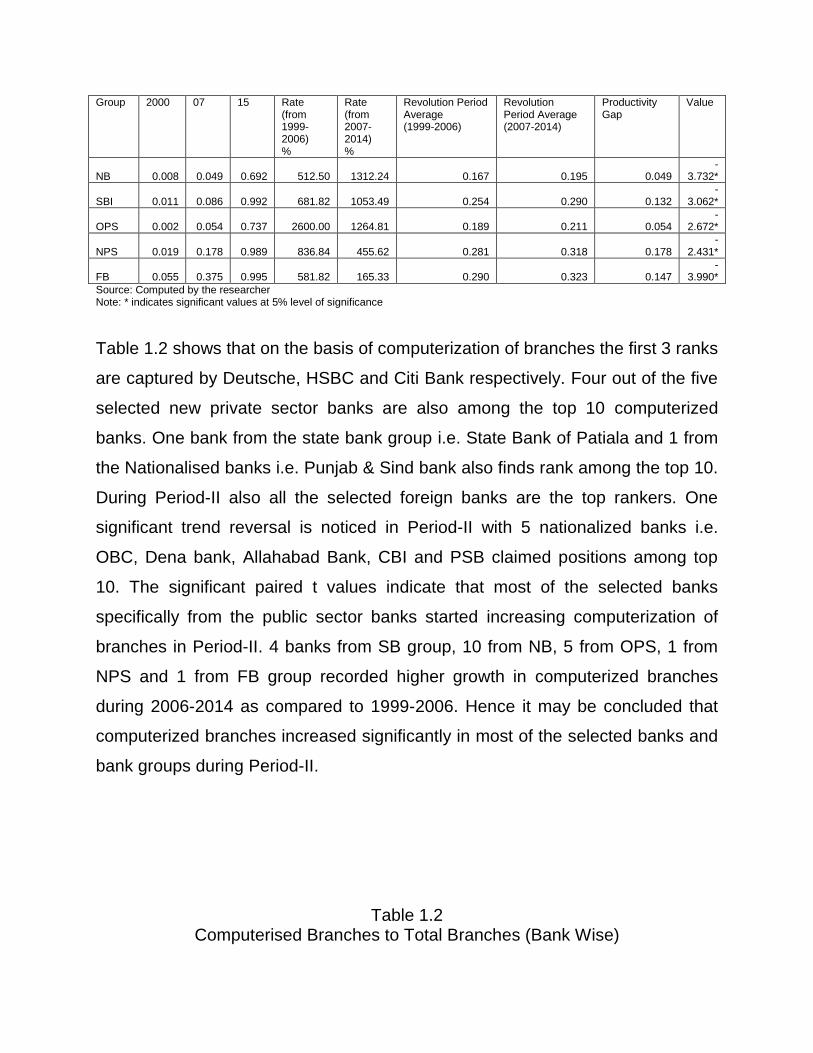
Table 1.2 shows that on the basis of computerization of branches the first 3 ranks
are captured by Deutsche, HSBC and Citi Bank respectively. Four out of the five
selected new private sector banks are also among the top 10 computerized
banks. One bank from the state bank group i.e. State Bank of Patiala and 1 from
the Nationalised banks i.e. Punjab & Sind bank also finds rank among the top 10.
During Period-II also all the selected foreign banks are the top rankers. One
significant trend reversal is noticed in Period-II with 5 nationalized banks i.e.
OBC, Dena bank, Allahabad Bank, CBI and PSB claimed positions among top
10. The significant paired t values indicate that most of the selected banks
specifically from the public sector banks started increasing computerization of
branches in Period-II. 4 banks from SB group, 10 from NB, 5 from OPS, 1 from
NPS and 1 from FB group recorded higher growth in computerized branches
during 2006-2014 as compared to 1999-2006. Hence it may be concluded that
computerized branches increased significantly in most of the selected banks and
bank groups during Period-II.
Table 1.2 Computerised Branches to Total Branches (Bank Wise)

Name of
Bank
1999-
2000 2006-07 2014-15
Growth rate
(1999-2006)
Growth rate
(2007-2014)
Average
(1998-2006)
Average
(2007-
2014)
Average
Productivity
Gap
t value
SBBJ 0.000 0.457 1.552 Na 239.85 0.266 0.978 0.712 -9.22*
SBI 0.046 0.233 1.514 406.52 549.96 0.274 1.053 0.779 -
33.42*
SBH 0.000 0.707 1.378 Na 94.83 0.265 0.920 0.655 -
14.36* SBP 0.426 0.957 1.607 124.76 67.93 0.723 1.052 0.329 -5.39*
SBT 0.453 0.742 1.539 63.80 107.47 0.480 1.038 0.558 -
15.52* CB 0.575 0.940 1.566 63.54 66.55 0.658 1.054 0.396 -7.07*
BOB 0.534 0.962 1.459 80.00 51.69 0.626 1.038 0.412 -8.63* BOI 0.155 0.342 1.225 120.46 258.09 0.416 0.831 0.415 -8.16* PNB 0.064 0.338 1.873 428.13 454.14 0.556 1.039 0.483 -4.12*
DenaB 0.000 0.954 1.783 Na 86.80 0.581 1.184 0.603 -6.65* PSB 0.000 1.034 1.546 Na 49.53 0.634 1.112 0.479 -3.60*
UBI 0.208 0.348 1.471 67.44 322.57 0.435 0.957 0.522 -
13.29*
AB 0.000 0.849 1.754 Na 106.65 0.270 1.138 0.867 -
42.79* IOB 0.000 0.795 1.406 Na 76.84 0.366 0.979 0.613 -8.37* OBC 0.175 0.525 1.681 199.64 220.27 0.233 1.237 1.004 -6.31*
CBI 0.000 0.515 1.833 Na 255.81 0.189 1.116 0.927 -
13.95* FB 0.000 0.616 1.156 Na 87.63 0.322 0.796 0.473 -7.41*
JKB 0.000 0.857 1.494 Na 74.33 0.380 1.044 0.664 -
10.64* INGVB 0.000 0.368 1.568 Na 326.16 0.181 0.867 0.686 -6.98*
KB 0.000 0.374 1.407 Na 276.39 0.192 0.879 0.687 -
10.36*
SIB 0.000 0.552 1.699 Na 207.93 0.231 1.036 0.806 -
12.26* Axis 0.429 0.709 0.967 65.34 36.54 0.706 0.798 0.092 -0.64 ICICI 0.184 0.792 1.231 330.75 55.39 0.690 0.906 0.216 -1.30 HDFC 0.446 0.803 1.052 80.20 30.91 0.716 0.832 0.116 -1.26
IIB 0.064 0.741 0.874 1057.09 18.02 0.775 0.667 -0.107 2.03 KMB 0.000 0.700 0.804 Na 14.85 0.239 0.715 0.476 -3.28* SCB 0.787 0.988 2.312 25.53 134.01 0.633 1.328 0.695 -6.89* RBS 0.000 0.920 7.699 Na 736.88 0.579 2.505 1.926 -2.08 DB 0.879 1.500 1.794 70.65 19.58 1.266 1.228 -0.038 -0.70
HSBC 0.652 1.243 2.335 90.64 87.82 0.997 1.302 0.305 -1.92 Citib 0.342 0.975 1.968 185.09 101.86 0.811 1.246 0.435 -4.07*
Source: Computed by the researcher Note: * indicates significant values at 5% level of significance
2 ATMs per Branch
ATMs are the most compassionate and speedy tool of IT for banking transactions
especially for cash withdrawal and mini statement of account. Table 1.3 shows
that during Pre e banking period FB group and NPS group have taken the lead in

establishing maximum number of ATMs per branch followed by SB, OPS and NB
group. During 2006-2014, the growth rate of ATMs is higher in NB, SB and OPS
group. The average productivity gap is also found highest in FB group although
this gap has been found positive for all the bank groups. Post e banking period,
with greater variations highlights that whole banking industry has gained
excellent improvement in ATMs’ installation. The significant t values also reveal a
comparatively better scenario during period II for all the bank groups.
Table 1.3 Number of ATMs Per Branch ((Bank Group Wise)
Bank Group
1999-2000
2006-07
2014-15
Growth Rate (from 1999-2006) %
Growth Rate (from 2007-2014) %
Pre E-Banking Revolution Period Average (1999-2006)
Pre E-Banking Revolution Period Average (2007-2014)
Average Productivity Gap
t- Value
NB 0.030 0.215 1.562 606.35 626.51 0.188 0.630 0.441 -6.03*
SB 0.081 0.340 1.785 319.26 425.12 0.309 1.300 0.990 -6.80*
OPS 0.085 0.336 1.537 295.46 357.17 0.197 0.974 0.777 -6.63*
NPS 1.317 3.026 3.123 129.79 3.20 2.022 3.046 1.024 -3.72*
FB 0.329 3.313 4.274 906.49 29.02 2.365 4.019 1.654 -4.94*
Source: Computed by the researcher Note: * indicates significant values at 5% level of significance
Table 1.4 shows that in Period-I foreign banks are among the top ten banks
having largest number of ATMs. Citibank tops the list of all 31 selected banks in
the study followed by Deutsche Bank. NPS banks are the second one to claim 4
places in the top ten. Axis Bank and IndusInd Bank are the top performers
among NPS banks. No bank from SB and NB group finds a place in top ten
performers. More specifically nationalized banks exists at the tail of the list in
Period-I. In Period-II, again the foreign banks take the lead by claiming 5 places
in the top 6 banks. Further all the selected new private sector banks are among
the top ten banks. The paired sample t values are found significant for all the
selected banks except Deutsche Bank, RBS and Indusind Bank as the average
productivity gap figures in these 3 banks are quite low. It may be concluded that
in ATMs installations, foreign banks and new private sector banks are better

performers as compared to other banks. The growth of ATMs during 2006-2014
as compared to 1999-2006 is found quite high for almost all the selected banks.
Table 1.4 Number of ATMs Per Branch ((Bank Wise)
Name of
Bank
1999-
2000 2006-07 2014-15
Growth rate
(1999-2006)
Growth rate
(2007-2014)
Average
(1998-2006)
Average
(2007-
2014)
Average
Productivity
Gap
t value
SBBJ 0.000 0.342 3.986 na 1063.99 0.13 1.71 1.58 -3.73* SBI 0.014 0.520 2.806 3598.69 439.40 0.19 1.54 1.35 -5.61* SBH 0.000 0.347 1.924 na 453.79 0.19 0.87 0.68 -4.05* SBP 0.000 0.379 2.162 na 470.78 0.16 0.95 0.79 -4.18* SBT 0.000 0.418 2.037 na 387.46 0.13 0.92 0.79 -5.41* CB 0.000 0.459 2.401 na 423.14 0.14 1.08 0.93 -5.02*
BOB 0.022 0.143 1.424 545.99 898.87 0.07 0.62 0.56 -3.88* BOI 0.000 0.109 0.588 na 441.21 0.04 0.26 0.22 -4.70* PNB 0.000 0.432 1.874 na 334.00 0.10 0.83 0.74 -5.15*
DenaB 0.000 0.224 1.401 na 525.39 0.06 0.63 0.57 -4.53* PSB 0.000 0.006 0.196 na 3271.31 0.00 0.08 0.08 -3.28* UBI 0.000 0.411 2.478 na 502.55 0.13 1.08 0.95 -4.51* AB 0.000 0.087 0.384 na 339.23 0.03 0.17 0.15 -4.71* IOB 0.000 0.158 1.261 na 700.13 0.07 0.55 0.48 -4.26* OBC 0.000 0.397 2.427 na 510.82 0.12 1.26 1.15 -3.64* CBI 0.000 0.059 0.510 na 759.46 0.01 0.21 0.20 -4.09* FB 0.000 0.665 3.092 na 365.01 0.22 1.46 1.24 -5.83*
JKB 0.000 0.423 1.705 na 303.00 0.21 0.80 0.59 -4.45* INGVB 0.000 0.230 3.139 na 1264.48 0.11 1.25 1.14 -3.26*
KB 0.000 0.093 1.795 na 1820.69 0.04 0.77 0.72 -3.57* SIB 0.000 0.343 2.646 na 671.37 0.15 1.09 0.94 -3.61* Axis 0.589 3.192 9.671 441.61 203.01 1.34 5.14 3.79 -7.46* ICICI 0.245 0.743 7.416 203.12 898.14 0.56 3.40 2.83 -3.70* HDFC 0.482 0.616 6.006 27.74 875.68 0.55 2.97 2.42 -3.80*
IIB 2.049 0.768 2.982 -62.54 288.48 1.29 1.80 0.51 -1.47 KMB 0.000 0.573 3.267 na 470.45 0.21 1.69 1.48 -5.10* SCB 0.328 1.878 14.599 472.80 677.33 0.68 5.69 5.01 -3.49* RBS 0.000 0.800 50.883 na 6260.40 0.48 13.29 12.81 -1.91* DB 0.800 2.875 10.279 259.38 257.55 2.70 4.43 1.73 -1.44*
HSBC 0.733 0.787 17.347 7.35 2103.48 0.76 6.24 5.47 -2.61* Citib 1.111 3.450 28.147 210.50 715.86 3.21 12.11 8.90 -2.74*
Source: Computed by the researcher Note: * indicates significant values at 5% level of significance
3 Credit Cards per Branch
Credit cards, an excellent version of IT for banking and shopping in market, has
gained momentum among all IT channels. Table 1.5 shows that during Period-I,
FB group is the most admired one for credit cards, as revealed by its highest
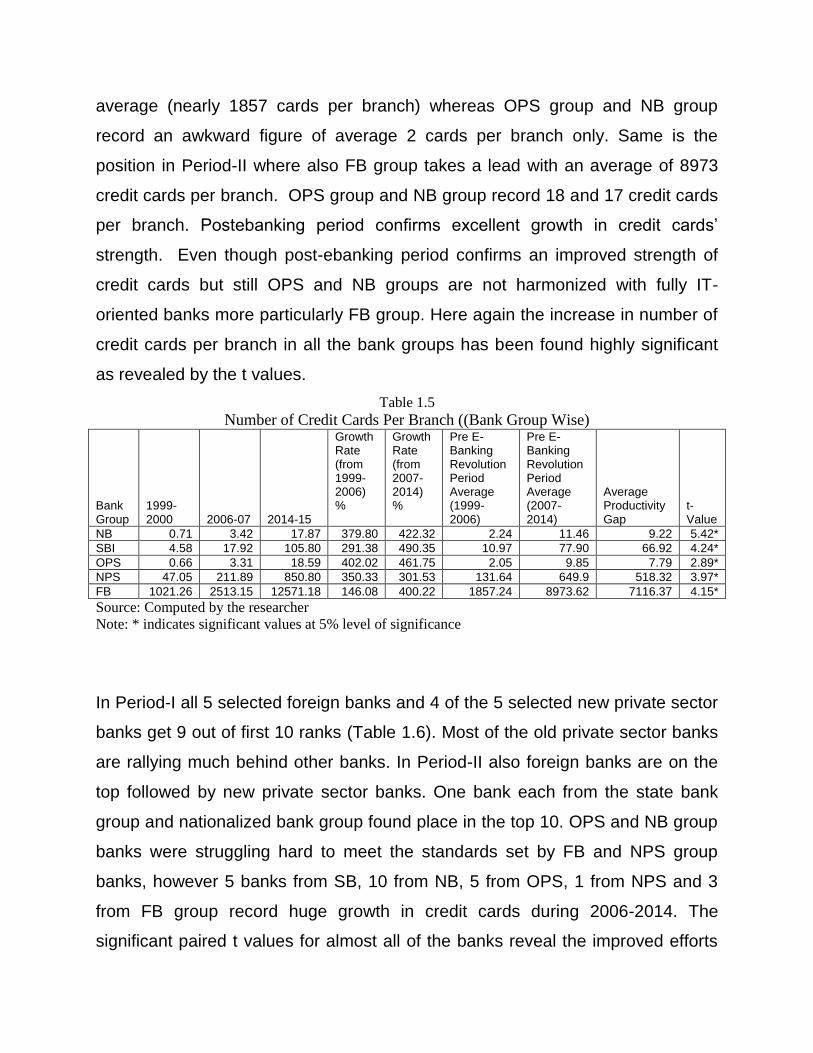
average (nearly 1857 cards per branch) whereas OPS group and NB group
record an awkward figure of average 2 cards per branch only. Same is the
position in Period-II where also FB group takes a lead with an average of 8973
credit cards per branch. OPS group and NB group record 18 and 17 credit cards
per branch. Postebanking period confirms excellent growth in credit cards’
strength. Even though post-ebanking period confirms an improved strength of
credit cards but still OPS and NB groups are not harmonized with fully IT-
oriented banks more particularly FB group. Here again the increase in number of
credit cards per branch in all the bank groups has been found highly significant
as revealed by the t values.
Table 1.5 Number of Credit Cards Per Branch ((Bank Group Wise)
Bank Group
1999-2000 2006-07 2014-15
Growth Rate (from 1999-2006) %
Growth Rate (from 2007-2014) %
Pre E-Banking Revolution Period Average (1999-2006)
Pre E-Banking Revolution Period Average (2007-2014)
Average Productivity Gap
t- Value
NB 0.71 3.42 17.87 379.80 422.32 2.24 11.46 9.22 5.42* SBI 4.58 17.92 105.80 291.38 490.35 10.97 77.90 66.92 4.24* OPS 0.66 3.31 18.59 402.02 461.75 2.05 9.85 7.79 2.89* NPS 47.05 211.89 850.80 350.33 301.53 131.64 649.9 518.32 3.97* FB 1021.26 2513.15 12571.18 146.08 400.22 1857.24 8973.62 7116.37 4.15* Source: Computed by the researcher Note: * indicates significant values at 5% level of significance
In Period-I all 5 selected foreign banks and 4 of the 5 selected new private sector
banks get 9 out of first 10 ranks (Table 1.6). Most of the old private sector banks
are rallying much behind other banks. In Period-II also foreign banks are on the
top followed by new private sector banks. One bank each from the state bank
group and nationalized bank group found place in the top 10. OPS and NB group
banks were struggling hard to meet the standards set by FB and NPS group
banks, however 5 banks from SB, 10 from NB, 5 from OPS, 1 from NPS and 3
from FB group record huge growth in credit cards during 2006-2014. The
significant paired t values for almost all of the banks reveal the improved efforts

on the part of selected banks in improving the credit card component of
electronic delivery channels.
Table 1.6 Number of Credit Cards Per Branch ((Bank Wise)
Name of
Bank 1999-2000 2006-07 2014-15
Growth rate
(1999-2006)
Growth rate
(2007-2014)
Average
(1998-2006)
Average
(2007-
2014)
Average
Productivity
Gap
t value
SBBJ 0.00 26.31 110.47 na 319.81 13.59 78.94 65.35 -6.02*
SBI 45.57 101.85 625.17 123.48 513.82 71.01 379.14 308.13 -3.83*
SBH 0.00 2.12 6.13 na 188.82 1.24 4.50 3.26 -7.17*
SBP 0.00 44.44 219.60 na 394.10 8.84 159.25 150.41 -7.57*
SBT 0.00 381.68 1341.01 na 251.35 119.44 1002.13 882.69 -8.64*
CB 0.00 23.51 49.98 na 112.58 10.08 39.44 29.36 -13.54*
BOB 0.84 2.48 56.77 194.62 2190.46 1.33 37.80 36.47 -4.19*
BOI 0.00 13.35 43.08 Na 222.72 6.31 32.10 25.79 -9.39*
PNB 0.00 15.56 19.87 Na 27.73 6.84 16.51 9.67 -6.20*
DenaB 0.00 19.06 43.74 Na 129.44 8.53 35.61 27.08 -12.94*
PSB 0.00 20.81 35.15 Na 68.94 14.40 29.90 15.49 -7.78*
UBI 1.57 12.05 99.40 665.91 724.89 6.84 67.92 61.08 -5.28*
AB 0.00 42.16 330.88 Na 684.79 11.47 254.71 243.25 -8.27*
IOB 0.00 280.49 859.75 0 206.52 81.39 645.95 564.56 -8.32*
OBC 320.44 735.38 829.28 129.49 12.77 504.73 825.35 320.62 -3.99*
CBI 0.00 5.88 15.43 Na 162.45 2.26 11.35 9.09 -10.95*
FB 0.00 6.01 85.18 Na 1316.17 3.24 55.84 52.59 -4.27*
JKB 0.00 9.85 58.28 Na 491.81 6.12 41.71 35.59 -5.13*
INGVB 0.00 10.27 383.59 Na 3635.49 5.41 248.53 243.12 -4.54*
KB 0.00 7.80 159.20 Na 1940.00 4.61 102.43 97.82 -3.91*
SIB 0.00 9.38 37.77 Na 302.69 4.46 25.50 21.04 -6.97*
Axis 370.27 1678.91 4012.72 353.42 139.01 509.68 3512.44 3002.76 -7.63*
ICICI 487.09 1370.52 837.91 181.37 -38.86 1204.42 812.88 -391.54 3.09*
HDFC 1132.87 1382.96 883.44 22.08 -36.12 1813.29 967.32 -845.97 5.51*
IIB 427.45 346.77 546.41 -18.87 57.57 512.37 588.27 75.90 -0.90
KMB 0.00 42.76 154.78 Na 261.94 16.70 133.18 116.48 -5.00*
SCB 5049.62 11702.56 35201.78 131.75 200.80 8292.27 23186.15 14893.88 -4.95*
RBS 0.00 26858.84 174817.09 Na 550.87 490.40 68142.77 67652.37 -2.17*
DB 810.67 655.00 1068.29 -19.20 63.10 726.52 805.40 78.88 -0.42
HSBC 23294.13 20448.89 38797.71 -12.21 89.73 21057.40 27519.29 6461.88 -2.62
Citib 16428.22 20525.28 49303.82 24.94 140.21 20875.11 38185.61 17310.50 -3.69* Source: Computed by the researcher Note: * indicates significant values at 5% level of significance
4 Internet Banking Branches
Internet banking is also a much popular approach of banking today. Table 1.7
demonstrates that on an average FB group takes the lead followed by NPS
group. During post-ebanking period , SB Group tops the list with an average of
37 percent followed by NPS and FB group. NB and OPS group show a very
dismal comparative picture in this regard. The average productivity gap in all the
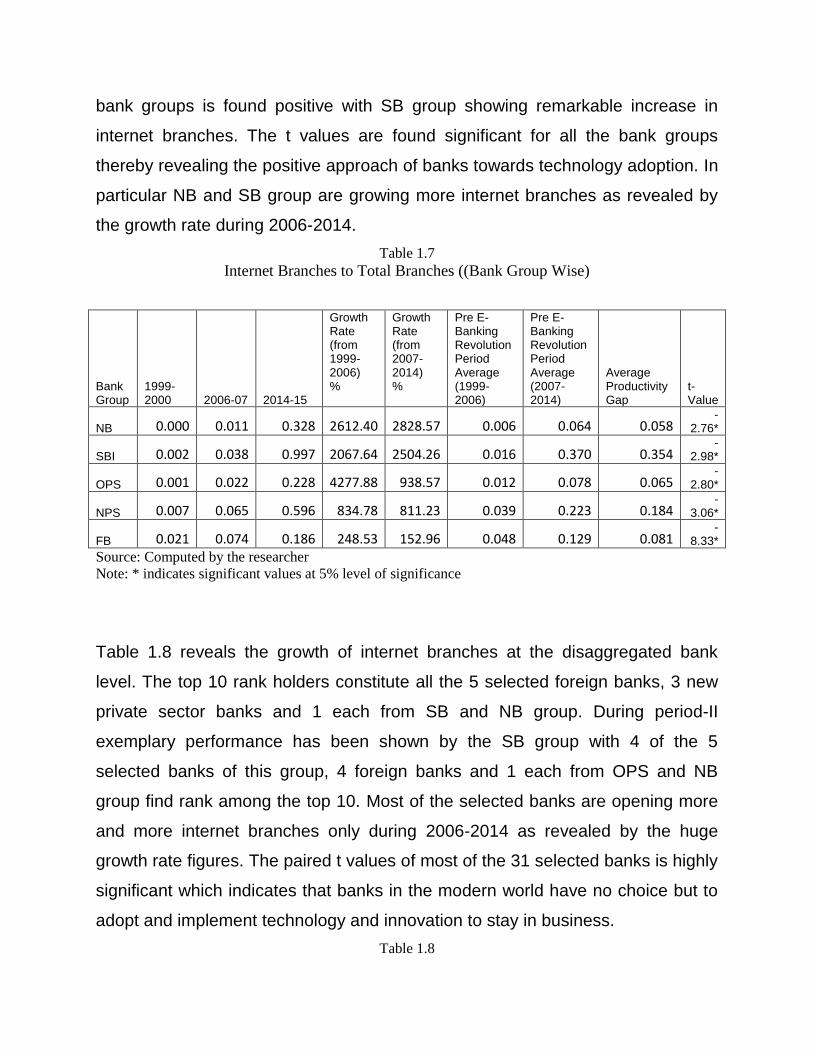
bank groups is found positive with SB group showing remarkable increase in
internet branches. The t values are found significant for all the bank groups
thereby revealing the positive approach of banks towards technology adoption. In
particular NB and SB group are growing more internet branches as revealed by
the growth rate during 2006-2014.
Table 1.7 Internet Branches to Total Branches ((Bank Group Wise)
Bank Group
1999-2000 2006-07 2014-15
Growth Rate (from 1999-2006) %
Growth Rate (from 2007-2014) %
Pre E-Banking Revolution Period Average (1999-2006)
Pre E-Banking Revolution Period Average (2007-2014)
Average Productivity Gap
t- Value
NB 0.000 0.011 0.328 2612.40 2828.57 0.006 0.064 0.058 -
2.76*
SBI 0.002 0.038 0.997 2067.64 2504.26 0.016 0.370 0.354 -
2.98*
OPS 0.001 0.022 0.228 4277.88 938.57 0.012 0.078 0.065 -
2.80*
NPS 0.007 0.065 0.596 834.78 811.23 0.039 0.223 0.184 -
3.06*
FB 0.021 0.074 0.186 248.53 152.96 0.048 0.129 0.081 -
8.33* Source: Computed by the researcher Note: * indicates significant values at 5% level of significance
Table 1.8 reveals the growth of internet branches at the disaggregated bank
level. The top 10 rank holders constitute all the 5 selected foreign banks, 3 new
private sector banks and 1 each from SB and NB group. During period-II
exemplary performance has been shown by the SB group with 4 of the 5
selected banks of this group, 4 foreign banks and 1 each from OPS and NB
group find rank among the top 10. Most of the selected banks are opening more
and more internet branches only during 2006-2014 as revealed by the huge
growth rate figures. The paired t values of most of the 31 selected banks is highly
significant which indicates that banks in the modern world have no choice but to
adopt and implement technology and innovation to stay in business.
Table 1.8

Internet Branches to Total Branches ((Bank Wise)
Name of
Bank 1999-2000 2006-07 2014-15
Growth rate
(1999-2006)
Growth rate
(2007-2014)
Average
(1998-2006)
Average
(2007-
2014)
Average
Productivity
Gap
t value
SBBJ 0.00 0.46 0.63 Na 35.74
0.15 0.56 0.41 -11.29*
SBI 0.02 0.13 1.34 614.64 964.11 0.05 0.94 0.88 -7.66*
SBH 0.00 0.52 1.02 Na 97.72
0.15 0.81 0.66 -12.80*
SBP 0.00 0.36 1.19 na 234.40 0.11 0.90 0.79 -8.99*
SBT 0.00 0.56 1.09 na 95.20
0.26 0.89 0.62 -35.56*
CB 0.00 0.20 0.37 na 80.28
0.06 0.32 0.26 -14.95*
BOB 0.09 0.27 0.97 200.00 259.38
0.23 0.80 0.57 -14.69*
BOI 0.00 0.09 0.48 na 423.52 0.03 0.32 0.30 -5.81*
PNB 0.00 0.37 0.56 na 49.85
0.12 0.46 0.34 -12.68*
DenaB 0.00 0.10 0.20 na 99.66
0.04 0.17 0.12 -20.28*
PSB 0.00 0.00 0.00 na Na 0.00 0.00 0.00 -4.79* UBI 0.00 0.07 0.63 na 849.94 0.03 0.41 0.38 -6.39*
AB 0.00 0.19 0.81 na 321.95
0.07 0.57 0.50 -14.57*
IOB 0.00 0.23 0.63 na 170.91 0.08 0.52 0.44 -5.93*
OBC 0.00 0.22 0.92 na 307.17
0.11 0.84 0.73 -21.02*
CBI 0.00 0.15 0.35 na 127.46 0.03 0.27 0.24 -4.20*
FB 0.00 0.20 0.24 na 19.84
0.11 0.22 0.11 -22.15*
JKB 0.00 0.23 0.48 na 109.58 0.11 0.41 0.30 -7.30*
INGVB 0.00 0.25 1.45 na 469.91
0.14 1.02 0.88 -11.90*
KB 0.00 0.24 0.41 na 74.02 0.13 0.34 0.21 -9.29* SIB 0.00 0.25 0.42 na 65.64 0.13 0.35 0.22 -3.99*
Axis 0.12 0.15 0.56 26.41 270.01
0.20 0.46 0.26 -10.14*
ICICI 0.12 0.43 0.78 276.05 79.12 0.34 0.65 0.31 -3.68* HDFC 0.14 0.47 0.41 240.89 -11.41 0.26 0.43 0.18 2.74*
IIB 0.36 0.49 0.26 37.51 -47.59 0.58 0.39 -0.19 -1.61 KMB 0.00 0.45 0.28 na -36.13 0.16 0.34 0.18 -8.10* SCB 0.17 0.35 0.80 102.25 126.65 0.23 0.57 0.34 -2.42* RBS 0.00 0.64 4.23 na 561.25 0.38 1.65 1.27 0.25 DB 0.80 0.75 1.02 -6.25 36.30 0.81 0.84 0.03 -9.99*
HSBC 0.27 0.60 1.21 123.40 103.85 0.42 0.87 0.44 -5.40* Citib 0.37 0.55 1.04 48.50 89.37 0.48 0.84 0.36 -3.69*
Source: Computed by the researcher Note: * indicates significant values at 5% level of significance
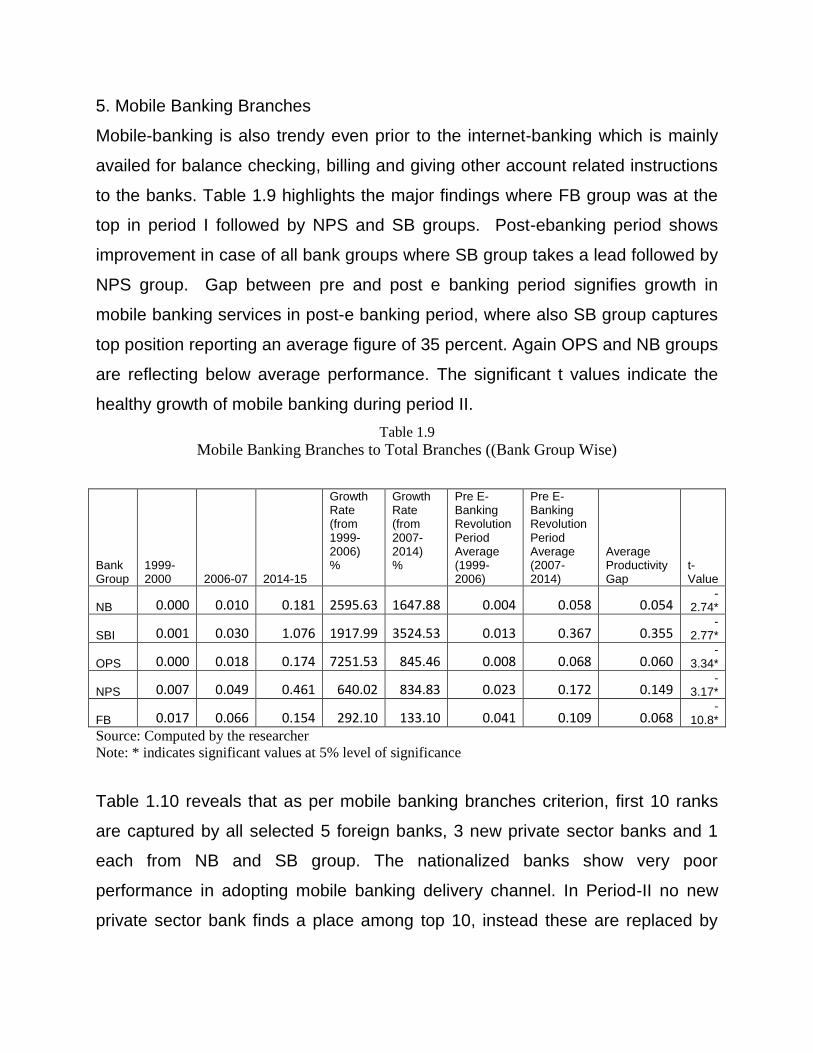
5. Mobile Banking Branches
Mobile-banking is also trendy even prior to the internet-banking which is mainly
availed for balance checking, billing and giving other account related instructions
to the banks. Table 1.9 highlights the major findings where FB group was at the
top in period I followed by NPS and SB groups. Post-ebanking period shows
improvement in case of all bank groups where SB group takes a lead followed by
NPS group. Gap between pre and post e banking period signifies growth in
mobile banking services in post-e banking period, where also SB group captures
top position reporting an average figure of 35 percent. Again OPS and NB groups
are reflecting below average performance. The significant t values indicate the
healthy growth of mobile banking during period II.
Table 1.9 Mobile Banking Branches to Total Branches ((Bank Group Wise)
Bank Group
1999-2000 2006-07 2014-15
Growth Rate (from 1999-2006) %
Growth Rate (from 2007-2014) %
Pre E-Banking Revolution Period Average (1999-2006)
Pre E-Banking Revolution Period Average (2007-2014)
Average Productivity Gap
t- Value
NB 0.000 0.010 0.181 2595.63 1647.88 0.004 0.058 0.054 -
2.74*
SBI 0.001 0.030 1.076 1917.99 3524.53 0.013 0.367 0.355 -
2.77*
OPS 0.000 0.018 0.174 7251.53 845.46 0.008 0.068 0.060 -
3.34*
NPS 0.007 0.049 0.461 640.02 834.83 0.023 0.172 0.149 -
3.17*
FB 0.017 0.066 0.154 292.10 133.10 0.041 0.109 0.068 -
10.8* Source: Computed by the researcher Note: * indicates significant values at 5% level of significance
Table 1.10 reveals that as per mobile banking branches criterion, first 10 ranks
are captured by all selected 5 foreign banks, 3 new private sector banks and 1
each from NB and SB group. The nationalized banks show very poor
performance in adopting mobile banking delivery channel. In Period-II no new
private sector bank finds a place among top 10, instead these are replaced by

SB group banks. However, most of the selected banks are making great efforts
to adopt mobile banking as revealed by the healthy growth figures during 2006-
2014. The significant t values further supports the fact that all the banks are
making all round efforts in adoption of mobile banking technology.
Table 1.10 Mobile Banking Branches to Total Branches (Bank Wise)
Name of
Bank 1999-2000 2006-07 2014-15
Growth rate
(1999-2006)
Growth rate
(2007-2014)
Average
(1998-2006)
Average
(2007-
2014)
Average
Productivity
Gap
t value
SBBJ 0.000 0.121 0.709 na 485.95 0.08 0.56 0.48 -9.45*
SBI 0.015 0.145 1.337 892.22 819.69 0.06 0.84 0.79 -5.31*
SBH 0.000 0.202 1.021 na 405.18 0.05 0.73 0.68 -6.62*
SBP 0.000 0.596 1.191 na 99.79 0.14 0.98 0.84 -16.48*
SBT 0.000 0.558 1.056 na 89.14 0.22 0.88 0.66 -25.90*
CB 0.000 0.223 0.377 na 68.83 0.08 0.33 0.25 -11.48*
BOB 0.072 0.339 1.005 369.48 196.90 0.17 0.80 0.63 -9.61*
BOI 0.000 0.088 0.435 na 391.75 0.03 0.29 0.26 -5.70*
PNB 0.000 0.245 0.390 na 59.40 0.05 0.32 0.26 -9.72*
DenaB 0.000 0.149 0.240 na 60.46 0.05 0.21 0.15 -13.12*
PSB 0.000 0.000 0.456 na Na 0.00 0.15 0.15 -2.42*
UBI 0.000 0.083 0.573 na 589.72 0.04 0.38 0.34 -5.34*
AB 0.000 0.090 0.749 na 734.52 0.04 0.49 0.45 -5.14*
IOB 0.000 0.098 0.682 na 596.17 0.04 0.47 0.43 -5.75*
OBC 0.000 0.232 0.846 na 263.85 0.10 0.78 0.68 -6.76*
CBI 0.000 0.124 0.264 na 111.92 0.03 0.21 0.18 -24.50*
FB 0.000 0.190 0.290 na 52.30 0.07 0.25 0.18 -12.29*
JKB 0.000 0.174 0.417 na 140.07 0.08 0.34 0.26 -21.04*
INGVB 0.000 0.283 1.154 na 307.18 0.13 0.84 0.70 -10.57*
KB 0.000 0.199 0.369 na 85.56 0.07 0.31 0.24 -17.24*
SIB 0.000 0.190 0.347 na 82.64 0.10 0.28 0.19 -11.13*
Axis 0.167 0.158 0.163 -5.39 3.38 0.18 0.15 -0.03 3.81*
ICICI 0.063 0.288 0.685 355.68 137.96 0.12 0.54 0.41 -6.99*
HDFC 0.145 0.317 0.396 119.13 24.88 0.18 0.39 0.21 -5.78*
IIB 0.195 0.443 0.258 127.16 -41.84 0.41 0.39 -0.01 0.23
KMB 0.000 0.264 0.279 na 5.90 0.10 0.31 0.21 -3.36*
SCB 0.087 0.293 0.674 234.76 130.30 0.17 0.47 0.30 -10.06*
RBS 0.000 0.640 4.232 na 561.25 0.35 1.64 1.29 -2.52*
DB 0.800 0.750 1.124 -6.25 49.93 0.83 0.90 0.07 -0.13
HSBC 0.133 0.404 1.251 203.19 209.51 0.24 0.86 0.62 -9.56*
Citib 0.519 0.575 1.180 10.89 105.28 0.55 0.95 0.40 -5.20* Source: Computed by the researcher Note: * indicates significant values at 5% level of significance
6 Tele-Banking Branches
Tele-banking encourages banking on telephones for limited operations. Table
1.11 represents comparative view where average share of tele-banking branches
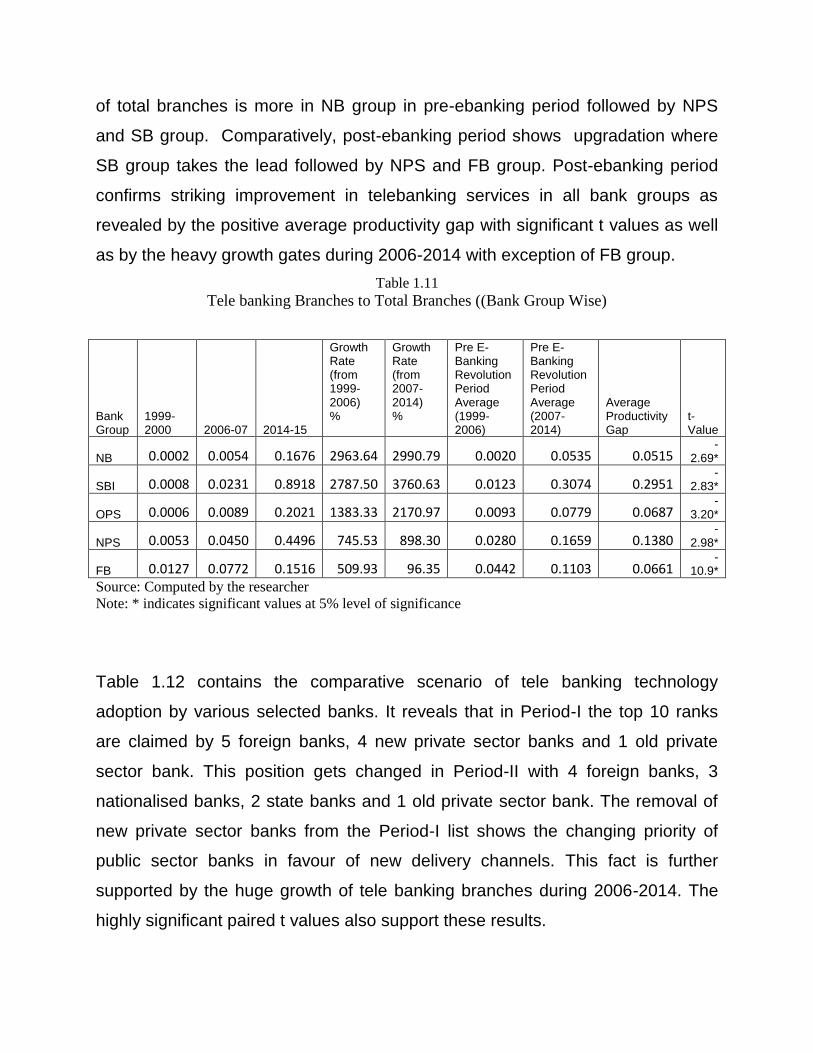
of total branches is more in NB group in pre-ebanking period followed by NPS
and SB group. Comparatively, post-ebanking period shows upgradation where
SB group takes the lead followed by NPS and FB group. Post-ebanking period
confirms striking improvement in telebanking services in all bank groups as
revealed by the positive average productivity gap with significant t values as well
as by the heavy growth gates during 2006-2014 with exception of FB group.
Table 1.11 Tele banking Branches to Total Branches ((Bank Group Wise)
Bank Group
1999-2000 2006-07 2014-15
Growth Rate (from 1999-2006) %
Growth Rate (from 2007-2014) %
Pre E-Banking Revolution Period Average (1999-2006)
Pre E-Banking Revolution Period Average (2007-2014)
Average Productivity Gap
t- Value
NB 0.0002 0.0054 0.1676 2963.64 2990.79 0.0020 0.0535 0.0515 -
2.69*
SBI 0.0008 0.0231 0.8918 2787.50 3760.63 0.0123 0.3074 0.2951 -
2.83*
OPS 0.0006 0.0089 0.2021 1383.33 2170.97 0.0093 0.0779 0.0687 -
3.20*
NPS 0.0053 0.0450 0.4496 745.53 898.30 0.0280 0.1659 0.1380 -
2.98*
FB 0.0127 0.0772 0.1516 509.93 96.35 0.0442 0.1103 0.0661 -
10.9* Source: Computed by the researcher Note: * indicates significant values at 5% level of significance
Table 1.12 contains the comparative scenario of tele banking technology
adoption by various selected banks. It reveals that in Period-I the top 10 ranks
are claimed by 5 foreign banks, 4 new private sector banks and 1 old private
sector bank. This position gets changed in Period-II with 4 foreign banks, 3
nationalised banks, 2 state banks and 1 old private sector bank. The removal of
new private sector banks from the Period-I list shows the changing priority of
public sector banks in favour of new delivery channels. This fact is further
supported by the huge growth of tele banking branches during 2006-2014. The
highly significant paired t values also support these results.
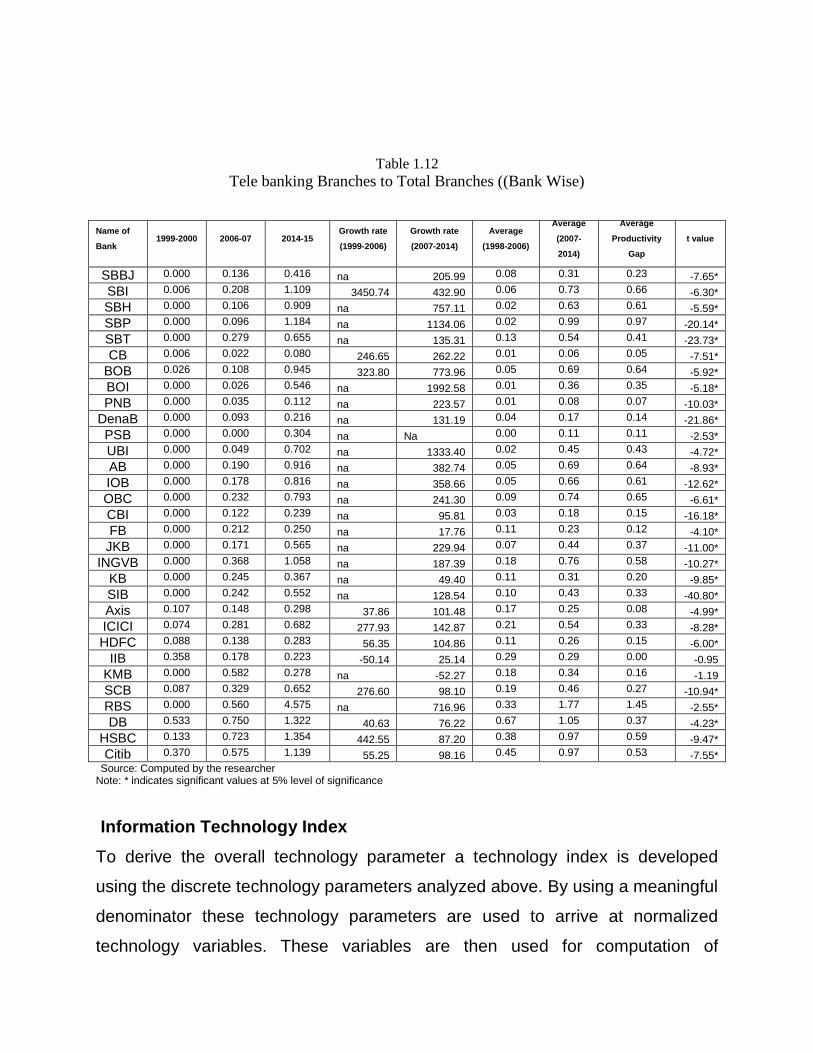
Table 1.12 Tele banking Branches to Total Branches ((Bank Wise)
Name of
Bank 1999-2000 2006-07 2014-15
Growth rate
(1999-2006)
Growth rate
(2007-2014)
Average
(1998-2006)
Average
(2007-
2014)
Average
Productivity
Gap
t value
SBBJ 0.000 0.136 0.416 na 205.99 0.08 0.31 0.23 -7.65*
SBI 0.006 0.208 1.109 3450.74 432.90 0.06 0.73 0.66 -6.30*
SBH 0.000 0.106 0.909 na 757.11 0.02 0.63 0.61 -5.59*
SBP 0.000 0.096 1.184 na 1134.06 0.02 0.99 0.97 -20.14*
SBT 0.000 0.279 0.655 na 135.31 0.13 0.54 0.41 -23.73*
CB 0.006 0.022 0.080 246.65 262.22 0.01 0.06 0.05 -7.51*
BOB 0.026 0.108 0.945 323.80 773.96 0.05 0.69 0.64 -5.92*
BOI 0.000 0.026 0.546 na 1992.58 0.01 0.36 0.35 -5.18*
PNB 0.000 0.035 0.112 na 223.57 0.01 0.08 0.07 -10.03*
DenaB 0.000 0.093 0.216 na 131.19 0.04 0.17 0.14 -21.86*
PSB 0.000 0.000 0.304 na Na 0.00 0.11 0.11 -2.53*
UBI 0.000 0.049 0.702 na 1333.40 0.02 0.45 0.43 -4.72*
AB 0.000 0.190 0.916 na 382.74 0.05 0.69 0.64 -8.93*
IOB 0.000 0.178 0.816 na 358.66 0.05 0.66 0.61 -12.62*
OBC 0.000 0.232 0.793 na 241.30 0.09 0.74 0.65 -6.61*
CBI 0.000 0.122 0.239 na 95.81 0.03 0.18 0.15 -16.18*
FB 0.000 0.212 0.250 na 17.76 0.11 0.23 0.12 -4.10*
JKB 0.000 0.171 0.565 na 229.94 0.07 0.44 0.37 -11.00*
INGVB 0.000 0.368 1.058 na 187.39 0.18 0.76 0.58 -10.27*
KB 0.000 0.245 0.367 na 49.40 0.11 0.31 0.20 -9.85*
SIB 0.000 0.242 0.552 na 128.54 0.10 0.43 0.33 -40.80*
Axis 0.107 0.148 0.298 37.86 101.48 0.17 0.25 0.08 -4.99*
ICICI 0.074 0.281 0.682 277.93 142.87 0.21 0.54 0.33 -8.28*
HDFC 0.088 0.138 0.283 56.35 104.86 0.11 0.26 0.15 -6.00*
IIB 0.358 0.178 0.223 -50.14 25.14 0.29 0.29 0.00 -0.95
KMB 0.000 0.582 0.278 na -52.27 0.18 0.34 0.16 -1.19
SCB 0.087 0.329 0.652 276.60 98.10 0.19 0.46 0.27 -10.94*
RBS 0.000 0.560 4.575 na 716.96 0.33 1.77 1.45 -2.55*
DB 0.533 0.750 1.322 40.63 76.22 0.67 1.05 0.37 -4.23*
HSBC 0.133 0.723 1.354 442.55 87.20 0.38 0.97 0.59 -9.47*
Citib 0.370 0.575 1.139 55.25 98.16 0.45 0.97 0.53 -7.55* Source: Computed by the researcher Note: * indicates significant values at 5% level of significance
Information Technology Index
To derive the overall technology parameter a technology index is developed
using the discrete technology parameters analyzed above. By using a meaningful
denominator these technology parameters are used to arrive at normalized
technology variables. These variables are then used for computation of

technology index. The variables are: number of ATMs per branch; number of
credit card per branch; number of computerized branches to total branches;
number of internet banking branches to total branches; number of mobile
banking branches to total branches; and number of tele-banking branches to
total branches. Bank group wise information technology index for different years
is shown in table 1.13. On the whole, the table is indicative of the fact that
information technology index of all bank groups has improved over a period of
time.
Table 1.13 Information Technology Index ( Bank group Wise)
Bank Group
1999-2000 2006-07 2014-15
Growth Rate (from 1999-2006) %
Growth Rate (from 2007-2014) %
Pre E-Banking Revolution Period Average (1999-2006)
Pre E-Banking Revolution Period Average (2007-2014)
Average Productivity Gap
NB 0.017 0.150 1.000 785.57 566.73 0.072 0.430 0.358
SBI 0.015 0.097 0.956 546.72 886.81 0.050 0.446 0.396
OPS 0.015 0.119 0.951 701.47 701.85 0.059 0.408 0.349
NPS 0.076 0.237 0.922 211.26 288.39 0.140 0.472 0.332
FB 0.132 0.528 0.945 299.77 78.94 0.321 0.766 0.445 Source: Computed by the researcher Note: * indicates significant values at 5% level of significance
Technology Index is the quantum of technology adoption and use by the banks.
In pre e banking period the FB group was on the top with average IT index value
of .321 followed by NPS, NB, OPS and SB group with average IT index values of
.14, .07, .059 and .05 respectively. However in post e banking period this ranking
changed to FB, NPS, SB, NB and OPS with the average IT index values of .766,
.472, .446, .430 and .408 respectively. As reflected by figure-I no bank group
was even nearer to the IT adoption performance of the FB group, however figure-
II shows a complete transformation in the efforts of all bank groups to towards
IT adoption and a clear convergence has been noticed during the end of the
study period. It is an indication of the fact that IT adoption has become a

necessity and this truth has very well been received and understood by all the
bankers. More specifically SB and NPS group recorded a relatively better growth
during 2006-2014. The CAGR of SB, NB, NPS and OPS during Period-II was
32,30, 26 and 22 percent as against the Period-I CAGR of 4,2,3 and 6 percent.
The CAGR of FB group during Period-I and II was 15 and 16 percent
respectively, hence it may be concluded that FB group was the early starter in IT
adoption and the rest of the groups made huge efforts only during period-II.

Table 1.14 contains the Technology Index at individual bank level. In Period-I the
ranking as per average IT index value goes in favour of foreign banks with RBS,
CITIB, HSBC and DB capturing first 4 ranks followed by SB group banks (SBT
and SBI). Among the first 10 banks there are 5 foreign banks, 2 state banks, 1
old private sector bank and 2 nationalised banks. This trend continues during
Period-II when the top ten rankers constitute 5 foreign banks, 3 state banks and
1 each from nationalized banks and old private sector banks. However as
revealed by figures III to VII state banks, nationalized banks, new private sector
banks and old private sector banks are making concerted efforts to adopt
various electronic delivery channels in their operations. Foreign banks are
slowing down in this regard as these already have a strong base of technology
channels.
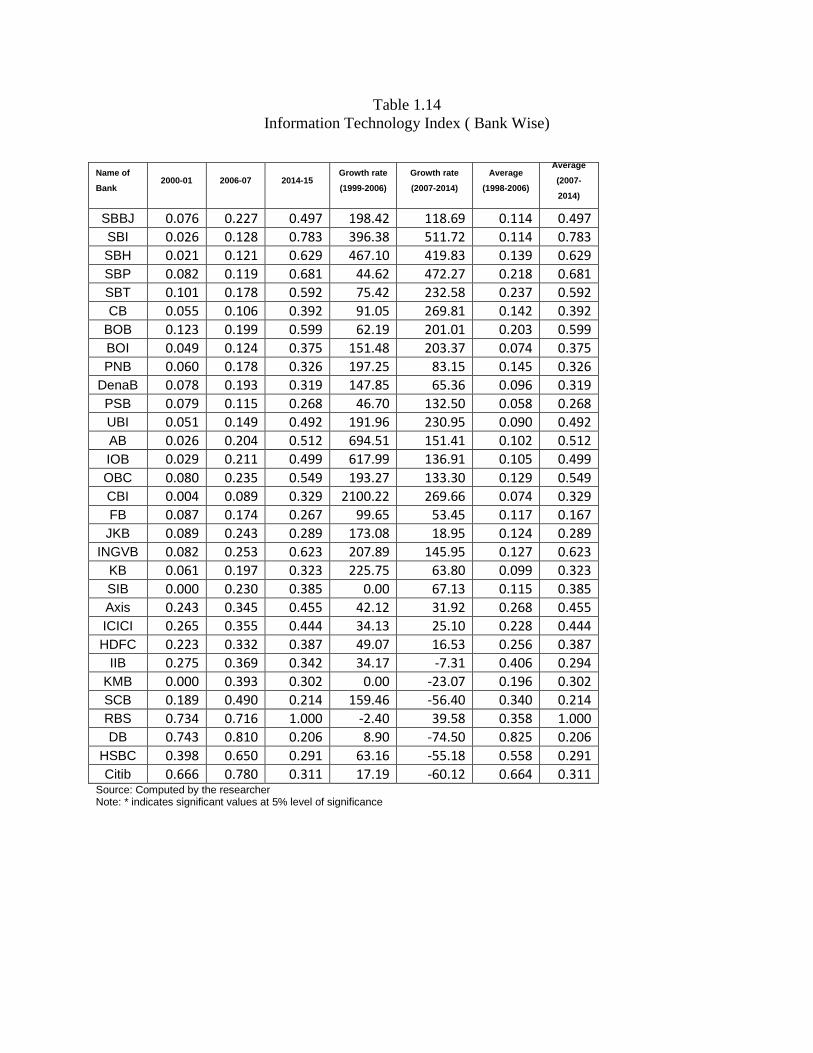
Table 1.14 Information Technology Index ( Bank Wise)
Name of
Bank 2000-01 2006-07 2014-15
Growth rate
(1999-2006)
Growth rate
(2007-2014)
Average
(1998-2006)
Average
(2007-
2014)
SBBJ 0.076 0.227 0.497 198.42 118.69 0.114 0.497 SBI 0.026 0.128 0.783 396.38 511.72 0.114 0.783 SBH 0.021 0.121 0.629 467.10 419.83 0.139 0.629 SBP 0.082 0.119 0.681 44.62 472.27 0.218 0.681
SBT 0.101 0.178 0.592 75.42 232.58 0.237 0.592 CB 0.055 0.106 0.392 91.05 269.81 0.142 0.392
BOB 0.123 0.199 0.599 62.19 201.01 0.203 0.599 BOI 0.049 0.124 0.375 151.48 203.37 0.074 0.375 PNB 0.060 0.178 0.326 197.25 83.15 0.145 0.326
DenaB 0.078 0.193 0.319 147.85 65.36 0.096 0.319
PSB 0.079 0.115 0.268 46.70 132.50 0.058 0.268 UBI 0.051 0.149 0.492 191.96 230.95 0.090 0.492
AB 0.026 0.204 0.512 694.51 151.41 0.102 0.512
IOB 0.029 0.211 0.499 617.99 136.91 0.105 0.499
OBC 0.080 0.235 0.549 193.27 133.30 0.129 0.549
CBI 0.004 0.089 0.329 2100.22 269.66 0.074 0.329 FB 0.087 0.174 0.267 99.65 53.45 0.117 0.167
JKB 0.089 0.243 0.289 173.08 18.95 0.124 0.289
INGVB 0.082 0.253 0.623 207.89 145.95 0.127 0.623 KB 0.061 0.197 0.323 225.75 63.80 0.099 0.323
SIB 0.000 0.230 0.385 0.00 67.13 0.115 0.385 Axis 0.243 0.345 0.455 42.12 31.92 0.268 0.455 ICICI 0.265 0.355 0.444 34.13 25.10 0.228 0.444 HDFC 0.223 0.332 0.387 49.07 16.53 0.256 0.387
IIB 0.275 0.369 0.342 34.17 -7.31 0.406 0.294
KMB 0.000 0.393 0.302 0.00 -23.07 0.196 0.302 SCB 0.189 0.490 0.214 159.46 -56.40 0.340 0.214 RBS 0.734 0.716 1.000 -2.40 39.58 0.358 1.000 DB 0.743 0.810 0.206 8.90 -74.50 0.825 0.206
HSBC 0.398 0.650 0.291 63.16 -55.18 0.558 0.291
Citib 0.666 0.780 0.311 17.19 -60.12 0.664 0.311 Source: Computed by the researcher Note: * indicates significant values at 5% level of significance
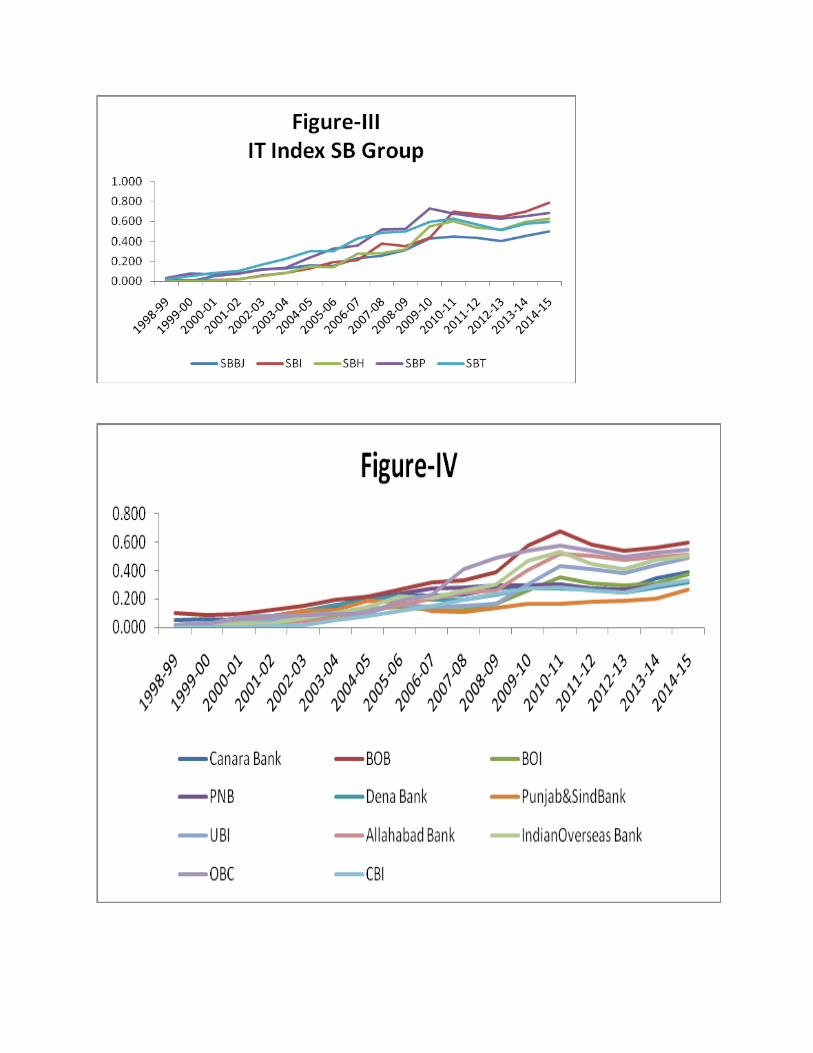

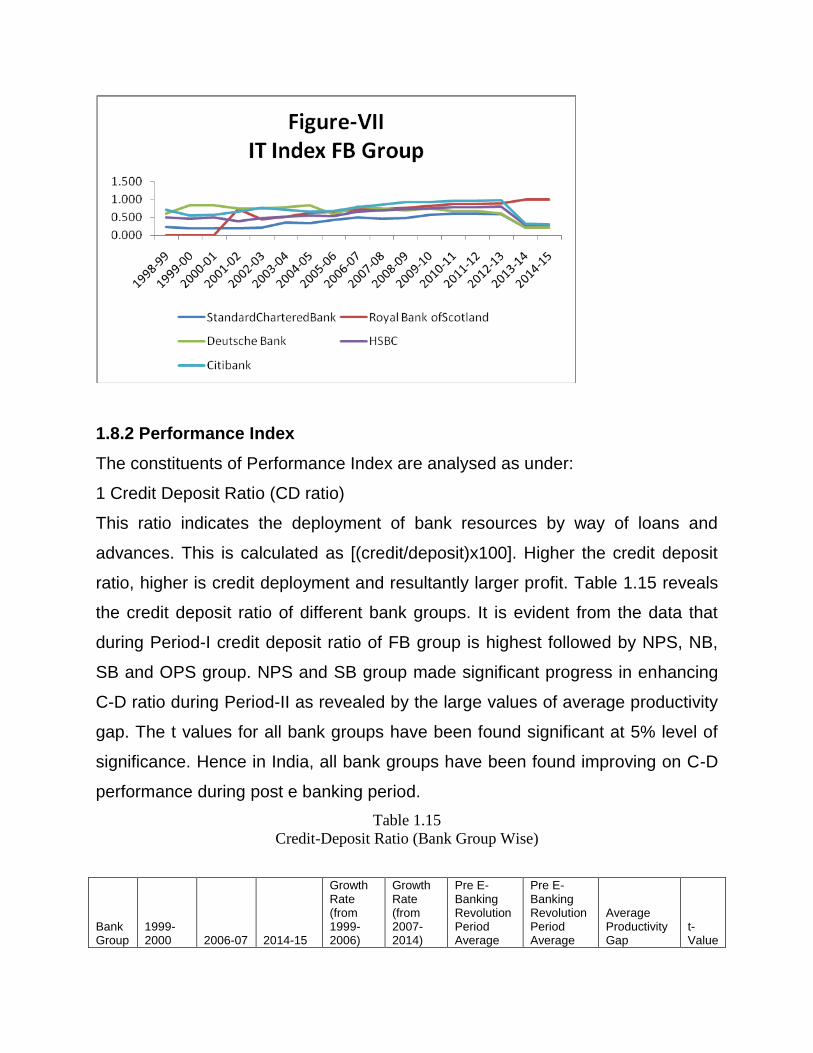
1.8.2 Performance Index
The constituents of Performance Index are analysed as under:
1 Credit Deposit Ratio (CD ratio)
This ratio indicates the deployment of bank resources by way of loans and
advances. This is calculated as [(credit/deposit)x100]. Higher the credit deposit
ratio, higher is credit deployment and resultantly larger profit. Table 1.15 reveals
the credit deposit ratio of different bank groups. It is evident from the data that
during Period-I credit deposit ratio of FB group is highest followed by NPS, NB,
SB and OPS group. NPS and SB group made significant progress in enhancing
C-D ratio during Period-II as revealed by the large values of average productivity
gap. The t values for all bank groups have been found significant at 5% level of
significance. Hence in India, all bank groups have been found improving on C-D
performance during post e banking period.
Table 1.15 Credit-Deposit Ratio (Bank Group Wise)
Bank Group
1999-2000 2006-07 2014-15
Growth Rate (from 1999-2006)
Growth Rate (from 2007-2014)
Pre E-Banking Revolution Period Average
Pre E-Banking Revolution Period Average
Average Productivity Gap
t- Value

% % (1999-2006)
(2007-2014)
NB 45.83 54.93 73.77 19.86 34.30 56.14 73.48 17.35 -
5.73*
SBI 44.32 58.03 82.02 30.93 41.34 54.96 80.21 25.26 -
7.72*
OPS 39.02 60.08 76.11 53.97 26.68 51.45 71.29 19.84 -
19.1*
NPS 45.37 75.14 86.36 65.62 14.93 64.08 81.69 17.61 -
6.16*
FB 70.00 83.81 80.86 19.73 -3.52 73.21 81.17 7.96 -
2.04* Source: Computed by the researcher Note: * indicates significant values at 5% level of significance
Table 1.16 reveals the comparative performance of individual banks under study.
In period-I, 4 foreign banks, 2 each from SB and NPS group and 1 each from
OPS and NB group are among the top 10 rank holders. State bank group shows
above average performance as 4 out of 5 SB group banks are among top 10 in
Period-II followed by 3 each from FB and NPS group. However, the significant t
values again reveal the comparatively improved credit- deposit ratio for all banks
during Period-II.
Table 1.16 Credit- Deposit Ratio (Bank Wise)
Name of
Bank 1999-2000 2006-07 2014-15
Growth rate
(1999-2006)
Growth rate
(2007-2014)
Average
(1998-2006)
Average
(2007-
2014)
Average
Productivity
Gap
t value
SBBJ 58.05 73.28 82.56 26.24 12.66 57.55 77.09 19.54 -6.56* SBI 56.38 62.88 82.45 11.53 31.12 54.43 64.60 10.18 -6.18* SBH 64.58 69.98 80.71 8.36 15.33 56.09 77.08 20.99 -9.49* SBP 66.57 70.27 84.83 5.56 20.72 61.43 81.32 19.89 -7.96* SBT 67.43 69.96 75.45 3.75 7.85 62.10 88.56 26.46 -6.27* CB 46.55 54.02 69.65 16.05 28.93 52.71 71.47 18.76 -6.75*
BOB 47.27 54.88 69.32 16.10 26.31 53.11 71.51 18.40 -8.68* BOI 54.75 59.02 75.58 7.80 28.06 62.28 73.95 11.67 -4.78* PNB 46.71 62.35 75.9 33.48 21.73 52.34 73.83 21.49 -15.84*
DenaB 54.22 60.24 68.08 11.10 13.01 52.74 68.26 15.52 -10.23* PSB 43.17 53.81 73.66 24.65 36.89 45.06 68.19 23.13 -17.42* UBI 40.19 56.71 80.68 41.10 42.27 54.09 72.05 17.97 -5.37* AB 45.03 60.1 77.49 33.47 28.94 48.66 69.53 20.87 -19.94* IOB 46.17 56.94 69.81 23.33 22.60 50.69 71.33 20.64 -6.70* OBC 45.87 57.7 71.2 25.79 23.40 47.93 69.78 21.85 -7.73* CBI 41.76 56.38 73.75 35.01 30.81 44.58 66.04 21.46 -29.44* FB 62.34 65.64 72.41 5.29 10.31 60.59 72.96 12.36 -6.51* JKB 45.79 59.55 67.8 30.05 13.85 48.77 64.17 15.39 -5.19*
INGVB 0 76.73 86.49 0.00 12.72 36.78 73.75 36.97 -2.74* KB 53.35 58.84 68.86 10.29 17.03 51.94 62.83 10.89 -7.93* SIB 53.31 60.11 72.03 12.76 19.83 55.47 68.37 12.90 -7.40* Axis 71.36 55.63 87.17 -22.04 56.70 53.64 72.95 19.31 -3.94*

ICICI 34.74 88.54 107.18 154.86 21.05 76.33 93.02 16.69 -0.87 HDFC 48.06 62.84 81.09 30.75 29.04 49.87 72.93 23.06 -6.66*
IIB 53.05 62.04 92.79 16.95 49.56 61.11 75.33 14.23 -5.47* KMB 0 96.68 88.38 0.00 -8.59 26.35 92.18 65.83 -3.73* SCB 63.16 84.6 93.9 33.95 10.99 82.23 88.44 6.21 -0.97 RBS 110.37 127.05 106.07 15.11 -16.51 111.47 94.62 -16.85 2.20* DB 76.83 58.95 93.54 -23.27 58.68 77.82 82.97 5.16 -0.75
HSBC 43.77 67.37 88.09 53.92 30.76 59.46 56.11 -3.35 0.55 Citib 52.97 87.61 68.49 65.40 -21.82 71.04 73.21 2.17 -0.18
Source: Computed by the researcher Note: * indicates significant values at 5% level of significance
2. Business per Branch
Business per branch is arrived at by dividing the total business with number of
branches and it includes the sum of deposits and advance which is also called
turnover. This ratio is taken into consideration for the purpose of evaluation of
efficiency of each bank at the bank group/ bank level. Higher the ratio more is
business per branch and thereby greater efficiency per branch. Business per
branch also measures branch productivity. Table 1.17 highlights the business per
branch of Indian bank groups to judge branch level productivity. FB group
outperforms all others both in Period-I and Period-II with Rs. 65523 lacs and Rs.
151490 lacs respectively. However keeping in view the low number of branches
of FB group these figures are an indication of highly concentrated business. The
ranking of all other bank groups also remain same during pre and post e banking
periods. The performance of NB group is also admirable during Period-II as
reflected in a large value of average productivity gap. This gap was found lowest
in NPS group which is further supported by the insignificant t value of this group.
The t values of all other groups have been found significant at 5 percent level of
significance.
Table 1.17 Business Per Branch ( Bank Group Wise)
(in Rs. Lacs)
Bank Group
1999-2000 2006-07 2014-15
Growth Rate (from 1999-2006) %
Growth Rate (from 2007-2014) %
Pre E-Banking Revolution Period Average (1999-
Pre E-Banking Revolution Period Average (2007-
Average Productivity Gap
t- Value
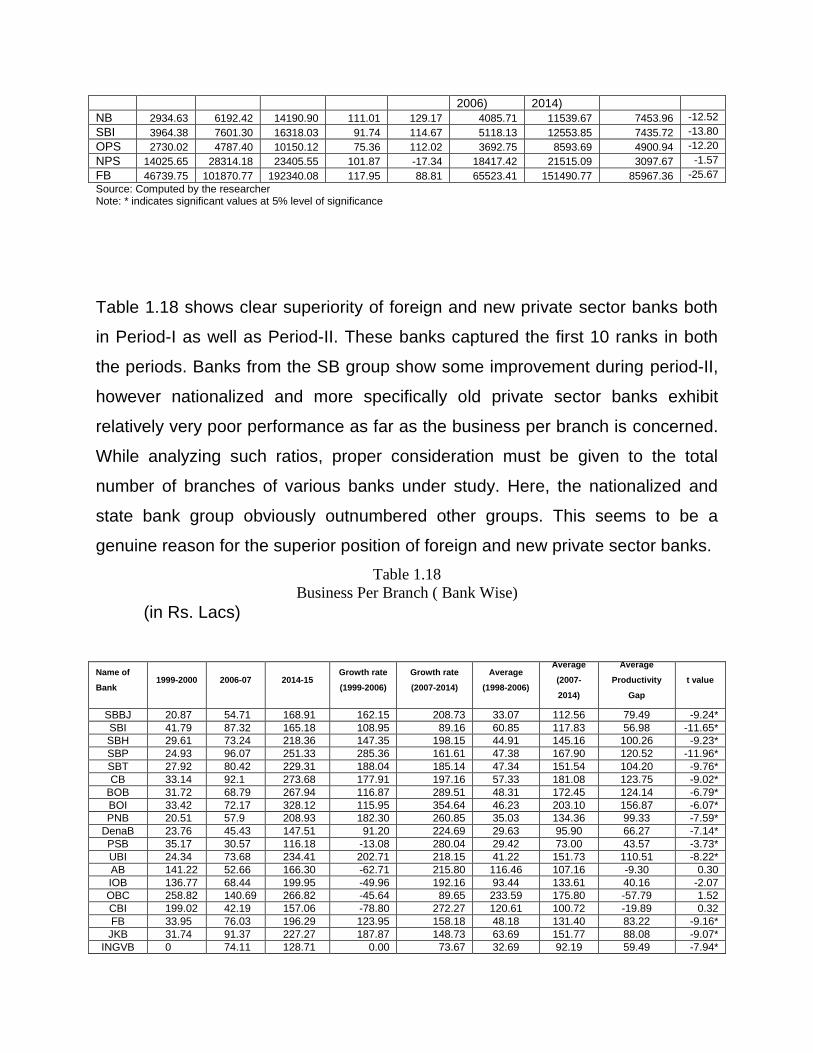
2006) 2014) NB 2934.63 6192.42 14190.90 111.01 129.17 4085.71 11539.67 7453.96 -12.52
SBI 3964.38 7601.30 16318.03 91.74 114.67 5118.13 12553.85 7435.72 -13.80
OPS 2730.02 4787.40 10150.12 75.36 112.02 3692.75 8593.69 4900.94 -12.20
NPS 14025.65 28314.18 23405.55 101.87 -17.34 18417.42 21515.09 3097.67 -1.57
FB 46739.75 101870.77 192340.08 117.95 88.81 65523.41 151490.77 85967.36 -25.67 Source: Computed by the researcher Note: * indicates significant values at 5% level of significance
Table 1.18 shows clear superiority of foreign and new private sector banks both
in Period-I as well as Period-II. These banks captured the first 10 ranks in both
the periods. Banks from the SB group show some improvement during period-II,
however nationalized and more specifically old private sector banks exhibit
relatively very poor performance as far as the business per branch is concerned.
While analyzing such ratios, proper consideration must be given to the total
number of branches of various banks under study. Here, the nationalized and
state bank group obviously outnumbered other groups. This seems to be a
genuine reason for the superior position of foreign and new private sector banks.
Table 1.18 Business Per Branch ( Bank Wise)
(in Rs. Lacs)
Name of
Bank 1999-2000 2006-07 2014-15
Growth rate
(1999-2006)
Growth rate
(2007-2014)
Average
(1998-2006)
Average
(2007-
2014)
Average
Productivity
Gap
t value
SBBJ 20.87 54.71 168.91 162.15 208.73 33.07 112.56 79.49 -9.24* SBI 41.79 87.32 165.18 108.95 89.16 60.85 117.83 56.98 -11.65* SBH 29.61 73.24 218.36 147.35 198.15 44.91 145.16 100.26 -9.23* SBP 24.93 96.07 251.33 285.36 161.61 47.38 167.90 120.52 -11.96* SBT 27.92 80.42 229.31 188.04 185.14 47.34 151.54 104.20 -9.76* CB 33.14 92.1 273.68 177.91 197.16 57.33 181.08 123.75 -9.02*
BOB 31.72 68.79 267.94 116.87 289.51 48.31 172.45 124.14 -6.79* BOI 33.42 72.17 328.12 115.95 354.64 46.23 203.10 156.87 -6.07* PNB 20.51 57.9 208.93 182.30 260.85 35.03 134.36 99.33 -7.59*
DenaB 23.76 45.43 147.51 91.20 224.69 29.63 95.90 66.27 -7.14* PSB 35.17 30.57 116.18 -13.08 280.04 29.42 73.00 43.57 -3.73* UBI 24.34 73.68 234.41 202.71 218.15 41.22 151.73 110.51 -8.22* AB 141.22 52.66 166.30 -62.71 215.80 116.46 107.16 -9.30 0.30 IOB 136.77 68.44 199.95 -49.96 192.16 93.44 133.61 40.16 -2.07 OBC 258.82 140.69 266.82 -45.64 89.65 233.59 175.80 -57.79 1.52 CBI 199.02 42.19 157.06 -78.80 272.27 120.61 100.72 -19.89 0.32 FB 33.95 76.03 196.29 123.95 158.18 48.18 131.40 83.22 -9.16* JKB 31.74 91.37 227.27 187.87 148.73 63.69 151.77 88.08 -9.07*
INGVB 0 74.11 128.71 0.00 73.67 32.69 92.19 59.49 -7.94*
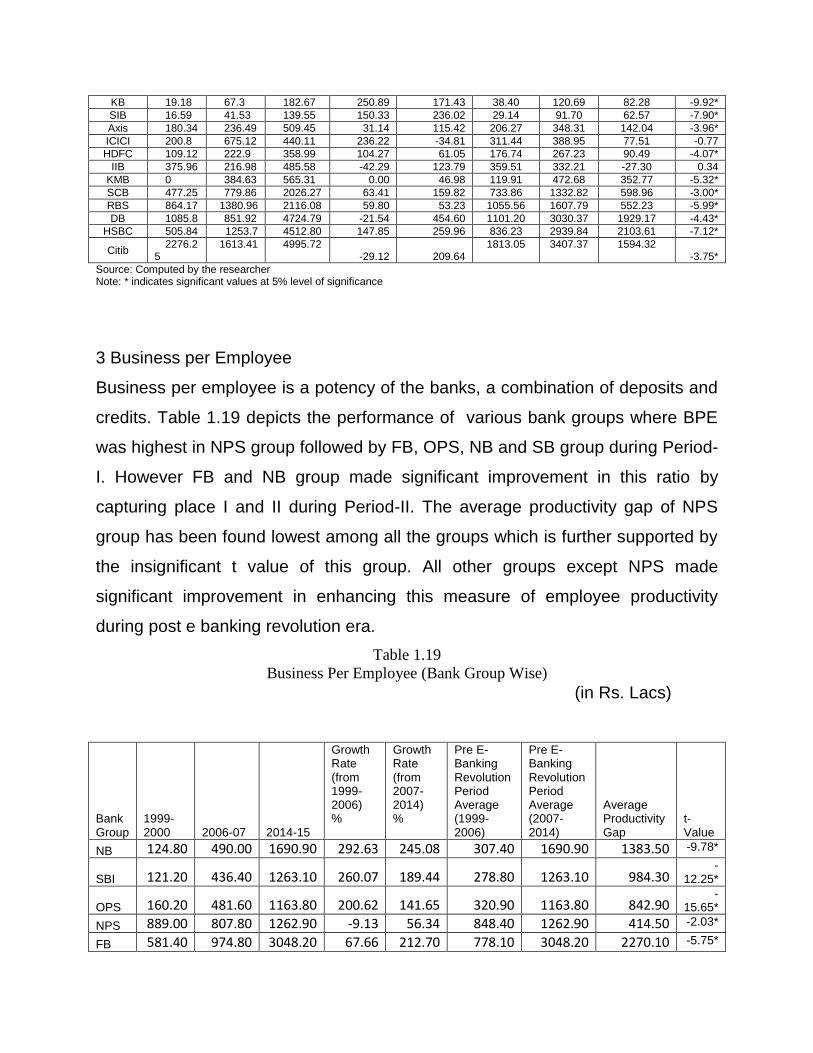
KB 19.18 67.3 182.67 250.89 171.43 38.40 120.69 82.28 -9.92* SIB 16.59 41.53 139.55 150.33 236.02 29.14 91.70 62.57 -7.90* Axis 180.34 236.49 509.45 31.14 115.42 206.27 348.31 142.04 -3.96* ICICI 200.8 675.12 440.11 236.22 -34.81 311.44 388.95 77.51 -0.77 HDFC 109.12 222.9 358.99 104.27 61.05 176.74 267.23 90.49 -4.07*
IIB 375.96 216.98 485.58 -42.29 123.79 359.51 332.21 -27.30 0.34 KMB 0 384.63 565.31 0.00 46.98 119.91 472.68 352.77 -5.32* SCB 477.25 779.86 2026.27 63.41 159.82 733.86 1332.82 598.96 -3.00* RBS 864.17 1380.96 2116.08 59.80 53.23 1055.56 1607.79 552.23 -5.99* DB 1085.8 851.92 4724.79 -21.54 454.60 1101.20 3030.37 1929.17 -4.43*
HSBC 505.84 1253.7 4512.80 147.85 259.96 836.23 2939.84 2103.61 -7.12*
Citib 2276.2
5 1613.41 4995.72
-29.12 209.64 1813.05 3407.37 1594.32
-3.75* Source: Computed by the researcher Note: * indicates significant values at 5% level of significance
3 Business per Employee
Business per employee is a potency of the banks, a combination of deposits and
credits. Table 1.19 depicts the performance of various bank groups where BPE
was highest in NPS group followed by FB, OPS, NB and SB group during Period-
I. However FB and NB group made significant improvement in this ratio by
capturing place I and II during Period-II. The average productivity gap of NPS
group has been found lowest among all the groups which is further supported by
the insignificant t value of this group. All other groups except NPS made
significant improvement in enhancing this measure of employee productivity
during post e banking revolution era.
Table 1.19 Business Per Employee (Bank Group Wise)
(in Rs. Lacs)
Bank Group
1999-2000 2006-07 2014-15
Growth Rate (from 1999-2006) %
Growth Rate (from 2007-2014) %
Pre E-Banking Revolution Period Average (1999-2006)
Pre E-Banking Revolution Period Average (2007-2014)
Average Productivity Gap
t- Value
NB 124.80 490.00 1690.90 292.63 245.08 307.40 1690.90 1383.50 -9.78*
SBI 121.20 436.40 1263.10 260.07 189.44 278.80 1263.10 984.30 -
12.25*
OPS 160.20 481.60 1163.80 200.62 141.65 320.90 1163.80 842.90 -
15.65*
NPS 889.00 807.80 1262.90 -9.13 56.34 848.40 1262.90 414.50 -2.03*
FB 581.40 974.80 3048.20 67.66 212.70 778.10 3048.20 2270.10 -5.75*
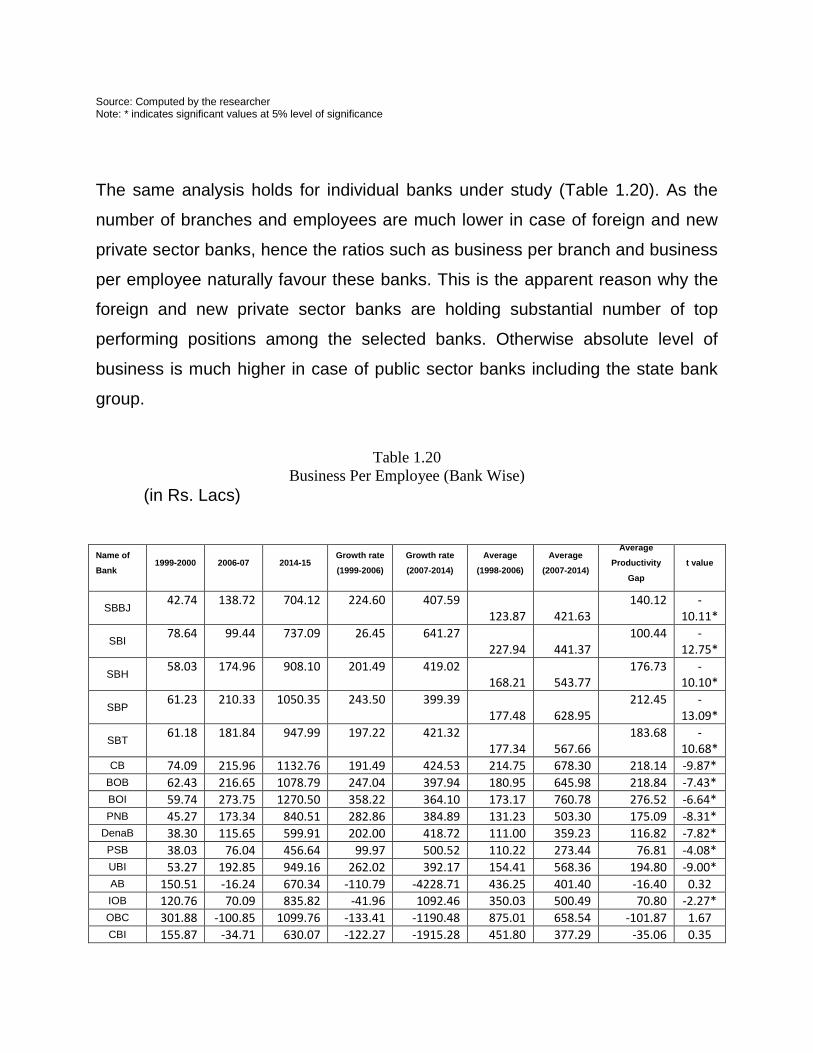
Source: Computed by the researcher Note: * indicates significant values at 5% level of significance
The same analysis holds for individual banks under study (Table 1.20). As the
number of branches and employees are much lower in case of foreign and new
private sector banks, hence the ratios such as business per branch and business
per employee naturally favour these banks. This is the apparent reason why the
foreign and new private sector banks are holding substantial number of top
performing positions among the selected banks. Otherwise absolute level of
business is much higher in case of public sector banks including the state bank
group.
Table 1.20 Business Per Employee (Bank Wise)
(in Rs. Lacs)
Name of
Bank 1999-2000 2006-07 2014-15
Growth rate
(1999-2006)
Growth rate
(2007-2014)
Average
(1998-2006)
Average
(2007-2014)
Average
Productivity
Gap
t value
SBBJ 42.74 138.72 704.12 224.60 407.59
123.87 421.63 140.12 -
10.11*
SBI 78.64 99.44 737.09 26.45 641.27
227.94 441.37 100.44 -
12.75*
SBH 58.03 174.96 908.10 201.49 419.02
168.21 543.77 176.73 -
10.10*
SBP 61.23 210.33 1050.35 243.50 399.39
177.48 628.95 212.45 -
13.09*
SBT 61.18 181.84 947.99 197.22 421.32
177.34 567.66 183.68 -
10.68* CB 74.09 215.96 1132.76 191.49 424.53 214.75 678.30 218.14 -9.87*
BOB 62.43 216.65 1078.79 247.04 397.94 180.95 645.98 218.84 -7.43* BOI 59.74 273.75 1270.50 358.22 364.10 173.17 760.78 276.52 -6.64* PNB 45.27 173.34 840.51 282.86 384.89 131.23 503.30 175.09 -8.31*
DenaB 38.30 115.65 599.91 202.00 418.72 111.00 359.23 116.82 -7.82* PSB 38.03 76.04 456.64 99.97 500.52 110.22 273.44 76.81 -4.08* UBI 53.27 192.85 949.16 262.02 392.17 154.41 568.36 194.80 -9.00* AB 150.51 -16.24 670.34 -110.79 -4228.71 436.25 401.40 -16.40 0.32 IOB 120.76 70.09 835.82 -41.96 1092.46 350.03 500.49 70.80 -2.27* OBC 301.88 -100.85 1099.76 -133.41 -1190.48 875.01 658.54 -101.87 1.67 CBI 155.87 -34.71 630.07 -122.27 -1915.28 451.80 377.29 -35.06 0.35

FB 62.26 145.23 821.99 133.26 465.98
180.47 492.21 146.70 -
10.02* JKB 82.30 153.72 949.41 86.77 517.63 238.56 568.51 155.27 -9.92*
INGVB 42.25 103.82 576.68 145.74 455.46 122.46 345.32 104.87 -8.69*
KB 49.63 143.59 754.97 189.31 425.79
143.86 452.08 145.04 -
10.85* SIB 37.66 109.19 573.66 189.95 425.39 109.15 343.51 110.29 -8.65* Axis 266.57 247.88 2178.90 -7.01 779.03 772.67 1304.73 250.38 -4.33* ICICI 402.49 135.26 2433.14 -66.39 1698.81 1166.64 1456.97 136.63 -0.85 HDFC 228.41 157.91 1671.69 -30.86 958.60 662.06 1001.01 159.51 -4.45*
IIB 464.60 -47.64 2078.16 -110.25 -4462.34 1346.67 1244.41 -48.12 0.38 KMB 154.96 615.63 2956.92 297.27 380.31 449.17 1770.61 621.85 -5.82* SCB 948.40 1045.27 8337.69 10.21 697.66 2748.98 4992.63 1055.83 -3.28* RBS 1364.14 963.72 10057.74 -29.35 943.64 3954.02 6022.60 973.45 -6.55* DB 1423.12 3366.68 18956.94 136.57 463.07 4124.98 11351.46 3400.69 -4.85*
HSBC 1080.69 3671.11 18390.62 239.70 400.96 3132.44 11012.35 3708.19 -7.79* Citib 2343.07 2782.33 21315.33 18.75 666.10 6791.51 12763.67 2810.43 -4.10*
Source: Computed by the researcher Note: * indicates significant values at 5% level of significance
4 Profit per Employee
Profit per employee is one of the basic indicators to measure the performance of
a bank group as it is both a profitability and efficiency indicator. Wage bill of the
employees form an important part of expenses of the banks. Banks which have
invested heavily in technology may have a well paid small but highly efficient
work force than that of those who are over staffed. A higher ratio indicates more
profit per employee which means greater efficiency of employee. Profit per
employee of commercial bank groups in India is given in table 1.21. It is seen
that during period-I as well as Period-II FB and NPS group were at position 1 and
2. SB group lost its 3rd place in Period-I and fell down to last place during Period-
II. It is due to slow growth of profits as well as huge recruitment drive of this
group during this period. The first rank of FB group more particularly in Period-II
may be attributed to the smaller work force as compared to other bank groups.
Table 1.21 Profit Per Employee (Bank Group Wise)
(in Rs. Lacs)
Bank Group
1999-2000 2006-07 2014-15
Growth Rate
Growth Rate
Pre E-Banking
Pre E-Banking
Average Productivity
t- Value
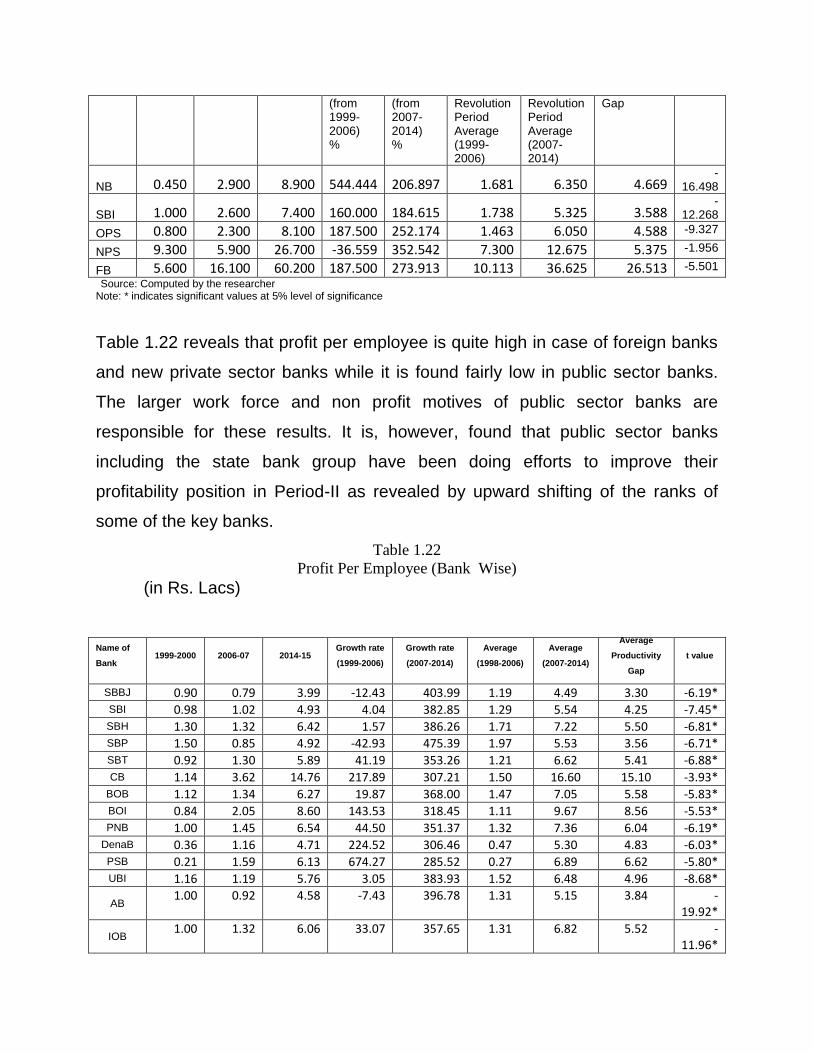
(from 1999-2006) %
(from 2007-2014) %
Revolution Period Average (1999-2006)
Revolution Period Average (2007-2014)
Gap
NB 0.450 2.900 8.900 544.444 206.897 1.681 6.350 4.669 -
16.498
SBI 1.000 2.600 7.400 160.000 184.615 1.738 5.325 3.588 -
12.268
OPS 0.800 2.300 8.100 187.500 252.174 1.463 6.050 4.588 -9.327
NPS 9.300 5.900 26.700 -36.559 352.542 7.300 12.675 5.375 -1.956
FB 5.600 16.100 60.200 187.500 273.913 10.113 36.625 26.513 -5.501
Source: Computed by the researcher Note: * indicates significant values at 5% level of significance
Table 1.22 reveals that profit per employee is quite high in case of foreign banks
and new private sector banks while it is found fairly low in public sector banks.
The larger work force and non profit motives of public sector banks are
responsible for these results. It is, however, found that public sector banks
including the state bank group have been doing efforts to improve their
profitability position in Period-II as revealed by upward shifting of the ranks of
some of the key banks.
Table 1.22 Profit Per Employee (Bank Wise)
(in Rs. Lacs)
Name of
Bank 1999-2000 2006-07 2014-15
Growth rate
(1999-2006)
Growth rate
(2007-2014)
Average
(1998-2006)
Average
(2007-2014)
Average
Productivity
Gap
t value
SBBJ 0.90 0.79 3.99 -12.43 403.99 1.19 4.49 3.30 -6.19* SBI 0.98 1.02 4.93 4.04 382.85 1.29 5.54 4.25 -7.45* SBH 1.30 1.32 6.42 1.57 386.26 1.71 7.22 5.50 -6.81* SBP 1.50 0.85 4.92 -42.93 475.39 1.97 5.53 3.56 -6.71* SBT 0.92 1.30 5.89 41.19 353.26 1.21 6.62 5.41 -6.88* CB 1.14 3.62 14.76 217.89 307.21 1.50 16.60 15.10 -3.93*
BOB 1.12 1.34 6.27 19.87 368.00 1.47 7.05 5.58 -5.83* BOI 0.84 2.05 8.60 143.53 318.45 1.11 9.67 8.56 -5.53* PNB 1.00 1.45 6.54 44.50 351.37 1.32 7.36 6.04 -6.19*
DenaB 0.36 1.16 4.71 224.52 306.46 0.47 5.30 4.83 -6.03* PSB 0.21 1.59 6.13 674.27 285.52 0.27 6.89 6.62 -5.80* UBI 1.16 1.19 5.76 3.05 383.93 1.52 6.48 4.96 -8.68*
AB 1.00 0.92 4.58 -7.43 396.78 1.31 5.15 3.84 -
19.92*
IOB 1.00 1.32 6.06 33.07 357.65 1.31 6.82 5.52 -
11.96*

OBC 2.20 1.00 6.26 -54.65 528.37 2.89 7.04 4.15 -4.97* CBI 0.46 0.39 1.97 -14.74 407.61 0.60 2.22 1.62 -6.49* FB 1.09 2.01 8.73 85.28 333.55 1.43 9.82 8.39 -6.84* JKB 2.15 1.21 7.01 -43.65 478.73 2.83 7.89 5.05 -3.97*
INGVB 0.32 0.88 3.64 176.69 312.69 0.42 4.10 3.68 -
5.12**
KB 1.71 1.02 5.77 -40.49 466.98 2.25 6.49 4.24 -
10.19* SIB 0.87 0.57 3.13 -34.07 447.84 1.14 3.52 2.38 -5.11* Axis 5.32 1.22 10.76 -76.99 778.83 7.00 12.10 5.10 -2.77* ICICI 6.22 2.47 16.41 -60.31 565.16 8.18 18.46 10.28 -4.33* HDFC 5.89 -0.38 5.50 -106.40 -1560.43 7.75 6.19 -1.57 1.51
IIB 8.26 -1.22 5.16 -114.73 -523.75 10.87 5.80 -5.07 1.59 KMB 1.22 0.90 4.77 -25.59 427.62 1.60 5.37 3.77 -4.84* SCB 9.96 5.84 33.28 -41.42 470.09 13.11 37.43 24.32 -3.89* RBS 10.12 -2.99 0.77 -129.52 -125.88 13.32 0.87 -12.45 6.47* DB 19.67 5.76 44.35 -70.72 670.00 25.88 49.89 24.00 -2.22*
HSBC 4.83 4.52 22.39 -6.31 395.27 6.35 25.19 18.84 -6.38* Citib 14.52 4.69 34.36 -67.71 632.68 19.11 38.65 19.54 -4.94*
Source: Computed by the researcher Note: * indicates significant values at 5% level of significance
5. NIM to total assets
The net Interest margin can be expressed as a performance metric that
examines the success of a firm’s investment decisions as contrasted to its debt
situations. A negative Net Interest Margin indicates that the firm is unable to
make an optimal decision, as interest expenses are higher than the amount of
returns produced by investments. Table 1.23 contains NIM to total assets ratio of
various bank groups under study.
Table 1.23 NIM to Total Assets (Bank Group Wise)
Bank Group
1999-2000 2006-07 2014-15
Growth Rate (from 1999-2006) %
Growth Rate (from 2007-2014) %
Pre E-Banking Revolution Period Average (1999-2006)
Pre E-Banking Revolution Period Average (2007-2014)
Average Productivity Gap
t- Value
NB 2.34 2.80 2.15 19.66 -23.21 2.95 2.91 -0.05 .295
SBI 2.79 2.79 2.81 0.00 0.72 2.98 2.98 0.00 -.010
OPS 3.02 2.54 2.34 -15.89 -7.87 2.97 2.61 -0.36 2.003
NPS 2.80 2.79 3.37 -0.36 20.79 2.58 3.30 0.72 -3.602

FB 4.27 4.36 3.54 2.11 -18.81 3.84 3.92 0.08 -.466
Source: Computed by the researcher Note: * indicates significant values at 5% level of significance
It reveals that during Period-I FB group was on the top followed by NB, SB and
OPS group as these three groups were fighting neck to neck with almost same
NIM ratio. The situation was no more different during Period-II with the exception
of NPS group performance as this group claimed 2nd rank in this period as
compared to last rank in Period –I. On the other hand, NB and OPS group show
below average performance in Period-II with a negative average productivity gap.
Hence the highlight of Period-II as far as NIM is concerned is NPS group. This
fact is further supported by the only significant t value of NPS group. The same
story is repeated in disaggregate analysis of banks under study (Table 1.24). 3 of
the 5 selected NPS banks claimed a place among top 10 banks in Period-II while
in Period-I no new private sector bank is on the top 10 list. However, the
significant paired t values specifically for public sector banks show the happening
improvement in NIM during Period-II.
Table 1.24 NIM to Total Assets (Bank Wise)
Name of
Bank 1999-2000 2006-07 2014-15
Growth rate
(1999-2006)
Growth rate
(2007-2014)
Average
(1998-2006)
Average
(2007-2014)
Average
Productivity
Gap
t value
SBBJ 2.74 10.84 15.91 296.31 46.73 5.82 22 16.18 -6.19*
SBI 2.96 13.95 19.61 371.10 40.56 6.3 27.12 20.82 -7.45*
SBH 3.94 4.94 11.39 25.54 130.44 8.38 15.76 7.38 -6.81*
SBP 4.54 4.93 12.31 8.50 149.69 9.67 17.03 7.36 -6.71*
SBT 2.79 5.16 9.85 85.10 91.02 5.93 13.63 7.7 -6.88*
CB 3.45 5.63 11.38 63.14 102.20 7.34 15.74 8.4 -3.93*
BOB 3.37 3.23 8.68 -4.30 168.66 7.18 12 4.82 -5.838
BOI 2.54 5.57 9.92 118.97 78.16 5.41 13.72 8.31 -5.53*
PNB 3.04 6.83 12.05 124.52 76.43 6.47 16.66 10.19 -6.19*
DenaB 1.07 7.18 9.39 569.62 30.88 2.28 12.99 10.71 -6.03*
PSB 0.63 8.11 9.71 1196.91 19.77 1.33 13.43 12.1 -5.8*
UBI 3.50 3.59 9.25 2.70 157.70 7.44 12.8 5.36 -8.68*
AB 3.02 6.22 11.37 105.96 82.60
6.43 15.72 9.29 -19.92*

IOB 3.00 5.10 10.12 69.77 98.52
6.39 14 7.61 -11.96*
OBC 6.64 2.81 13.25 -57.73 371.82 14.13 18.32 4.19 -4.97*
CBI 1.38 5.33 7.87 285.48 47.82 2.94 10.89 7.95 -6.49*
FB 3.29 5.56 11.06 69.03 98.92 7 15.3 8.3 -6.84*
JKB 6.52 2.95 13.21 -54.78 348.07 13.87 18.27 4.4 -3.97*
INGVB 0.96 6.91 8.94 616.94 29.37 2.05 12.36 10.31 -5.12*
KB 5.19 6.69 15.20 29.00 127.16
11.04 21.03 9.99 -10.19*
SIB 2.61 7.81 12.45 198.95 59.37 5.56 17.22 11.66 -5.11*
Axis 9.76 4.14 19.48 -57.58 370.58 20.77 26.95 6.18 -2.77*
ICICI 8.90 3.26 17.21 -63.35 427.59 18.94 23.81 4.87 -4.33*
HDFC 6.94 4.36 15.39 -37.17 252.74 14.77 21.28 6.51 1.51
IIB 8.50 0.00 13.08 -100.00 #DIV/0! 18.09 18.09 0 1.59
KMB 3.69 12.37 19.02 235.41 53.72 7.85 26.31 18.47 -4.84*
SCB 8.09 2.56 15.21 -68.38 494.35 17.22 21.04 3.82 -3.89*
RBS 6.05 1.35 10.76 -77.74 698.86 12.87 14.88 2.01 6.47*
DB 7.67 3.10 15.14 -59.53 388.04 16.31 20.94 4.63 -2.22*
HSBC 5.16 4.29 12.57 -16.91 193.04 10.98 17.38 6.4 -6.38*
Citib 9.90 3.89 19.43 -60.69 399.25 21.07 26.88 5.81 -4.94* Source: Computed by the researcher Note: * indicates significant values at 5% level of significance
6. Non interest income to Total Assets
Non-interest income is derived primarily from fees e.g. deposit and transaction
fees, insufficient funds fees, annual fees, monthly account service charges,
inactivity fees, check and deposit slip fees, etc. In recent years, banks have
started to move increasingly into areas that yield non-interest income – into
activities that earn fees rather than interest. It is because of the fact that the
profitability of traditional banking activities has, for a wide variety of reasons,
come under pressure in recent years, hence, fee-earning activities have greatly
increased their contribution to bank profits. Table 1.25 reveals the non – interest
income position of various bank groups in pre and post e banking period. FB
group has been found at the top of the list during pre as well as post e banking
period followed by NPS, SB, NB and OPS group. The average productivity gap of
all the bank groups except NB group turned negative due to the low non interest
income earned during Period-II. The t values of all the bank groups have been
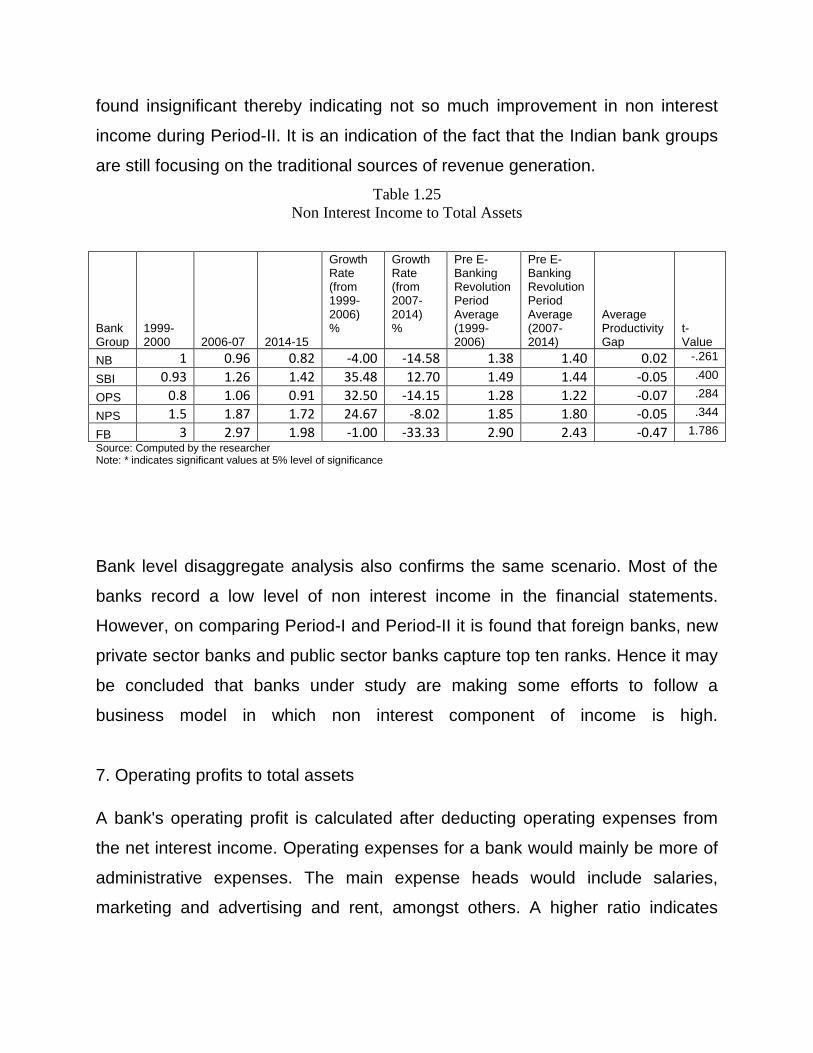
found insignificant thereby indicating not so much improvement in non interest
income during Period-II. It is an indication of the fact that the Indian bank groups
are still focusing on the traditional sources of revenue generation.
Table 1.25 Non Interest Income to Total Assets
Bank Group
1999-2000 2006-07 2014-15
Growth Rate (from 1999-2006) %
Growth Rate (from 2007-2014) %
Pre E-Banking Revolution Period Average (1999-2006)
Pre E-Banking Revolution Period Average (2007-2014)
Average Productivity Gap
t- Value
NB 1 0.96 0.82 -4.00 -14.58 1.38 1.40 0.02 -.261
SBI 0.93 1.26 1.42 35.48 12.70 1.49 1.44 -0.05 .400
OPS 0.8 1.06 0.91 32.50 -14.15 1.28 1.22 -0.07 .284
NPS 1.5 1.87 1.72 24.67 -8.02 1.85 1.80 -0.05 .344
FB 3 2.97 1.98 -1.00 -33.33 2.90 2.43 -0.47 1.786
Source: Computed by the researcher Note: * indicates significant values at 5% level of significance
Bank level disaggregate analysis also confirms the same scenario. Most of the
banks record a low level of non interest income in the financial statements.
However, on comparing Period-I and Period-II it is found that foreign banks, new
private sector banks and public sector banks capture top ten ranks. Hence it may
be concluded that banks under study are making some efforts to follow a
business model in which non interest component of income is high.
7. Operating profits to total assets
A bank's operating profit is calculated after deducting operating expenses from
the net interest income. Operating expenses for a bank would mainly be more of
administrative expenses. The main expense heads would include salaries,
marketing and advertising and rent, amongst others. A higher ratio indicates

higher operating efficiency and vice versa. Table 1.26 contains operating profits
to total assets ratio of various bank groups in India.
Table 1.26 Operating Profits to Total Assets
(in Rs. Lacs)
Bank Group
1999-2000 2006-07 2014-15
Growth Rate (from 1999-2006) %
Growth Rate (from 2007-2014) %
Pre E-Banking Revolution Period Average (1999-2006)
Pre E-Banking Revolution Period Average (2007-2014)
Average Productivity Gap
t- Value
NB 1.24 1.34 1.93 8.06 44.03 2.01 1.93 -0.08 .420
SBI 1.39 1.57 1.96 12.95 24.84 2.14 2.05 -0.10 .636
OPS 1.51 1.91 1.66 26.49 -13.09 1.99 1.88 -0.11 .649
NPS 1.72 2.08 2.86 20.93 37.50 2.19 2.68 0.50 -6.261
FB 3.26 4.06 3.36 24.54 -17.24 3.49 3.80 0.31 -1.127
Source: Computed by the researcher Note: * indicates significant values at 5% level of significance
It has been found that during pre as well as post e banking period NB group was
on the top followed by NPS, SB, NB and OPS group. On an average the
performance of NB, SB and OPS group has been found quite poor as these bank
groups displayed unsatisfactory operating efficiency. FB and NPS group have
been found quite consistent and earning sufficient operating profits during
Period-II. However the NPS group performed even better than FB group as also
revealed by significant t value. The bank level analysis reveals the same picture
with 4 of the 5 foreign banks, 3 new private sector banks and 2 state banks hold
top 10 ranks in Period-I, however in Period-II the number of state bank group
banks increases to 4 which is a good sign for public sector banks. Again the
large assets base together with other than profit motives may be attributed to
low figures of this ratio. Further, significant t values indicate the improved efforts
on the part of public sector banks in Period-II.
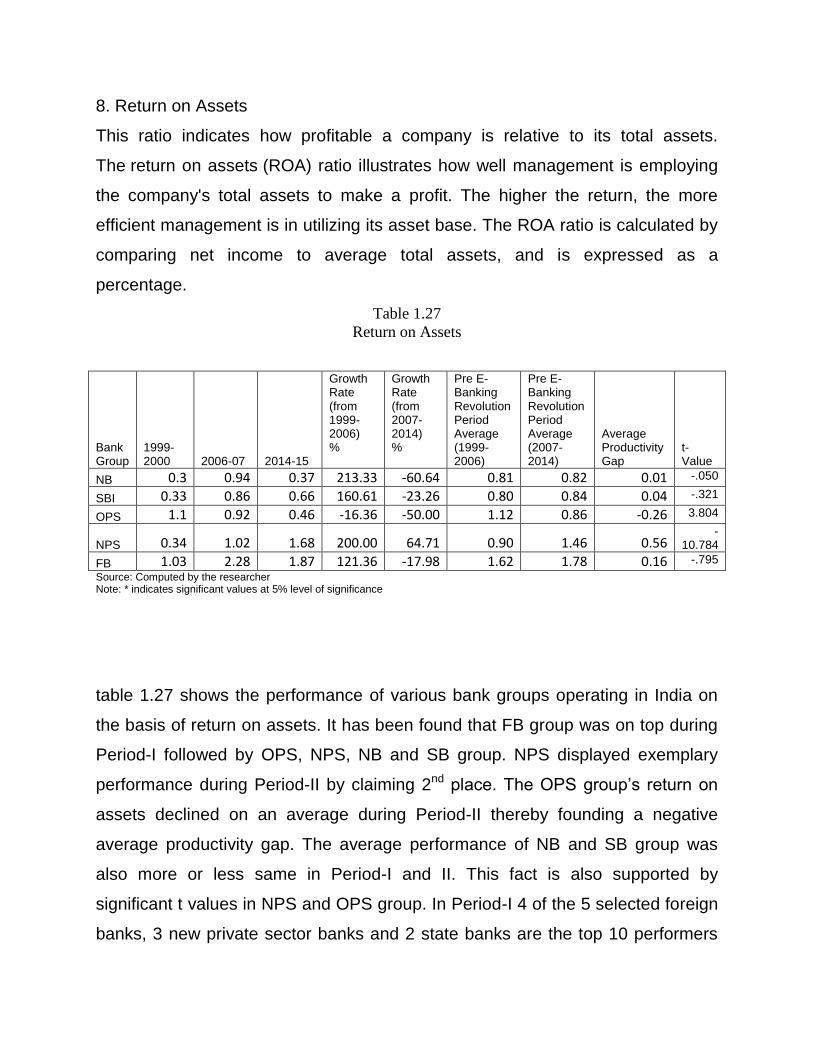
8. Return on Assets
This ratio indicates how profitable a company is relative to its total assets.
The return on assets (ROA) ratio illustrates how well management is employing
the company's total assets to make a profit. The higher the return, the more
efficient management is in utilizing its asset base. The ROA ratio is calculated by
comparing net income to average total assets, and is expressed as a
percentage.
Table 1.27 Return on Assets
Bank Group
1999-2000 2006-07 2014-15
Growth Rate (from 1999-2006) %
Growth Rate (from 2007-2014) %
Pre E-Banking Revolution Period Average (1999-2006)
Pre E-Banking Revolution Period Average (2007-2014)
Average Productivity Gap
t- Value
NB 0.3 0.94 0.37 213.33 -60.64 0.81 0.82 0.01 -.050
SBI 0.33 0.86 0.66 160.61 -23.26 0.80 0.84 0.04 -.321
OPS 1.1 0.92 0.46 -16.36 -50.00 1.12 0.86 -0.26 3.804
NPS 0.34 1.02 1.68 200.00 64.71 0.90 1.46 0.56 -
10.784
FB 1.03 2.28 1.87 121.36 -17.98 1.62 1.78 0.16 -.795
Source: Computed by the researcher Note: * indicates significant values at 5% level of significance
table 1.27 shows the performance of various bank groups operating in India on
the basis of return on assets. It has been found that FB group was on top during
Period-I followed by OPS, NPS, NB and SB group. NPS displayed exemplary
performance during Period-II by claiming 2nd place. The OPS group’s return on
assets declined on an average during Period-II thereby founding a negative
average productivity gap. The average performance of NB and SB group was
also more or less same in Period-I and II. This fact is also supported by
significant t values in NPS and OPS group. In Period-I 4 of the 5 selected foreign
banks, 3 new private sector banks and 2 state banks are the top 10 performers
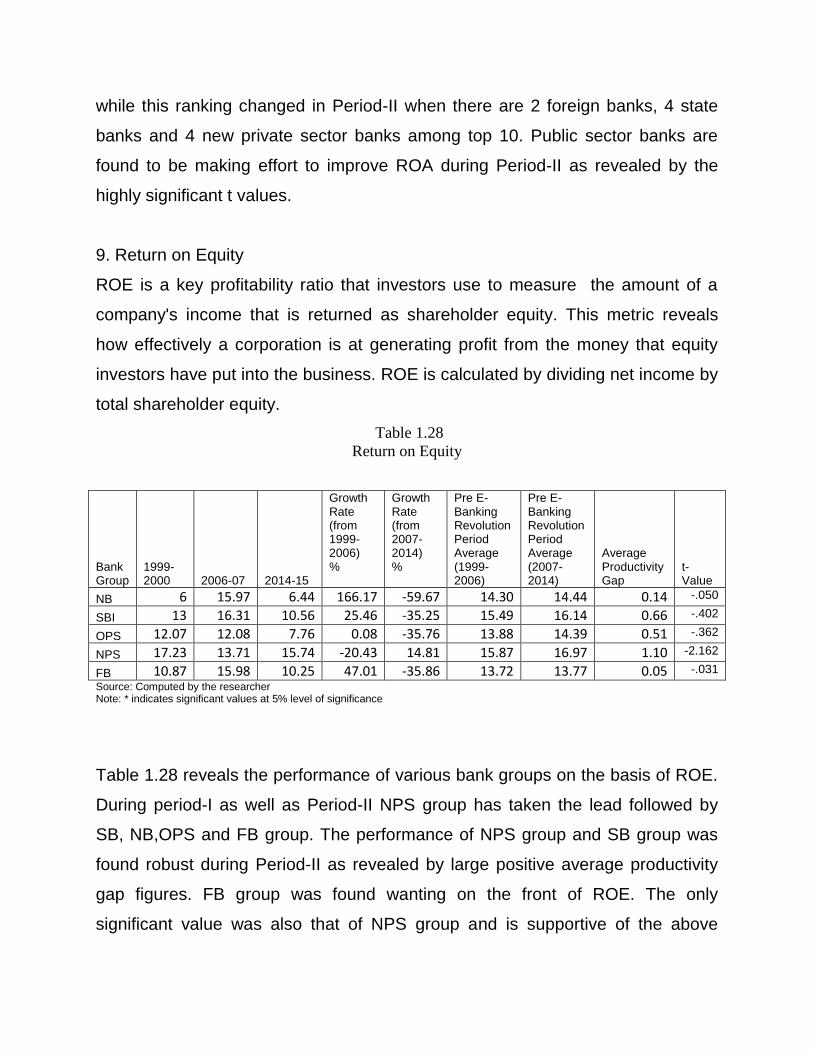
while this ranking changed in Period-II when there are 2 foreign banks, 4 state
banks and 4 new private sector banks among top 10. Public sector banks are
found to be making effort to improve ROA during Period-II as revealed by the
highly significant t values.
9. Return on Equity
ROE is a key profitability ratio that investors use to measure the amount of a
company's income that is returned as shareholder equity. This metric reveals
how effectively a corporation is at generating profit from the money that equity
investors have put into the business. ROE is calculated by dividing net income by
total shareholder equity.
Table 1.28 Return on Equity
Bank Group
1999-2000 2006-07 2014-15
Growth Rate (from 1999-2006) %
Growth Rate (from 2007-2014) %
Pre E-Banking Revolution Period Average (1999-2006)
Pre E-Banking Revolution Period Average (2007-2014)
Average Productivity Gap
t- Value
NB 6 15.97 6.44 166.17 -59.67 14.30 14.44 0.14 -.050
SBI 13 16.31 10.56 25.46 -35.25 15.49 16.14 0.66 -.402
OPS 12.07 12.08 7.76 0.08 -35.76 13.88 14.39 0.51 -.362
NPS 17.23 13.71 15.74 -20.43 14.81 15.87 16.97 1.10 -2.162
FB 10.87 15.98 10.25 47.01 -35.86 13.72 13.77 0.05 -.031
Source: Computed by the researcher Note: * indicates significant values at 5% level of significance
Table 1.28 reveals the performance of various bank groups on the basis of ROE.
During period-I as well as Period-II NPS group has taken the lead followed by
SB, NB,OPS and FB group. The performance of NPS group and SB group was
found robust during Period-II as revealed by large positive average productivity
gap figures. FB group was found wanting on the front of ROE. The only
significant value was also that of NPS group and is supportive of the above
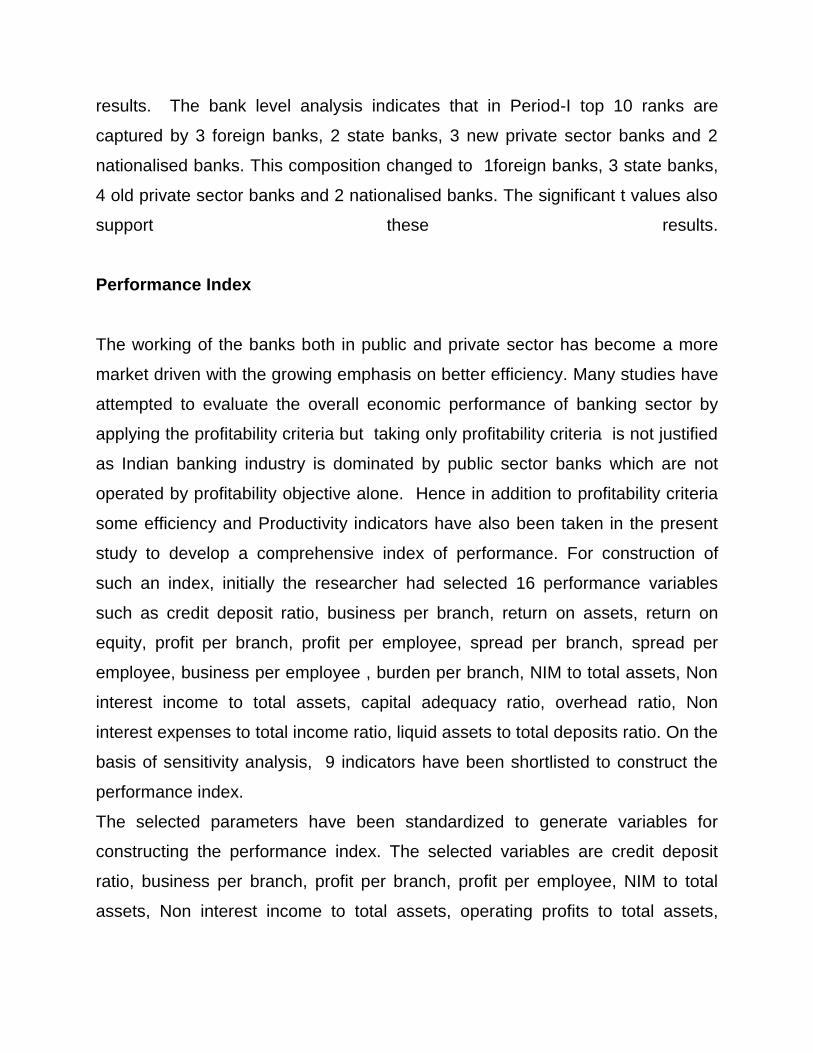
results. The bank level analysis indicates that in Period-I top 10 ranks are
captured by 3 foreign banks, 2 state banks, 3 new private sector banks and 2
nationalised banks. This composition changed to 1foreign banks, 3 state banks,
4 old private sector banks and 2 nationalised banks. The significant t values also
support these results.
Performance Index
The working of the banks both in public and private sector has become a more
market driven with the growing emphasis on better efficiency. Many studies have
attempted to evaluate the overall economic performance of banking sector by
applying the profitability criteria but taking only profitability criteria is not justified
as Indian banking industry is dominated by public sector banks which are not
operated by profitability objective alone. Hence in addition to profitability criteria
some efficiency and Productivity indicators have also been taken in the present
study to develop a comprehensive index of performance. For construction of
such an index, initially the researcher had selected 16 performance variables
such as credit deposit ratio, business per branch, return on assets, return on
equity, profit per branch, profit per employee, spread per branch, spread per
employee, business per employee , burden per branch, NIM to total assets, Non
interest income to total assets, capital adequacy ratio, overhead ratio, Non
interest expenses to total income ratio, liquid assets to total deposits ratio. On the
basis of sensitivity analysis, 9 indicators have been shortlisted to construct the
performance index.
The selected parameters have been standardized to generate variables for
constructing the performance index. The selected variables are credit deposit
ratio, business per branch, profit per branch, profit per employee, NIM to total
assets, Non interest income to total assets, operating profits to total assets,
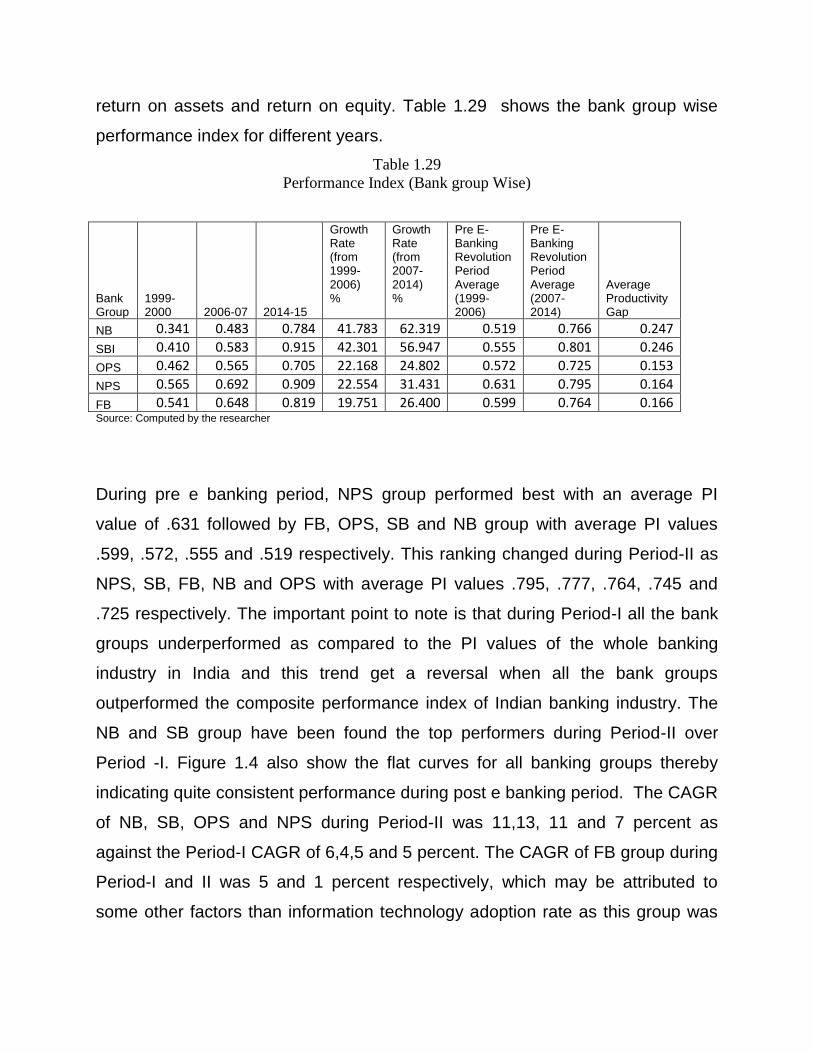
return on assets and return on equity. Table 1.29 shows the bank group wise
performance index for different years.
Table 1.29 Performance Index (Bank group Wise)
Bank Group
1999-2000 2006-07 2014-15
Growth Rate (from 1999-2006) %
Growth Rate (from 2007-2014) %
Pre E-Banking Revolution Period Average (1999-2006)
Pre E-Banking Revolution Period Average (2007-2014)
Average Productivity Gap
NB 0.341 0.483 0.784 41.783 62.319 0.519 0.766 0.247
SBI 0.410 0.583 0.915 42.301 56.947 0.555 0.801 0.246
OPS 0.462 0.565 0.705 22.168 24.802 0.572 0.725 0.153
NPS 0.565 0.692 0.909 22.554 31.431 0.631 0.795 0.164
FB 0.541 0.648 0.819 19.751 26.400 0.599 0.764 0.166 Source: Computed by the researcher
During pre e banking period, NPS group performed best with an average PI
value of .631 followed by FB, OPS, SB and NB group with average PI values
.599, .572, .555 and .519 respectively. This ranking changed during Period-II as
NPS, SB, FB, NB and OPS with average PI values .795, .777, .764, .745 and
.725 respectively. The important point to note is that during Period-I all the bank
groups underperformed as compared to the PI values of the whole banking
industry in India and this trend get a reversal when all the bank groups
outperformed the composite performance index of Indian banking industry. The
NB and SB group have been found the top performers during Period-II over
Period -I. Figure 1.4 also show the flat curves for all banking groups thereby
indicating quite consistent performance during post e banking period. The CAGR
of NB, SB, OPS and NPS during Period-II was 11,13, 11 and 7 percent as
against the Period-I CAGR of 6,4,5 and 5 percent. The CAGR of FB group during
Period-I and II was 5 and 1 percent respectively, which may be attributed to
some other factors than information technology adoption rate as this group was

the early starter in IT adoption. However for the rest of the groups possibly
technology adoption has played a key role in improving the PI figures.
Table 1.30 shows that during period-I, 5 foreign banks and 4 new private sector
banks capture nine positions out of top 10. The scenario did not change much
during period-II. However the charts of performance index of various banks
reveal consistent performance by all during Period-II.
Table 1.30 Performance Index ( Bank Wise)
Name of
Bank 2000-01 2006-07 2014-15
Growth rate
(1999-2006)
Growth rate
(2007-2014)
Average
(1998-2006)
Average
(2007-
2014)
SBBJ 0.107 0.139 0.172 30.104 22.981 0.111 0.175
SBI 0.107 0.132 0.181 23.400 37.068 0.114 0.163
SBH 0.124 0.143 0.181 15.810 26.501 0.120 0.185 SBP 0.127 0.134 0.181 5.715 35.168 0.128 0.189
SBT 0.117 0.136 0.174 16.152 28.232 0.120 0.207 CB 0.090 0.150 0.261 65.942 74.295 0.107 0.237
BOB 0.099 0.135 0.172 36.742 27.205 0.109 0.182
BOI 0.101 0.133 0.194 31.330 45.702 0.115 0.195 PNB 0.089 0.135 0.184 50.743 36.196 0.103 0.185
DenaB 0.104 0.111 0.149 6.253 34.580 0.095 0.158 PSB 0.083 0.103 0.169 23.348 64.450 0.082 0.165 UBI 0.080 0.151 0.175 89.496 16.059 0.109 0.174 AB 0.107 0.140 0.151 31.495 7.698 0.110 0.150 IOB 0.097 0.116 0.162 19.508 39.550 0.109 0.176
OBC 0.154 0.160 0.181 4.134 13.414 0.156 0.184 CBI 0.105 0.102 0.143 -2.849 40.343 0.098 0.138 FB 0.103 0.157 0.189 52.949 20.325 0.118 0.198
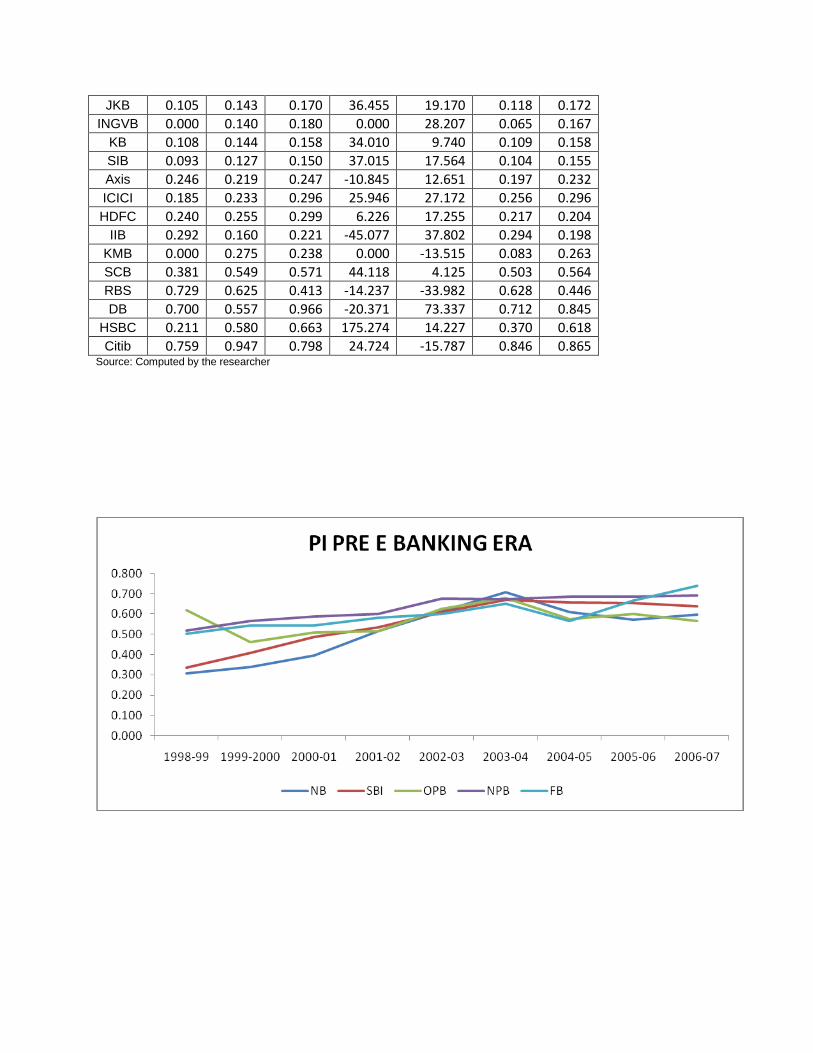
JKB 0.105 0.143 0.170 36.455 19.170 0.118 0.172 INGVB 0.000 0.140 0.180 0.000 28.207 0.065 0.167
KB 0.108 0.144 0.158 34.010 9.740 0.109 0.158
SIB 0.093 0.127 0.150 37.015 17.564 0.104 0.155 Axis 0.246 0.219 0.247 -10.845 12.651 0.197 0.232
ICICI 0.185 0.233 0.296 25.946 27.172 0.256 0.296
HDFC 0.240 0.255 0.299 6.226 17.255 0.217 0.204 IIB 0.292 0.160 0.221 -45.077 37.802 0.294 0.198
KMB 0.000 0.275 0.238 0.000 -13.515 0.083 0.263 SCB 0.381 0.549 0.571 44.118 4.125 0.503 0.564
RBS 0.729 0.625 0.413 -14.237 -33.982 0.628 0.446 DB 0.700 0.557 0.966 -20.371 73.337 0.712 0.845
HSBC 0.211 0.580 0.663 175.274 14.227 0.370 0.618 Citib 0.759 0.947 0.798 24.724 -15.787 0.846 0.865
Source: Computed by the researcher


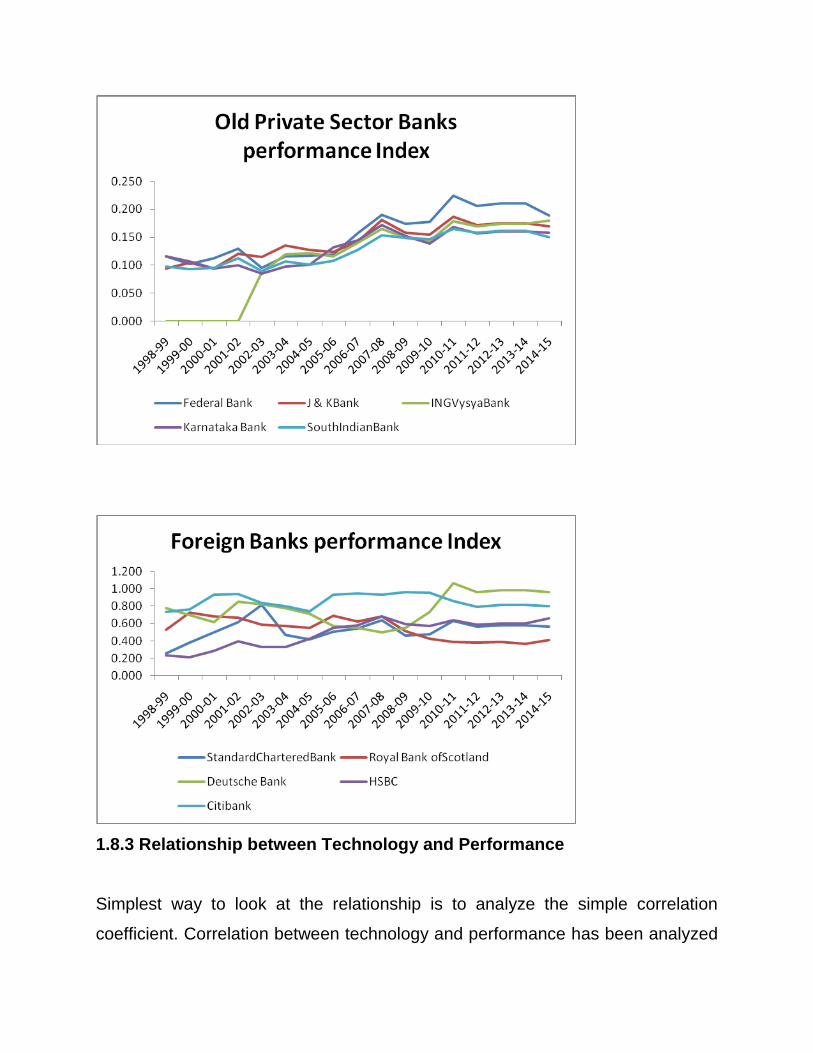
1.8.3 Relationship between Technology and Performance
Simplest way to look at the relationship is to analyze the simple correlation
coefficient. Correlation between technology and performance has been analyzed
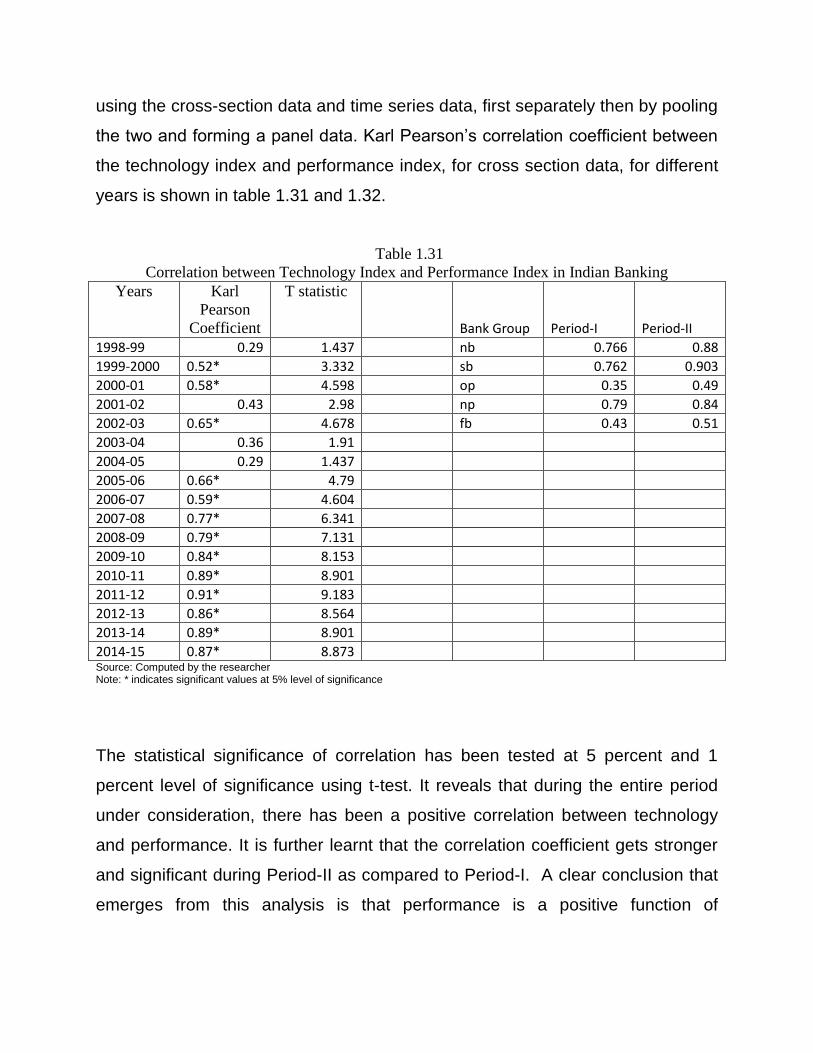
using the cross-section data and time series data, first separately then by pooling
the two and forming a panel data. Karl Pearson’s correlation coefficient between
the technology index and performance index, for cross section data, for different
years is shown in table 1.31 and 1.32.
Table 1.31 Correlation between Technology Index and Performance Index in Indian Banking
Years Karl Pearson
Coefficient
T statistic
Bank Group Period-I Period-II
1998-99 0.29 1.437 nb 0.766 0.88
1999-2000 0.52* 3.332 sb 0.762 0.903
2000-01 0.58* 4.598 op 0.35 0.49
2001-02 0.43 2.98 np 0.79 0.84
2002-03 0.65* 4.678 fb 0.43 0.51
2003-04 0.36 1.91
2004-05 0.29 1.437 2005-06 0.66* 4.79 2006-07 0.59* 4.604 2007-08 0.77* 6.341 2008-09 0.79* 7.131 2009-10 0.84* 8.153 2010-11 0.89* 8.901 2011-12 0.91* 9.183 2012-13 0.86* 8.564 2013-14 0.89* 8.901 2014-15 0.87* 8.873 Source: Computed by the researcher Note: * indicates significant values at 5% level of significance
The statistical significance of correlation has been tested at 5 percent and 1
percent level of significance using t-test. It reveals that during the entire period
under consideration, there has been a positive correlation between technology
and performance. It is further learnt that the correlation coefficient gets stronger
and significant during Period-II as compared to Period-I. A clear conclusion that
emerges from this analysis is that performance is a positive function of

information technology in the Indian banking. That is to say, information
technology is a driving force behind efficiency and performance in the Indian
banking. Using the temporal data, table shows the correlation between
technology index and performance index of all the 5 bank groups.
It is learnt from the table that there is a close relationship of technology index
and performance index for all the bank groups. Again the noteworthy point is the
tendency of stronger correlations in Period-II as compared to Period-I for all the
bank groups. However much stronger correlations between IT and PI have been
found in SB, NB and NPS group. The correlation coefficient was not found
significant in case of OPS and FB group. The correlation is much stronger and
significant for nationalized banks but statistical significance disappears for private
and foreign banks. The logic is that public sector banks have a scale and size
advantage. They stand at advantage so far as market share, size of bank and
experience of the bank is concerned.
Their market share in the total business is large. Their branch network and
customer base is large. These public sector banks are maintaining their
performance (with exception of few banks) and information technology has
undoubtedly contributed to large banks having greater flexibility to adapt to
changes, whereas private banks and foreign banks remained technologically
overcapitalized in relation to performance. They have invested heavily in costly
technological infrastructures. These banks are making IT investments which are
not essential, rather discretionary and irrelevant and they are not exploring
cheaper IT solutions. This excessive investment in technology has negatively
impacted banks’ performance. Moreover, maturity level of technology use has
also hurt the efficiency and performance of private sector banks.
Table 1.32 Bank-wise Correlation between Technology and Performance Index
Code Nameofthebank Correlation t-statistics Significance
1 SBBJ 0.85 5.36 **
2 SBI 0.892 6.55 **

3 SBH 0.747 3.73 **
4 SBP 0.926 8.14 **
5 SBT 0.801 4.44 **
6 CanaraBank 0.777 4.1 **
7 BOB 0.925 8.09 **
8 BOI 0.907 7.13 **
9 PNB 0.883 6.23 **
10 DenaBank 0.676 3.05 **
11 Punjab&SindBank 0.343 1.21 NS
12 UBI 0.76 3.87 **
13 AllahabadBank 0.834 5.02 **
14 IndianOverseasBank 0.898 6.76 **
15 OBC 0.516 2 NS
16 CBI 0.607 2.53 *
17 FederalBank 0.619 2.62 *
18 J&K Bank 0.91 7.28 **
19 INGVysyaBank 0.971 13.38 **
20 KarnatakaBank 0.72 3.44 *
21 SouthIndianBank 0.873 5.93 **
22 UTI/AxisBank 0.384 1.38 NS
23 ICICIBank 0.06 0.2 NS
24 HDFCBank -0.012 0.04 NS
25 IndusIndBank 0.268 0.92 NS
26 KotakMahindraBank 0.958 11.14 **
27 StandardCharteredBank 0.821 4.76 **
28 RoyalBankofScotland -0.008 0.02 NS
29 DeutscheBank 0.33 1.16 NS
30 HSBC 0.95 10.1 **
31 Citibank 0.081 0.27 NS Source: Computed by the researcher
**Significant at 0.01 level; * Significant at 0.05 level; NS Not significant
To better investigate the above preliminary evidences and to gain a deeper
insight into the relationship between technology index and performance index, a
set of regressions has been analyzed. Technology index has been treated as
independent (exogenous) variable and performance index has been treated as
dependent (endogenous) variable. The mathematical representation of
regression equation is written as follows:
Y = a + bX
Where Y is the performance Index; ‘a’ is the intercept; ‘b’ is the regression
coefficient and X is the technology index. Regression coefficient represents the
estimated change in the value of dependent variable, for each unit change in
independent variable values. Following analysis deals with regression analysis at
banking group and individual banks’ level.
Table 1.33
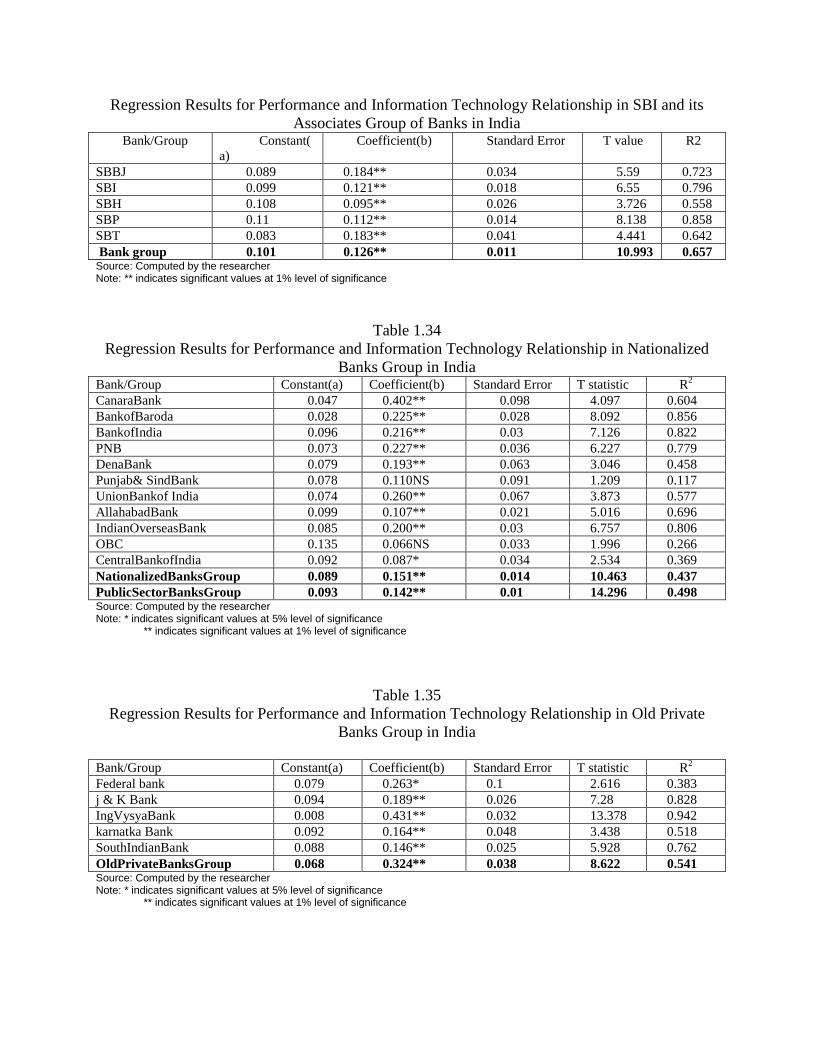
Regression Results for Performance and Information Technology Relationship in SBI and its Associates Group of Banks in India
Bank/Group Constant(a)
Coefficient(b) Standard Error T value R2
SBBJ 0.089 0.184** 0.034 5.59 0.723 SBI 0.099 0.121** 0.018 6.55 0.796 SBH 0.108 0.095** 0.026 3.726 0.558 SBP 0.11 0.112** 0.014 8.138 0.858 SBT 0.083 0.183** 0.041 4.441 0.642 Bank group 0.101 0.126** 0.011 10.993 0.657 Source: Computed by the researcher Note: ** indicates significant values at 1% level of significance
Table 1.34 Regression Results for Performance and Information Technology Relationship in Nationalized
Banks Group in India Bank/Group Constant(a) Coefficient(b) Standard Error T statistic R2 CanaraBank 0.047 0.402** 0.098 4.097 0.604 BankofBaroda 0.028 0.225** 0.028 8.092 0.856 BankofIndia 0.096 0.216** 0.03 7.126 0.822 PNB 0.073 0.227** 0.036 6.227 0.779 DenaBank 0.079 0.193** 0.063 3.046 0.458 Punjab& SindBank 0.078 0.110NS 0.091 1.209 0.117 UnionBankof India 0.074 0.260** 0.067 3.873 0.577 AllahabadBank 0.099 0.107** 0.021 5.016 0.696 IndianOverseasBank 0.085 0.200** 0.03 6.757 0.806 OBC 0.135 0.066NS 0.033 1.996 0.266 CentralBankofIndia 0.092 0.087* 0.034 2.534 0.369 NationalizedBanksGroup 0.089 0.151** 0.014 10.463 0.437 PublicSectorBanksGroup 0.093 0.142** 0.01 14.296 0.498 Source: Computed by the researcher Note: * indicates significant values at 5% level of significance ** indicates significant values at 1% level of significance
Table 1.35 Regression Results for Performance and Information Technology Relationship in Old Private
Banks Group in India
Bank/Group Constant(a) Coefficient(b) Standard Error T statistic R2 Federal bank 0.079 0.263* 0.1 2.616 0.383 j & K Bank 0.094 0.189** 0.026 7.28 0.828 IngVysyaBank 0.008 0.431** 0.032 13.378 0.942 karnatka Bank 0.092 0.164** 0.048 3.438 0.518 SouthIndianBank 0.088 0.146** 0.025 5.928 0.762 OldPrivateBanksGroup 0.068 0.324** 0.038 8.622 0.541 Source: Computed by the researcher Note: * indicates significant values at 5% level of significance ** indicates significant values at 1% level of significance
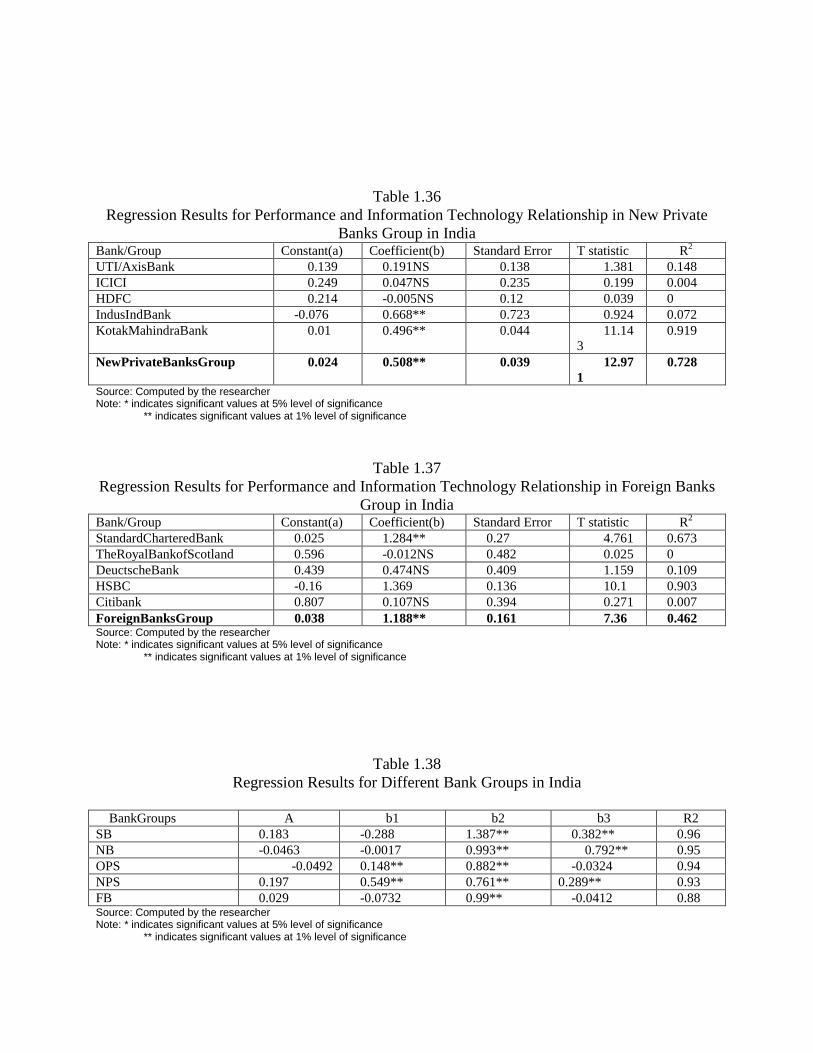
Table 1.36 Regression Results for Performance and Information Technology Relationship in New Private
Banks Group in India Bank/Group Constant(a) Coefficient(b) Standard Error T statistic R2 UTI/AxisBank 0.139 0.191NS 0.138 1.381 0.148 ICICI 0.249 0.047NS 0.235 0.199 0.004 HDFC 0.214 -0.005NS 0.12 0.039 0 IndusIndBank -0.076 0.668** 0.723 0.924 0.072 KotakMahindraBank 0.01 0.496** 0.044 11.14
3 0.919
NewPrivateBanksGroup 0.024 0.508** 0.039 12.971
0.728
Source: Computed by the researcher Note: * indicates significant values at 5% level of significance ** indicates significant values at 1% level of significance
Table 1.37 Regression Results for Performance and Information Technology Relationship in Foreign Banks
Group in India Bank/Group Constant(a) Coefficient(b) Standard Error T statistic R2 StandardCharteredBank 0.025 1.284** 0.27 4.761 0.673 TheRoyalBankofScotland 0.596 -0.012NS 0.482 0.025 0 DeuctscheBank 0.439 0.474NS 0.409 1.159 0.109 HSBC -0.16 1.369 0.136 10.1 0.903 Citibank 0.807 0.107NS 0.394 0.271 0.007 ForeignBanksGroup 0.038 1.188** 0.161 7.36 0.462 Source: Computed by the researcher Note: * indicates significant values at 5% level of significance ** indicates significant values at 1% level of significance
Table 1.38 Regression Results for Different Bank Groups in India
BankGroups A b1 b2 b3 R2
SB 0.183 -0.288 1.387** 0.382** 0.96 NB -0.0463 -0.0017 0.993** 0.792** 0.95 OPS -0.0492 0.148** 0.882** -0.0324 0.94 NPS 0.197 0.549** 0.761** 0.289** 0.93 FB 0.029 -0.0732 0.99** -0.0412 0.88 Source: Computed by the researcher Note: * indicates significant values at 5% level of significance ** indicates significant values at 1% level of significance

Pooled Data Regression Results
Pooled data regression analysis has been done for all Indian bank groups for all
the years under study (1999-2000 to 2014-15). The regression model is as
follows:
Performance Index = f(Technology Index)
As per tables 1.33 to 1.37 Regression results are indicative of the fact that
regression coefficient of performance as a function of technology is positive and
statistically significant for almost all the banking groups. The coefficients show
that technology is a significant determinant of performance in case of all the bank
groups in India. Study confirms that contribution of technology to bank group’s
performance has a differential behavior. It varies with size, scale, ownership and
phase of technology adoption.
Multivariate Regression Results
So far, performance has been taken as a sole function of technology, assuming
the effect of other inputs to be constants. To refine the relationship, in this part of
analysis, technology has been taken in conjunction with other inputs, capital and
labour. Multivariate regression analysis has been used to ascertain the
contribution of each of the independent variable to explain the dependent
variable. The model specification is as follows:
Business performance = f(Capital, Labour, and Technology)
Pooled data has been used for this purpose. The explicit regression model is as
follows: [Yi = a + b1x1 + b2x2 + b3x3+u)]; Where Yi is performance; X1 is the
capital; X2 is the labour; X3 is the technology; and b’s are regression coefficients.
The regression results are presented in Table 1.38. Table shows that in case of
SB, coefficient of capital is negative, indicating the negative impact of capital on

performance but labour and technology contribution to performance is positive,
as indicated by positive coefficient of labour and technology. Further the
coefficients are statistically significant at 1 percent level of significance and the
model explains to the extent of 94 percent. For NB group also the capital is
contributing negatively, but coefficients of labour and technology are positive.
Thus, in case of NB group, performance is positively determined by labour and
technology and negatively by the capital, the regression coefficients for labour
and technology are significant at 1 percent level of significance.
Coefficient of determination is 0.93 which shows that model is statistically a
sound model. For OPS group all the three factors are significantly contributing to
performance as all the three coefficients are positive and statistically significant
too. In case of NPS group, capital and labour indicates positive contribution but
technology contribution is negative and that too is statistically significant at 2
percent level of significance. For FB group, only labor is positively contributing to
performance whereas the other two factors namely capital and technology have
negative coefficient and coefficient of technology turns out to be non significant.
Overall, multivariate regression explains that out of three variables namely
capital, labour and technology, capital is significantly contributing positively to
business performance for OPS and NPS group but its impact is negative in case
of SB, NB and FB group. It indicates that these bank groups have gone for a
highly capital intensive mode of production. However the performance has not
grown to that extent at which the capital has accelerated. Labour is contributing
significantly for all the bank groups. It is because of better human resource
management practices in all banks which include performance based pay,
flexible job design, improving employee’s skill and institutional structure affecting
the labour management relations. So far as technology is concerned, it is
contributing positively to SB, NPS and NB group but its effect is negative for OPS
and FB group thereby explaining the productivity paradox which is attributed to
the insufficient response of these bank groups to use technology efficiently.
1.8.4 Technology-Productivity paradox: Non Parametric Analysis
In the previous section, efficiency was measured using the traditional accounting
measures. However, such measures have limitations in that the choice of a
single ratio does not provide precise information about various dimensions of the
performance of a bank, which uses multiple inputs to produce multiple outputs.
Moreover, these measures also do not differentiate between efficiency and
productivity clearly. This problem is better addressed through economic
measures that capture all aspects of banking operations in a single measure.
Among the several techniques for economic measures, the data envelopment
Analysis (DEA) approach used in this study has several advantages over others.
One, it provides bank level efficiency score. Two, it does not require a prior
specification about the underlying technologies.
Under the DEA approach, a best practice frontier which represents optimal
utilisation level of resources is prepared and efficiency of banks is measured
relative to that best frontier (benchmark). If a bank lies on the frontier, it is
referred to as an efficient bank, otherwise it is termed as less efficient. More
away the bank is from the frontier, lower is its efficiency level. Since, in practice,
the true ideal technology is not observable, the DEA analysis attempts to define
the feasible technology frontier. In order to estimate the best practice frontier,
labour, fixed assets, deposits and borrowings have been treated as inputs, while
credit, investments and asset equivalent of off-balance sheet operations have
been used as outputs.
Efficiency Estimates

According to the DEA estimates, there has been a significant improvement in
efficiency levels across the bank groups after the diffusion of technology and its
adoption by various bank groups. The improvement in efficiency was significantly
more pronounced between 2007 and 2014 than between 1999 and 2007. Clearly
the period 2007-2014 has been categorised as Period-II in the present study
which indicates the post e banking revolution period. During 1999-2000, the cost-
efficiency based on DEA estimates of the banking sector was 0.42 (implying that
given the observed input-output bundles and feasible technology, 58 per cent of
cost could have been reduced to produce the same level of output), which rose
to 0.77 by 2014-15. In terms of bank groups, the gains in cost efficiency were
more significant in the case of OPS group between 1999 and 2014 compared to
other bank groups largely due to their low base in 1990s. Despite the large gains
by private bank groups, the SB group continued to be the market leader insofar
as absolute efficiency levels were concerned.
Table 1.39
Efficiency Levels (Bank Group Wise)
Bank
Group
Efficiency
Type
DEA Efficiency Scores Growth rates of Efficiency
(%)
1999-2000 2007-08 2014-15
1999 -2007
2007-2014
1999-2014
SB cost 0.46 0.66 0.86 45.93 30.12 89.89
technical 0.65 0.80 0.96 23.08 20.00 47.69
allocative 0.70 0.83 0.90 18.57 8.43 28.57
NB cost 0.45 0.66 0.83 46.16 24.77 82.36
technical 0.63 0.78 0.94 23.81 20.51 49.21
allocative 0.72 0.85 0.88 18.06 3.53 22.22
OPS cost 0.24 0.49 0.64 101.64 29.55 161.21
technical 0.47 0.56 0.76 19.15 35.71 61.70
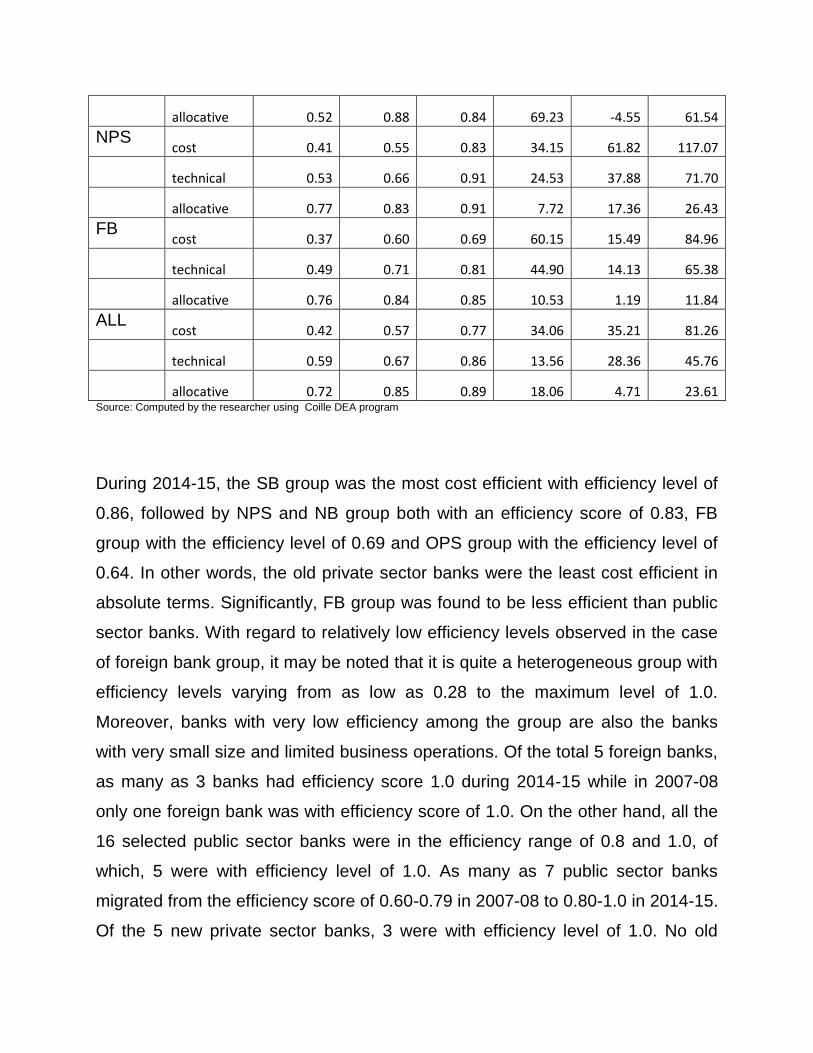
allocative 0.52 0.88 0.84 69.23 -4.55 61.54
NPS cost 0.41 0.55 0.83 34.15 61.82 117.07
technical 0.53 0.66 0.91 24.53 37.88 71.70
allocative 0.77 0.83 0.91 7.72 17.36 26.43
FB cost 0.37 0.60 0.69 60.15 15.49 84.96
technical 0.49 0.71 0.81 44.90 14.13 65.38
allocative 0.76 0.84 0.85 10.53 1.19 11.84
ALL cost 0.42 0.57 0.77 34.06 35.21 81.26
technical 0.59 0.67 0.86 13.56 28.36 45.76
allocative 0.72 0.85 0.89 18.06 4.71 23.61
Source: Computed by the researcher using Coille DEA program
During 2014-15, the SB group was the most cost efficient with efficiency level of
0.86, followed by NPS and NB group both with an efficiency score of 0.83, FB
group with the efficiency level of 0.69 and OPS group with the efficiency level of
0.64. In other words, the old private sector banks were the least cost efficient in
absolute terms. Significantly, FB group was found to be less efficient than public
sector banks. With regard to relatively low efficiency levels observed in the case
of foreign bank group, it may be noted that it is quite a heterogeneous group with
efficiency levels varying from as low as 0.28 to the maximum level of 1.0.
Moreover, banks with very low efficiency among the group are also the banks
with very small size and limited business operations. Of the total 5 foreign banks,
as many as 3 banks had efficiency score 1.0 during 2014-15 while in 2007-08
only one foreign bank was with efficiency score of 1.0. On the other hand, all the
16 selected public sector banks were in the efficiency range of 0.8 and 1.0, of
which, 5 were with efficiency level of 1.0. As many as 7 public sector banks
migrated from the efficiency score of 0.60-0.79 in 2007-08 to 0.80-1.0 in 2014-15.
Of the 5 new private sector banks, 3 were with efficiency level of 1.0. No old

private sector bank had efficiency level of 1.0. Out of total 13 banks in the
industry, which recorded 1.0 per cent efficiency score in 2014-15, 3 were foreign
bank group, 3 from new private sector bank, 5 from State Bank group and 2 from
the nationalised bank group.
Table 1.40
Frequency Distribution of efficiency
0-.19 .20-.39 .40-.59 .60-.79 .80-1.00
SB 1999-2000 0 0 0 4 1
2006-07 0 0 0 4 1
2014-15 0 0 0 0 5
NB 1999-2000 0 0 3 7 1
2006-07 0 0 0 6 5
2014-15 0 0 0 3 8
OPS 1999-2000 0 2 3 0 0
2006-07 0 3 1 1 0
2014-15 0 0 2 3 0
NPS 1999-2000 0 0 1 2 2
2006-07 0 0 1 1 3
2014-15 0 0 0 2 3
FB 1999-2000 0 2 1 1 1
2006-07 0 3 1 0 1
2014-15 0 1 1 0 3
Source: Computed by the researcher
Cost efficiency estimates drawn through DEA could be decomposed into
technical and allocative efficiency. Technical efficiency refers to the ability of a
bank to obtain maximum output from a given set of inputs, while allocative
efficiency refers to ability of the bank to use inputs in optimal proportions, given
their respective prices. Most of the gains in the overall efficiency have emanated
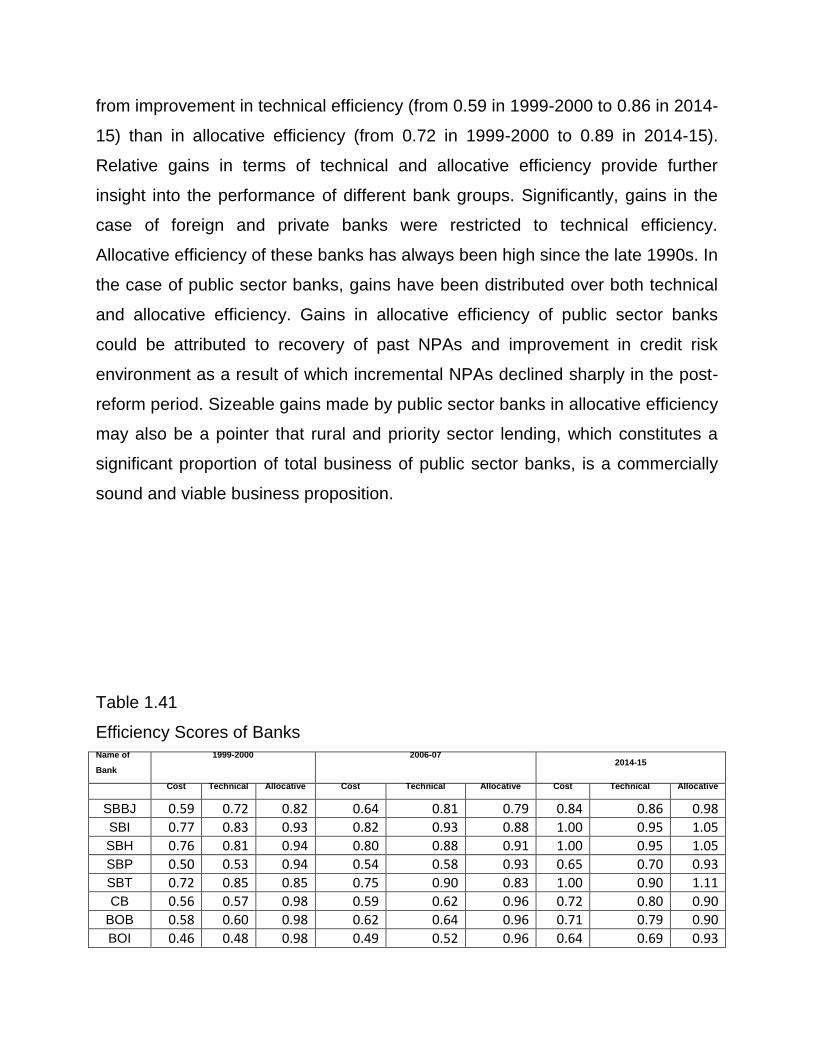
from improvement in technical efficiency (from 0.59 in 1999-2000 to 0.86 in 2014-
15) than in allocative efficiency (from 0.72 in 1999-2000 to 0.89 in 2014-15).
Relative gains in terms of technical and allocative efficiency provide further
insight into the performance of different bank groups. Significantly, gains in the
case of foreign and private banks were restricted to technical efficiency.
Allocative efficiency of these banks has always been high since the late 1990s. In
the case of public sector banks, gains have been distributed over both technical
and allocative efficiency. Gains in allocative efficiency of public sector banks
could be attributed to recovery of past NPAs and improvement in credit risk
environment as a result of which incremental NPAs declined sharply in the post-
reform period. Sizeable gains made by public sector banks in allocative efficiency
may also be a pointer that rural and priority sector lending, which constitutes a
significant proportion of total business of public sector banks, is a commercially
sound and viable business proposition.
Table 1.41
Efficiency Scores of Banks Name of
Bank
1999-2000
2006-07
2014-15
Cost Technical Allocative Cost Technical Allocative Cost Technical Allocative
SBBJ 0.59 0.72 0.82 0.64 0.81 0.79 0.84 0.86 0.98 SBI 0.77 0.83 0.93 0.82 0.93 0.88 1.00 0.95 1.05 SBH 0.76 0.81 0.94 0.80 0.88 0.91 1.00 0.95 1.05 SBP 0.50 0.53 0.94 0.54 0.58 0.93 0.65 0.70 0.93 SBT 0.72 0.85 0.85 0.75 0.90 0.83 1.00 0.90 1.11 CB 0.56 0.57 0.98 0.59 0.62 0.96 0.72 0.80 0.90
BOB 0.58 0.60 0.98 0.62 0.64 0.96 0.71 0.79 0.90
BOI 0.46 0.48 0.98 0.49 0.52 0.96 0.64 0.69 0.93
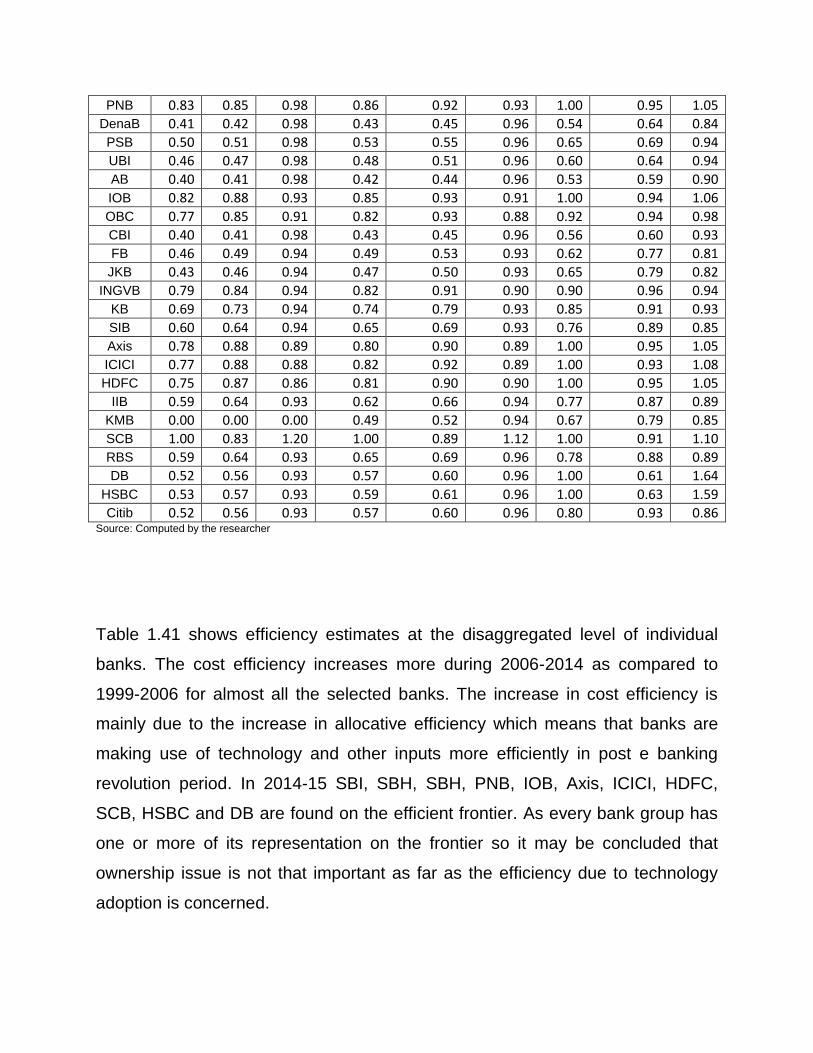
PNB 0.83 0.85 0.98 0.86 0.92 0.93 1.00 0.95 1.05 DenaB 0.41 0.42 0.98 0.43 0.45 0.96 0.54 0.64 0.84 PSB 0.50 0.51 0.98 0.53 0.55 0.96 0.65 0.69 0.94
UBI 0.46 0.47 0.98 0.48 0.51 0.96 0.60 0.64 0.94 AB 0.40 0.41 0.98 0.42 0.44 0.96 0.53 0.59 0.90
IOB 0.82 0.88 0.93 0.85 0.93 0.91 1.00 0.94 1.06
OBC 0.77 0.85 0.91 0.82 0.93 0.88 0.92 0.94 0.98 CBI 0.40 0.41 0.98 0.43 0.45 0.96 0.56 0.60 0.93 FB 0.46 0.49 0.94 0.49 0.53 0.93 0.62 0.77 0.81 JKB 0.43 0.46 0.94 0.47 0.50 0.93 0.65 0.79 0.82
INGVB 0.79 0.84 0.94 0.82 0.91 0.90 0.90 0.96 0.94 KB 0.69 0.73 0.94 0.74 0.79 0.93 0.85 0.91 0.93
SIB 0.60 0.64 0.94 0.65 0.69 0.93 0.76 0.89 0.85 Axis 0.78 0.88 0.89 0.80 0.90 0.89 1.00 0.95 1.05 ICICI 0.77 0.88 0.88 0.82 0.92 0.89 1.00 0.93 1.08
HDFC 0.75 0.87 0.86 0.81 0.90 0.90 1.00 0.95 1.05
IIB 0.59 0.64 0.93 0.62 0.66 0.94 0.77 0.87 0.89 KMB 0.00 0.00 0.00 0.49 0.52 0.94 0.67 0.79 0.85
SCB 1.00 0.83 1.20 1.00 0.89 1.12 1.00 0.91 1.10 RBS 0.59 0.64 0.93 0.65 0.69 0.96 0.78 0.88 0.89 DB 0.52 0.56 0.93 0.57 0.60 0.96 1.00 0.61 1.64
HSBC 0.53 0.57 0.93 0.59 0.61 0.96 1.00 0.63 1.59 Citib 0.52 0.56 0.93 0.57 0.60 0.96 0.80 0.93 0.86
Source: Computed by the researcher
Table 1.41 shows efficiency estimates at the disaggregated level of individual
banks. The cost efficiency increases more during 2006-2014 as compared to
1999-2006 for almost all the selected banks. The increase in cost efficiency is
mainly due to the increase in allocative efficiency which means that banks are
making use of technology and other inputs more efficiently in post e banking
revolution period. In 2014-15 SBI, SBH, SBH, PNB, IOB, Axis, ICICI, HDFC,
SCB, HSBC and DB are found on the efficient frontier. As every bank group has
one or more of its representation on the frontier so it may be concluded that
ownership issue is not that important as far as the efficiency due to technology
adoption is concerned.
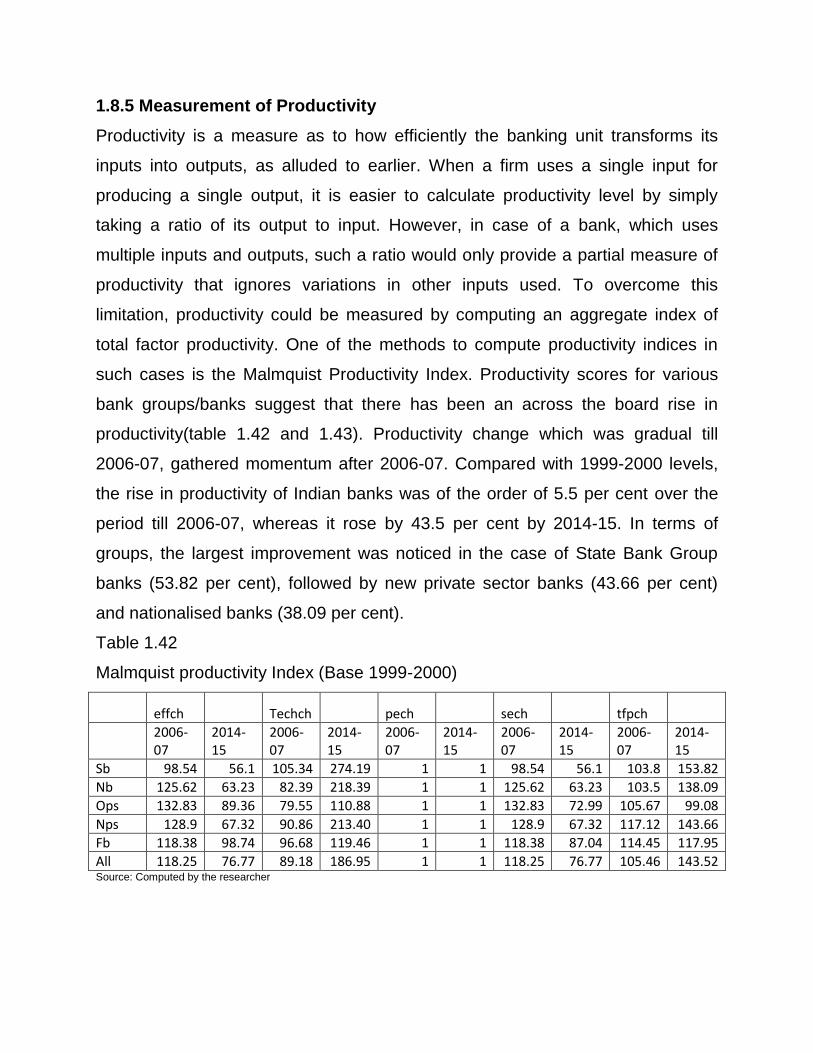
1.8.5 Measurement of Productivity
Productivity is a measure as to how efficiently the banking unit transforms its
inputs into outputs, as alluded to earlier. When a firm uses a single input for
producing a single output, it is easier to calculate productivity level by simply
taking a ratio of its output to input. However, in case of a bank, which uses
multiple inputs and outputs, such a ratio would only provide a partial measure of
productivity that ignores variations in other inputs used. To overcome this
limitation, productivity could be measured by computing an aggregate index of
total factor productivity. One of the methods to compute productivity indices in
such cases is the Malmquist Productivity Index. Productivity scores for various
bank groups/banks suggest that there has been an across the board rise in
productivity(table 1.42 and 1.43). Productivity change which was gradual till
2006-07, gathered momentum after 2006-07. Compared with 1999-2000 levels,
the rise in productivity of Indian banks was of the order of 5.5 per cent over the
period till 2006-07, whereas it rose by 43.5 per cent by 2014-15. In terms of
groups, the largest improvement was noticed in the case of State Bank Group
banks (53.82 per cent), followed by new private sector banks (43.66 per cent)
and nationalised banks (38.09 per cent).
Table 1.42
Malmquist productivity Index (Base 1999-2000)
effch Techch pech sech tfpch
2006-07
2014-15
2006-07
2014-15
2006-07
2014-15
2006-07
2014-15
2006-07
2014-15
Sb 98.54 56.1 105.34 274.19 1 1 98.54 56.1 103.8 153.82
Nb 125.62 63.23 82.39 218.39 1 1 125.62 63.23 103.5 138.09
Ops 132.83 89.36 79.55 110.88 1 1 132.83 72.99 105.67 99.08
Nps 128.9 67.32 90.86 213.40 1 1 128.9 67.32 117.12 143.66
Fb 118.38 98.74 96.68 119.46 1 1 118.38 87.04 114.45 117.95
All 118.25 76.77 89.18 186.95 1 1 118.25 76.77 105.46 143.52 Source: Computed by the researcher
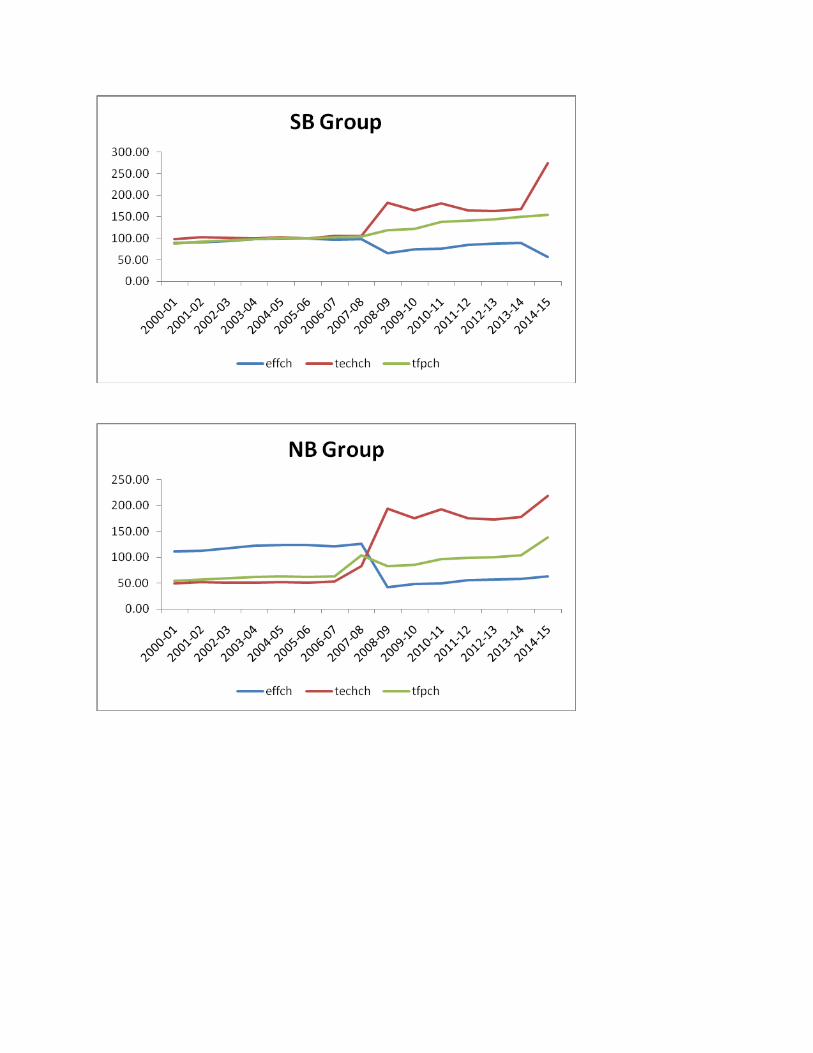
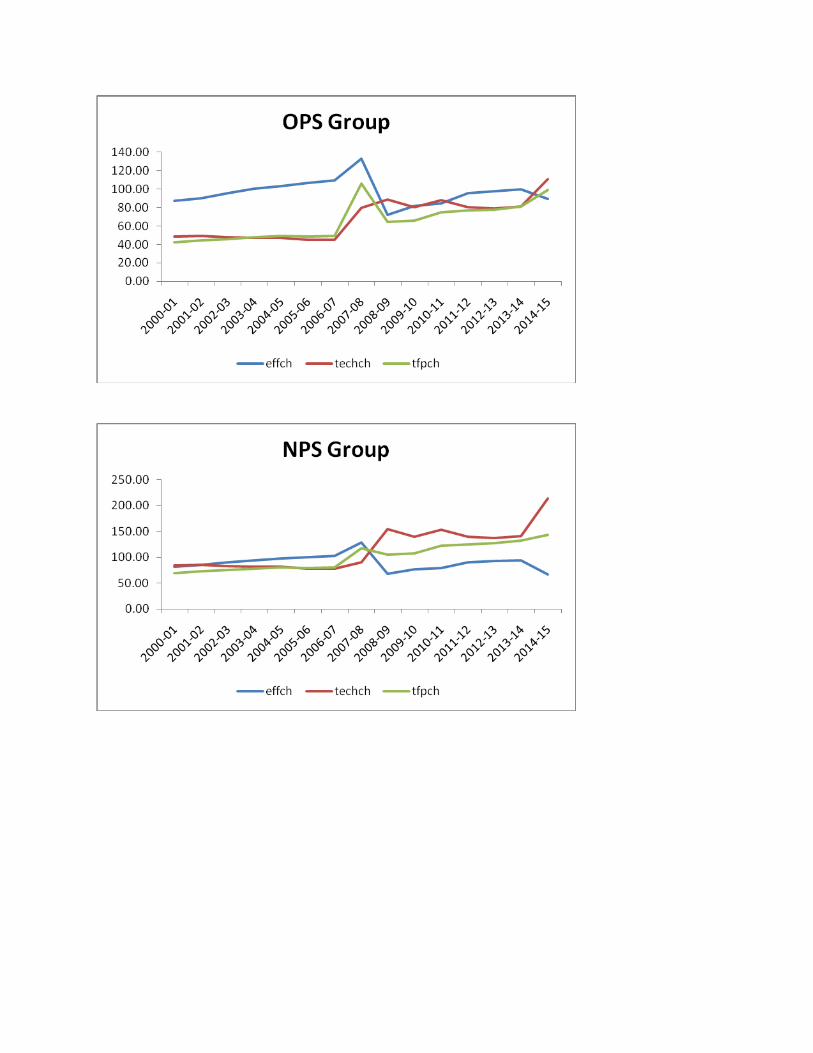

These productivity estimates based on Malmquist productivity index could be
decomposed into two mutually exclusive and exhaustive components: changes in
technical efficiency, i.e., change in output for given inputs (catching up) and shifts
in technology over time, i.e., technological improvements or technical progress
(innovation). Relative trends in technical efficiency and technical progress reveal
that between 1999-2000 and 2006-07, technical efficiency of the banking sector
and all bank groups, other than State Bank group, improved.
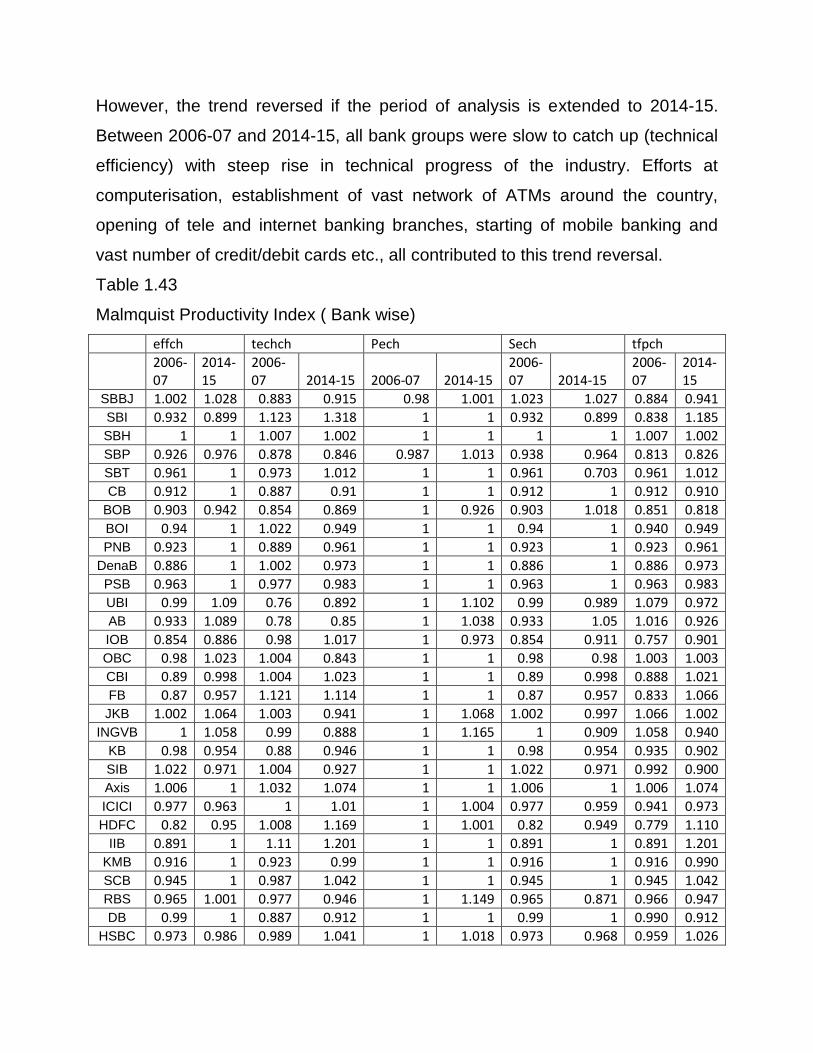
However, the trend reversed if the period of analysis is extended to 2014-15.
Between 2006-07 and 2014-15, all bank groups were slow to catch up (technical
efficiency) with steep rise in technical progress of the industry. Efforts at
computerisation, establishment of vast network of ATMs around the country,
opening of tele and internet banking branches, starting of mobile banking and
vast number of credit/debit cards etc., all contributed to this trend reversal.
Table 1.43
Malmquist Productivity Index ( Bank wise) effch techch Pech Sech tfpch
2006-07
2014-15
2006-07 2014-15 2006-07 2014-15
2006-07 2014-15
2006-07
2014-15
SBBJ 1.002 1.028 0.883 0.915 0.98 1.001 1.023 1.027 0.884 0.941 SBI 0.932 0.899 1.123 1.318 1 1 0.932 0.899 0.838 1.185 SBH 1 1 1.007 1.002 1 1 1 1 1.007 1.002
SBP 0.926 0.976 0.878 0.846 0.987 1.013 0.938 0.964 0.813 0.826 SBT 0.961 1 0.973 1.012 1 1 0.961 0.703 0.961 1.012
CB 0.912 1 0.887 0.91 1 1 0.912 1 0.912 0.910 BOB 0.903 0.942 0.854 0.869 1 0.926 0.903 1.018 0.851 0.818
BOI 0.94 1 1.022 0.949 1 1 0.94 1 0.940 0.949
PNB 0.923 1 0.889 0.961 1 1 0.923 1 0.923 0.961 DenaB 0.886 1 1.002 0.973 1 1 0.886 1 0.886 0.973 PSB 0.963 1 0.977 0.983 1 1 0.963 1 0.963 0.983
UBI 0.99 1.09 0.76 0.892 1 1.102 0.99 0.989 1.079 0.972 AB 0.933 1.089 0.78 0.85 1 1.038 0.933 1.05 1.016 0.926
IOB 0.854 0.886 0.98 1.017 1 0.973 0.854 0.911 0.757 0.901 OBC 0.98 1.023 1.004 0.843 1 1 0.98 0.98 1.003 1.003 CBI 0.89 0.998 1.004 1.023 1 1 0.89 0.998 0.888 1.021
FB 0.87 0.957 1.121 1.114 1 1 0.87 0.957 0.833 1.066 JKB 1.002 1.064 1.003 0.941 1 1.068 1.002 0.997 1.066 1.002
INGVB 1 1.058 0.99 0.888 1 1.165 1 0.909 1.058 0.940
KB 0.98 0.954 0.88 0.946 1 1 0.98 0.954 0.935 0.902
SIB 1.022 0.971 1.004 0.927 1 1 1.022 0.971 0.992 0.900
Axis 1.006 1 1.032 1.074 1 1 1.006 1 1.006 1.074
ICICI 0.977 0.963 1 1.01 1 1.004 0.977 0.959 0.941 0.973
HDFC 0.82 0.95 1.008 1.169 1 1.001 0.82 0.949 0.779 1.110
IIB 0.891 1 1.11 1.201 1 1 0.891 1 0.891 1.201 KMB 0.916 1 0.923 0.99 1 1 0.916 1 0.916 0.990 SCB 0.945 1 0.987 1.042 1 1 0.945 1 0.945 1.042 RBS 0.965 1.001 0.977 0.946 1 1.149 0.965 0.871 0.966 0.947 DB 0.99 1 0.887 0.912 1 1 0.99 1 0.990 0.912
HSBC 0.973 0.986 0.989 1.041 1 1.018 0.973 0.968 0.959 1.026

Citib 0.981 1 1.022 1.028 1 1 0.981 1 0.981 1.028 Source: Computed by the researcher
4 banks from the SB group, 6 banks from NB group, 1 bank from OPS group, 5
banks from NPS group and 3 banks from FB group depict increase in total factor
productivity in 2014-15 as compared to 2006-07. SBI records highest change in
total productivity. Out of the 31 selected banks, 21 reveal increase in total
productivity due to technological change which indicates the increased innovation
in Indian banks.
To sum up, the economic measures of efficiency and productivity substantiate
the results arrived at through the accounting measures. That is, efficiency has
improved across all bank groups when measured from a grand frontier for all
banks for the period 1999-2000 to 2014-15 and most of these efficiency gains
have emanated after technology diffusion in banks.
Beginning with the efficiency levels in 1999-2000, efficiency gains were found to
be the largest for old private sector banks. However, since their efficiency levels
were very low at the beginning of the study period, they still continue to lag far
behind the other bank groups. As of now, the state bank group are the most
efficient, followed by the new private sector banks as a group , nationalized
banks, foreign banks and old private sector bank groups.
1.9 CONCLUSION
The utilisation of information technology has magnificently increased in Indian
banking industry. All commercial banks have shown an impressive growth in
ATM installation. Notwithstanding such remarkable achievement, it is noted that
India still lags far behind other countries. The reason behind the slow growth in

ATM expansion is the high installation costs. Further at a disaggregate level,
technology revolution in Indian banking industry has been introduced by private
and foreign banks and to compete public sector banks followed it. The public
sector banks have been followers in terms of number of ATMs in the beginning
but by their size and spread advantage; they have a wider coverage at the
present. In terms of number of computerized branches, the public sector, both
SBI and its associates and nationalized banks together, form the major share in
Indian banking. The public sector, by its size and scale advantage has been able
to do the computerization of braches on a very large scale. The public sector
banks have a unique advantage over their competitors in terms of their branch
network and large customer base. When this gigantic computerization is viewed
in terms of number of customers served, as compared to public sector banks, the
new private and foreign banks are very small players in this context.
Number of credit cards has been experiencing an upward trend for the entire
period. Sector wise analysis shows that private sector banks are the market
leader. Bank-wise growth of credit cards is evenly distributed among the banks
but the SBI in particular and public sector banks in general have a major chunk of
customer by virtue of their wider customer base. It is inferred that growth of
foreign banks in terms of credit card is shrinking due to competition with Indian
banks which are coming with better modernised and localized strategic solutions.
The new generation private banks and foreign banks are the leaders in
introducing internet banking in India. However, the number of public sector banks
offering internet banking has been increasing exponentially. Keeping in view the
customer segment served by public sector banks, the availability of hardware
and security software for internet banking at the customer end is still in queue,
but the culture of internet banking is picking up in urban Indian segment.
New private banks and foreign banks have been able to create a niche in the
mobile banking in the early stages of technology adoption, as their share of
mobile banking branches in the total branches has been much higher as
compared to public sector banks. Here, the size, scale, customer heterogeneity
and mind set attuned towards resisting new technology are holding back the
public sector banks. It is proving to be an impediment and resulting in delayed
response in adoption of new technologies. This needs elaborate customer
awareness and change in the mind set of banking staff.
The broad conclusion that emerges from analysis of technology parameters is
that Indian model of banking is characterized by opening up of traditional public
sector and old private sector banks to a stiff competition from new private and
foreign banks armoured with state of the art technology. This competitive
environment served as a catalyst for public sector and old private sector banks to
go for up-gradation of technology base and their size, scale and spread gave
them the advantage in this regard. Technology adoption in public and old Indian
private sectors banks is slightly slow but its scale and size is massive and robust.
The system is in its transitory mode in adoption of technology; back-end
technologies have already been adopted, the front-end orientation of the system
is in progress.
Overall technology index is indicative of the fact that fast technology adoption
growth is associated with public sector banks or nationalized banks. Slow growth
is associated with new private banks and foreign banks. This is attributed to the
fact that nationalized banks have gone for gradual adoption of technology but
slow growing new private and foreign banks have gone for one-time abrupt
adoption of technology and continued with the same level. It is concluded that
new private sector banks and foreign banks primarily drove the growth in
technology index in the initial few years, but in the later years under study the
growth of technology is predominantly triggered by the rapidly growing public
sector banks or old private banks.
Volume of business per branch shows that foreign bank and new private banks
are many time more efficient than the nationalised banks but this is highly
misleading. No doubt some differences cannot be ignored due to the non-
electronic work culture but it also assumes that branches across the industry are
of the same size, following same technologies and are evenly distributed
throughout the geographical length and breadth of country and are catering
needs of all strata of the population. It is not so. Foreign banks and private sector
banks with bigger branches located in metropolitan cities are catering very small
elite strata. On the other hand, public sector banks and private banks with large
number of small sized branches, with traditional technology and with a network of
branches, are serving the needs of common masses that include the rural strata
also. So, the comparison of branch efficiency among the banks of different
organisational set up with different objectives is not valid.
Operating profit has grown faster than the net profit and profit per branch has
grown faster than the profit per employee. First, it implies that non operating
incomes of banks have grown at a slower pace than the operating incomes and
non-operating expenditure has grown faster. Secondly, banks have been able to
economize by managing their non-establishment branch expenses. Thirdly, cost
saving by intellectual capital management will take a little longer time. Various
performance parameters have been analysed. In terms of profit per branch
foreign banks are twenty times more efficient as compared to public sector
banks. It is inferred that branch profitability of foreign banks is the highest and is
increasing due to their check on burden. New private sector banks are following
the foreign banks and are initiating to fill this gap but the performance on the
profit front of nationalized banks as compared to other banks has a dismal
position, as these banks are lagging far behind the new private banks and
foreign banks. Currently, the profit per employee of foreign banks is almost three
times the industry average. Nationalised banks and private banks are performing

with a slight difference, almost at par with the industry benchmark but it is far
below the national benchmark for SBI and its associate bank group.
NIM per branch is continuously showing an increasing trend for overall industry
during the study period. Foreign banks continue to be much ahead of Indian
banks which may be due to the vary objective and the nature of organization of
different banking groups. This can be attributed to declining interest income,
which is the result of high proportion of the total deposits being impounded in
CRR and SLR; and earning relatively low rate of Interest. Further, a high
proportion of bank deposits had to be allocated to priority sectors under social
banking. No doubt, the interest rate paid by private sector banks are little more
than the public sector banks but this is a case of tactful management through
which the private sector banks were able to fetch huge funds on the basis of
attractive interest rates.
Overall performance index is indicative of the fact that there has been significant
change in the relative performance of different banks. Initially private banks and
foreign banks were dominating the scene. The entry of the private banks and
foreign banks resulted in great competitive pressure for nationalized banks and
they responded to these challenges of economic environment by initiating
tectonic measures such as up scaling their management capabilities,
repositioning their competitive strategies, resorting to state of art IT architecture,
increasing customer focus and profit orientation. Nationalized banks are
competing relatively effectively with private banks and foreign banks and now
they enjoy a prominent position among various private banks and foreign banks
and they have emerged as an important driver of economic growth and overall
development.
The technology-performance relation has been explored by using a variety of
techniques. Correlation coefficient of technology and performance is positive,

stronger and significant for public sector banks and statistical significance
disappears for some new private and foreign banks. With regards to this relation,
the public sector banks stand at advantage, so far as market share, size of bank
and experience of the bank is concerned. The public sector banks are
maintaining their performance and information technology has undoubtedly
contributed to large banks having greater flexibility to adapt to changes, whereas
private banks and foreign banks remained technologically overcapitalised in
relation to performance. They have invested heavily in costly technological
infrastructures. Hence, the new private banks and foreign banks must evaluate
their technology investment in relation to performance.
Regression coefficient of performance as a function of technology is positive for
all most all the banks and wherever negative, it is statistically insignificant. The
coefficient of determination shows that technology is a significant determinant of
performance in case of SBI and its associates, old private group but a poor
determinant in case of new private banks and foreign banks. Study confirms
that contribution of technology to bank’s performance has a differential
behaviour. It varies with size, scale, ownership and phase of technology
adoption. It contributes positively only to those banks where some preconditions
conducive to performance are existing, e.g., trained manpower, size and scale of
business. It shows that bank’s performance is related not just to its technological
stance but to other areas of competencies. Banks which gave greater stress both
to use of advanced IT and human resource strategies, experience superior
performance gains; whereas in some other banks, higher IT investments are not
associated with higher level of performance. This implies that every investment
decision relating to technology must be evaluated in the light of its interaction
with other inputs and its contribution to performance.
To refine the relationship, technology has also been taken in conjunction with
other inputs, capital and labour. The results shows that out of three factors

namely capital, labour and technology, capital is significantly contributing
positively to business performance for old private banks and new private banks
but its impact is negative in case of SBI and its associates, nationalized and
foreign banks. It indicates that these banks have gone for a highly capital
intensive mode of production. However the performance has not grown to that
extent at which the capital has accelerated. Labour is contributing significantly
for all the banks. It is because of better human resource management practices
in all banks which include performance based pay, flexible job design, improving
employee’s skill and institutional structure affecting the labour management
relations. So far as technology is concerned, it is contributing positively to
performance in public sector banks and old private banks but its effect is
negative in new private banks and foreign banks and thereby explaining the
productivity paradox which is attributed to an insufficient response of bank to use
technology effectively.
Increased application of technology also appeared to have played an important
role in improving efficiency and productivity of the banking sector. Progress after
1999-2000 was directly traceable to several technological changes that have
taken place on a continuous basis. These include improvements in payment and
settlement systems, customer service, internal controls and audit. Beginning with
the MICR cheque clearing system, the Indian retail payment system got a major
boost during the reform period with the introduction of technologically advanced
and secure systems such as electronic fund transfer, electronic clearing system,
the special EFT and card based systems that greatly enhanced efficiency levels
in banking operations. The introduction of RTGS helped improve the cash
management by banks. Another technology induced cost effective initiative was
the introduction of virtual banking services through the establishment of ATMs,
shared ATM networks, smart cards, stored-value cards, phone banking and
ultimately internet and intranet banking. These services economised on the staff
and branch infrastructure expenses and also boosted the volume of transactions
per unit of input used. The Reserve Bank also operationalised the Very Small
Aperture Terminal (VSAT) network to provide reliable communication backbone
to the financial sector. To facilitate connectivity within the banking sector, the
Reserve Bank, public sector banks and IDBRT collectively set up the Indian
Financial Network (INFINET) based on satellite communication. Currently,
INFINET is being migrated to a multiprotocol layer switching technology that
offers economies of scale, apart from ease of operation. Such technological
changes led to outward shift in the production frontier of banks.
As regards bank groups, the State Bank group and nationalised banks adopted
technology long after foreign and new private sector banks. Hence, while foreign
banks were mostly defining the grand technological frontier of the Indian banking
system, public sector and nationalised banks closely pursued the frontier to stay
competitive. Many public sector banks also computerised their branches and
introduced core banking solutions. Although in the initial years, it pushed up the
cost, it however, appeared to have resulted in cutting operating cost and
improving efficiency in the subsequent years. New private sector banks such as
ICICI Bank and HDFC Bank were relatively better off due to their access to the
frontiers of technology assisted by foreign direct investment.
Hence the overall conclusion that emerges from the analysis is that in banking
industry, performance is a positive function of information technology, if some
other complement conditions like intellectual capital, size and scale of operations
compatible with it are available; otherwise it can rather affect the performance
adversely. This is what explains the productivity paradox in service sector, in
general, and in banking sector, in particular. The study found strong evidences of
the fact that technology can play a major role not only in reducing operating cost
but also improving productivity. Banks, therefore, need to look at technology both

from the point of view of increasing labour productivity and cutting operating cost
in the long run.
Policy Implications
The relation of technology and performance of Indian banking has been analyzed
using the methodology outlined above. Following policy implications or
suggestions emerge from the analysis:
a) It is not merely spending more on information technology that translates it into
higher profitability but more important is that how banks manage information
technology and integrate it with business functions to achieve higher profitability.
Strong management and good governance of information technology is a need of
the time.
b) It is not just the process of buying the computers and software that gives
performance, rather the competitive advantage from introduction of information
technology stems from the organizational dynamic capabilities which are defined
in terms of timely responsiveness, rapid and flexible product innovation and
management capabilities to effectively coordinate internal and external
competencies.
c) With investment on information technology, new skills have to be acquired by
the employees. It involves not just the learning the use of new technology by the
operative level personnel. Even the managerial staff also needs training in
management of technology because modernization of work technology without
ensuring reasonable command and control system can lead to loss of managerial
effectiveness.
d) As computer and software are increasingly becoming economical inputs for
banks, an overriding feature of the information technology using banks is that
they are close to a real time interaction between suppliers, producers, distributors

and customers. Interactive processes alone can place new demands and open
opportunities for those who can respond to the need for increased flexibility.
Especially, in the context of public sector banks, the organization structure is
poorly suited to the effective implementation of information technology and it
need to be restructured.
e) Computerization needs to go beyond the mere arithmetical calculations and
need to be leveraged optimally to achieve and maintain a high service and
efficiency standard. Therefore, driving the productivity improvements in banking
involves acquiring the right technology, deploying it optimally and remaining cost
effective. Each organization needs to compute the optimum dose of information
technology that will be compatible with its performance.
f) Banks must revamp their human resource management processes. There
should be improvement in the existing practices of recruitment, training and
deployment. The focus must shift from generalist orientation of the staff to
specialist orientation, i.e., the ability to imbibe and absorb technology. Banks
should evolve appropriate policies to make the best use of their primary asset,
i.e., human resources.
g) Performance of information technology investment depends on environment,
quality service to end users and other partners, which would necessitate a well
qualified and robust group of skilled people to meet external and internal
commitments. Hence, banking system needs to spend a lot on training.
h) To translate the information technology investment into higher performance,
banks need to go beyond the traditional human resources jargon. Present day
organization needs intellectual capital that is a function of human capital,
structural capital and relationship capital. There needs to be a positive interaction
between information technology, skills and work organization. Adopting efficient
and productive methodologies that will foster innovations is need of the time.
To sum up, the above conclusions and policy implications are indicative of the
fact that there exists a relation between information technology and performance
but contribution of technology to performance has a differential behavior. In
banking sector, to translate information technology in to higher performance, a
package of other factors and conditions is required.
Bibliography
A. Emrouznejad, B. Parker, G. Tavares (2008), “Evaluation of research in efficiency and productivity: a survey and analysis of the first 30 years of scholarly literature in DEA”, Socio-Eco Plan Sci., doi:10.1016/j.seps.2007.07.002.
Agboola, A. (2007), “Information and Communication Technology (ICT) in Banking
Operations in Nigeria: An Evaluation of Recent Experiences”, Life Journal of Economics
and Finance, Vol.15, No.1, pp 1-21.
Aghdassi, M. (2008), “Association between Strategic Values and E-Banking Adoption in Iranian Banks”, [email protected].
Allen, F. (2002), “E. Finance: An Introduction”, Journal of Financial Services Research,
Vol.22, pp 5-7.

Alpar and Kim (1991), "A Microeconomic Approach to the Measurement of Information Technology Value", Journal of Management Information Systems, Vol.7, No.2, pp 55-69.
Awdeh and Moussawi (2009), “Bank Efficiency and Foreign Ownership in the
Lebanese Banking Sector”, Review of Middle East Economics and Finance, Vol. 5, No. 2, Article 4, Available at http://www.bepress.com/meef/vol5/iss2/art4
B. Hollingsworth, P.C. Smith (2003), “The use of ratios in data envelopment
analysis”, Appl. Econ. Lett. 10, 733–735
Balchandran, M. (2005), “Strategic Model for Repositioning of PSBs”, IBA Bulletin,
Vol.26, No.8, pp 9-13.
Banaghan, M. (1998), “The Productivity Paradox”, Business Review Weekly, Vol.13, pp
7073.
Banknet India (2006). “ATM User Survey report 2006”. Survey conducted by Banknet India. Mumbai
banks”,Applied Economics, 2004, 36, 215–227. Barua et. al. (1991), “Information Technology and Business Value: An Analytic and
Empirical Investigation”, University of Texas, Austin Working Paper.
Batterymarch, P. (2003), “Productivity and Information Technology”, Management
Science, Vol.40, No.11, pp 1525-1535.
Beccalli, E. (2003), “Information Technology and Economic Performance: Some
Evidences from the EU Banking Industry”, Working Paper, Accounting and Finance Department, London School of Economics.
Berg et al (1992). “Malmquist Indices of Productivity Growth During the Deregulation of
Norwegian Banking, 1980-89.”Scand. J. of Economics, 94: 211-228.
Casolaro and Gobbi (2007), “Information Technology and Productivity Changes in Banking Industry”, Economic Notes, Vol.36, No1, pp 43-76.
Chandrasekhar. and Sonar (2008), “Impact of Information Technology on Efficiency and
Total Factor Productivity of Indian Banks”, South Asian Journal of Management, Vol. 15, No. 3, pp 74-91.
Charnes et al., (1994), “Data Envelopment Analysis: Theory, Methodology and
Application”, Kluwer Academic Publishers, Boston.

Charnes, Cooper & Rhodes, (1978), “Measuring the Efficiency of Decision Making
Units”, European Journal of Operational Research, Vol.2, No. 6, pp. 429-444.
Choudhari & Tripathy, (2004), “Measuring Bank Performance: An Application of DEA”,
Prajnan, Vol. XXXII, No. 4, pp.287-304.
Claudia et al (2004), “Analysing the determinants of bank efficiency: the case of Italian Coelli et al (1998), “An Introduction to Efficiency And Productivity Analysis”, Boston: Kluwer Academic Publishers
Coelli, Tim. (1996), “A Guide to Deap Version 2.1: A Data Envelopment Analysis
(Computer) Program.” Cepa Working Paper, 96/08, Department of Econometrics, University of New England, Australia:1-49.
Coelli, Tim. (1996). “Measurement of Total Factor Productivity And Biases in
Technological Change in Western Australian Agriculture.” Journal of Applied
Econometrics, 11: 77-91.
Cook, D.S. (1997), “Structural Change in the U.S. Commercial Banking Industry: The
Role of Information Technology”, Working Paper, ESA/OPA, pp 97-106.
Das et al., (2000), “Technical, Allocative and Scale Efficiency of Public Sector Banks in
India,” Reserve Bank of India, Occasional Papers, Vol. 18, Nos. 2&3, pp. 279-301.
Deyoung, R. (2006), “The Performance of Internet Based Business Models: Evidence
from the Banking Industry”, Journal of Business, Vol.78, No 3, pp 893-936.
Dos Santos et al., (1993), "The Impact of Information Technology Investment Announcements on the Market Value of the Firm", Information Systems Research, Vol. 4, pp. 1-23.
Ekata, G.E. (2012), “The Relationship between IT Expenditure and Financial
Performance of US Commercial Banks”, Doctor of Management Dissertation in
Organizational Leadership, University of Phoenix, USA.
Eyadat and Kozak (2005), “The Role of Information Technology in the Profit and Cost
Efficiency Improvements of Banking Sector”, Journal of Academy of Business and Economics, Vol.5, No.2, pp 20-35.
Gunjan M. Sanjeev, (2006), “Data Envelopment Analysis (DEA) for measuring Technical Efficiency of banks”, The Journal of Business Perspective M Vol. 10 No. 1 pp. 13-27.

Gupta et al., (2008), “Dynamics of Productive Efficiency of Indian Banks”, International
Journal of Operations Research, Vol. 5, No. 2, pp. 7890. Oxford University Press, New Delhi.
Holden and Bannany (1999), “Investment in Information Technology Systems and Other
Determinants of Banks Profitability in UK”, Website, http://www.click to convert.com., pp
1-9.
Howell, R.O. (2005), “Information Technology Investment”, Journal of Information
Technology, Vol.6. pp 1-20.
Hua, G. (2009), “Understanding Productivity: Lessons from Longitudinal Micro data”,
Journal of Economic Literature, Vol.39, No.3. pp 416-423.
Hung, V.N. (2005), “Measuring Efficiency of Vietnamese Commercial Banks: An
Application of Data Envelopment Analysis (DEA)”, in K. M. Nguye and T. L .Giang
(Eds.), Technical Efficiency and Productivity Growth in Vietnam (P. 11) Hanoi: Publishing House of Social Labour.
Jun, S. (2006) “The Nexus between IT Investment and Banking Performance in Korea”,
Global Economic Review, Vol. 35, No1, pp 67-96.
Kamakura and Ratchford, (1996), “Productivity assessment of multiple retail outlets”, J
Retail, Vol. 72, No. 4, pp. 333-56.
Kasman and Kasman (2006), “Technical Change in Banking: Evidence from Transition Countries”, International Journal of the Economics of Business. 13(1). February. 129-44
Kumar and Varma, (2003), “Technical efficiency, Benchmarks and Target: A Case
Study of Indian Public Sector Banks”, Prajnan, Vol. 31, No. 4, pp. 275-300.
Kumar N.K. (2006), “Technology- The Backbone of Banking’. Indian Bankers – Special Issue on e-payments and Commerce”, 1(3). March. 25-27
Lawrence and Yale (1992), “A Composite Cost Function for Multi-product Firms with an Application to Economies of Scope in Banking”, 221-230
Leckson and Leckey (2011), “Investment in IT and Bank’s Business Performance in
Ghana”, International Journal of Economics and Finance, Vol.3, No.2, pp 133-142.
Loveman, (1994), “An Assessment of the Productivity Impact of Information
Technologies”, T.J. Allen and M.S. Scott Morton (Eds.), Information Technology and the
Corporation of the 1990s: Research Studies, MIT Press, Cambridge MA.

Malhotra and Singh (2005), “New Revolution in Indian Banking Industry: Internet
Banking”, Punjab Journal of Business Studies.Vol.1, No.1, (April- Sept.), pp 7586.
Malmquist, Sten (1953), “Index Numbers And Indifference Surfaces.” Trabajos De
Estatistica, 4: 209-242.
Mashhour, A. (2008), “A Framework for Evaluating the Effectiveness of Information
System at Jordan Banks: An Empirical Study,” Journal of Internet Banking and
Commerce, Vol.13, No1, pp 1-14.
Mittal and Dhingra (2007), “Assessing the Impact of Computerization on Productivity
and Profitability of Indian Banks”, Delhi Business Review, Vol.8, No1, pp 63-73.
Mukherjee et al., (2002), “Performance Benchmarking and Strategic Homogeneity of
Indian Banks”, International Journal of Bank Marketing, Vol. 20, No. 3, pp. 122-139.
Nair K.N.C. (2006). ‘Banking on Technology to Meet 21st Century Challenges’.
Contributions-Vol. II. Banknet India Publication. 6-11
Nurwani and Amaratunga (2003), “IT and Performance of Banks,” Conference on Business and information, Singapore, July 12-14.
Ombati and Magutu (2010), “Technology and Service Quality in the Banking Industry”,
African Journal Of Business and Management,Vol.1, pp 151-167.
Oral and Yolalan (1990), “An empirical study on measuring operating efficiency and profitability of bank branches”, European journal of operational Research, Vol. 46, pp.
1282-94.
Parsons, Gotieb & Denny, (1993), “Productivity and Computers in Canadian Banking”,
Z. Griliches and J. Mairesse (Eds.), Productivity Issues in Services at the Micro Level, Kluwer, Boston.
Paulraj, (2001), “Data Warehousing Fundamentals”, John Wiley & Sons, Singapore.
Pepreya B.K. (2006). ‘Internet Banking’. The Indian Banker – Special Issue on e-payments and Commerce. 1(3). March. 143-45
Prasad and Harker, (1997), “Examining the Contribution of Information Technology
towards Productivity and Profitability in U.S. Retail Banking”, Wharton School,
University of Pennsylvani.

R.D. Banker, A. Charnes, W.W. Cooper (1984), “Models for estimation of
technical and scale inefficiencies in data envelopment analysis”, Manage. Sci.
30, 1078–1092.
Rahman, I.U. (2007), “Role of Information Technology in Banking Industry: Review of
Business Research”, Dissertation, Osmania University.
Rahman, I.U. (2007), “Role of Information Technology in Banking Industry: Review of
Business Research”, Dissertation, Osmania University.
RBI. Annual Reports (Various issues)
RBI. Report on Trend and Progress of Banking in India. (Various relevant issues)
RBI. Statistical Tables Relating to Banks in India. (Various Issues)
Rezvanian et al., (2008), “Efficiency Change, Technological Progress and Productivity
Growth of Private, Public and Foreign Banks in India: Evidence from the Post-Liberalization Era”, Applied Financial Economics, Vol. 18, pp. 701-713.
Sathye, (2003), “Efficiency of Banks in a Developing Economy: The Case of India”,
European Journal of Operational Research, Vol. 148, pp. 662-671.
Sharma V.K. (1993), “Computerized Banking: Efficacy and Limitations”. Changing Profile of Indian Banking. edited by Sushil. J. Lalwani. Radha Publications. New Delhi. 454-59
Shaukat, M. (2009), “Efficiency and Performance of Islamic Banking”, Far East Journal
of Psychology and Business, Vol.2. No.2, pp 1-14.
Shirley and Mallick (2005), “The Impact of Information Technology on the Banking Industry: Theory and Empirics” Queen Mary, University of London, UK.
Shroff, (2004), “Impact of Technology on Banking”, IBA Bulletin, pp. 174-181.
Sunil & Rachita, (2010), “Dynamics of Cost Efficiency in Indian Public Sector Banks: A Post-deregulation Experience”, submitted for presentation in the Twelfth Annual
Conference on Money and Finance in the Indian Economy, 11th and 12th March, 2010, pp. 1-41.
Uppal and Jha(2008), “Online Banking in India”, (New Delhi: Anmol Publications Pvt. Ltd.)
Uppal R.K. (2006), “Indian Banking Industry and Information Technology”, (New Delhi: New Century Publications)
Vassiloglon and Giokas, (1990), “A study of relative efficiency of bank branches: an application of data envelopment analysis”, Journal of the Operational Research Society,
Vol. 41, No. 7, pp. 1591-97.
Zenios et al., (1999), “Benchmarking of efficiency of bank branches”, Interfaces, Vol. 29,
No. 3, pp. 133-51.

ANNEXURE-I IT INDEX (BANK WISE)
98-99 99-00 00-01 01-02 02-03 03-04 04-05 05-06 06-07 07-08 08-09 09-10 10-11 11-12 12-13 13-14 14-15
SBBJ 0 0 0.076 0.076 0.119 0.129 0.161 0.151 0.227 0.255 0.31 0.43 0.448 0.432 0.404 0.452 0.497
SBI 0.01 0.013 0.026 0.026 0.058 0.087 0.13 0.191 0.128 0.376 0.353 0.436 0.695 0.666 0.646 0.693 0.783
SBH 0 0 0.021 0.021 0.054 0.082 0.149 0.143 0.121 0.282 0.32 0.553 0.604 0.541 0.523 0.594 0.629
SBP 0.035 0.079 0.082 0.082 0.116 0.136 0.237 0.325 0.119 0.521 0.524 0.728 0.674 0.646 0.623 0.649 0.681
SBT 0.02 0.05 0.101 0.101 0.167 0.225 0.3 0.301 0.178 0.483 0.497 0.594 0.626 0.57 0.511 0.577 0.592
CBI 0.051 0.058 0.055 0.055 0.106 0.151 0.215 0.232 0.106 0.232 0.273 0.295 0.306 0.278 0.27 0.349 0.392
BOB 0.103 0.089 0.123 0.123 0.154 0.196 0.221 0.268 0.199 0.333 0.386 0.572 0.676 0.585 0.543 0.562 0.599
BOI 0.013 0.025 0.049 0.049 0.067 0.088 0.128 0.14 0.124 0.125 0.164 0.26 0.353 0.31 0.295 0.31 0.375
PNB 0.003 0.015 0.06 0.06 0.119 0.143 0.196 0.242 0.178 0.281 0.299 0.296 0.306 0.279 0.271 0.299 0.326
DENAB 0 0 0.078 0.078 0.117 0.156 0.191 0.226 0.193 0.194 0.232 0.276 0.277 0.266 0.245 0.283 0.319
PSB 0 0 0.079 0.079 0.115 0.127 0.188 0.18 0.115 0.11 0.14 0.168 0.169 0.184 0.19 0.203 0.268
UBI 0.017 0.032 0.051 0.051 0.092 0.101 0.126 0.159 0.149 0.151 0.168 0.307 0.438 0.414 0.384 0.439 0.492
AB 0 0 0.026 0.026 0.043 0.056 0.108 0.156 0.204 0.245 0.261 0.4 0.518 0.502 0.474 0.497 0.512
IOB 0 0 0.029 0.029 0.068 0.1 0.144 0.214 0.211 0.26 0.302 0.47 0.531 0.444 0.407 0.473 0.499
OBC 0.017 0.022 0.08 0.08 0.086 0.098 0.096 0.187 0.235 0.408 0.492 0.54 0.576 0.537 0.495 0.529 0.549
CBI 0 0 0.004 0.004 0.014 0.051 0.081 0.115 0.089 0.196 0.239 0.27 0.278 0.26 0.245 0.29 0.329
FB 0 0 0.087 0.087 0.133 0.149 0.194 0.221 0.174 0.223 0.243 0.288 0.3 0.237 0.208 0.198 0.267
JKB 0 0.004 0.089 0.089 0.119 0.14 0.172 0.199 0.243 0.274 0.307 0.376 0.405 0.371 0.335 0.301 0.289
ING 0 0 0.082 0.082 0.116 0.172 0.209 0.241 0.253 0.327 0.292 0.543 0.67 0.648 0.64 0.601 0.623
KB 0 0 0.061 0.061 0.115 0.127 0.152 0.154 0.197 0.212 0.237 0.279 0.326 0.311 0.289 0.301 0.323
SIB 0 0 0 0 0.116 0.151 0.167 0.188 0.23 0.252 0.299 0.35 0.358 0.328 0.312 0.342 0.385
AXIS 0.226 0.192 0.243 0.243 0.288 0.28 0.343 0.43 0.345 0.321 0.332 0.418 0.439 0.379 0.322 0.435 0.455
ICICI 0.128 0.102 0.265 0.265 0.334 0.375 0.35 0.324 0.355 0.316 0.333 0.488 0.578 0.534 0.481 0.358 0.444
HDFC 0.221 0.181 0.223 0.223 0.256 0.242 0.244 0.272 0.332 0.337 0.231 0.448 0.462 0.363 0.307 0.345 0.387
IIB 0.684 0.442 0.275 0.457 0.414 0.487 0.289 0.303 0.369 0.368 0.416 0.457 0.364 0.279 0.229 0.265 0.342
KMB 0 0 0 0 0 0 0.38 0.392 0.393 0.282 0.309 0.392 0.348 0.316 0.261 0.284 0.302
SCB 0.225 0.191 0.189 0.189 0.211 0.351 0.325 0.426 0.49 0.465 0.48 0.569 0.6 0.601 0.576 0.216 0.214
RBS 0 0 0.734 0.734 0.446 0.523 0.628 0.652 0.716 0.736 0.76 0.83 0.876 0.878 0.89 1 1
DB 0.605 0.84 0.743 0.743 0.751 0.788 0.838 0.589 0.81 0.754 0.704 0.749 0.676 0.678 0.61 0.206 0.206
HSBC 0.49 0.467 0.398 0.398 0.484 0.51 0.555 0.531 0.65 0.686 0.716 0.747 0.778 0.78 0.791 0.291 0.291
CITIB 0.716 0.549 0.666 0.666 0.769 0.721 0.663 0.682 0.78 0.857 0.929 0.919 0.965 0.967 0.979 0.33 0.311
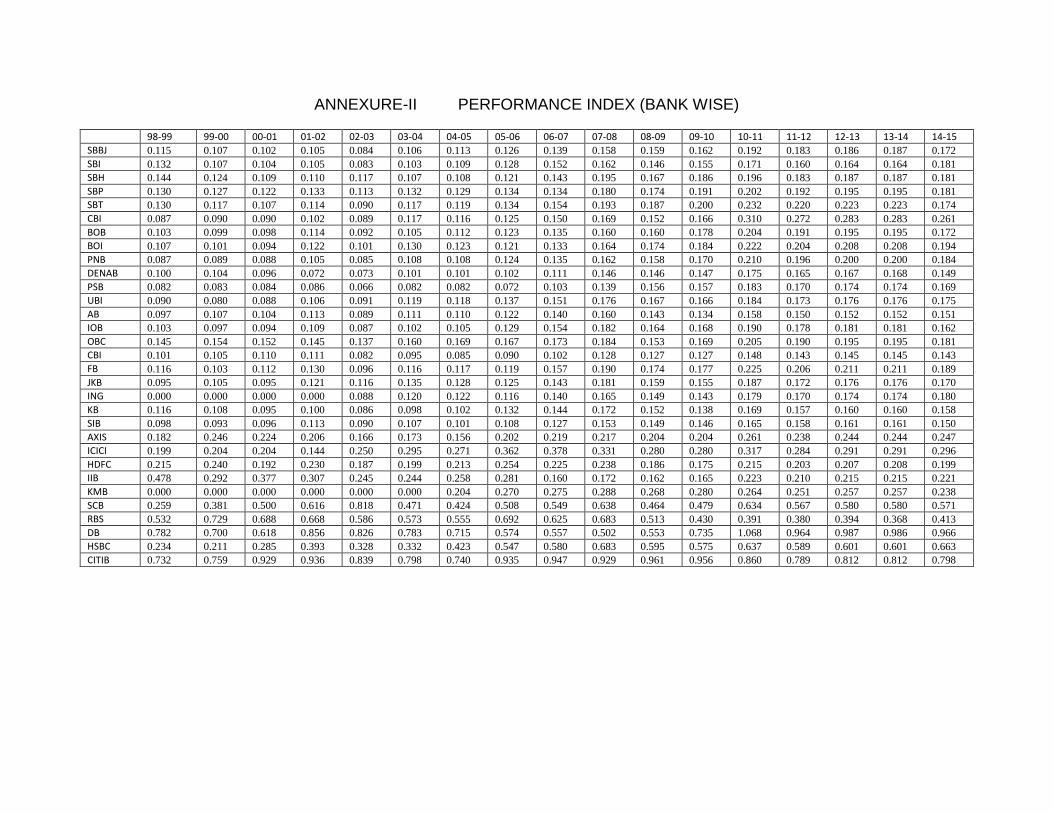
ANNEXURE-II PERFORMANCE INDEX (BANK WISE)
98-99 99-00 00-01 01-02 02-03 03-04 04-05 05-06 06-07 07-08 08-09 09-10 10-11 11-12 12-13 13-14 14-15
SBBJ 0.115 0.107 0.102 0.105 0.084 0.106 0.113 0.126 0.139 0.158 0.159 0.162 0.192 0.183 0.186 0.187 0.172 SBI 0.132 0.107 0.104 0.105 0.083 0.103 0.109 0.128 0.152 0.162 0.146 0.155 0.171 0.160 0.164 0.164 0.181 SBH 0.144 0.124 0.109 0.110 0.117 0.107 0.108 0.121 0.143 0.195 0.167 0.186 0.196 0.183 0.187 0.187 0.181 SBP 0.130 0.127 0.122 0.133 0.113 0.132 0.129 0.134 0.134 0.180 0.174 0.191 0.202 0.192 0.195 0.195 0.181 SBT 0.130 0.117 0.107 0.114 0.090 0.117 0.119 0.134 0.154 0.193 0.187 0.200 0.232 0.220 0.223 0.223 0.174 CBI 0.087 0.090 0.090 0.102 0.089 0.117 0.116 0.125 0.150 0.169 0.152 0.166 0.310 0.272 0.283 0.283 0.261 BOB 0.103 0.099 0.098 0.114 0.092 0.105 0.112 0.123 0.135 0.160 0.160 0.178 0.204 0.191 0.195 0.195 0.172 BOI 0.107 0.101 0.094 0.122 0.101 0.130 0.123 0.121 0.133 0.164 0.174 0.184 0.222 0.204 0.208 0.208 0.194 PNB 0.087 0.089 0.088 0.105 0.085 0.108 0.108 0.124 0.135 0.162 0.158 0.170 0.210 0.196 0.200 0.200 0.184 DENAB 0.100 0.104 0.096 0.072 0.073 0.101 0.101 0.102 0.111 0.146 0.146 0.147 0.175 0.165 0.167 0.168 0.149 PSB 0.082 0.083 0.084 0.086 0.066 0.082 0.082 0.072 0.103 0.139 0.156 0.157 0.183 0.170 0.174 0.174 0.169 UBI 0.090 0.080 0.088 0.106 0.091 0.119 0.118 0.137 0.151 0.176 0.167 0.166 0.184 0.173 0.176 0.176 0.175 AB 0.097 0.107 0.104 0.113 0.089 0.111 0.110 0.122 0.140 0.160 0.143 0.134 0.158 0.150 0.152 0.152 0.151 IOB 0.103 0.097 0.094 0.109 0.087 0.102 0.105 0.129 0.154 0.182 0.164 0.168 0.190 0.178 0.181 0.181 0.162 OBC 0.145 0.154 0.152 0.145 0.137 0.160 0.169 0.167 0.173 0.184 0.153 0.169 0.205 0.190 0.195 0.195 0.181 CBI 0.101 0.105 0.110 0.111 0.082 0.095 0.085 0.090 0.102 0.128 0.127 0.127 0.148 0.143 0.145 0.145 0.143 FB 0.116 0.103 0.112 0.130 0.096 0.116 0.117 0.119 0.157 0.190 0.174 0.177 0.225 0.206 0.211 0.211 0.189 JKB 0.095 0.105 0.095 0.121 0.116 0.135 0.128 0.125 0.143 0.181 0.159 0.155 0.187 0.172 0.176 0.176 0.170 ING 0.000 0.000 0.000 0.000 0.088 0.120 0.122 0.116 0.140 0.165 0.149 0.143 0.179 0.170 0.174 0.174 0.180 KB 0.116 0.108 0.095 0.100 0.086 0.098 0.102 0.132 0.144 0.172 0.152 0.138 0.169 0.157 0.160 0.160 0.158 SIB 0.098 0.093 0.096 0.113 0.090 0.107 0.101 0.108 0.127 0.153 0.149 0.146 0.165 0.158 0.161 0.161 0.150 AXIS 0.182 0.246 0.224 0.206 0.166 0.173 0.156 0.202 0.219 0.217 0.204 0.204 0.261 0.238 0.244 0.244 0.247 ICICI 0.199 0.204 0.204 0.144 0.250 0.295 0.271 0.362 0.378 0.331 0.280 0.280 0.317 0.284 0.291 0.291 0.296 HDFC 0.215 0.240 0.192 0.230 0.187 0.199 0.213 0.254 0.225 0.238 0.186 0.175 0.215 0.203 0.207 0.208 0.199 IIB 0.478 0.292 0.377 0.307 0.245 0.244 0.258 0.281 0.160 0.172 0.162 0.165 0.223 0.210 0.215 0.215 0.221 KMB 0.000 0.000 0.000 0.000 0.000 0.000 0.204 0.270 0.275 0.288 0.268 0.280 0.264 0.251 0.257 0.257 0.238 SCB 0.259 0.381 0.500 0.616 0.818 0.471 0.424 0.508 0.549 0.638 0.464 0.479 0.634 0.567 0.580 0.580 0.571 RBS 0.532 0.729 0.688 0.668 0.586 0.573 0.555 0.692 0.625 0.683 0.513 0.430 0.391 0.380 0.394 0.368 0.413 DB 0.782 0.700 0.618 0.856 0.826 0.783 0.715 0.574 0.557 0.502 0.553 0.735 1.068 0.964 0.987 0.986 0.966 HSBC 0.234 0.211 0.285 0.393 0.328 0.332 0.423 0.547 0.580 0.683 0.595 0.575 0.637 0.589 0.601 0.601 0.663 CITIB 0.732 0.759 0.929 0.936 0.839 0.798 0.740 0.935 0.947 0.929 0.961 0.956 0.860 0.789 0.812 0.812 0.798