
The Impact of Structural Adjustment Programmes on the ...archive.lib.msu.edu/DMC/African...
25
The African e-Journals Project has digitized full text of articles of eleven social science and humanities journals. This item is from the digital archive maintained by Michigan State University Library. Find more at: http://digital.lib.msu.edu/projects/africanjournals/ Available through a partnership with Scroll down to read the article.
Transcript of The Impact of Structural Adjustment Programmes on the ...archive.lib.msu.edu/DMC/African...

The African e-Journals Project has digitized full text of articles of eleven social science and humanities journals. This item is from the digital archive maintained by Michigan State University Library. Find more at: http://digital.lib.msu.edu/projects/africanjournals/
Available through a partnership with
Scroll down to read the article.

88 UTAFITI (New Series) Vol. 1 No 2, 1994
The Impact of Structural AdjustmentProgrammes on the Natural Resource Base:
The Case of Tourism Development
I.A.J. McbaUo1
AbstractDecisions taken to allocate natural resources such as land, coastalbeaches, wildlife and protected areas to tourism infrastructuredevelopment have not given due consideration to resource basecapability (carrying capacity) to sustain the designated developmentor use.
In the period of implementing Structural Adjustment programmes(SAPs) in Tanzania, we have experienced increased allocation ofprotected areas (land) to lodge development, hotel construction onfragile beach areas or over utilization of the national parks. In theshort term this development might seem profitable, but may havelong term adverse effects on the resource base and the nationaleconomy.
SAPs encourage investment into the development of tourisminfrastructure without a parallel package (in form of financing andpolicy Ilegislation enactment) for environmental safety. Thus manyprojects are executed without Environmental .Impact Assessment(EIA), environmental monitoring and relevant mitigation measures.or at times expert opinions are overruled. As a consequence thereare many incidences of resource abuse and resource over-use.
The paper examines the SAPs' policy instruments andassumptions that relate to the development of tourism and those thatprovide for natural resource utilization, and their shortcomings. Itanalyses the tools and style of implementation of SAPs to reveal thetrends in resource base degradation. Examples and data are drawnfrom national parks, and coastal beach tourism projects development.
INational Environment Management Council

SAPs Bnd Natural Resources: The Case of Tourism 89
to show that tourism development under SAPs infringes on itsresource base. and therefore are environmentally unsustainable. Amodel is created to predict the eventuality of both the resource basedegradation and tourism development, and suggest how this can beavoided.
1. IDtrodudion
In Tanzania. there are three types of tourism practised:
(i) Nature-based tourism, Le .• enjoyment of scenery and wild life, whichinclude walking, climbing, safari, hunting and fishing.
(ii) Coastal resorts tourism which depends on beaches, sea, and otherwater bodies for recreation and relaxation.
(iii) Cultural tourism which involves visiting historical sites, e.g. caves,monuments, etc.
This article deals mainly with nature-based tourism.Tourism is one of Tanzania's foreign exchange earner. In 1993, a total of
230,000 tourists came to Tanzania, earning the country realise US $ 180.0million. It has also encouraged investment through IPC in various touristsectors, especially tourist hotels.
This article addresses the problem that despite being a good source ofincome, the government has not put enough safeguards and monitoring of itseffects on its resource base. Emphasis is put on the significance of eco-tourismas against mass tourism.
Finally, the paper gives recommendations on the future development oftourism sector and the importance of striking a balance between environmentalconservation and tourism development.
2. Structural Adjustment Policies
The concept of structural adjustment has its origins in the global economicevents of 1973-1974 and the first oil shock. The 350 percent rise in oil priceshit developing country economies. In many countries, for example, the cost ofoil imports rose to 1/5 of total exports. The ensuing 1974-1975 recession ledto a 10 percent contraction in world trade and a sharp decline in export pricesof many commodities, thus aggravating the ability of many developing countriesto meet outstanding financial obligations (Reed, 1992).
90 I.A.J. Mchalla
The second oil shock of 1979 hiked oil prices to 130 percent, pushing theinternational financial system to the point of collapse, and again increasing thepercentage of developing country exports needed to purchase oil. Further, fromthe late 1970s onward, most commodities exported by developing countriesdeclined in value in relation to imported manufactured goods (Reed, 1992).
We can therefore say that, high interest rates, declining commodity prices,and internal and external imbalances in the industrialized societies createdadverse economic conditions for the developing world by the beginning of the1980s. In addition, developing countries were often beset by deeply rootedeconomic distortions and inefficiencies that had become widespread in theirproduction, distribution and financial systems.
The IMF responded to the evolving crisis by widening the range of financingfacilities available to member countries. By 1981, increased IMF disbursementsrepresented 33 per cent of low-income developing countries current accountdeficits (Reed, 1992).
However, the IMF financial support could not stem the stagnation anddecline sweeping much of the developing world. Dwindling financial reserves,uncontrolled inflation, rising debt obligations, declining productivity, decliningexport earning capacity, and growing social instability typified conditions in anumber of countries. The World Bank decided to commit its own resources tohelp correct the perversive macro-economic imbalances.
3. SAPs in Tanzania
Tanzania was also engulfed in the web of the economic imbalances affecting thethird world. In the mid-1970s, Tanzania's economy was beginning to sufferfrom its ambitious and increasingly umealistic development policies (See TableI).
Public sector revenue, even with high and rising foreign aid did not keeppace with the growth of public expenditures. Exports began to decline, thusconstraining the capacity for imports. Distribution of goods within the country,including vital inputs for agriculture was stifled by bureaucratic red tapeincurred through the massive nationalization of trade. Peasant farmers wereunable to increase their productivity either collectively or individually. Twofactors may have contributed to conceal the underlying imbalances in theeconomy in the mid 1970s.

SAPs and Natural Resources: The Case of Tourism 91
Table 1: Selected economic indicators (% annual changes)
1967-73 1974-78 1979-81 1982-84 1985-87
GDP per capita 2.5 -0.9 -l.l -2.9 0.7
Inflation 8.5 15.1 23.2 30.6 33.1
Exports 3.6 -6.8 7.1 -16.7 6.0
Imports 3.6 2.8 14.3 -8.4 13.8
Ratio of net -2:6 -9:6 -11:4.
-7:1 -12:4exports to GDP
Ratio of debt 120:6 187:1 261:1 513:1 902:4to export
Source: World Bank r:evelopment ndicators, and Lele (11,/: :8).
(i) Sharp increase in coffee prices. As international coffee prices shot upin 1975 and 1976, Tanzania's coffee prices more than doubled duringthe two years. This windfall raised the value of exports andimproved temporarily the balance of payments and raised incomes.The terms of trade improved by one-third during 1975-77.
(ii) Boom in foreign aid. Tanzania had,.already in the first part of the1970s been a major recipient of foreign assistance. During 1974-80the nominal value of such assistance, counted per capita. increasednearly fourfold (See Table 2).
However starting 1979, a series of negative external shocks unravelled theweaknesses of the Tanzanian economy. Coffee prices fell sharply just as thesecond oil shock occurred. The result was a dramatic decline in Tanzania'sterms of trade, a decline by 40% during 1978-82. The upsurge in internationalinterest rates and thus in Tanzania's external debt burden. added further to thestrain. In addition. aid flows which reached a peak around 1980 and fell sharplyin real per capita terms from 1981. On top of all these. Tanzania was draggedinto a war with Uganda.

92 I.A.J. Mchsllo
Table2: F~ aidto Tftn---
nd IMP.p
Year Per capita Year Per capitanet receipts net receipts
(constant 1983 (constant 1983US$ prices US$ prices
1913 18.1 1982 31.5
1914 18.5 1983 29.1
1915 30.2 1984 25.4
1916 29.1 1985 21.0
1911 33.2 1986 21.6
1918 33.5 1981 33.5
1979 42.0 1988 34.9
1980 42.9 1989 30.9
1981 44.7 1990 28.4:iOUTce: World Bank, orld DeveIoI ment indicators a
Owing to these economic crises, and following the pressure from the WorldBank and the International Monetary Fund (IMF), Tanzania embarked onmeasures of reviving the economy to arrest these economic distortions. Itlaunched a number of economic programmes popularly known as StructuralAdjusunent Programmes SAPs. There have so far been four such programmes:
(i) National Economic Survival Programme (NESP).(ii) Structural Adjusttnent Programme (SAP).(iii) Economic Recovery Programme (ERP).(iv) Economic and Social Action Programme (ESAP or ERP II).
3.1 National Economic Survival Progrrl1ll1lU (NESP)
This was a one-year programme and a major attempt by the Tanzaniagovernment launched in the 1981/82 fiscal year to deal with the economic

SAPs end Neturel Resources: The Case of Tourism 93
difficulties facing the country. The main objective of NESP was to mobilizedomestic resources to the maximum possible. The main elements included:
(i) an aggressive export drive in order to increase substantially foreignexchange earnings,
(ii) judicious use of available foreign exchange so as to enhance futureearning capacity as weIras save on imports.
(iii) the elimination of food shortage through inexpensive small scalevillage irrigation projects, as well as the cultivation of drought-resistant food crops.
3.2 Structural Adjustment frogramme (SAP)
This was a three-year programme (1982-1985) whose major objectives were to:
(i) Restructure future economic activity through better incentive ~ystems,and revise priorities in government spending to achieve a moresustainable external balance and renewed growth.
(ii) Rationalize production structures to achieve increased capacityutilization improved manpower utilization and to reduce unproductiveactivities.
(iii) Improve planning and control mechanisms through more effectivebudgeting, monitoring, evaluation and enforcement of agreedpriorities.
The economic theories behind SAP, were appiication of all the theories ofproduction, Le., changing of raw materials into finished goods, distribution ofthe goods and provision of services by using aids to trade likebanking, insurance, etc. However, even after the implementation of SAP, resultswere that:
(i) Industrial output continued to decline.(ii) Transport sector continued to face problems.(iii) Social services (health, education and water supply) continued to
deteriorate.(iv) Natural resources and environment continued to deteriorate.

94 I.A.J. Mchallo
One of the main reasons for failure of SAP was lack of adequate foreignexchange inflow to finance importation of essentials and spare parts.
3.3 EcononUc Recovery Progrtlllf1lfe (ERP)
As a continuation and improvement of SAP the government launched EconomicRecovery Programme. a three-year programme spanning from 1986 to 1989.The main goal was to enable Tanzania to achieve sustained growth in realincomes and welfare improvements. The major objectives were to:
(i) Increase the output of food and export crops through appropriateincentives for production. improving marketing StructuIes, andincreasing the resources available to agriculture.
(ii) Rehabilitate the physical i.nfrastruaure of the country in support ofdirectly productive activities.
(iii) Increase capacity utilization in industry through the allocation ofscarce foreign exchange to priority sectors and firms.
(iv) Restore internal and external balances by pursuing prudent fiscal,monetary and trade policies.
Strategies employed to achieve these objectives included:
(i) Exchange rate adjustment.(ii) Raising producer prices and interest rates.(Hi) Reduction of credit expansion.(iv) Improving efficiency in agriculture, industry and the economic
infrastructure by providing adequate inputs and services.
Although ERP seemed to be comprehensive, it could not solve the economicproblems because there was continued deterioration in the terms of trade due tothe substantial decline in world coffee prices, and weak: world prices for otherTanzanian agricultural exports. These reduced export earnings and widened thecurrent account deficit. Prices of imports continued to rise as opposed to theprices of exports. Devaluation of the shilling continued while the agriculturaleconomy could not respond to expectations made by devaluation. Essential andluxury goods continued to be imported since they could not be manufactured inthe country.
SAPs lUId Nllturlll Resources: The Cue of Tourism 95
3.4 Economk t11Ul SociIJI Action ProgrtuIuIu (ESAP or ERP 11)
This was implemented in 1989/90 to 1991/92 as the successor to the ERP.Market liberalisation measures were gradually extended to achieve the samemacro-economic goals set under the ERP but greater emphasis was placed onalleviating the social costs of adjustment. Decontrol of prices has been gradualover time and price decontrolled goods were reduced from 72 product categoriesin 1984 to only two in mid 1991 (World Bank, 1991). Liberalisation of theforeign exchange market and banking sector also began in 1992 under thisprogramme. IMF backing for the programme continued after July 1991 with theapproval of an enhanced structural adjustment facility credit of SDR 181.9mover the period of three years. Thus the process of gradual economicliberalisation has continued without interruption to the present.
ESAP has not succeeded fully since, social services have continued todeteriorate, natural resources and environment have continued to be degraded,and the whole economy is still heavily dependent on foreign donors.
From an environmental point of view, it is worth noting that a verysignificant aspect was not incorporated in the menu of the SAP policies, Le.,environmental dimensions. Actually it is clearly indicated in the SAP document,that "SAPs do not include natural resources and tourism" (SAP, 1982). Thus,in implementing SAPs in Tanzania, some important environmental considerationswere not taken into account. Tourism development is the case in point.
4. SAPs and Tourism Development
Tourism as an industry began in Tanzania since the colonial days. Thecountry's superb and vast game reserves cover nearly one-third of its total area.There are the world's most dramatic and most densely populated natural parksand game sanctuaries of the "Northern circuit": Serengeti (about 15,000 sq.km); Ngorongoro crater (610m deep and 20km in diameter); Tarangire,Manyara, and the Arusha National Park with its wonderful views of MountsMeru and Kilimanjaro.
The "Southern circuit" embraces the wen-known Selous game reserve andthe less well-known Mikumi. There are also Ruaha National Park and the shoreof Lake Malawi and Lake Tanganyika. One of the most spectacular game parksin the world is in the Mahale mountains on Lake Tanganyika. There are also800km Indian ocean coastline, the "Spice Islands" of Zanzibar, Pemba, and

96 I.A.J. Mch8llo
Mafia; prehistoric sites, rock paintings, ancient towns, together with the folkloreand artistry of some 120 tribes which offer the richest of African tapestries forinternational visitors.
The government's policy is to encourage private investment in the touristindustry, both privately and also through joint ventures. "Up-market" touristdevelopments' are favoured. On the basis of a five-year tourism developmentplan, the government hopes to substantially rehabilitate and improve thecountry's tourism related physical infrastructure and services, and undertake anextensive promotion campaign for the purpose of attracting international tourismto Tanzania. It aims at attracting 500,000 tourists, earning the country $ US500 million per year by the year 2,000 (UNIDO; 1992).
The Tanzania government considers private investment (both foreign andlocal) as the leading engine of growth. It has therefore, taken steps to providea macro-economic framework and an enabling environment for private investorsto operate. In this connection the private sector is being assigned an increasingrole in Tanzania's overall development, a policy that has been reinforcedthrough the introduction of several recent measures.
In connection with economic liberalization and the government's policy toencourage private investments in the tourism industry, the government embarkedupon promoting tourism and encouraging investment in tourism industry e.g.construction of hotels in the parks and coastal beaches.
A number of investors interested in tourism industry have been issued withtourist clearances to invest without consultation with the ConservationInstitutions e.g. TANAPA. Therefore they come with predetermined sites onwhere to develop their infrastructure. Many of these development projects havenot been subjected to Environmental Impact Assessment (EIA). Where EIA hasbeen carried out, there has not been sufficient public participation, monitoringand auditing plans to ensure compliance to intended, mitigation or standards.Below is a few case studies.
4.1 Tarangin National Pari
4.1.1 Description
The Tarangire National Park comprises a 2,600 kIn' portion of the Tarangireecosystem. The entire ecosystem encompasses approximately, 20,500 kIn2 of

SAPs and Natural Resources: The Casa of Tourism 97
the Masai Steppe. The park is located in an arid Acacia savannah belt 118 kInsouth of Arusha east of the Great North Road within the administrative districtsof Babati, Monduli, Kiteto, Simanjiro and Kondoa.
Tarangire National Park is the fourth largest park in Tanzania with one ofthe highest density of elephants of any park in the country. It is part ofTanzania's popular northern tourist cireuit that includes Antsha, Mt.Kilimanjaro, L. Manyara, and Serengeti National Parks as well as NgorongoroConservation Area. One unique feature is the Tarangire River that flowsthrough the centre of the national park from south to north/north-west, andempties its water in the Tarangire ecosystem.
The park is endowed with wetlands (the Silale, Gursi, Larmakare, and NguseLororoboi) which act as sponges by supplying Tarangire River with water duringdry periods. Because of availability of water, the park has a high concentrationand variety of wildlife in the dry season.
Tarangire National Park is a dry season refuge for a majority of themigratory wildlife in the Tarangire ecosystem. The park is very rich inmllmmllls and birds. It is estimated that during the dry season total biomass oflarge mammals inside the park is well in excess of 35 metric tonslkm2• It hasmore than 550 species of birds. Particularly rich bird life occurs in the openAcacia woodlands, in and along the wetlands (Silale swamp), and in the floodplain of Tarangire river.
Vegetation comprises Acacia and Commiphora species with approximately10 vegetation types. The significance of the park is that it:
(a) possesses, second only to Serengeti/Ngorongoro ecosystem, thehighest concentration of wildlife during the ~ season of any area inTanzania (Lamprey 1964);
(b) is one of the few protected areas in Tanzania with a hydrologicalregime that ensures a permanent year round water source for thepark's most exceptional resources - the Tarangire River;
(c) Is the only national park in Tanzania's northern circuit where one caneasily view a large concentration ef elephants during almost any timeof the year.
(d) Is one of the few protected area in Tanzania where one can easily seeconcentrations of onyx.
(e) possesses within its acacia habitat one of the highest'known diversityof breeding birds in a single vegetation type (Moreau, 1966).
98 LA.J. Mchallo
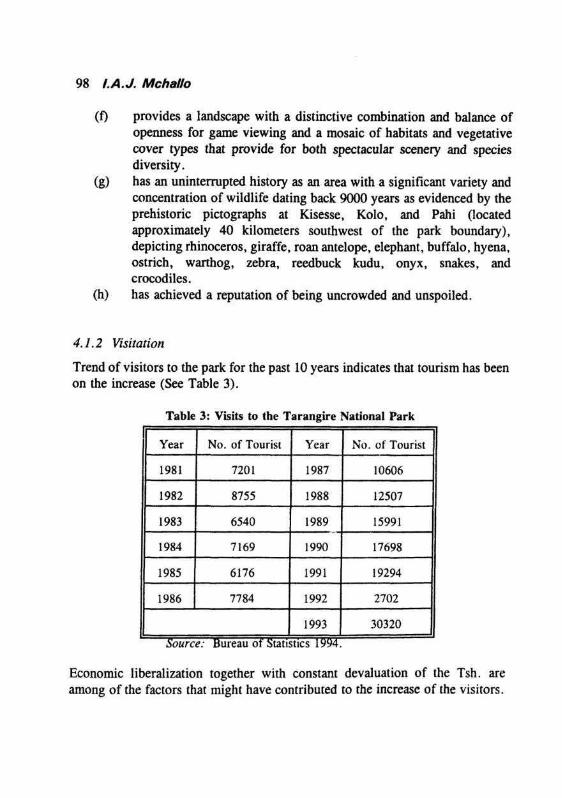
(f) provides a landscape with a distinctive combination and balance ofopenness for game viewing and a mosaic of habitats and vegetativecover types that provide for both spectacular scenery and speciesdiversity.
(g) has an uninterrupted history as an area with a significant variety andconcentration of wildlife dating back 9000 years as evidenced by theprehistoric pictographs at Kisesse, Kolo, and Pahi (locatedapproximately 40 kilometers southwest of the park boundary),depicting rhinoceros, giraffe, roan antelope, elephant, buffalo, hyena,ostrich, warthog, zebra, reedbuck kudu, onyx, snakes, andcrocodiles.
(h) has achieved a reputation of being uncrowded and unspoiled.
4.1.2 Visitation
Trend of visitors to the park for the past 10 years indicates that tourism has beenon the increase (See Table 3).
Table 3: Visits to the Tarangire National Park
Year
1981
1982
1983
1984
1985
j 1986
No. of Tourist
7201
8755
6540
7169
6176
7784
Year
1987
1988
1989
1990
1991
1992
1993
No. of Tourist
10606
12507
15991
17698
19294
2702
30320 |
Source: Bureau of Statistics 19947
Economic liberalization together with constant devaluation of the Tsh. areamong of the factors that might have contributed to the increase of the visitors.

SAPs and Natural Resources: The Case of Tourism 99
4.1.3 Hotel Projects in the ParkThe Arusha based consolidated SOPA Company was in 1990 granted a lease toconstruct a 150 bed two-storey hotel in the Park. It was also leased to run 10special camp sites, one permanent tented lodge and another permanent tentedcamp. The initial plan of the promoters was to construct the lodge in thenverine grassland near to river Tarangire. However, following release of theManagement Zone Plan (MZP) by TANAPA, which prohibits any developmentin the area, the developers were offered another alternative site away from theriver but within the national park.
The MZP focuses on diversity, providing for a wide range of "appropriate"visitor experiences consistent with the policies, acts, ordinances and managementobjectives. For management planning, purposes, the park is divided into 4zones:
(i) The Cone Preservation Zone(ii) Conservation General Use Zone(iii) Semi-Wilderness Zone(iv) Wilderness Zone
Location for the proposed SOPA Lodge is in the Conservation General UseZone.
4.1.4 Limits of Acceptable Use
MZP does not attempt to determine a "carrying capacity", i.e., of how muchuse and development the area can tolerate. Ra$,er, it requires that "limits ofacceptable use" (LAU) be determined. The. LAU system represents areformulation of the carrying capacity concept, with primary emphasis on theconditions (both physical and social) desired in the area, rather than on themaximum amount of use and development the area can tolerate.
The LAU focused on the maximum number of beds established for thosezones designated for overnight stays, and the number of vehicles per kilometerin the most frequented zone of the park. The LAU was determined using thebest available information to achieve a desired condition - an appropriate balancebetween preservation and tourism use/development. Accordingly, limits ofacceptable use have been set for each zone.
In the Core Preservation Zone, the quality of the overall visitor experiencefor the Park will be based on the number of vehicles per kilometer during a
100 I.A.J. MchaHo
peak season day on the existing described roads (east and west loop road alongboth sides of the Tarangire River and the ridge road overlooking SiIale Swampwithin the Core Preservation Zone).
The MZP Action states that estimated number of vehicles per kIn on a peakseason day on the eXli.ting described roads is approximately 1 vehicle per 1.6kilometers. However, the actual existing situation estimated number of vehiclesper km on a peak season day on the existing described roads is approximately1 vehicle per 2.7 kilometers. Calculations of the number of vehicles per kIn forexisting conditions included the number ofbeds and the estimates of the numberof day users on a parkwide basis.
Assume that on a peak season, the 150-bed Sopa Lodge will be operating atfull capacity, i.e., 150 visitors, and that they will visit the various zones; andsupposing that 75% of them will be willing to head to the Core PreservationZone since it has the largest concentration of animals Le. about I B. Normallythey will be using mini-buses canying 6 visitors each. Thus we arrive at asituation of having 19 vehicles heading towards the same destination. Such anumber of tourist vehicles at a time spoils the natural set-up of a park, thusspoiling the solitude and prestinity of a natural area. In case they came acrosssome of the most interesting animaI species, e.g., cheetah, lion, or rhino, sucha big group of visitors per one attraction is a menace to the animal.
It is not easy for the drivers to follow the driving regulations of the zoneplans. Some of them do not have regard to wildlife, they are mainly interestedin impressing their clients and are prepared to break Park laws. There areinstances where drivers have been seen chasing cheetah, leopard or lions, off-road driving, and doing other illegal activities, e.g., shouting to animals.
Also, if one assumes that, on a peak season, one fme morning between 8.00to 9.00 am, the visitors get into the vehicles to the Core Preservation Zone. Inthis case we will have 150 visitors, and taking 6 visitors per vehicle, we willhave about 25 vehicles. The number of vehicles is quite high contrary to theMZP. Allowing such a number of vehicles in the Park has serious effects, suchas:
(a) Degradation of the road which can easily be damaged due to over-utilization by the vehicles.
(b) Visitor pressure exceeds the tolerance of the animals, causing stressand therefore interfering with the physiological and behaviourial weIl-
SAPs and Natural Resources: The Case of Tourism 101
being of the animals, which might reduce the breeding success.(c) Visitors' pressure may cause animals and birds to keep constantly on
the move, thereby making them occupy less favourable areas andcausing high egg and young mortality rate in unattended nests.
(d) Pollution (dust and fumes) which has negative effects tothe ecosystem and the biodiversity within it.
(e) Noise which has a disturbing effect to the wildlife.
The national park has its value. Economic valuation can demonstrate andmeasure economic values, and also fmd ways to measure the value:
The value of a given resource - Total Economic Value (TEV)TEV = Direct use value + Indirect use value + Option value +
Existence value
Further scientific studies may be needed to go into the details of suchcalculations. However, the point here is that, investing Tsh. x millions in thelodge in order to generate revenue in forex but with the possibility of ruining thepark could be a loss as against not constructing the lodge at all .with. or.without. the project concept.
According to the Zone plan, managing the park can be more beneficial thanthe construction of the lodge in that:
1. Apart from the tourists, the activities alone in the hotel are enough tocreate disturbance to the wildlife. Th.e movement of the workers ofthe hotel-whether they stay at the hotel or away-causes noisepollution which has a disturbing effect to the animals. and thereforetheir behavioral well being which might affect the reproduction trend.
2. Construction of such a big hotel in the centre of a national park isinterfering with the ecological balance of that ecosystem which affectthe animals.
4.2 Kilil1la1ljaro Natio1lal Park
4.2./ Description
Mt. Kilimanjaro. the highcst mountain in Africa and one of thc world's largestfree standing mountains. is located 330 kilometcrs south of the equator on the

102 I.A.J. MchaJlo
northern boundary of Tanzania. It is Africa's most scenic mountain, and theview of its majestic, snow capped peak is recognized throughout the world. Themountain is a natural focal point for all of East Africa, and a source of waterfor the surrounding areas.
The ecosystem of mt. Kilimanjaro is a succession of distinct vegetation zonesthat form belts around the mountain: lower slopes, montane forest; health andmoorland; alpine desert; and summit. Each zone is characterized by the typesof plants best adapted to the set of environmental conditions at that altitude,particularly the range of temperatures and the amount of rainfall. Agricultureand settlement on the mountains lower slopes have replaced the naturalvegetation in what used to be a IGwer montane forest.
Kilimanjaro National Park comprises the area (75,353 hectares) above the2,700 meter contour. Kilimanjaro Forest Reserve surrounds the park andcomprises the area (92,906 hectares excluding the plantations and the Half MileStrip) between the 1,820 meter colltour and the 2,700 meter contour. The parkalso includes six right-of-way corridors through the forest reserve. It is locatedin Tanzania's northern tourist circuit of the parks.
The significance of the mountain lies in the fact that:
(a) Kilimanjaro is one of the few mountain ecosystems located near theequator that contains large expanses of ice glaciers. It has thegreatest extent of alpine desert of all the glaciated equatorialmountains in East Africa.
(b) The montane forest on Mt. Kilimanjaro is one of the most importantwater catchment areas in all of Tanzania.
(c) The convention on International Trade in Endangered Species of WildFauna and Flora (CITES) identifies 11 species of fauna believed tobe present in the Mt. Kilimanjaro eco-system.
4.2.2 VisitationThe number of tourists climbing Kilimanjaro has been increasing steadily overthe past 10 years.
Climbing and hiking are the primary activities on the mountain. Most hikersspend approximately 4 nights and 5 days on the mountain. Although there area number of options for climbing Mt. Kilimanjaro, 91 per cent of all hikers use
SAPs and Natural Resources: The Case of Tourism 103
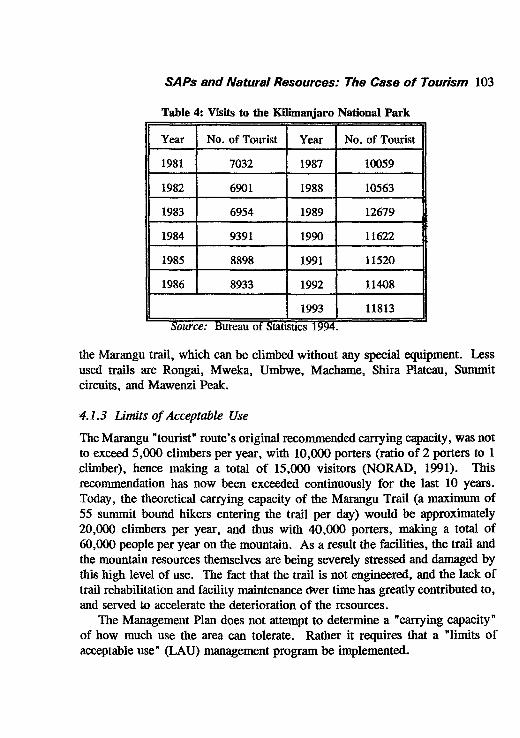
Table 4: Visits to the Kilimanjaro National Park
Year No. of Tourist Year No. of Tourist
1981 7032 1987 100591982 6901 1988 105631983 6954 1989 126791984 9391 1990 116221985 8898 1991 115201986 8933 1992 11408
1993 11813Source: Bureau of StatIStICS1~~4.
the Marangu trail, which can be climbed without any special equipment. Lessused trails are Rongai, Mweka, Umbwe, Machame, Shira Plateau, Summitcircuits, and Mawenzi Peak.
4.1.3 limits of Acceptable Use
The Marangu "tourist" route's original recommended carrying capacity, was notto exceed 5,000 climbers per year, with 10,000 porters (ratio of 2 porters to 1climber), hence making a total of 15,000 visitors (NORAD, 1991). Thisrecommendation has now been exceeded continuously for the last 10 years.Today, the theoretical carrying capacity of the Marangu Trail (a maximum of55 summit bound hikers entering the trail per day) would be approximately20,000 climbers per year, and thus with 40,000 porters, making a total of60,000 people per year on the mountain. As a result the facilities, the trail andthe mountain resources themselves are being severely stressed and damaged bythis high level of use. The fact that the trail is not engineered, and the lack oftrail rehabilitation and facility maintenance (JVertime has greatly contributed to,and served to accelerate the deterioration of the resources.
The Management Plan does not attempt to determine a "carrying capacity"of how much use the area can tolerate. Rather it requires that a "limits ofacceptable use" (LAU) management program be implemented.
104 J.A.J. Mchallo
The management zones set by the general management plan for KilimanjaroNational Park are 8 with a total of 168,259 hectares. Taking the example of the"Intensive Use Hiking Zone - 2,700 Marangu Trail", this zone will comprise theMarangu trail and all permanent facilities associated with the redesignedMarangu parking area and the upgraded hut complexes located along themarangu trail. This plan will establish the limits of acceptable use alone for theMarangu route not to exceed 58 climbers per day and 10,500 climbers per year.
It is worth to strike a balance between utilisation of Mt. Kilimanjaro and itspreservation, bearing in mind the value of rich biodiversity in flora and faunawhich is high when quantified.
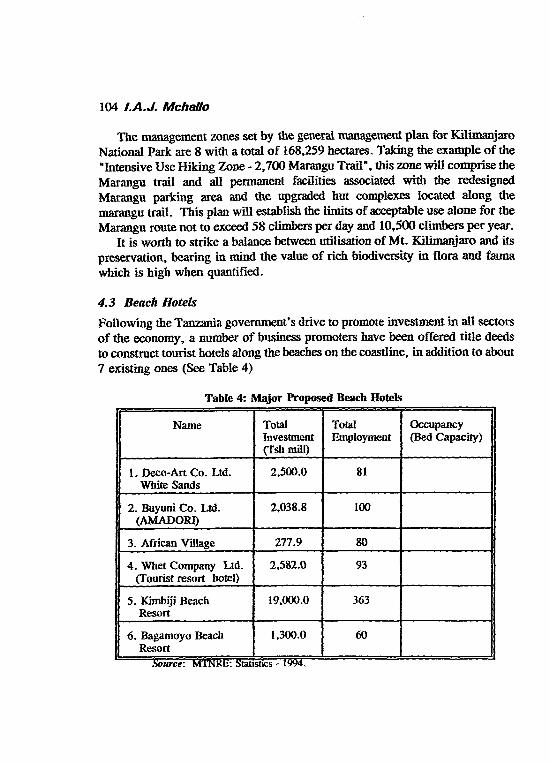
4.3 Beach HotelsFollowing the Tanzania government's drive to promote investment in all sectorsof the economy, a number of business promoters have been offered title deedsto construct tourist hotels along the beaches on the coastline, in addition to aoout7 existing ones (See Table 4)
Table 4: Major Proposed Beach Hotels
Name Total Total OccupancyInvestment Employment (Bed Capacity)(fsh mill)
1. Deco-Art Co. Ltd. 2,500.0 81White Sands
2. Buyuni Co. Ltd. 2,038.8 100(AMADOR!)
3. African Village 277.9 80
4. Whet Company Ltd. 2,582.0 93(Tourist resort hotel)
5. Kimbiji Beach 19,000.0 363Resort
6. Bagamoyo Beach 1,300.0 60Resort
Source: MrNKh: ~tatistlCS - IW4.

SAPs end NeturBl Resources: The eese of Tourism 105
Some scientific studies have been carried out on the coastline on varioussubjects. but only little studies so far have dwelt on the "carrying capacity"concept. Although the beautiful beaches have to be utilised in order to tap themuch needed foreign currency. this has to be done in a sustainable manner. Thecoastline. as an environmental asset. has its limits of providing services beyondwhich it becomes overloaded and prone to destruction.
From Table 4, it is clear that hotels with investments of over Tsh. 2.()()()mare big structures which will have approximately over 100 bed capacity.Assuming that on a peak season. about 70% of the beach hotels in Dar esSalaam are operating at full capacity. We have about 700 tourists who will behaving leisure time along the beaches. The peak season continues for a monthor two. Therefore we are having a situation where about 700 people areutilising the beach for 30-60 days. Such a big number is likely to infringe onthe coastline.
It is not the aim of this paper to establish that such a number of touristsautomatically damage the beaches. However, it worth noting that tourists andvisitors to an area can cause a visual deterioration of its quality, and thereforeenvironmental concerns have to be taken into account regarding suchdevelopments.
As mentioned earlier that the "carrying capacity dimensions" are hereinadequate, we could bank on a number of carrying capacity guidelines from theTourism Council of South Pacific that exist to ensure a reasonable quality ofexperience (see Table 5).
Table 5: Carrying Capacity Dbnensions
Area\rea Recommended carrying capacity
Beach 10-15 square meters per person
Small boats 2-6 per hectare
Sailing boats 1-2 per hectare
Water-skiing 1 boat for ev~ry 2-4 hectares
Low density 40-100 people per hectarepicnicking
&Jure/!: l'ounsm CiuuJelmes m the &Juth Pacific

106 I.A.J. Mchalfo
Significant environmental effects likely to be caused by tourists in coastal resorts-particularly when the carrying capacity is exceeded-are loss of wet lands,lagoons; destruction of natural coastal defence-cliffs, reefs, shallows, sandbanks; interference with beach formation, long shore drift; beach erosion; oilspillage from motor boats, discharge of untreated sewage disposal of litter andother waste.
An argument is open for discussion that if the environmental servicesprovided by the coastline (e.g. the significance of coral reefs and wetlands)could be quantified or measured in monetary terms vis-a-vis construction ofhotels, an appropriate piece of advice could be given to decision-makers.
5. Sustainable Use of the Resource Base
Sustainability requires a balanced relationship between human needs and thefinite size and resource capacity of the earth. Human welfare must be pursuedwithin the natural environment's capacity to tolerate, support and such use.Present levels of use are excessive and unsustainable. Urgent corrective actionis therefore needed. Globally speaking, the notion of sustainability has three keycomponents: the environment, economic growth, and human welfare (WWF,1993).
Sustainable development is defined by meN, UNEP and WWF as"improving the quality of human life within the carrying capacity of supportingecosystems." Sustainable development must therefore encompass environmental,social and economic factors.
Sustainable resource use is the method by which the concept of sustainabledevelopment is applied to the use of natural resources, renewable and non-renewable. Sustainable resource use could be defined as the "use of naturalresources that always remains within the limits of environmental capacity andon that basis, meets the needs of the present generation without compromisingthe ability of future generations to meet their own needs" (WWF, 1993).
With regard to tourism development, sustainable resource use is an importantmethod that could be employed to ensure that the resource base, e.g., thenational parks, beaches, etc., are utilized sustainably. One way of ensuring thisis through discouraging mass/conventional tourism and instead encourage eco-tourism.
Boo-tourism may be defined as nature tourism that involves travelling torelatively undisturbed areas with the objective of admiring, studying or enjoying

SAPs and Natural Resources: The Case of Tourism 107
the scenery and its wild plants and animals, as well, as any cultural featuresfound there. Eco-tourists have the opportunity of exploring deep nature in a wayenabling them eventually to acquire an awareness and insight of the naturalenvironment, together with its cultural aspects that ultimately tunes them toappreciate conservation issues-
On the contrary, mass/conventional tourism involves visiting a natural area,e.g., a beach, lake or forest out of interest in activities that have little or nothingto do with a true concern for nature or ecology of the site (e.g. jogging, sunbathing picnicking, or simply relaxing).
It could be argued that until recently mass tourism has been in practice inTanzania. For example, the government's target of increasing the number oftourists to 500,000 by the year 2000 is undoubtedly encouraging mass tourism.One could ask: when this target was being set, were questions on impact takeninto account?
The trade liberalization policy prompted influx of investors especially intourist areas-lodges and tented camps. Also we have witnessed mushroomingof tour operators for air charter companies, ground transportation, and othertour operations. These activities have had severe negative effects on theresource base upon which tourism depends, e.g., degradation of protected areashabitats, devegetation, and harassment to wildlife.
Tanzania National Parks' (TANAPA) move of preparing the GeneralManagement Plans (GMP) is a timely action and clearly indicates thedetermination for eco-tourism. Hand in hand with the GMP all projects shouldbe subjected to Environmental Impact Assessment (EIA) to ensure sustainableresource use. Figure 1 in Appendix 1 shows the'model of sustainability.
EIA is a narrative description of the environment in which a proposeddevelopment is to be carried out, including specific description ofthose elementsof the existing environment which will be affected by the proposed development;and determines mitigation measures.
6. Conclusion
It has been seen clearly that the structural adjustment programmes encouragefast cash-making investments, and that social and environmental considerationswere not included in the menu of the package. SAPs' emphasis has always beenon quick generation of hard currency to pay back World Bank loans.
While the Tanzania government has been looking at tourism as one of its

108 LA.J. MchaDo
biggest foreign exchange earner, it has under-estimated the same resource baseupon which tourism depends. Statistical data have shown that as the governmentis implementing SAPs to revive the economy and service debt the number oftourists has been increasing steadily, hand in hand wjth mushrooming of touristhotels.
The major centres of attraction for tourists are also areas of globalsignificance physically and sociaIly, e.g., the national parks or MountKilimanjaro which is a site of world heritage. These are areas that are to besafeguarded at all costs. If they are to be utilised, it should be in a rational andsustainable way.
It is therefore advised that, while the government is making efforts to revivethe economy, significant issues like environmental ones should be reflected inthe menu of policies geared towards economic development. An important toolthat should be used and integrated into the policies is Environmental ImpactAssessment (EIA), which will ensure that potential environmental problems areidentified and solved at an early stage in any development ventures.
For future sustainable development of the country's tourism industry, it istherefore recommended that:
(a) There should be proper coordination between the gOVernmentauthorities concerned with tourism development, e.g., the InvestmentPromotion Centre (IPC) and TANAPA. There should be appropriateprocedures to follow on the part of investors regarding theseinstitutions.
(b) Environmental Impact Assessment (EfA) should be mandatory andincorporated in the menu of policies. Also ecological economicanalysis has to be reflected in the review of EIA studies.
(c) Investors should adhere to General Management Plans. GMPIEIALeaselDevelopment Consideration Packages (LDCP) and Guidelinesfor preparation of EIA studies prepared by TANAP A.
(d) Eco-tourIsIJl should be encouraged and promoted.

SAPs and Natural Resources: The Case of Tourism 109
APPENDIX 1
1987
OM: Revenue without economic considerationsAN: Resource value without environmental considerationsBC: Revenue with environmental considerationsDF: Resource value with environmental considerations
Fig. 1: Theoretical Model of Sustainability

llO I.A.J. Mchallo
References
Council of South Pacific. 1990. Guidelines for Integration of TourismDevelopment and Environmental Protection in the South Pacific. Suva:TCSP.
Karlstrom, R and GOlan H. 1993. Structural Adjustment as a Policy ProcessThe Case of Tanzania. WorldDe.dopmenr Vol. 21. No. 9pp. 1395-1404.
Mason P. 1990. Tourism. Environment and Dnelopmenr Perspectives.Eastboume: Manor Park: Press Ltd.
Mwasaga. RC. 1994. Effects of Economic Development to WildlifeConservation with special Emphasis on the Need For Environmental ImpactAssessment. Mimeo.
Peare D. & Turner K.R. 1990. Economics of Natural Resources and theEnvironment. Exeter: BPCC.
Planning Commission. 1982. Structural Adjustment Progrtl11UneFor Tanzania.Dar es Salaam: Government Printer.
Reed, D. 1992. Structural Adjustment and the Environment. London:Earthscan Publications.
Tanzania Bureau of Statistics. 1994. Hotels and National Parks Statistics 1993.Dar es Salaam: Government Printer.
Tanzania National Parks (TANAPA). 1993. Kilimanjaro National Park-General Management Plan/EIA. Arusha: Tanzania National Parks.
---. 1994. Tarangire National Park Management Zone Plan/EIA. Arusha:Tanzania National Parks.

SAPs and Naturlll Raourca: The Cae of Tourism III
---. 1994. National Policies For National Parks in Tanzania Nairobi: MajesticPrinting Works Ltd.
UNIDO and United republic of Tanzania (URT). 1992. Investors Guide toTanzania. Austria.
Werikhe, S. 1994. Economic Benefits of Eco-tourism to The Local Communitiesand The Environment. Mimeo(?).
Winpenny J.T. 1991. Values for the Environment A Guide to EconoltticAppraisal. London: London.
WWF. 1993. Sustainable Use of Natural Resources, Concepts, Issues andCriteria. Position Paper, WWF Gland-Switzerland.


![How Structural Adjustment Programmes Affect …...[IMFINQ] DRAFT tf320@cam.ac.uk 05.01.2017 How Structural Adjustment Programmes Affect Inequality: A Disaggregated Analysis of IMF](https://static.fdocuments.net/doc/165x107/5e8ade3d74de6622096384b9/how-structural-adjustment-programmes-affect-imfinq-draft-tf320camacuk-05012017.jpg)


