The Impact of School Leadership on Pupil...
212
Research Report DCSF-RR018 -QR Exploring Headteacher and Key Staff Perceptions of Leadership and School Improvement: A Quantitative Report – Phase 1 Questionnaire Survey The Impact of School Leadership on Pupil Outcomes Pam Sammons, Qing Gu, and Daniel Robertson School of Education, University of Nottingham
Transcript of The Impact of School Leadership on Pupil...

Research Report DCSF-RR018 -QR
Exploring Headteacher and Key StaffPerceptions of Leadership and SchoolImprovement:
A Quantitative Report –
Phase 1 Questionnaire Survey
The Impact of SchoolLeadership on PupilOutcomes
Pam Sammons, Qing Gu, and Daniel Robertson
School of Education, University of Nottingham

The Impact of School Leadership on Pupil Outcomes
Exploring Headteacher and Key Staff Perceptions of Leadership and School Improvement:
A Quantitative Report – Phase 1 Questionnaire Survey
Pam Sammons, Qing Gu, and Daniel Robertson
School of Education, University of Nottingham
The views expressed in this report are the authors’ and do not necessarily reflect those of the Department for Children, Schools and Families.
© University of Nottingham 2007 ISBN 978 1 84775 081 5
Research Report No DCSF-RR018 -QR


i
Contents
Chapter 1: Leadership In Improving And Effective Schools: Broadening Participation and Distributing Leadership ............................1
1.1 Introduction..................................................................................1 1.2 Changing Structures.......................................................................4
1.2.1 (Re)Structuring the organization: strengthening internal review, facilitating work ...................................................................4
1.2.2 School improvement: widening participation in decision making .8 1.3 Widening participation: Differences related to Heads’ Years of Experience
In School....................................................................................13 1.3.1 Clarifying reasons ..............................................................13
1.4 Engaging Parents.........................................................................14 1.4.1 Headteachers’ years of experience in school .......................... 15
1.5 Working With Other Schools .......................................................... 16 1.5.1 Differences by sector and socio-economic context................... 16
1.6 Building Community Support .........................................................18 1.6.1 Differences by sector, socio-economic context and years of
experience in school ........................................................... 18 1.7 Working With The Local Authority................................................... 20
1.7.1 Difference by sector and socio-economic context .................... 20 1.8 Integrating School Policies With National Policy Agendas ...................21
1.8.1 Differences by sector and socio-economic context................... 21 1.9 Working With The Governing Body ................................................. 23
1.9.1 Differences by sector.......................................................... 23 1.10 Working Collaboratively With The Senior Leadership/ Management Team
And Other Staff ...........................................................................24 1.10.1 Differences by headteacher experience in school .................... 25
1.11 Key Staff Perspectives on Collaborative Practice ............................... 26 1.11.1 The pivotal role of SLT: redefining the senior leadership team ..28 1.11.2 Distribution or delegation? .................................................. 28 1.11.3 Regularity of consultation between ‘tiers’............................... 28
1.12 Key Findings: ..............................................................................29 Chapter 2: Changing School Cultures...................................................31
2.1 Providing A Sense of Purpose: Raising Expectations.......................... 31 2.1.1 Providing a sense of purpose ............................................... 31 2.1.2 Differences by years of experience in school .......................... 32 2.1.3 High expectations for staff ..................................................33 2.1.4 High expectations for pupil behaviour ................................... 35
2.2 Shared Professional Beliefs And Values ........................................... 36

ii
2.3 Developing People .......................................................................37 2.3.1 CPD (Continuing Professional Development) .......................... 37 2.3.2 Developing care and trust ...................................................39 2.3.3 Modeling professional practice ............................................. 40
2.4 Discussion of Educational Issues: Differences By Sector, Socio-Economic Context And Years Of Experience In School ..................................... 42
2.5 Managing The Teaching And Learning Programme ............................ 45 2.5.1 Strengthening internal review: differences by sector and socio-
economic context...............................................................45 2.5.2 Redesigning the organisation: differences by sector and heads’
years of experience in school............................................... 46 2.6 Key Findings ...............................................................................47
Chapter 3: Changing Curriculum, Pedagogy And Assessment..............49 3.1 Curriculum And Pedagogy .............................................................49 3.2 Setting Goals ..............................................................................49
3.2.1 Differences by sector.......................................................... 49 3.2.2 Differences by years of experience in school .......................... 50
3.3 Encouraging New Ideas ................................................................52 3.4 Beyond The Academic Curriculum .................................................. 53
3.4.1 Differences by sector.......................................................... 53 3.5 Redesigning Resources For Teaching .............................................. 54
3.5.1 Differences by school sector, socio-economic context and headteacher years of experience in school ............................. 56
3.6 Coaching, Mentoring And Classroom Observation ............................. 58 3.6.1 Differences by sector.......................................................... 58 3.6.2 Differences by school socio-economic context and headteacher
years of experience in school............................................... 60 3.7 Assessment: Increasing The Use Of Pupil Attainment Data................. 61
3.7.1 Differences by sector.......................................................... 62 3.7.2 Differences by school level of disadvantage ........................... 63
3.8 Key Findings ...............................................................................67 Chapter 4: Leadership Characteristics And Practices In Schools With
Different Effectiveness And Improvement Profiles.............70 4.1 Introduction................................................................................70 4.2 Contexts Of Leadership And Improvement Group ............................. 71
4.2.1 School SES contexts and improvement groups ....................... 71 4.2.2 School SES contexts and heads’ experience ........................... 72 4.2.3 Experience of headteachers and improvement groups ............. 73 4.2.4 Age of headteachers and improvement groups ....................... 74 4.2.5 Stability of school leadership and improvement groups............ 75

iii
4.3 Leadership Distribution: Patterns Of External And Internal Participation.................................................................................................77 4.3.1 The way that leadership tasks were distributed or shared within
schools............................................................................. 77 4.3.2 The kinds of leadership practice provided by SMT/SLT in school 78 4.3.3 The extent to which leadership practice in school was provided by
other people or groups (Internal and External)....................... 80 4.4 Leadership Influence: Persuasion Tactics........................................ 85 4.5 School Conditions: Academic Press................................................. 89
4.5.1 School SES Contexts .......................................................... 90 4.5.2 School Improvement Groups ............................................... 92
4.6 School Conditions: Collaborative Cultures........................................ 95 4.6.1 School SES Contexts .......................................................... 96 4.6.2 School Improvement Groups ............................................... 98
4.7 Leader Self-Efficacy ................................................................... 101 4.7.1 School SES contexts......................................................... 102 Key Staff Perceptions ................................................................. 103 8.6.2 School Improvement Groups ............................................. 104
4.8 Classroom Conditions: Workload Volume And Complexity ................ 106 4.8.1 School SES contexts......................................................... 107 4.8.2 School improvement groups .............................................. 110
4.9 Building and Sustaining Improvement: The Extent of Change........... 115 4.9.1 Changes in school conditions over time: disciplinary climate... 115
4.10 Changes in school conditions over time: the school......................... 120 4.11 Changes in structures, culture, and curriculum, pedagogy and
assessment............................................................................... 124 4.11.1 Changes in structures....................................................... 125 4.11.2 Changes in culture ........................................................... 129 4.11.3 Changes in curriculum, pedagogy and assessment................ 131
4.12 Teaching Policies And Practices .................................................... 135 4.13 Extra Curricula Programmes........................................................ 136 4.14 Extended Services ..................................................................... 138
4.14.1 Type of services (headteacher perceptions only)................... 138 4.14.2 Management and provision of services (headteacher perceptions
only).............................................................................. 139 4.15 Summary ................................................................................. 141
4.15.1 Key findings:................................................................... 142 4.16 Key Messages ........................................................................... 145

1
Chapter 1: Leadership In Improving And Effective
Schools: Broadening Participation and Distributing
Leadership
1.1 Introduction
This three-year study, commissioned by the Department for Children, Schools
and Families, in conjunction with the National College of School Leadership,
focuses upon the critical relationship between school leadership, in particular
headteacher leadership, and improved pupil learning outcomes. Taking a review
and evaluation of the growing international evidence base as a point of departure,
the study investigates not only how successful school leaders impact on students’
learning outcomes but also how, in order to do so, they adapt their practices to
suit the many different contexts in which they carry out their work. For our
purposes, such contexts include: sectors of schooling (primary, secondary);
amounts of experience leaders bring to their work; socio-economic levels of their
school’s student intakes; and leadership in schools in three different
‘improvement’ groupings.
This quantitative technical report presents detailed findings from the initial phase
of the mixed method study based on a questionnaire survey of headteacher and
key staff perceptions of leadership and school improvement conducted in the first
year of the project (2006-2007). It is an accompanying document to the Project’s
Interim Report which was published by DCSF in January 2008 (Day et al., 20071).
In the Project’s Interim Report we linked emerging qualitative case study and
qualitative survey results. Both the case studies and the surveys provided a
wealth of complementary data relating to a number of key issues about the role,
characteristics and strategies of leadership in improving and effective schools,
and they have begun to point to associations between these and improvements in
pupils’ achievements. In this chapter we provide further illustration of the
quantitative findings concerning the indirect influence of headteachers’ and key
1 Day, C., Sammons, P., Gu, Q., Penlington, C., Kington, A., Hopkins, D., Mehta, P., Harris, A. & Leithwood, K. (2007) The Impact of School Leadership on Pupil Outcomes: Interim Report. DCSF (http://www.dfes.gov.uk/research/programmeofresearch/projectinformation.cfm?projectid=15339&resultspage=1)

2
staff leadership on improved pupil outcomes through reported changes which
they make in school structures. The survey questions were derived from the
review of the literature on successful headship; and the findings, by and large,
confirm these, though with interesting differences appearing between school
sectors (primary and secondary); between headteachers’ experience levels (years
in current post and total years of headship); and between school SES contexts
based upon level of social disadvantage of pupil intake (measured by the school
FSM band).
Begun in January 2006, the mixed method study links qualitative (case study)
and quantitative (survey) approaches, and is being conducted in three phases.
During the first, now-completed phase, a comprehensive review of literature was
conducted (Leithwood, Day, Sammons, Harris and Hopkins. 20062), national data
sets related to pupil attainment were analysed, and survey data were collected
from both headteachers and key staff3 in a nationally representative achieved
sample of high performing and improving primary (378) and secondary (362)
schools during 2006/2007. Based on three years (2002-2005) of national pupil
achievement data, schools in the sample were allocated to one of three groups
for comparison purposes: schools that had significantly improved from a low to a
moderate level, schools that had improved from a moderate to high level, and
schools that had demonstrated stable high achievement and effectiveness. These
schools were selected to represent the different levels of social disadvantage of
their pupil intake identified by the % of pupils eligible for Free School Meals (FSM
Band 1 to 4).
Table 1.1 below shows primary and secondary samples by FSM band.
2 Leithwood, K., Day, C., Sammons, P., Harris, A. & Hopkins, D. (2006) Seven strong claims about successful school leadership. Nottingham, DfES/NCSL 3 Key staff were defined as either (i) Key Stage managers/leaders in primary schools; and, (ii) Heads of Department (maths, English, science, arts and humanities) in secondary schools. Two Key Stage managers (primary) and five Heads of Departments (secondary) were invited to participate in the key staff survey.

3
Table 1.1: Primary and Secondary Samples by FSM Band
FSM Band Primary
Sample (N)
Percent
(%)
Secondary
Sample (N) Percent (%)
FSM1 (0-8%) 225 30 316 38
FSM2 (9-20%) 180 24 280 33
FSM3 (21-35%) 163 22 124 15
FSM4 (36%+) 184 24 119 14
Total 752 100 839 100
The initial questionnaire survey was conducted in summer 2006. The response
rate to the survey initially achieved was approximately 19% for both the primary
and secondary head teacher sample. A re-survey of non-respondents of the
original sample and other schools that met the criteria but were not included in
the original sample was carried out in January 2007. Strategies included:
personal telephone calls; emails; and postal contact with the offer of a visit if
preferred. Though time consuming, these proved very successful. The
headteacher response rate to the questionnaire survey increased from
approximately 19% for both the primary and secondary headteacher sample to
24% primary and 32% secondary of a larger group. The total sample size
surveyed is shown in Table 1.2 to Table 1.4 below. Additional questionnaires
received have been incorporated into subsequent analyses. Tables 1.2-1.4 also
summarise the response rates for headteacher and key Staff questionnaire
surveys.
Table 1.2: Survey response rate (Headteachers)
Sample Size
Surveyed N
Returned Headteacher Questionnaires
N
Response Rate %
Primary 1,550 378 24 Secondary 1,140 362 32
Table 1.3: Survey response rate (Key Staff at school level)
Sample Size
Surveyed N
Schools with Returned Key Staff Questionnaires
N
Response Rate %
Primary 1,550 409 26 Secondary 1,140 393 34

4
Table 1.4: Survey response rate (Key Staff at questionnaire level)
Sample Size Surveyed*
N
Returned Key Staff Questionnaires
N
Response Rate %
Primary 3,100 608 20 Secondary 5,700 1,167 20
The survey questions asked headteachers and key staff to report on the extent of
change in different features of school activity and practice over the last three
years. This period was chosen to coincide with the years for which the analysis of
improvement in pupil attainment had taken place. While surveys inevitably tap
into respondents’ perceptions (in line with the qualitative interviews reported in
the case study sections of the Interim Report) we also have a baseline of the
initial level of attainment for a school to relate to perceptions of change in the
quantitative analyses and these results are described in detail in Chapter 4.
This report is divided into four main chapters that focus on different aspects of
leadership and improvement.
1. Leadership in improving and effective schools: Broadening participation
and distributing leadership
2. Changing school cultures
3. Changing curriculum, pedagogy and assessment
4. Leadership characteristics and practices within schools with different
effectiveness and improvement profiles
1.2 Changing Structures
1.2.1 (Re)Structuring the organization: strengthening internal review,
facilitating work
More than half of primary heads (N=204, 54%) reported “a lot” or “very
significant” change in practice relating to improving internal review procedures
during the last three years. By contrast, more substantial change in this area was
reported by secondary heads. The majority of secondary heads reported “a lot” or
“very significant” change (N=251, 71%) in improving internal review procedures,
with almost a third who felt that the amount of change in practice in their schools
was “very significant” (N=105, 30%) over the past three years (the equivalent
was only N=43, 11% for primary heads, Table 1.5). In the primary sample heads
from high disadvantage schools were more likely to report a lot of change in

5
leadership practice relating to this area4 (Table 1.6). However, this was not the
case for secondary schools where responses did not differ by level of school
disadvantage.
Table 1.5: Headteacher responses to “To what extent do you believe your actions
have changed in relation to improving internal review procedures”
The extent to which headteachers believed their actions had changed in relation to improving internal review procedures
Sector Not at
all Very little
Little Partially A lot Very
significantly Total
Primary 9
(2.4%) 18
(4.8%) 20
(5.3%) 126
(33.4%) 161
(42.7%) 43
(11.4%) 377
(100.0%)
Secondary 11
(3.1%) 13
(3.7%) 20
(5.6%) 59
(16.7%) 146
(41.2%) 105
(29.7%) 354
(100.0%)
Total 20
(2.7%) 31
(4.2%) 40
(5.5%) 185
(25.3%) 307
(42.0%) 148
(20.2%) 731
(100.0%)
Table 1.6: Primary headteacher responses to “To what extent do you believe your
actions have changed in relation to improving internal review procedures” by
school FSM band
The extent to which headteachers believed their actions had changed in relation to improving internal review procedures School
FSM Band Not at all / Very
little Little Partially
A lot / Very
significantly Total
FSM 1 and 2
17 (7.3%)
7 (3.0%)
91 (38.9%)
119 (50.9%)
234 (100.0%)
FSM 3 and 4
10 (7.1%)
11 (7.8%)
35 (24.8%)
85 (60.3%)
141 (100.0%)
Total 27
(7.2%) 18
(4.8%) 126
(33.6%) 204
(54.4%) 375
(100.0%)
A greater degree of change in practice was reported by secondary than primary
heads in terms of structuring the organisation to facilitate work. More than half
(N=202, 58%) reported “a lot” or “very significant” change in practice, with one
in five (N=69, 20%) indicating their leadership practice in this areas had changed
“very significantly”. A somewhat lower proportion of primary heads (N=175,
47%) reported “a lot” or “very significant” change as can be seen in Table 1.7.
School disadvantage, however, was not related to the extent of reported change
in leadership practice in this area.
4 χ²=10.86, df=3, p<0.05

6
Table 1.7: Headteacher responses to “To what extent do you believe your actions
have changed in relation to structuring the organisation to facilitate work” by
sector
The extent to which headteachers believed their actions had changed in relation to structuring the organisation to facilitate work
Sector Not at
all Very little
Little Partially A lot Very
significantly Total
Primary 14
(3.8%) 29
(7.8%) 35
(9.4%) 120
(32.2%) 124
(33.2%) 51
(13.7%) 373
(100.0%)
Secondary 20
(5.7%) 20
(5.7%) 19
(5.4%) 89
(25.4%) 133
(38.0%) 69
(19.7%) 350
(100.0%)
Total 34
(4.7%) 49
(6.8%) 54
(7.5%) 209
(28.9%) 257
(35.5%) 120
(16.6%) 723
(100.0%)
For secondary heads only, weak but statistically significant negative associations
were found between heads’ years of experience in their current schools and the
extent of reported change in relation to the two items on redesigning the
organisation. Those with more experience tended to report less change in practice
in their schools over the last three years. In particular:
i) 83% (N=75)of secondary heads with less than three years’ experience
reported a substantial amount of change in practice relating to improving
internal review procedures in their schools over the last three years,
whereas 60% (N=18) of those with more than 16 years’ experience did
so5 (Table 1.8)
ii) 68% of less experienced heads (0-3 years) reported a lot of change in
practice in relation to structuring the organisation to facilitate work; by
contrast, less than half (N=13, 43%) of their more experienced peers
(16+ years) reported such extent of change6 (Table 1.9)
5 Gamma=-0.23, p<0.05 6 Gamma=-0.19, p<0.05

7
Table 1.8: Secondary headteacher responses to “To what extent do you believe
your actions have changed in relation to improving internal review procedures”
by heads’ years of experience
The extent to which headteachers believed their actions had changed in relation to improving internal review procedures
Years of experience
as headteacher
Not at all
Very little Little Partially A lot Very
significantly Total
0-3 years 4
(4.3%) 4
(4.3%) 1
(1.1%) 10
(10.6%) 41
(43.6%) 34
(36.2%) 94
(100.0%)
4-7 years 1
(1.4%) 1
(1.4%) 5
(6.8%) 10
(13.5%) 28
(37.8%) 29
(39.2%) 97
(100.0%)
8-15 years 2
(2.9%) 1
(1.5%) 6
(8.8%) 13
(19.1%) 29
(42.6%) 17
(25.0%) 68
(100.0%)
16+ years 2
(6.7%) 3
(10.0%) 2
(6.7%) 5
(16.7%) 15
(50.0%) 3
(10.0%) 30
(100.0%)
Total 9
(3.4%) 9
(3.4%) 14
(5.3%) 38
(14.3%) 113
(42.5%) 83
(31.2%) 266
(100.0%)
Table 1.9: Secondary headteacher responses to “To what extent do you believe
your actions have changed in relation to structuring the organisation to facilitate
work” by heads’ years of experience
The extent to which headteachers believed their actions had changed in relation to structuring the organisation to facilitate work
Years of experience
as headteacher
Not at all
Very little
Little Partially A lot Very
significantly Total
0-3 years 4
(4.4%) 3
(3.3%) 3
(3.3%) 19
(21.1%) 40
(44.4%) 21
(23.3%) 90
(100.0%)
4-7 years 2
(2.7%) 2
(2.7%) 8
(10.8%) 20
(27.0%) 25
(33.8%) 17
(23.0%) 74
(100.0%)
8-15 years 5
(7.4%) 4
(5.9%) 3
(4.4%) 15
(22.1%) 24
(35.3%) 17
(25.0%) 68
(100.0%)
16+ years 5
(16.7%) 1
(3.3%) 2
(6.7%) 9
(30.0%) 11
(36.7%) 2
(6.7%) 30
(100.0%)
Total 16
(6.1%) 10
(3.8%) 16
(6.1%) 63
(24.0%) 100
(38.2%) 57
(21.8%) 262
(100.0%)
Almost eight out of ten key staff agreed moderately/strongly that the
headteacher had improved the internal review procedures of their school over the
last three years. A greater degree of agreement was reported by primary
(N=506, 84%) than secondary key staff (N=881, 76%) and this difference was
statistically significant7.
7 χ²=21.1, df=3, p<0.001

8
The degree of agreement to this statement was not found to be related to years
of experience of key staff or the level of school disadvantage.
Similarly, a greater degree of agreement was reported by primary key staff
compared to those of secondary key staff concerning the structuring the
organization to facilitate work. Close to 94% of primary key stage managers
agreed moderately or strongly to the above statement, with almost a third
agreeing strongly. In all, 81% of secondary heads of departments agreed
moderately/strongly to it; but interestingly half of them reporting a strong
agreement compared with a third of primary key staff. This difference was
statistically significant8. It suggests that in secondary schools where
organisational restructuring occurred it was more likely to be deep seated (a half
versus a third showing strong agreement in the two sectors).
1.2.2 School improvement: widening participation in decision making
Over half of primary heads (N=192, 51%) reported “a lot” of change in their
response to the question on the extent that they had increased their actions
“helping clarify the reasons for their schools’ improvement initiatives" over the
past three years, whereas less than half of secondary heads (N=151, 42%) did
so. In only a small minority of cases the extent of change was identified as ‘very
significant’ in this area (here the proportions for primary and secondary heads
were similar at 14% and 16% respectively) (Table 1.10).
8 χ²=54.46, df=3, p<0.001

9
Table 1.10: Headteacher responses indicating a high degree of change in
widening participation in decision making over the past three years
Question Sector Not at
all Very little
Little Partially A lot Very
significantly Total
Primary 17
(4.5%) 22
(5.8%) 22
(5.8%) 70
(18.6%) 192
(50.9%) 54
(14.3%) 377
(100.0%)
Helping clarify the reasons for our school’s improvement initiatives
Secondary 21
(5.8%) 32
(8.9%) 38
(10.5%) 63
(17.5%) 151
(41.8%) 56
(15.5%) 361
(100.0%)
Primary 20
(5.3%) 34
(9.0%) 34
(9.0%) 96
(25.4%) 143
(37.8%) 51
(13.5%) 378
(100.0%)
Ensuring wide participation in decisions about school improvement
Secondary 20
(5.6%) 32
(9.0%) 32
(9.0%) 113
(31.8%) 128
(36.1%) 30
(8.5%) 355
(100.0%)
Primary 4
(1.1%) 12
(3.2%) 39
(10.3%) 142
(37.6%) 153
(40.5%) 28
(7.4%) 378
(100.0%)
Increasing dialogue about school improvement between pupils and adults
Secondary 12
(3.4%) 11
(3.1%) 42
(11.9%) 134
(38.0%) 114
(32.3%) 40
(11.3%) 353
(100.0%)
Somewhat more primary than secondary heads felt that “a lot” or “ very
significant” change had occurred over the past three years in their leadership
practice in relation to widening participation in decisions about school
improvement (Primary: N=143, 38%; Secondary: N=128, 36% reported “a lot”,
while N=51, 14% primary and N=30, 9% reported “very significant” change in
widening participation). (Table 1.9).
A similar pattern was found in relation to the extent of reported change in
leadership practice in increasing dialogue about school improvement between
pupils and adults. In total, 48% (N=181) of primary heads and 44% (N=154) of
secondary heads reported “a lot” or “very significant” change in this area, in
contrast to only 4% (N=16) of primary heads (Table 1.9) and 7% (N=23) of
secondary heads who reported “not at all” or “very little” change.
More than 90% of key staff agreed moderately/strongly that their headteacher
helped clarify the reasons for their school’s improvement initiatives and primary
key staff (N=457, 75%) were more likely to agree strongly than secondary key
staff (N=698, 60%) to this item. This difference was statistically significant9.
9 χ²=48.6, df=5, p<0.001

10
The results for those survey items described above did not differ by years of
experience of key staff, but there were differences related to school
disadvantage. Staff from highly disadvantaged schools (FSM Band 4) were the
most likely to agree strongly (N=202, 73%) that their headteacher “helps clarify
reasons for their school’s improvement initiatives” and staff from the least
disadvantaged schools were the least likely to say so (N=351, 61%)10 (Table
1.11).
Table 1.11: Key staff responses to “To what extent do you agree that the
headteacher in your school helps clarify the reasons for our school’s
improvement initiatives” by FSM band
School FSM Band
Disagree strongly
Disagree moderately
Disagree slightly
Agree slightly
Agree moderately
Agree
strongly Total
1 4
(0.7%) 6
(1.0%) 11
(1.9%) 47
(8.2%) 156
(27.1%) 351
(61.0%) 575
(100.0%)
2 0
(0.0%) 6
(1.0%) 1
(0.2%) 47
(7.8%) 156
(25.9%) 392
(65.1%) 602
(100.0%)
3 0
(0.0%) 2
(0.7%) 2
(0.7%) 20
(6.6%) 81
(26.6%) 200
(65.6%) 305
(100.0%)
4 0
(0.0%) 1
(0.4%) 2
(0.7%) 7
(2.5%) 64
(23.2%) 202
(73.2%) 276
(100.0%)
Total 4
(0.2%) 15
(0.9%) 16
(0.9%) 121
(6.9%) 457
(26.0%) 1145
(65.1%) 1758
(100.0%)
A similar pattern was identified when key staff were asked whether their
headteacher ensures wide participation in decisions about school improvement.
Primary key staff were more likely (N=333, 55%) to agree moderately/strongly
than their secondary counterparts (N=433, 37%). This variation was also
statistically significant11 (Figure 1.1).
10 χ²=9.51, df=3, p<0.05 11 χ²=97.42, df=5, p<0.001

11
Figure 1.1: Differences between primary and secondary key staff perceptions of
headteacher leadership practice in relation to ensuring wide participation in
decisions about school improvement
0%
10%
20%
30%
40%
50%
60%
Primary 3% 7% 35% 55%
Secondary 12% 17% 33% 37%
Disagree strongly/moderately/slightl
Agree slightlyAgree
moderatelyAgree
strongly
Level of school disadvantage was also associated with the key staff agreement for
the above statement. In line with patterns noted for earlier items, key staff from
highly disadvantaged schools (FSM bands 3 and 4) were more likely to agree that
their headteacher ensures wide participation in decisions about school
improvement12. This difference was largely due to differences in responses
amongst key staff in secondary schools. Heads of department from highly
disadvantaged secondary schools were more likely to agree than those from less
disadvantaged schools13 (Table 1.12). However, the degree of agreement did not
differ according to years of experience of the key staff.
12 χ²=13.31, df=3, p<0.01 13 χ²=11.68, df=3,p<0.01

12
Table 1.12: Key staff responses to “To what extent do you agree that the
headteacher in your school ensures wide participation in decisions about school
improvement” by school FSM band
Sector School
FSM Band
Disagree strongly
Disagree moderately
Disagree slightly
Agree slightly
Agree moderately
Agree strongly
Total
FSM 1 and 2
0 (0.0%)
3 (0.8%)
6 (1.6%)
28 (7.5%)
138 (37.2%)
196 (52.8%)
371 (100.0%)
Primary FSM 3 and 4
1 (0.4%)
1 (0.4%)
6 (2.6%)
16 (7.0%)
72 (31.3%)
134 (58.3%)
230 (100.0%)
FSM 1 and 2
23 (2.9%)
35 (4.4%)
56 (7.0%)
142 (17.8%)
281 (35.2%)
262 (32.8%)
799 (100.0%)
Secondary FSM 3 and 4
7 (2.0%)
4 (1.1%)
17 (4.9%)
54 (15.5%)
101 (29.0%)
165 (47.4%)
348 (100.0%)
When key staff were asked whether the headteacher increases dialogue about
school improvement between pupils and adults, 78% of primary key stage
managers agreed moderately/strongly compared with 69% of secondary heads of
departments14. Neither school disadvantage nor staff years of experience were
associated with degree of agreement for this aspect of headteacher leadership.
Key staff were asked about the extent to which the headteacher in their school
“engages parents in the school’s improvement efforts”. Proportionally more key
stage managers from primary schools (N=487, 81%) were likely to agree
moderately/strongly; with almost 41% agreeing strongly to it. By contrast,
proportionately fewer secondary heads of department agreed (N=783, 68%);
with only 28% agreeing strongly. This difference was statistically significant15
(Table 1.13). School disadvantage and years of experience of the staff were not
factors related to key staff perceptions of this aspect of headteacher leadership.
14 χ²=30.53, df=3, p<0.001 15 χ²=36.61, df=3, p<0.001

13
Table 1.13: Key staff responses to “To what extent do you agree that the
headteacher in your school engages parents in the school’s improvement efforts”
by sector
Sector Disagree strongly
Disagree moderately
Disagree slightly
Agree slightly
Agree moderately
Agree strongly
Total
Primary 0
(0.0%) 4
(0.7%) 20
(3.3%) 91
(15.1%) 242
(40.2%) 245
(40.7%) 602
(100.0%)
Secondary 4
(0.3%) 25
(2.2%) 75
(6.5%) 268
(23.2%) 456
(39.5%) 327
(28.3%) 1155
(100.0%)
Total 4
(0.2%) 29
(1.7%) 95
(5.4%) 359
(20.4%) 698
(39.7%) 572
(32.6%) 1757
(100.0%)
1.3 Widening participation: Differences related to Heads’
Years of Experience In School
1.3.1 Clarifying reasons
There were several differences identified in heads’ responses to the survey items
that related to their length of experience as a head in the current school for the
secondary sample. These included responses to the item on changes in the
emphasis they gave to ‘helping clarify the reasons for their schools’ improvement
initiatives’ 16 (p<0.05) and ‘ensuring wide participation in decisions about school
improvement’17 (p<0.05). We found that more experienced heads tended to
report less change in their emphasis on these two areas over last three years
(Figure 1.2 and Figure 1.3). This activity received more attention from less
experienced heads however. Experienced heads may have effected more change
earlier in their time in the school, and, having achieved improvements, may have
been more likely to seek to embed the changes made and perhaps focus on other
areas of activity.
From our survey data it appears that an emphasis on clarifying the reasons for
school improvement initiatives and on ensuring wide participation in decision
making are particularly important activities for heads in the early phases of a new
headship. This may be linked with setting new directions to effect rapid and
positive change in pupil outcomes.
16 χ²=21.03, df=9, p<0.05; Gamma=-0.30, p<0.001 17 χ²=19.70, df=9, p<0.05; Gamma=-0.27, p<0.001

14
0%
10%
20%
30%
40%
50%
60%
70%
80%
90%
100%
0-3 years 4-7 years 8-15 years 16+years
A lot/ Verysignif icantly
Partially
Little
Not at all/Very little
(N=95) (N=31)(N=69)(N=76)
0%
10%
20%
30%
40%
50%
60%
70%
80%
90%
100%
0-3 years 4-7 years 8-15 years 16+years
A lot/ Verysignif icantly
Partially
Little
Not at all/Very little
(N=95) (N=30)(N=68)(N=74)
Figure 1.2: Secondary heads’ experience in school and the extent of reported
change in helping clarify the reasons for their schools’ improvement initiatives
Figure 1.3: Secondary heads’ experience in school and the extent of reported
change in ensuring wide participation in decisions about school improvement
1.4 Engaging Parents
In total 44% (N=166) of primary heads and 42% (N=149) of secondary heads
felt that the actions they had taken to engage parents in their schools’

15
improvement had changed “partially” over the past three years, while a
substantial minority reported “a lot” or “very significant” change in this area
(35% of Primary, 28% of secondary heads). For the primary sample only, a weak
but statistically significant negative association was found between level of school
disadvantage and the extent of reported change in engaging parents in their
improvement efforts. This indicates that heads in low disadvantage schools (FSM
1 and 2) in our sample were more likely to report positive change in the extent of
parental engagement over the last three years than heads in schools serving
more disadvantaged (FSM 3 and 4) intakes (p<0.05).18 (Table 1.14).
Table 1.14: Primary key staff responses to “To what extent do you agree that the
headteacher in your school engages parents in the school’s improvement efforts”
by school FSM band
School FSM Band
Disagree strongly
Disagree moderately
Disagree slightly
Agree slightly
Agree moderately
Agree strongly
Total
FSM 1 and 2
0 (0.0%)
1 (0.3%)
11 (3.0%)
59 (15.9%)
141 (38.0%)
159 (42.9%)
371 (100.0%)
FSM 3 and 4
0 (0.0%)
3 (1.3%)
9 (3.9%)
32 (14.0%)
100 (43.9%)
84 (36.8%)
228 (100.0%)
Total 0
(0.0%) 4
(0.7%) 20
(3.3%) 91
(15.2%) 241
(40.2%) 243
(40.6%) 599
(100.0%)
1.4.1 Headteachers’ years of experience in school
For the primary sample less experienced heads reported more change in the last
three years in relation to all the four items relating to school improvement. In
particular:
i) The only moderate, statistically highly significant negative association was
found between heads’ length of service in their current schools and the
extent of reported change in relation to helping clarify the reason for their
schools’ improvement19. Eighty per cent of the less experienced heads
(N=56), compared to 51% of the most experienced heads (N=25),
reported a lot of change in leadership practice in their schools;
ii) There was a marked difference in heads’ responses to the extent of
change in engaging parents in the school’s improvement efforts20 (Figure
1.4). Half of the heads (N=36, 51%) with no more than three years’
18 Gamma=-0.18, p<0.05 19 χ²=21.36, df=3, p<0.05; Gamma=-0.32, p<0.001 20 χ²=21.36, df=3, p<0.05; Gamma=-0.32, p<0.001

16
experience in their schools reported a substantial amount of change in
practice in this area, in contrast to only 22% (N=11) of those who had
served their schools for 16 years or more.
Figure 1.4: Primary heads’ experience in school and the extent of reported
change in engaging parents in the school’s improvement efforts
0%
10%
20%
30%
40%
50%
60%
70%
80%
90%
100%
0-3 years 4-7 years 8-15 years 16+years
A lot/ Verysignif icantly
Partially
Little
Not at all/Very little
(N=71) (N=49)(N=74)(N=64)
1.5 Working With Other Schools
1.5.1 Differences by sector and socio-economic context
Compared to primary heads (N=105, 28%), a relatively greater proportion of
secondary heads (N=125, 35%) reported “a lot” of change in this area (working
with other schools) of leadership practice over the last three years. However, only
a few heads reported “very significant” change in the extent to which they were
now working in collaboration with other schools and this was more often reported
by secondary heads (N=65, 18%) than their primary peers (N=50, 13%).

17
0%
10%
20%
30%
40%
50%
60%
70%
80%
90%
100%
0-3 years 4-7 years 8-15 years 16+years
A lot/ Verysignif icantly
Partially
Little
Not at all/Very little
(N=69) (N=49)(N=73)(N=64)
0%
10%
20%
30%
40%
50%
60%
70%
80%
90%
100%
0-3 years 4-7 years 8-15 years 16+years
A lot/ Verysignif icantly
Partially
Little
Not at all/Very little
(N=96) (N=31)(N=69)(N=75)
Figure 1.5: Primary heads’ experience in school and the extent of reported
change in working collaboratively with the Governing Body
Figure 1.6: Secondary heads’ experience in school and the extent of reported
change in working collaboratively with the Governing Body
In contrast to headteachers’ reports, key staff perceptions of their schools’ levels
of collaboration with other schools tended to be rather more favourable (Table
1.15). A greater proportion of primary key stage managers agreed strongly that
their headteacher works in collaboration with other schools (N=339, 56%) than
their secondary peers (N=525, 46%). However, a somewhat higher proportion of

18
secondary heads of department (N=402, 35%) agreed moderately to the above
statement than their primary peers (N=193, 32%).
Table 1.15: Key staff responses to “To what extent do you agree that the
headteacher in your school works in collaboration with other schools” by sector
Sector Disagree strongly
Disagree moderately
Disagree slightly
Agree slightly
Agree moderately
Agree strongly
Total
Primary 2
(0.3%) 1
(0.2%) 5
(0.8%) 65
(10.7%) 193
(31.9%) 339
(56.0%) 605
(100.0%)
Secondary 4
(0.3%) 11
(1.0%) 39
(3.4%) 162
(14.2%) 402
(35.2%) 525
(45.9%) 1143
(100.0%)
Total 6
(0.3%) 12
(0.7%) 44
(2.5%) 227
(13.0%) 595
(34.0%) 864
(49.4%) 1748
(100.0%)
Key staff from highly disadvantaged secondary schools (N=294, 85%) were more
likely to agree strongly compared to their counterparts in less disadvantaged
contexts (N=624, 79%), that their head worked collaboratively with other schools
(p<0.05). These findings suggest that cross school collaboration may have been a
more important strategy for improvement in disadvantaged contexts, especially in
the secondary sector 21 (Table 1.16).
Table 1.16: Secondary key staff responses to “To what extent do you agree that
the headteacher in your school works in collaboration with other schools” by
school FSM band
School FSM Band
Disagree strongly
Disagree moderately
Disagree slightly
Agree slightly
Agree moderately
Agree strongly
Total
FSM 1 and 2
3 (0.4%)
10 (1.3%)
34 (4.3%)
116 (14.7%)
290 (36.8%)
334 (42.4%)
787 (100.0%)
FSM 3 and 4
1 (0.3%)
1 (0.3%)
5 (1.4%)
44 (12.8%)
112 (32.5%)
182 (52.8%)
345 (100.0%)
1.6 Building Community Support
1.6.1 Differences by sector, socio-economic context and years of
experience in school
Headteachers’ views on the extent of change in building community support for
their school’s improvement efforts mirrored the pattern found for the item on
collaboration with other schools described above (Table 1.17). For both primary
21 χ²=9.53, df=3. p<0.05

19
and secondary heads, around one in four reported “a lot” of change, with only a
few reporting “very significant” change (Primary: N=23, 6%; Secondary: N=25,
7%). In relation to school context, primary heads in highly disadvantaged schools
were more likely to report change. This was not the case for secondary schools.
For both primary and secondary heads, those with more experience tended to
report less change in practice in their schools in this aspect over the last three
years.
Table 1.17: Headteacher responses to “To what extent do you believe your
actions have changed in relation to building community support for the school’s
improvement efforts over the past three years?” by sector
Sector Not at
all Very little
Little Partially A lot Very
significantly Total
Primary 11
(2.9%) 37
(9.8%) 46
(12.2%) 164
(43.5%) 96
(25.5%) 23
(6.1%) 377
(100.0%)
Secondary 22
(6.2%) 39
(11.0%) 57
(16.1%) 119
(33.7%) 91
(25.8%) 25
(7.1%) 353
(100.0%)
Total 33
(4.5%) 76
(10.4%) 103
(14.1%) 283
(38.8%) 187
(25.6%) 48
(6.6%) 730
(100.0%)
Evidence of sector differences was also found when key staff were asked about
the extent to which their head emphasized building community support for the
school’s improvement efforts. A slightly larger proportion of primary staff
(N=487, 81%) than those of secondary (N=851, 74%) agreed
moderately/strongly to it (Table 1.18). Again, the school disadvantage factor was
found to be related to responses to this item. A larger proportion of staff from
school FSM bands 3 and 4 (N=465, 81%) agreed moderately/strongly that their
heads emphasised building community support than those from school FSM bands
1 and 2 (N=864, 74%). The difference was statistically significant at p<0.01
across all key staff and was also noted within both primary22 and secondary23
samples (p<0.05).
22 χ²=8.35, df=3, p<0.05 23 χ²=7.94, df=3, p<0.05

20
Table 1.18: Key staff responses to “To what extent do you agree that the
headteacher in your school builds community support for the school’s
improvement efforts” by sector
The extent to which key staff agreed that the headteacher builds community support for the school’s improvement efforts
Sector Disagree strongly
Disagree moderately
Disagree slightly
Agree slightly
Agree moderately
Agree
strongly Total
Primary 1
(0.2%) 3
(0.5%) 17
(2.8%) 93
(15.5%) 235
(39.1%) 252
(41.9%) 601
(100.0%)
Secondary 8
(0.7%) 20
(1.7%) 56
(4.9%) 217
(18.8%) 445
(38.6%) 406
(35.2%) 1152
(100.0%)
Total 9
(0.5%) 23
(1.3%) 73
(4.2%) 310
(17.7%) 680
(38.8%) 658
(37.5%) 1753
(100.0%)
1.7 Working With The Local Authority
1.7.1 Difference by sector and socio-economic context
One in five primary heads (N=76, 20%) reported “not at all” or “very little”
change over the last three years in the extent of working collaboratively with the
Local Authority (LA), with slightly over a third indicating “a lot” or “very
significant” change in this area (N=129, 35%) (Table 1.19). When comparing the
responses by FSM band, the evidence suggests that working collaboratively with
the LA has been a relatively more important factor emphasised by disadvantaged
primary schools that had improved. However, this does not seem to be the case
for secondary schools were there was little difference in the extent of LA
involvement reported. In interpreting this we noted that many secondaries had
become specialist schools during the last three years. At least one in four (N=97,
27%) felt that there was “not at all” or “very little” change in their collaboration
with the LA whereas almost a third (N=115, 32%) reported “a lot” or “very
significant” change over the last three years.

21
Table 1.19: Headteacher responses to “To what extent do you believe that your
leadership practice and actions have changed in relation to working
collaboratively with the Local Authority (LA)” by sector
The extent to which headteachers believed that their actions had changed in relation to working collaboratively with the LA
Sector Not at
all Very little
Little Partially A lot Very
significantly Total
Primary 30
(8.0%) 46
(12.3%) 66
(17.7%) 102
(27.3%) 85
(22.8%) 44
(11.8%) 373
(100.0%)
Secondary 37
(10.3%) 60
(16.7%) 54
(15.0%) 94
(26.1%) 70
(19.4%) 45
(12.5%) 360
(100.0%)
Total 67
(9.1%) 106
(14.5%) 120
(16.4%) 196
(26.7%) 155
(21.1%) 89
(12.1%) 733
(100.0%)
When key staff were asked to indicate their agreement as to whether the
headteacher in their school works collaboratively with the Local Authority a far
greater level of agreement was reported overall. Just over 90% agreed
moderately or strongly to it (N=1,577); out of which 63% agreed strongly to it
(N=1,093). Higher proportions of primary key staff agreed moderately/strongly
than those from the secondary sample. In addition, primary key stage managers
(N= 434, 72%) were more like to give strong agreement to this item than their
peers in secondary schools (N=659, 59%)24.
Neither length of key staff experience nor the school disadvantage factor was
related to perceptions of this aspect of headteacher leadership.
1.8 Integrating School Policies With National Policy
Agendas
1.8.1 Differences by sector and socio-economic context
Variations were also found in responses to the question about the extent of
change in priorities relating to the National Government’s policy agenda, with
more primary heads (N=141, 39%) describing the amount of change in the past
three years as “a lot” or “very significant” and a much lower proportion (N=50,
13%) who reported “not at all” or “very little” change. At the secondary level,
more change was reported by heads of highly disadvantaged schools (Table
1.20). In common with the primary heads, over half of secondary heads (N=53,
24 χ²=38.86, df=5, p<0.001

22
52%) felt that their leadership practice in relation to integrating school priorities
with the National Government’s policy agenda had changed “a lot” or “very
significantly” over the past three years whereas a much lower proportion (16%,
N=56) reported “not at all” or “very little” change. For heads in low disadvantage
schools (FSM 1 and 2) only 30% (N=76) reported a lot or very significant change
in this aspect.
Table 1.20: Secondary headteacher responses to “To what extent do you believe
your leadership practice and actions have changed in relation to integrating
school priorities with the National Government’s policy agenda?”
School FSM Band
Not at all / Very little
Little Partially A lot / Very
significantly Total
FSM 1 and 2 42
(16.5%) 44
(17.3%) 92
(36.2%) 76
(29.9%) 254
(100.0%)
FSM 3 and 4 14
(13.7%) 7
(6.9%) 28
(27.5%) 53
(52.0%) 102
(100.0%)
Total 56
(15.7%) 51
(14.3%) 120
(33.7%) 129
(36.2%) 356
(100.0%)
A far greater number of key staff agreed moderately/strongly that their
headteacher integrates school priorities with the National Government’s policy
agenda (N=1,612, 92%). Variations were also found within the two sectors and
between schools in different socio-economic settings. Primary key stage
managers (N=399, 66%) were more likely to agree moderately/strongly than
secondary heads of departments (N=667, 58%)25. These responses also varied
based on the FSM bands of the schools. Those from FSM band 1 schools (N=298,
53%) were the least likely and key staff from schools in FSM band 4 (N=183,
66%) were the most likely to agree moderately/strongly to above statement26
(Table 1.21).
25 χ²=16.56, df=5, p<0.01 26 χ²=34.44, df=15, p<0.01

23
Table 1.21: Key staff responses to “To what extent do you agree that the
headteacher in your school integrates school priorities with the National
Government’s policy agenda” by FSM band
The extent to which key staff agreed that their headteacher integrates school priorities with the National Government’s policy agenda
FSM band Disagree
strongly Disagree
moderately Disagree slightly
Agree slightly
Agree moderately
Agree
strongly Total
1 1
(0.2%) 3
(0.5%) 5
(0.9%) 55
(9.7%) 204
(36.0%) 298
(52.7%) 566
(100.0%)
2 1
(0.2%) 0
(0.0%) 3
(0.5%) 34
(5.7%) 176
(29.5%) 383
(64.1%) 597
(100.0%)
3 1
(0.3%) 1
(0.3%) 1
(0.3%) 21
(7.0%) 81
(27.1%) 194
(64.9%) 299
(100.0%)
4 0
(0.0%) 0
(0.0%) 3
(1.1%) 9
(3.2%) 81
(29.2%) 183
(66.4%) 276
(100.0%)
Total 3
(0.2%) 4
(0.2%) 12
(0.7%) 119
(6.8%) 542
(31.2%) 1058
(60.9%) 1738
(100.0%)
The results suggest that integration of schools’ priorities with the National
Government Policy agenda is perceived to have been a major area of change by
key staff, especially at the secondary level, whereas this is less evident for
headteachers.
1.9 Working With The Governing Body
1.9.1 Differences by sector
In both sectors there were variations in heads’ reports on the extent of change in
the extent to which they worked collaboratively with the Governing Body. More
primary (N=209, 56%) than secondary heads (N=174, 48%) reported ‘some or a
lot of change’ in practice over the last three years. In secondary schools one in
five (N=77, 21%) reported “not at all” or “very little” change whereas
proportionately fewer primary heads reported this (N=61, 16%).
A substantial amount of agreement was noted when (N=1,665, 95%) key staff
were asked whether the headteacher in their school works collaboratively with
the Governing body. Nearly 75% agreed strongly to it with 21% agreeing
moderately. A slight sector difference was evident here with higher proportions of
primary key staff agreeing strongly to it (N=498, 82%) compared to less number

24
of those from secondary schools to say so (N=805, 71%)27. No variation was
noted based on staff’s length of experience or school disadvantage factor.
1.10 Working Collaboratively With The Senior Leadership/
Management Team And Other Staff
For both primary and secondary heads a large amount of change in their actions
was reported for the item related to working collaboratively with their Senior
Management Team (SMT) or Senior Leadership Team (SLT) over the last three
years. Almost one in three (N=113, 31%) of the secondary heads felt that change
in this area was “very significant”, compared with a slightly lower figure of nearly
one in four of the primary heads (N=88, 23%). In addition “a lot” of change was
reported by 39% (N=145) of primary heads and 21% (N=77) of secondary heads
(Table 1.22).
Table 1.22: Headteacher responses indicating degree of change in working with
the SMT/SLT
Question Sector Not at
all Very little
Little Partially A lot Very
significantly Total
Primary 18
(4.8%) 31
(8.2%) 23
(6.1%) 71
(18.9%) 145
(38.6%) 88
(23.4%) 376
(100.0%) Working collaboratively with the SMT/SLT Secondary
45 (12.5%)
29 (8.0%)
33 (9.1%)
64 (17.7%)
77 (21.3%)
113 (31.3%)
361 (100.0%)
Primary 25
(6.6%) 32
(8.5%) 49
(13.0%) 96
(25.4%) 140
(37.0%) 36
(9.5%) 378
(100.0%) Encouraging collaborative work among staff Secondary
27 (7.6%)
30 (8.5%)
28 (7.9%)
80 (22.6%)
157 (44.4%)
32 (9.0%)
354 (100.0%)
A similar proportion of primary (N=96, 25%) and secondary heads (N=80, 23%)
reported that their actions had changed “partially” in relation to collaboration with
other staff. However, almost half of secondary heads (N=157, 44%), compared
to over a third of primary heads (N=140, 37%), reported “a lot” of change in
leadership practice in working with the SMT over the last three years (Table
1.22).
In the primary sample there was greater variation in responses concerning extent
of change in collaborative working with the SLT. Less change was reported for
27 χ²=31.16, df=4, p<0.001

25
high disadvantage schools28 (Table 1.23). Twenty-three percent of primary heads
(N=32) leading FSM 3 and 4 schools, compared to 16% of their peers in FSM 1
and 2 schools (N=38), reported “not at all”, “very little” or “little” change in
leadership practice in relation to working collaboratively with their SMT/SLT.
However, more change was also reported by other primary heads (65% in FSM 3
and 4 compared with 61% in FSM 1 and 2).
Table 1.23: Primary headteacher responses to “To what extent do you believe
your leadership practice and actions have changed in relation to working
collaboratively with the SMT/SLT?” by school FSM band
School FSM Band
Not at all / Very little
Little Partially A lot / Very
significantly Total
FSM 1 and 2 26
(11.2%) 12
(5.2%) 53
(22.7%) 142
(60.9%) 233
(100.0%)
FSM 3 and 4 22
(15.6%) 10
(7.1%) 18
(12.8%) 91
(64.5%) 141
(100.0%)
Total 48
(12.8%) 22
(5.9%) 71
(19.0%) 233
(62.3%) 374
(100.0%)
1.10.1 Differences by headteacher experience in school
There is a marked difference in the extent of reported change for a range of
survey items between less experienced and more experienced heads in the
sample, particularly in the primary sector. In both sectors, heads’ length of
service in their current schools is related to the extent of reported change in
terms of working collaboratively with the Governing Body, the Local Authority and
the SMT/SLT, and encouraging collaborative work amongst staff (Table 1.24). In
all cases, more experienced heads reported less change in leadership practice in
their schools over the last three years. Moderate, statistically highly significant
negative associations were found between heads’ experience in their current
school and the degree of reported change in relation to working collaboratively
with the Governing Body for both the primary29 and the secondary sample30. This
points to the priority given by heads during their first years as head of a school in
taking actions that promote wider participation and collaboration in leadership
practice in our sample of improving and effective schools.
28 Gamma=-0.17, p<0.05 29 Gamma=-0.40, p<0.001 30 Gamma=-0.31, p<0.001

26
Table 1.24: Headteacher responses indicating the degree of change in
collaborative practice by years of experience as a headteacher
Question Years of
experience
Not at all / Very little
Little Partially A lot / Very significantly
Total
0-3 years 10
(8.0%) 8
(6.4%) 24
(19.2%) 83
(66.4%) 125
(100.0%)
4-7 years 30
(17.2%) 18
(10.3%) 42
(24.1%) 84
(45.0%) 174
(100.0%)
8-15 years 54
(22.1%) 35
(14.3%) 82
(33.6%) 73
(29.9%) 244
(100.0%)
Working collaboratively with the Governing Body
16 years+ 28
(24.3%) 26
(22.6%) 35
(30.4%) 31
(27.0%) 120
(100.0%)
0-3 years 13
(10.4%) 10
(8.0%) 39
(31.2%) 63
(50.4%) 125
(100.0%)
4-7 years 33
(19.0%) 27
(15.5%) 47
(27.0%) 67
(38.5%) 174
(100.0%)
8-15 years 81
(33.2%) 41
(16.8%) 61
(25.0%) 61
(25.0%) 244
(100.0%)
Working collaboratively with the Local Authority (LA)
16 years+ 31
(27.2%) 25
(21.9%) 31
(27.2%) 27
(23.7%) 114
(100.0%)
0-3 years 11
(8.7%) 10
(7.9%) 15
(11.9%) 90
(71.4%) 126
(100.0%)
4-7 years 23
(13.2%) 11
(6.3%) 31
(17.8%) 107
(61.5%) 172
(100.0%)
8-15 years 45
(18.4%) 12
(4.9%) 49
(20.0%) 139
(56.7%) 245
(100.0%)
Working collaboratively with the SMT/SLT
16 years+ 27
(23.5%) 16
(13.9%) 22
(19.1%) 50
(43.5%) 115
(100.0%)
0-3 years 9
(7.2%) 8
(6.4%) 31
(24.8%) 77
(61.6%) 125
(100.0%)
4-7 years 23
(13.2%) 17
(9.8%) 41
(23.6%) 93
(53.4%) 174
(100.0%)
8-15 years 39
(16.0%) 35
(14.3%) 53
(21.7%) 117
(48.0%) 244
(100.0%)
Encouraging
collaborative work
among staff
16 years+ 29
(25.4%) 11
(9.6%) 36
(31.6%) 38
(33.3%) 114
(100.0%)
1.11 Key Staff Perspectives on Collaborative Practice
Key staff were asked about the extent to which the headteacher works
collaboratively with the SMT/SLT, a high degree of agreement was reported by
primary (N=582, 95%) and secondary respondents (N=1,055, 92%)31 (Table
31 P<0.001

27
1.25). This pattern was similar to the ones found for external collaborations. Also,
key staff from high disadvantage schools were found to be more likely to agree
moderately/strongly32. No significant variations were found between the primary
or secondary sectors.
Table 1.25: Key staff responses to “The extent to which the headteacher works
collaboratively with SMT/SLT” by sector
Sector Disagree strongly
Disagree moderately
Disagree slightly
Agree slightly
Agree moderately
Agree strongly
Total
Primary 0
(0.0%) 2
(0.3%) 2
(0.3%) 15
(2.5%) 104
(17.3%) 478
(79.5%) 601
(100.0%)
Secondary 8
(0.7%) 9
(0.8%) 18
(1.6%) 63
(5.5%) 226
(19.6%) 829
(71.9%) 1153
(100.0%)
Total 8
(0.5%) 11
(0.6%) 20
(1.1%) 78
(4.4%) 330
(18.8%) 1307
(74.5%) 1754
(100.0%)
When asked about the extent to which their headteacher encourages
collaborative work among staff, variations were found in the way key staff
responded to the item. Over half agreed strongly (N=983, 56%), 30% agreed
moderately (N=523) and 11% agreed slightly (N=200) (Table 1.26). There was a
large difference across sectors in the way key staff reported strong agreement.
Significantly more primary staff (N=427, 71%) compared with a smaller
proportion of secondary staff (N=556, 48%) agreed strongly that their head
encouraged collaborative work33.
Table 1.26: Key staff responses to “The extent to which the headteacher
encourages collaborative work amongst staff” by sector
The extent to which the headteacher encourages collaborative work amongst staff
Sector Disagree strongly
Disagree moderately
Disagree slightly
Agree slightly
Agree moderately
Agree strongly
Total
Primary 1
(0.2%) 2
(0.3%) 6
(1.0%) 26
(4.3%) 142
(23.5%) 427
(70.7%) 604
(100.0%)
Secondary 3
(0.3%) 12
(1.0%) 30
(2.6%) 174
(15.1%) 381
(33.0%) 556
(48.1%) 1156
(100.0%)
Total 4
(0.2%) 14
(0.8%) 36
(2.0%) 200
(11.4%) 523
(29.7%) 983
(55.9%) 1760
(100.0%)
School disadvantage was positively related to the way staff responded to this
aspect of headteacher leadership. A greater degree of strong agreement was
32 χ²=8.14, df=3, p<0.05 33 χ²=96.14, df=5, p<0.001

28
identified by key staff from school FSM band 4 (N=163, 60%) than by their
counterparts from school FSM band 1 (N=290, 51%)34 indicating that
collaboration is an important feature for improving schools in disadvantaged
contexts.
A similar pattern of difference was found between sectors, when key staff were
asked the extent to which they agreed that their headteacher promoted
leadership development among teachers. Higher proportions of primary key staff
(N=445, 73%) than their secondary peers (N=674, 60%) agreed strongly that
their head emphasised this. However, there were no significant differences in
responses to this item related to school context measured by level of
disadvantage (school FSM band).
1.11.1 The pivotal role of SLT: redefining the senior leadership team
Overall, 54% of secondary heads thought their leadership practice had changed
very significantly or a lot during the last three years and the figure for primary
heads was higher at 63%. Over 60% of secondary but only 31% of primary heads
reported that leadership in their school was exercised ‘all the time’ by their SLT.
Turning to key staff perceptions we find that 72% of secondary and 80 per cent
of primary key staff strongly agreed that their headteacher worked collaboratively
with the SMT/SLT in their school.
1.11.2 Distribution or delegation?
Overall 38% of primary key staff felt that leadership tasks were delegated by the
headteacher or SLT in their school very significantly and another 40% said this
happened a lot. For secondaries the picture was very similar for key staff with
33% saying delegation was very significant and another 45% saying that this
happened a lot.
1.11.3 Regularity of consultation between ‘tiers’
Overall, 37% of secondary key staff felt that their headteacher ensured wide
participation in decisions about school improvement and another third (33%) felt
this happened a lot. For primary key staff the responses are notably more
positive with 55% thinking that wide participation was very significant and
another 35% that this happened a lot. This may reflect differences in school size
34 χ²=27.16, df=15, p<0.05

29
and organizational complexity between the two sectors rather than differences in
the mind sets of headteachers.
1.12 Key Findings:
i) Effective leadership relies upon an increasingly close and
collaborative relationship between headteachers and the SLT.
• Of the heads surveyed, 23% of primary headteachers and 31% of
secondary heads reported an increase in collaborative work between
heads and the SLT, over the last three years.
ii) Level of leadership experience of the headteacher has an association
with the level of change implementation to structures in the school.
• In all 80% of secondary heads with 0-3 years of experience reported
some change in internal review procedures, compared with 60% of
secondary heads with more that sixteen years of experience.
• Over two thirds (68%) of secondary heads with 0-3 years of
experience reported changes in structuring the organisation to
facilitate work, compared with 43% for secondary heads with more
than sixteen years of experience.
iii) Broadening participation in and communication about change needed
to promote improvement is a key leadership strategy
• Around one-half of all heads surveyed reported some or a lot of change
in practice in relation to working collaboratively with their governing
body, over the last three years.
iv) Changes in efforts to engage parents in school improvement were
more likely to be reported by headteachers with less experience at
their current school, and by headteachers in more disadvantaged
contexts (FSM 3 and 4 schools).
• Around a quarter of all primary and secondary heads surveyed
reported a lot, or very significant changes, in building community
support for school improvement. The group most likely to report these
changes were primary heads in FSM 3 and 4 schools.
This chapter has highlighted the survey evidence on the extent to which heads of
improving and effective schools in the research had placed emphasis on changing
organisational and decision-making structures during the last three years. It has

30
shown how the extent of change varies by sector, level of school disadvantage
and headteachers’ time in current post.

31
Chapter 2: Changing School Cultures
The analyses of the results from respondents in the surveys highlight a number of
key features which focus on leadership actions in relation to school culture. The
results suggest that changing school culture can be an important feature of
strategies to create favourable conditions for school improvement.
2.1 Providing A Sense of Purpose: Raising Expectations
2.1.1 Providing a sense of purpose
The majority of primary and secondary heads reported some or ‘a lot’ of change
in practice over the last three years in relation to giving staff a sense of overall
purpose. In all, 52% of primary heads (N=194) and 46% of secondary heads
(N=166) thought their leadership practice and actions had changed “very
significantly” or “a lot” in relation to giving staff an overall sense of purpose
during this period. In particular, 10% (N=36) of primary heads and 15% (N=54)
of secondary heads indicated “very significant” change in their leadership practice
in this aspect. In contrast, 27% of secondaries (N=98) and 25% of primaries
(N=97) felt they had made little change in terms of giving staff an overall sense
of purpose. This may reflect different perceived needs in these schools related to
attainment and improvement groups, a topic investigated in Chapter 4.
Key staff views showed some sector differences. A significantly greater proportion
of primary key staff (N=439, 72%) than secondary (N=713, 61%) agreed
strongly that they felt their headteacher gave staff an overall sense of purpose35
(Table 2.1). Moreover, higher proportions of key staff from highly disadvantaged
contexts (FSM bands 3 and 4, N=404, 70%) agreed strongly that their
headteacher showed this quality of leadership than their counterparts from less
disadvantaged schools (FSM bands 1 and 2, N=737, 63%). This difference was
statistically significant36. It is clear that staff generally had a very positive view of
the way their headteacher gave them an overall sense of purpose in both sectors,
pointing to the importance of this attribute for leadership in improving and
effective schools.
35 χ²=29.07, df=5, p<0.001 36 χ²=13.95, df=5, p<0.05

32
Table 2.1: Key staff responses to “To what extent do you agree that the
headteacher in your school gives staff a sense of overall purpose?”
Sector Disagree strongly
Disagree moderately
Disagree slightly
Agree slightly
Agree moderately
Agree strongly
Total
Primary 1
(0.2%) 0
(0.0%) 6
(1.0%) 23
(3.8%) 137
(22.6%) 439
(72.4%) 606
(100.0%)
Secondary 6
(0.5%) 13
(1.1%) 23
(2.0%) 76
(6.5%) 335
(28.7%) 713
(61.1%) 1166
(100.0%)
Total 7
(0.4%) 13
(0.8%) 29
(1.6%) 99
(5.6%) 472
(26.6%) 1152
(65.0%) 1772
(100.0%)
A similar pattern was also noted within the secondary school sample. Slightly
higher proportions of heads of department from high disadvantage schools
(N=233, 67%) agreed strongly to the above statement than their counterpart
from less disadvantaged schools (N=472, 59%)37 (Table 2.2). This suggests that
this may be a particularly important attribute for successful leadership of schools
in disadvantaged areas.
Table 2.2: Secondary key staff responses to “To what extent do you agree that
the headteacher in your school gives staff a sense of overall purpose?” by school
FSM band
School FSM Band
Disagree strongly
Disagree moderately
Disagree slightly
Agree slightly
Agree moderately
Agree strongly
Total
FSM 1 and 2
5 (0.6%)
11 (1.4%)
20 (2.5%)
60 (7.4%)
238 (29.5%)
472 (58.6%)
806 (100.0%)
FSM 3 and 4
0 (0.0%)
2 (0.6%)
2 (0.6%)
16 (4.6%)
96 (27.5%)
233 (66.8%)
349 (100.0%)
Total 5
(0.4%) 13
(1.1%) 22
(1.9%) 76
(6.6%) 334
(28.9%) 705
(61.0%) 1155
(100.0%)
2.1.2 Differences by years of experience in school
For primary heads only, a moderate, statistically highly significant negative
association was found between experience and the extent of reported change in
leadership practice in giving staff a sense of overall purpose38. As Figure 2.1
shows, there was a marked difference between the extent of change reported by
less experienced heads and their more experienced peers: 73% of heads (N=51)
with less than three years’ experience in their current schools reported a
37 χ²=14.23, df=5, p<0.05 38 χ²=36.06, df=9, p<0.001; Gamma=-0.38, p<0.001

33
0%
10%
20%
30%
40%
50%
60%
70%
80%
90%
100%
0-3 years 4-7 years 8-15 years 16+years
A lot/ Verysignif icantly
Partially
Little
Not at all/Very little
(N=70) (N=49)(N=74)(N=64)
substantial amount of change in their schools over the last three years, a
proportion that was three times the figure for more experienced (16+ years)
heads (N=13, 27%). It thus seems, perhaps not surprisingly, that in the early
stages of headship in a new school heads in our sample of highly effective/highly
improved schools gave particular attention to raising expectations and setting
directions.
Figure 2.1: Primary heads’ experience in school and the extent of reported
change in giving staff a sense of overall purpose
2.1.3 High expectations for staff
For both primary and secondary heads, different degrees of change over the last
three years in their leadership practice were reported which related to the item on
demonstrating high expectations for staff’s work with pupils. In all, 50% of
secondary heads and 46% of primary heads thought this had changed “a lot” or
“very significantly”. In both sectors, approximately a third of headteachers
(Primary: N=124, 33%; Secondary: N=116, 32%) reported “a lot” of change in
this area. However, nearly another third reported “not at all” or a fairly small
amount of change (“very little” or “little”) in practice (Primary: N=106, 29%;
Secondary: N=115, 31%). Overall 92% of key staff agreed moderately/strongly
that the headteacher in their school demonstrated high expectations for staff’s
work with pupils. The proportion of key staff agreeing strongly was slightly higher
within the primary (N=456, 75%) than the secondary sector (N=813, 70%) and
the difference, though small, was statistically significant (p<0.05) (Table 2.3).
These results suggest that creating a climate of high expectations was perceived

34
to be a strong feature of heads’ activity in most of this sample of improving and
effective schools.
Table 2.3: Key staff responses to “To what extent do you agree that the
headteacher in your school demonstrates high expectations for staff’s work with
pupils?”
Sector Disagree strongly
Disagree moderately
Disagree slightly
Agree slightly
Agree moderately
Agree strongly
Total
Primary 1
(0.2%) 1
(0.2%) 6
(1.0%) 23
(3.8%) 119
(19.6%) 456
(75.0%) 606
(100.0%)
Secondary 8
(0.7%) 7
(0.6%) 15
(1.3%) 79
(6.8%) 245
(21.0%) 813
(69.7%) 1167
(100.0%)
Total 9
(0.5%) 8
(0.5%) 21
(1.2%) 102
(5.8%) 364
(20.5%) 1269
(71.6%) 1773
(100.0%)
There was greater variation in responses to this item by heads in the primary
sample in disadvantaged contexts. They were more likely to report a lot of very
significant change in demonstrating high expectations (49.6%, N=70) than those
in low disadvantage contexts (44.7%, N=104)39 (Table 2.4), but this was not the
case in the secondary group. However, thirty-five percent of primary heads in
FSM 3 and 4 schools (N=49), compared to 27% of those leading FSM 1 and 2
schools (N=64), reported little change (“not at all/very little” and “little”) in their
leadership practice in relation to demonstrating high expectations for staff’s work
with pupils.
Table 2.4: Primary headteacher responses to “To what extent do you believe your
leadership practice and actions have changed in relation to demonstrating high
expectations for staff’s work with pupils in the last three years?” by school FSM
band
School FSM Band
Not at all
Very Little
Little Partially A lot Very
significantly Total
FSM 1 and 2
15 (6.4%)
20 (8.6%)
29 (12.4%)
65 (27.9%)
81 (34.8%)
23 (9.9%)
233 (100.0%)
FSM 3 and 4
17 (12.1%)
13 (9.2%)
19 (13.57%)
22 (15.6%)
43 (30.5%)
27 (19.1%)
141 (100.0%)
Total 32
(8.6%) 33
(8.8%) 48
(12.8%) 87
(23.3%) 124
(33.2%) 50
(13.4%) 374
(100.0%)
39 χ²=8.23, df=3, p<0.05

35
2.1.4 High expectations for pupil behaviour
Similar proportions of primary and secondary heads reported change in relation to
demonstrating high expectations for pupil behaviour. In both sectors, almost one
in five (Primary: N=63, 17%; Secondary: N=69, 19%) reported “very significant”
change in this area in their schools over the last three years. In addition, 28% of
primary heads and 25% of secondary heads reported “a lot” of change in
demonstrating high expectations for pupil behaviour. However, at least one in five
(Primary: N=85, 23%; Secondary: N=76, 21%) heads reported otherwise (“not
at all” or “very little”).
Heads were more likely to indicate “a lot” or “very significant” change relating to
demonstrating high expectations for pupil achievement (over half of both primary
and secondary heads reported this). “Very significant” change in this area was
more commonly reported by secondary (N=91, 25%) than primary heads (N=65,
17%) (see Appendices XVI and XVII).
Figure 2.2 shows that the vast majority of key staff agreed strongly when asked
whether the headteacher in their school demonstrated high expectations for pupil
behaviour. (N=1,498, 85%). However, a sector difference was evident here.
Close to 74% of primary key staff (N=446) compared with only 52% secondary
key staff (N=609) agreed strongly to this item and this difference was statistically
significant40 (Figure 2.2). This may reflect greater difficulties in pupil behaviour
management across the two sectors. No variations in response were found based
on staff length of experience or school disadvantage.
When asked if pupils felt safe in their school, 82% of headteachers and 84% of
key staff in primary schools strongly agreed. In contrast, 57% of secondary heads
and but only 44% of secondary key staff strongly agreed that this was the case in
their school. It is clear that pupil behaviour management is perceived to be more
problematic by key staff in secondary than those in primary schools for this
sample.
40 χ²=92.64, df=5, p<0.001; Gamma=-0.43, p<0.001

36
Figure 2.2: Differences between primary and secondary school key staff’s
perceptions in relation to demonstrating high expectations for pupil behaviour
0%
10%
20%
30%
40%
50%
60%
70%
80%
90%
100%
Primary 2% 5% 20% 74%
Secondary 9% 11% 28% 52%
Disagree strongly/moderately/slightly
Agree slightlyAgree
moderatelyAgree
strongly
2.2 Shared Professional Beliefs And Values
The item, ‘most teachers in our school share a similar set of values, beliefs and
attitudes related to teaching and learning’, can be seen as an indicator of school
culture. The survey results suggest that most heads and key staff in both sectors
had positive views about the extent to which this statement characterised their
school.
There were some sector differences however (Table 2.5). In all, 68% of primary
heads (N=259) and 67% of primary key staff (N=402) strongly agreed with this
item as a description of their school, and another 27% of primary heads (N=100)
and 27% of primary staff (N=164) agreed moderately. In contrast, for secondary
schools 47% of heads (N=170) and 45% of key staff (N=522) showed strong
agreement, with 43% of heads (N=157) and 36% of key staff (N=421) indicating
moderate agreement. This may reflect school size and the stronger role of
departmental and subject differences. These differences were statistically
significant.

37
0%
10%
20%
30%
40%
50%
60%
70%
80%
90%
100%
0-3 years 4-7 years 8-15 years 16+years
A lot/ Verysignif icantly
Partially
Little
Not at all/Very little
(N=69) (N=49)(N=74)(N=63)
Table 2.5: Headteacher and key staff responses to “Indicate the extent to which
you agree that most tecachers in our school share a similar set of values, beliefs
and attitudes related to teaching and learning” by sector
Sector Respondents Disagree strongly
Disagree moderately
Disagree slightly
Agree slightly
Agree moderately
Agree
strongly Total
Headteachers 0
(0.0%) 1
(0.3%) 2
(0.5%) 15
(4.0%) 100
(26.5%) 259
(68.7%) 377
(100.0%) Primary
Key staff 0
(0.0%) 3
(0.5%) 6
(1.0%) 32
(5.3%) 191
(31.7%) 370
(61.5%) 602
(100.0%)
Headteachers 0
(0.0%) 3
(0.8%) 3
(0.8%) 28
(7.8%) 157
(43.5%) 170
(47.1%) 361
(100.0%) Secondary
Key staff 4
(0.3%) 16
(1.4%) 43
(3.7%) 192
(16.6%) 533
(45.9%) 372
(32.1%) 1160
(100.0%)
2.3 Developing People
2.3.1 CPD (Continuing Professional Development)
Most primary (N=226, 60%) and secondary (N=217, 60%) heads reported a
moderate or a substantial amount of change over the three year period in relation
to promoting a range of CPD experience among all staff. “Very significant” change
in practice in this area was reported by a minority of 16% of primary heads
(N=58) and a similar proportion of secondary heads (N=54, 15%). Less
experienced primary heads were more likely to report change in terms of
promoting a range of CPD experiences41 (Figure 2.3), but this was not the case
for the secondary heads.
Figure 2.3:
Primary heads’
experience in
school and the
extent of
reported change
in promoting a
range of CPD
among all staff
41 χ²=25.1, df=9, p<0.01; Gamma=-0.26, p<0.001

38
Similarly, just over half key staff agreed strongly that their headteacher promoted
a range of CPD experiences among all staff (N=921, 52%) and close to one third
agreed moderately to it (N=549, 31%).
Once again, the sector difference was evident in key staff responses concerning
the extent that the head was perceived to promote a range of CPD experiences
for staff in their school. More primary key staff (N=388, 64%) agreed that this
was the case (“very significantly”) than was the case for their secondary school
peers (N=533, 46%) (p<0.001). 42. In addition, a greater degree of strong
agreement was reported by those from high disadvantage schools (N=339, 58%)
than their counterparts from less disadvantaged schools (N=573, 49%)43 (Table
2.6).
Table 2.6: Key staff responses to “To what extent do you agree that the
headteacher in your school promotes a range of CPD experiences among all
staff?” by school FSM band
School FSM Band
Disagree strongly
Disagree moderately
Disagree slightly
Agree slightly
Agree moderately
Agree strongly
Total
FSM 1 and 2
6 (0.5%)
23 (2.0%)
32 (2.7%)
157 (13.5%)
374 (32.1%)
573 (49.2%)
1165 (100.0%)
FSM 3 and 4
3 (0.5%)
5 (0.9%)
13 (2.2%)
49 (8.4%)
172 (29.6%)
339 (58.3%)
581 (100.0%)
Total 9
(0.5%) 28
(1.6%) 45
(2.6%) 206
(11.8%) 546
(31.4%) 912
(52.2%) 1746
(100.0%)
Within primary schools, those key staff from low disadvantaged school contexts
(N=226, 61%) were less likely to agree strongly that their headteacher promoted
a range of CPD experiences in comparison with their peers from high
disadvantage schools (N=159, 69%) (p<0.05). This suggests that CPD may have
been used more extensively as part of an improvement strategy in high
disadvantage contexts.44 (Table 2.7).
42 χ²=68.94, df=5, p<0.001; Gamma=-0.35, p<0.001 43 χ²=18.75, df=5, p<0.01 44 χ²=9.54, df=4, p<0.05

39
Table 2.7: Primary key staff responses to “To what extent do you agree that the
headteacher in your school promotes a range of CPD experiences among all
staff?” by school FSM band
School FSM Band
Disagree strongly
Disagree moderately
Disagree slightly
Agree slightly
Agree moderately
Agree strongly
Total
FSM 1 and 2
0 (0.0%)
3 (0.8%)
3 (0.8%)
36 (9.8%)
100 (27.2%)
226 (60.8%)
368 (100.0%)
FSM 3 and 4
0 (0.0%)
1 (0.4%)
1 (0.4%)
8 (3.4%)
63 (27.2%)
159 (68.5%)
232 (100.0%)
Total 0
(0.0%) 4
(0.7%) 4
(0.7%) 44
(7.3%) 163
(27.2%) 421
(70.2%) 600
(100.0%)
2.3.2 Developing care and trust
In both sectors there were variations in the extent of reported change in
leadership practice in terms of developing an atmosphere of caring and trust.
Although one in four (Primary: N=96, 26%; Secondary: N=91, 25%) reported
“not at all” or “very little” change in this area in their schools, another quarter of
heads (Primary: N=96, 26%; Secondary: N=101, 28%) felt that their leadership
practice in this area had changed “a lot” over the last three years. “Very
significant” change in practice was reported by fifteen per cent of primary heads
(N=58) and 14% of secondary heads (N=51) (Appendices XVI and XVII).
When key staff were asked whether the headteacher in their school develops an
atmosphere of caring and trust, 57% agreed strongly (N=1,013) with 24%
indicating moderately strong agreement. A noticeable difference was found
between the responses of staff from both sectors (Figure 2.4). Primary key staff
(N=426, 71%) were significantly more likely to agree moderately/strongly than
their peers in secondary schools (N=587, 51%)45. The smaller organizational size
of primary schools may facilitate the development of such care and trust.
45 χ²=78.35, df=5, p<0.001; Gamma=-0.39, p<0.001

40
Figure 2.4: Differences between primary and secondary school key staffs’
perceptions of their headteachers’ leadership style in relation to developing an
atmosphere of caring and trust
0%
10%
20%
30%
40%
50%
60%
70%
80%
90%
100%
Primary 3% 7% 20% 71%
Secondary 9% 14% 26% 51%
Disagree strongly/modera
tely/slightlyAgree slightly
Agree moderately Agree strongly
2.3.3 Modeling professional practice
Nearly two thirds of key staff reported strong agreement when they were asked
whether their head modelled a high level of professional practice (N=1,108,
63%). A substantial number of them agreed moderately/strongly to it (N=1,522,
86%). Weak but statistically significant variations existed between primary and
secondary staff agreements; with higher numbers of primary key staff than those
of secondary schools agreeing (p<0.05)46 (Table 2.8). Taken together with
findings on the atmosphere of caring and trust noted above, these results suggest
that the professional climate of secondary and primary schools is likely to differ
also.
46 χ²=8.67, df=3, p<0.05; Gamma=-0.204, p<0.01

41
Table 2.8: Key staff responses to “To what extent do you agree that the
headteacher in your school models a high level of professional practice?” by
sector
Sector Disagree strongly
Disagree moderately
Disagree slightly
Agree slightly
Agree moderately
Agree strongly
Total
Primary 4
(0.7%) 7
(1.2%) 16
(2.7%) 37
(6.1%) 144
(23.9%) 395
(65.5%) 603
(100.0%)
Secondary 15
(1.3%) 20
(1.7%) 35
(3.0%) 110
(9.5%) 270
(23.2%) 713
(61.1%) 1163
(100.0%)
Total 19
(1.1%) 27
(1.5%) 51
(2.9%) 147
(8.3%) 414
(23.4%) 1108
(62.7%) 1766
(100.0%)
Also in both sectors, one in five headteachers reported very little, if any, change
(“not at all” or “very little”) in relation to modelling a high level of professional
practice in their schools (Primary: N=78, 21%; Secondary: N=79, 22%). A
quarter of primary heads (N=97, 26%) and almost a third of secondary heads
(N=112, 31%), by contrast, reported “a lot” of change in this area over the last
three years. However, for the secondary sample, heads in high disadvantage
schools were more likely to report a substantial amount of change in leadership
practice relating to modelling a high level of professional practice47 (Table 2.9).
Table 2.9: Secondary headteacher responses to “To what extent do you believe
that your actions have changed in relation to modelling a high level of
professional practice over the past three years?” by school FSM band
School FSM Band
Not at all / Very little Little Partially A lot / Very significantly Total
FSM 1 and 2
62 (24.6%)
32 (12.7%)
62 (24.6%)
96 (38.1%)
252 (100.0%)
FSM 3 and 4
17 (16.7%)
7 (6.9%)
24 (23.5%)
54 (52.9%)
102 (100.0%)
Total 79
(22.3%) 39
(11.0%) 86
(24.3%) 150
(42.4%) 354
(100.0%)
For both the primary and the secondary sample, weak but statistically highly
significant associations were found between heads’ experience, in their current
school, and the extent of reported change on these two items relating to
developing people (Appendix II). Again, less experienced heads were more likely
47 χ²=8.11, df=3, p<0.05; Gamma=0.25, p<0.01

42
to report change in these areas in their schools over the last three years
indicating that this is an important area of focus when heads first take up post in
a school.
2.4 Discussion of Educational Issues: Differences By Sector,
Socio-Economic Context And Years Of Experience In
School
A fair degree of change in practice was reported by both primary and secondary
heads in relation to frequently discussing educational issues with staff. In both
sectors, one in three (Primary: N=124, 33%; Secondary: N=118, 33%) reported
“a lot” of change and almost a third “partial” change (Primary: N=110, 29%;
Secondary: N=102; 29%) (Table 2.10). A very similar pattern was found in
relation to the extent of reported change in practice in terms of buffering teachers
from distractions to their teaching. In both sectors “partial” and “a lot” of change
in practice in this area was reported by a third of heads.
Table 2.10: Headteacher responses indicating the degree of change in frequently
discussing educational issues with staff and buffering teachers from distractions
to their teaching over the past three years
Question Sector Not at
all Very little
Little Partially A lot Very
significantly Total
Primary 32
(8.5%) 31
(8.2%) 50
(13.3%) 110
(29.2%) 124
(32.9%) 30
(8.0%) 377
(100.0%) Frequently discussing educational issues with staff Secondary
27 (7.6%)
32 (9.1%)
44 (12.5%)
102 (28.9%)
118 (33.4%)
30 (8.5%)
353 (100.0%)
Primary 26
(6.9%) 28
(7.4%) 44
(11.7%) 125
(33.2%) 123
(32.7%) 30
(8.0%) 376
(100.0%) Buffering teachers from distractions to their teaching Secondary
30 (8.5%)
17 (4.8%)
35 (9.9%)
117 (33.1%)
119 (33.6%)
36 (10.2%)
354 (100.0%)
For the secondary sample, heads of high disadvantage school contexts were more
likely to report a substantial amount of change in these two areas relating to
managing the teaching programme (Discussing educational issues48 and buffering
teachers from distractions49). This was not the case for primary schools.
48 χ²=10.06, df=3, p<0.05; Gamma=0.27, p<0.01 49 χ²=9.4, df=3, p<0.05; Gamma=0.25, p<0.01

43
0%
10%
20%
30%
40%
50%
60%
70%
80%
90%
100%
FSM 1&2 (0-20%) 4% 6% 15% 75%
FSM 3&4 (21%+) 2% 4% 11% 84%
Disagree strongly/moderate
lyDisagree slightly Agree slightly
Agree moderately/strong
ly
Turning to key staff, seven out of ten agreed moderately/strongly that their
headteacher frequently discussed educational issues with them (N=1,375, 78%);
with half of them reported a strong agreement (N=881, 50%). Higher proportions
of primary key stage managers (N=532, 82%) than their counterparts in
secondary schools (N=843, 73%) agreed to this statement. This association was
statistically significant50 (Table 2.11).
Table 2.11: Key staff responses indicating the extent to which the headteacher
discusses educational issues, and buffers teachers from distractions
Question Sector Disagree strongly
Disagree moderately
Disagree slightly
Agree slightly
Agree moderately
Agree strongly
Total
Primary 0
(0.0%) 6
(1.0%) 11
(1.8%) 55
(9.1%) 139
(23.0%) 393
(65.1%) 604
(100.0%) Frequently discussing educational issues with staff Secondary
16 (1.4%)
35 (3.0%)
75 (6.5%)
186 (16.1%)
355 (30.7%)
488 (42.3%)
1155 (100.0%)
Primary 5
(0.8%) 8
(1.4%) 20
(3.4%) 81
(13.7%) 212
(35.8%) 266
(44.9%) 592
(100.0%)
Buffering teachers from distractions to their teaching
Secondary 33
(2.9%) 47
(4.1%) 127
(11.1%) 229
(20.1%) 364
(31.9%) 341
(29.9%) 1141
(100.0%)
A weak but significant relationship was found between school disadvantage and
the key staff agreement that their headteacher frequently discusses educational
issues with them (Figure 2.5). Key staff in high disadvantage schools (N=481,
84%) were more likely to agree than their peers in low disadvantage schools
(N=882, 75%)51. This variation was also evident within the secondary sample
(Table 2.12).
Figure 2.5:
Differences between
key staff levels of
agreement when
asked whether the
headteacher
discusses
educational issues
with staff frequently
by school FSM band
50 χ²=57.76, df=3, p<0.001; Gamma=-0.46, p<0.001 51 χ²=15.20, df=3, p<0.01; Gamma=0.24, p<0.001

44
Table 2.12: Secondary key staff responses to the question “To what extent do
you agree that the headteacher in your school frequently discusses educational
issues with staff?” by school FSM band
School FSM Band
Disagree strongly
Disagree moderately
Disagree slightly
Agree slightly
Agree moderately
Agree strongly
Total
FSM 1 and 2
13 (1.6%)
27 (3.4%)
56 (7.0%)
141 (17.7%)
250 (31.4%)
310 (38.9%)
797 (100.0%)
FSM 3 and 4
3 (0.9%)
7 (2.0%)
18 (5.2%)
45 (13.0%)
102 (29.4%)
172 (49.6%)
347 (100.0%)
Total 16
(1.4%) 34
(3.0%) 74
(6.5%) 186
(16.3%) 352
(30.8%) 482
(42.1%) 1144
(100.0%)
In both primary52 and secondary53 sectors, heads’ experience in their current
schools was related to the extent of reported change in discussing educational
issues with staff (Table 2.13). Once again, more experienced heads reported less
change in this aspect of their practice over the last three years.
Table 2.13: Headteacher responses to the question “To what extent do you
believe your actions have changed in relation to frequently discussing
educational issues with staff over the past three years?” by years of experience
Sector Years of
experience Not at
all Very little
Little Partially A lot Very
significantly Total
0-3 years 2
(4.3%) 1
(2.2%) 6
(13.0%) 15
(32.6%) 16
(34.8%) 6
(13.0%) 46
(100.0%)
4-7 years 5
(6.5%) 8
(10.4%) 12
(15.6%) 18
(23.4%) 27
(35.1%) 7
(9.1%) 77
(100.0%)
8-15 years 8
(6.3%) 11
(8.6%) 22
(17.2%) 34
(26.6%) 44
(34.4%) 9
(7.0%) 128
(100.0%)
Primary
16+ years 12
(15.4%) 7
(9.0%) 6
(7.7%) 31
(39.7%) 19
(24.4%) 3
(3.8%) 78
(100.0%)
0-3 years 2
(2.6%) 6
(7.8%) 6
(7.8%) 23
(29.9%) 30
(39.0%) 10
(13.0%) 77
(100.0%)
4-7 years 6
(6.1%) 5
(5.1%) 11
(11.2%) 27
(27.6%) 41
(41.8%) 8
(8.2%) 98
(100.0%)
8-15 years 11
(9.6%) 14
(12.2%) 18
(15.7%) 36
(31.3%) 30
(26.1%) 6
(5.2%) 115
(100.0%)
Secondary
16+ years 3
(10.0%) 5
(16.7%) 4
(13.3%) 7
(23.3%) 7
(23.3%) 2
(6.7%) 28
(100.0%)
52 Gamma=-0.18, p<0.05 53 Gamma=-0.22, p<0.01

45
2.5 Managing The Teaching And Learning Programme
2.5.1 Strengthening internal review: differences by sector and socio-
economic context
More than half of primary heads (N=204, 54%) reported “a lot” or “very
significant” change in practice relating to improving internal review procedures.
Nonetheless, more substantial change in this area was reported by secondary
heads. The majority of secondary heads reported “a lot” or “very significant”
change (N=251, 71%) in improving internal review procedures, with almost a
third who felt that the amount of change in practice in their schools was “very
significant” (N=105, 30%) over the past three years (Table 2.14). In the primary
sample heads from high disadvantage schools were more likely to report a lot of
change in leadership practice relating to this area54 (Table 2.15). However, this
was not the case for secondary schools. It seems that strengthening internal
review procedures has been an important feature of activity over the last 3 years
for the majority of heads, but especially those in the secondary sector, and for
heads of high disadvantage primary schools.
Table 2.14: Headteacher responses to “To what extent do you believe your
actions have changed in relation to improving internal review procedures?” by
sector
Sector Not at
all Very little
Little Partially A lot Very
significantly Total
Primary 9
(2.4%) 18
(4.8%) 20
(5.3%) 126
(33.4%) 161
(42.7%) 43
(11.4%) 377
(100.0%)
Secondary 11
(3.1%) 13
(3.7%) 20
(5.6%) 59
(16.7%) 146
(41.2%) 105
(29.7%) 354
(100.0%)
Total 20
(2.7%) 31
(4.2%) 40
(5.5%) 185
(25.3%) 307
(42.0%) 148
(20.2%) 731
(100.0%)
54 χ²=10.86, df=3, p<0.05

46
Table 2.15: Primary headteacher responses to “To what extent do you believe
your actions have changed in relation to improving internal review procedures?”
by school FSM band
School FSM Band
Not at all / Very little
Little Partially A lot / Very significantly
Total
FSM 1 and 2
17 (7.3%)
7 (3.0%)
91 (38.9%)
119 (50.9%)
234 (100.0%)
FSM 3 and 4
10 (7.1%)
11 (7.8%)
35 (24.8%)
85 (60.3%)
141 (100.0%)
Total 27
(7.2%) 18
(4.8%) 126
(33.6%) 204
(54.4%) 375
(100.0%)
Almost eight out of ten key staff agreed moderately/strongly that the
headteacher had improved the internal review procedures of their school over the
last three years. A greater degree of agreement was reported by primary
(N=506, 84%) than secondary key staff (N=881, 76%) and this difference was
statistically significant55 (Table 2.16). The degree of agreement to this statement
was not found to be related to years of experience of key staff or the level of
school disadvantage.
Table 2.16: Key staff responses to “To what extent do you agree that the
headteacher in your school improves internal review procedures?”
Sector Disagree strongly
Disagree moderately
Disagree slightly
Agree slightly
Agree moderately
Agree strongly
Total
Primary 1
(0.2%) 2
(0.3%) 21
(3.5%) 70
(11.7%) 233
(38.8%) 273
(45.5%) 600
(100.0%)
Secondary 11
(1.0%) 18
(1.6%) 39
(3.4%) 204
(17.7%) 421
(36.5%) 460
(39.9%) 1153
(100.0%)
Total 12
(0.7%) 20
(1.1%) 60
(3.4%) 274
(15.6%) 754
(43.0%) 733
(41.8%) 1753
(100.0%)
2.5.2 Redesigning the organisation: differences by sector and heads’
years of experience in school
A greater degree of change in practice was reported by secondary (N=202, 58%)
than primary heads (N=175, 47%) in terms of restructuring the organisation to
facilitate work. For secondary heads, weak but statistically significantly negative
associations were found between heads’ years of experience in their current
55 χ²=21.1, df=3, p<0.001

47
schools and the extent of reported change in relation to redesigning the
organisation. Those with more experience tended to report less change in practice
in their schools over the last three years. In particular:
• Eighty percent of secondary heads with less than three years’ experience
reported a substantial amount of change in practice relating to improving
internal review procedures in their schools (N=75), whereas 60% (N=18) of
those with more than 16 years’ experience did so (Gamma=-0.23, p<0.05)
• Sixty-eight percent of less experienced heads (0-3 years) reported a lot of
change in practice in relation to structuring the organisation to facilitate work;
by contrast, less than half (N=13, 43%) of their more experienced peers (16+
years) reported such extent of change (Gamma=-0.19, p<0.05).
• Years of experience were not related to primary heads responses on these
items.
2.6 Key Findings
i) The setting of high expectations for staff and students was a central
strategy in developing the teaching and learning programmes
• One-third (33%) of all primary and secondary headteachers surveyed
reported a fair degree of change in practice in relation to discussing
educational issues with staff. Of the key staff surveyed, 82% primary
sample and 73% of the secondary sample agreed moderately or strongly
that their headteacher frequently discussed educational issues with them.
• Around one-third of the headteachers surveyed (33% primary and 32%
secondary) reported a lot of change in relation to demonstrating high
expectations for staff. In responding to a similar question, 92% of all key
staff surveyed (75% primary and 70% secondary) reported that their
headteacher demonstrated high expectations for staff work with pupils.
ii) The establishment of high achievement focussed school cultures in
which care and trust are predominant features received considerable
emphasis in the sample schools.
• Around 40% of all headteachers surveyed reported a lot or very significant
changes in relation to developing a culture of trust and caring.
• Of the key staff surveyed, overall 57% agreed strongly that their
headteachers developed a culture of care and trust in the school. However,
there were sector differences with strong agreement from 71% of primary

48
key staff, and 51% secondary key staff, suggesting that primary heads
may be more successful than their secondary counterparts in establishing
this culture of care and trust perhaps due to smaller organisational size.
iii) The headteacher in highly improved and effective schools seek to
model the professional practice for staff.
• Twenty six percent of primary headteachers and 31% of secondary
headteachers reported a change in their practice in relation to modelling a
high level of professional practice for staff. Secondary headteachers in FSM
3 and 4 schools were most likely to report a substantial amount of change
in relation to this area of practice. Key staff results corroborate
headteacher reports. Eighty-six percent of all key staff surveyed
moderately-strongly agreed that their headteacher modelled a high level
of professional practice.

49
Chapter 3: Changing Curriculum, Pedagogy And
Assessment
In this chapter we examine the extent of reported changes over the last three
years related to curriculum, pedagogy and assessment.
3.1 Curriculum And Pedagogy
The survey results provide strong evidence that headteachers and key staff of
effective schools placed a great emphasis on improving curriculum, pedagogy and
assessment, with a particular focus on the use of performance data.
3.2 Setting Goals
3.2.1 Differences by sector
A similar proportion of primary (N=158, 42%) and secondary (N=149, 41%)
heads who responded to the survey reported “a lot” of change in practice in
relation to providing assistance to staff in setting short-term goals for teaching
and learning, although the category “very significant” change was somewhat
more likely to be reported by primary heads (N=50, 13%) than their secondary
peers (N=25, 7%). This was confirmed by survey data from key staff
respondents.
When asked whether the headteacher provided assistance to staff in setting
short-term goals for teaching and learning, three quarters of key staff agreed
moderately/strongly (N=1,315, 75%) and roughly one in five agreed slightly
(N=306, 17%) (Table 3.1). There was a considerable sector difference: with 50%
primary key stage managers agreeing strongly to it (N=301) but only 31% of
their secondary peers (N=358). This was a moderate and significant difference56
indicating that primary heads of effective and improving schools are particularly
likely to support goal setting as a strategy to improve teaching and learning. This
may reflect the smaller size of primaries and differences in the level of day to day
contact with headteachers as well as the important role of departments in relation
to subject teaching and social setting in secondary schools.
56 χ²=88.26, df=5, p<0.001; Gamma=-0.37, p<0.001

50
Table 3.1: Key staff responses to “To what extent do you agree that the
headteacher in your school provides assistance to staff in setting short-term
goals for teaching and learning?”
Sector Disagree strongly
Disagree moderately
Disagree slightly
Agree slightly
Agree moderately
Agree strongly
Total
Primary 1
(0.2%) 8
(1.3%) 12
(2.0%) 63
(10.4%) 221
(36.3%) 301
(49.5%) 606
(100.0%)
Secondary 18
(1.6%) 41
(3.5%) 62
(5.4%) 243
(21.0%) 435
(37.6%) 358
(30.9%) 1157
(100.0%)
Total 19
(1.1%) 49
(2.8%) 74
(4.2%) 306
(17.4%) 656
(37.2%) 659
(37.4%) 1763
(100.0%)
In the secondary sample, heads from high disadvantage schools were more likely
to report change in practice in relation to assisting staff to set short-term
teaching goals, giving them individual support to improve their teaching and
encouraging them to think of learning beyond the academic curriculum (p<0.01).
A greater proportion of key staff from highly disadvantaged primary schools
(N=238, 41%) showed strong agreement to the item on goal setting than their
counterparts in low disadvantage schools (N=414, 35%, p<0.05). This was also
true for the secondary school sample. Key staff from schools in FSM band 4
(N=54, 38%) were also the most likely to agree strongly and those from school
FSM band 1 (N=108, 27%) were the least likely to agree strongly to this item
(p<0.05). This was, however, not the case for the primary heads and key staff.
These results reveal that headteachers and key staff in highly effective/improved
high disadvantage secondary schools are more likely to have given particular
emphasis to providing specific, focussed support to improve the quality of
teaching than their counterparts in low disadvantage secondary schools.
3.2.2 Differences by years of experience in school
As shown in Table 3.2, heads’ experience is significantly associated with the
degree of reported change in relation to setting short-term goals for both the
primary57 and the secondary samples58. Sixty-two percent of less experienced
secondary heads (0-3 years) (N=59) reported a lot of change in this area in
contrast to only 32% of most experienced heads (16+ years) (N=10) who did so.
For example, in the primary sample, 66% (N=46) of less experienced heads and
45% (N=22) of most experienced heads reported such change over the last three
years. Less experienced primary heads were more likely to report change in
57 χ²=18.57, df=3, p<0.05; Gamma=-0.24, p<0.01 58 χ²=23.29, df=3, p<0.01; Gamma=-0.31, p<0.001

51
terms of giving staff individual support59 and encouraging them to consider new
ideas for teaching60 (Table 3.3), but this pattern was not the case for secondary
schools. This confirms other findings in this report that more recently appointed
heads are more likely to focus upon improvements in teaching and learning than
more experienced heads, and that primary heads may exercise more direct
influence on this instance than their secondary colleagues.
Table 3.2: Headteacher responses to “To what extent do you believe your
leadership practice and actions have changed in relation to providing assistance
to staff in setting short-term goals for teaching and learning?” by experience
Sector Experience Not at
all Very little
Little Partially A lot Very
significantly Total
0-3 years 0
(0.0%) 2
(4.3%) 2
(4.3%) 12
(26.1%) 23
(50.0%) 7
(15.2%) 46
(100.0%)
4-7 years 0
(0.0%) 6
(8.0%) 3
(3.9%) 17
(22.7%) 33
(44.0%) 16
(21.3%) 75
(100.0%)
8-15 years 5
(3.9%) 8
(6.3%) 9
(7.0%) 39
(30.5%) 48
(37.5%) 19
(14.8%) 128
(100.0%)
Primary
16+ years 6
(7.7%) 4
(5.1%) 9
(11.5%) 20
(25.6%) 35
(44.9%) 4
(5.1%) 78
(100.0%)
0-3 years 1
(1.3%) 3
(3.8%) 4
(5.0%) 20
(25.0%) 44
(55.0%) 8
(10.0%) 80
(100.0%)
4-7 years 5
(5.2%) 7
(7.2%) 8
(8.2%) 29
(29.9%) 41
(41.8%) 7
(7.2%) 97
(100.0%)
8-15 years 4
(3.4%) 14
(12.0%) 18
(15.4%) 33
(28.2%) 42
(35.9%) 6
(5.1%) 117
(100.0%)
Secondary
16+ years 1
(3.3%) 4
(13.3%) 4
(13.3%) 11
(36.7%) 9
(30.0%) 1
(3.3%) 30
(100.0%)
59 χ²=18.11, df=3, p<0.05; Gamma=-0.21, p<0.01 60 Gamma=-0.20, p<0.05

52
Table 3.3: Primary headteacher responses concerning changes in giving staff
individual support and encouraging them to consider new ideas for teaching by
experience
Question Experience Not at
all Very little
Little Partially A lot Very
significantly Total
0-3 years 0
(0.0%) 3
(6.7%) 2
(4.4%) 18
(40.0%) 17
(37.8%) 5
(11.1%) 45
(100.0%)
4-7 years 2
(2.6%) 6
(7.9%) 6
(7.9%) 27
(35.5%) 24
(31.6%) 11
(14.5%) 76
(100.0%)
8-15 years 8
(6.3%) 9
(7.0%) 19
(14.8%) 41
(32.0%) 46
(35.9%) 5
(3.9%) 128
(100.0%)
Giving staff individual support to help them improve their teaching
16+ years 8
(10.3%) 8
(10.3%) 12
(15.4%) 31
(39.7%) 16
(20.5%) 3
(3.8%) 78
(100.0%)
0-3 years 0
(0.0%) 3
(6.5%) 2
(4.3%) 9
(19.6%) 25
(54.3%) 7
(15.2%) 46
(100.0%)
4-7 years 2
(2.6%) 2
(2.6%) 7
(9.2%) 21
(27.6%) 29
(38.2%) 15
(19.7%) 76
(100.0%)
8-15 years 5
(3.9%) 9
(7.0%) 9
(7.0%) 28
(21.9%) 64
(50.0%) 13
(10.2%) 128
(100.0%)
Encouraging them to consider new ideas for their teaching
16+ years 4
(5.1%) 4
(5.1%) 8
(10.3%) 26
(33.3%) 33
(42.3%) 3
(3.8%) 78
(100.0%)
3.3 Encouraging New Ideas
Most primary and secondary heads reported a substantial amount of change (“a
lot” or “very significantly”) in relation to encouraging teachers to consider new
ideas for their teaching (Primary: N=213, 57%; Secondary: N=196, 55%). In
both sectors a minority also reported substantial change in practice relating to
giving staff individual support to help them improve their teaching practices
(Primary: N=148, 39%; Secondary: N=152, 42%) (see Appendices XVI and
XVII). A moderate amount of change (“partially”) was also reported by roughly a
third of primary and secondary heads (Primary: N=129, 34%; Secondary:
N=110, 31%).
A moderate degree of agreement was noted when key staff were asked whether
their headteacher encouraged them to consider new ideas for their teaching.
Under half agreed strongly to this item and roughly one-third agreed moderately;
with about 15% agreeing only slightly. Figure 3.1 shows a clear sector difference.
In all, 60% primary key staff (N=361) agreed strongly, compared with 43% of
their secondary peers (N=496)61.
61 χ²=71.53, df=5, p<0.001; Gamma=-0.34, p<0.001

53
Figure 3.1: Differences between primary and secondary key staff perceptions of
the extent of their headteacher’s encouragement to consider new ideas for their
teaching
0%
10%
20%
30%
40%
50%
60%
70%
Primary 2% 8% 30% 60%
Secondary 7% 18% 32% 43%
Disagree strongly/moderat
ely/slightlyAgree slightly
Agree moderately Agree strongly
3.4 Beyond The Academic Curriculum
3.4.1 Differences by sector
A substantial amount of change was reported by many primary heads (N=210,
56%) in relation to encouraging staff to think of learning beyond the academic
curriculum, whereas the figure was somewhat lower at 38% of secondary heads
(N=138) (Table 3.4). Almost a third of secondary heads (N=116, 32%) reported
partial change in practice in their schools for this item.
Table 3.4: Headteacher responses to the question “To what extent do you believe
your actions have changed in relation to encouraging staff to think of learning
beyond the academic curriculum in the past three years?” by sector
Sector Not at
all Very little
Little Partially A lot Very
significantly Total
Primary 24
(6.4%) 19
(5.1%) 32
(8.5%) 91
(24.2%) 158
(42.0%) 52
(13.8%) 376
(100.0%)
Secondary 22
(6.1%) 32
(8.9%) 52
(14.4%) 116
(32.2%) 104
(28.9%) 34
(9.4%) 360
(100.0%)
Total 46
(6.3%) 51
(6.9%) 84
(11.4%) 207
(28.1%) 262
(35.6%) 86
(11.7%) 736
(100.0%)

54
0%
10%
20%
30%
40%
50%
60%
70%
Primary 1% 6% 23% 70%
Secondary 7% 16% 33% 44%
Disagree strongly/moderat
ely/slightlyAgree slightly
Agree moderately Agree strongly
Over half of key staff agreed strongly that their headteacher encouraged them to
think of learning beyond the academic curriculum (N=933, 53%). Significant
associations were found between sector and leaders’ responses. Primary key
stage managers (N=423, 70%) were more likely than secondary heads of
departments (N=510, 44%) to agree strongly that their head encouraged this62 (
Figure 3.2).Taken together, these findings suggest that a focus upon raising the
quality of classroom teaching and learning was perceived by heads to be a key
part of their strategic role. However, there were differences between heads
according to level of school disadvantage and their years of experience in the
school.
Figure 3.2: Differences between primary and secondary staff perceptions
of headteacher encouragement to think of learning beyond the academic
curriculum
3.5 Redesigning Resources For Teaching
In both sectors over a quarter of heads reported “very significant” change in
terms of utilising support staff skills for the benefit of pupil learning (Primary:
N=102, 27%; Secondary: N=90, 26%). In addition, the majority of primary
(N=225, 60%) and secondary heads (N=225, 64%) reported a moderate or a
substantial amount of change in this area over the last three years (Table 3.5).
Similarly, most primary (N=237, 63%) and secondary heads (N=220, 63%)
reported some or a lot of change in practice relating to allocating resources
strategically based on pupil needs. Around one in ten of both primary (N=39,
62 χ²=127.52, df=5, p<0.001; Gamma=-0.49, p<0.001

55
10%) and secondary heads (N=36, 10%), around one in ten reported “very
significant” change in this area during the last three years. Likewise, a fair degree
of change was reported in relation to providing or locating resources to help staff
improve their teaching by 64% of primary heads (N=240) and 66% of secondary
heads (N=233).
Table 3.5: Headteacher responses to “To what extent do you believe your actions
have changed in relation to utilising support staff skills for the benefit of pupil
learning?” by sector
Sector Not at
all Very little
Little Partially A lot Very
significantly Total
Primary 8
(2.1%) 18
(4.8%) 23
(6.1%) 68
(18.1%) 157
(41.8%) 102
(27.1%) 376
(100.0%)
Secondary 8
(2.3%) 11
(3.1%) 19
(5.4%) 58
(16.4%) 167
(47.3%) 90
(25.5%) 353
(100.0%)
Total 16
(2.2%) 29
(4.0%) 42
(5.8%) 126
(17.3%) 324
(44.4%) 192
(26.3%) 729
(100.0%)
Around half of key staff agreed strongly that their headteacher allocated
resources strategically based on pupils needs (N=839, 48%) and one-third
agreed moderately (N=585, 33%). In total 14% agreed only slightly (N=240)
with this statement. Primary key stage managers (N=381, 63%) were more
likely to agree strongly than their counterparts from secondary schools (N=458,
40%)63 (Table 3.6). Those from low disadvantage schools were somewhat less
likely to agree with this statement64 (
Table 3.7) suggesting that the strategic use of resources was seen as a stronger
feature in more disadvantaged contexts.
Table 3.6: Key staff responses to “To what extent do you agree that the
headteacher in your school allocates resources strategically based on pupil
needs?” by sector
Sector Disagree strongly
Disagree moderately
Disagree slightly
Agree slightly
Agree moderately
Agree strongly
Total
Primary 1
(0.2%) 1
(0.2%) 4
(0.7%) 44
(7.3%) 173
(28.6%) 381
(63.1%) 604
(100.0%)
Secondary 13
(1.1%) 24
(2.1%) 41
(3.6%) 196
(17.1%) 412
(36.0%) 458
(40.0%) 1144
(100.0%)
Total 14
(0.8%) 25
(1.4%) 45
(2.6%) 240
(13.7%) 585
(33.5%) 839
(48.0) 1748
(100.0%)
63 χ²=106.16, df=5, p<0.001; Gamma=-0.43, p<0.001 64 χ²=21.96, df=5, p<0.01

56
Table 3.7: Key staff responses to “To what extent do you agree that the
headteacher in your school allocates resources strategically based on pupil
needs?” by school FSM band
School FSM Band
Disagree strongly
Disagree moderately
Disagree slightly
Agree slightly
Agree moderately
Agree strongly
Total
FSM 1 and 2
13 (1.1%)
15 (1.3%)
31 (2.7%)
175 (15.1%)
411 (35.5%)
514 (44.3%)
1159 (100.0%)
FSM 3 and 4
1 (0.2%)
9 (1.6%)
13 (2.3%)
64 (11.1%)
172 (29.9%)
317 (55.0%)
576 (100.0%)
Total 14
(0.8%) 24
(1.4%) 44
(2.5%) 239
(13.8%) 583
(33.6%) 831
(47.9%) 1735
(100.0%)
3.5.1 Differences by school sector, socio-economic context and
headteacher years of experience in school
Secondary heads in high disadvantage schools were more likely to report change
in all the three areas related to redesigning resources for teaching (Table 3.8).
However, no statistically significant associations were found for the primary
sample by school context. Results suggest that more emphasis on specific
targeted actions in relation to improving teaching had been given in the
secondary sector and that this was particularly the case in schools in more
disadvantaged contexts. In both sectors less experienced heads were more likely
to report change in relation to allocating resources strategically based on pupil
needs over the last three years. Figures 3.3 and 3.4 show that the difference was
slightly stronger for secondary heads65 than primary heads66.
65 Gamma=-0.24, p<0.01 66 Gamma=-0.19, p<0.05

57
0%
10%
20%
30%
40%
50%
60%
70%
80%
90%
100%
0-3 years 4-7 years 8-15 years 16+years
A lot/ Verysignif icantly
Partially
Little
Not at all/Very little
(N=71) (N=49)(N=74)(N=64)
Table 3.8: Secondary headteacher responses relating to questions about change
in redesigning resources for teaching over the past three years by school FSM
band
Question School
FSM Band
Not at all
Very little
Little Partially A lot Very
significantly Total
FSM 1 and 2
6 (0.8%)
16 (2.0%)
26 (3.3%)
132 (16.6%)
299 (37.7%)
315 (39.7%)
794 (100.0%)
Utilising support staff skills for the benefit of pupil learning
FSM 3 and 4
2 (0.6%)
3 (0.9%)
15 (4.3%)
43 (12.4%)
106 (30.5%)
178 (51.3%)
347 (100.0%)
FSM 1 and 2
13 (1.7%)
15 (1.9%)
29 (3.7%)
144 (18.3%)
296 (37.6%)
290 (36.8%)
787 (100.0%)
Allocating resources strategically based on pupil needs
FSM 3 and 4
0 (0.0%)
8 (2.3%)
11 (3.2%)
51 (14.7%)
114 (32.9%)
162 (46.8%)
346 (100.0%)
FSM 1 and 2
6 (0.8%)
15 (1.9%)
40 (5.0%)
149 (18.6%)
292 (36.5%)
297 (37.2%)
799 (100.0%)
Providing or locating resources to help staff improve their teaching
FSM 3 and 4
5 (1.4%)
5 (1.4%)
10 (2.9%)
52 (15.1%)
109 (31.6%)
164 (47.5%)
345 (100.0%)
Figure 3.3: Primary heads’ years of experience in school and the extent of
reported change in allocating resources strategically based on pupil needs

58
0%
10%
20%
30%
40%
50%
60%
70%
80%
90%
100%
0-3 years 4-7 years 8-15 years 16+years
A lot/ Verysignif icantly
Partially
Little
Not at all/Very little
(N=93) (N=30)(N=68)(N=74)
Figure 3.4: Secondary heads’ years of experience in school and the extent of
reported change in allocating resources strategically based on pupil needs
3.6 Coaching, Mentoring And Classroom Observation
In both sectors some or a lot of change (increase) during the three year period
was noted by the majority of heads for the three items related to: regularly
observing classroom activities; working with teachers to improve their teaching
after classroom observation; and using coaching and mentoring to improve the
quality of teaching (Table 6.9).
3.6.1 Differences by sector
For secondary heads, relatively more change was reported in relation to regularly
observing classroom activities and using coaching and mentoring to support
teachers in developing their practice. Sixteen per cent (N=58) and 10% (N=36)
of secondary heads reported “very significant” change in relation to these two
items respectively, compared to 10% (N=39) and 6% (N=23) of primary heads.
In addition, 40% of secondary heads (N=142), in contrast to 28% of primary
heads (N=106), reported that “a lot” of change in practice had occurred in regular
classroom observation (Table 3.9). In total over half (58%) of secondary and
more than a third (38%) of primary heads reported substantial change in relation
to the use of lesson observation. When school key staff were asked whether the
headteacher in their school regularly observed classroom activities, worked with
teachers to improve teaching after the observation and used coaching and
mentoring to improve quality of teaching, most staff from both sectors agreed a

59
lot or very significantly that this was the case (Table 3.10). As evident in previous
items, the sector difference was significant here also. Primary key stage
managers were more likely to agree to this than their secondary peers: in all 73%
of primary compared with 60% of secondary key staff agreed.
Table 3.9: Headteacher responses to items relating to the degree of change in
observation and mentoring over the past three years by sector
Question Sector Not at
all Very little
Little Partially A lot Very
significantly Total
Primary 21
(5.6%) 34
(9.0%) 62
(16.5%) 114
(30.3%) 106
(28.2%) 39
(10.4%) 376
(100.0%) Regularly observing classroom activities
Secondary 21
(5.9%) 24
(6.8%) 40
(11.3%) 70
(19.7%) 142
(40.0%) 58
(16.3%) 355
(100.0%)
Primary 23
(6.1%) 32
(8.5%) 68
(18.0%) 129
(34.2%) 99
(26.3%) 26
(6.9%) 377
(100.0%) After observing classroom activities, working with teachers to improve their teaching Secondary
20 (5.6%)
22 (6.2%)
50 (14.1%)
117 (33.1%)
114 (32.2%)
31 (8.8%)
354 (100.0%)
Primary 25
(6.7%) 30
(8.0%) 52
(13.9%) 131
(34.9%) 114
(30.4%) 23
(6.1%) 375
(100.0%) Using coaching and mentoring to improve quality of teaching Secondary
14 (4.0%)
23 (6.5%)
38 (10.7%)
116 (32.8%)
127 (35.9%)
36 (10.2%)
354 (100.0%)
Table 3.10: Key staff responses to items relating to the perceived use of
observation and mentoring by sector
Question Sector Not at
all Very little
Little Partially A lot Very
significantly Total
Primary 4
(0.7%) 9
(1.5%) 25
(4.1%) 83
(13.7%) 185
(30.6%) 298
(49.3%) 604
(100.0%) Regularly observing classroom activities
Secondary 54
(4.7%) 60
(5.2%) 121
(10.5%) 214
(18.5%) 329
(28.5%) 376
(32.6%) 1154
(100.0%)
Primary 8
(1.3%) 10
(1.7%) 28
(4.6%) 103
(17.1%) 196
(32.5%) 259
(42.9%) 604
(100.0%) After observing classroom activities, working with teachers to improve their teaching Secondary
70 (6.1%)
83 (7.2%)
151 (13.2%)
268 (23.3%)
330 (28.7%)
246 (21.4%)
1148 (100.0%)
Primary 7
(1.2%) 12
(2.0%) 42
(7.0%) 103
(17.1%) 195
(32.3%) 244
(40.5%) 603
(100.0%) Using coaching and mentoring to improve quality of teaching Secondary
37 (3.2%)
51 (4.4%)
108 (9.4%)
259 (22.5%)
381 (33.1%)
316 (27.4%)
1152 (100.0%)

60
3.6.2 Differences by school socio-economic context and headteacher
years of experience in school
In the primary sample, heads from high disadvantage schools were more likely to
report a lot of change in relation to coaching and mentoring67. Also, less
experienced primary heads were more likely to report change in the extent to
which there was regular observation of classrooms activities68 and working with
teachers after class observation69 (Table 3.11). However, there were no
significant differences for the secondary sample related to headteacher
experience or school context for these items. More key staff from high
disadvantage schools (N=207, 36%) agreed that the use of mentoring and
coaching to improve the quality of teaching was a strong feature than those from
low disadvantage schools (N=348, 30%)70 (Table 3.12). Once more results
indicated a greater emphasis in high disadvantaged schools on the use of specific
support strategies to improve teaching.
Table 3.11: Primary headteacher responses to items relating to the degree of
change in observation and mentoring over the past three years by school FSM
band
Question School
FSM Band
Not at all / Very little
Little Partially A lot / Very significantly
Total
FSM 1 and 2
31 (13.4%)
43 (18.5%)
74 (31.9%)
84 (36.2%)
232 (100.0%) Regularly observing
classroom activities FSM 3 and 4
23 (16.2%)
18 (12.7%)
40 (28.2%)
61 (43.0%)
142 (100.0%)
FSM 1 and 2
30 (12.9%)
48 (20.6%)
86 (36.9%)
69 (29.6%)
233 (100.0%)
After observing classroom activities, working with teachers to improve their teaching
FSM 3 and 4
24 (16.9%)
19 (13.4%)
43 (30.3%)
56 (39.4%)
142 (100.0%)
FSM 1 and 2
30 (13.0%)
37 (16.0%)
90 (39.0%)
74 (32.0%)
231 (100.0%) Using coaching and
mentoring to improve quality of teaching FSM 3
and 4 24
(16.9%) 15
(10.6%) 41
(28.9%) 62
(43.7%) 142
(100.0%)
67 p<0.05 68 p<0.01 69 p<0.05 70 χ²=14.23, df=5, p<0.05

61
Table 3.12: Key staff responses to “To what extent do you agree that the
headteacher in your school uses coaching and mentoring to improve quality of
teaching?” by school FSM band
SES Disagree strongly
Disagree moderately
Disagree slightly
Agree slightly
Agree moderately
Agree strongly
Total
FSM 1 and 2
30 (2.6%)
38 (3.3%)
112 (9.6%)
260 (22.2%)
381 (32.6%)
348 (29.8%)
1169 (100.0%)
FSM 3 and 4
14 (2.4%)
24 (4.2%)
37 (6.5%)
101 (17.6%)
190 (33.2%)
207 (36.1%)
573 (100.0%)
Total 44
(2.5%) 62
(3.6%) 149
(8.6%) 361
(20.7%) 571
(32.8%) 555
(31.9%) 1742
(100.0%)
3.7 Assessment: Increasing The Use Of Pupil Attainment
Data
For both sectors, heads’ responses to the three items that related to encouraging
staff to use data in their work, to identify pupil needs and for decisions about
improvement showed much change in repeated practice during the last three
years (Table 3.13). The majority of heads (over 64%) reported “a lot” or “very
significant” change in these three areas in their schools. Roughly a quarter of
primary (N=93, 25%) and secondary heads (N=84, 24%) reported “very
significant” change in the use of pupil achievement data to make most decisions
about school improvement.
Close to two-thirds of key staff agreed strongly that the headteacher encouraged
them to use data in their work to plan for individual pupil needs and to make
most decisions about school improvement. However, only about 43% strongly
agreed that their headteacher incorporated research evidence into his/her
decision making to inform practice (Table 3.14).

62
Table 3.13: Headteacher responses indicating a degree of change relating to use
of data over the past three years
Question Sector Not at
all Very little
Little Partially A lot Very
significantly Total
Primary 8
(2.1%) 12
(3.2%) 19
(5.0%) 66
(17.5%) 193
(51.2%) 79
(21.0%) 377
(100.0%) Encouraging staff to use data in their work Secondary
18 (5.1%)
6 (1.7%)
15 (4.2%)
46 (13.0%)
147 (41.6%)
121 (34.3%)
353 (100.0%)
Primary 8
(2.1%) 17
(4.5%) 20
(5.3%) 73
(19.4%) 187
(49.7%) 71
(18.9%) 376
(100.0%)
Encouraging staff to use data in planning for individual pupil needs
Secondary 17
(4.8%) 7
(2.0%) 14
(4.0%) 64
(18.1%) 147
(41.6%) 104
(29.5) 353
(100.0%)
Primary 13
(3.5%) 23
(6.1%) 20
(5.3%) 67
(17.9%) 159
(42.4%) 93
(24.8%) 375
(100.0%)
Using pupil achievement data to make most decisions about school improvement
Secondary 19
(5.4%) 17
(4.8%) 24
(6.8%) 69
(19.5%) 141
(39.8%) 84
(23.7%) 354
(100.0%)
Table 3.14: Key staff responses indicating the degree of emphasis relating to the
use of data by the headteacher
Question Disagree strongly
Disagree moderately
Disagree slightly
Agree slightly
Agree moderately
Agree strongly
Total
Encourages staff to use data in their work
5 (0.3%)
5 (0.3%)
27 (1.5%)
126 (7.1%)
423 (24.0%)
1158 (65.6%)
1764 (100.0%)
Encourages staff to use data in planning for individual pupil needs
5 (0.3%)
5 (0.3%)
37 (2.1%)
166 (9.4%)
479 (27.3%)
1065 (60.6%)
1757 (100.0%)
Incorporates research evidence into his/her decision making to inform practice
10 (0.6%)
16 (0.9%)
57 (3.3%)
307 (17.6%)
608 (34.9%)
743 (42.7%)
1741 (100.0%)
Uses pupil achievement data to make most decisions about school improvement
2 (0.1%)
5 (0.3%)
21 (1.2%)
144 (8.2%)
451 (25.7%)
1134 (64.5%)
1757 (100.0%)
3.7.1 Differences by sector
For secondary heads relatively more substantial change was reported for the two
items relating to encouraging staff to use data in their work and to identify pupil
needs (Table 3.13). Approximately one in three reported “very significant” change
in practice in these two areas in contrast to only one in five of the primary heads

63
who did so. This suggests that a greater emphasis on using performance data is
seen, most recently, as a particular lever for improvement in the secondary
sector.
Most primary (N=237, 63%) and secondary heads (N=198, 56%) reported partial
or a lot of change in relation to incorporating research evidence into their decision
making to inform practice (Table 3.15). However, there were 15% of primary
heads (N=55) and 17% of secondary heads (N=60) who reported “not at all” or
“very little” change in this area in the last three years.
Table 3.15: Headteacher responses to “To what extent do you believe your
actions have changed in relation to incorporating research evidence into your
decision making to inform practice in the last three years?” by sector
Sector Not at
all Very little
Little Partially A lot Very
significantly Total
Primary 16
(4.2%) 39
(10.3%) 69
(18.3%) 154
(40.8%) 83
(22.0%) 16
(4.2%) 377
(100.0%)
Secondary 29
(8.2%) 31
(8.8%) 65
(18.4%) 123
(34.7%) 75
(21.2%) 31
(8.8%) 354
(100.0%)
Total 45
(6.2%) 70
(9.6%) 134
(18.3%) 277
(37.9%) 158
(21.6%) 47
(6.4%) 731
(100.0%)
3.7.2 Differences by school level of disadvantage
School FSM band was not associated with any differences in responses in the
primary sample. However, in the secondary sector, heads in high disadvantage
contexts were more likely to report a substantial amount of change in their
practice in relation to the four listed items below than secondary heads in low
disadvantage schools (Table 3.16):
• Encouraging staff to use data in their work71
• Encouraging to use data in planning for individual pupil needs72
• Incorporating research evidence into my decision making to inform practice73
• Using pupil achievement data to make most decisions about school
improvement74.
71 p<0.05 72 p<0.01 73 p<0.05 74 p<0.001

64
Table 3.16: Secondary headteacher responses indicating a degree of change
relating to use of data over the past three years by school FSM band
Question School
FSM Band
Not at all / Very little
Little Partially A lot / Very significantly
Total
FSM bands 1 and 2
19 (7.6%)
12 (4.8%)
37 (14.9%)
181 (72.7%)
249 (100.0%)
Encouraging staff to use data in their work FSM
bands 3 and 4
5 (5.0%)
3 (3.0%)
8 (8.0%)
84 (84.0%)
100 (100.0%)
FSM bands 1 and 2
18 (7.3%)
13 (5.3%)
51 (20.6%)
165 (66.8%)
247 (100.0%) Encouraging staff to
use data in planning for individual pupil needs FSM
bands 3 and 4
6 (5.9%)
1 (1.0%)
11 (10.8%)
84 (82.4%)
102 (100.0%)
FSM bands 1 and 2
49 (19.7%)
49 (19.7%)
82 (32.9%)
69 (27.7%)
249 (100.0%)
Incorporating research evidence into my decision making to inform practice
FSM bands 3 and 4
11 (10.9%)
14 (13.9%)
40 (39.6%)
36 (35.6%)
101 (100.0%)
FSM bands 1 and 2
29 (11.7%)
20 (8.1%)
55 (22.2%)
144 (58.1%)
248 (100.0%)
Using pupil achievement data to make most decisions about school improvement
FSM bands 3 and 4
7 (6.9%)
3 (2.9%)
13 (12.7%)
79 (77.5%)
102 (100.0%)
For example, 84% (N=84) of secondary heads in FSM 3 and 4 schools, compared
with 73% (N= 181) of those in FSM 1 and 2 schools, reported ‘a lot’ or ‘very
significant’ change in encouraging staff to use data in their work. Over 80%
(N=84, 83%) of secondary heads leading high disadvantaged schools indicated a
substantial amount of change in leadership practice in terms of encouraging all
staff to use data in planning for individual pupil needs. In contrast, 67% of those
leading low disadvantage schools reported that they did so. In addition, more
than three in four (N=79, 78%) of those in high disadvantage schools, in contrast
to slightly over half (N=144, 58%) in low disadvantage schools, indicated a
substantial amount of change in using pupil achievement data to make most
decisions about school improvement.
Again, therefore, the results suggest that in secondary schools a stronger focus
over the recent period was made on the use of assessment data and this was
particularly evident for those in more disadvantaged schools, suggesting that the
use of data had a particular role to play in their improvement efforts. This point is
supported by case study data reported elsewhere75 and in the written comments
on the survey forms.
75 Day, C., et al. 2008. The Impact of School Leadership on Pupil Outcomes. School Leadership & Management 28, no. 1.

65
Length of experience and level of school disadvantage factors were also
associated with the way secondary key staff perceived the level of monitoring and
target setting in their school. More experienced key staff and those from more
disadvantaged contexts (FSM bands 3 and 4) reported higher levels of agreement
that these characterised their work (Table 3.17). For example, 52% of key staff in
highly disadvantaged secondary schools indicated that they strongly agreed that
monitoring and target setting were features of teachers’ work with 31% agreeing
moderately. For key staff in low disadvantage schools, 38% showed strong and
36% moderate agreement to this statement.
Table 3.17: Secondary key staff responses indicating the extent of agreement
with the statement ‘the performance of subject areas is regularly monitored and
targets for improvement are regularly set’ by school FSM band
SES Disagree strongly
Disagree moderately
Disagree slightly
Agree slightly
Agree moderately
Agree strongly
Total
FSM 1 and 2
4 (0.5%)
12 (1.5%)
24 (3.0%)
170 (21.2%)
287 (35.7%)
306 (38.1%)
803 (100.0%)
FSM 3 and 4
0 (0.0%)
2 (0.6%)
10 (2.9%)
48 (13.9%)
106 (30.7%)
179 (51.9%)
345 (100.0%)
Total 4
(0.3%) 14
(1.2%) 34
(3.0%) 218
(19.0%) 393
(34.2%) 485
(42.2%) 1148
(100.0%)
In addition, key staff from high disadvantage schools were more likely to report
that their headteacher incorporated research evidence into decision making. No
significant differences in degree of agreement were found between primary or
secondary school key staff according to their years of experience (see Table 3.18
for secondary key staff) but secondary key staff from disadvantaged schools were
more likely to report encouragement from the headteacher to use data in
planning for individual pupil needs. Secondary key staff with longer service were
also likely to perceive more encouragement to use data in their work (Table
3.19). It may be that headteachers see the use of data as helpful to encourage
longer serving staff to review their teaching approaches and that those in
disadvantaged contexts also find it especially useful to challenge existing
practices. In addition, long serving staff may have additional responsibilities that
involve the use of data.

66
Table 3.18: Secondary key staff responses to the question “To what extent do
you agree that the headteacher in your school incorporates research evidence
into his/her decision making to inform practice?” by experience in teaching
Years as a
leader
Disagree strongly
Disagree moderately
Disagree slightly
Agree slightly
Agree moderately
Agree strongly
Total
0-3 years
2 (0.6%)
1 (0.3%)
12 (3.9%)
64 (20.8%)
108 (35.1%)
121 (39.3%)
308 (100.0%)
4-7 years
1 (0.4%)
2 (0.8%)
7 (2.9%)
54 (22.4%)
69 (28.6%)
108 (44.8%)
241 (100.0%)
8-15 years
1 (0.8%)
0 (0.0%)
0 (0.0%)
30 (23.6%)
44 (34.6%)
52 (40.9%)
127 (100.0%)
16+ years
0 (0.0%)
1 (1.2%)
4 (4.8%)
14 (16.7%)
29 (34.5%)
36 (42.9%)
84 (100.0%)
Total 4
(0.5%) 4
(0.5%) 23
(3.0%) 162
(21.3%) 250
(32.9%) 317
(41.7%) 760
(100.0%)
Table 3.19: Secondary key staff responses to the question “To what extent do
you agree that the headteacher in your school encourages staff to use data in
their work?” by experience in teaching
Years as a
leader
Disagree strongly
Disagree moderately
Disagree slightly
Agree slightly
Agree moderately
Agree strongly
Total
0-3 years
0 (0.0%)
1 (0.3%)
5 (1.6%)
35 (11.1%)
79 (25.1%)
195 (61.9%)
315 (100.0%)
4-7 years
0 (0.0%)
0 (0.0%)
5 (2.0%)
21 (8.6%)
59 (24.1%)
160 (65.3%)
245 (100.0%)
8-15 years
0 (0.0%)
0 (0.0%)
0 (0.0%)
8 (6.3%)
22 (17.2%)
98 (76.6%)
128 (100.0%)
16+ years
0 (0.0%)
2 (2.4%)
1 (1.2%)
3 (3.5%)
18 (21.2%)
61 (71.8%)
85 (100.0%)
Total 0
(0.0%) 3
(0.4%) 11
(1.4%) 67
(8.7%) 178
(23.0%) 514
(66.5%) 773
(100.0%)
When key staff were asked whether the headteacher utilised support staff skills
for the benefit of pupil learning, over half agreed strongly (N=915, 52%) and
roughly one-third agreed moderately (N=553, 31%). As seen in previous
questions, Primary staff (N=417, 69%) were more likely to agree strongly than
their secondary peers (N=498, 43%)76 (Table 3.20).
76 χ²=119.33, df=5, p<0.001; Gamma=-0.47, p<0.001

67
Table 3.20: Key staff responses to “To what extent do you agree that the
headteacher in your school utilises support staff skills for the benefit of pupil
learning”
Sector Disagree strongly
Disagree moderately
Disagree slightly
Agree slightly
Agree moderately
Agree strongly
Total
Primary 0
(0.0%) 0
(0.0%) 7
(1.2%) 36
(6.0%) 144
(23.8%) 417
(69.0%) 604
(100.0%)
Secondary 8
(0.7%) 20
(1.7%) 42
(3.6%) 175
(15.2%) 409
(35.5%) 498
(43.2%) 1152
(100.0%)
Total 8
(0.5%) 20
(1.1%) 49
(2.8%) 211
(12.0%) 553
(31.5%) 915
(52.1) 1756
(100.0%)
3.8 Key Findings
i) Headteachers and other leaders in effective and improving schools
had promoted change in the curriculum and in teaching approaches
and practice.
• 56% of primary heads and 38% of secondary heads surveyed reported
substantial change in their practice in relation to encouraging to think of
student learning beyond the traditional curriculum. The heads most likely
to report this change were secondary heads in high disadvantage schools
(FSM 3 and 4).
ii) A key leadership strategy in the effective schools was that of placing
a high priority and consistent emphasis upon improving classroom
teaching across the school.
• More than half of heads surveyed (57% primary and 55% secondary)
reported substantial change in relation to getting teachers to consider new
ideas for their teaching. Of the key staff who responded to the survey,
nearly all agreed (slightly-strongly) that their head encouraged them to
consider new ideas for their teaching (98% primary key staff and 93%
secondary key staff).
• Strategies aimed at getting staff to change and improve their teaching
practice were also noted as a focus for heads in the effective schools that
were surveyed. Areas of leadership practice that had changed significantly
in surveyed schools included a marked focus on the provision of relevant
professional development and the use of classroom observations to
identify personal targets for staff development.
o 39% of primary heads and 42% of secondary heads reported
substantial change in giving staff individual support so that they
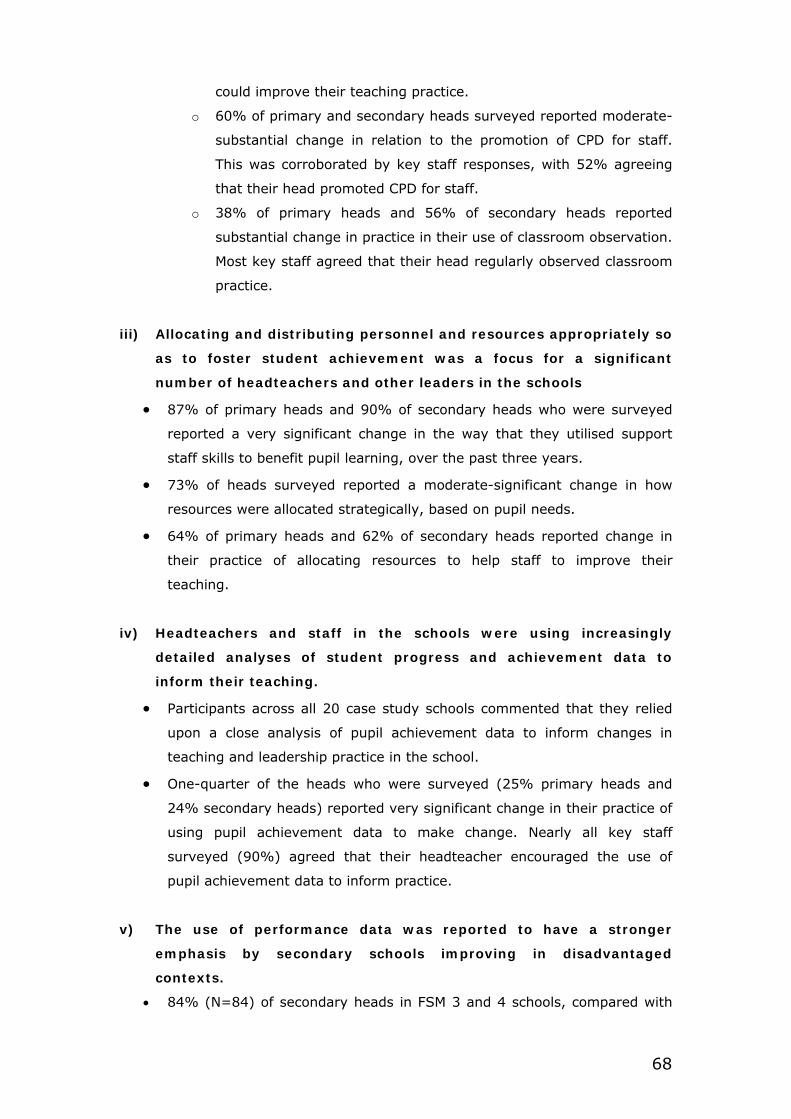
68
could improve their teaching practice.
o 60% of primary and secondary heads surveyed reported moderate-
substantial change in relation to the promotion of CPD for staff.
This was corroborated by key staff responses, with 52% agreeing
that their head promoted CPD for staff.
o 38% of primary heads and 56% of secondary heads reported
substantial change in practice in their use of classroom observation.
Most key staff agreed that their head regularly observed classroom
practice.
iii) Allocating and distributing personnel and resources appropriately so
as to foster student achievement was a focus for a significant
number of headteachers and other leaders in the schools
• 87% of primary heads and 90% of secondary heads who were surveyed
reported a very significant change in the way that they utilised support
staff skills to benefit pupil learning, over the past three years.
• 73% of heads surveyed reported a moderate-significant change in how
resources were allocated strategically, based on pupil needs.
• 64% of primary heads and 62% of secondary heads reported change in
their practice of allocating resources to help staff to improve their
teaching.
iv) Headteachers and staff in the schools were using increasingly
detailed analyses of student progress and achievement data to
inform their teaching.
• Participants across all 20 case study schools commented that they relied
upon a close analysis of pupil achievement data to inform changes in
teaching and leadership practice in the school.
• One-quarter of the heads who were surveyed (25% primary heads and
24% secondary heads) reported very significant change in their practice of
using pupil achievement data to make change. Nearly all key staff
surveyed (90%) agreed that their headteacher encouraged the use of
pupil achievement data to inform practice.
v) The use of performance data was reported to have a stronger
emphasis by secondary schools improving in disadvantaged
contexts.
• 84% (N=84) of secondary heads in FSM 3 and 4 schools, compared with

69
73% of those in FSM 1 and 2 schools, reported ‘a lot’ or ‘very significant’
change in encouraging staff to use data in their work.
• Over 80% (N=84, 83%) of secondary heads leading high disadvantaged
schools indicated a substantial amount of change in leadership practice in
terms of encouraging all staff to use data in planning for individual pupil
needs. In contrast, 67% of those leading low disadvantage schools
reported that they did so.
• In addition, more than three in four (N=79, 78%) of those in high
disadvantage schools, in contrast to slightly over half (N=144, 58%) in
low disadvantage schools, indicated a substantial amount of change in
using pupil achievement data to make most decisions about school
improvement.
The survey results indicate that heads and key staff had used a variety of
strategies to enhance the quality of teaching and learning and develop the
curriculum as part of their improvement strategies and had also paid a lot of
attention to the use of performance data.

70
Chapter 4: Leadership Characteristics And
Practices In Schools With Different Effectiveness
And Improvement Profiles
4.1 Introduction
This chapter focuses on the relationships between leadership characteristics and
practices in schools identified as having different effectiveness and improvement
profiles over a three year period (2003-2005). It compares the characteristics of
leadership practices of these improving and effective schools in terms of
responses to the survey of head teachers and key staff and discusses in detail
similarities and differences between the three improvement groups in leadership
strategies in establishing foundations, and building and sustaining improvement.
It also extends earlier discussion (chapter 1-3) of differences by sector and level
of disadvantage, where appropriate, to set the findings on differences between
school improvement groups in a broader context.
The three sub-groups of schools were identified based on analyses of national
assessment and examination data and value added indicators identifying trends
across three years as described in Chapter 2 of the main Interim Report. The
groups were: 1) improving from low to moderate or low to high in attainment and
highly effective in value added, 2) improving from moderate to higher moderate
or high in attainment and highly effective in value added and 3) stable high
attainment and highly effective in value added. Proportionately more schools
responding to the survey were in the low to moderate/high group i.e. those that
had made rapid recent improvement (Table 4.1). For the purpose of this chapter,
we label the Low to Moderate or Low to High Group as the Low Start Group, the
Moderate to Higher Moderate or High Group as the Moderate Start Group and the
Stable High and High to Higher Group as the High Start Group.

71
Table 4.1: Responses to the Headteacher Survey by School Improvement Groups
School Improvement Group
Primary Schools
Secondary Schools
2003-2005
N % N %
Low Start
160 42 167 47
Moderate Start
94 25 76 21
High Start
123 33 115 32
Total
37777 100 35878 100
4.2 Contexts Of Leadership And Improvement Group
We found significant associations between the improvement groupings and a
range of influences relating to headteachers’ years of experience in total and in
their current schools, the number of headteachers in the last ten years, school
education sector and school socio-economic contexts.
4.2.1 School SES contexts and improvement groups
We found statistically significant negative associations between the level of socio-
economic disadvantage of the pupil intake (measured by the FSM band of the
school) and the three improvement groups for both the primary79 and secondary
samples. In both education sectors the High Improvement Group were relatively
more likely to serve low disadvantage communities (FSM 1&2) whereas the Low
Improvement Group were more likely to serve high disadvantage communities
(FSM 3&4).
Table 4.2 shows that nearly two thirds (N= 105, 65.6%) of primary schools in the
Low Start Group, compared with under one in 10 (N= 10, 8%) of the High Start
Group were in high disadvantage contexts (FSM Bands 3 and 4). As Table 4.3
shows, over half (N=84, 50.3%) of secondary schools in the Low Start Group,
compared with around one in 20 (N=6, 5.2%) in the High Start Group, were in
high disadvantage contexts. Although 71% of schools responding to the survey
were in low disadvantage contexts (FSM 1 and 2) only around a half (49.7%)
77 One school changed DCSF number but did not supply their DCSF number, so could not be allocated to an improvement group. 78 Four schools changed DCSF numbers and could not be allocated to improvement groups. 79 Primary: Gamma=-0.78, p<0.001; χ²=101.49, p<0.001; and secondary: Gamma=-0.78, p<0.001; χ²=73.95, p<0.001.

72
were in the Low Start improvement group. These results point to the importance
of school context in interpreting differences in school performance results and
trajectories.
Table 4.2: School context (FSM Band) and primary school improvement group
School Context (FSM Band) Improvement Groups
FSM 1 and 2 FSM 3 and 4 Total
Low to Moderate/High 55
(34.4%) 105
(65.6%) 160
(100%)
Moderate to Higher Moderate/ High 67
(71.3%) 27
(28.7%) 94
(100%)
Stable High/ High to Higher 112
(91.8%) 10
(8.2%) 122
(100%)
Total 234
(62%) 142
(38%) 376
(100%)
Table 4.3: School context (FSM Band) and secondary school improvement group
School Context (FSM Band) Improvement Groups FSM 1 and 2 FSM 3 and 4 Total
Low to Moderate/High 83
(49.7%) 84
(50.3%) 167
(100%)
Moderate to Higher Moderate/ High 63
(82.9%) 13
(17.1%) 76
(100%)
Stable High/ High to Higher 109
(94.8%) 6
(5.2%) 115
(100%)
Total 255
(71%) 103
(29%) 358
(100%)
4.2.2 School SES contexts and heads’ experience
• Heads’ years of experience in total
For the secondary sample, heads with less experience tended to be more likely to
serve high disadvantage schools80, but this pattern was not identified for primary
heads. Only 20% of secondary heads leading low disadvantage schools (FSM 1
and 2) had been a headteacher for three years or less whereas proportionately
almost twice as many headteachers (37%) with similar amount of experience
were leading high disadvantage schools (FSM 3 and 4) (Table 4.4). In contrast,
nearly half (48%) of FSM 1 and 2 heads had more than eight years of experience
whereas the proportion was somewhat lower at 38% of FSM 3 and 4 heads with a
80 χ²=10.16, df=3, p<0.05; Gamma=-0.24, p<0.05.

73
similar longer length of experience as a headteacher.
Table 4.4: School disadvantage (FSM Band) and headteachers’ total years of
experience (secondary)
How long have you been a headteacher in total? School Context (FSM Band)
0-3 years 4-7 years 8-15 years 16+ years Total
FSM1 and 2 46
(20%) 73
(31.7%) 87
(37.8%)
24
(10.4%)
230
(100%)
FSM 3 and 4 34
(37%) 23
(25%) 28
(30.4%)
7
(7.6%)
92
(100%)
Total 80
(25%) 96
(30%) 115
(36%)
31
(10%)
322
(100%)
• Heads’ years of experience in school
Also only for the secondary sample, heads in high disadvantage schools were
proportionately more likely to have worked in their current schools for a shorter
period of time (0-3 years: FMS 1 and 2=31% versus FSM 3 and 4=45%) (Table
4.5). Those in low disadvantage schools were relatively more likely to have been
in their current schools for a longer period of time (16+ years: FSM 1 and 2=14%
versus FSM 3 and 4=7%).
Table 4.5: School disadvantage (FSM Band) and headteachers’ years of
experience in their current school (secondary)
How long have you been a headteacher in this school? School Context (FSM Band)
0-3 years 4-7 years 8-15 years 16+ years Total
FSM 1 and 2 57
(30.8%) 55
(29.7%) 48
(25.9%) 25
(13.5%) 185
(100.0%)
FSM 3 and 4 38
(45.2%) 19
(22.6%) 21
(25.0%) 6
(7.1%) 84
(100.0%)
Total 95
(35.3%) 74
(27.5%) 69
(25.7%) 31
(11.5%) 269
(100%)
4.2.3 Experience of headteachers and improvement groups
There were significant associations between the three school improvement groups
in terms of the total years of experience of the headteacher. For both the primary
and secondary samples, less experienced heads were proportionately more likely
to be in post in schools from the Low Start Group whereas schools in the High
Start Group were relatively more likely to have an experienced headteacher in

74
post81. As shown in Figures A and B in Appendix II, this tendency is particularly
striking for secondary schools.
In total 47% of heads of the Low Start Group of primary schools had seven or
fewer years of experience as a headteacher in contrast to 25% of those in the
High Start Group of schools. At the secondary level, 62% of heads of the Low
Start Group had the same amount of experience (7 or below) as a headteacher
compared with 49% of those in the High Start Group.
Table 4.6 below shows that secondary heads with less than seven years of
experience in their current schools were significantly more likely to be in post in
the Low Start Group of improving schools (72.2% versus 56.5% of the High Start
Group)82.
Table 4.6: Heads’ length of service in current school by school improvement
group (secondary heads)
How long have you been a headteacher in this school? Improvement Groups 0-3 years 4-7 years 8-15 years 16+ years Total
Low to Moderate/High 56
(42.1%) 40
(30.1%) 29
(21.8%) 8
(6.0%)
133
(100%)
Moderate to Higher Moderate/ High
13 (25.5%)
12 (23.5%)
18 (35.5%)
8 (15.7%)
51
(100%)
Stable High/ High to Higher
26 (30.6%)
22 (25.9%)
22 (25.9%)
15 (17.6%)
85
(100%)
Total 95
(35%) 74
(28%) 69
(26%) 31
(12%)
269
(100%)
4.2.4 Age of headteachers and improvement groups
A similar pattern was identified when the relationship between the school
improvement group and headteachers’ age group was investigated and this held
for both the primary and the secondary samples. Younger primary and secondary
heads were proportionately more likely to be in post in schools that had made
rapid improvement from low to moderate or moderate to high. Overall 51% of
primary and 53% of secondary heads aged 45 or under were in the Low Start
Group whereas only around a third (31% primary, 36% secondary) aged 56 or
over were in the same improvement group (see Tables A and B in Appendix III).
81 (Primary: χ²=17.59, df=6, p<0.01; Gamma=0.21, p<0.01; Secondary: χ²=14.01, df=6, p<0.05; Gamma=0.23, p<0.01). 82 (χ²=14.01, df=6, p<0.05; Gamma=0.23, p<0.01)

75
0%
10%
20%
30%
40%
50%
60%
70%
80%
90%
100%
0-1 heads 2 heads 3-10 heads
StableHigh/High-HigherMod-HigherMod/High
Low -Mod/High
(N=139) (N=108)(N=125)
For younger and less experienced heads, the challenges of improving a school
with a low attainment profile may be particularly motivating. It may also be
somewhat easier to obtain a headship of a low attaining school at a relatively
young age. It is possible that younger heads may be better placed to effect
radical change in schools with a history of low attainment, because their problems
are widely recognised. It is also possible that the longer years of experience and
a longer time in post of heads in the Stable High effective category may help to
account for their sustained good results over a number of years.
4.2.5 Stability of school leadership and improvement groups
In both sectors statistically significant associations were found between the three
school improvement groups in terms of number of headteachers in post over the
last decade. Schools in the High Start Group were less likely to have experienced
headteacher change and the association was stronger for the secondary sample83
than for the primary sample84 (Figure 4.1 and Figure 4.2).
Figure 4.1: Stability of heads’ service in school and three improvement groups
(Primary)
83 Gamma=-0.38, p<0.001 84 Gamma=-0.19, p<0.01

76
0%
10%
20%
30%
40%
50%
60%
70%
80%
90%
100%
0-1 heads 2 heads 3-10 heads
StableHigh/High-HigherMod-HigherMod/High
Low -Mod/High
(N=94) (N=90)(N=172)
Figure 4.2: Stability of heads’ service in school and three improvement groups
(Secondary)
A change of headteacher can be a catalyst for school improvement. This has been
noted in a number of studies of improving schools and is also evident in
inspection evidence (see Matthews & Sammons 2005). The survey results suggest
that changing the headteacher may have contributed to the rapid improvement of
schools with an initial low attainment profile. However, many changes in headship
over a decade can be a symptom of a school experiencing many difficulties and
this is likely to inhibit the creation of a school culture focussed on improvement.
The number of headteachers in post in the past ten years is also significantly
related to school context for the secondary sample85. High disadvantage schools
were relatively more likely to have experienced several changes of heads
compared with less disadvantage schools (Table 4.7). Again, this may be seen as
a symptom as much as a possible cause of difficulties.
For example, only a fifth (19.8%) of schools in low disadvantage contexts (FSM 1
and 2) had experienced 3 or more changes of head in the last ten years but this
was found for nearly double this proportion in high disadvantage schools (FSM 3
and 4) (38.8%). It seems that secondary schools in challenging (high
disadvantaged) contexts have greater difficulties in recruiting/retaining
headteachers who have the qualities necessary to effect significant improvement.
The need for attention to be given to ways of attracting high calibre applicants for
85 χ²=14.34, df=2, p<0.01; Gamma=0.62, p<0.01.

77
headships in such schools is suggested by this finding.
Table 4.7: School SES contexts (FSM Band) and changes of headteacher
(secondary)
Including yourself, how many headteachers has your current school had in the past 10 years?
School Context
(FSM Band) 0-1 heads 2 heads 3-10 heads Total
FSM 1 and 2 70
(27.7%) 133
(52.6%) 50
(19.8%)
253
(100%)
FSM 3 and 4 24
(23.3%) 39
(37.9%) 40
(38.8%)
103
(100%)
Total 94
(26%) 172
(48%) 90
(25%)
356
(100%)
4.3 Leadership Distribution: Patterns Of External And
Internal Participation
Overall there were more similarities than differences between the three
improvement groups in relation to perceptions of:
i) The way that leadership tasks were distributed or shared within schools;
ii) The kinds of leadership practice provided by SMT/SLT in school.
iii) The extent to which leadership practice in school was provided by other
people or groups (e.g. Deputy Head(s) and SMT/SLT);
This was the case for both the primary and secondary headteachers samples. This
suggests similar patterns of leadership distribution between the three
improvement groups in terms of the way that leadership tasks were reported to
be organised within schools and the provision of leadership practice by SMT/SLT
in school.
4.3.1 The way that leadership tasks were distributed or shared within
schools
For both the primary and the secondary samples, most heads indicated that
leadership tasks were delegated or distributed by the Head or the SMT/SLT, and
that collective planning was a strong feature of their school organisation. In
contrast, very few thought leadership distribution was spontaneous or that very
few others took on leadership tasks in their schools.

78
Overall most headteachers agreed to some (“partially”) or a fairly large (“a lot”)
extent agreed that most leadership tasks were carried out by themselves and
SMT/SLT, although rather more primary (N=43, 12%) than secondary (N=6, 2%)
heads indicated that to a “very significant” extent, this was the case within their
schools. This suggests a minority of primary schools (just over 1 in 10)
headteachers and their SLT did not distribute or delegate leadership widely.
There was a considerable sector difference found for some items relating to the
way that leadership tasks were perceived to be distributed within schools
according to the key staff survey (Table 4.8). For example, a greater proportion
of primary than secondary staff reported that they agreed “a lot” or “very
significantly” with the following statements:
• They collectively plan which individual or group(s) will carry out which
leadership tasks (Primary: N=325, 55%; Secondary: N=393, 35%);
• Most leadership tasks in their school are carried out by the Head and
SMT/SLT (Primary: N=408, 68%; Secondary: N=530, 46%).
This suggests that more collective approaches may characterise the work of
highly improved or high effective primary schools.
Table 4.8: Key staff responses indicating the extent to which they agreed with
statements concerning distribution of leadership in their schools
Question Sector Not at
all Very little
Little Partially A lot Very
significantly Total
Primary 13
(2.2%) 39
(6.5%) 52
(8.7%) 171
(28.5%) 207
(34.5%) 118
(19.7%) 600
(100.0%)
We collectively plan which individual or group(s) will carry out which leadership tasks
Secondary 87
(7.6%) 153
(13.4%) 188
(16.4%) 325
(28.4%) 283
(24.7%) 110
(9.6%) 1146
(100.0%)
Primary 6
(1.0%) 15
(2.5%) 23
(3.8%) 146
(24.4%) 270
(45.2%) 138
(23.1%) 598
(100.0%)
Most leadership tasks in this school are carried out by the Head and SMT/SLT
Secondary 27
(2.3%) 48
(4.2%) 127
(11.0%) 424
(36.7%) 402
(34.8%) 128
(11.1%) 1156
(100.0%)
4.3.2 The kinds of leadership practice provided by SMT/SLT in school
For both the primary and the secondary sample, the large majority of heads
strongly agreed that the members of the SMT/SLT in their schools share a similar

79
set of values, beliefs and attitudes related to teaching and learning, participate in
ongoing collaborative work, have a role in a range of activities and the
development of policies relating to teaching and learning, and have a positive
impact on standards of teaching and raising levels of pupil attainment (see Tables
A and B in Appendix XII).
In particular, a greater proportion of secondary than primary heads strongly
agreed that their SMT/SLT have a role or involvement in:
i) School-wide decision making (Secondary: N=311, 86%; Primary: N=266,
71%);
ii) The development of pupil behaviour policies (Secondary: N=293, 81%;
Primary: N=280, 75%);
iii) The school evaluation and review process (Secondary: N=325, 90%;
Primary: N=274, 73%);
iv) Determining the direction of the school (Secondary: N=279, 77%;
Primary: N=237, 63%).
Some sector difference was found for the key staff sample in terms of the kinds of
leadership practice provided by SMT/SLT in their schools, particularly in relation
to items on teaching and learning. This is in contrast to headteachers’ responses
where no marked differences were found relating to the same items. As Table 4.9
shows, higher proportions of primary Key Stage Managers compared to secondary
Heads of Department tended to agree moderately/strongly to all the above items
on the leadership of SMT/SLT in relation to teaching and learning.
Table 4.9: Key staff responses to the kinds of leadership provided by SMT/SLT
relating to teaching and learning (agree “moderately” or “strongly”)
Primary Key Stage Managers
Secondary Heads of Department
The Kinds of Leadership Practice Provided by SMT/SLT
N % N % Share a similar set of values, beliefs and attitudes related to teaching and learning
566 95 943 81
Participate in ongoing, collaborative work 554 92 902 78 Have a role in the development of policies on lesson planning
538 90 863 75
Have a positive impact on standards of teaching 557 93 874 75 Have a positive impact on raising levels of pupil attainment
562 94 883 76
Difference in the key staff responses was also found between the improvement
groups, but for the secondary sample only (Table 4.10). Key staff from schools in
the Low Start Group were the most likely to agree that members of the SMT/SLT

80
in their school participate in ongoing, collaborative work86 and that they had a
role in the development of policies on lesson planning87. This is, again, in contrast
to the headteachers’ responses where no significant difference was found
between improvement groups. It appears that key staff in schools that made
rapid sustained development in academic outcomes from a low start reported
greater SLT involvement in these aspects suggesting a more proactive ‘hands on’
approach.
Table 4.10: Secondary key staff responses to the kinds of leadership provided by
SMT/SLT relating to teaching and learning (agree “moderately” or “strongly”) by
improvement group
The Kinds of Leadership Practice Provided by SMT/SLT
Low Start Group
Moderate Start Group
High Start Group
N % N % N % Share a similar set of values, beliefs and attitudes related to teaching and learning
422 83 180 80 285 81
Participate in ongoing, collaborative work 405 79 176 69 268 76 Have a role in the development of policies on lesson planning
466 91 197 88 312 89
Have a positive impact on standards of teaching 389 76 169 74 265 75 Have a positive impact on raising levels of pupil attainment
395 77 164 72 272 72
4.3.3 The extent to which leadership practice in school was provided
by other people or groups (Internal and External)
Headteacher Perceptions
More secondary than primary heads tended to report that leadership practice was
provided “all the time” by Deputy Head(s) and SMT/SLT. In secondary schools the
majority of heads reported that leadership practice was provided “all the time” by
Deputy Head(s) (N=242, 67%) and SMT/SLT (N=213, 59%). In contrast, in
primary schools only slightly over half (N=182, 51%) reported that leadership
practice was provided by Deputy Head(s) “all the time” and less than half
(N=173, 47%) reported that SMT/SLT provided “a great deal” of leadership
practice in their schools.
In addition, over half of secondary heads reported that leadership practice was
provided “a great deal” by Heads of Faculty (N=139, 52%). In contrast, less than
half of primary heads (45%, N=138) reported that Key Stage Managers provided
“a great deal” of leadership practice in their schools.
86 χ²=20.81, df=10, p<0.05; Gamma=-0.12, p<0.01 87 χ²=28.88, df=12, p<0.01

81
External participation in leadership
Compared to primary heads (N=79, 21%), almost twice as many secondary
heads reported that their LA (N=152, 43%) provided little leadership practice in
their schools. Also, more secondary heads (N=142, 40%) than their primary
peers (N=101, 27%) reported very little leadership practice from parents.
School SES contexts
Secondary heads leading high disadvantage schools were more likely than their
colleagues in low disadvantage schools to report leadership by the LA (13%
versus 8% FSM1 and 2), School Improvement Partners (SIPs) (23% versus 18%
FSM1 and 2) and parents88 (10% versus 3% FSM1 and 2) (Table 4.11).
Table 4.11: Secondary headteacher responses concerning the extent to which
leadership practice in their schools was provided by various groups
Group School
FSM Band
Rarely/never / Infrequently
Some Moderate amount
A great deal / All the time
Total
FSM 1 and 2
81 (38.9%)
47 (22.6%)
42 (20.2%)
38 (18.3%)
208 (100.0%) School
Improvement Partners (SIPS) FSM 3
and 4 21
(23.1%) 19
(20.9%) 30
(33.0%) 21
(23.1%) 91
(100.0%)
FSM 1 and 2
125 (49.8%)
58 (23.1%)
47 (18.7%)
21 (8.4%)
251 (100.0%) Local Authority
(LA) FSM 3 and 4
24 (23.5%)
24 (23.5%)
41 (40.2%)
13 (12.7%)
102 (100.0%)
FSM 1 and 2
108 (43.0%)
84 (33.5%)
52 (20.7%)
7 (2.8%)
251 (100.0%)
Parents FSM 3 and 4
32 (31.1%)
41 (39.8%)
20 (19.4%)
10 (9.7%)
103 (100.0%)
88 LA: χ²=26.72, df=3, p<0.001; Gamma=0.42, p<0.001; SIPs: χ²=9.79, df=3, p<0.05; Gamma=0.25, p<0.01; parents: χ²=10.82, df=3, p<0.05; Gamma=0.20, p<0.05.

82
School improvement groups
In relationship to the three improvement groupings, primary heads in the High
Start Group were somewhat more likely to report that pupils in their schools
provided a moderate (N=51, 42%) or a substantial amount (N=41, 33%) of
leadership practice, compared to those serving in the Low Start and Moderate
Start Groups (p<0.05) (Figure 4.3). This was, however, not the case for the
secondary sample.
Figure 4.3: Leadership distribution by pupils and the three improvement groups
(Primary)
In the secondary sample, heads of schools in the Low Start Group were more
likely to report that leadership practice in their schools was provided “a great
deal” or “all the time” by i) groups of teachers, ii) individual teachers with
formally assigned tasks (e.g. KS3 co-ordinators) and iii) the LA89.
In particular, only one in three heads of the Low Start Group (N=55, 33%)
indicated that their LA rarely or infrequently contributed to the provision of
leadership in their schools in contrast to two in three of the High Group (N=64,
67%) who indicated so (Table 4.12). This is likely to reflect LA targeting and
priorities to assist the improvement of low attaining schools, while those in the
High Start Group may not need or wish for LA involvement, and indeed may be
89 i) groups of teachers: Gamma=-0.18, p<0.05, ii) individual teachers with formally assigned tasks: Gamma=-0.18, p<0.05; and iii) the LA: χ²=19.30, df=6, p<0.01; Gamma=-0.29, p<0.001.
0%
10%
20%
30%
40%
50%
60%
70%
80%
90%
100%
Low -Mod/High Mod-HigherMod/High
Stable High/High-Higher
a great deal/all the time
moderateamount
some
Rarely/infrequently
(N=158) (N=123)(N=93)

83
acting in a supportive capacity for other schools as a SIP, for example.
Table 4.12: School improvement group and secondary headteachers’ responses
concerning the extent to which leadership is provided by different people and
groups
Group Improveme
nt group
Rarely / Never /
Infrequently Some Moderate
A great deal / All the time
Total
Low Start Group
5 (3.1%)
20 (12.3%)
64 (39.5%)
73 (45.1%)
162 (100.0%)
Moderate Start Group
2 (2.7%)
16 (21.3%)
33 (44.0%)
24 (32.0%)
75 (100.0%)
Groups of teachers
High Start Group
2 (1.8%)
25 (22.1%)
50 (44.2%)
36 (31.9%)
113 (100.0%)
Low Start Group
1 (0.6%)
14 (8.6%)
54 (33.1%)
94 (57.7%)
163 (100.0%)
Moderate Start Group
1 (1.4%)
12 (16.2%)
21 (28.4%)
40 (54.1%)
74 (100.0%)
Individual teachers
with formally assigned
tasks High Start Group
1 (0.9%)
22 (19.5%)
38 (33.6%)
52 (46.0%)
113 (100.0%)
Low Start Group
55 (33.3%)
40 (24.2%)
49 (29.7%)
21 (12.7%)
165 (100.0%)
Moderate Start Group
30 (40.0%)
16 (21.3%)
21 (28.0%)
8 (10.7%)
75 (100.0%)
Local Authority
(LA) High Start
Group 64
(56.6%) 26
(23.0%) 18
(15.9%) 5
(4.4%) 113
(100.0%)
Key Staff Perceptions
The evidence from the Key staff survey indicated that there was a fairly strong
degree of correspondence in general views on leadership between headteachers
and other key staff. Significant differences were noted only with regards to
leadership practice by the School Improvement Partners (SIPs) and the LA.
Secondary key staff from the High Start Group were the most likely to report
“infrequently” and least likely to report “a great deal” of leadership practice by
SIPs.
Internal participation in leadership
Differences between headteachers’ and key staff’s responses were found
particularly in relation to the reported provision of leadership practice by senior
managers. For the headteacher sample, more secondary than primary heads
reported that leadership practice was provided “all the time” or “a great deal” by
Deputy Heads and SMT/SLT. However, for the Key Staff sample more primary
Key Staff than their secondary peers indicated that this was the case.
Forty-four per cent (N=246) of primary key staff compared to 38% of secondary

84
key staff (N=432) reported that Deputy Head(s) provided leadership practice “all
the time” in their schools, although, this difference was not statistically
significant. Primary staff (N=267, 46%) were also more likely than those of
secondary (N=473, 41%) to report that “a great deal” of leadership was provided
by SMT/SLT.
In addition, more primary (N=418, 69%) than secondary (N=603, 52%) key staff
reported that the leadership was provided by the headteacher “all the time”.
External participation in leadership
Key staff’s responses were broadly in line with headteachers’ reports on the
extent of leadership practice provided by LA and parents. Primary key staff were
more likely to indicate that a “moderate amount” (N=203, 35%) or “a great deal”
(N=117, 20%) of leadership was provided by their LA than their counterparts in
secondary schools (N=117, 20% and N=150, 14%). Secondary staff (N=326,
29%) were relatively more likely than their Primary (N=122, 21%) counterparts
to report that parents “infrequently” provided leadership practice in their schools.
School improvement groups
Significant differences were noted only with regards to leadership practice by the
School Improvement Partners (SIPs) and the LA. Secondary Key Staff from the
High Group were the most likely to report “infrequently” and least likely to report
“a great deal” of leadership practice by SIPs90 (see Figure A in Appendix IV).
When asked about the leadership practice by the LA, both primary and secondary
staff in the High Group schools were the most likely to report “Infrequently” 91
(see Figures B and C in Appendix IV). For the headteacher sample however, a
similar pattern of association relating to the LA was found only in secondary
schools.
These results indicate that external agents (SIPs and LA) are perceived to play a
lesser role in secondary schools with a longer history of success (with stable high
effective performance over several years).
90 χ²=33.69, df=10, p<0.001 91 Primary: χ²=19.61, df=10, p<0.05; Secondary: χ²=51.92, df=10, p<0.001 respectively

85
4.4 Leadership Influence: Persuasion Tactics
Headteacher Perceptions
As noted in Chaper 1, there was considerable variation in heads’ responses to
items concerning persuasion tactics for both the primary and the secondary
samples. Some tactics were much more widely reported than others.
Table 4.13: Comparisons of heads’ responses (“Very Significantly” ) to items on
persuasion tactics
Primary Headteachers Secondary Headteachers
“Very significantly” “Very significantly” To what extent do you feel able to use:
N % N %
Rational persuasion 94 25 132 36
Consultation 92 25 97 27
Inspirational appeals 45 12 60 17
Personal support 46 12 40 11
Apprising 37 10 58 16
Ingratiation 12 3 19 5
Coalition building 10 3 19 5
Legitimating tactics 8 2 14 4
Personal appeals 4 1 10 3
Exchange 5 1 8 2
Pressure 1 .3 9 2
Rational persuasion and consultation were the strategies most commonly
reported by both primary and secondary heads to influence and persuade others,
followed by inspirational appeals (appeals to persons’ values, ideals or emotions),
apprising (explaining how something would be beneficial to the person) and
personal support (Table 4.13).
In particular, more than one in three secondary heads (N=132, 37%) indicated
that to a “very significant” extent they used rational persuasion to influence
others, in contrast to one in four primary heads (N=94, 25%) who reported this.
It is possible that the use of rational persuasion may be related to the larger size
of secondary schools which may limit some other strategies.
Also, secondary heads (“a lot” and “very significantly”: N=201, 56%) were
somewhat more likely to report the use of inspirational appeals than their primary
colleagues (“a lot” and “very significantly”: N=165, 44%).
Exchange (offering something with the expectation of reciprocity at a later time),
personal appeals (appealing to personal friendship of favours) and pressure (the

86
use of demands, persistent checking etc) were least often reported tactics for
both groups, followed by legitimating tactics (efforts to establish the legitimacy of
a course of action or to verify the authority to carry out the action). (Tables A and
B in Appendix V)
School SES contexts
Pressure was somewhat less commonly reported as a tactic used by heads in low
disadvantage primary schools92, but it was not the case at the secondary level.
Over half (N=123, 53%) of primary heads in FSM1 and 2 schools indicated they
hardly used pressure as a tactic, in contrast to 41% (N=58) of primary heads
serving high disadvantage schools who reported doing so.
School improvement groups
In the primary sample pressure was found to be somewhat more commonly
reported by heads in the Low Group (N=51, 32%) than those in the Moderate
(N=21, 23%) and High (N=23, 19%) improvement groups93. However, this was
not found to be case for the secondary sample.
For the secondary sample statistically significant differences were found between
the three improvement groups in relation to heads’ reported use of inspirational
appeals94 and personal support95 (Table 4.14) as tactics to influence and persuade
others. These two tactics were somewhat less commonly reported by heads
serving schools in the High Start Group (Inspirational Appeals: N=53, 47%;
Personal Support: N=40, 35%). By contrast, there was no marked difference
between the Low Start and the Moderate Start groups in terms of the use of
inspirational appeals. In both groups the majority of heads (the Low Start Group:
N=100, 60%; the Moderate Start Group: N=47, 62%) reported using
inspirational appeals as tactics to influence others in their school. Heads in the
Moderate Group were somewhat more likely to report using personal support
(N=44, 58%) to influence others in their schools.
92 Gamma=0.19, p<0.05 93 Gamma=-0.18, p<0.05 94 χ²=15.54, df=6, p<0.05 95 χ²=16.57, df=6, p<0.05

87
Table 4.14: School improvement group and secondary headteachers’ responses
concerning the extent to which they feel able to use different tactics to influence
and persuade others
To what extent do you feel able to use:
School improvement
group
Rarely / Never /
Infrequently Some Moderate
A great deal / All the time
Total
Low Start Group
3 (1.8%)
18 (10.8%)
45 (27.1%)
100 (60.2%)
166 (100.0%)
Moderate Start Group
3 (3.9%)
8 (10.5%)
18 (23.7%)
47 (61.8%)
76 (100.0%)
Inspirational appeals
High Start Group
7 (6.1%)
6 (5.3%)
48 (42.1%)
53 (46.5%)
114 (100.0%)
Low Start Group
15 (9.0%)
25 (15.0%)
46 (27.5%)
81 (48.5%)
167 (100.0%)
Moderate Start Group
10 (13.2%)
5 (6.6%)
17 (22.4%)
44 (57.9%)
76 (100.0%)
Personal support
High Start Group
15 (13.2%)
12 (10.5%)
47 (41.2%)
40 (35.1%)
114 (100.0%)
These findings suggest that the headteachers in schools that are making more
rapid improvement from a lower starting point may be making greater use of a
range of strategies, particularly those that have an emotional component (offers
of personal support, inspirational appeals) that are likely to affect the mind set
and emotional climate of the school. In contrast, schools that are already highly
effective appear to make less use of these approaches.
Key Staff Perceptions
Overall key staff’s perceptions varied when asked about their headteachers’
persuasion tactics.
In line with headteachers’ responses, the greatest proportion of key staff reported
that the headteacher in their schools tended to use rational persuasion and
consultation “very significantly” to persuade and influence others (N=655, 37%
and N=609, 35% respectively).
Personal appeals, exchange, and pressure were reported as the least commonly
used tactics by the headteacher – which is also in line with results of the
headteacher sample. Around 20% of key staff indicated that the headteacher in
their schools did not use these persuasion tactics at all to influence others.
Education sector

88
Within the headteacher sample, more secondary than primary heads reported the
use of rational persuasion and inspirational appeals to persuade and influence
others.
For the key staff sample, equal proportions of primary and secondary staff
reported the use of most of the listed persuasion tactics by their headteacher,
except for consultation, legitimating tactics and pressure (Table 4.15).
• Primary staff were more likely than their secondary colleagues to report
that the headteacher used consultation a lot/very significantly (Primary:
N=486, 81% and Secondary: N=813, 70%) to influence others;
• However, compared to primary key staff, secondary key staff were more
likely to report that their headteacher used legitimating tactics (Primary:
N=113, 20% and Secondary: N=266, 24%) and pressure (Primary: N=47,
8% and Secondary: N=171, 15%) a lot or very significantly.
Table 4.15: Key staff responses concerning the extent to which they felt their
headteacher uses different tactics to influence and persuade others
To what extent do you feel
able to use:
Sector Not at
all Very little
Little Partially A lot Ver y
significantly Total
Primary 3
(0.5%) 5
(0.8%) 20
(3.3%) 86
(14.1%) 263
(43.3%) 223
(36.7%) 600
(100.0%) Consultation
Secondary 14
(1.2%) 36
(3.1%) 68
(5.9%) 225
(19.5%) 427
(36.9%) 386
(33.4%) 1156
(100.0%)
Primary 84
(14.7%) 93
(16.3%) 116
(20.4%) 164
(28.8%) 80
(14.0%) 33
(5.8%) 570
(100.0%) Legitimating tactics
Secondary 104
(9.4%) 149
(13.4%) 216
(19.4%) 376
(33.8%) 206
(18.5%) 60
(5.4%) 1111
(100.0%)
Primary 170
(28.2%) 191
(31.7%) 124
(20.6%) 70
(11.6%) 39
(6.5%) 8
(1.3%) 602
(100.0%) Pressure
Secondary 200
(17.4%) 299
(26.0%) 241
(21.0%) 237
(20.6%) 124
(10.8%) 47
(4.1%) 1148
(100.0%)
School SES contexts
School disadvantage was not associated with the way key staff perceived their
headteacher’s persuasion tactics except with regards to the use of ingratiation
within secondary schools. Heads of departments from high disadvantage schools
(N=107, 31%) were more likely than their counterparts from low disadvantage
schools (N=200, 25%) to indicate that the headteacher used Ingratiation “a

89
lot/very significantly” to influence or persuade others96.
School improvement groups
Key staff responses concerning the headteachers’ use of persuasion tactics did
not differ based on the three improvement groups within the primary key staff
sample. However, differences were found for the secondary sample. Heads of
Department from schools in the High Start Group were slightly less likely than
their counterparts in other improvement groups to report that the headteacher
used inspirational appeals97 and ingratiation98. This is broadly in line with the
findings from the headteacher survey.
4.5 School Conditions: Academic Press
Headteacher Perceptions
Heads’ responses were fairly positive for all the items relating to academic
standards and expectations in their schools and this might be expected given the
focus of the sample on highly improved/ highly effective schools. Primary heads
were relatively more likely to report improvement in most items related to
academic aspects over the last three years than their secondary peers.
Nonetheless, a relatively greater proportion of secondary (N=225, 62%) than
primary heads (N=176, 47%) tended to “agree strongly” that the performance of
department/subject areas was regularly monitored and targets for improvement
were regularly set in their schools.
Key Staff Perceptions
A large majority of key staff agreed moderately/strongly to the items relating to
academic standards and expectations set in their schools. For example, when
they were asked whether their school sets high standards for academic
performance, more than 90% agreed moderately/strongly to it. This is broadly in
line with findings from the headteacher sample.
96 χ²=8.64, df=3, p<0.05 97 χ²=22.90, df=10, p<0.05; Gamma=-0.12, p<0.01 98 χ²=33.03, df=10, p<0.001; Gamma=-0.11, p<0.01

90
Nonetheless, there were a few items to which a substantial proportion of key staff
showed relatively lower levels of agreement. For example:
• Only 57% agreed moderately/strongly that the lessons plans are regularly
discussed and monitored;
• 67% agreed moderately/strongly that pupils respect others who get good
marks/grades.
Overall, there was a considerable sector difference, with higher proportions of
positive responses from primary key stage managers than their peers in
secondary schools for most items for this section. This is, again, broadly in line
with findings from the headteacher survey.
4.5.1 School SES Contexts
Headteacher Perceptions
School socio-economic contexts were related to both primary and secondary
heads’ responses in this section. For both the primary and secondary sample
those in high disadvantage schools were more likely to agree that lesson plans
were regularly discussed and monitored99.
In addition, for primaries those in high disadvantage schools (FSM 3 and 4:
N=118, 84% versus FSM 1 and 2: N=175, 75%) were somewhat more likely to
agree moderately or strongly that the performance of subject areas was regularly
monitored and targets for improvement were regularly set (p<0.05). Those in low
disadvantage schools (FSM 1 and 2: N=196, 84% versus FSM 3 and 4: N=104,
73%), were proportionately more likely to agree that pupils were regularly
involved in assessment for learning in their schools100 (Table 4.16).
For secondaries, heads in low disadvantage schools (FSM 1 and 2: N=200, 79%
versus FSM 3 and 4: N=91, 88%) were slightly less likely to agree strongly that
teachers regularly use pupil assessment data to set individual pupil achievement
targets (Gamma=0.34, p<0.05). However, pupil assessment data were clearly
highly used in all schools.
99 Primary: χ²=9.1, df=3, p<0.05; Gamma=0.33, p<0.01; Secondary: Gamma=0.28, p<0.01 100 χ²=7.8, df=3, [email protected]; Gamma=-0.32, p<0.05

91
Table 4.16: School socio-economic status and primary headteachers’ responses
concerning academic standards and expectations
Question School
FSM Band
Disagree strongly /
moderately
Disagree slightly
Agree slightly
Agree moderately / strongly
Total
FSM1 and 2
4 (1.7%)
10 (4.3%)
44 (18.9%)
175 (75.1%)
233 (100.0%)
The performance of subject areas is regularly monitored and targets for improvement are regularly set
FSM3 and 4
0 (0.0%)
3 (2.1%)
20 (14.1%)
118 (83.7%)
141 (100.0%)
FSM1 and 2
1 (0.4%)
3 (1.3%)
33 (14.2%)
196 (84.1%)
233 (100.0%)
Pupils are regularly involved in assessment for learning FSM3
and 4 3
(2.1%) 4
(2.8%) 31
(21.8%) 104
(73.2%) 173
(100.0%)
Key Staff Perceptions
Similar patterns of associations were found within the key staff sample. Key staff
from high disadvantage schools were more likely to agree with specific items
related to the use of performance data and monitoring:
• Primary key staff in high disadvantage schools were relatively more likely
than their peers in low disadvantage schools to agree that the
performance of subject areas was regularly monitored and targets for
improvement were regularly set101 (Table 4.17). This is in line with primary
headteachers’ responses. This is in line with primary headteachers’
responses.
• Also in line with secondary headteachers’ responses, secondary key staff
in high disadvantage schools were more likely to agree that lesson plans
were regularly discussed and monitored102 in their schools and that class
teachers regularly use pupil assessment data to set individual pupil
achievement targets103 (Table 4.17).
101 χ²=10.27, df=4, p<0.05 102 χ²=11.33, df=5, p<0.05 103 χ²=22.69, df=5, p<0.001;Gamma=0.24, p<0.001

92
Table 4.17: Key staff responses indicating agreement with the statement “The
performance of subject areas is regularly monitored and targets for improvement
are regularly set”
Sector School
FSM Band
Disagree strongly
Disagree moderately
Disagree slightly
Agree slightly
Agree moderately
Agree strongly
Total
FSM1 and 2
0 (0.0%)
2 (0.5%)
15 (4.1%)
66 (17.8%)
140 (37.8%)
147 (39.7%)
370 (100.0%)
Primary FSM3 and 4
0 (0.0%)
2 (0.9%)
28 (12.2%)
28 (12.2%)
90 (39.1%)
108 (47.0%)
230 (100.0%)
FSM1 and 2
0 (0.0%)
10 (1.2%)
33 (4.1%)
109 (13.6%)
268 (33.3%)
384 (47.8%)
804 (100.0%)
Secondary
FSM3 and 4
0 (0.0%)
3 (0.9%)
9 (2.6%)
39 (11.4%)
114 (33.2%)
178 (51.9%)
343 (100.0%)
Taken together, these results suggest that the use of performance data and
monitoring are particularly important strategies in the drive to raise standards in
schools that make sustained improvement in raising pupil attainment in
disadvantaged contexts.
Perhaps unsurprisingly, higher numbers of Key Staff from low disadvantage
schools agreed that most pupils do achieve the goals that have been set for
them. This was the case for both Primary and Secondary samples104.
4.5.2 School Improvement Groups
Headteacher Perceptions
Patterns of associations between the school’s improvement group and survey
responses differed for the primary and secondary headteacher samples.
Primary heads serving schools in the Moderate Start Group (N=79, 84%) were
more likely to agree moderately or strongly that lesson plans were regularly
discussed and monitored in their schools than those in the other two
improvement groups (the Low Start Group: N=126, 79%; the High Start Group:
N=87, 71%)105 (Table 4.18). Also at the primary level, heads in the High Start
Group (87%) were somewhat more likely than their peers in the other two
improvement groups to agree that pupils were regularly involved in assessment
104 Primary: χ²=14.14, df=4, p<0.01; Secondary: χ²=11.57, df=5, p<0.05 105 χ²=14.93, df=6, p<0.05

93
for learning within their schools106, though a large majority in all groups agreed
moderately or strongly with this item (the Moderate Group: N=74, 79%; the Low
Group: N=120, 75%) (Table 4.19).
Table 4.18: Improvement groups and primary heads’ responses to “Lesson plans
are regularly discussed monitored.”
Improvement Groups Disagree strongly/
moderately
Disagree slightly
Agree slightly
Agree moderately/
strongly
Total
Low to Moderate/High 1
(0.6%) 9
(5.6%) 24
(15%) 126
(78.8%)
160
(100%)
Moderate to Higher Moderate/ High
1 (1.1%)
2 (2.1%)
12 (12.8%)
79 (84%)
94
(100%)
Stable High/ High to Higher
6 (4.9%)
2 (1.6%)
27 (22.1%)
87 (71.3%)
122
(100%)
Total 8
(2%) 13
(3%) 63
(17%) 292
(78%)
376
(100%)
Table 4.19: Improvement groups and primary heads’ responses to “pupils are
regularly involved in assessment for learning”
Improvement Groups Disagree strongly/
moderately
Disagree slightly
Agree slightly
Agree moderately/
strongly
Total
Low to Moderate/High 4
(2.5%) 4
(2.5%) 32
(20%) 120
(75%)
160
(100%)
Moderate to Higher Moderate/ High
0 (0%)
1 (1.1%)
19 (20.2%)
74 (78.7%)
94
(100%)
Stable High/ High to Higher
0 (0%)
3 (2.5%)
13 (10.7%)
106 (86.9%)
122
(100%)
Total 4
(1%) 8
(2%) 64
(17%) 300
(80%)
376
(100%)
At the secondary level, heads in the Low Start Group schools were
proportionately less likely to agree moderately or strongly that teachers set high
standards for academic performance107 (N=140, 84%) and that pupils respected
others who had good marks/grades108 (N=99, 59%) (Table 4.20 and Table 4.21).
In contrast, heads serving schools in the Moderate Start Group were somewhat
more likely to agree that teachers set high standards for academic performance
(N=72, 96%) whereas those working in the High Start Group schools were
proportionately more likely to agree strongly that pupils respected others who
106 Gamma=0.26, p<0.05 107 χ²=12.75, df=4, p<0.05; Gamma=0.41, p<0.01 108 Gamma=0.27, p<0.05

94
had achieved good marks/grades (N=88, 77%).
Table 4.20: Improvement groups and secondary heads’ responses to “Teachers
set high standards for academic performance”
Improvement Groups Disagree slightly
Agree slightly
Agree moderately/ strongly
Total
Low to Moderate/High 1
(0.6%) 26
(15.6%) 140
(83.8%)
167
(100%)
Moderate to Higher Moderate/ High
1 (1.3%)
2 (2.7%)
72 (96%)
75
(100%)
Stable High/ High to Higher
0 (0%)
8 (7%)
107 (93%)
115
(100%)
Total 2
(1%) 36
(10%) 319
(89%)
357
(100%)
Table 4.21: Improvement groups and secondary heads’ responses to “pupils
respect others who get good marks/grades”
Improvement Groups Disagree strongly/
moderately
Disagree slightly
Agree slightly
Agree moderately/
strongly
Total
Low to Moderate/High 5
(3%) 19
(11.4%) 44
(26.3%) 99
(59.3%)
167
(100%)
Moderate to Higher Moderate/ High
2 (2.7%)
4 (5.3%)
21 (28%)
48 (64%)
75
(100%)
Stable High/ High to Higher
1 (0.9%)
6 (5.3%)
19 (16.7%)
88 (77.2%)
114
(100%)
Total 8
(2%) 29
(8%) 84
(24%) 235
(66%)
356
(100%)
Key Staff Perceptions
In common with findings from the headteacher sample, patterns of associations
also differed for the primary and secondary key staff sample.
In primary schools, responses from key staff did not differ significantly based on
improvement groups except for one item on academic standards and
expectations. Proportionately more key staff from the High Start Group of schools
were likely to agree strongly that most pupils do achieve the goals that have been
set for them when compared with the leaders from schools in the two other
improvement groups109. Overall, 60% of primary key stage managers from
schools in the high group compared to only 47% staff from the Moderate Start
109 χ²=16.33, df=8, p<0.05

95
Group schools and only 41% of those from the Low Start Group agreed strongly
to this statement (see Figure A in Appendix VI).
However, for secondary schools, significant differences were found on most items
in relation to the three groups of improving schools. Key staff from the High Start
Group reported stronger agreement than their peers in the other two
improvement groups when asked whether i) Pupils in this school can achieve the
goals that have been set for them110 (Figure B in Appendix VI); ii) Teachers set
high standards for academic performance111; iii) The school sets high standards
for academic performance112 (Figure C in Appendix VI); iv) Their pupils respect
others who get good marks/grades113 (Figure D in Appendix VI). For example,
40% of key staff from the High Start Group schools compared to 26% from the
Moderate Start Group and only 21% from the Low Start Group agreed strongly
that pupils in their schools can achieve the goals that have been set for them.
4.6 School Conditions: Collaborative Cultures
Headteachers and key staff were surveyed to establish their perceptions of the
current state of their schools in relation to collaborative practise and cultures.
Headteacher Perceptions
Most headteachers’ responses to all items on school culture were rated very
positively by both primary and secondary heads, though, again, the primary
heads were more likely to report somewhat higher agreement on most items
related to aspects of school culture than their secondary peers.
In particular, almost two thirds of primary heads (N=233, 62%) agreed strongly
that there was ongoing collaborative planning of classroom work among teachers
in their schools, compared with just under a third of secondary heads (N=111,
31%) who reported this. There was lower agreement (“agree strongly”) that
pupils felt safe in their schools for the secondary (N=204, 57%) than the primary
sample (N=311, 82%). In addition, only just over a third of secondary heads
(N=134, 37%) agreed strongly that teachers and other adults in the classroom
110 χ²=19.12, df=10, p<0.05 111 χ²=79.94, df=8, p<0.001 112 χ²=56.56, df=8, p<0.001 113 χ²=76.44, df=10, p<0.001

96
worked collaboratively whereas twice as many primary heads (N=291, 77%)
indicated that this was the case in their schools. Secondary heads (N=145, 40%)
were, also, much less likely than their primary colleagues (N=298, 79%) to agree
moderately or strongly that parents often visited the school.
Key Staff Perceptions
The majority of the key staff reported higher levels of agreement to most items
relating to the culture in their schools. This is broadly in line with findings from
the headteacher survey in which most primary and secondary heads responded
positively to all items on school culture.
In particular, close to 95% of the key staff agreed moderately/strongly when
asked whether teachers in their school mostly work together to improve their
practice. The least amount of agreement was reported when they were asked
whether parents often visit the school (N=1,026, 58% agreed
moderately/strongly).
Considerable sector difference was also noted in relation to all items on school
culture. Primary key staff reported higher levels of “strong” agreements and lower
levels of “moderate” agreements than their counterparts in secondary schools as
seen in Appendix VII (Tables A & B). This is, again, in line with patterns of
responses from the headteacher survey.
4.6.1 School SES Contexts
Headteacher Perceptions
At the primary level, heads in low disadvantage schools were more likely to agree
that parents often visited the school114. (FSM 1 and 2: 86% versus FSM 3 and 4:
67%).
At the secondary level heads in high disadvantage schools were more likely to
agree that most teachers shared a similar set of values, beliefs and attitudes115
(FSM 3 and 4: 96% versus FSM 1 and 2: 88%) and that teachers and other
adults worked collaboratively in the classroom116 (FSM 3 and 4: 91% versus FSM
1 and 2: 82%).
114 χ²=21.74, df=3, p<0.001; Gamma=-0.51, p<0.001 115 Gamma=0.54, p<0.01 116 Gamma=0.38, p<0.05

97
Key Staff Perceptions
In common with patterns of headteachers’ responses, school disadvantage was
related to both primary and secondary key staff responses, but for different items
on school culture.
When asked whether parents often visit the school, primary key staff from high
disadvantage schools were relatively less likely than their counterparts to agree
strongly to it117, but this was not the case for secondary schools (Table 4.22).
This finding is again in line with headteachers’ responses.
Table 4.22: Key staff responses indicating agreement with the statement
“Parents often visit the school”
Sector School
FSM Band
Disagree strongly
Disagree moderately
Disagree slightly
Agree slightly
Agree moderately
Agree strongly
Total
FSM1 and 2
2 (0.5%)
8 (2.2%)
13 (3.5%)
41 (11.1%)
117 (31.7%)
188 (50.9%)
369 (100.0%)
Primary FSM3 and 4
4 (1.7%)
10 (4.3%)
16 (7.0%)
43 (18.7%)
80 (34.3%)
77 (33.5%)
230 (100.0%)
FSM1 and 2
14 (1.8%)
57 (7.1%)
107 (13.4%)
230 (28.8%)
252 (31.5%)
139 (17.4%)
799 (100.0%)
Secondary
FSM3 and 4
16 (4.7%)
18 (5.2%)
48 (14.0%)
99 (28.8%)
105 (30.5%)
58 (16.9%)
344 (100.0%)
At the secondary level, key staff in high disadvantage schools were also more
likely than their peers in low disadvantage schools to agree that most teachers in
their school shared a similar set of values, beliefs and attitudes118 (Table 4.23).
This once again corresponds with headteachers’ perceptions.
117 χ²=23.66, df=5, p<0.001; Gamma=-0.31, p<0.001 118 χ²=15.36, df=5, p<0.01

98
Table 4.23: Secondary key staff responses indicating agreement with the
statement “Most teachers in our school share a similar set of values, beliefs and
attitudes related to teaching and learning”
School FSM Band
Disagree strongly
Disagree moderately
Disagree slightly
Agree slightly
Agree moderately
Agree strongly
Total
FSM1 and 2
1 (0.1%)
9 (1.1%)
30 (3.7%)
141 (17.5%)
388 (48.2%)
236 (29.3%)
805 (100.0%)
FSM3 and 4
3 (0.9%)
7 (2.0%)
13 (3.7%)
51 (14.8%)
139 (40.4%)
131 (37.5%)
344 (100.0%)
Total 4
(0.3%) 16
(1.4%) 43
(3.7%) 192
(16.7%) 527
(45.9%) 367
(31.9%) 1149
(100.0%)
School disadvantage was also found to be related to different items on school
culture compared with secondary headteachers’ responses. Key staff in high
disadvantage schools were relatively more likely than those from low
disadvantage schools to agree strongly that i) the goals they are expected to
accomplish with their pupils are clear to them119; ii) there is no conflict in their
mind about what they are expected to do120; and iii) the school is actively
involved in work with other schools or organisations121.
Contrasting associations were found when secondary heads of department were
asked whether pupils feel safe in their schools122. A slightly higher proportion of
key staff from low disadvantage schools (N= 361, 45%) agreed strongly to it
compared to their peers from high disadvantage schools (N=144, 42%).
Taken together these results suggest that the achievement of a common vision,
or mind set is likely to play a particular role in motivating and focussing the
collective efforts of staff to promote improvement in pupil outcomes as a high
priority within high disadvantage contexts.
4.6.2 School Improvement Groups
Headteacher Perceptions
Overall there were few statistically significant differences between the three
improvement groups in relation to most items on school culture, except for heads’
perceptions of how often parents visited their schools.
As shown in Figure 4.4 and Figure 4.5, for both the primary and the secondary
119 χ²=11.72, df=5, p<0.05 120 χ²=11.25, df=5, p<0.05 121 χ²=14.66, df=5, p<0.05 122 χ²=13.71, df=5, p<0.05

99
0%
10%
20%
30%
40%
50%
60%
70%
80%
90%
100%
Low -Mod/High Mod-HigherMod/High
Stable High/ High-Higher
AgreeModerately/StronglyAgreeSlightly
DisagreeSlightly
DisagreeStrongly/Moderately
(N=160) (N=122)(N=94)
samples, heads serving the Low Start Group schools were somewhat less likely to
agree that parents often visited their schools123. For example, 69% of primary
heads in the Low Start Group, compared to 86% of those in the Moderate Start
and High Start Groups respectively, agreed moderately or strongly that parents
often visited their schools. At the secondary level, 33% of headteachers in the
Low Start Group, in contrast to 49% of those in the High Start Group, agreed that
this was the case.
Figure 4.4: Levels of agreement with the item “parents often visit the school” by
improvement groups (Primary)
123 Primary: χ²=17.93, df=6, p<0.01; Gamma=0.37, p<0.001; Secondary: Gamma=0.19, p<0.01

100
0%
10%
20%
30%
40%
50%
60%
70%
80%
90%
100%
Low -Mod/High Mod-HigherMod/High
Stable High/ High-Higher
AgreeModerately/StronglyAgreeSlightly
DisagreeSlightly
DisagreeStrongly/Moderately
(N=165) (N=115)(N=75)
Figure 4.5: Levels of agreement with the item “parents often visit the school” by
improvement groups (Secondary)
Key Staff Perceptions
Key staff responses differed based on the three improvement groups for three
items on school culture.
At the primary level, key stage managers from the High Start Group schools were
the most likely to agree strongly to the statement that parents often visit the
school124. This is in line with the headteachers’ responses. Primary key staff from
the Moderate Start Group were the most likely to agree strongly that the goals
they are expected to accomplish with their pupils are clear to them125 (Table
4.24).
Table 4.24: Primary key staff responses indicating agreement with the statement
“The goals I am expected to accomplish with my pupils are clear to me”
Improvement Group
Disagree strongly
Disagree moderately
Disagree slightly
Agree slightly
Agree moderately
Agree strongly
Total
Low Start Group
0 (0.0%)
0 (0.0%)
0 (0.0%)
1 (0.4%)
58 (23.2%)
191 (76.4%)
250 (100.0%)
Moderate Start Group
0 (0.0%)
0 (0.0%)
0 (0.0%)
4 (2.9%)
19 (13.8%)
115 (83.3%)
138 (100.0%)
High Start Group
0 (0.0%)
0 (0.0%)
2 (1.1%)
1 (0.6%)
36 (20.2%)
139 (78.1%)
178 (100.0%)
Total 0
(0.0%) 0
(0.0%) 2
(0.4%) 6
(1.1%) 113
(20.0%) 445
(78.6%) 566
(100.0%)
For the secondary key staff sample, higher proportions of heads of department
124 χ²=28.53, df=10, p<0.01 125 χ²=16.72, df=6, p<0.05

101
0%
10%
20%
30%
40%
50%
60%
70%
80%
90%
100%
Low -Moderate/High Moderate-highermoderate/high
Stable high/ high-higher
Agree strongly
Agree moderately
Agree slightly
Disagree slightly
Disagree strongly/moderately
from the High Start Group were more likely to agree strongly that pupils feel safe
in their school126. Figure 4.6 illustrates this result and points to the difference in
perceptions of behavioural climate.
Figure 4.6: Three improvement groups and key staff responses to whether their
pupils feel safe in their school (Secondary)
4.7 Leader Self-Efficacy
Headteacher Perceptions
Both primary and secondary heads’ responses to items related to their self-
efficacy were positively skewed, indicating high levels of self-confidence about
their abilities. However, although still positive, primary heads’ responses were
somewhat less favourable than their secondary colleagues on most items.
Primary heads were relatively less positive about their ability to manage multiple
accountabilities from diverse audiences and their ability to sustain their job
satisfaction and motivation in their leadership role as well as their commitment to
the teaching profession (Table 4.25 shows differences in the use of the most
positive ratings). Also, primary heads were relatively less confident about their
ability to raise achievement in national tests and examinations and to manage
change in their schools.
Secondary heads of improved and highly effective schools showed the most
positive ratings for their ability to sustain their commitment to the teaching
126 χ²=64.83, df=10, p<0.001

102
profession and to manage change.
Table 4.25: Comparisons of heads’ responses (“very significantly”) to items on
self-efficacy127
Primary Headteachers
Secondary Headteachers
Very significantly Very significantly To what extent do you feel able to:
N % N %
Manage multiple accountabilities from diverse audiences
68 18 97 27
Sustain your job satisfaction in your leadership role 91 24 139 39
Sustain your motivation as a school leader 91 24 147 41
Sustain your commitment to the teaching profession 133 35 180 50
Raise achievement on national tests & exams 77 21 114 32
Manage change in your school 149 39 170 48
Key Staff Perceptions
The majority of the key staff also responded positively on almost all items related
to headteacher efficacy. In particular, when they were asked whether the
headteacher in their school managed multiple accountabilities from diverse
audiences (e.g. Governing Body, LA, Ofsted), 92% (N=1,595) reported “a lot” or
“very significantly”. This corresponds to patterns of headteachers’ own
perceptions of their self-efficacy. Primary key staff were more likely to hold
positive views on all of the items related to the headteacher’s efficacy. These
results confirm the high esteem accorded to head teachers in the sample of
effective and improved schools in this study by their key staff.
4.7.1 School SES contexts
Headteacher Perceptions
In both sectors heads from more disadvantaged schools responded most
positively to items asking their views about their self-efficacy. For primary heads,
those from high disadvantage schools were more positive about items related to
their role and their ability to manage change in their school128 (FSM 3 and 4:
N=134, 94% versus FSM 1 and 2: N=207, 89%) and manage multiple
accountabilities129 (FSM 3 and 4: N=96, 68%; versus FSM 1 and 2: N=121,
52%).
127 See Tables A and B in Appendix VIII for complete summaries of primary and secondary heads’ responses to items on leader self-efficacy 128 Gamma=0.37, p<0.05 129 χ²=10.35, df=3, p<0.05; Gamma=0.31, p<0.01

103
For secondaries, heads in high disadvantage schools tended to be more positive
about their ability to i) motivate teachers, ii) create a positive learning
environment, iii) facilitate pupil learning and iv) raise achievement – areas that
are closely related to raising standards and the quality of teaching and learning
(see Tables 1-4 in Appendix IX). They were also, in common with their primary
colleagues in schools with similar SES contexts, more positive about their ability
to manage multiple accountabilities (Table 5 in Appendix IX).
Key Staff Perceptions
In contrast to findings of the headteacher survey, school disadvantage was not
related to the key staff responses within the primary sample. However, at the
secondary level, key staff responses varied based on the school disadvantage
factor. Key staff from high disadvantage schools tended to be more positive about
their headteachers’ ability to motivate teachers130 and raise achievement on
national tests and examinations131. This was in line with secondary headteachers’
own perceptions. In addition, secondary key staff in high disadvantage schools
were also more positive about their headteachers’ ability to generate enthusiasm
for a shared vision of the school132 and sustain staff commitment to the teaching
profession133(Table 4.26).
These findings indicate that the leadership of the headteacher is viewed as
especially important to success in disadvantaged secondary schools.
130 χ²=13.47, df=5, p<0.05 131 χ²=13.22, df=5,p<0.05 132 χ²=13.74, df=5, p<0.05 133 χ²=15.55, df=5, p<0.01

104
Table 4.26: Secondary key staff responses concerning the headteachers’ abilities
Question School
FSM Band
Not at all
Very little
Little Partially A lot Very
significantly Total
FSM1 and 2
6 (0.7%)
34 (4.2%)
31 (3.9%)
222 (27.7%)
337 (42.0%)
172 (21.4%)
802 (100.0%) Motivates
teachers FSM3 and 4
5 (1.4%)
6 (1.7%)
12 (3.4%)
79 (22.6%)
147 (42.1%)
100 (28.7%)
349 (100.0%)
FSM1 and 2
6 (0.7%)
24 (3.0%)
31 (3.9%)
177 (22.1%)
287 (35.8%)
277 (34.5%)
802 (100.0%)
Generates enthusiasm for a shared vision of the school
FSM3 and 4
3 (0.9%)
6 (1.7%)
10 (2.9%)
56 (16.1%)
116 (33.4%)
156 (45.0%)
347 (100.0%)
FSM1 and 2
5 (0.6%)
12 (1.5%)
39 (4.9%)
157 (19.6%)
278 (34.7%)
310 (38.7%)
801 (100.0%)
Raises achievement on national tests and examinations
FSM3 and 4
3 (0.9%)
2 (0.6%)
12 (3.5%)
60 (17.3%)
98 (28.3%)
171 (49.4%)
346 (100.0%)
FSM1 and 2
18 (2.3%)
29 (3.6%)
54 (6.8%)
162 (20.3%)
268 (33.6%)
267 (33.5%)
798 (100.0%)
Sustains your commitment to the teaching profession
FSM3 and 4
9 (2.6%)
6 (1.8%)
15 (4.4%)
60 (17.6%)
99 (29.0%)
152 (44.6%)
341 (100.0%)
8.6.2 School Improvement Groups
Headteacher Perceptions
For both primary and secondary heads, those in the Low Start improvement
group were somewhat more confident about their ability to manage multiple
accountabilities134(Table 4.27). In all 66% (N=105) of these primary heads, in
contrast to 43% (N=53) of those in the High Start Group schools, indicated a high
level of perceived self-efficacy in this aspect. For the secondary sample, 75%
(N=124) of heads serving schools in the Low Start Group, in contrast to 64%
(N=72) of those in the High Start Group, reported high self-efficacy in relation to
managing multiple accountabilities.
134 Primary: χ²=19.34, df=6, p<0.01; Gamma=-0.30, p<0.001; secondary: Gamma=-0.17, p<0.05

105
Table 4.27: Headteacher responses to the question “To what extent do you feel
able to manage multiple accountabilities from diverse audiences?”
Sector Improvement
Group Not at all / Very little
Little Partially A lot / Very significantly
Total
Low Start Group
2 (1.3%)
7 (4.4%)
46 (28.8%)
105 (65.6%)
160 (100.0%)
Moderate Start Group
4 (4.3%)
5 (5.3%)
25 (26.6%)
60 (63.8%)
94 (100.0%)
Primary
High Start Group
8 (6.6%)
12 (9.8%)
49 (40.2%)
53 (43.4%)
122 (100.0%)
Low Start Group
2 (1.2%)
6 (3.6%)
33 (20.0%)
124 (75.2%)
165 (100.0%)
Moderate Start Group
1 (1.3%)
5 (6.7%)
19 (25.3%)
50 (66.7%)
75 (100.0%)
Secondary
High Start Group
1 (0.9%)
3 (2.7%)
37 (32.7%)
72 (63.7%)
113 (100.0%)
In secondary schools heads in the Low Start Group were also more positive about
their ability to motivate teachers135. Over 90% of these heads (N=149),
compared with 79% (N=59) of those in the Moderate Start Group and 83%
(N=95) in the High Start Group, indicated a high level of perceived efficacy in this
aspect.
Key Staff Perceptions
Primary key staff responses did not differ based on the three improvement
groups. In contrast, we found differences in the pattern of responses for
secondary key staff for three items related to perceived headteacher efficacy.
When secondary key staff were asked whether the headteacher created a positive
learning environment in their school, those from the High Start Group (46%)
were the most likely to report “very significantly”, followed by Key Staff from the
Low Start Group (39%) and then the Moderate Start Group (36%)136.
In contrast, rather more positive views were given by secondary key staff from
the Low Start Group, when asked whether the headteacher sustained their
motivation as a school leader137 and sustained their commitment to the teaching
profession138. These results are in line with headteachers’ own perceptions in the
Low Start Group.
135 χ²=6.36, df=2, p<0.05 136 χ²=19.59, df=10, p<0.05 137 χ²=18.72, df=10, p<0.05 138 χ²=18.54, df=10, p<0.05

106
4.8 Classroom Conditions: Workload Volume And
Complexity
Headteacher Perceptions
Both primary and secondary heads’ views were fairly positive in response to these
items, particularly concerning teachers having access to the teaching resources
they need to do a good job and the atmosphere throughout their school
encouraging pupils to learn. Most heads felt that teachers’ workloads were quite
fair compared with those in other schools (“agree strongly”: Primary: N=150,
40%; Secondary: N=174, 49%). Over half of primary heads (N=208, 55%)
compared with more than two thirds of secondary heads (N=251, 70%) felt that
the amount of administrative work required of teachers was not excessive.
Primary heads were relatively less likely than secondary heads to report that the
school had too many pupils who were uncooperative (13% compared with 26%),
or who achieved poorly despite teachers’ best efforts (28% compared with 33%).
However, primary heads were somewhat more likely to think the size of classes
makes unreasonable demands on the time required for preparation and marking
although this was still a minority (26% primary versus 17% secondary).
In general, therefore, heads of improving and effective schools are fairly positive
about the relationship between workload demands and resources available to
meet them in their schools.
Key Staff Perceptions
• Workload volume
Overall, fairly positive views were reported by key staff in terms of their workload
volume, but with mixed views on some of the items. This is broadly in line with
findings of the headteacher survey.
Sector difference was also noted. Primary key stage managers were more likely
than secondary heads of department to have more positive views about their
workload volume (Table 4.28).

107
Table 4.28: Key staff responses concerning workload volume
Questions Sector Disagree strongly
Disagree moderately
Disagree slightly
Agree slightly
Agree moderately
Agree slightly
Total
Primary 12
(2.0%) 40
(6.8%) 51
(8.7%) 95
(16.2%) 203
(34.6%) 186
(31.7%) 587
(100.0%) My workload is quite fair compared to teachers in other schools Secondary
54 (4.8%)
102 (9.0%)
169 (14.9%)
207 (18.2%)
357 (31.5%)
246 (21.7%)
1135 (100.0%)
Primary 44
(7.4%) 78
(13.1%) 119
(19.9%) 105
(17.6%) 160
(26.8%) 91
(15.2%) 597
(100.0%) The amount of administrative work required of me is not excessive Secondary
134 (11.6%)
224 (19.4%)
251 (21.8%)
214 (18.6%)
226 (19.6%)
104 (9.0%)
1153 (100.0%)
• Workload complexity
With regards to workload complexity, there was a large sector difference found
for most items. Primary staff were more likely to agree strongly than secondary
staff that:
• They have access to the teaching resources that they need to do a good
job (Primary: N=383, 48% and Secondary: N=484, 42%);
• The atmosphere throughout the school encourages pupils to learn
(Primary: N=430, 72% and Secondary: N=393, 34%).
Primary staff (N=357, 60%) were also more likely to disagree compared with
secondary staff (N=462, 40%) when asked whether they have too many pupils
who are uncooperative. This corresponds with headteachers’ responses.
However, when staff were asked if they teach subjects or areas of the curriculum
for which they have little formal preparation, substantially higher numbers of
secondary staff (N=832, 73%) disagreed strongly to it compared to their primary
peers (N=266, 45%).
4.8.1 School SES contexts
Headteacher Perceptions
Both primary and secondary heads from high disadvantage schools gave more
positive responses to the two items concerned with class size: i) the size of
classes makes unreasonable demands on the time required for preparation and
marking139; and ii) the size of classes allows teachers to adequately differentiate
their teaching between pupils140 (Table 4.29).
139 Primary: χ²=7.85, df=3, p<0.05; Gamma=-0.23, p<0.05; Secondary: Gamma=-0.30, p<0.01 140 Primary: χ²=10.32, df=3, p<0.05; Gamma=0.32, p<0.01; Secondary: Gamma=0.23, p<0.05

108
Table 4.29: Headteacher responses concerning class size by school FSM band
Question School
FSM Band
Disagree strongly /
moderately
Disagree slightly
Agree slightly
Agree moderately / strongly
Total
FSM 1 and 2
296 (60.9%)
69 (14.2%)
76 (15.6%)
45 (9.3%)
486 (100.0%)
The size of classes makes unreasonable demands on the time required for preparation and marking
FSM 3 and 4
180 (73.5%)
29 (11.8%)
23 (9.4%)
13 (5.3%)
245 (100.0%)
FSM 1 and 2
37 (7.6%)
69 (14.2%)
116 (23.9%)
264 (54.3%)
486 (100.0%)
The size of classes allows teachers to adequately differentiate their teaching between pupils
FSM 3 and 4
11 (4.5%)
14 (5.7%)
52 (21.2%)
168 (68.6%)
245 (100.0%)
However, both primary and secondary heads from high disadvantage schools
gave relatively less positive responses to the item on numbers of pupils achieving
poorly despite teachers’ best efforts141. Also, in both sectors fewer heads from
low disadvantage schools thought there were too many pupils who were
uncooperative142 (Table 4.30).
Again these findings indicate differences in the challenges facing those working in
high versus lower disadvantage contexts.
Table 4.30: Headteacher responses concerning pupil achievement and
cooperation by school FSM band
Question SES Disagree
strongly / moderately
Disagree slightly
Agree slightly
Agree moderately / strongly
Total
FSM 1 and 2
375 (76.8%)
28 (5.7%)
57 (11.7%)
28 (5.7%)
488 (100.0%) This school has too
many pupils who are uncooperative FSM 3
and 4 157
(64.1%) 29
(11.8%) 38
(15.5%) 21
(8.6%) 245
(100.0%)
FSM 1 and 2
326 (66.9%)
46 (9.4%)
75 (15.4%)
40 (8.2%)
487 (100.0%)
This school has too many pupils who achieve poorly in spite of teachers’ best efforts
FSM 3 and 4
113 (23.2%)
24 (4.9%)
69 (14.2%)
39 (8.0%)
245 (100.0%)
141 Primary: χ²=41.27, df=3, p<0.001; Gamma=0.34, p<0.001; Secondary: Gamma=0.19, p<0.05 142 Primary: χ²=14.72, df=3, p<0.01; Gamma=0.36, p<0.01; Secondary: χ²=10.17, df=3, p<0.05; Gamma=0.28, p<0.01

109
Key Staff Perceptions
• Workload volume
Secondary Key Staff from high disadvantage schools were more likely than their
counterparts from low disadvantage schools to agree strongly that the size of
their class(es) allows them to adequately differentiate their teaching between
pupils143. In the headteacher survey, however, a similar pattern of responses was
found for both the primary and the secondary sample.
Interestingly, when Key Staff were asked whether the amount of administrative
work required of them is not excessive, slightly higher proportions of key staff
from high disadvantage schools (N=41, 18%) than their counterparts from low
disadvantage schools (N=50, 14%) reported strong agreement144. This may
reflect differences in staffing levels.
• Workload complexity
For both primary and secondary schools, key staff from low disadvantage schools
reported stronger disagreement when asked whether they have too many pupils
who achieve poorly in spite of their best efforts145. (Table 4.31) This is in line with
headteachers’ responses. Secondary key staff from low disadvantage schools
reported stronger disagreement when asked whether they have too many pupils
who are uncooperative146 (Table 4.32). Again, a similar pattern of disagreement
was found for both the primary and the secondary headteacher sample.
Table 4.31: Key staff responses indicating the degree to which they agreed with
the statement “I have too many pupils who achieve poorly in spite of my best
efforts”
Sector SES Strongly disagree
Moderately disagree
Slightly disagree
Slightly agree
Moderately agree
Strongly agree
Total
FSM 1 and 2
171 (47.0%)
84 (23.1%)
39 (10.7%)
46 (12.6%)
17 (4.7%)
7 (1.9%)
364 (100.0%)
Primary FSM 3 and 4
85 (37.6%)
44 (19.5%)
27 (11.9%)
39 (17.3%)
24 (10.6%)
7 (3.1%)
226 (100.0%)
FSM 1 and 2
359 (44.8%)
175 (21.8%)
105 (13.1%)
116 (14.5%)
37 (4.6%)
9 (1.1%)
801 (100.0%)
Secondary FSM 3 and 4
115 (33.8%)
71 (20.9%)
45 (13.2%)
62 (18.2%)
23 (6.8%)
24 (7.1%)
340 (100.0%)
143 χ²=22.19, df=5, p<0.001 144 χ²=11.67, df=5, p<0.05 145 Primary: χ²=13.96, df=5, p<0.05 and Secondary: χ²=40.37, df=5, p<0.001 146 χ²=26.60, df=5, p<0.01; Gamma=0.21, p<0.001

110
Table 4.32: Secondary key staff responses indicating the degree to which they
agreed with the statement “I have too many pupils who are uncooperative”
SES Strongly disagree
Moderately disagree
Slightly disagree
Slightly agree
Moderately agree
Strongly agree
Total
FSM 1 and 2
349 (43.5%)
178 (22.2%)
101 (12.6%)
109 (13.6%)
45 (5.6%)
20 (2.5%)
802 (100.0%)
FSM 3 and 4
110 (32.4%)
77 (22.6%)
43 (12.6%)
55 (16.2%)
30 (8.8%)
25 (7.4%)
370 (100.0%)
Total 459
(39.2%) 255
(21.8%) 144
(12.3%) 164
(14.0%) 75
(6.4%) 45
(3.8%) 1172
(100.0%)
With regards to access to teaching resources, those from high disadvantage
schools were more likely to agree strongly to it. This was found for both
primary147 and secondary schools148 and may reflect more favourable resource
allocations to such schools.
Again, these findings indicate differences in the challenges facing those working in
high versus low disadvantage contexts in terms of pupil characteristics rather
than in terms of resources available to meet needs.
4.8.2 School improvement groups
Headteacher Perceptions
• Workload volume
The school’s improvement group was associated with heads’ views on different
items in relation to workload volume for the primary and the secondary sample.
At the primary level heads in schools from the High Start Group were less likely
to report that their schools had too many pupils who were uncooperative149. Three
quarters of heads from the Low Start Group (N=120, 75%), compared with 85%
(N=80) of those in the Moderate Start Group and 90% (N=111) in the High Start
Group, disagreed moderately or strongly that there were too many uncooperative
pupils in their schools.
At the secondary level heads in the Low Start group had more favourable
147 χ²=12.97, df=5, p<0.05; Gamma=0.22, p<0.01 148 χ²=18.65, df=5, p<0.01; Gamma=0.16, p<0.01 149 χ²=14.53, df=6, p<0.05; Gamma=-0.35, p<0.01

111
responses to the items concerned with class size (Table 4.33):
i) Three quarters of heads (N=125) in the Low Start Group disagreed
moderately or strongly that teachers in their schools taught an excessive
number of pupils, compared with 68% (N=51) of those in the Moderate
Start Group and 63% (N=72) in the High Start Group150;
ii) 78% (N=131) of heads in Low Start Group schools, compared with 64%
(N=48) of the Moderate Start and 57% (N=65) of the High Start
improvement groups reported a high level of disagreement with the item
indicating that the size of classes made unreasonable demands on the
time required for preparation and marking in their schools151;
iii) The majority of heads in the Low Start Group (N=104, 62%) felt that the
size of classes allowed teachers to adequately differentiate their teaching
between pupils whereas less than half of heads in the other two groups
reported so (the Moderate Start Group: 47%; the High Start Group: 49%).
150 Gamma=0.20, p<0.05 151 χ²=18.08, df=6, p<0.01; Gamma=0.33, p<0.001

112
Table 4.33: Secondary headteacher responses concerning class size by
improvement group
Question Improvement
Group
Disagree strongly /
moderately
Disagree slightly
Agree slightly
Agree moderately / strongly
Total
Low Start Group
125 (74.9%)
26 (15.6%)
13 (7.8%)
3 (1.8%)
167 (100.0%)
Moderate Start Group
51 (68.0%)
11 (14.7%)
9 (12.0%)
4 (5.3%)
75 (100.0%)
Teachers in this school teach an excessive number of pupils High Start
Group 72
(62.6%) 23
(20.0%) 12
(10.4%) 8
(7.0%) 115
(100.0%)
Low Start Group
131 (78.4%)
19 (11.4%)
11 (6.6%)
6 (3.6%)
167 (100.0%)
Moderate Start Group
48 (64.0%)
11 (14.7%)
11 (14.7%)
5 (6.7%)
75 (100.0%)
The size of classes makes unreasonable demands on the time required for preparation and marking
High Start Group
65 (56.5%)
22 (19.1%)
22 (19.1%)
6 (5.2%)
115 (100.0%)
Low Start Group
13 (7.8%)
13 (7.8%)
37 (22.2%)
104 (62.3%)
167 (100.0%)
Moderate Start Group
6 (8.0%)
12 (15.8%)
21 (28.0%)
35 (46.7%)
75 (100.0%)
The size of my classes allows teachers to adequately differentiate their teaching between pupils High Start
Group 7
(6.1%) 23
(20.0%) 29
(25.2%) 56
(48.7%) 115
(100.0%)
This may reflect differences in the resources available and strategies for size of
classes in such schools.
• Workload complexity
In both sectors, heads in schools from the High Start Group were, relatively, less
likely than heads in the other two improvement groups to report that the school
had too many pupils who were uncooperative152, or who achieved poorly despite
teachers’ best efforts153 (Figure 4.7 and Figure 4.8).
152 Primary: χ²=14.53, df=6, p<0.05; Gamma=-0.35, p<0.01 153 Primary: χ²=37.27, df=6, p<0.001; Gamma=-0.46, p<0.001

113
0%
10%
20%
30%
40%
50%
60%
70%
80%
90%
100%
Low -Mod/High Mod-HigherMod/High
Stable High/High-Higher
Agreemoderately/stronglyAgree slightly
Disagreeslightly
Disagreemoderately/strongly
(N=167) (N=115)(N=75)
0%
10%
20%
30%
40%
50%
60%
70%
80%
90%
100%
Low -Mod/High Mod-HigherMod/High
Stable High/High-Higher
Agreemoderately/stronglyAgree slightly
Disagreeslightly
Disagreemoderately/strongly
(N=160) (N=123)(N=94)
0%
10%
20%
30%
40%
50%
60%
70%
80%
90%
100%
Low -Mod/High Mod-HigherMod/High
Stable High/High-Higher
Agreemoderately/stronglyAgree slightly
Disagreeslightly
Disagreemoderately/strongly
(N=160) (N=123)(N=94)
0%
10%
20%
30%
40%
50%
60%
70%
80%
90%
100%
Low -Mod/High Mod-HigherMod/High
Stable High/High-Higher
Agreemoderately/stronglyAgree slightly
Disagreeslightly
Disagreemoderately/strongly
(N=167) (N=115)(N=74)
Figure 4.7: Heads’ views on the number of pupils who were uncooperative across
three improvement groups
a Primary b Secondary
Figure 4.8: Heads’ views on the number of pupils who achieved poorly despite
teachers’ best efforts across three improvement groups
a Primary b Secondary
For primary schools, heads in the High Start group (N=99, 81%) were more likely
to indicate that teachers had a significant amount of autonomy over decisions
about what happened in their classes compared with those in the other two
improvement groups (the Moderate Start Group: N=63, 67%; the Low Start
Group: N=109, 68%)154.
This may suggest that teacher autonomy may be viewed as less important in
comparison with collaboration and consistency of approach in schools that are
successful in raising attainment in difficult circumstances and from a low base.
For the secondary sample heads in schools from the High Start Group (N=112,
154 Gamma=0.19, p<0.05

114
97%) were more likely to agree that the atmosphere throughout their schools
encouraged pupils to learn155. A slightly lower proportion of heads in the other
two improvement groups indicated so although this was still the vast majority
(the Moderate Start Group: N=70, 93%; the Low Start Group: N=146, 87%).
Key Staff Perceptions
• Workload volume
Compared with headteacher perceptions, key staff views were somewhat less
favourable in terms of whether they teach an excessive number of pupils, but the
pattern of differences was broadly in line with the headteachers by improvement
group. Primary staff from the Moderate Start Group were the most likely to
disagree strongly (N=91, 61%) to it followed by those from the Low Start Group
(N=144, 56%) and the High Start Group (N=95, 51%). Secondary key staff from
the Low Start Group were most likely to disagree strongly to it156, in line with
findings from the headteacher survey.
Secondary staff from the Low Start Group (N=176, 35%) were the most likely to
disagree strongly that the size of their class(es) makes unreasonable demands on
the time required for preparation and marking157. Almost equal proportions of
staff from the Moderate Start (N=60, 25%) and the High Start groups (N=100,
26%) disagreed strongly to it. This, again, corresponds with results of the
headteacher survey. By contrast 11% of secondary staff from the Low Start group
agreed moderately or strongly with the statement, as did 15% of the Moderate
Start group and 13% of the High Start group.
• Workload complexity
More variation was found within the secondary sample in relation to school
improvement groups. Overall, key staff from schools in the High Start Group
reported the most positive views compared with staff from schools in the other
two improvement groups, broadly in line with findings from the headteacher
survey:
i. When asked whether they have too many pupils who are uncooperative,
they were more likely to disagree158 (see Figure A in Appendix X);
ii. When asked whether they have too many pupils who achieve poorly in
155 χ²=14.63, df=6, p<0.05; Gamma=0.52, p<0.01 156 χ²=30.70, df=10, p<0.01 157 χ²=19.83, df=10, p<0.05 158 χ²=43.15, df=10, p<0.001; Gamma=-0.2, p<0.001

115
spite of their best efforts, they showed stronger disagreement159 (see
Figure B in Appendix X);
iii. When asked about whether the atmosphere throughout the school
encourages pupils to learn, they were most likely to agree strongly160.
On the other hand, key staff from the Moderate and High Start Groups were most
likely to agree strongly or moderately that they have a significant amount of
autonomy over decisions about what happens in their classes161. The proportion
of staff in the Low Start Group was still large but lower.
Within primary schools, significant variation was noted only for one item on
workload complexity concerned with whether many pupils achieved poorly in spite
of teachers’ best efforts. Those from the Moderate Start Group were the most
likely to disagree strongly to it162. However, when taken together moderate and
strong disagreement, those from the High Start Group were the most likely to
disagree that this was the case, in line with the results for headteachers.
4.9 Building and Sustaining Improvement: The Extent of
Change
4.9.1 Changes in school conditions over time: disciplinary climate
Headteachers and key staff were surveyed to explore perceptions of the extent of
change in practice of the last three years in a range of aspects related to school
climate and culture.
Headteacher perceptions
Where change was reported for both samples it suggested some or a lot of
improvement rather than decline in pupil behaviour over the last three years. For
both the primary and the secondary sample there were significant differences
related to the three school improvement groups.
159 χ²=67.41, df=10, p<0.001; Gamma=-0.27, p<0.001 160 χ²=13.85, df=6, p<.05 161 χ²=20.53, df=10, p<0.05 162 χ²=19.52, df=10, p<0.05
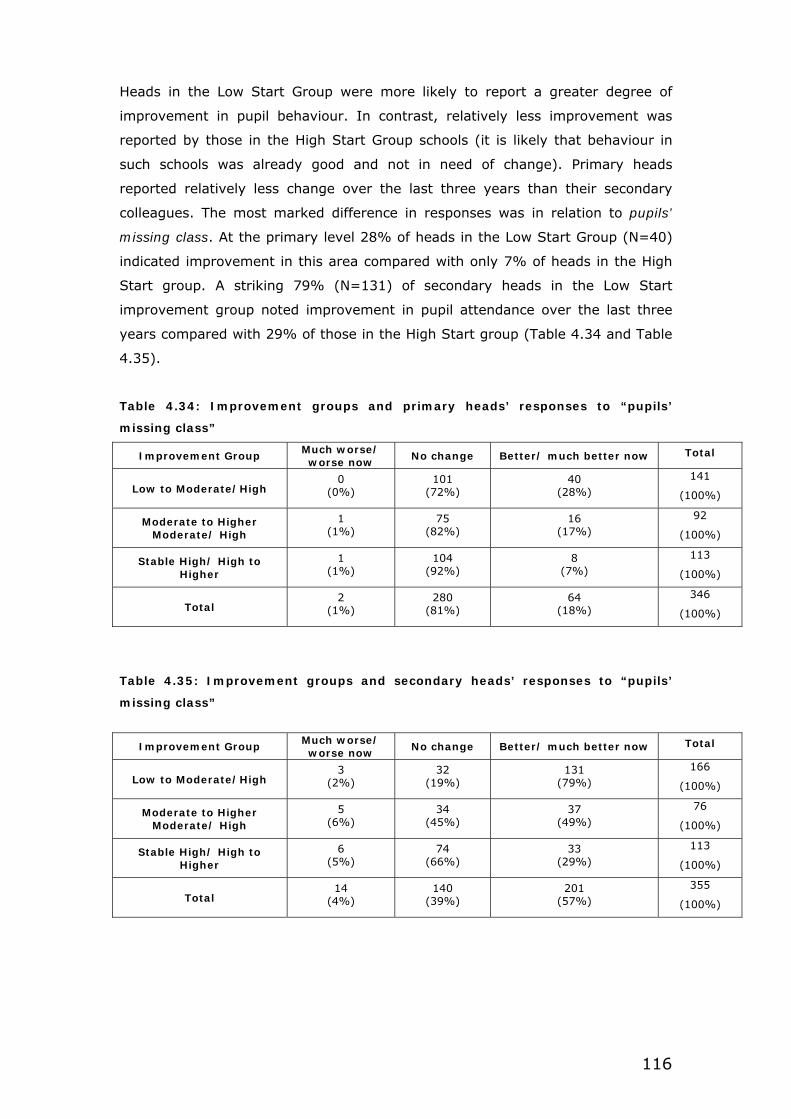
116
Heads in the Low Start Group were more likely to report a greater degree of
improvement in pupil behaviour. In contrast, relatively less improvement was
reported by those in the High Start Group schools (it is likely that behaviour in
such schools was already good and not in need of change). Primary heads
reported relatively less change over the last three years than their secondary
colleagues. The most marked difference in responses was in relation to pupils’
missing class. At the primary level 28% of heads in the Low Start Group (N=40)
indicated improvement in this area compared with only 7% of heads in the High
Start group. A striking 79% (N=131) of secondary heads in the Low Start
improvement group noted improvement in pupil attendance over the last three
years compared with 29% of those in the High Start group (Table 4.34 and Table
4.35).
Table 4.34: Improvement groups and primary heads’ responses to “pupils’
missing class”
Improvement Group Much worse/ worse now
No change Better/ much better now Total
Low to Moderate/High 0
(0%) 101
(72%) 40
(28%)
141
(100%)
Moderate to Higher Moderate/ High
1 (1%)
75 (82%)
16 (17%)
92
(100%)
Stable High/ High to Higher
1 (1%)
104 (92%)
8 (7%)
113
(100%)
Total 2
(1%) 280
(81%) 64
(18%)
346
(100%)
Table 4.35: Improvement groups and secondary heads’ responses to “pupils’
missing class”
Improvement Group Much worse/ worse now
No change Better/ much better now Total
Low to Moderate/High 3
(2%) 32
(19%) 131
(79%)
166
(100%)
Moderate to Higher Moderate/ High
5 (6%)
34 (45%)
37 (49%)
76
(100%)
Stable High/ High to Higher
6 (5%)
74 (66%)
33 (29%)
113
(100%)
Total 14
(4%) 140
(39%) 201
(57%)
355
(100%)

117
Key Staff Perceptions
• Pupil attendance
Key staff perceptions supported those of the heads in the survey in terms of the
degree of improvement in non academic areas.
When the key staff were asked about pupils’ lateness to lessons and school,
pupils’ absenteeism, pupils’ missing class and pupils’ turnover, between 30%-
60% respondents reported no change. Overall the majority (N=1,058, 62%)
reported no change for pupils’ turnover. In contrast, more than 30% reported
that it is better/much better now (see Tables A and B in Appendix XIII).
Sector differences
In terms of sector differences, some patterns are similar to those noticed in
previous sections. When asked about pupils’ absenteeism and pupils’ lateness to
lessons and school, primary key staff were more likely to report that they are
better/much better now, compared with their colleagues in secondary schools.
However, when asked about pupils’ missing classes and their turnover, more
secondary key staff than their primary counterparts were likely to report
improvement163 (see Tables A and B in Appendix XIII).
• Pupil behaviour
Key staff were asked to report on the extent of improvements over the last three
years in physical conflict and bullying among pupils, vandalism of school property,
physical and verbal abuse of teachers as well as level of pupil misbehaviour
(Table 4.36).
Among these, the highest number of key staff reported no change for physical
abuse of teachers and the lowest number reported no change when asked about
pupil misbehaviour. Between 30%-50% staff reported improvements with regards
to the above items – a greater proportion of key staff reported improvements in
terms of reductions in bullying among pupils while the lowest (30%) was noted
for reductions in physical abuse of teachers (note such abuse is very rare in most
schools).
163 χ²= 171.18, df=5, p<0.001 and χ²=41.49, df=6, p<0.001

118
Table 4.36: Key staff responses to questions concerning pupil behaviour
To what extent do you consider that these things
have changed over the past three years?
Much worse now
Worse now
No change
now
Better now
Much better now
Total
Physical conflict among pupils 10 (0.6%)
113 (6.5%)
777 (44.9%)
613 (35.4%)
218 (12.6%)
1732 (100.0%)
Bullying of all kinds among pupils 8 (0.5%)
71 (4.1%)
769 (44.4%)
687 (39.7%)
194 (11.2%)
1729 (100.0%)
Vandalism of school property 22 (1.3%)
165 (9.6%)
780 (45.1%)
594 (34.3%)
227 (13.1%)
1727 (100.0%)
Physical abuse of teachers 12 (0.7%)
59 (3.5%)
1107 (65.0%)
311 (18.3%)
211 (12.4%)
1700 (100.0%)
Verbal abuse of teachers 44 (2.6%)
254 (14.7%)
871 (50.5%)
388 (22.5%)
167 (9.7%)
1724 (100.0%)
Level of pupil misbehaviour 33 (1.9%)
276 (15.9%)
593 (34.2%)
617 (35.6%)
212 (12.2%)
1732 (100.0%)
Sector differences
There was a marked sector difference found for all of the above items (Table
4.37). More primary staff than their counterparts in secondary schools reported
improvements in terms of reductions in physical conflict and bullying among
pupils; and improved pupil behaviour.
Higher proportions of primary staff reported no change when asked about
vandalism of school property, physical and verbal abuse of teachers; whereas
their secondary colleagues were more likely to report improvement in relation to
these three items (but it is likely that many of the no change responses in
primaries were related to the rarity of such incidences of teacher abuse).

119
Table 4.37: Key staff responses to questions concerning pupil behaviour by sector
To what extent do
you consider that these
things have changed over
the past three years?
Sector Much worse now
Worse now
No change now
Better now Much better
now Total
Primary 2
(0.3%) 29
(4.9%) 241
(40.6%) 221
(36.3%) 100
(16.8%) 593
(100.0%) Physical conflict among pupils Secondary
8 (0.7%)
84 (7.4%)
536 (47.1%)
392 (34.4%)
118 (10.4%)
1138 (100.0%)
Primary 1
(0.2%) 11
(1.9%) 250
(42.1%) 229
(38.6%) 101
(17.0%) 592
(100.0%) Bullying of all kinds among pupils Secondary
7 (0.6%)
60 (5.3%)
519 (45.6%)
458 (40.3%)
93 (8.2%)
1137 (100.0%)
Primary 5
(0.8%) 29
(4.9%) 323
(54.6%) 138
(23.3%) 94
(15.9%) 589
(100.0%) Vandalism of school property Secondary
17 (1.5%)
136 (12.0%)
457 (40.2%)
395 (34.7%)
133 (11.7%)
1138 (100.0%)
Primary 3
(0.5%) 10
(1.7%) 428
(73.5%) 67
(11.5%) 72
(12.4%) 580
(100.0%) Physical abuse of teachers Secondary
9 (0.8%)
49 (4.4%)
679 (60.6%)
244 (21.8%)
139 (12.4%)
1120 (100.0%)
Primary 4
(0.7%) 26
(4.4%) 386
(65.6%) 91
(15.5%) 79
(13.4%) 586
(100.0%) Verbal abuse of teachers
Secondary 40
(3.5%) 228
(20.0%) 485
(42.6%) 297
(26.1%) 88
(7.7%) 1138
(100.0%)
Primary 4
(0.7%) 42
(7.1%) 233
(39.2%) 204
(34.3%) 110
(18.5%) 593
(100.0%) Level of pupil misbehaviour
Secondary 29
(2.5%) 234
(20.5%) 361
(31.7%) 413
(36.3%) 102
(8.7%) 1139
(100.0%)
School improvement groups
Significant differences were found between all three improvement groups when
asked about change in the discipline climate of the school in last three years. Key
staff from the High Start Group were the most likely to report “no change” for all
items relating to discipline climate (which is likely to reflect a good discipline
climate already in place). In contrast, those from schools in the Low Start Group
were the most likely to report that it is “better now” or “much better now”. This
is in line with the results for headteachers.
Close to half of key staff from the Low Start Group reported that pupils’ lateness
to school and absenteeism had become ‘better now’ (i.e. reduced), 14% thought
lateness was ‘much better’ and 19% that absenteeism was ‘much better’. In
terms of changes in pupils’ motivation for learning, those from both the High and
the Moderate Start Groups were more likely to indicate this was “better now”
compared with those from the Low Start Group.
These results strongly support the view that there is an important association
between changes in the behavioural climate and improvement in academic results

120
(value added progress and attainment levels) particularly for Low Start schools,
those making significant gains from a low base.
4.10 Changes in school conditions over time: the school
Here we examine heads’ and key staff perceptions of the extent of
improvement/change across their school over the last three years. The evidence
from the headteacher and the key staff survey indicated that there was a fairly
strong degree of correspondence in general views on change in school conditions
over time between headteachers and other key staff.
Headteacher Perceptions
For primary and secondary heads the majority indicated considerable
improvements in a range of areas including: commitment and enthusiasm of
staff, an orderly and secure working environment, enhanced local reputation and
improved pupil behaviour and discipline as a result of a whole school approach
(Table 4.38 and Table 4.39). Secondary heads also reported some or a lot of
change in terms of more pupils going into further/higher education (N=230,
64%).
Table 4.38: Headteachers’ perceptions of change in school conditions over time
(primary)
No change A little Some A lot Total
Enhanced commitment and enthusiasm of staff
54 (14.4%)
50 (13.3%)
121 (32.2%)
151 (40.2%)
376
(100%)
Promoted an orderly and secure working environment
79 (21%)
47 (12.5%)
85 (22.5%)
166 (44%)
377
(100%)
Enhanced local reputation 64
(17.1%) 65
(17.3%) 125
(33.3%) 121
(32.3%)
375
(100%)
Improved pupil behaviour and discipline as a result of
a whole school approach
78 (20.7%)
55 (14.6%)
107 (28.5%)
136 (36.2%)
376
(100%)

121
Table 4.39: Headteachers’ perceptions of change in school conditions over time
(secondary)
No change A little Some A lot Total
Enhanced commitment and enthusiasm of staff
32 (8.9%)
49 (13.6%)
150 (41.6%)
130 (36%)
361
(100%)
Promoted an orderly and secure working environment
41 (11.4%)
58 (16.1%)
137 (38%)
125 (34.6%)
361
(100%)
Enhanced local reputation 44
(12.2%) 53
(14.7%) 107
(29.7%) 156
(43.3%)
360
(100%)
Improved pupil behaviour and discipline as a result of
a whole school approach
44 (12.2%)
70 (19.4%)
127 (35.3%)
119 (33.1%)
360
(100%)
This is in line with school effectiveness and improvement research that points to
the importance of the behavioural climate as a key characteristic of effectiveness
(Sammons et al 1997; Teddlie & Reynolds 2000) and the results of previous case
studies of improving and turnaround schools (Haydn 2001, Ofsted 2001).
Secondary heads (N=287, 79%) were relatively more likely to report
improvements in homework policies and practices than primary heads (N=262,
70%). More primary than secondary heads reported no change in staff absence
(44% versus 29%) or mobility (43% versus 32%), but this may indicate an
absence of problems three years before in these areas.
School improvement groups
For both the primary and the secondary sample, heads in the Low Start
improvement group were relatively more likely to indicate a substantial amount of
improvement across their school over the past three years. In contrast, no
change was somewhat more likely to be reported by those in High Start group.
For example, 28.7% (N=45) of primary heads and 29.7% (N=49) of secondary
heads in the Low Start Group indicated “a lot” of improvement in terms of a
reduction in staff mobility in their schools, in contrast to 12.4% (N=15) of
primary heads and 11.4% (N=13) of secondary heads in the High Start Group
(Table 4.40 and Table 4.41).

122
Table 4.40: Improvement groups and primary heads’ responses to “reduction in
staff mobility”
School Improvement Group
No change A little Some A Lot Total
Low to Moderate/High 55
(35%) 22
(14%) 35
(22.3%) 45
(28.7%)
157
(100%)
Moderate to Higher Moderate/ High
41 (43.6%)
18 (19.1%)
22 (23.4%)
13 (13.8%)
94
(100%)
Stable High/ High to Higher
64 (52.9%)
27 (22.3%)
15 (12.4%)
15 (12.4%)
121
(100%)
Total 160 43%
67 18%
72 19%
73 20%
372
100%
Table 4.41: Improvement groups and secondary heads’ responses to “reduction
in staff mobility”
School Improvement Group
No change A little Some A Lot Total
Low to Moderate/High 40
(24.2%) 24
(14.5%) 52
(31.5%) 49
(29.7%)
165
(100%)
Moderate to Higher Moderate/ High
26 (34.2%)
15 (19.7%)
22 (28.9%)
13 (17.1%)
76
(100%)
Stable High/ High to Higher
48 (42.1%)
31 (27.2%)
22 (19.3%)
13 (11.4%)
114
(100%)
Total 114
(32%) 70
(20%) 96
(27%) 75
(21%)
355
(100%)
Over half of secondary heads (50.6%) in the Low Start Group reported a
substantial degree of improvement in terms of an enhanced local reputation, with
less than one in three (30.4%) in the High Start Group who indicated this. A
similar but much less marked pattern was found for the primary sample. Just
over one in three (35.6%) in the Low Start Group indicated a lot of improvement
in this aspect compared with 28.9% of the Stable High/High to High Start group
who reported this.
A substantial degree of improvement in achieving an orderly and secure working
environment was reported by over half of primary heads in the Low Start group
(54%). In contrast, one in three of those in the High Start group (34%) indicated
this. This difference is more noticeable for the secondary sample. Almost half of
secondary heads in the Low Start group (45%) reported a lot of improvement in
this aspect, in contrast to only 18% of those in the High Start group.
A similar pattern of association was also found in the extent of
change/improvements in four other areas: reduction in staff absence, improved

123
homework policies and practice, enhanced commitment and enthusiasm of staff
and improved pupil behaviour and discipline as a result of a whole school
approach.
Key Staff Perceptions
Key staff were also asked about any reduction in staff mobility in the past three
years. One third of the respondents indicated that there had been no change and
another third of the respondents indicated some change. Six out of ten reported
some/a lot of change when asked about enhanced local reputation of the school.
Secondary staff were more likely to report a lot of change than their primary
counterparts.
Between 50%-70% of key staff reported some or a lot of change in terms of
enhanced commitment and enthusiasm of staff, improved homework policies and
practice, and promotion of an orderly and secure working environment over the
past three years (see Tables A and B in Appendix XIV). There is a sharp sector
difference found here, with higher numbers of primary staff reporting a lot of
change compared to those in secondary schools.
School improvement groups
Significant associations were also found between key staff responses and the
three school improvement groups. Overall, those from schools in the Low Start
group were the most likely to report “a lot” of change in last three years with
regards to school conditions. This is broadly in line with the results for
headteachers.
More differences were found within secondary schools than primary schools. In
particular, there was an association between secondary key staff response and
school improvement groups for the following items (Table 4.42):
• Enhanced local reputation;
• Enhanced commitment and enthusiasm of staff;
• Promoted an orderly and secure working environment.

124
Table 4.42: Secondary key staff responses to questions concerning school
improvement over the past 3 years
To what extent has your school experienced improvement in the
following areas in the last 3 years?
Improvement group
No change
A little Some A lot Total
Low Start Group
29 (5.8%)
73 (14.6%)
165 (33.1%)
232 (46.5%)
499 (100.0%)
Moderate Start Group
24 (10.8%)
27 (12.1%)
71 (31.8%)
100 (44.8%)
222 (100.0%)
Enhanced local reputation
High Start Group
71 (20.7%)
46 (13.4%)
120 (35.0%)
106 (30.9%)
343 (100.0%)
Low Start Group
51 (10.2%)
73 (14.6%)
208 (41.6%)
168 (33.6%)
500 (100.0%)
Moderate Start Group
26 (11.7%)
32 (14.4%)
102 (45.9%)
62 (27.9%)
222 (27.9%)
Enhanced commitment and enthusiasm of staff
High Start Group
82 (24.0%)
67 (19.6%)
125 (36.7%)
67 (19.6%)
341 (19.6%)
Low Start Group
42 (8.4%)
78 (15.6%)
177 (35.4%)
203 (40.6%)
500 (40.6%)
Moderate Start Group
27 (12.1%)
45 (20.1%)
89 (39.7%)
63 (28.1%)
224 (28.1%)
Promoted an orderly and secure working environment
High Start Group
88 (25.5%)
56 (16.2%)
112 (32.5%)
89 (25.8%)
345 (25.8%)
For most items related to school conditions, a higher percentage of key staff from
schools in the Moderate Start Group reported “some” change. For example, when
asked about the improved pupil behaviour and discipline as a result of a whole
school approach, “a lot” of change was reported by 47% primary key stage
managers from the Low Start Group schools and 33% of those from schools in
the Moderate Start Group. By contrast, only 28% staff from the Low Start Group
reported “some” change compared with 36% of those from the Moderate Start
Group who indicated this.
Taken together, the survey results for headteachers and key staff support the
view that rapidly improving schools effect improvement across a range of areas to
do with practice, climate and learning conditions that have a mutually reinforcing
impact and help schools to break out of a low attainment state into an upward
trajectory. It appears that such change is particularly associated and marked for
secondary schools with a past history of low performance.
4.11 Changes in structures, culture, and curriculum,
pedagogy and assessment
At the secondary level schools’ improvement is related to the extent of reported
change in leadership practice in relation to almost all the aspects of school
structures, culture, and curriculum, pedagogy and assessment. These aspects

125
were discussed in more detail in Chapters 1, 2 and 3. In contrast, far fewer
associations were found for the primary sample, particularly in relation to change
in school culture.
4.11.1 Changes in structures
Headteacher Perceptions
Primary sector
At the primary level statistically significant differences in the extent of reported
change between the three improvement groups were particularly noted in relation
to building external collaborations (structure) (Table 4.43). Heads in the Low
Start Group were somewhat more likely to report a moderate or a substantial
amount of change in terms of working collaboratively with the LA (Low Start 42%
versus 37% in the Moderate Start Group and 24% in the High Start Group) and
building community support for the school’s improvement efforts (Low Start 39%
versus Moderate Start 28% and High Start 25%).
Table 4.43: Improvement groups and primary heads’ responses to the extent of
change in working collaboratively with the LA
Improvement Group Not at all/ Very little
Little Partially A lot/ very
significantly Total
Low to Moderate/High 34
(21.5%) 24
(15%) 34
(21.5%) 66
(42%)
158
(100%)
Moderate to Higher Moderate/ High
15 (16.3%)
15 (16.3%)
28 (30.4%)
34 (37%)
92
(100%)
Stable High/ High to Higher
26 (21%)
27 (22%)
40 (33%)
29 (24%)
122
(100%)
Total 75
(20%) 66
(18%) 102
(27%) 129
(35%)
372
(100%)
In addition, we found significant associations relating to change in structuring the
organisation. Nearly two thirds of primary heads in the Low Start Group (N=98,
62%) reported a substantial amount of change in leadership practice in relation to
improving internal review procedures in their schools over the last three years,
whereas around half in the Moderate Start Group (N=49, 52%) and less than half
(N=57, 46%) in the High Start Group indicated that this had occurred164 (Table
4.44).
164 Gamma=-0.18, p<0.05

126
Table 4.44: Improvement groups and primary heads’ responses to the extent of
change in improving internal review procedures
Improvement Group Not at all/ Very little
Little Partially A lot/ very
significantly Total
Low to Moderate/High 12
(7.5%) 8
(5%) 41
(25.8%) 98
(61.6%)
159
(100%)
Moderate to Higher Moderate/ High
4 (4.3%)
3 (3.2%)
38 (40.4%)
49 (52.1%)
94
(100%)
Stable High/ High to Higher
11 (8.9%)
8 (6.5%)
47 (38.2%)
57 (46.3%)
123
(100%)
Total 27
(7%) 19
(5%) 126
(34%) 204
(54%)
376
(100%)
Secondary sector
At the secondary level, schools’ improvement group was also found to be related
to greater reported change in structures. In Chapters 1, 2 and 3, change in four
areas of leadership practices was discussed under Structures: i) Structuring the
organisation, ii) School improvement, iii) External and internal collaborations and
iv) Teacher leadership. We found significant differences between the three school
improvement groups and the extent of reported change in relation to almost all
items on structuring the organisation, school improvement and external and
internal collaborations (see Tables A, B and C in Appendix XV). Secondary heads
in the Low Start Group schools were relatively more likely than those in the other
two improvement groups to report a moderate or a substantial amount of change
in leadership practice in all of these areas in their schools over the last three
years.
For example, in terms of structuring the organisation, in total 79% of heads of
the Low Start Group of secondary schools reported a substantial amount of
change in improving internal review procedures, compared with 61% of those in
the High Start Group of schools165 (Table 4.45).
165 χ²=12.91, df=6, p<0.05; Gamma=-0.26, p<0.01

127
Table 4.45: Improvement groups and secondary heads’ responses to the extent
of change in improving internal review procedures
Improvement Group Not at all/ Very little
Little Partially A lot/ very
significantly Total
Low to Moderate/High 11
(6.8%) 6
(3.7%) 17
(10.5%) 128
(79%)
162
(100%)
Moderate to Higher Moderate/ High
4 (5.3%)
4 (5.3%)
17 (22.7%)
50 (66.7%)
75
(100%)
Stable High/ High to Higher
9 (8%)
9 (8%)
25 (22.1%)
70 (61.9%)
113
(100%)
Total 24
(7%) 19
(5%) 59
(17%) 248
(71%)
350
(100%)
Likewise, over half of heads of the Low Start Group (57%), compared with 34%
of those in the High Start Group, reported a substantial amount of change in
ensuring wide participation in decisions about school improvement. Another
example is secondary heads’ responses to the extent of change in helping clarify
the reasons for their schools’ improvement initiatives where 63% of the Low Start
Group reported a lot or very significant change in this aspect compared with just
over half of those in the High Start Group.
Significant differences in the extent of reported change were found between
school improvement groups in relation to all the items on external and internal
collaborations, including: working collaboratively with the Governing Body, the
LA, the SMT/SLT and encouraging collaborative work amongst staff. For example,
the majority of heads of the Low Start Group (N=101, 61%) reported a
substantial amount of change in working collaboratively with SMT/SLT whereas
less than half of those in the High Start Group (N=53, 46%) reported this. Also,
42% (N=69) of secondary heads in the Low Start Group, compared with only one
in five (N=23, 20%) of those in the High Start Group, indicated a lot of change in
working collaboratively with the LA (Table 4.46).

128
Table 4.46: Improvement groups and secondary heads’ responses to the extent
of change in working collaboratively with the LA
Improvement Group Not at all/ Very little
Little Partially A lot/ very
significantly Total
Low to Moderate/High 36
(21.8%) 21
(12.7%) 39
(23.6%) 69
(41.8%)
165
(100%)
Moderate to Higher Moderate/ High
20 (26.3%)
11 (14.5%)
23 (30.3%)
22 (28.9%)
76
(100%)
Stable High/ High to Higher
40 (34.8%)
20 (17.4%)
32 (27.8%)
23 (20%)
115
(100%)
Total 96
(27%) 52
(15%) 94
(26%) 114
(32%)
356
(100%)
Key Staff Perceptions
In contrast to primary headteachers’ results, primary key stage managers’
responses did not differ based on the improvement group of the schools. For
secondary schools, the responses differed for three items related to changes in
school structure. For all these items on headteachers’ leadership style in relation
to school structures, secondary key staff from the Low Start Group schools were
most likely to agree strongly and those from schools in the High Start Group were
most likely to agree moderately to them compared with their counterparts (Table
4.47):
• Works in collaboration with other schools166;
• Ensures wide participation in decisions about school improvement167;
• Works collaboratively with the Local Authority (LA)168 .
166 χ²=24.85, df=10, p<0.01 167 χ²=26.84, df=10, p<0.01 168 χ²=29.73, df=10, p<0.01

129
Table 4.47: Secondary key staff responses to questions concerning their
headteachers’ leadership style in relation to school structures
Question Improvement
group Disagree strongly
Disagree Moderately
Disagree slightly
Agree slightly
Agree moderately
Agree strongly
Total
Low Start Group
0 (0.0%)
0 (0.0%)
5 (1.0%)
38 (7.6%)
145 (29.1%)
311 (62.3%)
499 (100.0%)
Moderate Start Group
0 (0.0%)
0 (0.0%)
2 (0.9%)
15 (6.9%)
66 (30.6%)
133 (61.6%)
216 (100.0%)
Works collaborative with the Local Authority (LA)
High Start Group
3 (0.9%)
2 (0.6%)
11 (3.2%)
29 (8.5%)
129 (37.8%)
167 (49.0%)
341 (100.0%)
Low Start Group
12 (2.4%)
14 (2.8%)
29 (5.7%)
90 (17.7%)
145 (28.5%)
218 (42.9%)
508 (100.0%)
Moderate Start Group
6 (2.7%)
7 (3.1%)
14 (6.2%)
31 (13.8%)
83 (36.9%)
84 (37.3%)
225 (100.0%)
Ensures wide participation in decisions about school improvement High Start
Group 9
(2.6%) 17
(4.8%) 25
(7.1%) 65
(18.5%) 139
(39.5%) 97
(27.6%) 352
(100.0%) Low Start Group
1 (0.2%)
3 (0.6%)
9 (1.8%)
67 (13.3%)
172 (34.1%)
252 (50.0%)
504 (100.0%)
Moderate Start Group
0 (0.0%)
1 (0.4%)
8 (3.6%)
28 (12.5%)
81 (36.2%)
106 (47.3%)
224 (100.0%)
Works in collaboration with other schools High Start
Group 3
(0.9%) 7
(2.0%) 19
(5.5%) 54
(15.7%) 128
(37.2%) 133
(38.7%) 344
(100.0%)
4.11.2 Changes in culture
Headteacher Perceptions
Interestingly no clear pattern of association between schools’ improvement group
and heads’ reported change in school culture was found at the primary level.
However, for secondary schools statistically significant differences in the extent of
reported change were found between the three improvement groups in relation to
almost all the items on culture (see Appendix VII). This may suggest that
achieving cultural change may be relatively more important for the improvement
of pupil attainment in secondary schools, particularly for schools starting from a
low attainment base.
These items were categorised as setting directions, developing people and
managing the teaching and learning programme in Chapters 1, 2 and 3. Again,
heads in the Low Start Group schools tended to report more change in practice
relating to culture over the past three years compared with their colleagues in the
other two improvement groups.
For example, over half of the heads of the Low Start Group of secondary schools
(N=87, 52%) indicated a substantial degree of change in demonstrating high
expectations for pupil behaviour, compared with 36% (N=41) of those in the
Stable High/High to Higher group of schools (Table 4.48).

130
Table 4.48: Improvement groups and secondary heads’ responses to the extent
of change in demonstrating high expectations for pupil behaviour
Improvement Group Not at all/ Very little
Little Partially A lot/ very
significantly Total
Low to Moderate/High 28
(16.9%) 14
(8.4%) 37
(22.3%) 87
(52.4%)
166
(100%)
Moderate to Higher Moderate/ High
19 (25.3%)
8 (10.7%)
18 (24%)
30 (40%)
75
(100%)
Stable High/ High to Higher
28 (24%)
19 (18.5%)
27 (23.5%)
41 (35.7%)
115
(100%)
Total 75
(21%) 41
(12%) 82
(23%) 158
(44%)
356
(100%)
A lot or very significant change in demonstrating high expectations for pupil
achievement and for staff’s work with pupils were reported by 64% (N=107) and
59% (N=98) of secondary heads in the Low Start Group respectively, compared
with 50% (N=58) and 42% (N=48) of those in the High Start Group of schools.
In addition, half of secondary heads in the Low Start Group (N=84, 50%)
indicated a substantial amount of change in developing an atmosphere of caring
and trust, in contrast to 39% (N=44) of those in the High Start Group who
reported this, and only 29% of those in the Moderate Start Group (Table 4.49).
Table 4.49: Improvement groups and secondary heads’ responses to the extent
of change in developing an atmosphere of caring and trust
Improvement Group Not at all/ Very little
Little Partially A lot/ very
significantly Total
Low to Moderate/High 31
(18.6%) 20
(12%) 32
(19.2%) 84
(50.3%)
167
(100%)
Moderate to Higher Moderate/ High
26 (34.2%)
9 (11.8%)
19 (25%)
22 (28.9%)
76
(100%)
Stable High/ High to Higher
32 (28.3%)
18 (15.9%)
19 (16.8%)
44 (38.9%)
113
(100%)
Total 89
(25%) 47
(13%) 70
(20%) 150
(42%)
356
(100%)
Key Staff Perceptions
Interestingly, there were no significant relationships found between the three
improvement groups and the way key staff responded to items related to school
culture in either sector.

131
4.11.3 Changes in curriculum, pedagogy and assessment
Headteacher Perceptions
There were significant associations between schools’ improvement group and the
amount of change in leadership practice reported in relation to curriculum,
pedagogy and assessment, but these were most evident for responses by heads
in the secondary sector. This was particularly noted in terms of the use of
coaching, mentoring and class observation, and assessment to improve teaching
and the use of data.
Primary sector
For the primary sample, heads in the Low Start Group were somewhat more likely
to report a moderate or a substantial amount of change in terms of using
coaching and mentoring to improve the quality of teaching169, encouraging staff
to use data in their work170 and encouraging staff to use data in planning for
individual pupil needs171 (Table 4.50).
169 χ²=17.20, df=6, p<0.01 170 χ²=13.13, df=6, p<0.05; Gamma=-0.26, p<0.01 171 Gamma=-0.17, p<0.05

132
Table 4.50: Primary headteacher responses to questions concerning their
leadership style in relation to curriculum, pedagogy and assessment
To what extent do you believe your actions
have changed in relation to the following over the past three
years?
Improvement group
Not at all / Very little
Little Partially A lot / Very significantly
Total
Low Start Group
28 (17.5%)
15 (9.4%)
45 (28.1%)
72 (45.0%)
160 (100.0%)
Moderate Start Group
13 (13.8%)
13 (13.8%)
37 (39.4%)
31 (33.0%)
94 (100.0%)
Using coaching and mentoring to improve quality of teaching High Start
Group 13
(10.8%) 24
(20.0%) 49
(40.8%) 34
(28.3%) 120
(100.0%) Low Start Group
7 (4.4%)
4 (2.5%)
20 (12.5%)
129 (80.6%)
129 (100.0%)
Moderate Start Group
5 (5.3%)
4 (4.3%)
21 (22.3%)
64 (68.1%)
94 (100.0%)
Encouraging staff to use data in their work
High Start Group
7 (5.7%)
11 (9.0%)
25 (20.5%)
79 (64.8%)
122 (100.0%)
Low Start Group
9 (5.7%)
6 (3.8%)
26 (16.4%)
118 (74.2%)
159 (100.0%)
Moderate Start Group
7 (7.4%)
2 (2.1%)
22 (23.4%)
63 (67.0%)
94 (100.0%)
Encouraging all staff to use data in planning for individual pupil needs High Start
Group 8
(6.6%) 12
(9.8%) 25
(20.5%) 77
(63.1%) 122
(100.0%)
Secondary sector
A similar pattern of association was found for the secondary sample in relation to
the three items (Table 4.51). For secondary heads, relatively more change was
also reported by those in the Low Start Group in relation to using coaching and
mentoring and using data to improve teaching and learning. Half of secondary
heads in the Low Start Group (N=85, 52%) reported a lot of change in this
aspect, compared with 40% of those in the High Start Group.
In the secondary sector the schools’ improvement group was also associated with
the amount of reported change in relation to other items on class observation and
assessment. In particular, in terms of class observation, heads in the Low Start
Group were relatively more likely to report a substantial degree of change relating
to regularly observing classroom activities172 and working with teachers to
improve their teaching after observing classroom activities173 (Table 4.52).
Relatively more change in leadership practice was also reported by heads in this
improvement group for items related to incorporating research evidence into their
decision making to inform practice174 and using pupil achievement data to make
172 χ²=17.16, df=6, p<0.01; Gamma=-0.15, p<0.05 173 Gamma=-0.17, p<0.05 174 χ²=17.16, df=6, p<0.01; Gamma=-0.18, p<0.01

133
most decisions about school improvement175.
Table 4.51: Secondary headteacher responses to questions concerning their
leadership style in relation to curriculum, pedagogy and assessment
To what extent do you believe your actions
have changed in relation to the following over the past three
years?
Improvement group
Not at all / Very little
Little Partially A lot / Very significantly
Total
Low Start Group
11 (6.7%)
15 (9.2%)
52 (31.9%)
85 (52.1%)
163 (100.0%)
Moderate Start Group
12 (16.0%)
8 (10.7%)
22 (28.9%)
33 (44.0%)
75 (100.0%)
Using coaching and mentoring to improve quality of teaching High Start
Group 14
(12.5%) 15
(13.4%) 38
(33.9%) 45
(40.2%) 112
(100.0%) Low Start Group
9 (5.6%)
6 (3.7%)
11 (6.8%)
136 (84.0%)
162 (100.0%)
Moderate Start Group
6 (7.9%)
2 (2.7%)
16 (21.3%)
51 (68.0%)
75 (100.0%)
Encouraging staff to use data in their work
High Start Group
9 (8.0%)
7 (6.3%)
18 (16.1%)
78 (69.6%)
112 (100.0%)
Low Start Group
9 (5.5%)
7 (4.3%)
18 (11.0%)
129 (79.1%)
163 (100.0%)
Moderate Start Group
6 (8.1%)
2 (2.7%)
18 (24.3%)
48 (64.9%)
74 (100.0%)
Encouraging all staff to use data in planning for individual pupil needs High Start
Group 9
(8.0%) 5
(4.5%) 26
(23.2%) 72
(64.3%) 112
(100.0%)
Table 4.52: Secondary headteacher responses to questions concerning their
leadership style in relation to classroom observation
To what extent do you believe your actions
have changed in relation to the following over the past three
years?
Improvement group
Not at all / Very little
Little Partially A lot / Very significantly
Total
Low Start Group
17 (10.4%)
15 (9.1%)
26 (15.9%)
106 (64.6%)
164 (100.0%)
Moderate Start Group
13 (17.3%)
8 (10.7%)
24 (32.0%)
30 (40.0%)
75 (100.0%)
Regularly observing classroom activities High Start
Group 14
(12.5%) 17
(15.2%) 19
(17.0%) 62
(55.4%) 112
(100.0%) Low Start Group
14 (8.6%)
19 (11.7%)
51 (31.3%)
79 (48.5%)
163 (100.0%)
Moderate Start Group
13 (17.3%)
13 (17.3%)
25 (33.3%)
24 (32.0%)
75 (100.0%)
After observing classroom activities, working with teachers to improve their teaching
High Start Group
15 (13.4%)
18 (16.1%)
38 (33.9%)
41 (36.6%)
112 (100.0%)
For example, 84% of secondary heads in the Low Start Group reported a
substantial amount of change in encouraging staff to use data in their work,
175 χ²=12.86, df=6, p<0.05; Gamma=-0.20, p<0.01

134
compared with 70% of those in the High Start Group. Likewise, substantial
change in regularly observing classroom activities was indicated by 65% of
secondary heads of the Low Start Group, compared with 55% of those in the High
Start Group.
It thus appears that heads in schools that had made rapid improvement from a
low base were likely to have focused more upon the use of a range of specific
strategies to change teachers’ classroom practices, particularly in the secondary
sector. All heads in secondary schools reported considerable change in the extent
to which they encourage the use of data by teachers, but this was a particular
emphasis in Low Start secondary schools.
Key Staff Perceptions
Turning to key staff responses, once again almost equal levels of agreement were
found between schools from the three improvement groups within the primary
sample. In contrast, for secondary schools, key staff responses differed based on
the three improvement groups. This again corresponds with the results for
headteachers.
When the Heads of Departments were asked whether the headteacher in their
school allocates resources strategically based on pupil needs, those from the Low
Start Group schools were the most likely to agree strongly176. When asked
whether the headteacher utilises support staff skills for the benefit of pupil
learning, those from the Moderate Start Group were more likely to agree
strongly/moderately compared with their counterparts in the other improvement
groups177 (Table 4.53).
176 χ²=21.00, df=10, p<0.05 177 χ²=19.30, df=10, p<0.05

135
Table 4.53: Secondary key staff responses to questions concerning their
headteachers’ leadership style in relation to curriculum, pedagogy and
assessment
To what extent do you agree
that the headteacher in
your school does the
following?
Improvement group
Disagree strongly
Disagree moderately
Disagree slightly
Agree slightly
Agree moderately
Agree strongly
Total
Low Start Group
3 (0.6%)
11 (2.2%)
24 (4.7%)
82 (16.1%)
158 (31.1%)
230 (45.3%)
508 (100.0%)
Moderate Start Group
2 (0.9%)
1 (0.4%)
7 (3.1%)
25 (11.1%)
87 (38.7%)
103 (45.8%)
225 (100.0%)
Utilises support staff skills for the benefit of pupil learning High Start
Group 3
(0.9%) 4
(1.2%) 7
(2.0%) 52
(15.0%) 143
(41.3%) 137
(39.6%) 346
(100.0%) Low Start Group
5 (1.0%)
16 (3.2%)
15 (3.0%)
86 (17.1%)
161 (31.9%)
221 (43.8%)
504 (100.0%)
Moderate Start Group
1 (0.4%)
2 (0.9%)
9 (4.0%)
31 (13.9%)
98 (43.9%)
82 (36.8%)
223 (100.0%)
Allocates resources strategically based on pupil needs High Start
Group 6
(1.7%) 3
(0.9%) 12
(3.5%) 66
(19.2%) 126
(36.6%) 131
(38.1%) 344
(100.0%)
4.12 Teaching Policies And Practices
Headteacher Perceptions
Overall, headteachers agreed moderately or strongly with most items, though the
tendency was stronger for primary heads in relation to the item on disruptions to
teaching time are minimised (“agree strongly”: 53% versus 30%). Secondary
heads had somewhat lower agreement about the extent to which the school
timetable provides adequate time for collaborative teacher planning (“agree
strongly”: 21% versus 37%), and teachers’ strategies enable pupils to construct
their own knowledge (“agree strongly”: 8% versus 24%). The large majority
(around 80%) of heads from both sectors believed there were more opportunities
for pupils to take responsibility for their own learning now than three years ago.
This seems to be a strong feature in both sectors.
Secondary heads were more likely than primary heads to indicate moderate to
strong agreement that pupils of similar academic ability were grouped together in
most subject areas (70% versus 50%).

136
School improvement groups
No clear pattern of significant associations was found between schools’ level of
improvement and heads’ views on teaching policies and practices for the primary
sample.
Significant associations, however, were again identified for secondary schools.
Heads in the Low Start Group (N=125, 75%) were somewhat more likely to agree
moderately or strongly that pupils of similar academic ability were grouped
together in most subject areas compared to those in the other two improvement
groups (the Moderate Start Group: N=53, 71%; the High Start Group: N=73,
64%)178. In contrast, those in the High Start Group schools (N=75, 66%) tended
to indicate somewhat stronger agreement than those in the other two
improvement groups that there were more opportunities for pupils to take
responsibility for their own learning now than three years ago179 (the Moderate
Start Group: N=41, 55%; the Low Start Group: N=85, 51%).
Key Staff Perceptions
There was very little evidence of differences in key staff views in relation to
school improvement group in items referring to teaching policies and practices. A
statistically significant difference was noted only for one item in secondary staff
responses in relation to the extent that teachers in their school have a sense of
collective responsibility for pupil learning. Those from schools in the High Start
Group were the most likely to agree strongly to it180. Forty-three per cent of the
key staff from the High Start Group agreed strongly to it compared with 42%
from the Moderate Start Group and 35% from the Low Start Group.
4.13 Extra Curricula Programmes
Headteacher Perceptions Only
Most primary and secondary heads agreed that their schools provided a broad
range of extracurricular activities for children. In addition, around 60% of primary
and secondary heads reported that most pupils regularly participated in at least
one extracurricular activity in their schools. Secondary heads were more likely to
indicate that their school provided after school academic support activities (85%
178 Gamma=-0.19, p<0.05 179 Gamma=0.20, p<0.05 180 χ²=20.42, df=10, p<0.05

137
versus 46% for primaries). However, a little over half of primary (55%) compared
with around four in ten secondary (43%) heads indicated that most of their
teachers participated regularly in at least one extracurricular school activity.
School improvement groups
In both sectors heads in schools of the Low Start Group indicated higher
agreement that their school provided after school academic support activities181.
In all 53% of primary heads and 89% of secondary heads in this improvement
group, compared with 41% of primary heads and 78% of secondary heads in the
High Start Group, reported moderate to strong agreement on this item.
For the primary sample in particular, similar levels of agreement on this item
were noted between heads in the Moderate Start Group (40%) and the High Start
Group (40%). In contrast, at the secondary level those in the Low Start (89%)
and Moderate Start (88%) groups reported similar and much higher levels of
agreement on this item.
In both primary and secondary schools, heads in the High Start Group were
somewhat more likely to agree moderately or strongly that most of their pupils
participated regularly in at least one extracurricular school activity182. In both
sectors around 68% of heads in this improvement group indicated so. There was
no marked difference in heads’ views on this item between the other two
improvement groups (Figures A and B in Appendix XI).
For the primary sample only heads in the High Start Group (N=75, 61%) were
relatively more likely to indicate strong agreement that most of their teachers
participated regularly in at least one extracurricular school activity183, compared
to 58% (N=54) in the Moderate Start Group and 49% (N=79) in the Low Start
Group. This may reflect differences in priorities and in other pressures between
these groups of schools related to their attainment histories.
181 Primary: χ²=16.44, df=6, p<0.05; Gamma=-0.20, p<0.01; Secondary: Gamma=-0.27, p<0.05 182 Primary: Gamma=0.20, p<0.01; Secondary: Gamma=0.20, p<0.01 183 Gamma=0.16, p<0.05

138
4.14 Extended Services
The introduction of extended services is a key feature of recent policy
development in England. There were a number of differences between the
primary and secondary school heads in the extent to which different extended
services were reported as available.
4.14.1 Type of services (headteacher perceptions only)
There were a number of differences between the primary and secondary school
heads in the extent to which different extended services were reported as
available:
• Year round child care from 8am to 6pm was reported as full access
by 28% primary but only 6% secondary schools. No access was indicated
by 32% primary but 64% secondary schools.
• Responses by both samples were more likely to indicate that a varied
menu of activities was provided before and after school (just over 50%
indicating full access to this in both sectors and nearly all of the rest
indicating some access).
• Primary schools were more likely to report swift and easy access to health
and social services (41% primary but only 30% secondary schools noting
full access).
• Primary schools were more likely to report access to parenting support
including structured parenting support programmes (no access was noted
by 25% primary but 42% secondary schools).
In both education sectors heads in the Low Start Group were relatively more
likely to report some or full access to parenting support, including structured
parenting support programme184 (Table 4.54). In contrast, those in the High Start
Group were somewhat more likely to indicate no access to this type of extended
service within their schools, and this tendency appears to be stronger for the
secondary sample (“no access”: secondary 53% versus primary 33%).
184 Primary: χ²=11.36, df=4, p<0.05; Gamma=0.22, p<0.01; Secondary: χ²=15.94, df=4, p<0.01; Gamma=0.31, p<0.001

139
Table 4.54: Headteacher responses to the question “Do you provide some, or full
access to parenting support, including structured parenting support
programmes?”
Sector Improvement group Full access Some access No access Total
Low Start Group 31
(19.5%) 102
(64.2%) 26
(16.4%) 159
(100.0%)
Moderate Start Group 12
(12.8%) 56
(59.6%) 26
(27.7%) 94
(100.0%) Primary
High Start Group 18
(14.6%) 65
(52.8%) 40
(32.5%) 123
(100.0%)
Low Start Group 20
(12.2%) 93
(56.7%) 51
(31.1%) 164
(100.0%)
Moderate Start Group 5
(6.8%) 33
(44.6%) 36
(48.6%) 74
(100.0%) Secondary
High Start Group 7
(6.1%) 47
(40.9%) 61
(53.0%) 115
(100.0%)
For the secondary sample, again, heads from schools in the Low Start Group
(N=61, 37%) were relatively more likely than those in the other two
improvement groups to indicate full access to swift and easy referral to health
and social services185 (25% of the Moderate Start Group and 22% of the High
Start Group respectively). In addition, they were somewhat more likely to report
community access to school facilities186: half (N=83) indicated full access to this
extended services compared with 42% of the Moderate Start Group and 35% of
the High Start Group who reported so.
4.14.2 Management and provision of services (headteacher perceptions
only)
Only a small proportion of primary (N=45, 12%) and secondary (N=41, 12%)
schools relied greatly on an extended schools coordinator/manager, and around
40-46% did not have one in delivering extended services. Partnerships were
used to some extent or greatly by over half the primary (N=241, 64%) and
secondary (N=184, 52%) school sample in providing services, and cluster
relationships with other schools or Children’s services were also noted at a similar
level (50% primaries; 47% secondaries).
Heads reported that their teachers were relied on greatly to run out of hours
activities (49% primary, 44% secondary) or to some extent (41% primary, 48%
secondary). Primary heads in particular reported that their own involvement was
greatly relied on to lead the strategy for extended services (39% primary
185 Gamma=0.23, p<0.01 186 χ²=11.29, df=4, p<0.05; Gamma=0.21, p<0.05

140
compared with 15% of secondary heads). Primary heads were also much more
likely to report great personal involvement in establishing/running extended
services (29% primaries versus 8% secondaries).
For both primary and secondary schools those in the Low Start Group were
somewhat more likely to report great or some reliance on an extended school’s
coordinator/manager in providing extended services187 (Table 4.55). In all 48% of
secondary heads and 42% of primary heads in this improvement group,
compared with 23% of secondary heads and 33% of primary heads in the High
Start Group, indicated that they did so.
Table 4.55: Headteacher responses to the question “To what extent do these
services rely upon an extended schools coordinator/manager?”
Sector Improvement
group Greatly To some
extent Not at all
Not applicable
Total
Low Start Group 26
(16.4%) 41
(25.8%) 73
(45.9%) 19
(11.9%) 159
(100.0%) Moderate Start Group
8 (8.6%)
20 (21.5%)
47 (50.5%)
18 (19.4%)
93 (100.0%)
Primary
High Start Group 11
(8.9%) 30
(24.4%) 54
(43.9%) 28
(22.8%) 123
(100.0%)
Low Start Group 25
(15.2%) 54
(32.9%) 56
(32.9%) 29
(17.7%) 164
(100.0%) Moderate Start Group
7 (9.2%)
22 (28.9%)
32 (42.1%)
15 (19.7%)
76 (100.0%)
Secondary
High Start Group 9
(7.9%) 17
(14.9%) 56
(49.1%) 32
(28.1%) 114
(100.0%)
In both education sectors cluster relationships with other schools or Children’s
services were somewhat more likely to be used greatly or to some extent by
heads in schools from the Low Start Group188 (Table 4.56). More of those in High
Start schools (47% secondaries and 47% primaries) tended to report no reliance
on these cluster relationships in providing extended services within and around
their schools (the Moderate Start Group: 44% primary, 41% secondary; the Low
Start Group: 35% primary, 33% secondary).
187 Primary: Gamma=0.18, p<0.05; Secondary: χ²=19.45, df=6, p<0.01 188 primary: Gamma=0.19, p<0.01; secondary: χ²=23.08, df=6, p<0.01; Gamma=0.32, p<0.001

141
Table 4.56: Headteacher responses to the question “To what extent do these
services rely upon cluster relationships with other schools/Children’s Centres?”
Sector Improvement
group Greatly To some
extent Not at all
Not applicable
Total
Low Start Group 22
(13.8%) 71
(44.7%) 55
(34.6%) 11
(6.9%) 159
(100.0%) Moderate Start Group
9 (9.7%)
32 (34.4%)
41 (44.1%)
11 (11.8%)
94 (100.0%)
Primary
High Start Group 12
(10.2%) 38
(32.2%) 55
(46.6%) 13
(11.0%) 118
(100.0%)
Low Start Group 18
(11.1%) 77
(47.5%) 54
(33.3%) 13
(8.0%) 162
(100.0%) Moderate Start Group
7 (9.2%)
22 (28.9%)
32 (42.1%)
11 (14.7%)
75 (100.0%)
Secondary
High Start Group 9
(7.9%) 17
(14.9%) 56
(49.1%) 23
(20.2%) 114
(100.0%)
For the primary sample, great reliance on the involvement of teachers to run out
of hours activities was relatively more likely to be reported by heads in High Start
schools (N=68, 55%), whereas those in Low Start schools were more likely to
indicate some (N=76, 48%) or no (N=17, 11%) reliance on the involvement of
teachers in providing extended services (Table 4.57). For secondary schools,
partnerships were relatively more likely to be used to some extent or greatly by
heads in Low Start schools (N=96, 60%). By contrast, the figures were less than
half of heads in Moderate Start schools (N=37, 49%) and High Start schools
(N=49, 43%).
Table 4.57: Primary headteacher responses to the question “To what extent do
these services rely upon the involvement of teachers to run out of hours
activities?”
Improvement group Greatly To some
extent Not at all
Not applicable
Total
Low Start Group 65
(40.6%) 76
(47.5%) 17
(10.6%) 2
(1.3%) 160
(100.0%)
Moderate Start Group 50
(53.2%) 34
(36.2%) 8
(8.5%) 2
(2.1%) 94
(100.0%)
High Start Group 68
(55.3%) 44
(35.8%) 7
(5.7%) 4
(3.3%) 123
(100.0%)
Total 183
(48.5%) 154
(40.8%) 32
(8.5%) 8
(2.1%) 377
(100.0%)
These results indicate that proportionally more of the Low Start rapidly improving
schools from a low base tended to be involved in extended schools provision. This
may reflect differences in the needs of the pupil populations and communities
served and availability of resources.
4.15 Summary
This section provides a summary of the results of the analyses of surveys of

142
primary and secondary headteachers and comparisons of the views of key staff
in highly improving/highly effective schools in relation to the characteristics of
these schools (by context and sector). It highlights the similarities and differences
in leadership characteristics and strategies in establishing foundations and
building and sustaining improvement between the three school improvement
groups (i.e. Low Start, Moderate Start and High Start) over the last three years.
It also explores sector differences and those related to school contexts.
4.15.1 Key findings:
1. Differences by School SES Context
• School context is significantly associated with schools’ improvement
groupings. Stable High attaining and effective schools were much more
likely to be low disadvantage schools (measured by % FSM of pupil intake
Bands 3 and 4) whereas highly improved effective schools from a low base
(Low Start group) were relatively more likely to be high disadvantage
schools (measured by school FSM Band 3 and 4).
• High disadvantage secondary schools were relatively more likely to be led
by less experienced headteachers and to have had several changes in
headteacher over the last ten years (3 plus changes).
• Overall, key staff in high disadvantage schools in this sample reported
more positive views on school conditions, school culture and workload
volumes. They were also more likely than their counterparts in less
disadvantaged schools to report higher levels of headteacher efficacy. In
contrast, staff in low disadvantage schools were more likely to report
favourable views about their workload complexity189.
2. Differences by Sector
• Primary headteachers were relatively more likely than their secondary
peers to report improvement in aspects of academic press and school
culture in the past three years. Primary heads gave relatively less
favourable responses than their secondary colleagues to most items
relating to leader self-efficacy although views were generally favourable.
• Primary key staff were more likely than their secondary counterparts to
189 It must be remembered that this study includes only highly improved/highly effective schools and this pattern would be less likely to be found in less successful schools.

143
report positive views on all items related to leadership distribution and
practice. They also reported a substantial amount of change over the last
three years in the school conditions (e.g. disciplinary climate).
• Primary key staff perceived higher levels of leadership practice provided by
the headteacher and deputy headteacher and they were also more likely to
report that leadership practice is provided by the LA. Primary key staff also
perceived higher levels of their own involvement in leadership activities
and collective planning in the school.
3. Differences by School Improvement Group
• In both education sectors stable high effective schools (the High Start
Group) were more likely to have experienced headteachers in post, those
who had been in post for more than eight years.
• Schools making rapid improvement from a low base (those in the Low
Start Group) were relatively more likely to be led by a younger and less
experienced headteacher. Such schools were also more likely to have had
several changes (3 or more) of head in the last decade. It is important to
note that this is likely to link to the finding on school context since
relatively more highly disadvantaged schools were in the rapid
improvement Low Start Group.
• Findings in relation to education sector were also associated with school
improvement group. Differences by school improvement group were more
common and generally stronger for the secondary sample.
• For secondary schools in particular, there were marked differences
between the three improvement groups in relation to the extent of
reported change in almost all the aspects of school structures, culture and
curriculum, pedagogy and assessment. Compared to other areas of change
analysed in our surveys (e.g. academic press, extracurricular programmes
and leadership distribution) where fewer differences were found, these
three areas appeared to have been a strong focus of change and
improvement particularly for secondary heads in the Low Start group. To
achieve rapid and sustained (over three years) improvement from a low
base it appears that a focus on these areas is particularly important,
especially in the larger and more complex organisational context of
secondary schools.

144
• In the secondary sample, the LA was seen to have played a greater role in
the provision of leadership practice by both headteachers and key staff in
the Low Start Group.
• Secondary key staff from Low Start schools were the most likely to report
that SMT/SLT in their schools participate in ongoing, collaborative work
and have a positive role in the development of policies on lesson planning.
• In both sectors we found significant differences between the three school
improvement groups in relation to the use of data to improve the quality
of teaching and learning. Analysis provides evidence for the hypothesis
that effective headteachers promote and ensure that staff adopt evidence-
based approaches to the use of assessment data, intervening early and
monitoring and evaluating continually at school, department and
classroom level. This seems to be particularly important for the
improvement strategies of schools improving from a low attainment base
(the Low Start Group).
• Also in both primary and secondary schools, significant differences were
found between the three school improvement groups in terms of the
extent headteachers reported change/improvement across their school,
including disciplinary climate, reduction of staff mobility and enhanced
commitment and enthusiasm of staff. More improvements/change were
likely to be reported by heads and the key staff in the Low Start
improvement group. This supports the findings on their rapid academic
improvement in the analyses of national assessment and examination
data.
This observation also provides evidence for our hypothesis that effective
headteachers have a positive influence upon the ‘mindset’190 of the school
and its culture and staff and student relationships. This is in line with the
conclusion of the literature review (strong claim 4) that school leaders
tend to improve teaching and learning and pupil outcomes indirectly and
most powerfully through their influence on staff motivation, commitment
and working conditions.
190 A term coined by James et al. (2006)

145
There were also broad similarities between the three improvement groups in
relation to school culture, the way that leadership tasks were distributed or
shared within schools and the kinds of leadership practice provided by SMT/SLT in
school. This suggests that these aspects of leadership practice vary less in
relation to school improvement and effectiveness group and supports the view
that there are some common core features of leadership in all highly
effective/improved schools.
4.16 Key Messages
To our knowledge, this interim analysis is the first example of a survey of highly
effective and improved schools that has sought to explore similarities and
differences in headteacher and key staff perceptions of major features of school
leadership according to their school’s improvement and effectiveness history.
1. The categorisation of schools into three distinctive groups reveals that
there are statistically and educationally significant differences in certain
leadership features and practices. In addition, other important influences are
found to show significant associations with the pattern of staff responses related
to headteachers’ years of experience in total and in their current schools, the
number of headteachers in post in the last ten years, school sector and socio-
economic context.
2. There are important relationships between school context and the
school improvement group, and between school context and
headteachers’ time in post. The less stable leadership histories of schools,
particularly secondary schools in high disadvantage, challenging contexts is
evident and is a feature that points to the likely importance of supportive
initiatives by NCSL and others in relation to leadership, training, development and
succession planning.
3. There are distinct features that differentiate schools in the three start
improvement groups. There is strong evidence that schools in the Low to
Moderate/High group had made greater improvements in changing
school culture, climate and addressing teaching and learning and use of
performance data during the last three years.
4. Participants from Low Start schools were significantly more likely to
report substantial improvement in pupil behaviour, attendance, attitude
and motivation. These aspects are likely to be important precursors and

146
facilitators for improvement in students’ academic achievements, especially in
high disadvantage contexts. These findings are in accordance with those of
reviews of school effectiveness and improvement research (Sammons 2007).
5. Headteachers in the Low Start Group were more likely to prioritise
strategies to improve teaching and learning and the use of data than
those in the High Start (stable high effective) Group. This was evident for
schools in both sectors but particularly those in the secondary sector.
Additional data collected from the surveys included details of the three strategies
identified as most influential in improving pupil academic outcomes by the head
teachers and will be analysed to establish which combinations of actions are
perceived to have been most important. Further analyses will help to indicate
which combination of each actions appear to be most frequently adopted by
schools in the three improvement groups and in different contexts. In addition,
qualitative data will be examined to explore patterns of similarities and
differences in approaches between the three improvement groups and schools in
different SES contexts. A follow-up survey of heads and key staff is planned to
further explore aspects identified as potentially important from the initial
integration of quantitative and qualitative evidence.
Structural equation modelling will be used to further examine underlying
dimensions in the responses to both surveys. This will establish whether the
theoretical scales derived from the literature are empirically confirmed in our
sample. In addition, these quantitatively derived dimensions will be related to
hypothesised models of the proposed links between different features of
leadership practice and measures of pupil outcomes and change in outcomes over
time. We will seek to explore their predictive ability, as indicated by relationships
between several measures of change in pupil academic outcomes derived from
the national data sets and from staff and headteacher perceptions of degree of
change in non-academic pupil outcomes collected in the surveys. Combined with
evidence obtained from the qualitative strand, this analysis strategy for the
quantitative strand will help to test and refine models of the hypothesised
relationships between leadership and pupil outcomes (direct/indirect, and
moderating and mediating influences).

Appendices

Contents
Appendix I: Summary Of Responses By Improvement Groups ....................................... i
Appendix II: Headteachers’ Total Years Of Experience By School Improvement Group. ii Experience Of Headteachers And Improvement Groups....................................................... ii
Appendix III: Age Of Headteachers And Improvement Groups .................................... iii Age Of Headteachers And Improvement Groups ............................................................... iii
Appendix IV: Key Staff Perceptions’ Of Leadership Distribution: Associations Between Improvement Groups And Leadership Practice Provided By Sips And Parents .............. iv
Appendix V: Leadership Influence: Persuasion Tactics................................................. vi
Appendix VI: School Conditions: Academic Press ........................................................ vii Key Staff Perceptions Of Academic Press ........................................................................ vii
Appendix VII: Primary And Secondary Key Staff Responses For Items On School Culture .......................................................................................................................... ix
Appendix VIII: Leader Self-Efficacy ............................................................................. xi
Appendix IX: Leader Self-Efficacy And School SES Contexts (Secondary) ................... xii
Appendix X: Three Improvement Groups And Key Staff Responses To Whether They Have Too Many Pupils Who Are Uncooperative............................................................. xv
Appendix XI: Heads’ Views On Pupils’ Participation In Extracurricular School Activity Across Three Improvement Groups............................................................................. xvi
Appendix XII: The kinds of leadership practice provided by SMT/SLT in school........ xvii
Appendix XIII: Keys staff perceptions relating to pupil attendance ........................... xix
Appendix XIV: Key staff perceptions of school improvement over the past 3 years .... xx
Appendix XV: Three improvement groups and secondary headteachers’ responses relating to structuring the organisation, external and internal collaborations, and school improvement.................................................................................................... xxi
Appendix XVI: Primary Headteacher Questionnaire Survey – Wave 1 ...................... xxiv
Appendix XVII: Secondary Headteacher Questionnaire Survey – Wave 1................ xxxii
Appendix XVIII: Primary Key Staff Questionnaire Survey – Wave 1............................. xl
Appendix XIX: Secondary Key Staff Questionnaire Survey – Wave 1......................... xlix

Appendix I: Summary Of Responses By
Improvement Groups
Table 1 shows the numbers of schools for which we received completed head
teacher surveys in each group by sector. Table 2 shows the numbers of responses
received from key staff according to the three improvement groups.
Table 1: Numbers Of Schools Responding To The Head Teacher Survey In Three
Improvement Groups
Primary Secondary Total Improvement Groups
N % N % N %
Low-Moderate/High 160 42 785 45 945 44
Moderate-higher moderate/high 94 25 393 14 487 23
Stable high/ high-higher 123 33 585 25 708 33
Total 377¹ 100 1,763 100 2,140 100
¹ One school has missing value. ² Four schools have missing values.
Table 2: Summary Of Three Improvement Groups (Primary And Secondary) At
Key Staff Response Level
Primary Secondary Total Improvement Groups
N % N % N %
Low-Moderate/High 261 43 524 45 785 45
Moderate-higher moderate/high 153 16 240 13 393 14
Stable high/ high-higher 193 24 392 25 585 25
Total 607 100 1,156 100 1,763 100
i

Appendix II: Headteachers’ Total Years Of
Experience By School Improvement Group
Experience Of Headteachers And Improvement
Groups
The relationship between Headteachers’ total years of experience and school
improvement groups is particularly striking for secondary schools.
Figure A: Headteachers’ Total Years Of Experience By School Improvement
Group (Primary)
0%
10%
20%
30%
40%
50%
60%
70%
80%
90%
100%
0-3 years 4-7 years 8-15 years 16+years
StableHigh/High-HigherMod-HigherMod/High
Low -Mod/High
(N=47) (N=85)(N=127)(N=77)
Figure B: Headteachers’ Total Years Of Experience By School Improvement
Group (Secondary)
0%
10%
20%
30%
40%
50%
60%
70%
80%
90%
100%
0-3 years 4-7 years 8-15 years 16+years
StableHigh/High-HigherMod-HigherMod/High
Low -Mod/High
(N=95) (N=31)(N=69)(N=74)
ii

Appendix III: Age Of Headteachers And
Improvement Groups
Age Of Headteachers And Improvement Groups
Table A shows that younger primary heads were proportionately more likely to be
in post in schools that had made rapid improvement from low to moderate or
moderate to high. (Gamma=0.13, p<0.05). For secondary heads, this tendency
was evident for both the Low to Moderate/High and Moderate to Higher
Moderate/High groups (Table B).
Table A: Headteachers’ Age And Primary School Improvement Group
Improvement Groups Headteachers’
Age Low to Moderate/High
Moderate to Higher Moderate/ High
Stable High/ High to Higher
Total
37 15 21 73 45 or under
(51%) (20%) (29%) (100%)
25 14 23 62 46-50
(40%) (23%) (37%) (100%)
65 36 39 140 51-55
(46%) (26%) (28%) (100%)
31 29 40 100 Over 56
(31%) (29%) (40%) (100%)
158 94 123 375 Total
(42%) (25%0 (33%) (100%)
Table B: Headteachers’ Age And Secondary School Improvement Group
Improvement Groups Headteachers’
Age Low to Moderate/High
Moderate to Higher Moderate/ High
Stable High/ High to Higher
Total
26 6 17 49 45 or under
(53%) (12%) (35%) (100%)
40 15 15 70 46-50
(57%) (21%) (22%) (100%)
65 29 51 145 51-55
(45%) (20%) (35%) (100%)
33 26 32 91 Over 56
(36%) (29%) (35%) (100%)
164 76 115 355 Total (46%) (21%) (32%) (100%)
iii

Appendix IV: Key Staff Perceptions’ Of
Leadership Distribution: Associations
Between Improvement Groups And
Leadership Practice Provided By Sips And
Parents
Figure A: Leadership Practice Provided By Sips And The Three Improvement
Groups (Secondary)
0%
10%
20%
30%
40%
50%
60%
70%
80%
90%
100%
Low-Mod/High(N=475)
Mod-higherMod/high(N=214)
Stable high/high-higher
(N=338)
All the time
A great deal
ModerateamountSome
Infrequently
Rarely / never
Figure B: Leadership Practice Provided By The LA And The Three Improvement
Groups (Primary)
0%
10%
20%
30%
40%
50%
60%
70%
80%
90%
100%
Low-Mod/High(N=255)
Mod-higherMod/high(N=147)
Stable high/high-higher
(N=182)
All the time
A great deal
Moderate amount
Some
Infrequently
Rarely / never
iv

Figure C: Leadership Practice Provided By The LA And The Three Improvement
Groups (Secondary)
0%
10%
20%
30%
40%
50%
60%
70%
80%
90%
100%
Low-Mod/High(N=506)
Mod-higherMod/high(N=228)
Stable high/high-higher
(N=369)
All the time
A great deal
Moderate amount
Some
Infrequently
Rarely / never
v

Appendix V: Leadership Influence:
Persuasion Tactics
There was considerable variation in heads’ responses to these items for both
samples. Some tactics were much more widely reported than other (see Tables
and B).
Table A: Comparisons Of Heads’ Responses To Items On Persuasion Tactics:
Primary
Primary
Not at all/ very little
Little
Partially
A lot
Very significantly
To what extent do you use each of the
following to influence or
persuade others: N % N % N % N % N %
Rational persuasion 2 .5 6 2 77 21 194 52 94 25
Apprising 6 2 26 7 140 38 163 44 37 10
Inspirational appeals 16 4 43 12 150 40 120 32 45 12
Consultation 1 .3 4 1 64 17 214 57 92 25
Ingratiation 82 22 76 21 125 34 75 20 12 3
Personal appeals 198 53 92 25 58 16 20 5 4 1
Exchange 198 53 91 24 69 18 11 3 5 1
Coalition building 86 23 70 19 152 41 56 15 10 3
Legitimating tactics 101 28 91 25 121 33 42 12 8 2
Pressure 182 49 97 26 81 22 13 4 1 .3
Personal support 43 12 33 9 126 34 125 34 46 12
Table B: Comparisons Of Heads’ Responses To Items On Persuasion Tactics:
Secondary
Secondary
Not at all/ very little
Little
Partially
A lot
Very significantly
To what extent do you use each of the
following to influence or
persuade others: N % N % N % N % N %
Rational persuasion 2 .6 0 0 43 12 185 51 132 36
Apprising 6 2 34 9 115 32 148 41 58 16
Inspirational appeals 13 4 33 9 113 31 141 39 60 17
Consultation 1 .3 6 2 58 16 200 55 97 27
Ingratiation 87 24 68 19 114 32 69 19 19 5
Personal appeals 194 54 91 25 42 12 21 6 10 3
Exchange 205 57 81 23 49 14 17 5 8 2
Coalition building 68 19 77 21 130 36 66 18 19 5
Legitimating tactics 96 27 99 28 91 26 54 15 14 4
Pressure 145 40 92 26 87 24 28 8 9 2
Personal support 41 11 43 12 111 31 126 35 40 11
vi

Appendix VI: School Conditions: Academic
Press
Key Staff Perceptions Of Academic Press
Figure A: Three Improvement Groups And Key Staff Responses To Whether Most
Pupils Do Achieve The Goals That Have Been Set For Them (Primary)
0.00%
10.00%
20.00%
30.00%
40.00%
50.00%
60.00%
70.00%
80.00%
90.00%
100.00%
Low -Moderate/High
Moderate-highermoderate/high
Stable high/ high-higher
Agree strongly
Agree moderately
Agree slightly
Disagreestrongly/moderately/slightly
Figure B: Three Improvement Groups And Key Staff Responses To Whether Most
Pupils Do Achieve The Goals That Have Been Set For Them (Secondary)
0.00%
10.00%
20.00%
30.00%
40.00%
50.00%
60.00%
70.00%
80.00%
90.00%
100.00%
Agree strongly
Agree moderately
Agree slightly
Disagreestrongly/moderately/slightly
Low -Moderate/High
Moderate-highermoderate/high
Stable high/ high-higher
vii

Figure C: Three Improvement Groups And Key Staff Responses To Whether The
School Sets High Standards For Academic Performance (Secondary)
0%
10%
20%
30%
40%
50%
60%
70%
80%
90%
100%
Low -Moderate/High Moderate-highermoderate/high
Stable high/ high-higher
Agree strongly
Agree moderately
Agree slightly
Disagree slightly
Disagree moderately
Figure D: Three Improvement Groups And Key Staff Responses To Whether Their
Pupils Respect Others Who Get Good Marks / Grades (Secondary)
0%
10%
20%
30%
40%
50%
60%
70%
80%
90%
100%
Low -Moderate/High Moderate-highermoderate/high
Stable high/ high-higher
Agree strongly
Agree moderately
Agree slightly
Disagree slightly
Disagree moderately
Disagree strongly
viii

Appendix VII: Primary And Secondary Key
Staff Responses For Items On School Culture
Table A: Primary Key Staff Responses
Primary
School culture N or % Disagree
strongly Disagree
moderately Disagree slightly
Agree slightly
Agree moderately
Agree strongly
N 0 3 6 32 191 370 Most teachers in our school share a similar set of values, beliefs and attitudes related to teaching and learning % 0% 0% 1% 5% 32% 61%
N 0 0 2 7 120 474 The goals I am expected to accomplish with my pupils are clear to me % 0% 0% 0% 1% 20% 79%
N 2 2 11 20 124 443 There is no conflict in my mind about what I am expected to do
% 0% 0% 2% 3% 21% 74%
N 0 0 1 11 83 508 Pupils feel safe in our school
% 0% 0% 0% 2% 14% 84%
N 0 0 2 10 96 495 Teachers and other adults in the classroom work collaboratively
% 0% 0% 0% 2% 16% 82%
N 6 18 29 84 200 265 Parents often visit the school
% 1% 3% 5% 14% 33% 44%
N 5 5 17 88 179 307 The school is actively involved in work with other schools or organisations % 1% 1% 3% 15% 30% 51%
N 0 2 5 38 107 451 Our school provides a broad range of extracurricular activities for pupils
% 0% 0% 1% 6% 18% 75%
ix

Table B: Secondary Key Staff Responses
Secondary
School culture N or %
Disagree strongly
Disagree moderatel
y
Disagree slightly
Agree slightly
Agree moderatel
y
Agree strongly
N 4 16 43 192 533 372 Most teachers in our school share a similar set of values, beliefs and attitudes related to teaching and
learning % 0% 1% 4% 17% 46% 32%
N 2 2 7 69 302 773 The goals I am expected to accomplish with my pupils are
clear to me % 0% 0% 1% 6% 26% 67%
N 7 7 24 76 288 752 There is no conflict in my mind about what I am expected to do
% 1% 1% 2% 7% 25% 65%
N 3 15 34 120 478 510 Pupils feel safe in our school
% 0% 1% 3% 10% 41% 44%
N 2 5 24 146 451 530 Teachers and other adults in the classroom work collaboratively
% 0% 0% 2% 13% 39% 46%
N 30 75 156 332 360 201 Parents often visit the school
% 3% 6% 14% 29% 31% 17%
N 5 21 41 224 354 499 The school is actively involved in work with other schools or
organisations % 0% 2% 4% 20% 31% 44%
N 5 16 26 104 298 708 Our school provides a broad range of extracurricular activities for
pupils % 0% 1% 2% 9% 26% 61%
x

Appendix VIII: Leader Self-Efficacy
Both primary and secondary heads’ responses to items related to their self-
efficacy were positively skewed indicating high levels of self-confidence, however,
primary heads were relatively less favourable than their secondary colleagues to
most items (Tables A and B).
Table A: Comparisons Of Heads’ Responses To Items On Self-Efficacy: Primary
Primary
Not at all/ very little
Little
Partially
A lot
Very significantly
To what extent do you feel able to:
N % N % N % N % N %
Manage multiple accountabilities from
diverse audiences 14 4 24 6 120 32 151 40 68 18
Sustain your job satisfaction in your
leadership role 10 3 21 6 100 26 156 41 91 24
Sustain your motivation as a school leader
3 1 15 4 94 25 175 46 91 24
Sustain your commitment to the teaching profession
8 2 16 4 68 18 153 41 133 35
Raise achievement on national tests & exams
4 1 11 3 114 30 169 45 77 21
Manage change in your school
1 .3 1 .3 33 9 194 51 149 39
Table B: Comparisons Of Heads’ Responses To Items On Self-Efficacy: Secondary
Secondary
Not at all/ very little
Little
Partially
A lot
Very significantly
To what extent do you feel able to:
N % N % N % N % N %
Manage multiple accountabilities from
diverse audiences 5 2 14 4 90 25 151 42 97 27
Sustain your job satisfaction in your
leadership role 7 2 3 1 77 21 132 37 139 39
Sustain your motivation as a school leader
4 1 4 1 58 16 145 41 147 41
Sustain your commitment to the teaching profession
5 1 3 1 41 12 128 36 180 50
Raise achievement on national tests & exams
1 .3 6 2 71 20 165 46 114 32
Manage change in your school
1 .3 1 .3 20 6 166 46 170 48
xi

Appendix IX: Leader Self-Efficacy And School
SES Contexts (Secondary)
Table 1: Crosstabulation Of FSM And Heads’ Perceived Ability To Motivate
Teachers (Χ²=6.82, Df=1, P<0.01; Gamma=0.49, P<0.01)
44 207 251
17.5% 82.5% 100.0%
86.3% 68.3% 70.9%
7 96 103
6.8% 93.2% 100.0%
13.7% 31.7% 29.1%
51 303 354
14.4% 85.6% 100.0%
100.0% 100.0% 100.0%
Count% within FreeSchool Meals Band% within MotivateteachersCount% within FreeSchool Meals Band% within MotivateteachersCount% within FreeSchool Meals Band% within Motivateteachers
FSM 1&2 (0-20%)
FSM 3&4 (21%+)
Free SchoolMeals Band
Total
PartiallyA lot/Very
significantly
Motivate teachers
Total
Table 2: Crosstabulation Of FSM And Heads’ Perceived Ability To Create A
Positive Learning Environment In Their Schools (Gamma=0.42, P<0.05)
Crosstab
28 223 251
11.2% 88.8% 100.0%
84.8% 69.5% 70.9%
5 98 103
4.9% 95.1% 100.0%
15.2% 30.5% 29.1%
33 321 354
9.3% 90.7% 100.0%
100.0% 100.0% 100.0%
Count% within Free SchoolMeals Band% within Create a positivelearning environment inyour schoolCount% within Free SchoolMeals Band% within Create a positivelearning environment inyour schoolCount% within Free SchoolMeals Band% within Create a positivelearning environment inyour school
FSM 1&2 (0-20%)
FSM 3&4 (21%+)
Free SchoolMeals Band
Total
PartiallyA lot/Very
significantly
Create a positive learningenvironment in your
school
Total
xii

Table 3: Crosstabulation Of FSM And Heads’ Perceived Ability To Facilitate Pupil
Learning In Their Schools (Gamma=0.38, P<0.05)
Crosstab
1 39 209 249
.4% 15.7% 83.9% 100.0%
50.0% 84.8% 68.8% 70.7%
1 7 95 103
1.0% 6.8% 92.2% 100.0%
50.0% 15.2% 31.3% 29.3%
2 46 304 352
.6% 13.1% 86.4% 100.0%
100.0% 100.0% 100.0% 100.0%
Count% within Free SchoolMeals Band% within Facilitate pupillearning in your schoolCount% within Free SchoolMeals Band% within Facilitate pupillearning in your schoolCount% within Free SchoolMeals Band% within Facilitate pupillearning in your school
FSM 1&2 (0-20%)
FSM 3&4 (21%+)
Free SchoolMeals Band
Total
Little PartiallyA lot/Very
significantly
Facilitate pupil learning in your school
Total
Table 4: Crosstabulation Of FSM And Heads’ Perceived Ability To Raise
Achievement On National Tests And Examinations (Χ²=12.62, Df=3, P<0.01;
Gamma=0.54, P<0.001)
Crosstab
1 5 61 183 250
.4% 2.0% 24.4% 73.2% 100.0%
100.0% 83.3% 87.1% 66.3% 70.8%
0 1 9 93 103
.0% 1.0% 8.7% 90.3% 100.0%
.0% 16.7% 12.9% 33.7% 29.2%
1 6 70 276 353
.3% 1.7% 19.8% 78.2% 100.0%
100.0% 100.0% 100.0% 100.0% 100.0%
Count% within Free SchoolMeals Band% within Raiseachievement on nationaltests and examinationsCount% within Free SchoolMeals Band% within Raiseachievement on nationaltests and examinationsCount% within Free SchoolMeals Band% within Raiseachievement on nationaltests and examinations
FSM 1&2 (0-20%)
FSM 3&4 (21%+)
Free SchoolMeals Band
Total
Not atall/Very Little Little Partially
A lot/Verysignificantly
Raise achievement on national tests and examinations
Total
xiii

Table 5: Crosstabulation Of FSM And Heads’ Perceived Ability To Manage Multiple
Accountabilities From Diverse Audiences (Gamma=0.25, P<0.05)
Crosstab
3 10 71 166 250
1.2% 4.0% 28.4% 66.4% 100.0%
75.0% 71.4% 79.8% 67.5% 70.8%
1 4 18 80 103
1.0% 3.9% 17.5% 77.7% 100.0%
25.0% 28.6% 20.2% 32.5% 29.2%
4 14 89 246 353
1.1% 4.0% 25.2% 69.7% 100.0%
100.0% 100.0% 100.0% 100.0% 100.0%
Count% within Free SchoolMeals Band% within Managemultiple accountabilitiesfrom diverse audiencese.g. Governing Body, LA,OfstedCount% within Free SchoolMeals Band% within Managemultiple accountabilitiesfrom diverse audiencese.g. Governing Body, LA,OfstedCount% within Free SchoolMeals Band% within Managemultiple accountabilitiesfrom diverse audiencese.g. Governing Body, LA,Ofsted
FSM 1&2 (0-20%)
FSM 3&4 (21%+)
Free SchoolMeals Band
Total
Not atall/Very Little Little Partially
A lot/Verysignificantly
Manage multiple accountabilities from diverseaudiences e.g. Governing Body, LA, Ofsted
Total
xiv

Appendix X: Three Improvement Groups And
Key Staff Responses To Whether They Have
Too Many Pupils Who Are Uncooperative
Figure A: Three Improvement Groups And Key Staff Responses To Whether They
Have Too Many Pupils Who Are Uncooperative (Secondary)
0%
10%
20%
30%
40%
50%
60%
70%
80%
90%
100%
Low -Moderate/High Moderate-highermoderate/high
Stable high/ high-higher
Agree strongly
Agree moderately
Agree slightly
Disagree slightly
Disagree moderately
Disagree strongly
0%
10%
20%
30%
40%
50%
60%
70%
80%
90%
100%
Low -Moderate/High Moderate-highermoderate/high
Stable high/ high-higher
Agree stronglyAgree moderatelyAgree slight lyDisagree slight lyDisagree moderatelyDisagree strongly
Figure B: Three Improvement Groups And Key Staff Responses To Whether They
Have Too Many Pupils Who Achieve Poorly In Spite Of My Best Efforts
(Secondary)
xv

Appendix XI: Heads’ Views On Pupils’
Participation In Extracurricular School
Activity Across Three Improvement Groups
Figure A: Heads’ Views On Pupils’ Participation In Extracurricular School Activity
Across Three Improvement Groups (Primary)
0%
10%
20%
30%
40%
50%
60%
70%
80%
90%
100%
Low -Mod/High Mod-HigherMod/High
Stable High/High-Higher
Agreemoderately/stronglyAgree slightly
Disagreeslightly
Disagreemoderately/strongly
(N=160) (N=123)(N=94)
Figure B: Heads’ Views On Pupils’ Participation In Extracurricular School Activity
Across Three Improvement Groups (Secondary)
0%
10%
20%
30%
40%
50%
60%
70%
80%
90%
100%
Low -Mod/High Mod-HigherMod/High
Stable High/High-Higher
Agreemoderately/stronglyAgree slightly
Disagreeslightly
Disagreemoderately/strongly
(N=167) (N=115)(N=75)
xvi

Appendix XII: The kinds of leadership
practice provided by SMT/SLT in school
For both the primary and the secondary sample, the large majority of heads
strongly agreed to the items concerning the leadership practice of members of
the SMT/SLT (see Tables and B).
Table A: Primary heads’ responses to items on the role of the SMT/SLT
Primary
Disagree strongly /
moderately
Disagree slightly
Agree slightly
Agree moderately
Agree strongly
To what extent do you agree that the members of
the SMT/SLT in your school:
N % N % N % N % N %
Share a similar set of values, beliefs and attitudes related to
teaching and learning 0 0 1 .3 10 2.7 89 23.7 275 73.3
Participate in ongoing, collaborative work
0 0 0 0 16 4.3 105 28.0 254 67.7
Have a role in school-wide decision-making
0 0 2 .5 7 1.9 100 26.7 266 70.9
Have a role in the development of pupil behaviour policies
0 0 2 .5 6 1.6 87 23.2 280 74.7
Have a role in the development of policies on lesson planning?
0 0 3 .8 19 5.1 95 25.3 258 68.8
Have a role in the development of policies on homework
1 .3 4 1.1 24 6.4 104 27.7 242 64.5
Have involvement in the school evaluation and review process
1 .3 0 0 11 2.9 89 23.7 274 73.1
Have a role in classroom monitoring and assessment
strategies 1 .3 2 .5 15 4.0 118 31.5 239 63.7
Have a role in determining the direction of the school
1 .3 1 .3 16 4.3 120 32.0 237 63.2
Have a positive impact on standards of teaching
1 .3 1 .3 10 2.7 87 23.2 276 73.6
Have a positive impact on raising levels of pupil
attainment 1 .3 1 .3 11 2.9 84 22.4 278 74.1
Have a role in determining the allocation of resources to
pupils 4 1.1 3 .8 45 12.0 135 36.0 188 50.1
xvii

Table B: Secondary heads’ responses to items on the role of the SMT/SLT
Secondary
Disagree strongly /
moderately
Disagree slightly
Agree slightly
Agree moderately
Agree strongly
To what extent do you agree that the members of
the SMT/SLT in your school:
N % N % N % N % N %
Share a similar set of values, beliefs and attitudes related to
teaching and learning 2 .6 2 .6 10 2.8 71 19.7 276 76.5
Participate in ongoing, collaborative work
3 .8 3 .8 8 2.2 89 24.6 259 71.5
Have a role in school-wide decision-making
1 .3 4 1.1 5 1.4 41 11.3 311 85.9
Have a role in the development of pupil
behaviour policies 1 .3 1 .3 7 1.9 60 16.6 293 80.9
Have a role in the development of policies on
lesson planning? 2 .6 3 .8 20 5.5 93 25.7 244 67.4
Have a role in the development of policies on
homework 2 .6 2 .6 25 6.9 107 29.6 226 62.4
Have involvement in the school evaluation and review
process 0 0 1 .3 10 2.8 26 7.2 325 89.8
Have a role in classroom monitoring and assessment
strategies 0 0 1 .3 5 1.4 60 16.6 296 81.8
Have a role in determining the direction of the school
2 .6 0 0 10 2.8 70 19.3 279 77.3
Have a positive impact on standards of teaching
0 0 1 .3 11 3.0 93 25.7 257 71.0
Have a positive impact on raising levels of pupil
attainment 0 0 0 0 12 3.3 84 23.2 266 73.5
Have a role in determining the allocation of resources to
pupils 10 2.8 5 1.4 66 18.2 125 34.6 155 42.9
xviii

Appendix XIII: Keys staff perceptions
relating to pupil attendance
Table A: Primary heads’ responses to items concerning pupil attendance
Primary
Much worse now
Worse now
No change
Better now
Much better now
To what extent do you agree that the members of the SMT/SLT in your
school:
N % N % N % N % N %
Pupils’ lateness to lessons 0 0 6 1.0 358 61.2 149 25.5 72 12.3
Pupils’ lateness to school 1 .2 25 4.2 255 43.1 246 41.6 65 11.0
Pupils’ absenteeism (both authorised and unauthorised)
2 .3 19 3.2 229 38.5 261 43.9 84 14.1
Pupils’ missing class 2 .4 1 .2 405 71.1 96 16.8 64 11.2
Pupils’ mobility/turnover 6 .2 72 12.2 369 62.3 102 17.2 40 6.8
Table B: Secondary heads’ responses to items concerning pupil attendance
Secondary
Much worse now
Worse now
No change
Better now
Much better now
To what extent do you agree that the members of the SMT/SLT in
your school:
N % N % N % N % N %
Pupils’ lateness to lessons 19 1.7 139 12.2 482 42.3 405 35.5 95 8.3
Pupils’ lateness to school 13 1.1 120 10.6 485 42.7 422 37.2 95 8.4
Pupils’ absenteeism (both authorised and unauthorised)
11 1.0 87 7.7 411 36.3 479 42.4 142 12.6
Pupils’ missing class 9 .8 73 6.4 462 40.7 461 40.7 128 11.3
Pupils’ mobility/turnover 6 .5 59 5.2 689 61.2 290 25.8 81 7.2
xix

Appendix XIV: Key staff perceptions of
school improvement over the past 3 years
Table A: Primary key staff responses to items concerning school improvement
Primary
No change
A little Some A lot To what extent has your school experienced
improvement in the following areas in the last three years:
N % N % N % N %
Reduction in staff mobility 248 42.0 97 16.4 143 24.2 103 17.4
Reduction in staff absence 265 44.9 83 14.1 148 25.1 94 15.9
Enhanced local reputation 99 16.6 74 12.4 219 36.7 204 34.2
Improved homework policies and practice 122 20.6 131 22.1 215 36.3 124 20.9
Enhanced commitment and enthusiasm of staff 89 15.0 69 11.6 186 31.3 250 42.1
Promoted an orderly and secure working environment 107 18.0 63 10.6 171 28.7 254 42.7
Improved pupil behaviour and discipline as a result of a whole school approach
99 16.7 92 15.5 179 30.1 224 37.7
Table B: Secondary key staff responses to items concerning school improvement
Secondary
No change
A little Some A lot To what extent do you agree that the members of
the SMT/SLT in your school:
N % N % N % N %
Reduction in staff mobility 326 29.3 209 18.8 389 35.0 188 16.9
Reduction in staff absence 329 29.7 257 23.2 371 33.5 149 13.5
Enhanced local reputation 131 11.5 156 13.7 379 33.4 468 41.2
Improved homework policies and practice 268 23.6 298 26.3 422 37.2 146 12.9
Enhanced commitment and enthusiasm of staff 174 15.4 182 16.1 457 40.3 320 28.2
Promoted an orderly and secure working environment 168 14.7 194 17.0 396 34.8 381 33.5
Improved pupil behaviour and discipline as a result of a whole school approach
242 21.2 250 21.9 358 31.4 289 25.4
xx

Appendix XV: Three improvement groups and
secondary headteachers’ responses relating
to structuring the organisation, external and
internal collaborations, and school
improvement
Table A: Secondary headteacher responses to items relating to structuring the
organisation
To what extent do you believe your actions have changed in relation to the following over the past three years?
Improvement group
Not at all / Very little
Little Partially A lot / Very significantly
Low Start Group
12 (7.5%)
8 (5.0%)
41 (25.8%)
98 (61.6%)
Moderate Start Group
4 (4.3%)
3 (3.2%)
38 (40.4%)
49 (52.1%)
Improving internal review procedures
High Start Group
11 (8.9%)
8 (6.5%)
47 (38.2%)
57 (46.3%)
Low Start Group
13 (8.2%)
9 (5.7%)
26 (16.4%)
111 (69.8%)
Moderate Start Group
4 (4.3%)
5 (5.4%)
22 (23.7%)
62 (66.7%)
Utilising support staff skills for the benefit of pupil learning
High Start Group
8 (6.5%)
9 (7.3%)
20 (16.3%)
86 (69.9%)
Low Start Group
31 (19.5%)
14 (8.8%)
40 (25.2%)
74 (46.5%)
Moderate Start Group
14 (14.9%)
8 (8.5%)
31 (33.0%)
41 (43.6%)
Allocating resources strategically based on pupil needs
High Start Group
14 (11.4%)
19 (15.4%)
40 (32.5%)
50 (40.7%)
Low Start Group
19 (12.0%)
12 (7.6%)
49 (31.0%)
78 (49.4%)
Moderate Start Group
10 (10.8%)
12 (12.9%)
27 (29.0%)
44 (47.3%)
Structuring the organisation to facilitate work
High Start Group
13 (10.7%)
11 (9.1%)
44 (36.4%)
53 (43.8%)
xxi

Table B: Secondary headteacher responses to items relating to external and
internal collaborations
To what extent do you believe your actions have changed in relation to the following over the past three years?
Improvement group
Not at all / Very little
Little Partially A lot / Very significantly
Low Start Group
28 (17.7%)
21 (13.3%)
47 (29.4%)
62 (39.2%)
Moderate Start Group
14 (15.1%)
8 (8.6%)
40 (43.0%)
31 (33.3%)
Working collaboratively with the Governing Body
High Start Group
18 (14.6%)
20 (16.3%)
32 (26.0%)
53 (43.1%)
Low Start Group
34 (21.5%)
24 (15.2%)
34 (21.5%)
66 (41.8%)
Moderate Start Group
15 (16.3%)
15 (16.3%)
28 (30.4%)
34 (37.0%)
Working collaboratively with the Local Authority (LA)
High Start Group
26 (21.3%)
27 (22.1%)
40 (32.8%)
29 (23.8%)
Low Start Group
24 (15.0%)
7 (4.4%)
26 (16.3%)
103 (64.4%)
Moderate Start Group
10 (10.8%)
6 (6.5%)
18 (19.4%)
59 (63.4%)
Working collaboratively with the SMT/SLT
High Start Group
14 (11.5%)
10 (8.2%)
27 (22.1%)
71 (58.2%)
Low Start Group
34 (21.3%)
15 (9.4%)
39 (24.4%)
72 (45.0%)
Moderate Start Group
8 (8.5%)
18 (19.1%)
26 (27.7%)
42 (44.7%)
Encouraging collaborative work amongst staff
High Start Group
14 (11.4%)
16 (13.0%)
31 (25.2%)
62 (50.4%)
Low Start Group
14 (8.8%)
19 (11.9%)
56 (35.2%)
70 (44.0%)
Moderate Start Group
8 (8.5%)
8 (8.5%)
39 (41.5%)
39 (41.5%)
Working in collaboration with other schools
High Start Group
16 (13.1%)
16 (13.1%)
45 (36.9%)
45 (36.9%)
xxii

Table C: Secondary headteacher responses to items relating to school
improvement
To what extent has your school experienced improvement in the following areas in the last three years?
Improvement group No
change A little Some A lot
Low Start Group 40
(24.2%) 24
(14.5%) 52
(31.5%) 49
(29.7%) Moderate Start Group
26 (34.2%)
15 (19.7%)
22 (28.9%)
13 (17.1%)
Reduction in staff mobility
High Start Group 48
(42.1%) 31
(27.2%) 22
(19.3%) 13
(11.4%)
Low Start Group 38
(22.9%) 27
(16.3%) 61
(36.7%) 40
(24.1%) Moderate Start Group
20 (26.3%)
18 (23.7%)
28 (36.8%)
10 (13.2%)
Reduction in staff absence
High Start Group 46
(40.4%) 32
(28.1%) 24
(21.1%) 12
(10.5%)
Low Start Group 2
(1.2%) 22
(13.3%) 58
(34.9%) 84
(50.6%) Moderate Start Group
12 (16.0%)
6 (8.0%)
21 (28.0%)
36 (48.0%)
Enhanced local reputation
High Start Group 30
(26.1%) 24
(20.9%) 26
(22.6%) 35
(30.4%)
Low Start Group 18
(10.8%) 58
(34.9%) 72
(43.4%) 18
(10.8%) Moderate Start Group
16 (21.1%)
34 (44.7%)
23 (30.3%)
3 (3.9%)
Improved homework policies and practice
High Start Group 39
(33.9%) 36
(31.3%) 27
(23.5%) 13
(11.3%)
Low Start Group 5
(3.0%) 14
(8.4%) 74
(44.6%) 73
(44.0%) Moderate Start Group
4 (5.3%)
11 (14.5%)
30 (39.5%)
31 (40.8%)
Enhanced commitment and enthusiasm of staff
High Start Group 23
(20.0%) 22
(19.1%) 45
(39.1%) 25
(21.7%)
Low Start Group 6
(3.6%) 19
(11.4%) 66
(39.8%) 75
(45.2%) Moderate Start Group
6 (7.9%)
14 (18.4%)
29 (38.2%)
27 (35.5%)
Promoted an orderly and secure working environment
High Start Group 28
(24.3%) 25
(21.7%) 41
(35.7%) 21
(18.3%)
Low Start Group 8
(4.8%) 26
(15.8%) 60
(36.4%) 71
(43.0%) Moderate Start Group
11 (14.5%)
9 (11.8%)
34 (44.7%)
22 (28.9%)
Improved pupil behaviour and discipline as a result of a whole school approach
High Start Group 24
(20.9%) 35
(30.4%) 32
(27.8%) 24
(20.9%)
xxiii

Appendix XVI: Primary Headteacher
Questionnaire Survey – Wave 1
The Impact of School Leadership on Pupil Outcomes Headteacher Questionnaire – Primary
N = 394 1. To what extent do you believe your leadership practice and actions have changed in relation to the following over the past three years?
Valid Percent Not at
all Very little
Little Partially A lot Very significantly
a) Giving staff an overall sense of purpose 7 10 10 23 42 10 b) Helping clarify the reasons for our school’s improvement initiatives
5 6 6 19 51 14
c) Providing assistance to staff in setting short-term goals for teaching and learning
3 6 8 28 42 13
d) Demonstrating high expectations for staff’s work with pupils
9 9 13 23 33 13
e) Demonstrating high expectations for pupil behaviour
12 10 11 22 28 17
f) Demonstrating high expectations for pupil achievement
8 10 11 17 37 17
g) Working collaboratively with the Governing Body
7 9 13 32 24 15
h) Working collaboratively with the Local Authority (LA)
8 12 18 27 23 12
i) Working collaboratively with the SMT/SLT 5 8 6 19 39 23 j) Integrating school priorities with the National Government’s policy agenda
4 10 13 36 30 8
2. To what extent do you believe your actions have changed in relation to the following over the past three years?
Valid Percent Not at
all Very little
Little Partially A lot Very significantly
a) Giving staff individual support to help them improve their teaching practices
5 9 12 34 33 7
b) Encouraging them to consider new ideas for their teaching
4 6 7 26 45 11
c) Modeling a high level of professional practice 10 10 16 29 26 9 d) Developing an atmosphere of caring and trust
15 11 16 18 26 15
e) Promoting leadership development amongst teachers
6 5 8 21 38 22
f) Promoting a range of CPD experiences among all staff
7 7 10 31 30 16
g) Encouraging staff to think of learning beyond the academic curriculum (e.g. personal, emotional and social education, citizenship, etc.)
6 5 9 24 42 14
3.To what extent do you believe your actions have changed in relation to the following over the past three years?
Valid Percent Not at
all Very little
Little Partially A lot Very significantly
a) Encouraging collaborative work amongst staff
7 9 13 25 37 10
b) Ensuring wide participation in decisions about school improvement
5 9 9 25 38 14
c) Engaging students in the school’s improvement efforts
2 7 12 44 29 6
xxiv

d) Increasing dialogue about school improvement between pupils and adults
1 3 10 38 41 7
e) Improving internal review procedures 2 5 5 33 43 11 f) Building community support for the school’s improvement efforts
3 10 12 44 26 6
g) Utilising support staff skills for the benefit of pupil learning
2 5 6 18 42 27
h) Allocating resources strategically based on pupil needs
6 10 11 30 33 10
i) Working in collaboration with other schools 3 7 11 37 28 13 j) Structuring the organisation to facilitate work
4 8 9 32 33 14
4. To what extent do you believe your actions have changed in relation to the following over the past three years?
Valid Percent Not at
all Very little
Little Partially A lot Very significantly
a) Providing or locating resources to help staff improve their teaching
5 8 15 32 32 8
b) Regularly observing classroom activities 6 9 17 30 28 10 c) After observing classroom activities, working with teachers to improve their teaching
6 9 18 34 26 7
d) Using coaching and mentoring to improve the quality of teaching
7 8 14 35 30 6
e) Frequently discussing educational issues with staff
9 8 13 29 33 8
f) Buffering teachers from distractions from their teaching
7 7 12 33 33 8
g) Encouraging staff to use data in their work 2 3 5 18 51 21 h) Encouraging all staff to use data in planning for individual needs
2 5 5 19 50 19
i) Incorporating research evidence into my decision making to inform practice
4 10 18 41 22 4
j) Using pupil achievement data to make most decisions about school improvement
4 6 5 18 42 25
6. Please indicate the extent to which you agree with the following statements:
Valid Percent Disagree strongly
Disagree moderately
Disagree slightly
Agree slightly
Agree moderately
Agree strongly
a) I trust most of the staff in the school to do their jobs well
0 0 1 2 20 76
b) I feel quite confident that my teachers will always treat me fairly
0 1 2 5 28 65
c) My teachers would not try to gain advantage by deceiving me
0 1 2 3 29 65
d) I feel a strong loyalty to my teachers 0 0 0 2 11 86 e) I would support my teachers in almost any emergency
1 0 1 2 13 84
f) I have a divided sense of loyalty towards my teachers
62 18 6 6 7 2
g) I am able to discuss my feelings, worries and frustrations with my teachers
4 6 7 22 35 26
h) Teachers are able to discuss their feelings, worries and frustrations with me
0 0 1 9 48 43
7. To what extent do you feel able to:
Valid Percent Not at
all Very little
Little Partially A lot Very significantly
a) Motivate teachers? 0 0 0 15 62 23 b) Generate enthusiasm for a shared vision of the school?
0 0 0 8 56 35
xxv

c) Manage change in your school? 0 0 0 9 51 39 d) Create a positive learning environment in your school?
0 0 0 5 47 48
e) Facilitate pupil learning in your school? 0 0 0 8 58 34 f) Raise achievement on national tests and examinations?
1 1 3 30 45 21
g) Sustain your motivation as a school leader? 0 1 4 25 46 24 h) Sustain your job satisfaction in your leadership role?
0 2 6 27 41 24
i) Sustain your commitment to the teaching profession?
0 2 4 18 41 35
j) Manage multiple accountabilities from diverse audiences e.g. Governing Body, LA, Ofsted?
1 3 6 32 40 18
8. Please indicate the extent to which leadership practice in this school is provided by the following people or groups:
Valid Percent Rarely /
never Infrequently Some Moderate
amount A great
deal All the time
a) Deputy Head 1 2 3 10 33 51 b) SMT/SLT 1 1 3 19 47 30 c) Key Stage Managers 3 1 7 22 45 23 d) Groups of teachers 1 2 12 38 39 7 e) Individual teachers with formally assigned tasks (e.g. subject co-ordinators)
0 0 10 31 47 12
f) Individual teachers acting informally 0 5 23 36 29 7 g) Governors 4 14 23 37 20 3 h) Pupils 1 6 28 39 23 4 i) Support staff 1 4 23 39 29 5 j) School Improvement Partners (SIPs) 22 12 23 25 15 3 k) Local Authority (LA) 6 15 34 32 11 2 l) Parents 6 20 40 26 7 1 9. To what extend does each of the statements below describe the way leadership tasks are distributed or shared within your school?
Valid Percent Not at
all Very little
Little Partially A lot Very significantly
a) Leadership tasks are delegated by the Head or SMT/SLT
1 2 3 27 42 25
b) We collectively plan which individual or group(s) will carry out which leadership tasks
1 4 8 31 40 16
c) The distribution of leadership tasks in this school is “spontaneous”. It is not planned but it usually works out well
25 31 20 18 6 1
d) The distribution of leadership tasks in this school is “spontaneous”. It is not planned and it often leads to conflicts and confusion
60 31 6 1 1 0
e) Most leadership tasks in this school are carried out by the Head and the SMT/SLT
2 4 7 38 37 12
f) Very few others take on leadership tasks 23 20 19 28 8 1 10. To what extent do you agree that members of the SMT/SLT in your school…
Valid Percent Disagree strongly
Disagree moderately
Disagree slightly
Agree slightly
Agree moderately
Agree strongly
a) Share a similar set of values, beliefs and attitudes related to teaching and learning?
0 0 0 3 24 73
b) Participate in ongoing, collaborative work?
0 0 0 4 28 68
xxvi

c) Have a role in school-wide decision-making?
0 0 1 2 27 71
d) Have a role in the development of pupil behaviour policies?
0 0 1 2 23 75
e) Have a role in the development of policies on lesson planning?
0 0 1 5 25 69
f) Have a role in the development of policies on homework?
0 0 1 6 28 65
g) Have involvement in the school evaluation and review process?
0 0 0 3 24 73
h) Have a role in classroom monitoring and assessment strategies?
0 0 1 4 32 64
i) Have a role in determining the direction of the school?
0 0 0 4 32 63
j) Have a positive impact on standards of teaching?
0 0 0 3 23 74
k) Have a positive impact on raising levels of pupil attainment?
0 0 0 3 22 74
l) Have a role in determining the allocation of resources to pupils?
0 1 1 12 36 50
11. To what extend do you use each of the following to influence or persuade others?
Valid Percent Not at
all Very little
Little Partially A lot Very significantly
a) Rational Persuasion (use of logical arguments and factual evidence)
1 0 2 21 52 25
b) Apprising (explaining how carrying out a request will be beneficial to the person)
0 1 7 38 44 10
c) Inspirational Appeals (appeals to person’s values, ideals or emotions)
1 4 12 40 32 12
d) Consultation (inviting feedback or advice about a proposed course of action)
0 0 1 17 57 25
e) Ingratiation (the use of praise and flattery) 7 16 21 34 20 3 f) Personal appeals (appealing to personal friendship or favours)
25 28 25 16 5 1
g) Exchange (offering something with the expectation of reciprocity at a later time)
23 31 24 18 3 1
h) Coalition building (enlisting the aid or support of others as a means of influence)
8 15 19 41 15 3
i) Legitimating tactics (efforts to establish the legitimacy of a course of action or to verify the authority to carry out the action)
10 18 25 33 12 2
j) Pressure (the use of demands, persistent checking etc.)
18 31 26 22 4 0
k) Personal support (offer of additional resources, empathetic responses)
4 7 9 34 34 12
12. Your school has been chosen because it has made significant improvement or sustained high academic achievement over the last three years. To what extent has your school experienced improvement in the following areas in the last three years?
Valid Percent No change A little Some A lot
a) Reduction in staff mobility 43 18 19 20 b) Reduction in staff absence 44 16 24 16 c) Enhanced local reputation 17 17 33 32 d) Improved homework policies and practice 30 28 28 1 e) Enhanced commitment and enthusiasm of staff 14 13 32 40 f) Promoted an orderly and secure working environment 21 13 23 44 g) Improved pupil behaviour and discipline as a result of a whole school approach
21 15 29 36
xxvii

13. To what extent do you consider that these things have changed over the past three years?
Valid Percent Much
worse now Worse now
No change
Better now
Much better now
a) Pupils’ lateness to lessons 0 1 62 26 11 b) Pupils’ lateness to school 0 4 45 41 10 c) Pupils’ absenteeism (both authorised and unauthorised)
1 6 43 40 10
d) Pupils’ missing class 1 0 81 10 8 e) Pupils’ mobility/turnover 3 15 61 16 6 f) Physical conflict among pupils 0 5 39 36 20 g) Bullying of all kinds among pupils 0 3 44 36 17 h) Vandalism of school property 1 4 55 24 17 i) Physical abuse of teachers 0 3 73 12 13 j) Verbal abuse of teachers 0 5 63 17 14 k) Levels of pupil misbehaviour 0 7 36 36 21 l) Pupils’ motivation for learning 0 3 16 52 30 14. Indicate the extent to which you agree that each statement characterises your school
Valid Percent Disagree strongly
Disagree moderately
Disagree slightly
Agree slightly
Agree moderately
Agree strongly
a) Pupils in this school can achieve the goals that have been set for them
0 0 1 4 32 64
b) Most pupils do achieve the goals that have been set for them
0 0 0 6 39 55
c) Teachers set high standards for academic performance
0 0 1 5 39 56
d) This school sets high standards for academic performance
0 0 0 3 27 69
e) Pupils respect others who get good marks / grades
0 1 3 11 38 47
f) Lesson plans are regularly discussed and monitored
1 2 3 17 31 47
g) The performance of department / subject areas is regularly monitored and targets for improvement are regularly set
0 1 4 17 35 44
h) Pupils are regularly involved in assessment for learning
0 1 2 17 39 41
i) Class teachers regularly use pupil data to set individual pupil achievement targets
0 1 1 9 33 56
15. Indicate the extent to which you agree that each statement characterises your school
Valid Percent Disagree strongly
Disagree moderately
Disagree slightly
Agree slightly
Agree moderately
Agree strongly
a) Most teachers in our school share a similar set of values, beliefs and attitudes related to teaching and learning
0 0 1 4 27 69
b) Teachers in our school mostly work together to improve their practice
0 0 1 5 27 67
c) There is ongoing collaborative planning of classroom work among teachers in our school
0 0 2 11 25 62
d) Pupils feel safe in our school 0 0 0 1 17 82 e) Teachers and other adults in the classroom work collaboratively
0 0 0 2 21 77
f) Parents often visit the school 1 1 2 16 41 38
xxviii

g) The school is actively involved in work with other schools or organisations (e.g. networks, GTC, NCSL or other learning partnerships)
1 3 4 15 24 53
16. Indicate the extent to which you agree that each statement characterises your school
Valid Percent Disagree strongly
Disagree moderately
Disagree slightly
Agree slightly
Agree moderately
Agree strongly
a) Disruptions to teaching time are minimised
0 1 2 7 37 53
b) The school timetable provides adequate time for collaborative teacher planning
2 5 8 19 29 37
c) Our pupil assessment practices reflect our curriculum standards
0 0 4 11 42 43
d) We are able to provide a coherent teaching and learning programme for pupils across the years
0 0 1 6 29 63
e) Pupils of similar academic ability are grouped together for teaching in most subject areas
9 8 10 22 29 21
f) Teachers in this school have a sense of collective responsibility for pupil learning
0 0 1 7 30 62
g) Teachers’ teaching strategies enable pupils to construct their own knowledge
1 0 4 21 51 24
h) There are more opportunities for pupils to take responsibilities for their own learning in school now than three years ago
0 0 1 13 38 47
17. Which of these services do you provide some, or full access to (this might be on site or by referral)?
Valid Percent Full access Some access No access
a) Year round childcare from 8am to 6pm weekdays 28 40 32 b) A varied menu of activities (such as homework clubs, art, sport, music, language) before and after school
51 49 0
c) Parenting support, including structured parenting support programmes
16 59 25
d) Swift and easy referral to health and social services 41 52 7 e) Wider community access to your facilities (e.g. ICT, sports hall) 16 57 27 18. To what extent do these services rely upon…
Valid Percent Greatly To some
extent Not at all Not applicable
(no extended services)
a) An extended schools co-ordinator/manager? 12 24 46 18 b) Partnerships with the local authority, PCT, or voluntary, private or independent organisations?
12 52 25 10
c) Cluster relationships with other schools/Children’s Centres? 12 38 41 10 d) The involvement of teachers to run out of hours activities? 49 41 9 2 e) Your own involvement to lead the strategy for extended services?
39 47 4 10
f) Your own involvement to establish/run services? 29 53 10 8
xxix

19. Indicate the extent to which you agree that each statement characterises your school
Valid Percent Disagree strongly
Disagree moderately
Disagree slightly
Agree slightly
Agree moderately
Agree strongly
a) Our school provides a broad range of extracurricular activities for pupils (e.g. plays, athletics, music, dance)
0 1 1 8 24 66
b) Our school provides after school academic support activities
10 6 9 30 22 24
c) Most of our pupils participate regularly in at least one extracurricular school activity
2 3 11 26 32 27
d) Most of our teachers participate regularly in at least one extracurricular school activity
7 9 11 17 23 33
20. Indicate the extent to which you agree that each statement characterises conditions in classrooms within your school
Valid Percent Disagree strongly
Disagree moderately
Disagree slightly
Agree slightly
Agree moderately
Agree strongly
a) Teachers’ workload is quite fair compared with teachers in other schools
1 3 6 9 41 40
b) Teachers in this school teach an excessive number of pupils
46 20 14 11 7 3
c) The size of classes makes unreasonable demands on the time required for preparation and marking
44 18 12 15 8 3
d) The size of classes allows teachers to adequately differentiate their teaching between pupils
2 4 9 22 40 23
e) The amount of administrative work required of teachers is not excessive
6 7 14 18 30 25
f) Teachers’ non-teaching (other than admin.) duties in the school are not excessive
1 2 6 19 42 30
g) Teachers teach subjects or areas of the curriculum for which they have little formal preparation
32 25 14 19 8 3
h) This school has too many pupils who are uncooperative
67 15 4 10 1 2
i) This school has too many pupils who achieve poorly in spite of teachers’ best efforts
45 19 9 19 6 3
j) Teachers have a significant amount of autonomy over decisions about what happens in their classes
1 2 6 19 47 25
k) Teachers have access to the teaching resources that they need to do a good job
0 1 2 9 43 45
l) The atmosphere throughout my school encourages pupils to learn
0 0 0 2 21 77
Sex
Valid Percent
Male Female 39 61
Age
Valid Percent
31-35 36-40 41-45 46-50 51-55 56-60 61-65 2 6 11 17 37 25 2
xxx

Education background*
Percent
Non-graduate Certificate / Diploma
Degree Postgraduate Certificate / Diploma
Masters Doctorate Other qualification
36 66 29 20 0 8 *These figures will not add up to 100 as some teachers selected a qualification more than once How long have you been a headteacher in total?
Valid Percent
0-3 years 4-7 years 8-15 years 16-23 years 24 years or more 14 23 39 19 4
How long have you been a headteacher in this school?
Valid Percent
0-3 years 4-7 years 8-15 years 16-23 years 24 years or more 21 27 31 17 4
How long were you a deputy headteacher?
Valid Percent
0-3 years 4-7 years 8-15 years 16-23 years 24 years or more Not applicable 33 47 15 1 0 4
Were you a deputy headteacher at this school before you became headteacher?
Valid Percent
Yes No 22 78
Including yourself, how many headteachers has your current school had in the past 10 years?
Valid Percent
1 2 3 4 5 6 7 8 10 No idea 35 33 18 5 2 2 1 0 0 0
xxxi

Appendix XVII: Secondary Headteacher
Questionnaire Survey – Wave 1
The Impact of School Leadership on Pupil Outcomes
Headteacher Questionnaire – Secondary N = 368 1. To what extent do you believe your leadership practice and actions have changed in relation to the following over the past three years?
Valid Percent Not at
all Very little
Little Partially A lot Very significantly
a) Giving staff an overall sense of purpose 9 9 9 27 31 15 b) Helping clarify the reasons for our school’s improvement initiatives
6 9 11 18 42 16
c) Providing assistance to staff in setting short-term goals for teaching and learning
4 8 11 28 41 7
d) Demonstrating high expectations for staff’s work with pupils
11 8 10 20 32 18
e) Demonstrating high expectations for pupil behaviour
12 9 12 23 25 19
f) Demonstrating high expectations for pupil achievement
11 8 11 14 32 25
g) Working collaboratively with the Governing Body
11 11 13 23 25 18
h) Working collaboratively with the Local Authority (LA)
10 17 15 26 19 13
i) Working collaboratively with the SMT/SLT 13 8 9 18 21 31 j) Integrating school priorities with the National Government’s policy agenda
6 9 14 34 26 10
2. To what extent do you believe your actions have changed in relation to the following over the past three years?
Valid Percent Not at
all Very little
Little Partially A lot Very significantly
a) Giving staff individual support to help them improve their teaching practices
7 9 12 31 34 8
b) Encouraging them to consider new ideas for their teaching
6 5 5 29 42 13
c) Modeling a high level of professional practice 12 10 11 25 31 11 d) Developing an atmosphere of caring and trust
14 11 13 19 28 14
e) Promoting leadership development amongst teachers
7 5 6 20 41 22
f) Promoting a range of CPD experiences among all staff
8 8 8 26 34 15
g) Encouraging staff to think of learning beyond the academic curriculum (e.g. personal, emotional and social education, citizenship, etc.)
6 9 14 32 29 9
3.To what extent do you believe your actions have changed in relation to the following over the past three years?
Valid Percent Not at
all Very little
Little Partially A lot Very significantly
a) Encouraging collaborative work amongst staff
8 9 8 23 44 9
b) Ensuring wide participation in decisions about school improvement
6 9 9 32 36 9
c) Engaging students in the school’s improvement efforts
5 7 19 42 23 5
xxxii

d) Increasing dialogue about school improvement between pupils and adults
3 3 12 38 32 11
e) Improving internal review procedures 3 4 6 17 41 30 f) Building community support for the school’s improvement efforts
6 11 16 34 26 7
g) Utilising support staff skills for the benefit of pupil learning
2 3 5 16 47 26
h) Allocating resources strategically based on pupil needs
9 9 9 32 30 10
i) Working in collaboration with other schools 3 5 10 29 35 18 j) Structuring the organisation to facilitate work
6 6 5 25 38 20
4. To what extent do you believe your actions have changed in relation to the following over the past three years?
Valid Percent Not at
all Very little
Little Partially A lot Very significantly
a) Providing or locating resources to help staff improve their teaching
5 7 12 31 35 10
b) Regularly observing classroom activities 6 7 11 20 40 16 c) After observing classroom activities, working with teachers to improve their teaching
6 6 14 33 32 9
d) Using coaching and mentoring to improve the quality of teaching
4 7 11 33 36 10
e) Frequently discussing educational issues with staff
8 9 13 29 33 9
f) Buffering teachers from distractions from their teaching
9 5 10 33 34 10
g) Encouraging staff to use data in their work 5 2 4 13 42 34 h) Encouraging all staff to use data in planning for individual needs
5 2 4 18 42 30
i) Incorporating research evidence into my decision making to inform practice
8 9 18 35 21 9
j) Using pupil achievement data to make most decisions about school improvement
5 5 7 20 40 24
6. Please indicate the extent to which you agree with the following statements:
Valid Percent Disagree strongly
Disagree moderately
Disagree slightly
Agree slightly
Agree moderately
Agree strongly
a) I trust most of the staff in the school to do their jobs well
0 0 2 4 33 62
b) I feel quite confident that my teachers will always treat me fairly
0 1 2 5 36 56
c) My teachers would not try to gain advantage by deceiving me
0 1 2 6 43 48
d) I feel a strong loyalty to my teachers 0 0 0 3 18 79 e) I would support my teachers in almost any emergency
0 0 1 4 16 78
f) I have a divided sense of loyalty towards my teachers
54 19 6 10 10 2
g) I am able to discuss my feelings, worries and frustrations with my teachers
7 13 9 26 28 17
h) Teachers are able to discuss their feelings, worries and frustrations with me
0 1 1 13 47 38
7. To what extent do you feel able to:
Valid Percent Not at
all Very little
Little Partially A lot Very significantly
a) Motivate teachers? 0 0 0 15 58 28 b) Generate enthusiasm for a shared vision of the school?
0 0 0 12 49 39
xxxiii

c) Manage change in your school? 0 0 0 6 46 48 d) Create a positive learning environment in your school?
0 0 0 9 49 42
e) Facilitate pupil learning in your school? 0 0 1 14 54 32 f) Raise achievement on national tests and examinations?
0 0 2 20 46 32
g) Sustain your motivation as a school leader? 0 1 1 16 41 41 h) Sustain your job satisfaction in your leadership role?
0 2 1 22 37 39
i) Sustain your commitment to the teaching profession?
0 1 1 12 36 50
j) Manage multiple accountabilities from diverse audiences e.g. Governing Body, LA, Ofsted?
0 1 4 25 42 27
8. Please indicate the extent to which leadership practice in this school is provided by the following people or groups:
Valid Percent Rarely /
never Infrequently Some Moderate
amount A great
deal All the time
a) Deputy Head(s) 1 0 2 5 23 69 b) SMT/SLT 0 0 1 4 35 60 c) Heads of Faculty 0 0 3 24 52 21 d) Heads of Department 0 2 8 25 47 19 e) Groups of teachers 1 2 17 42 33 5 f) Individual teachers with formally assigned tasks (e.g. KS3 co-ordinators)
0 1 14 32 43 11
g) Individual teachers acting informally 1 5 25 36 29 5 h) Governors 4 13 20 31 23 8 i) Pupils 0 5 31 35 26 3 j) Support staff 1 5 25 39 25 5 k) School Improvement Partners (SIPs) 16 19 22 24 15 5 l) Local Authority (LA) 17 26 23 25 8 2 m) Parents 10 30 35 20 5 0 9. To what extend does each of the statements below describe the way leadership tasks are distributed or shared within your school?
Valid Percent Not at
all Very little
Little Partially A lot Very significantly
a) Leadership tasks are delegated by the Head or SMT/SLT
0 1 2 22 44 31
b) We collectively plan which individual or group(s) will carry out which leadership tasks
1 2 6 25 43 23
c) The distribution of leadership tasks in this school is “spontaneous”. It is not planned but it usually works out well
24 33 24 16 4 1
d) The distribution of leadership tasks in this school is “spontaneous”. It is not planned and it often leads to conflicts and confusion
53 34 10 3 0 0
e) Most leadership tasks in this school are carried out by the Head and the SMT/SLT
5 11 14 43 26 2
f) Very few others take on leadership tasks 32 27 16 20 5 0 10. To what extent do you agree that members of the SMT/SLT in your school…
Valid Percent Disagree strongly
Disagree moderately
Disagree slightly
Agree slightly
Agree moderately
Agree strongly
a) Share a similar set of values, beliefs and attitudes related to teaching and learning?
0 1 1 3 20 77
b) Participate in ongoing, collaborative work?
0 1 1 2 25 72
xxxiv

c) Have a role in school-wide decision-making?
0 0 1 1 11 86
d) Have a role in the development of pupil behaviour policies?
0 0 0 2 17 81
e) Have a role in the development of policies on lesson planning?
0 1 1 6 26 67
f) Have a role in the development of policies on homework?
0 0 1 7 30 62
g) Have involvement in the school evaluation and review process?
0 0 0 3 7 90
h) Have a role in classroom monitoring and assessment strategies?
0 0 0 1 17 82
i) Have a role in determining the direction of the school?
0 0 0 3 19 77
j) Have a positive impact on standards of teaching?
0 0 0 3 26 71
k) Have a positive impact on raising levels of pupil attainment?
0 0 0 3 23 74
l) Have a role in determining the allocation of resources to pupils?
0 3 1 18 35 43
11. To what extend do you use each of the following to influence or persuade others?
Valid Percent Not at
all Very little
Little Partially A lot Very significantly
a) Rational Persuasion (use of logical arguments and factual evidence)
0 0 0 12 51 37
b) Apprising (explaining how carrying out a request will be beneficial to the person)
0 1 9 32 41 16
c) Inspirational Appeals (appeals to person’s values, ideals or emotions)
1 3 9 31 39 17
d) Consultation (inviting feedback or advice about a proposed course of action)
0 0 2 16 55 27
e) Ingratiation (the use of praise and flattery) 6 18 19 32 19 5 f) Personal appeals (appealing to personal friendship or favours)
28 26 25 12 6 3
g) Exchange (offering something with the expectation of reciprocity at a later time)
23 34 23 14 5 2
h) Coalition building (enlisting the aid or support of others as a means of influence)
5 14 21 36 18 5
i) Legitimating tactics (efforts to establish the legitimacy of a course of action or to verify the authority to carry out the action)
9 18 28 26 15 4
j) Pressure (the use of demands, persistent checking etc.)
13 27 26 24 8 3
k) Personal support (offer of additional resources, empathetic responses)
2 9 12 31 35 11
12. Your school has been chosen because it has made significant improvement or sustained high academic achievement over the last three years. To what extent has your school experienced improvement in the following areas in the last three years?
Valid Percent No change A little Some A lot
a) More pupils going into further / higher education 18 19 42 21 b) Reduction in staff mobility 32 19 27 21 c) Reduction in staff absence 29 21 31 18 d) Enhanced local reputation 12 15 30 43 e) Improved homework policies and practice 20 36 34 9 f) Enhanced commitment and enthusiasm of staff 9 14 41 36 g) Promoted an orderly and secure working environment 11 16 38 35 h) Improved pupil behaviour and discipline as a result of a whole school approach
12 19 35 33
xxxv

13. To what extent do you consider that these things have changed over the past three years?
Valid Percent Much
worse now Worse now
No change
Better now
Much better now
a) Pupils’ lateness to lessons 1 6 42 43 9 b) Pupils’ lateness to school 1 6 42 44 8 c) Pupils’ absenteeism (both authorised and unauthorised)
1 6 27 48 18
d) Pupils’ missing class 0 4 40 43 14 e) Pupils’ mobility/turnover 1 8 66 17 8 f) Physical conflict among pupils 0 6 45 33 17 g) Bullying of all kinds among pupils 0 4 42 44 11 h) Vandalism of school property 1 5 39 34 22 i) Physical abuse of teachers 1 3 64 18 14 j) Verbal abuse of teachers 1 19 41 28 11 k) Levels of pupil misbehaviour 1 12 28 45 14 l) Pupils’ motivation for learning 0 4 19 56 22 14. Indicate the extent to which you agree that each statement characterises your school
Valid Percent Disagree strongly
Disagree moderately
Disagree slightly
Agree slightly
Agree moderately
Agree strongly
a) Pupils in this school can achieve the goals that have been set for them
1 0 0 2 29 69
b) Most pupils do achieve the goals that have been set for them
0 1 1 11 43 45
c) Teachers set high standards for academic performance
0 0 1 10 45 45
d) This school sets high standards for academic performance
0 0 0 4 31 64
e) Pupils respect others who get good marks / grades
0 2 8 24 38 28
f) Lesson plans are regularly discussed and monitored
1 4 6 29 40 19
g) The performance of department / subject areas is regularly monitored and targets for improvement are regularly set
1 0 1 8 29 62
h) Pupils are regularly involved in assessment for learning
0 2 3 26 46 24
i) Class teachers regularly use pupil data to set individual pupil achievement targets
0 1 2 14 44 37
15. Indicate the extent to which you agree that each statement characterises your school
Valid Percent Disagree strongly
Disagree moderately
Disagree slightly
Agree slightly
Agree moderately
Agree strongly
a) Most teachers in our school share a similar set of values, beliefs and attitudes related to teaching and learning
0 1 1 8 44 47
b) Teachers in our school mostly work together to improve their practice
1 0 2 8 45 45
c) There is ongoing collaborative planning of classroom work among teachers in our school
0 1 3 15 50 31
d) Pupils feel safe in our school 0 0 1 7 36 57 e) Teachers and other adults in the classroom work collaboratively
0 0 1 14 47 37
f) Parents often visit the school 3 10 13 34 28 12
xxxvi

g) The school is actively involved in work with other schools or organisations (e.g. networks, GTC, NCSL or other learning partnerships)
2 3 2 17 31 45
16. Indicate the extent to which you agree that each statement characterises your school
Valid Percent Disagree strongly
Disagree moderately
Disagree slightly
Agree slightly
Agree moderately
Agree strongly
a) Disruptions to teaching time are minimised
0 3 4 18 45 30
b) The school timetable provides adequate time for collaborative teacher planning
3 6 15 27 29 21
c) Our pupil assessment practices reflect our curriculum standards
1 1 5 24 50 21
d) We are able to provide a coherent teaching and learning programme for pupils across the years
0 1 2 7 37 53
e) Pupils of similar academic ability are grouped together for teaching in most subject areas
3 7 6 14 32 38
f) Teachers in this school have a sense of collective responsibility for pupil learning
0 0 1 12 40 47
g) Teachers’ teaching strategies enable pupils to construct their own knowledge
0 2 6 36 49 8
h) There are more opportunities for pupils to take responsibilities for their own learning in school now than three years ago
0 1 1 18 42 38
17. Which of these services do you provide some, or full access to (this might be on site or by referral)?
Valid Percent Full access Some access No access
a) Year round childcare from 8am to 6pm weekdays 6 30 64 b) A varied menu of activities (such as homework clubs, art, sport, music, language) before and after school
53 47 1
c) Parenting support, including structured parenting support programmes
9 49 42
d) Swift and easy referral to health and social services 30 55 15 e) Wider community access to your facilities (e.g. ICT, sports hall) 43 51 6 18. To what extent do these services rely upon…
Valid Percent Greatly To some
extent Not at all Not applicable
(no extended services)
a) An extended schools co-ordinator/manager? 12 26 41 22 b) Partnerships with the local authority, PCT, or voluntary, private or independent organisations?
9 43 33 15
c) Cluster relationships with other schools/Children’s Centres? 8 39 39 14 d) The involvement of teachers to run out of hours activities? 44 48 5 3 e) Your own involvement to lead the strategy for extended services?
15 54 19 12
f) Your own involvement to establish/run services? 8 50 32 10
xxxvii

19. Indicate the extent to which you agree that each statement characterises your school
Valid Percent Disagree strongly
Disagree moderately
Disagree slightly
Agree slightly
Agree moderately
Agree strongly
a) Our school provides a broad range of extracurricular activities for pupils (e.g. plays, athletics, music, dance)
0 1 1 5 27 66
b) Our school provides after school academic support activities
0 1 2 12 32 53
c) Most of our pupils participate regularly in at least one extracurricular school activity
1 4 11 24 39 21
d) Most of our teachers participate regularly in at least one extracurricular school activity
3 9 17 28 29 14
20. Indicate the extent to which you agree that each statement characterises conditions in classrooms within your school
Valid Percent Disagree strongly
Disagree moderately
Disagree slightly
Agree slightly
Agree moderately
Agree strongly
a) Teachers’ workload is quite fair compared with teachers in other schools
1 4 4 9 34 49
b) Teachers in this school teach an excessive number of pupils
39 31 17 9 4 1
c) The size of classes makes unreasonable demands on the time required for preparation and marking
40 28 14 13 3 2
d) The size of classes allows teachers to adequately differentiate their teaching between pupils
3 5 13 24 43 12
e) The amount of administrative work required of teachers is not excessive
2 5 9 14 34 36
f) Teachers’ non-teaching (other than admin.) duties in the school are not excessive
0 3 3 14 32 48
g) Teachers teach subjects or areas of the curriculum for which they have little formal preparation
66 18 6 6 1 3
h) This school has too many pupils who are uncooperative
46 16 12 16 6 4
i) This school has too many pupils who achieve poorly in spite of teachers’ best efforts
37 19 11 21 9 3
j) Teachers have a significant amount of autonomy over decisions about what happens in their classes
1 4 5 23 44 24
k) Teachers have access to the teaching resources that they need to do a good job
1 2 3 10 46 38
l) The atmosphere throughout my school encourages pupils to learn
0 0 1 7 37 55
Sex
Valid Percent
Male Female 63 37
Age
Valid Percent
31-35 36-40 41-45 46-50 51-55 56-60 61-65 Over 65 0 2 11 20 41 24 1 0
xxxviii

Education background*
Percent
Non-graduate Certificate / Diploma
Degree Postgraduate Certificate / Diploma
Masters Doctorate Other qualification
11 83 54 52 6 14 *These figures will not add up to 100 as some teachers selected a qualification more than once How long have you been a headteacher in total?
Valid Percent
0-3 years 4-7 years 8-15 years 16-23 years 24 years or more 25 30 36 8 1
How long have you been a headteacher in this school?
Valid Percent
0-3 years 4-7 years 8-15 years 16-23 years 24 years or more 26 32 29 13 0
How long were you a deputy headteacher?
Valid Percent
0-3 years 4-7 years 8-15 years 16-23 years 24 years or more Not applicable 15 61 20 2 0 1
Were you a deputy headteacher at this school before you became headteacher?
Valid Percent
Yes No 24 76
Including yourself, how many headteachers has your current school had in the past 10 years?
Valid Percent
1 2 3 4 5 6 7 8 25 48 18 4 1 1 1 0
xxxix

Appendix XVIII: Primary Key Staff
Questionnaire Survey – Wave 1
The Impact of School Leadership on Pupil Outcomes Key Staff Questionnaire – Primary
N = 606 1. To what extent do you agree that the headteacher in your school does the following things?
Valid Percent Disagree strongly
Disagree moderately
Disagree slightly
Agree slightly
Agree moderately
Agree strongly
a) Gives staff an overall sense of purpose 0 0 1 4 23 72 b) Helps clarify the reasons for our school’s improvement initiatives
0 0 0 4 20 75
c) Provides assistance to staff in setting short-term goals for teaching and learning
0 1 2 10 37 50
d) Demonstrates high expectations for staff’s work with pupils
0 0 1 4 20 75
e) Demonstrates high expectations for pupil behaviour
0 0 2 5 20 74
f) Demonstrates high expectations for pupil achievement
0 0 0 2 17 81
g) Works collaboratively with the Governing Body
0 0 0 3 15 82
h) Works collaboratively with the Local Authority (LA)
0 0 0 6 21 72
i) Works collaboratively with the SMT/SLT 0 0 0 3 17 80 j) Integrates school priorities with the National Government’s policy agenda
0 0 0 5 29 66
2. To what extent do you agree that the headteacher in your school does the following things?
Valid Percent Not at
all Very little
Little Partially A lot Very significantly
a) Gives staff individual support to help them improve their teaching practices
0 1 3 11 35 50
b) Encourages them to consider new ideas for their teaching
0 1 1 8 30 60
c) Models a high level of professional practice 1 1 3 6 24 66 d) Develops an atmosphere of caring and trust 0 1 2 7 20 71 e) Promotes leadership development amongst teachers
0 0 1 5 20 73
f) Promotes a range of CPD experiences among all staff
0 1 1 7 27 64
g) Encourages staff to think of learning beyond the academic curriculum (e.g. personal, emotional and social education, citizenship, etc.)
0 0 0 6 23 70
3. To what extent do you agree that the headteacher in your school does the following?
Valid Percent Not at
all Very little
Little Partially A lot Very significantly
a) Encourages collaborative work amongst staff
0 0 1 4 24 71
b) Ensures wide participation in decisions about school improvement
0 1 2 7 35 55
c) Engages students in the school’s improvement efforts
0 1 3 15 40 41
d) Increases dialogue about school improvement between pupils and adults
0 1 2 20 39 39
xl

e) Improves internal review procedures 0 0 4 12 39 46 f) Builds community support for the school’s improvement efforts
0 1 3 16 39 42
g) Utilises support staff skills for the benefit of pupil learning
0 0 1 6 24 69
h) Allocates resources strategically based on pupil needs
0 0 1 7 29 63
i) Works in collaboration with other schools 0 0 1 11 32 56 j) Structures the organisation to facilitate work 0 0 1 6 31 63 4. To what extent do you agree that the headteacher in your school does the following?
Valid Percent Not at
all Very little
Little Partially A lot Very significantly
a) Provides or locates resources to help staff improve their teaching
0 1 3 12 33 51
b) Regularly observes classroom activities 1 2 4 14 31 49 c) After observing classroom activities, works with teachers to improve their teaching
1 2 5 17 33 43
d) Uses coaching and mentoring to improve the quality of teaching
1 2 7 17 32 41
e) Frequently discusses educational issues with staff
0 1 2 9 23 65
f) Buffers teachers from distractions from their teaching
1 1 3 14 36 45
g) Encourages staff to use data in their work 0 0 2 6 27 65 h) Encourages all staff to use data in planning for individual needs
0 0 2 7 27 63
i) Incorporates research evidence into my decision making to inform practice
1 1 3 14 38 43
j) Uses pupil achievement data to make most decisions about school improvement
0 0 1 6 20 73
5. Indicate the extent to which you agree that each statement characterises your school:
Valid Percent Disagree strongly
Disagree moderately
Disagree slightly
Agree slightly
Agree moderately
Agree strongly
a) I have regular opportunities to collaborate with my colleagues (e.g. common planning times)
1 1 2 10 24 61
b) My colleagues and I work together in small teams to accomplish many of our tasks
1 2 2 9 25 61
c) I have sufficient opportunity to prepare for my teaching
1 1 3 11 34 50
d) I have access to useful professional development opportunities
0 1 1 6 28 65
e) I participate in many school-wide decisions
1 1 1 5 20 73
f) My school’s physical facilities allow me to use the types of teaching I consider best
0 2 4 9 34 51
6. To what extent do you agree that the headteacher in your school:
Valid Percent Disagree strongly
Disagree moderately
Disagree slightly
Agree slightly
Agree moderately
Agree strongly
a) Identifies others’ strengths and weaknesses?
0 0 1 7 26 66
b) Accurately reads peoples’ moods, feelings, or non-verbal cues?
2 2 5 15 34 43
c) Gives others opportunities to speak their minds?
1 2 3 7 30 58
xli

d) Pays attention and listens well? 0 2 3 8 28 58 e) Shows sensitivity and understanding? 1 1 2 8 24 63 f) Asks questions to be sure he/she understands another person?
1 1 3 10 28 58
7. Please indicate the extent to which you agree with the following statements about the headteacher in your school:
Valid Percent Disagree strongly
Disagree moderately
Disagree slightly
Agree slightly
Agree moderately
Agree strongly
a) I feel quite confident that my headteacher will always try to treat me fairly
1 1 1 2 15 81
b) My headteacher would not try to gain advantage by deceiving me
1 0 2 3 14 81
c) I feel a strong loyalty to my headteacher
0 0 1 4 13 82
d) I would support my headteacher in almost any emergency
0 0 0 0 6 93
e) I have a divided sense of loyalty towards my headteacher
65 11 4 3 7 10
f) I am able to discuss my feelings, worries and frustrations with my headteacher
1 1 3 6 22 67
g) The headteacher looks out for the personal welfare of the teachers in this school
0 1 2 8 19 70
h) The headteacher trusts most of the staff in the school to do their jobs well
0 1 2 5 25 67
8. To what extent do you feel that the headteacher:
Valid Percent Not at
all Very little
Little Partially A lot Very significantly
a) Motivates teachers? 0 1 2 20 44 34 b) Generates enthusiasm for a shared vision of the school?
0 0 2 14 36 47
c) Manages change in your school? 0 0 1 9 32 58 d) Creates a positive learning environment in your school?
0 0 1 9 31 60
e) Facilitates pupil learning in your school? 0 0 1 8 35 56 f) Raises achievement on national tests and examinations?
0 1 2 18 36 44
g) Sustains your motivation as a school leader? 0 1 1 14 31 54 h) Sustains your job satisfaction in your leadership role?
1 1 2 14 33 51
i) Sustains your commitment to the teaching profession?
0 1 2 15 31 51
j) Manages multiple accountabilities from diverse audiences e.g. Governing Body, LA, Ofsted?
0 0 1 5 26 68
9. To what extent do you agree that the headteacher in your school:
Valid Percent Disagree strongly
Disagree moderately
Disagree slightly
Agree slightly
Agree moderately
Agree strongly
a) Is expert at solving the day-to-day problems that arise in our school?
0 1 1 6 24 68
b) Has the background knowledge to help us find solutions to the most important challenges we face in this school?
0 1 1 5 22 72
c) Is skilful in facilitating our collective problem solving processes?
0 1 2 8 29 60
xlii

d) Helps us clarify our goals for problem solving?
0 0 2 9 30 59
e) Remains calm in the face of urgent problems and crises?
0 1 1 5 22 71
f) Helps us clarify our basic professional values and acts in a manner that is consistent with those values?
0 0 2 6 22 70
10. To what extent do you agree that the headteacher in your school:
Valid Percent Disagree strongly
Disagree moderately
Disagree slightly
Agree slightly
Agree moderately
Agree strongly
a) Is well aware of the educational policies and procedures related to the work we are doing in the school?
0 0 0 3 16 82
b) Has a good grasp of the basic ideas underlying the kind of teaching we are engaged in at this school?
0 0 0 3 18 79
c) Is up-to-date in the content knowledge we teach to our pupils?
0 1 4 7 29 59
d) Has a sophisticated understanding of good leadership and management practices?
0 0 1 5 22 72
e) Knows how to help us improve the quality of our programmes of work and our teaching?
0 0 3 8 31 58
11. Please indicate the extent to which you agree with the following statements:
Valid Percent Disagree strongly
Disagree moderately
Disagree slightly
Agree slightly
Agree moderately
Agree strongly
a) Teachers in this school really care about each other
1 1 1 7 30 60
b) Teachers in this school trust each other 0 1 2 7 36 53 c) Teachers are able to discuss feelings, worries and frustrations with other teachers
0 1 1 7 26 65
d) Teachers in this school respect colleagues who take the lead in school improvement efforts
1 1 2 6 32 60
12. Please indicate the extent to which you agree with the following statements:
Valid Percent Disagree strongly
Disagree moderately
Disagree slightly
Agree slightly
Agree moderately
Agree strongly
a) If pupils aren’t disciplined at home, they aren’t likely to accept any discipline
24 22 10 19 19 7
b) When I really try, I can get through to the most difficult or unmotivated pupils
1 1 1 7 43 48
c) A teacher is very limited in what he/she can achieve because a pupil’s home environment is a large influence on his/her achievement
22 27 11 23 13 4
d) If parents would do more for their children, I could do more
7 10 7 30 26 20
e) If a pupil did not remember information I gave in a previous lesson, I would know how to increase his/her retention in the next lesson
2 2 2 14 51 30
xliii

13. Please indicate the extent to which leadership practice in this school is provided by the following people or groups:
Valid Percent Rarely /
never Infrequently Some Moderate
amount A great
deal All the time
a) Headteacher 0 0 2 4 25 69 b) Deputy Head 1 1 4 13 38 44 c) SMT/SLT 0 0 6 18 46 30 d) Key Stage Managers 2 2 5 24 42 24 e) Groups of teachers 1 4 18 36 29 11 f) Individual teachers with formally assigned tasks (e.g. subject co-ordinators)
0 2 12 34 39 13
g) Individual teachers acting informally 2 10 24 33 23 9 h) Governors 8 19 22 27 18 5 i) Pupils 5 11 32 29 19 4 j) Support staff 4 13 31 25 20 6 k) School Improvement Partners (SIPs) 10 12 29 27 19 3 l) Local Authority (LA) 4 12 26 35 20 3 m) Parents 15 21 33 24 7 2 14. To what extend does each of the statements below describe the way leadership tasks are distributed or shared within your school?
Valid Percent Not at
all Very little
Little Partially A lot Very significantly
a) Leadership tasks are delegated by the Head or SMT/SLT
0 2 1 19 40 38
b) We collectively plan which individual or group(s) will carry out which leadership tasks
2 7 9 29 35 20
c) The distribution of leadership tasks in this school is “spontaneous”. It is not planned but it usually works out well
31 31 14 16 6 2
d) The distribution of leadership tasks in this school is “spontaneous”. It is not planned and it often leads to conflicts and confusion
64 24 7 4 1 0
e) Most leadership tasks in this school are carried out by the Head and the SMT/SLT
1 3 4 24 45 23
f) Very few others take on leadership tasks 16 16 18 34 13 3 15. To what extent do you agree that members of the SMT/SLT in your school…
Valid Percent Disagree strongly
Disagree moderately
Disagree slightly
Agree slightly
Agree moderately
Agree strongly
a) Share a similar set of values, beliefs and attitudes related to teaching and learning?
1 1 1 4 27 67
b) Participate in ongoing, collaborative work?
0 1 1 6 31 62
c) Have a role in school-wide decision-making?
0 0 1 5 29 65
d) Have a role in the development of pupil behaviour policies?
0 0 1 6 27 67
e) Have a role in the development of policies on lesson planning?
1 0 1 8 33 57
f) Have a role in the development of policies on homework?
1 0 3 10 34 53
g) Have involvement in the school evaluation and review process?
0 0 0 4 23 72
h) Have a role in classroom monitoring and assessment strategies?
0 0 1 5 27 67
i) Have a role in determining the direction of the school?
0 0 0 7 32 61
j) Have a positive impact on standards of teaching?
0 0 0 7 30 63
xliv

k) Have a positive impact on raising levels of pupil attainment?
0 1 0 6 29 65
l) Have a role in determining the allocation of resources to pupils?
0 1 3 13 32 51
16. To what extend does the headteacher use each of the following to influence or persuade others?
Valid Percent Not at
all Very little
Little Partially A lot Very significantly
a) Rational Persuasion (use of logical arguments and factual evidence)
0 2 2 15 42 39
b) Apprising (explaining how carrying out a request will be beneficial to the person)
1 2 5 26 38 28
c) Inspirational Appeals (appeals to person’s values, ideals or emotions)
1 4 9 32 32 22
d) Consultation (inviting feedback or advice about a proposed course of action)
1 1 3 14 44 37
e) Ingratiation (the use of praise and flattery) 9 14 20 30 19 8 f) Personal appeals (appealing to personal friendship or favours)
27 24 23 15 9 3
g) Exchange (offering something with the expectation of reciprocity at a later time)
34 25 20 15 5 2
h) Coalition building (enlisting the aid or support of others as a means of influence)
20 19 21 25 12 3
i) Legitimating tactics (efforts to establish the legitimacy of a course of action or to verify the authority to carry out the action)
15 16 20 29 14 6
j) Pressure (the use of demands, persistent checking etc.)
28 32 21 12 7 1
k) Personal support (offer of additional resources, empathetic responses)
6 8 14 29 27 16
17. Your school has been chosen because it has made significant improvement or sustained high academic achievement over the last three years. To what extent has your school experienced improvement in the following areas in the last three years?
Valid Percent No change A little Some A lot
a) Reduction in staff mobility 42 16 24 17 b) Reduction in staff absence 45 14 25 16 c) Enhanced local reputation 17 12 37 34 d) Improved homework policies and practice 21 22 36 21 e) Enhanced commitment and enthusiasm of staff 15 12 31 42 f) Promoted an orderly and secure working environment 18 11 29 43 g) Improved pupil behaviour and discipline as a result of a whole school approach
17 16 30 38
18. To what extent do you consider that these things have changed over the past three years?
Valid Percent Much
worse now Worse now
No change
Better now
Much better now
a) Pupils’ lateness to lessons 0 1 61 26 12 b) Pupils’ lateness to school 0 4 43 42 11 c) Pupils’ absenteeism (both authorised and unauthorised)
0 3 39 44 14
d) Pupils’ missing class 0 0 71 17 11 e) Pupils’ mobility/turnover 1 12 62 17 7 f) Physical conflict among pupils 0 5 41 37 17 g) Bullying of all kinds among pupils 0 2 42 39 17 h) Vandalism of school property 1 5 55 23 16 i) Physical abuse of teachers 1 2 74 12 12
xlv

j) Verbal abuse of teachers 1 4 66 16 13 k) Levels of pupil misbehaviour 1 7 39 34 19 l) Pupils’ motivation for learning 0 3 20 49 29 19. Indicate the extent to which you agree that each statement characterises the teachers you work with
Valid Percent Disagree strongly
Disagree moderately
Disagree slightly
Agree slightly
Agree moderately
Agree strongly
a) Pupils in this school can achieve the goals that have been set for them
0 0 1 4 42 52
b) Most pupils do achieve the goals that have been set for them
0 0 1 7 44 48
c) Teachers set high standards for academic performance
0 1 1 6 33 60
d) This school sets high standards for academic performance
0 0 1 4 27 69
e) Pupils respect others who get good marks / grades
1 0 2 10 39 49
f) Lesson plans are regularly discussed and monitored
1 3 4 18 35 40
g) The performance of department / subject areas is regularly monitored and targets for improvement are regularly set
0 1 3 16 38 42
h) Pupils are regularly involved in assessment for learning
0 0 3 16 37 43
i) Class teachers regularly use pupil data to set individual pupil achievement targets
0 1 1 8 33 58
20. Indicate the extent to which you agree that each statement characterises your school
Valid Percent Disagree strongly
Disagree moderately
Disagree slightly
Agree slightly
Agree moderately
Agree strongly
a) Most teachers in our school share a similar set of values, beliefs and attitudes related to teaching and learning
0 1 1 5 32 62
b) The goals I am expected to accomplish with my pupils are clear to me
0 0 0 1 20 79
c) There is no conflict in my mind about what I am expected to do
0 0 2 3 21 74
d) Pupils feel safe in our school 0 0 0 2 14 84 e) Teachers and other adults in the classroom work collaboratively
0 0 0 2 16 82
f) Parents often visit the school 1 3 5 14 33 44 g) The school is actively involved in work with other schools or organisations (e.g. networks, GTC, NCSL or other learning partnerships)
1 1 3 15 30 51
h) Our school provides a broad range of extracurricular activities for pupils (e.g. plays, athletics, music, dance)
0 0 1 6 18 75
21. Indicate the extent to which you agree that each statement characterises your school
Valid Percent Disagree strongly
Disagree moderately
Disagree slightly
Agree slightly
Agree moderately
Agree strongly
a) Disruptions to teaching time are minimised
0 1 4 7 41 47
b) The school timetable provides adequate time for collaborative teacher planning
5 6 11 18 28 34
c) Our pupil assessment practices reflect our curriculum standards
0 1 1 10 41 48
xlvi

d) We are able to provide a coherent teaching and learning programme for pupils across the years
0 0 1 3 30 67
e) Pupils of similar academic ability are grouped together for teaching in most subject areas
5 6 8 20 32 29
f) Teachers in this school have a sense of collective responsibility for pupil learning
0 1 1 7 31 61
g) Teachers’ teaching strategies enable pupils to construct their own knowledge
0 1 2 16 50 31
h) There are more opportunities for pupils to take responsibilities for their own learning in school now than three years ago
0 1 2 16 31 51
22. Indicate the extent to which you agree that each statement characterises conditions in your classroom
Valid Percent Disagree strongly
Disagree moderately
Disagree slightly
Agree slightly
Agree moderately
Agree strongly
a) My workload is quite fair compared with teachers in other schools
2 7 9 16 35 32
b) I teach an excessive number of pupils 56 15 12 8 6 4 c) The size of my class(es) makes unreasonable demands on the time required for preparation and marking
53 15 12 10 7 3
d) The size of my class(es) allows me to adequately differentiate my teaching between pupils
4 4 9 15 36 33
e) The amount of administrative work required of me is not excessive
7 13 20 18 27 15
f) My non-teaching (other than admin.) duties in the school are not excessive
4 8 15 17 29 27
g) I teach subjects or areas of the curriculum for which I have little formal preparation
45 19 12 13 9 2
h) I have too many pupils who are uncooperative
60 16 8 9 3 4
i) I have too many pupils who achieve poorly in spite of my best efforts
43 22 11 15 7 2
j) I have a significant amount of autonomy over decisions about what happens in my classes
1 2 2 8 37 50
k) I have access to the teaching resources that I need to do a good job
0 1 2 10 40 48
l) The atmosphere throughout the school encourages pupils to learn
0 0 0 4 24 72
Sex
Valid Percent
Male Female 18 82
Age
Valid Percent
30 or under 31-35 36-40 41-45 46-50 51-55 56-60 61-65 Over 65 16 18 14 14 15 14 9 0 0
Education background*
xlvii

Percent
Non-graduate Certificate / Diploma
Degree Postgraduate Certificate / Diploma
Masters Doctorate Other qualification
100 76 30 7 0 0 *These figures will not add up to 100 as some teachers selected a qualification more than once How long have you been a teacher in total?
Valid Percent
0-3 years 4-7 years 8-15 years 16-23 years 24 years or more 3 19 37 18 23
How long have you been a teacher in this school?
Valid Percent
0-3 years 4-7 years 8-15 years 16-23 years 24 years or more 18 32 26 12 12
How long have you been a key stage manager in total?
Valid Percent
0-3 years 4-7 years 8-15 years 16-23 years 24 years or more 36 35 22 5 2
How long have you been a key stage manager in this school?
Valid Percent
0-3 years 4-7 years 8-15 years 16-23 years 24 years or more 46 33 15 4 2
What key stage do you manage?
Valid Percent
Key stage 1 Key stage 2 35 65
xlviii

Appendix XIX: Secondary Key Staff
Questionnaire Survey – Wave 1
The Impact of School Leadership on Pupil Outcomes Key Staff Questionnaire – Secondary
N = 1167 1. To what extent do you agree that the headteacher in your school does the following things?
Valid Percent Disagree strongly
Disagree moderately
Disagree slightly
Agree slightly
Agree moderately
Agree strongly
a) Gives staff an overall sense of purpose 1 1 2 7 29 61 b) Helps clarify the reasons for our school’s improvement initiatives
0 1 1 8 29 60
c) Provides assistance to staff in setting short-term goals for teaching and learning
2 4 5 21 38 31
d) Demonstrates high expectations for staff’s work with pupils
1 1 1 7 21 70
e) Demonstrates high expectations for pupil behaviour
2 2 6 11 28 52
f) Demonstrates high expectations for pupil achievement
0 1 1 5 19 74
g) Works collaboratively with the Governing Body
0 0 1 5 24 71
h) Works collaboratively with the Local Authority (LA)
0 0 2 8 32 59
i) Works collaboratively with the SMT/SLT 1 1 2 6 20 72 j) Integrates school priorities with the National Government’s policy agenda
0 0 1 8 33 58
2. To what extent do you agree that the headteacher in your school does the following things?
Valid Percent Not at
all Very little
Little Partially A lot Very significantly
a) Gives staff individual support to help them improve their teaching practices
4 5 7 21 34 30
b) Encourages them to consider new ideas for their teaching
1 3 4 18 32 43
c) Models a high level of professional practice 1 2 3 10 23 61 d) Develops an atmosphere of caring and trust 3 2 5 14 26 51 e) Promotes leadership development amongst teachers
1 1 3 10 27 58
f) Promotes a range of CPD experiences among all staff
1 2 4 14 33 46
g) Encourages staff to think of learning beyond the academic curriculum (e.g. personal, emotional and social education, citizenship, etc.)
1 2 4 16 33 44
3. To what extent do you agree that the headteacher in your school does the following?
Valid Percent Not at
all Very little
Little Partially A lot Very significantly
a) Encourages collaborative work amongst staff
0 1 3 15 33 48
b) Ensures wide participation in decisions about school improvement
3 3 6 17 33 37
c) Engages students in the school’s improvement efforts
0 2 7 23 40 28
d) Increases dialogue about school improvement between pupils and adults
1 2 6 23 41 28
xlix

e) Improves internal review procedures 1 2 3 18 37 40 f) Builds community support for the school’s improvement efforts
1 2 5 19 39 35
g) Utilises support staff skills for the benefit of pupil learning
1 2 4 15 36 43
h) Allocates resources strategically based on pupil needs
1 2 4 17 36 40
i) Works in collaboration with other schools 0 1 3 14 35 46 j) Structures the organisation to facilitate work 1 2 3 14 30 51 4. To what extent do you agree that the headteacher in your school does the following?
Valid Percent Not at
all Very little
Little Partially A lot Very significantly
a) Provides or locates resources to help staff improve their teaching
1 2 4 18 35 40
b) Regularly observes classroom activities 5 5 11 19 29 33 c) After observing classroom activities, works with teachers to improve their teaching
6 7 13 23 29 21
d) Uses coaching and mentoring to improve the quality of teaching
3 4 9 23 33 27
e) Frequently discusses educational issues with staff
1 3 7 16 31 42
f) Buffers teachers from distractions from their teaching
3 4 11 20 32 30
g) Encourages staff to use data in their work 0 0 2 9 22 67 h) Encourages all staff to use data in planning for individual needs
0 0 2 11 28 59
i) Incorporates research evidence into my decision making to inform practice
1 1 3 20 33 42
j) Uses pupil achievement data to make most decisions about school improvement
0 0 1 10 29 60
5. Indicate the extent to which you agree that each statement characterises your school:
Valid Percent Disagree strongly
Disagree moderately
Disagree slightly
Agree slightly
Agree moderately
Agree strongly
a) I have regular opportunities to collaborate with my colleagues (e.g. common planning times)
3 6 10 19 31 32
b) My colleagues and I work together in small teams to accomplish many of our tasks
1 3 6 17 29 45
c) I have sufficient opportunity to prepare for my teaching
6 7 12 21 30 25
d) I have access to useful professional development opportunities
1 3 5 16 30 45
e) I participate in many school-wide decisions
3 4 8 20 26 39
f) My school’s physical facilities allow me to use the types of teaching I consider best
5 5 8 18 31 33
6. To what extent do you agree that the headteacher in your school:
Valid Percent Disagree strongly
Disagree moderately
Disagree slightly
Agree slightly
Agree moderately
Agree strongly
a) Identifies others’ strengths and weaknesses?
1 2 3 13 33 48
b) Accurately reads peoples’ moods, feelings, or non-verbal cues?
4 5 9 16 31 36
c) Gives others opportunities to speak their minds?
3 4 5 16 28 44
l

d) Pays attention and listens well? 3 3 5 12 26 50 e) Shows sensitivity and understanding? 3 2 5 14 25 51 f) Asks questions to be sure he/she understands another person?
2 2 5 14 26 52
7. Please indicate the extent to which you agree with the following statements about the headteacher in your school:
Valid Percent Disagree strongly
Disagree moderately
Disagree slightly
Agree slightly
Agree moderately
Agree strongly
a) I feel quite confident that my headteacher will always try to treat me fairly
2 2 2 6 18 71
b) My headteacher would not try to gain advantage by deceiving me
2 2 3 7 17 69
c) I feel a strong loyalty to my headteacher
2 1 3 11 17 67
d) I would support my headteacher in almost any emergency
1 1 1 4 13 81
e) I have a divided sense of loyalty towards my headteacher
56 15 6 7 6 10
f) I am able to discuss my feelings, worries and frustrations with my headteacher
3 4 5 14 24 50
g) The headteacher looks out for the personal welfare of the teachers in this school
2 3 4 12 28 50
h) The headteacher trusts most of the staff in the school to do their jobs well
2 3 5 12 31 47
8. To what extent do you feel that the headteacher:
Valid Percent Not at
all Very little
Little Partially A lot Very significantly
a) Motivates teachers? 1 3 4 26 42 24 b) Generates enthusiasm for a shared vision of the school?
1 3 4 20 35 38
c) Manages change in your school? 0 1 2 12 36 50 d) Creates a positive learning environment in your school?
0 1 4 19 36 41
e) Facilitates pupil learning in your school? 0 1 3 16 42 38 f) Raises achievement on national tests and examinations?
1 1 5 19 33 42
g) Sustains your motivation as a school leader? 2 3 4 18 32 41 h) Sustains your job satisfaction in your leadership role?
2 3 6 20 32 37
i) Sustains your commitment to the teaching profession?
2 3 6 19 32 37
j) Manages multiple accountabilities from diverse audiences e.g. Governing Body, LA, Ofsted?
0 0 1 9 31 59
9. To what extent do you agree that the headteacher in your school:
Valid Percent Disagree strongly
Disagree moderately
Disagree slightly
Agree slightly
Agree moderately
Agree strongly
a) Is expert at solving the day-to-day problems that arise in our school?
2 2 5 12 35 44
b) Has the background knowledge to help us find solutions to the most important challenges we face in this school?
1 1 3 9 30 57
c) Is skilful in facilitating our collective problem solving processes?
1 2 5 14 33 45
li
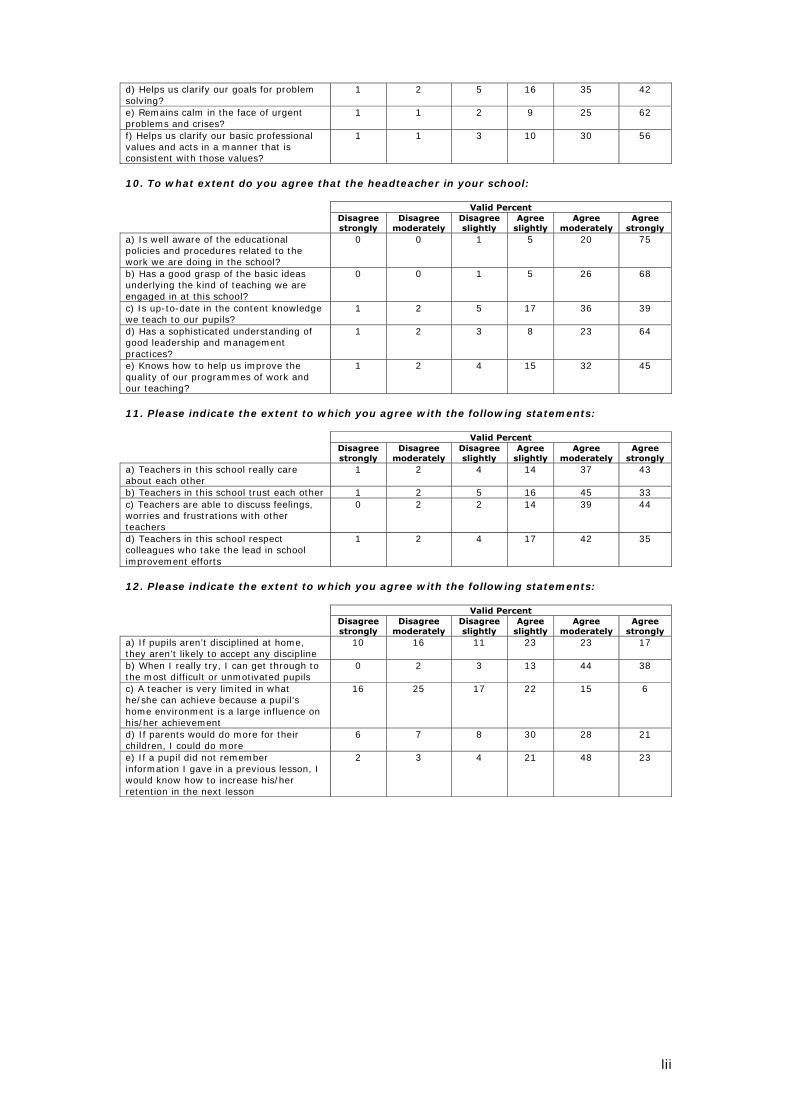
d) Helps us clarify our goals for problem solving?
1 2 5 16 35 42
e) Remains calm in the face of urgent problems and crises?
1 1 2 9 25 62
f) Helps us clarify our basic professional values and acts in a manner that is consistent with those values?
1 1 3 10 30 56
10. To what extent do you agree that the headteacher in your school:
Valid Percent Disagree strongly
Disagree moderately
Disagree slightly
Agree slightly
Agree moderately
Agree strongly
a) Is well aware of the educational policies and procedures related to the work we are doing in the school?
0 0 1 5 20 75
b) Has a good grasp of the basic ideas underlying the kind of teaching we are engaged in at this school?
0 0 1 5 26 68
c) Is up-to-date in the content knowledge we teach to our pupils?
1 2 5 17 36 39
d) Has a sophisticated understanding of good leadership and management practices?
1 2 3 8 23 64
e) Knows how to help us improve the quality of our programmes of work and our teaching?
1 2 4 15 32 45
11. Please indicate the extent to which you agree with the following statements:
Valid Percent Disagree strongly
Disagree moderately
Disagree slightly
Agree slightly
Agree moderately
Agree strongly
a) Teachers in this school really care about each other
1 2 4 14 37 43
b) Teachers in this school trust each other 1 2 5 16 45 33 c) Teachers are able to discuss feelings, worries and frustrations with other teachers
0 2 2 14 39 44
d) Teachers in this school respect colleagues who take the lead in school improvement efforts
1 2 4 17 42 35
12. Please indicate the extent to which you agree with the following statements:
Valid Percent Disagree strongly
Disagree moderately
Disagree slightly
Agree slightly
Agree moderately
Agree strongly
a) If pupils aren’t disciplined at home, they aren’t likely to accept any discipline
10 16 11 23 23 17
b) When I really try, I can get through to the most difficult or unmotivated pupils
0 2 3 13 44 38
c) A teacher is very limited in what he/she can achieve because a pupil’s home environment is a large influence on his/her achievement
16 25 17 22 15 6
d) If parents would do more for their children, I could do more
6 7 8 30 28 21
e) If a pupil did not remember information I gave in a previous lesson, I would know how to increase his/her retention in the next lesson
2 3 4 21 48 23
lii

13. Please indicate the extent to which leadership practice in this school is provided by the following people or groups:
Valid Percent Rarely /
never Infrequently Some Moderate
amount A great
deal All the time
a) Headteacher 1 2 4 12 30 52 b) Deputy Head(s) 1 3 6 15 38 38 c) SMT/SLT 0 2 8 19 41 29 d) Heads of Faculty 2 1 8 21 48 21 e) Heads of Department 0 1 8 24 45 21 f) Groups of teachers 2 6 23 35 28 6 g) Individual teachers with formally assigned tasks (e.g. KS3 co-ordinators)
1 4 18 34 34 9
h) Individual teachers acting informally 3 12 27 31 22 6 i) Governors 11 19 24 25 17 5 j) Pupils 8 17 36 26 10 3 k) Support staff 10 22 30 23 12 3 l) School Improvement Partners (SIPs) 11 18 30 24 13 4 m) Local Authority (LA) 8 19 29 28 14 3 n) Parents 16 29 28 20 5 2 14. To what extend does each of the statements below describe the way leadership tasks are distributed or shared within your school?
Valid Percent Not at
all Very little
Little Partially A lot Very significantly
a) Leadership tasks are delegated by the Head or SMT/SLT
0 2 3 18 45 33
b) We collectively plan which individual or group(s) will carry out which leadership tasks
8 13 16 28 25 10
c) The distribution of leadership tasks in this school is “spontaneous”. It is not planned but it usually works out well
32 32 16 15 5 1
d) The distribution of leadership tasks in this school is “spontaneous”. It is not planned and it often leads to conflicts and confusion
51 27 8 9 4 1
e) Most leadership tasks in this school are carried out by the Head and the SMT/SLT
2 4 11 37 35 11
f) Very few others take on leadership tasks 20 20 19 28 11 3 15. To what extent do you agree that members of the SMT/SLT in your school…
Valid Percent Disagree strongly
Disagree moderately
Disagree slightly
Agree slightly
Agree moderately
Agree strongly
a) Share a similar set of values, beliefs and attitudes related to teaching and learning?
1 3 5 10 36 45
b) Participate in ongoing, collaborative work?
1 2 5 15 36 42
c) Have a role in school-wide decision-making?
0 0 2 8 31 59
d) Have a role in the development of pupil behaviour policies?
0 1 1 8 32 57
e) Have a role in the development of policies on lesson planning?
1 2 5 17 35 39
f) Have a role in the development of policies on homework?
1 2 4 14 35 45
g) Have involvement in the school evaluation and review process?
0 0 1 5 23 70
h) Have a role in classroom monitoring and assessment strategies?
0 2 2 11 34 52
i) Have a role in determining the direction of the school?
1 0 1 7 27 63
liii

j) Have a positive impact on standards of teaching?
1 3 4 17 35 41
k) Have a positive impact on raising levels of pupil attainment?
1 2 3 18 34 42
l) Have a role in determining the allocation of resources to pupils?
2 2 4 18 35 40
16. To what extend does the headteacher use each of the following to influence or persuade others?
Valid Percent Not at
all Very little
Little Partially A lot Very significantly
a) Rational Persuasion (use of logical arguments and factual evidence)
0 1 3 16 44 36
b) Apprising (explaining how carrying out a request will be beneficial to the person)
1 2 6 26 41 23
c) Inspirational Appeals (appeals to person’s values, ideals or emotions)
3 5 12 26 32 22
d) Consultation (inviting feedback or advice about a proposed course of action)
1 3 6 20 37 33
e) Ingratiation (the use of praise and flattery) 8 14 19 32 18 10 f) Personal appeals (appealing to personal friendship or favours)
26 25 23 17 6 3
g) Exchange (offering something with the expectation of reciprocity at a later time)
27 27 22 19 4 2
h) Coalition building (enlisting the aid or support of others as a means of influence)
15 19 19 29 14 4
i) Legitimating tactics (efforts to establish the legitimacy of a course of action or to verify the authority to carry out the action)
9 13 19 34 19 5
j) Pressure (the use of demands, persistent checking etc.)
17 26 21 21 11 4
k) Personal support (offer of additional resources, empathetic responses)
5 10 16 30 26 12
17. Your school has been chosen because it has made significant improvement or sustained high academic achievement over the last three years. To what extent has your school experienced improvement in the following areas in the last three years?
Valid Percent No change A little Some A lot
a) More pupils going into further / higher education 13 18 44 25 b) Reduction in staff mobility 29 19 35 17 c) Reduction in staff absence 30 23 34 14 d) Enhanced local reputation 12 14 33 41 e) Improved homework policies and practice 24 26 37 13 f) Enhanced commitment and enthusiasm of staff 15 16 40 28 g) Promoted an orderly and secure working environment 15 17 35 34 h) Improved pupil behaviour and discipline as a result of a whole school approach
21 22 31 25
18. To what extent do you consider that these things have changed over the past three years?
Valid Percent Much
worse now Worse now
No change
Better now
Much better now
a) Pupils’ lateness to lessons 2 21 42 36 8 b) Pupils’ lateness to school 1 11 43 37 8 c) Pupils’ absenteeism (both authorised and unauthorised)
1 8 36 42 13
d) Pupils’ missing class 1 6 41 41 11 e) Pupils’ mobility/turnover 1 5 61 26 7 f) Physical conflict among pupils 1 7 48 34 10 g) Bullying of all kinds among pupils 1 5 46 40 8
liv

h) Vandalism of school property 2 12 40 35 12 i) Physical abuse of teachers 1 4 61 22 12 j) Verbal abuse of teachers 4 20 43 26 8 k) Levels of pupil misbehaviour 3 21 32 36 9 l) Pupils’ motivation for learning 1 10 25 49 15 19. Indicate the extent to which you agree that each statement characterises the teachers you work with
Valid Percent Disagree strongly
Disagree moderately
Disagree slightly
Agree slightly
Agree moderately
Agree strongly
a) Pupils in this school can achieve the goals that have been set for them
0 1 3 14 44 39
b) Most pupils do achieve the goals that have been set for them
0 1 4 22 45 29
c) Teachers set high standards for academic performance
0 1 2 12 40 45
d) This school sets high standards for academic performance
0 0 2 9 32 57
e) Pupils respect others who get good marks / grades
1 4 12 27 37 19
f) Lesson plans are regularly discussed and monitored
3 7 14 28 32 16
g) The performance of department / subject areas is regularly monitored and targets for improvement are regularly set
0 1 4 13 33 49
h) Pupils are regularly involved in assessment for learning
1 2 5 25 40 28
i) Class teachers regularly use pupil data to set individual pupil achievement targets
0 1 3 19 34 42
20. Indicate the extent to which you agree that each statement characterises your school
Valid Percent Disagree strongly
Disagree moderately
Disagree slightly
Agree slightly
Agree moderately
Agree strongly
a) Most teachers in our school share a similar set of values, beliefs and attitudes related to teaching and learning
0 1 4 17 46 32
b) The goals I am expected to accomplish with my pupils are clear to me
0 0 1 6 26 67
c) There is no conflict in my mind about what I am expected to do
1 1 2 7 25 65
d) Pupils feel safe in our school 0 1 3 10 41 44 e) Teachers and other adults in the classroom work collaboratively
0 0 2 13 39 46
f) Parents often visit the school 3 7 14 29 31 17 g) The school is actively involved in work with other schools or organisations (e.g. networks, GTC, NCSL or other learning partnerships)
0 2 4 20 31 44
h) Our school provides a broad range of extracurricular activities for pupils (e.g. plays, athletics, music, dance)
0 1 2 9 26 61
21. Indicate the extent to which you agree that each statement characterises your school
Valid Percent Disagree strongly
Disagree moderately
Disagree slightly
Agree slightly
Agree moderately
Agree strongly
a) Disruptions to teaching time are minimised
4 6 12 22 35 21
b) The school timetable provides adequate time for collaborative teacher planning
10 13 21 22 23 11
lv

c) Our pupil assessment practices reflect our curriculum standards
0 1 5 22 44 28
d) We are able to provide a coherent teaching and learning programme for pupils across the years
0 0 2 12 39 47
e) Pupils of similar academic ability are grouped together for teaching in most subject areas
3 5 8 15 32 37
f) Teachers in this school have a sense of collective responsibility for pupil learning
0 1 4 14 42 39
g) Teachers’ teaching strategies enable pupils to construct their own knowledge
1 2 7 30 43 17
h) There are more opportunities for pupils to take responsibilities for their own learning in school now than three years ago
1 2 4 21 35 37
22. Indicate the extent to which you agree that each statement characterises conditions in your classroom
Valid Percent Disagree strongly
Disagree moderately
Disagree slightly
Agree slightly
Agree moderately
Agree strongly
a) My workload is quite fair compared with teachers in other schools
5 9 15 18 32 22
b) I teach an excessive number of pupils 32 20 21 16 8 4 c) The size of my class(es) makes unreasonable demands on the time required for preparation and marking
30 19 20 19 9 4
d) The size of my class(es) allows me to adequately differentiate my teaching between pupils
5 10 24 25 26 12
e) The amount of administrative work required of me is not excessive
12 19 22 19 20 9
f) My non-teaching (other than admin.) duties in the school are not excessive
5 10 16 23 27 19
g) I teach subjects or areas of the curriculum for which I have little formal preparation
73 10 5 6 4 3
h) I have too many pupils who are uncooperative
40 22 13 14 7 4
i) I have too many pupils who achieve poorly in spite of my best efforts
42 21 13 16 5 3
j) I have a significant amount of autonomy over decisions about what happens in my classes
1 1 2 8 36 53
k) I have access to the teaching resources that I need to do a good job
1 3 5 10 39 42
l) The atmosphere throughout the school encourages pupils to learn
1 2 5 18 39 34
Sex
Valid Percent
Male Female 46 54
Age
Valid Percent
30 or under 31-35 36-40 41-45 46-50 51-55 56-60 61-65 Over 65 9 20 16 15 16 15 8 1 0
lvi

Education background*
Percent
Non-graduate Certificate / Diploma
Degree Postgraduate Certificate / Diploma
Masters Doctorate Other qualification
7 81 61 17 2 2 *These figures will not add up to 100 as some teachers selected a qualification more than once How long have you been a teacher in total?
Valid Percent
0-3 years 4-7 years 8-15 years 16-23 years 24 years or more 2 14 39 19 26
How long have you been a teacher in this school?
Valid Percent
0-3 years 4-7 years 8-15 years 16-23 years 24 years or more 17 29 23 14 17
How long have you been a Head of Department in total?
Valid Percent
0-3 years 4-7 years 8-15 years 16-23 years 24 years or more 33 32 23 9 3
How long have you been a Head of Department in this school?
Valid Percent
0-3 years 4-7 years 8-15 years 16-23 years 24 years or more 41 32 17 8 3
lvii

Ref: DCSF-RR018 -QR
ISBN: 978 1 84775 081 5
© University of Nottingham 2007
www.dcsf.gov.uk/researchPublished by the Department forChildren, Schools and Families