The Impact of Portland’s Urban Growth Boundary › conferences › AETP › ETSS... · showing...
7
The Impact of Portland’s Urban Growth Boundary Jingjing Xu, Yaoyao Zhu Nanjing Xiaozhuang University, Academy of Fine Arts, Nanjing, China Anhui University of Technology, Academy of Architectural Engineering,Anhui, China [email protected] Keywords: Impact, Portland, Urban Growth, housing price Abstract: The urban growth boundary (UGB) concept is useful in the field of urban planning and it also be implemented by planning agencies worldwide. However, among many cities around the world, Portland has perhaps the best-known growth management program in the world. The aim of this paper is to present an overview of the impact of Portland’s Urban Growth Boundary in terms of the housing prices, the housing density and the land redevelopment, which offer helpful guidelines for other city's future in urban planning and UGB design. 1. Introduction In United Stated, Oregon law regulates each of the state’s cities and metropolitan areas has created an urban growth boundary around its perimeter that is a land useplanning line to control urban expansion onto farm and forest lands. While DEMOGRAPHIAstates, in Oregon, Portland’s urban growth boundary maybe a effectively measure to block the city growth. Urban Growth Boundary (UGB) is a zoning tool that maintains a relatively high density of housing and commercial development inside the boundary and rural density outside the boundary. The purpose of this essay is to provide an overview of the impactof Portland’s Urban Growth Boundary in terms of the housing prices, the housing density and the land redevelopment. 2. Background 2.1 Urban Growth Boundary Urban growth boundaries have become one of the most popular urban growth management tools, since the first US urban growth boundary (UGB) was established in Lexington, Kentucky in 1958. Urban growth Boundaryis a regional boundary to effectively control urban sprawl by mandating that the area inside the boundary be used for higher density urban development and the area outside be used for lower density development. Green Belt Alliance show the objectives of UGBs are summarized in six categories: (1) preserve open space andfarmland; (2) minimize the use of land and increasing residential densities; (3) reduce infrastructure costs by encouraging urban revitalization, infill, and compact development; (4) clearly separate urban and rural areas; (5) ensure the or deny transitions of land from rural to urban uses; and (6) promote a sense of unified 2018 2nd International Conference on Education Technology and Social Science (ETSS 2018) Published by CSP © 2018 the Authors DOI: 10.23977/etss.2018.12552 303
Transcript of The Impact of Portland’s Urban Growth Boundary › conferences › AETP › ETSS... · showing...
The Impact of Portland’s Urban Growth Boundary
Jingjing Xu, Yaoyao Zhu Nanjing Xiaozhuang University, Academy of Fine Arts, Nanjing, China
Anhui University of Technology, Academy of Architectural Engineering,Anhui, China [email protected]
Keywords: Impact, Portland, Urban Growth, housing price
Abstract: The urban growth boundary (UGB) concept is useful in the field of urban planning and it also be implemented by planning agencies worldwide. However, among many cities around the world, Portland has perhaps the best-known growth management program in the world. The aim of this paper is to present an overview of the impact of Portland’s Urban Growth Boundary in terms of the housing prices, the housing density and the land redevelopment, which offer helpful guidelines for other city's future in urban planning and UGB design.
1. Introduction
In United Stated, Oregon law regulates each of the state’s cities and metropolitan areas has created an urban growth boundary around its perimeter that is a land useplanning line to control urban expansion onto farm and forest lands. While DEMOGRAPHIAstates, in Oregon, Portland’s urban growth boundary maybe a effectively measure to block the city growth. Urban Growth Boundary (UGB) is a zoning tool that maintains a relatively high density of housing and commercial development inside the boundary and rural density outside the boundary. The purpose of this essay is to provide an overview of the impactof Portland’s Urban Growth Boundary in terms of the housing prices, the housing density and the land redevelopment.
2. Background
2.1 Urban Growth Boundary
Urban growth boundaries have become one of the most popular urban growth management tools, since the first US urban growth boundary (UGB) was established in Lexington, Kentucky in 1958. Urban growth Boundaryis a regional boundary to effectively control urban sprawl by mandating that the area inside the boundary be used for higher density urban development and the area outside be used for lower density development. Green Belt Alliance show the objectives of UGBs are summarized in six categories: (1) preserve open space andfarmland; (2) minimize the use of land and increasing residential densities; (3) reduce infrastructure costs by encouraging urban revitalization, infill, and compact development; (4) clearly separate urban and rural areas; (5) ensure the or deny transitions of land from rural to urban uses; and (6) promote a sense of unified
2018 2nd International Conference on Education Technology and Social Science (ETSS 2018)
Published by CSP © 2018 the Authors DOI: 10.23977/etss.2018.12552
303

community. By 1999, urban growth boundaries exist in more than 100cities, counties, and regions across the US and three states had passed statewide mandates for UGBs. Inside the boundary, the land that can be efficiently supplied with public services will be developed, while outside the boundary has environmentally sensitive land and productive farm and forest land. When a city successfully implements the UGB strategy, the urban growth boundary can be seen as the single most effective policy to create a livable and sustainable city and region.
2.2 Portland urban context
Metropolitan Portland is the state’s large metropolitan area. It is composed of parts of three counties and 24 cities. Metropolitan Portland covered 3026 square miles and is home to 1.1 million residents. The area’s overall population density is about 364 persons per square mile. Because Portland has experienced accelerated immigration, by the year 2000 the metropolitan area’s population will exceed 1.3 million. In Portland, land is a limited resource. In the past 30 years, Portland has protected farmland and open space by limiting the development of sprawling suburbs and exurbs through strict controls over the location of growth. According to Jun (2003) presents in Portland urbanized land area and population have increased at a faster rate than other metropolitan areas and population density in the urbanized area has risen by 13.6 per cent. Table 1 shows the changes in Portland’s population, land size and density in the urbanized area over the past two decades. The urbanized population has increased by 54 per cent, while the urbanized land area increased by 36 per cent over the 1980–2000 periods. Portland’s growth rates are ranked 8th for urbanized population and 9th for urbanized land among 32 metropolitan areas.
Table 1.Population, land area, and density in the Portland urbanized area, 1980–2000
Source: The Effects of Portland’s Urban Growth Boundary on Urban Development Patterns and Commuting 2004
2.3 Portland’s Urban Growth Boundary
In Oregon, Portland’s UGB was proposed in 1977 and approved by the state in 1980. Portland has perhaps the best-known growth management program in the world. For Portland, the single UGB includes parts of three counties and all or part of 24 municipalities. Figure 1 presents a map of the Portland urban growth boundary, the red line is boundary. Adoption of the UGB will provide greater predictability in planning at local and regional levels, supporting the more orderly development of land, discouraging the unnecessary extension of community infrastructure and helps preserve the important qualities of rural areas.
Urban growth boundary delimitation is not the same, rather than according to the actual development of constantly updated. Figure 2 shows Portland growth within the boundary is 236000 acres, while in 2004 it rise to 256000acres.
Moavenzadeh and Markow conclude that the primary objectives of the Portland UGB were to promote the efficient planning and use of urban land, to improve the efficiency of public facilities and services, and to preserve prime farmland and forest lands outside the boundary. Portland’s UGB increases the housing price and fosters the higher density development, and encouraged
304

redevelopment of urban areas.
] Figure 1.Portland urban growth boundary (ESRI 2008)
3. The effect of the Portland
3.1The effect of the Portland UGB on housing price
Portland's urban growth boundary raises house prices to some extent. By restricting land availability, growth boundaries could increase the price of land and, ultimately, housing. 2004 argue that the economic analysis of the supply-side impacts of Urban Growth Boundaries (UGBs) limit the supply of land increases the price of housing. Nelson (2000) and Dowall (1979) conclude that urban growth boundaries raise housing prices because they result in limiting the amount of available land. A research studied by Landis (1986) states that a ten percent reduction in the supply of developable land may increase new housing prices by up to 30 percent. Also, Knapp (1985) presented a theoretical framework for the role of UGBs on urban and nonurban land values, and found a significant impact of UGBs on land values in metropolitan Portland. Because the land
Figure2.Portland UGB Expansion (Demographic)
305
becomes scarcer inside the boundary, the increased competition for developable land inside the growth boundary appears to be contributing to higher land prices. Ball et al. 2014 summarize that real land prices within the UGB are consistently higher, because the land is near the CBD. Regulations that artificially limit the boundaries of urban development and prescribe open space requirements in urban areas, constraining the overall supply of developed land and built space, thereby inflating the price. Additionally, Nelson (1986) developed a theory and provided evidence that amenity values created by the greenbelts of UGBs might be reflected in gains in housing values.
There are two principal methodological approaches to analyzing land or housing prices. One is cross-sectional modeling, another is quasi-experimental studies. Two research articles tentatively support the hypothesis that UGBs increase land and housing prices. Jun (2006) argues that “although the two evidences are not overwhelming, there are many empirical studies indicating that UGBs and other means of urban containment lead to higher land prices by limiting the supply of developable land”.
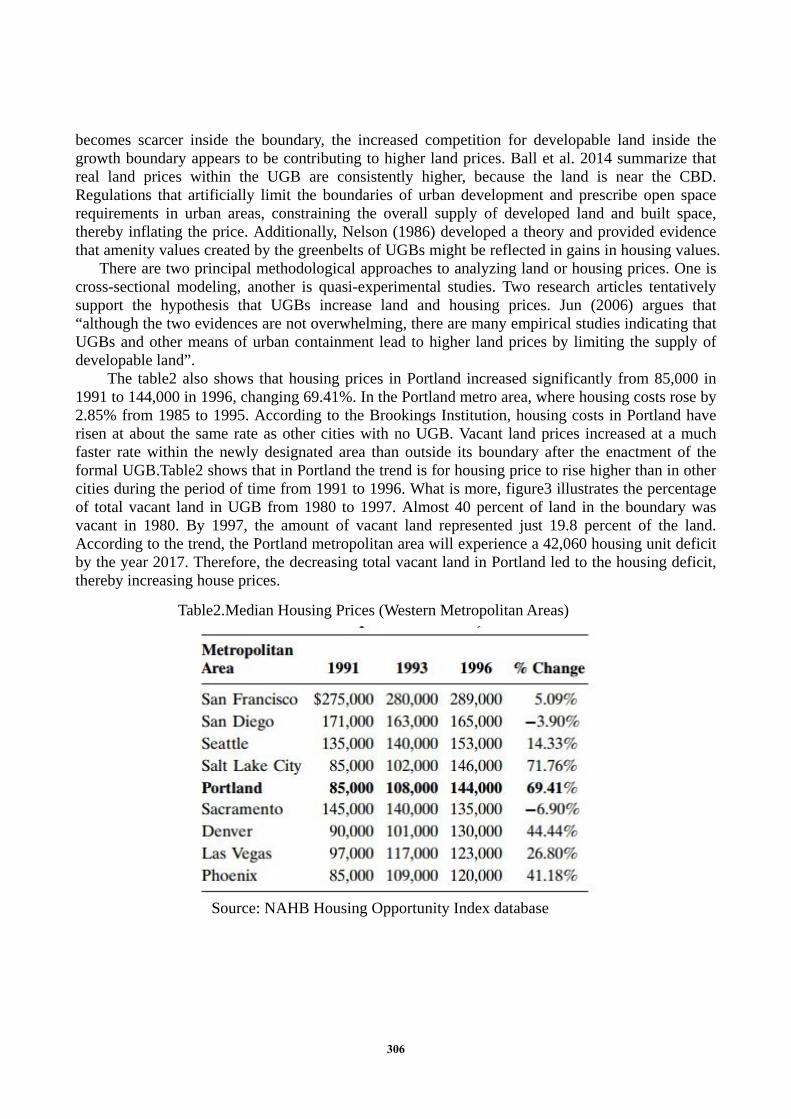
The table2 also shows that housing prices in Portland increased significantly from 85,000 in 1991 to 144,000 in 1996, changing 69.41%. In the Portland metro area, where housing costs rose by 2.85% from 1985 to 1995. According to the Brookings Institution, housing costs in Portland have risen at about the same rate as other cities with no UGB. Vacant land prices increased at a much faster rate within the newly designated area than outside its boundary after the enactment of the formal UGB.Table2 shows that in Portland the trend is for housing price to rise higher than in other cities during the period of time from 1991 to 1996. What is more, figure3 illustrates the percentage of total vacant land in UGB from 1980 to 1997. Almost 40 percent of land in the boundary was vacant in 1980. By 1997, the amount of vacant land represented just 19.8 percent of the land. According to the trend, the Portland metropolitan area will experience a 42,060 housing unit deficit by the year 2017. Therefore, the decreasing total vacant land in Portland led to the housing deficit, thereby increasing house prices.
Table2.Median Housing Prices (Western Metropolitan Areas)
Source: NAHB Housing Opportunity Index database
306

Figure3.Vacant Land in Portland Urban Growth Boundary: 1980 to 1997
Moreover, land prices within UGBs were much higher than those outside. In 1980, just one year
after Portland's regional-growth boundary was established, an analysis of 455 single-family homes found that land prices inside the boundary were significantly higher than those outside the boundary. Similarly, Knaap, Nelson concluded that the residential land prices were higher inside the Portland UGB compared to the prices outside. In fact, from 1990 to 1995, inner-city neighborhoods in Portland experienced a housing renaissance: the North, Southeast, and Northeast Portland areas saw the greatest rate of housing-price appreciation in the region. In particular, home prices in North Portland doubled, rising from $41,300 in 1990 to $83,800 in 1995.
Toole 2001 implied Portland’s land use policies have distorted the region’s housing market greatly. Some people could not afford the housing, especially low-to moderate-income households, which are more concerned about housing affordability. Even middle-income families may be at risk based on emerging evidence from Portland, Oregon and California. What is more, roughly40% of renters cannot afford a two-bedroom apartment in the region, and only 34% could afford the median priced house in 1997 at $155,000. According tothe National Association of Homebuilders, 80,000 single-family homes became “unaffordable” to Portland residents between 1995 and 1997 because of housing price inflation. According to the NAHB, Portland also ranks in the top 10 percent of the most expensive housing markets in the U.S., and the area is expected to have a housing deficit of 9,000 units by 2040.
Ultimately, the UGB has created an upward pressure on housing prices in Portland, thereby leading a decline in housing affordability. By restricting the supply of vacant land and forcing development into higher cost, inner-city locations, the boundary is contributing to Portland’s housing-price appreciation.
3.2 The effect of the Portland UGB on housing density
Under provisions of Oregon law, Portland’s urban growth boundary is a line outside of which urban development is not permitted. So Portland’s UGB control the urban sprawl, thereby generating urbanized density increases. Some studies support the conclusion that Portland's UGB has effectively slowed down urban sprawl and increased residential density. Also, Richardson and Gordon (2001) and Cox (2001) who compared Portland with one or two other metropolitan regions, showing the Portland’s urban growth boundary strategy control the urban land sprawl, while Mildner et al.(1996) states that controlling the urban land sprawl leads to greater density. Cox 2001 shows housing affordability has dropped substantially in Portland and the shortage of land resulting from the urban growth boundary. According to US Census Bureau State & County 2010, the population density in Portland is 4,375.2 people per square mile. Anderson 1999 tells that if adopt
307

‘2040 boundary planning concept’ in 2000, the average density in Portland today is 3,800 people per square mile to the forecasting model. ‘2040 boundary planning concept’ means expand the city boundary region, once expanding the boundary, the number of population density in forecasting model is smaller than the number of the population density in 2000, so which can be seen implement UGB controlling the urban land sprawl lead to greater housing density.
With the imposition of an effective growth boundary, consumers have fewer housing choices than under a freely functioning land market, since developers are more limited in the kinds of homes they can provide. To some degree, it will reduce the overall quality of life for residents because builders will use less land in order to keep the cost of their houses from rising too high, and homeowners will be unable to buy as much land as they would normally like. Nelson and Moore (1993) found residential building permits, residential land divisions and density of residential development inside and outside Portland’s UGB between 1985 and 1989 and concluded that most regional development has been directed within the UGB. In a certain space, the population growth, which will increase the housing density. In the early 1990s, the local government implemented a land-use plan, whereby developers were allowed to build more houses on each acre of land as maximum densities. Moavenzadeh & Markow show that the average housing density in Portland increased from five homes per acre to eight homes per acre. Due to greater density, Downs (1992) claims that the median price of current housing stock rose by more than 50%, over three years due to adopting a growth boundary approach.
3.3 The effect of the Portland UGB on land development and infill
Portland's urban growth boundary turns the vacant land into redevelopment and infill. Stanley and Mildner (1999) found that vacant land inside the boundary has fallen from 75,000 acres in 1985 to less than 55,000 today. This is because, as Portland pushes for more infill development, vacant land within the growth boundary is disappearing. According to Portland Metro(1997)shows almost 40 percent of the land in the boundary was vacant in 1980, while by 1997, the total vacant land represented just 19.8 percent of the land. As implied by Lall et al., drawing a ring around a city and outlawing urban development outside this ring, urban growth boundaries prevent conversion of rural land and restrict supply of land for further development.
Besides, there is an explanation for the positive impact of UGB on land development within city boundary. Land ownerships within city boundary require paying extra city property tax, but the positive amenities, such as more services provided by the city and may have compensated for the extra cost of living in the city.
4. Conclusion
To sum up, Portland’s Urban growth boundary is a way to manage the major challenges posed by unplanned urban growth. With land inside the growth boundary becomes increasingly scarce, housing prices have increased significantly. While urban growth boundaries have come under an increasing amount of scrutiny because housing prices have substantially risen. Besides, controlling the urban land sprawl lead to greater housing density and encouraged redevelopment of urban areas. Portland’s urban growth boundaries have become one of the most popular urban growth management tools and the goal is to manage growth.
References
[1] Dowall, DE 1979, 'The Effect of Land Use and Environmental Regulations on Housing Costs",
308
Policy Studies Journal, vol. 8, no. 2. [2] Downs, A.1992, "Growth Management- Satan or Savior- Regulatory barriers to Affordable
Housing", Journal of the American Planning Association, 58(4). [3] Downs, A 2005, "Smart Growth: Why We Discuss It More than We Do It", Journal of the
American Planning Association, vol. 71, no. 4. [4] Green Belt Alliance,Urban-growth Boundaries,viewed 20 May 2015. [5] Ihlanfeldt,K.R.2004, "Introduction: Exclusionary Land-use Regulations", Urban Studies, vol.41,
no.2. [6] Jun, M 2006, "The Effects of Portland's Urban Growth Boundary on Housing Prices", Journal
of the American Planning Association, vol. 72, no. 2. [7] Landis, JD 1986, "Land Regulation and the Price of New Housing Lessons from Three
California Cities", Journal of the American Planning Association, vol. 52, no. 1. [8] Lall,SV,Freire,M,Yuen,B,Rajack,R,Helluin,JJ 2009, Urban Land Markets: Improving Land
Management for Successful Urbanization, Springers
309