
Strengthening Families and Parental Resiliency: Impact on ...

The Impact of Parental Income and Parental
Education on the Schooling of Children
Colm Harmon (UCD Geary, CEPR, and IZA)Ian Walker (LUMS, UCD Geary Institute, and IZA)
Arnaud Chevalier (Royal Holloway and IZA)Vincent O’Sullivan (Warwick)
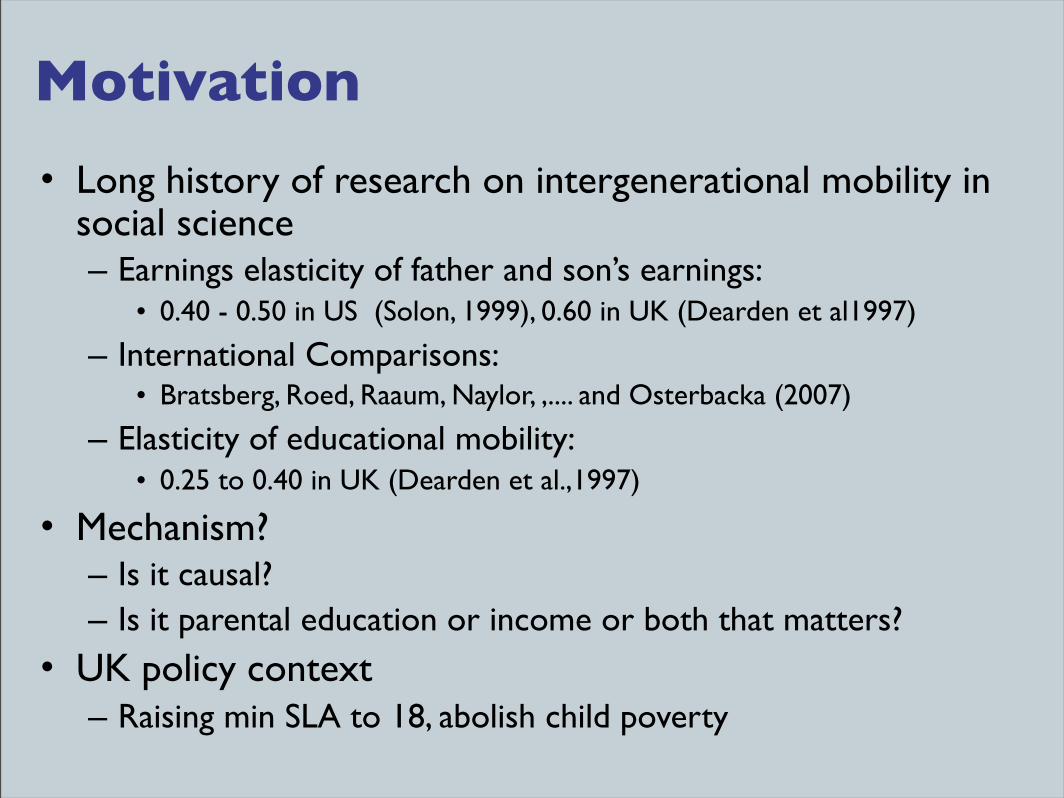
Motivation
• Long history of research on intergenerational mobility in social science– Earnings elasticity of father and son’s earnings:
• 0.40 - 0.50 in US (Solon, 1999), 0.60 in UK (Dearden et al1997)
– International Comparisons:• Bratsberg, Roed, Raaum, Naylor, ,.... and Osterbacka (2007)
– Elasticity of educational mobility:• 0.25 to 0.40 in UK (Dearden et al.,1997)
• Mechanism?– Is it causal?– Is it parental education or income or both that matters?
• UK policy context– Raising min SLA to 18, abolish child poverty
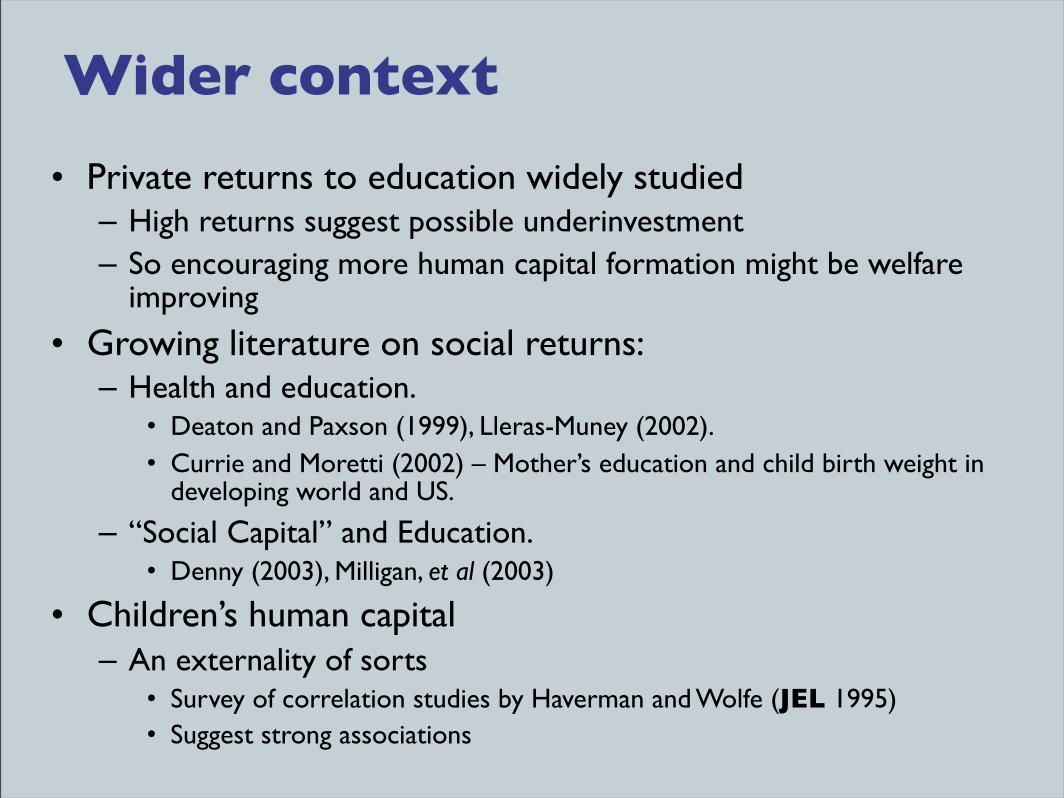
Wider context
• Private returns to education widely studied– High returns suggest possible underinvestment– So encouraging more human capital formation might be welfare
improving
• Growing literature on social returns:– Health and education.
• Deaton and Paxson (1999), Lleras-Muney (2002).• Currie and Moretti (2002) – Mother’s education and child birth weight in
developing world and US.
– “Social Capital” and Education.• Denny (2003), Milligan, et al (2003)
• Children’s human capital– An externality of sorts
• Survey of correlation studies by Haverman and Wolfe (JEL 1995)• Suggest strong associations
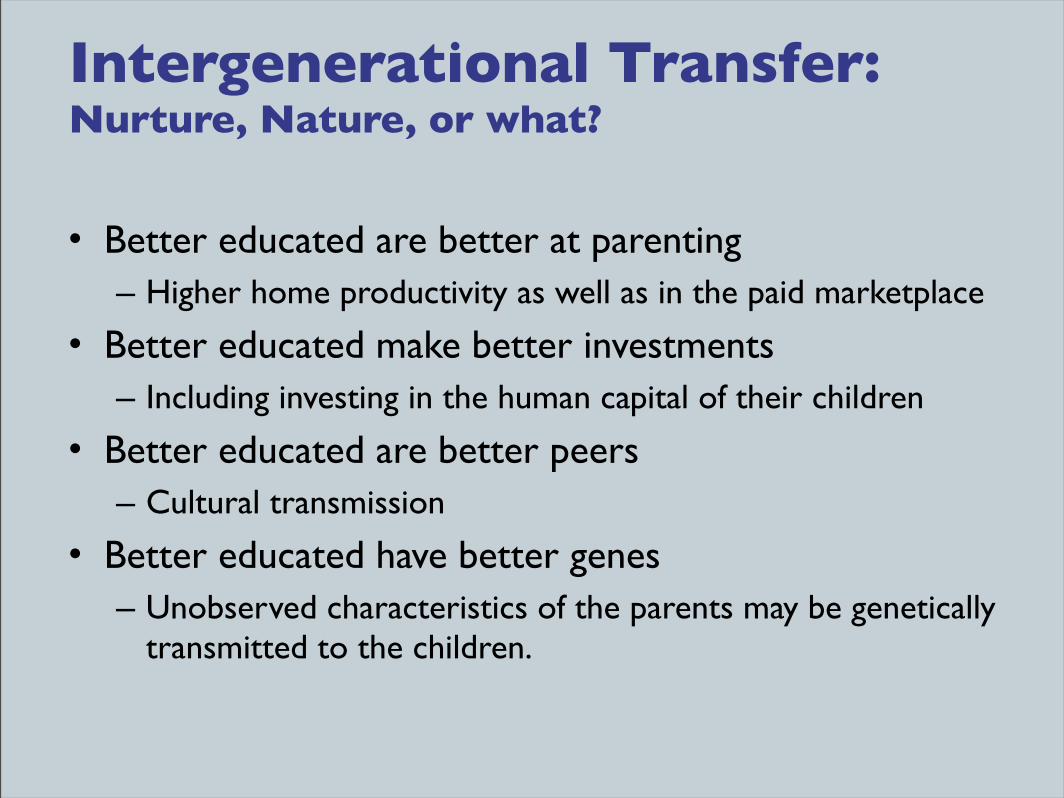
Intergenerational Transfer: Nurture, Nature, or what?
• Better educated are better at parenting– Higher home productivity as well as in the paid marketplace
• Better educated make better investments– Including investing in the human capital of their children
• Better educated are better peers– Cultural transmission
• Better educated have better genes– Unobserved characteristics of the parents may be genetically
transmitted to the children.
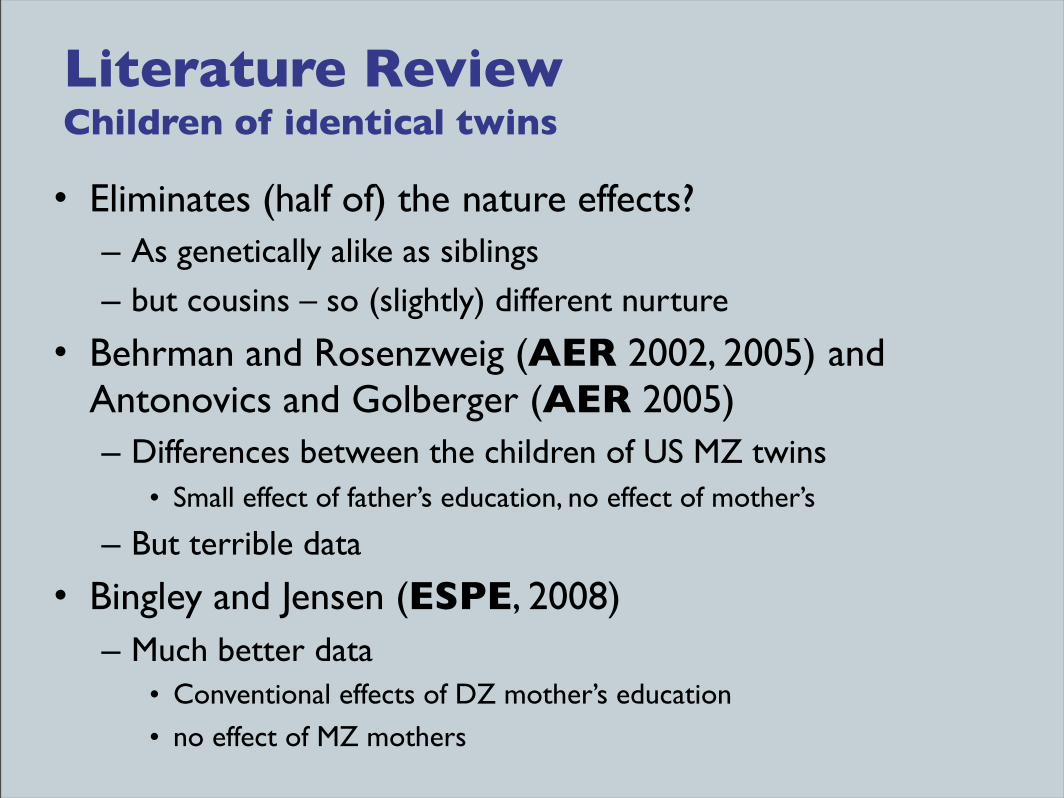
Literature ReviewChildren of identical twins
• Eliminates (half of) the nature effects?– As genetically alike as siblings – but cousins – so (slightly) different nurture
• Behrman and Rosenzweig (AER 2002, 2005) and Antonovics and Golberger (AER 2005)– Differences between the children of US MZ twins
• Small effect of father’s education, no effect of mother’s
– But terrible data
• Bingley and Jensen (ESPE, 2008)– Much better data
• Conventional effects of DZ mother’s education
• no effect of MZ mothers
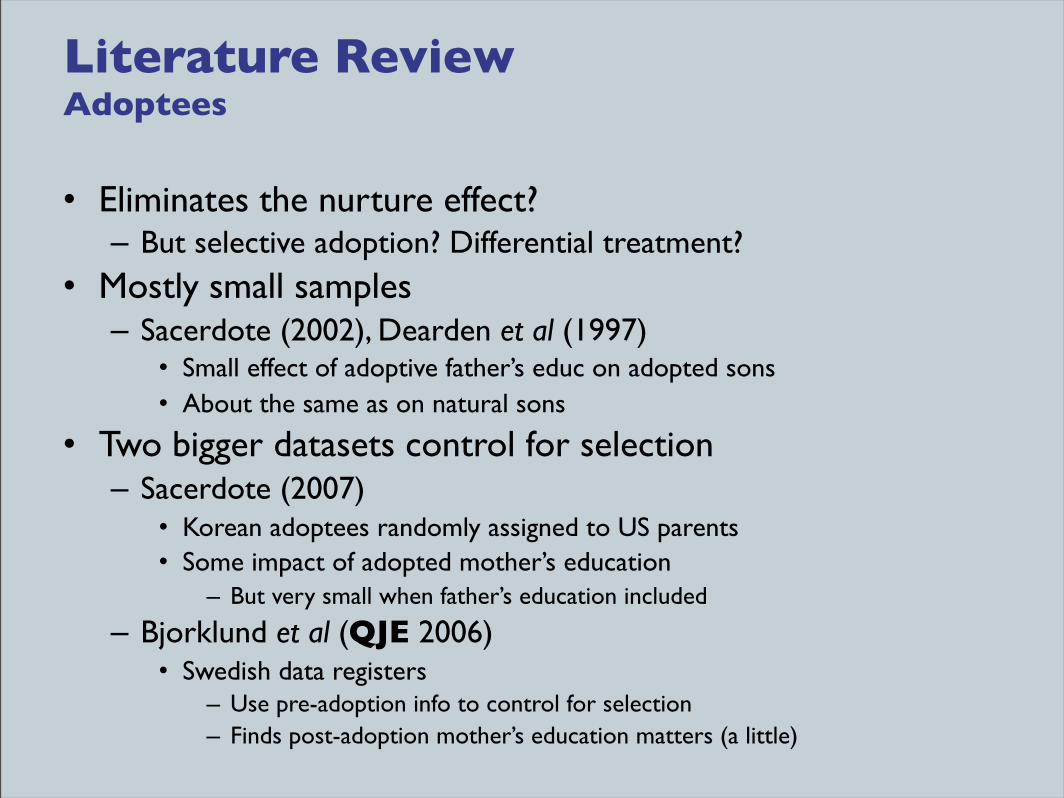
Literature ReviewAdoptees
• Eliminates the nurture effect?– But selective adoption? Differential treatment?
• Mostly small samples– Sacerdote (2002), Dearden et al (1997)
• Small effect of adoptive father’s educ on adopted sons• About the same as on natural sons
• Two bigger datasets control for selection– Sacerdote (2007)
• Korean adoptees randomly assigned to US parents• Some impact of adopted mother’s education
– But very small when father’s education included
– Bjorklund et al (QJE 2006)• Swedish data registers
– Use pre-adoption info to control for selection– Finds post-adoption mother’s education matters (a little)
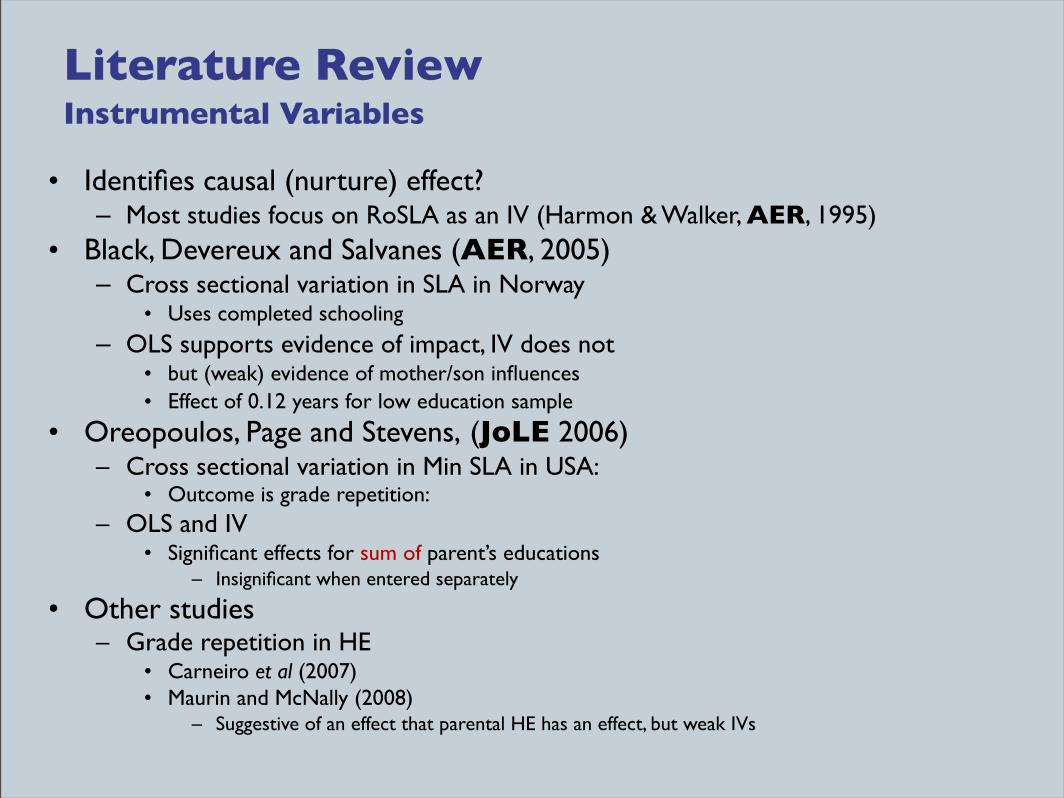
Literature Review Instrumental Variables
• Identifies causal (nurture) effect?– Most studies focus on RoSLA as an IV (Harmon & Walker, AER, 1995)
• Black, Devereux and Salvanes (AER, 2005) – Cross sectional variation in SLA in Norway
• Uses completed schooling– OLS supports evidence of impact, IV does not
• but (weak) evidence of mother/son influences• Effect of 0.12 years for low education sample
• Oreopoulos, Page and Stevens, (JoLE 2006) – Cross sectional variation in Min SLA in USA:
• Outcome is grade repetition:– OLS and IV
• Significant effects for sum of parent’s educations– Insignificant when entered separately
• Other studies– Grade repetition in HE
• Carneiro et al (2007)• Maurin and McNally (2008)
– Suggestive of an effect that parental HE has an effect, but weak IVs
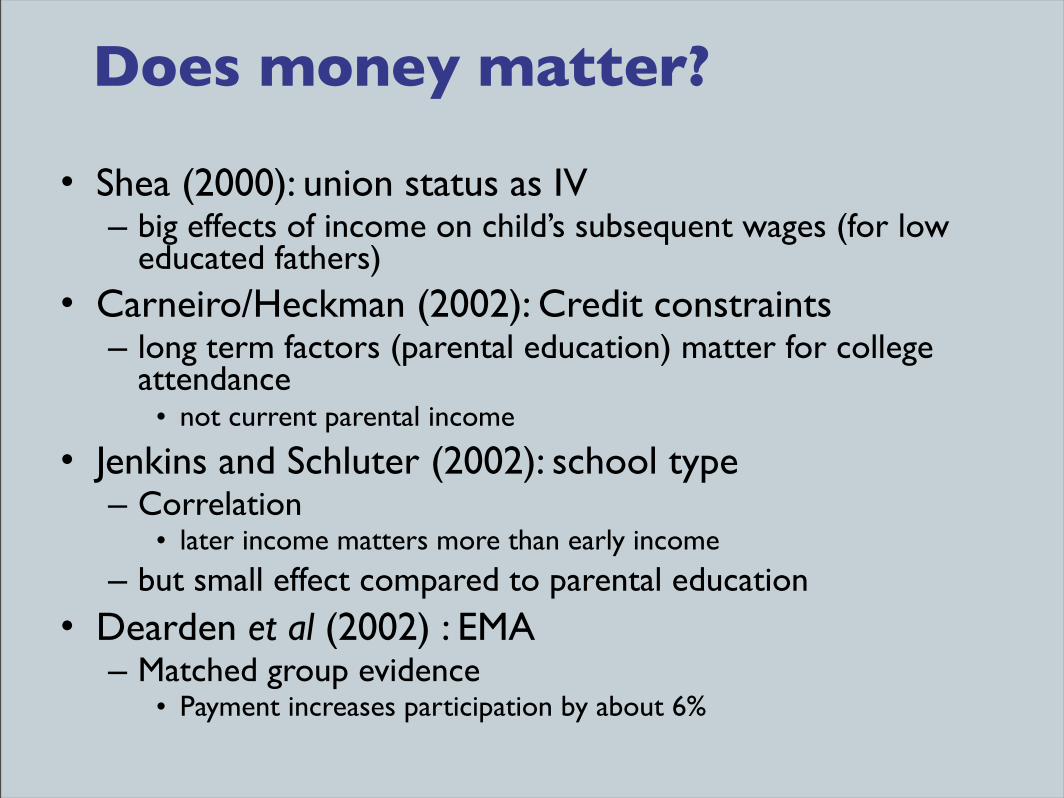
• Shea (2000): union status as IV – big effects of income on child’s subsequent wages (for low
educated fathers)• Carneiro/Heckman (2002): Credit constraints
– long term factors (parental education) matter for college attendance
• not current parental income
• Jenkins and Schluter (2002): school type– Correlation
• later income matters more than early income – but small effect compared to parental education
• Dearden et al (2002) : EMA– Matched group evidence
• Payment increases participation by about 6%
Does money matter?
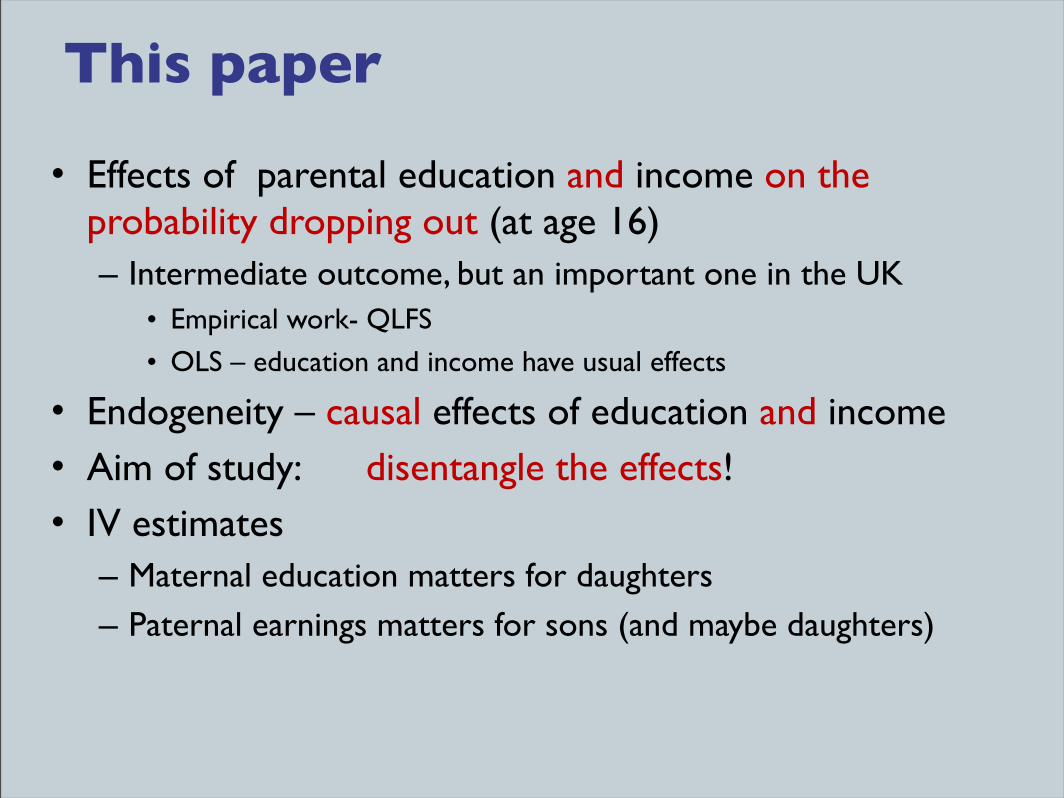
This paper
• Effects of parental education and income on the probability dropping out (at age 16)– Intermediate outcome, but an important one in the UK
• Empirical work- QLFS
• OLS – education and income have usual effects
• Endogeneity – causal effects of education and income• Aim of study: disentangle the effects!• IV estimates
– Maternal education matters for daughters– Paternal earnings matters for sons (and maybe daughters)
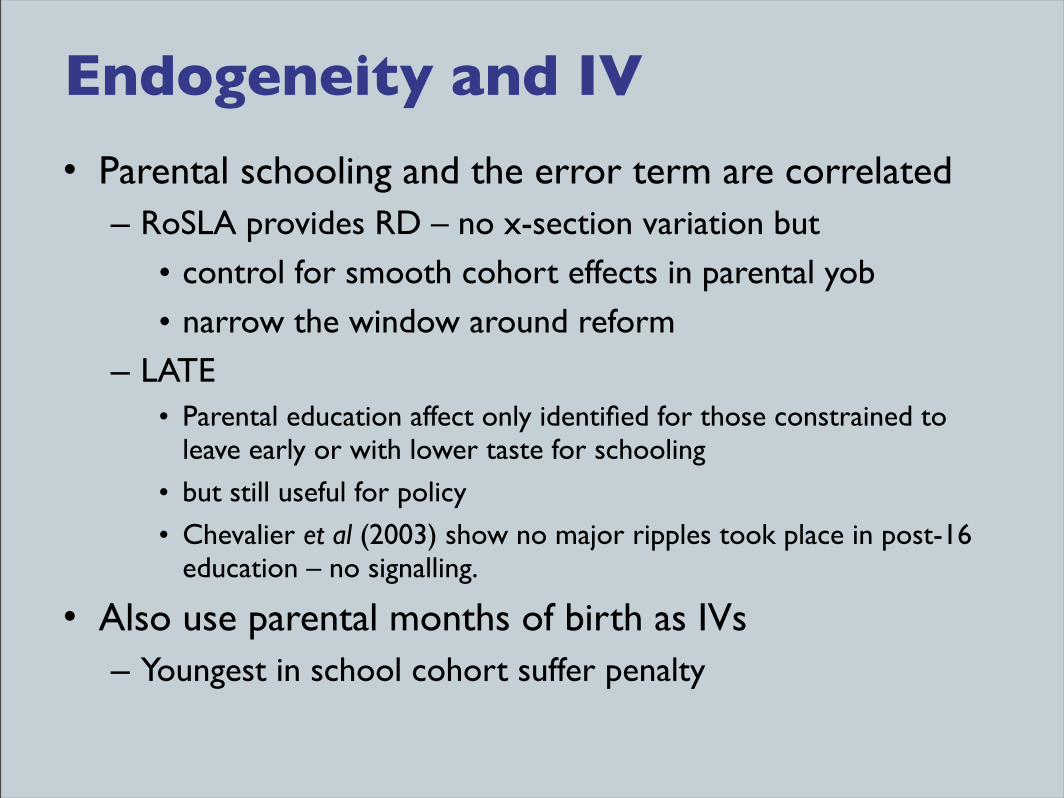
Endogeneity and IV
• Parental schooling and the error term are correlated – RoSLA provides RD – no x-section variation but
• control for smooth cohort effects in parental yob• narrow the window around reform
– LATE• Parental education affect only identified for those constrained to
leave early or with lower taste for schooling
• but still useful for policy
• Chevalier et al (2003) show no major ripples took place in post-16 education – no signalling.
• Also use parental months of birth as IVs– Youngest in school cohort suffer penalty
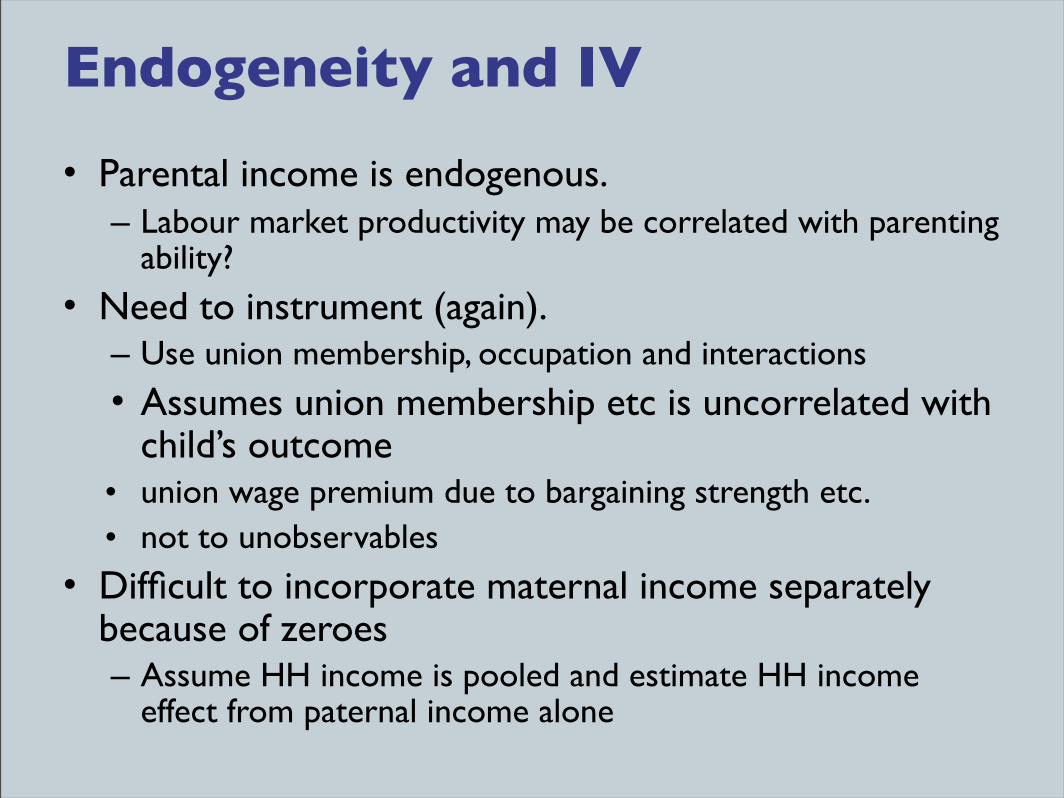
Endogeneity and IV
• Parental income is endogenous. – Labour market productivity may be correlated with parenting
ability? • Need to instrument (again).
– Use union membership, occupation and interactions• Assumes union membership etc is uncorrelated with
child’s outcome• union wage premium due to bargaining strength etc.• not to unobservables
• Difficult to incorporate maternal income separately because of zeroes– Assume HH income is pooled and estimate HH income
effect from paternal income alone
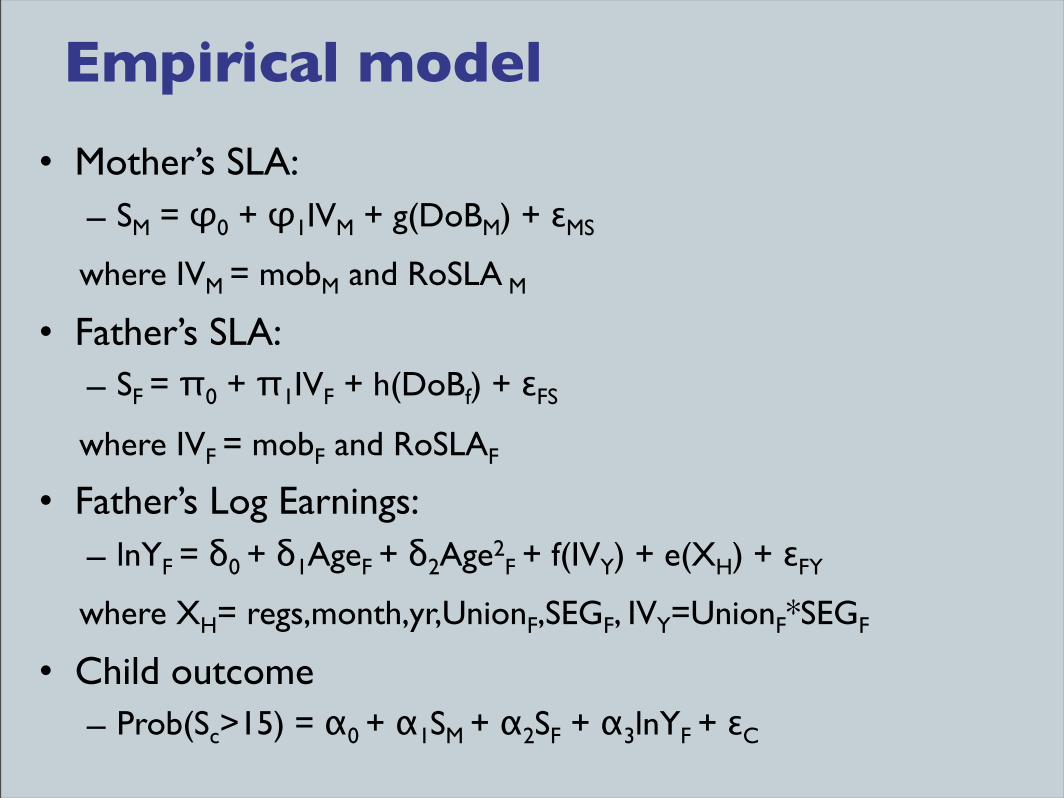
Empirical model
• Mother’s SLA:– SM = φ0 + φ1IVM + g(DoBM) + εMS
where IVM = mobM and RoSLA M
• Father’s SLA:– SF = π0 + π1IVF + h(DoBf) + εFS
where IVF = mobF and RoSLAF
• Father’s Log Earnings:– lnYF = δ0 + δ1AgeF + δ2Age2
F + f(IVY) + e(XH) + εFY
where XH= regs,month,yr,UnionF,SEGF, IVY=UnionF*SEGF
• Child outcome– Prob(Sc>15) = α0 + α1SM + α2SF + α3lnYF + εC
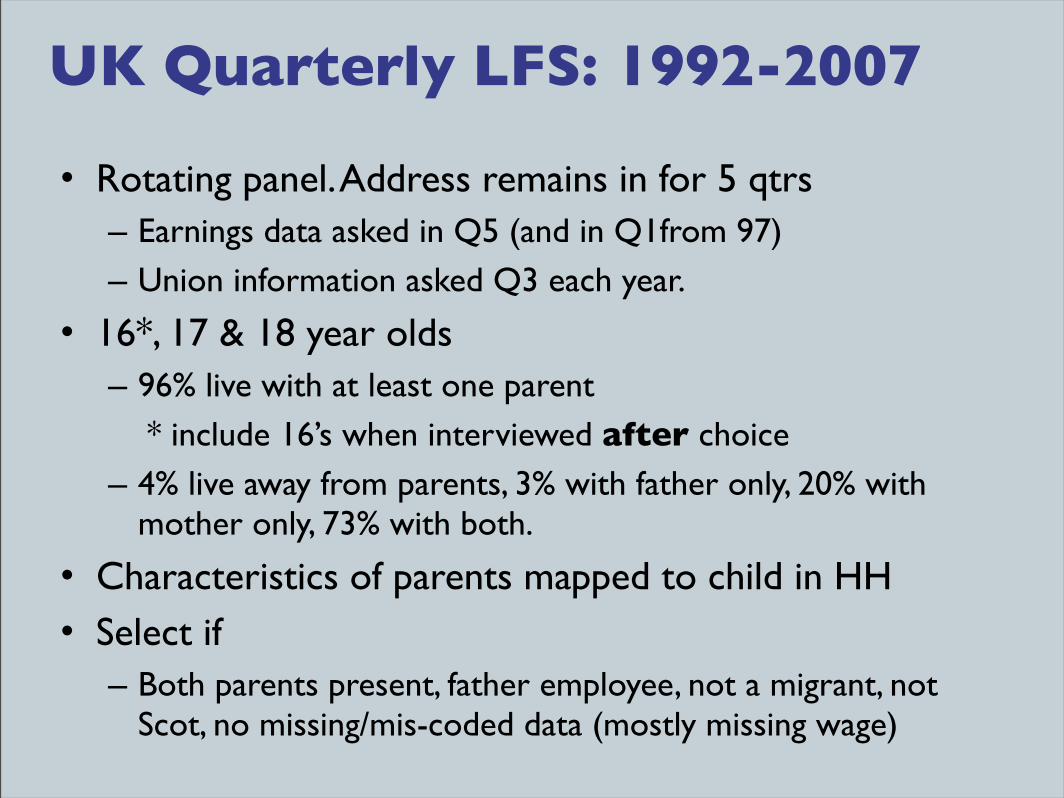
• Rotating panel. Address remains in for 5 qtrs– Earnings data asked in Q5 (and in Q1from 97)– Union information asked Q3 each year.
• 16*, 17 & 18 year olds– 96% live with at least one parent * include 16’s when interviewed after choice– 4% live away from parents, 3% with father only, 20% with
mother only, 73% with both.
• Characteristics of parents mapped to child in HH• Select if
– Both parents present, father employee, not a migrant, not Scot, no missing/mis-coded data (mostly missing wage)
UK Quarterly LFS: 1992-2007
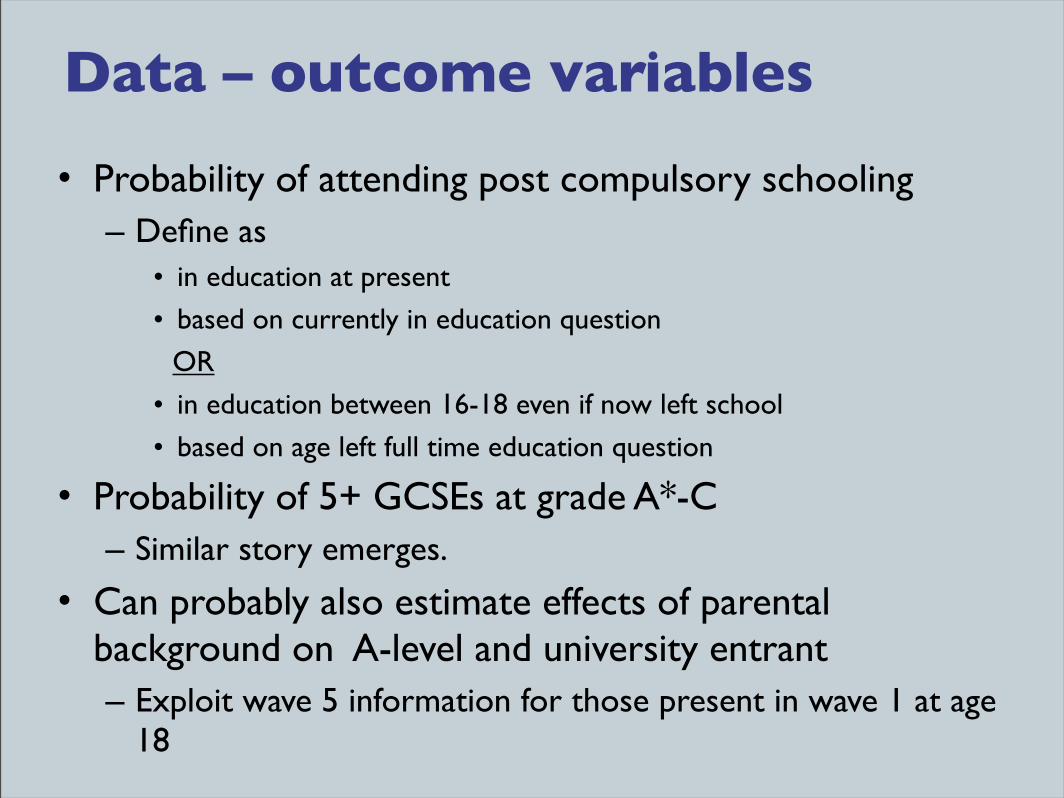
Data – outcome variables
• Probability of attending post compulsory schooling – Define as
• in education at present
• based on currently in education question
OR
• in education between 16-18 even if now left school
• based on age left full time education question
• Probability of 5+ GCSEs at grade A*-C– Similar story emerges.
• Can probably also estimate effects of parental background on A-level and university entrant– Exploit wave 5 information for those present in wave 1 at age
18
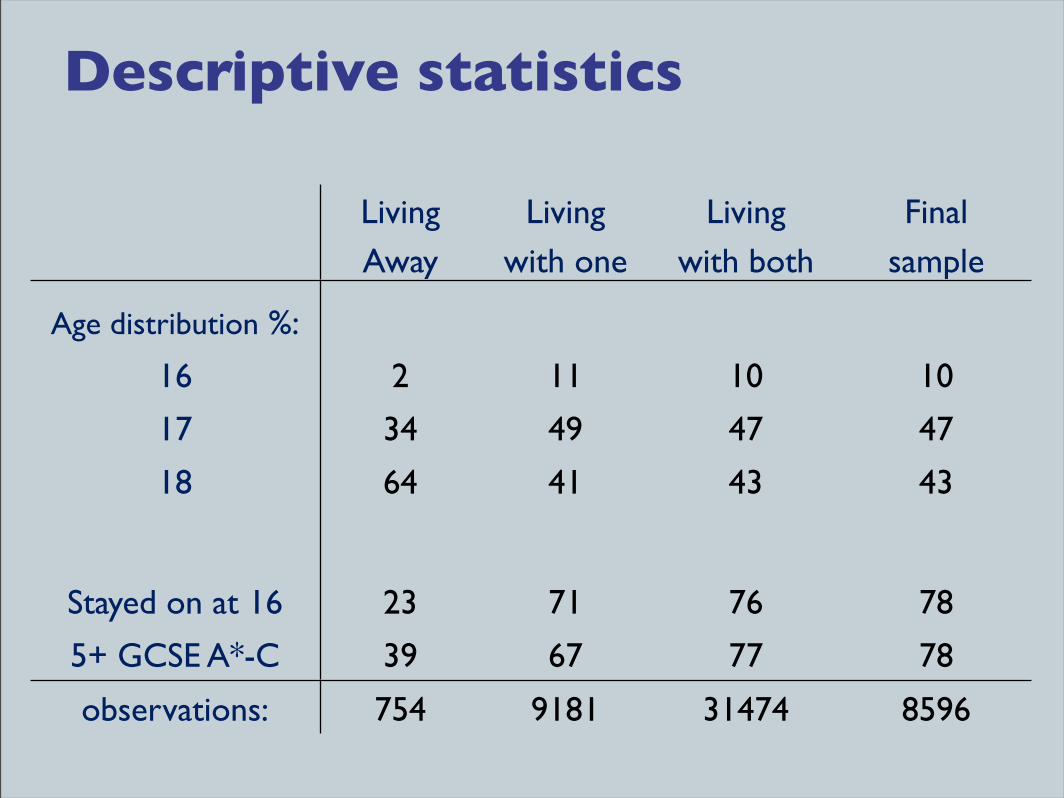
Descriptive statistics
LivingAway
Living with one
Living with both
Finalsample
Age distribution %:
16 2 11 10 10
17 34 49 47 47
18 64 41 43 43
Stayed on at 16 23 71 76 78
5+ GCSE A*-C 39 67 77 78
observations: 754 9181 31474 8596
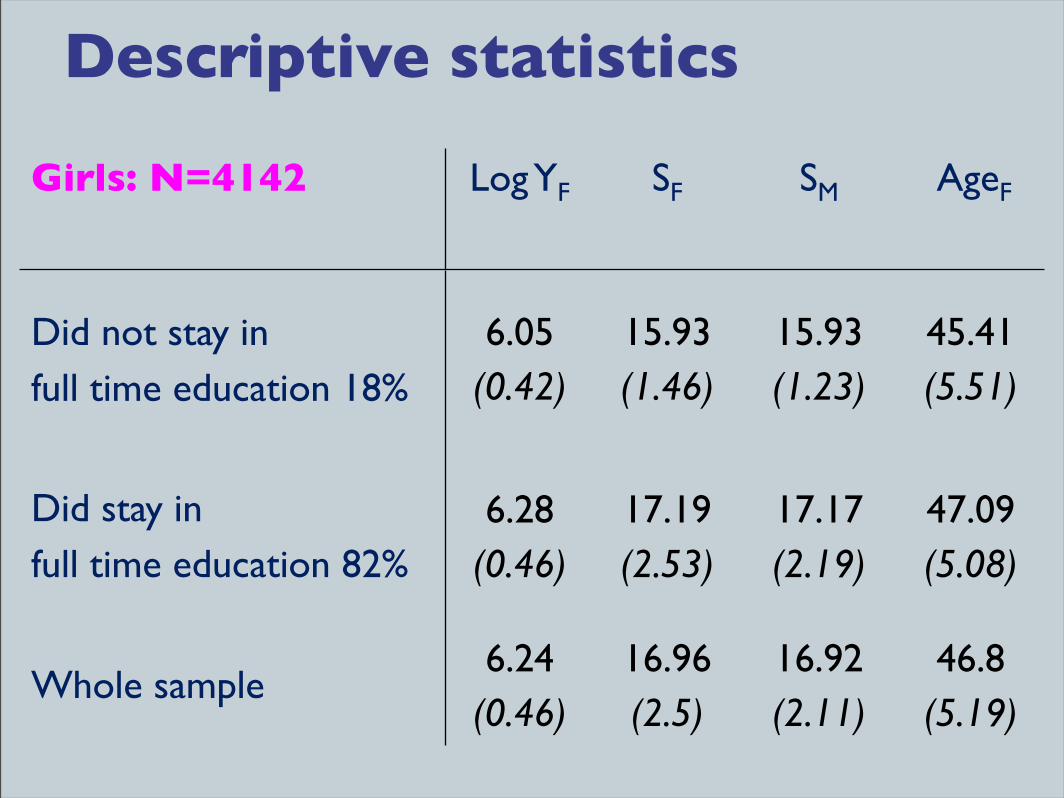
Descriptive statistics
Girls: N=4142 Log YF SF SM AgeF
Did not stay in full time education 18%
6.05(0.42)
15.93(1.46)
15.93(1.23)
45.41(5.51)
Did stay in full time education 82%
6.28(0.46)
17.19(2.53)
17.17(2.19)
47.09(5.08)
Whole sample6.24
(0.46)16.96(2.5)
16.92(2.11)
46.8(5.19)
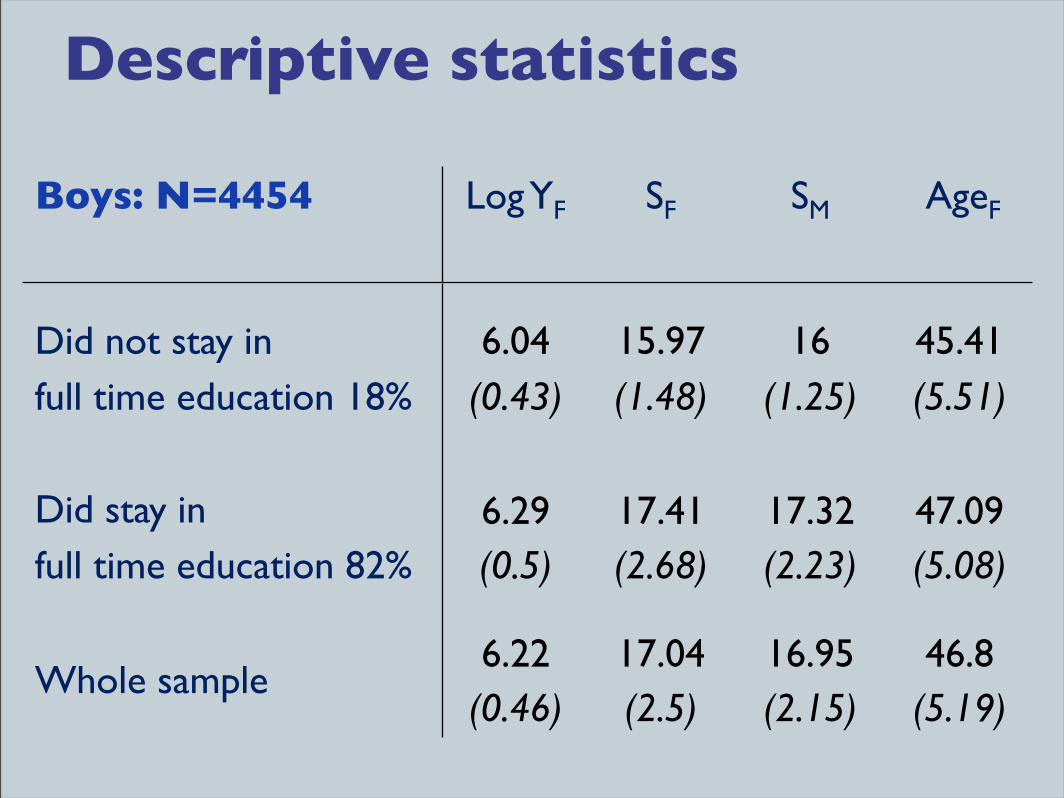
Descriptive statistics
Boys: N=4454 Log YF SF SM AgeF
Did not stay in full time education 18%
6.04(0.43)
15.97(1.48)
16(1.25)
45.41(5.51)
Did stay in full time education 82%
6.29(0.5)
17.41(2.68)
17.32(2.23)
47.09(5.08)
Whole sample6.22
(0.46)17.04(2.5)
16.95(2.15)
46.8(5.19)
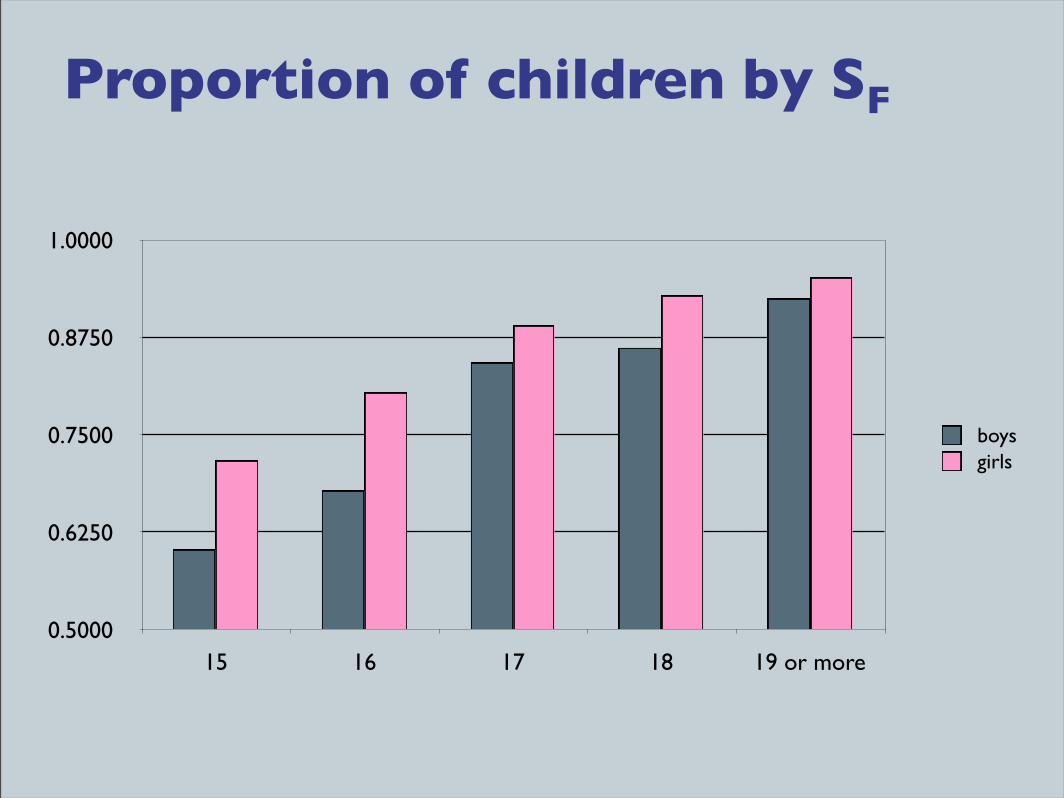
Proportion of children by SF
0.5000
0.6250
0.7500
0.8750
1.0000
15 16 17 18 19 or more
boysgirls

OLS: Dependent Variable SC>15
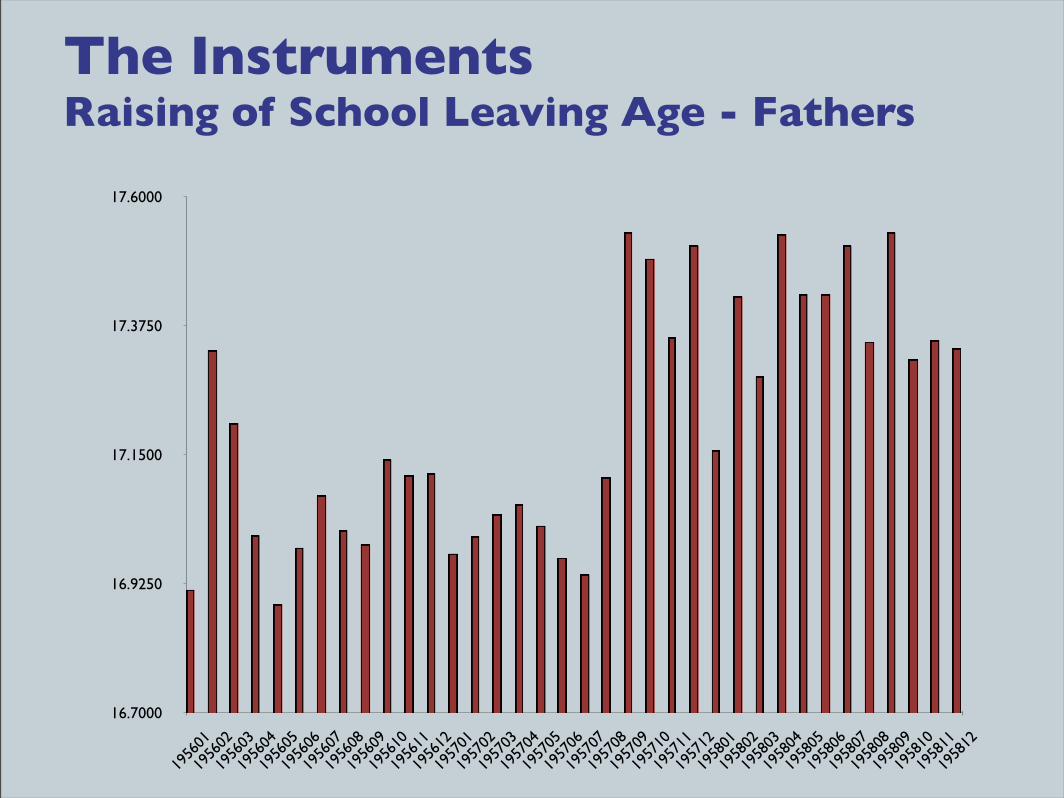
The InstrumentsRaising of School Leaving Age - Fathers
16.7000
16.9250
17.1500
17.3750
17.6000
1956
01
1956
02
1956
03
1956
04
1956
05
1956
06
1956
07
1956
08
1956
09
1956
10
1956
11
1956
12
1957
01
1957
02
1957
03
1957
04
1957
05
1957
06
1957
07
1957
08
1957
09
1957
10
1957
11
1957
12
1958
01
1958
02
1958
03
1958
04
1958
05
1958
06
1958
07
1958
08
1958
09
1958
10
1958
11
1958
12
0%
25%
50%
75%
100%
1953
219
541
1954
319
552
1956
119
563
1957
219
581
1958
319
592
1960
119
603
1961
2
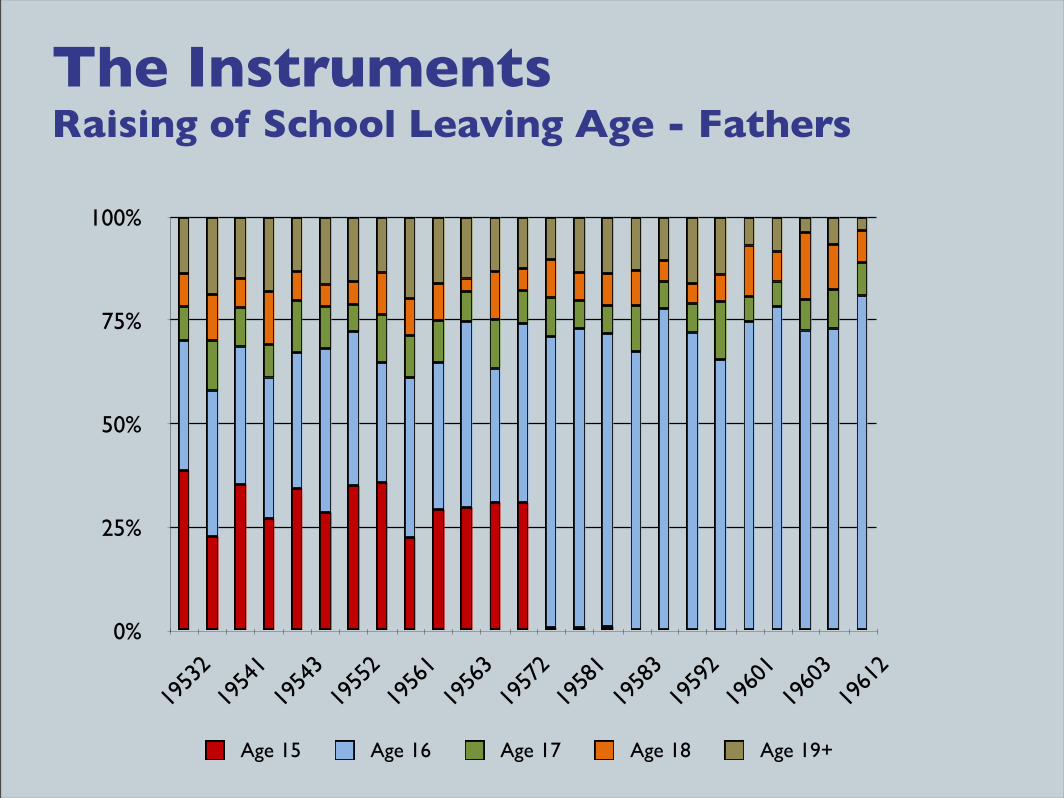
Age 15 Age 16 Age 17 Age 18 Age 19+
The InstrumentsRaising of School Leaving Age - Fathers
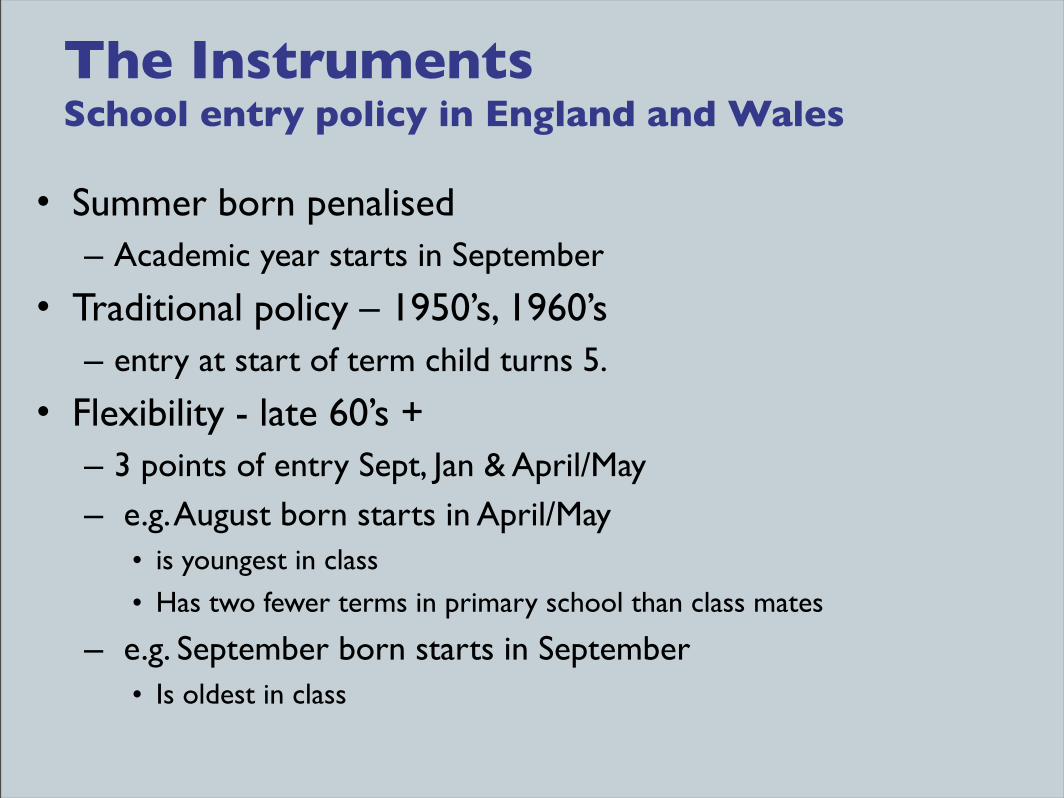
The Instruments School entry policy in England and Wales
• Summer born penalised– Academic year starts in September
• Traditional policy – 1950’s, 1960’s– entry at start of term child turns 5.
• Flexibility - late 60’s +– 3 points of entry Sept, Jan & April/May– e.g. August born starts in April/May
• is youngest in class
• Has two fewer terms in primary school than class mates
– e.g. September born starts in September • Is oldest in class
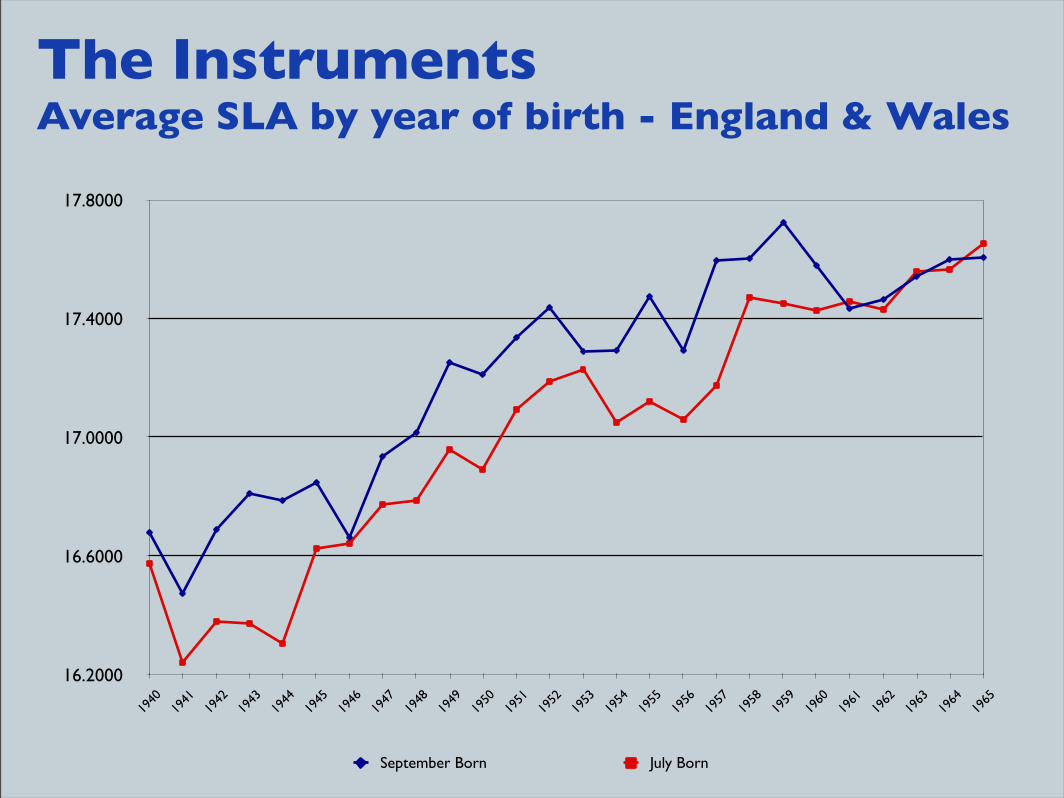
The Instruments Average SLA by year of birth - England & Wales
16.2000
16.6000
17.0000
17.4000
17.8000
1940
1941
1942
1943
1944
1945
1946
1947
1948
1949
1950
1951
1952
1953
1954
1955
1956
1957
1958
1959
1960
1961
1962
1963
1964
1965
September Born July Born
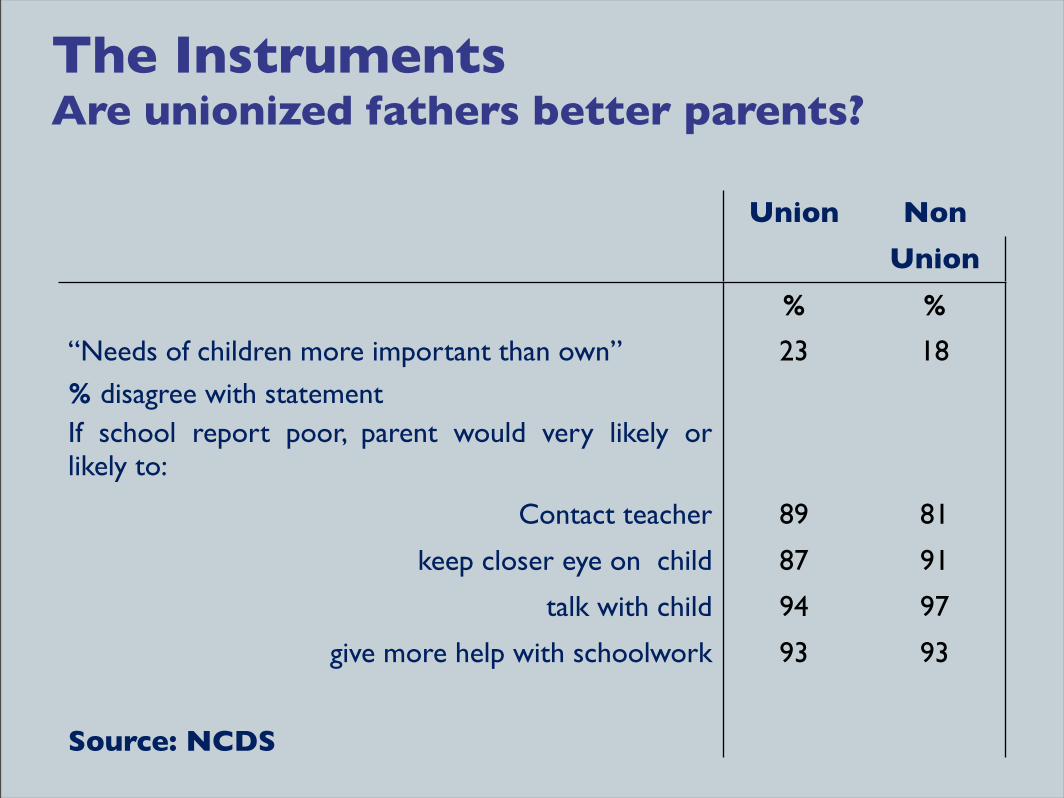
Union Non Union
Union
% %
“Needs of children more important than own”
% disagree with statement
23 18
If school report poor, parent would very likely or likely to:
Contact teacher 89 81
keep closer eye on child 87 91
talk with child 94 97
give more help with schoolwork 93 93
Source: NCDS
The Instruments Are unionized fathers better parents?
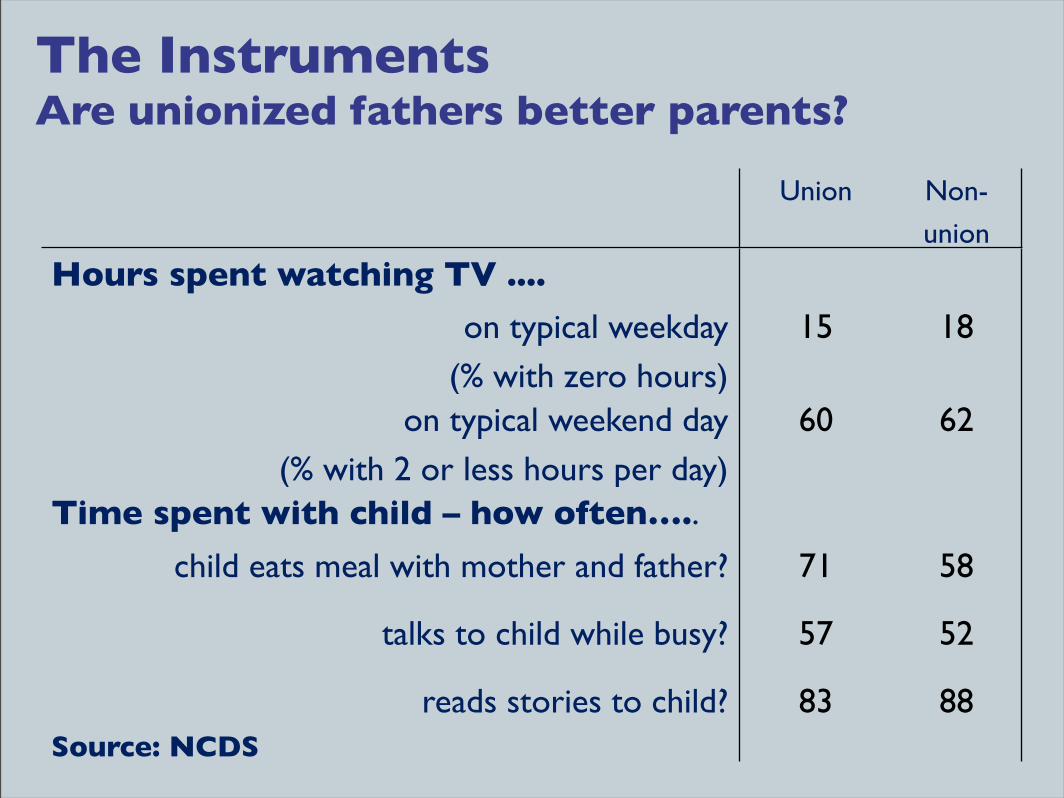
Union Non-
union
Hours spent watching TV ....
on typical weekday (% with zero hours)
15 18
on typical weekend day (% with 2 or less hours per day)
60 62
Time spent with child – how often…..
child eats meal with mother and father? 71 58
talks to child while busy? 57 52
reads stories to child? Source: NCDS
83 88
The Instruments Are unionized fathers better parents?
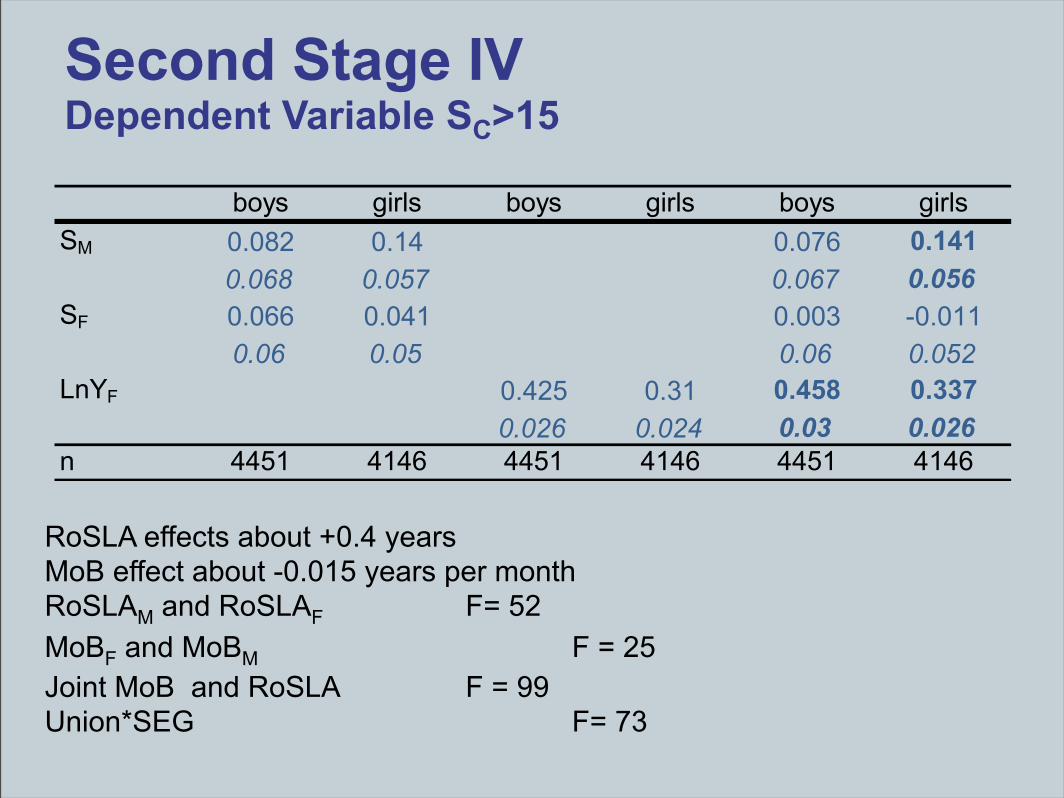
Second Stage IVDependent Variable SC>15
RoSLA effects about +0.4 yearsMoB effect about -0.015 years per monthRoSLAM and RoSLAF F= 52MoBF and MoBM F = 25Joint MoB and RoSLA F = 99Union*SEG F= 73
Robustness checks
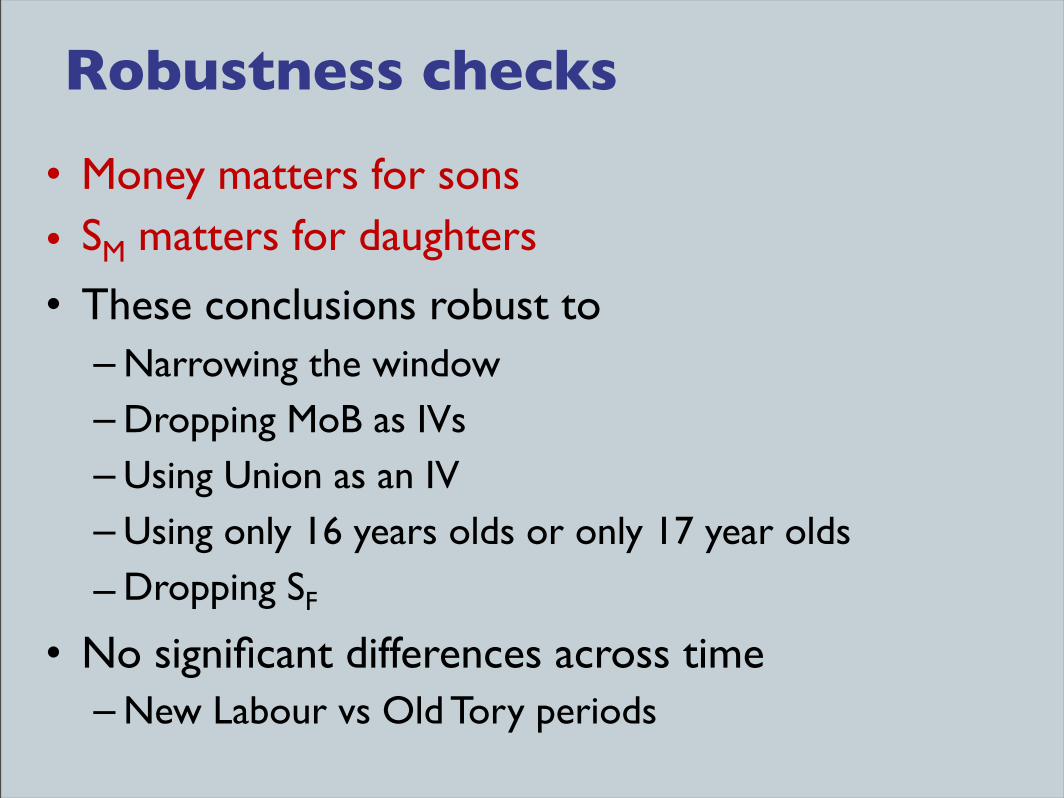
• Money matters for sons• SM matters for daughters
• These conclusions robust to– Narrowing the window– Dropping MoB as IVs– Using Union as an IV– Using only 16 years olds or only 17 year olds
– Dropping SF
• No significant differences across time– New Labour vs Old Tory periods
Interpretation
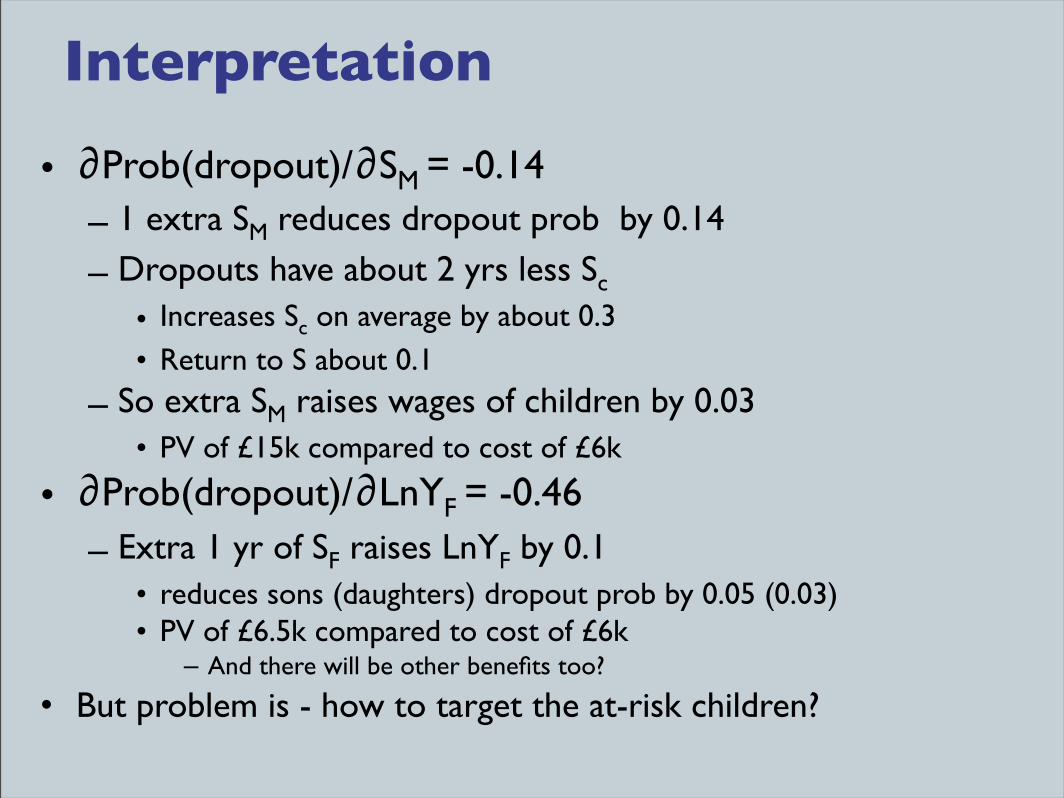
• ∂Prob(dropout)/∂SM = -0.14– 1 extra SM reduces dropout prob by 0.14
– Dropouts have about 2 yrs less Sc
• Increases Sc on average by about 0.3• Return to S about 0.1
– So extra SM raises wages of children by 0.03• PV of £15k compared to cost of £6k
• ∂Prob(dropout)/∂LnYF = -0.46– Extra 1 yr of SF raises LnYF by 0.1
• reduces sons (daughters) dropout prob by 0.05 (0.03)• PV of £6.5k compared to cost of £6k
– And there will be other benefits too?
• But problem is - how to target the at-risk children?
Conclusion
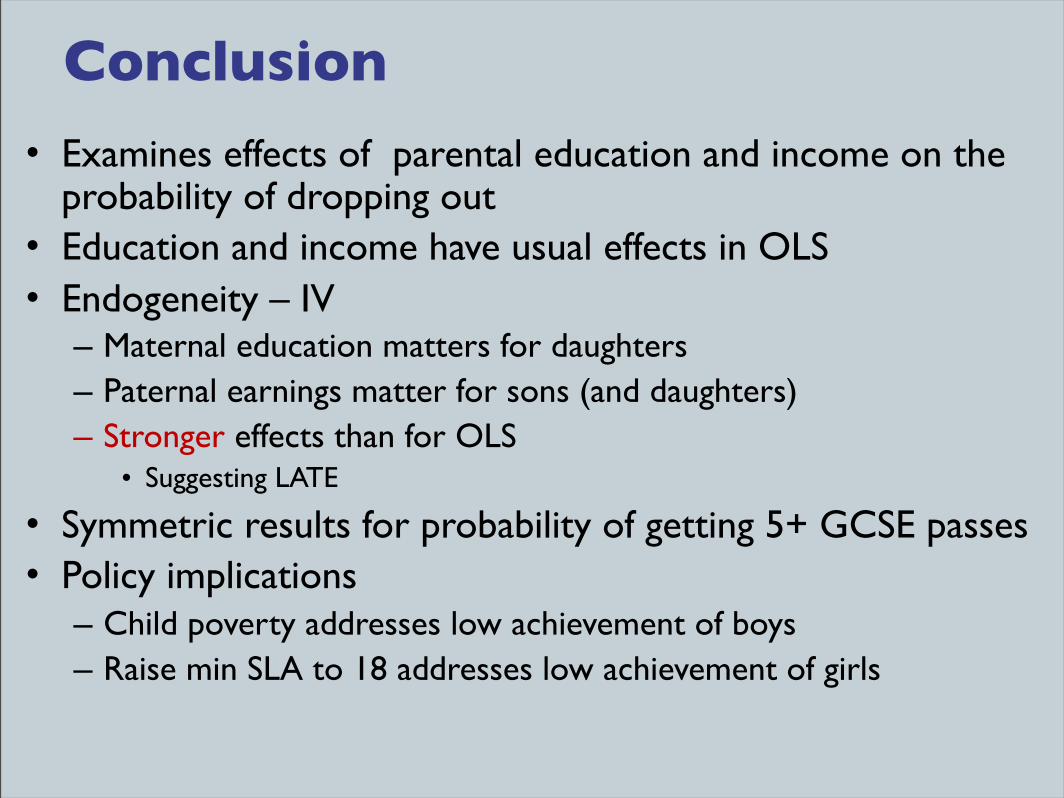
• Examines effects of parental education and income on the probability of dropping out
• Education and income have usual effects in OLS• Endogeneity – IV
– Maternal education matters for daughters– Paternal earnings matter for sons (and daughters)– Stronger effects than for OLS
• Suggesting LATE
• Symmetric results for probability of getting 5+ GCSE passes• Policy implications
– Child poverty addresses low achievement of boys– Raise min SLA to 18 addresses low achievement of girls


