"Making it Mutual The Ownership Revolution that Britain Needs"
The Impact of Mutual Fund Ownership on Corporate Investment:
Evidence from a Natural Experiment
Roni Kisin∗
Olin Business School
Washington University in St. Louis
May 1, 2011
ABSTRACT
Mutual fund holdings data reveal a significant impact of mutual funds on the realinvestment activities of their portfolio companies. I address the problem of the endo-geneity of mutual fund ownership by using the shock to investor flows caused by the2003 trading scandal, in which twenty five mutual fund families were implicated inillegal trading practices. The scandal caused substantial capital outflows from fundsthat belonged to implicated families. Following the scandal, firms that were held byfunds from implicated families experienced significant changes in capital expendituresand acquisitions. Both the magnitude and the direction of these changes varied accord-ing to a type of a distressed fund: corporate investment decreased more in firms heldby funds whose ownership in the past was associated with increases in corporate in-vestments, and even increased in firms held by funds whose ownership was historicallyassociated with significant decreases in corporate investment. Consistent with modelsof governance by the threat of exit, the effects are especially strong for firms with highsensitivity of executive compensation to stock prices, firms with liquid stock, and im-portant holdings. These findings provide evidence on the causal effect of institutionalshareholders on the real activity and highlight a link between financial and real sidesof firms.
∗Email: [email protected]. This paper is a revised version of part of my Ph.D. dissertation at the BoothSchool of Business, University of Chicago. I am grateful to my advisors, Raghuram Rajan (chair), StevenKaplan, Gregor Matvos, Tobias Moskowitz, and Amit Seru, for their guidance. I thank Itzhak Ben-David,Marianne Bertrand, Douglas Diamond, Alex Edmans, Michael Gofman, Radha Gopalan, Richard Holden,Ali Hortacsu, Christopher Hrdlicka, Eugene Kandel, E. Han Kim, Rinat Kisin, Yian Liu, Dong Lou, AsafManela, Atif Mian, Alan Moreira, Adair Morse, Alexi Savov, David Solomon, Amir Sufi, Anjan Thakor,Luigi Zingales and seminar participants at Boston College, Federal Reserve Bank of Boston, Federal ReserveBoard, Indiana University, London Business School, LSE Paul Woolley Center Conference, University ofChicago, Washington University in St. Louis for helpful comments and discussions.

1. Introduction
Can a large group of small shareholders, such as mutual funds, influence real investments of
their portfolio companies? Investments, arguably the most important corporate decisions,
are at the epicenter of a potential conflict of interests between management and shareholders.
And since relatively small holding sizes dominate equity holdings in the United States, the
ability of disperse shareholders to influence management is vital for our corporate governance
system. So far, however, there is no evidence of such influence. The lack of evidence, taken
at its face value, may lead to an unsettling conclusion: a massive group of shareholders that
holds almost 30% of the shares of an average company, seems to be excluded from steering
the real activities of public corporations.1
The dismissal of mutual funds as passive investors may at first appear unsurprising. In
many theories, a large block of stock is a prerequisite for shareholder influence, which means
that disperse shareholders should not have a real impact (e.g., Shleifer and Vishny, 1986).
But a recent literature turns attention to an additional governance tool for shareholders who
may sidestep an active governance role. Small investors can influence management by the
mere threat of exit, since their exit conveys negative information to the market and depresses
the stock price (e.g., Admati and Pfleiderer, 2009; Edmans, 2009). Supporting this insight,
recent empirical papers documents that dissatisfied institutions indeed “vote with their feet,”
leaving the firms prior to adverse events (Parrino, Sias, and Starks, 2003; Chen, Harford,
and Li, 2007). This renewed conceptual framework calls for a direct empirical examination
of the notion of mutual fund passivity, implicitly made in the literature.
My empirical approach addresses two main challenges in appraising the real impact of
shareholders. First, ownership is endogenous. Correlations between mutual fund ownership
and corporate investments could be driven by common economic conditions and by the self-
selection of mutual funds who may choose firms that follow particular investment patterns.
I address the problem of the endogeneity of the mutual fund ownership by using the shock to
1In fact, the empirical literature is sceptical about the real impact of institutional investors in general.Institutions as a group are entrusted with roughly 60% of the publicly traded equity in the U.S. Somepapers (e.g., Wahal and McConnell, 2000; Bushee, 1998) document positive correlation between institutionalownership and R&D, but the causal impact of these shareholders is still an open empirical question.
1

ownership caused by the 2003 mutual fund trading scandal. In this scandal, 25 large mutual
fund families were accused in allowing illegal trading practices, such as market timing and
late trading, in some of their funds. The legal charges led to significant capital outflows from
the implicated families. Since large outflows lead to a decrease in mutual funds positions,
the scandal created a shock well suited to test the theories of shareholder influence.
The second challenge is that there is no unambiguous prediction about the direction
of shareholder influence on real investment. Firms could overinvest or underinvest relative
to the level of investment that their shareholders perceive to be optimal. Shareholders
themselves may disagree about the right course of action.2 Therefore, even with a plausible
source of exogenous variation in ownership, testing for an effect of such variation requires a
measure of shareholder or firm heterogeneity. That is, one needs either a measure of over-
or under-investment, or a measure of shareholders’ attitudes towards investment policies.
Otherwise, the average effect may conceal important conflicting effects.
To address this second challenge I estimate a measure of each mutual fund’s approach to
the capital expenditures of its portfolio companies – a mutual fund’s type. This measure is
a mutual fund fixed effect from a regression of corporate investments (capital expenditures,
number of acquisitions) on time varying firm characteristics, as well as year, firm and mu-
tual fund fixed effects. It captures the individual fund heterogeneity in setting corporate
investment policies. I then examine the interaction between the fund type and the effect of
the trading scandal, that is, I allow the effect of the scandal to vary by the types of mutual
funds that held the firms in my sample. If the scandal hurt a fund’s ability to influence
management, we would expect investments to move in an opposite direction from the fund’s
type. That is, firms held by higher types would decrease investments, since part of their
investments was due to the particular fund’s attitude towards investments.3
2Anecdotally, disagreements among shareholders are common. A recent example involving mutual fundsis the proxy fight over the merger between Hewlett-Packard and Compaq. Putnam, a largest institutionalinvestor in HP with 2.5% stake, supported the merger, whereas some others, including Wells Fargo and Bancof America were opposed to the deal. Mutual funds’ attitudes towards the deal were widely discussed in themedia and had a significant impact on the merger, despite relatively small holding sizes.
3The triple fixed effect estimation is similar in spirit to Bertrand and Schoar (2003) who estimated a similarspecification for CEOs and Cronqvist and Fahlenbrach (2008) who estimated it for blockholders. The exactmethodology used here is different from these papers and follows Abowd, Kramarz, and Margolis (1999)that allows, among other advantages, estimating models with high-dimensional fixed effects. Theoretically,
2

Importantly, the mutual fund fixed effect alone cannot be interpreted as a causal impact
of mutual funds on corporate investments; the exogenous matching assumption that is needed
to separately identify firm and mutual fund fixed effects is unlikely to hold in my sample. As
a result, the estimated fixed effect will comprise both a selection effect and a causal impact
of mutual fund ownership. Interacting the mutual fund type with the shock to ownership,
such as the trading scandal, helps teasing out a causal effect, with some caveats that will be
examined in detail below.
Consistent with the previous literature, I find that an average effect of the scandal on
capital expenditures (“capex”) could be considered relatively modest: on average, firms held
by funds from implicated families had a decrease of 0.001 in capex and an increase of 0.01 in
the number of acquisitions. But the average effect conceals an important heterogeneity across
mutual funds in their real impact: firms that were held by mutual funds that historically
had a more positive influence on corporate investments experienced bigger decreases in their
investments. For example, an increase of 1 standard deviation in capex type would result in
an additional decrease of -0.0017 in the capex following the scandal (2.7% of the standard
deviation of capex in 2003). For firms held by shareholders of low types (anywhere below
the 30th percentile), the shock resulted in an increase in investments. For example, a shift
from a mean type to a lowest 10th percentile, would change the effect of the shock from a
increase of 2.3% of the standard deviation. Qualitatively similar results are reported for the
number of acquisitions.
Next, I test several additional hypotheses in order to gain a better understanding of the
source of the results. First, consistent with a prediction of theories of shareholders’ impact,
I find that the results are especially strong for the subsample of important shareholders.4
Second, I find that the results are primarily driven by firms where the CEO compensation
is sensitive to stock prices, which is predicted by the theories where shareholders use the
threat of exit to discipline management. Third, consistent with the theories that predict
an extensive literature has studied the origins and the consequences of persistent differences in beliefs, e.g.,Kurz (1994a,b), Cripps, Ely, Mailath, and Samuelson (2008).
4I define importance as larger than average holding size for the period prior to the scandal.
3
shareholders will have stronger influence when the liquidity of the shares is higher,5 I find
that the above results do not hold for a subsample of firms with illiquid stocks.
The contribution of this paper to the literature on the role of institutional investors is
twofold. First, the paper provides causal evidence on the importance of mutual funds for
real investments. Second, it provides evidence that the heterogeneity among institutional
investors is an important driver of their influence. In addition, the paper provides micro-level
evidence on the interaction between financial and real sides of firms. The evidence suggests,
short-term fluctuations in the financial markets that affect shareholders participation in the
ownership of firms might have real consequences for companies they hold.
2. Related Literature and Testable Hypotheses
Mutual funds have had a significant presence in the ownership of the U.S. publicly traded
companies for quite a long time. However, the empirical literature on mutual funds has
mostly ignored their impact on real investment activities of their portfolio companies.6 The
empirical literature that examines institutional investors in general, also has not reached
a consensus about the real effects of these shareholders. Recent examples include Bushee
(1998), Wahal and McConnell (2000), Hansen and Hill (1991) who find positive correlation
between institutional ownership and R&D expenditures. Although this literature provides
very useful descriptive evidence, whether institutional investors, and particularly mutual
funds, have a causal impact on investment policies it is still an open empirical question.
A potential disagreement between shareholders and management over corporate invest-
ments has received a great deal of attention from theorists. In agency models moral hazard
may drive investments away from the optimal level if choosing the optimal level is privately
costly for the manger (Holmstrom and Weiss, 1985; Lambert, 1986; Hirshleifer and Suh,
1992). Other theories suggest that managers may have an incentive to boost short-term
5E.g., Maug (1998), Admati and Pfleiderer (2009).6One exception, and perhaps the closest study to this paper, is Cronqvist and Fahlenbrach (2008), who
find significant blockholder fixed effects in determining various corporate policies.
4

profits at the expense of investments that would maximize a long-term growth. This incen-
tives arise due to managerial reputation concerns (Narayanan, 1985; Scharfstein and Stein,
1990), or managerial obsession with short-term variation in stock prices (Stein, 1988, 1989).
Since these models study different frictions and mechanisms, there is no unified directional
prediction on the deviation of corporate investments from the level that maximizes share-
holder value; shareholders could be facing over- and under-investment, depending on the
firm.
In addition to the disagreement with management, shareholders themselves may disagree
about the optimal course of action for the firm. Kurz (1994a,b) shows that rational agents
may disagree about the interpretation of the same data even if they share a common goal
(e.g., maximizing firm value).7 Acemoglu, Chernozhukov, and Yildiz (2006) show that with
uncertainty about the precision of signals, agents’ beliefs may not converge. Cripps, Ely,
Mailath, and Samuelson (2008) show that with finite signal space, individual learning may
not result in an agreement even when agents start with common priors. Therefore, from the
theoretical standpoint, it is not surprising that shareholders may have persistently different
opinions on the real policies of the firm.
Reviewing the theoretical literature, it becomes evident that even if mutual funds have
an ability to affect real investments of the firms they hold, focusing only on an average
effect of their intervention may be misleading. The average effect may appear small simply
because mutual funds are pushing real investments upward in some firms and downward in
others, or because mutual funds have diverging opinions about the right course of action for
the firm. Therefore, one either needs a measure of a firm’s deviation from the the level of
investments that shareholders want, or a measure of shareholders’ attitude towards corporate
investments. For the lack of a measure of firms’ deviation from value-maximizing investment
level in my sample, I use a measure of shareholder heterogeneity.
7In this theory, the disagreement may persist when the data generating process is non-stationary (orwhen agents are not certain that it is stationary) since in that case the process is not uniquely identified andagents’ beliefs cannot be rejected based on the available data. Boot, Gopalan, and Thakor (2008) apply thistheory in a financial setting and demonstrate that an uncertainty about future shareholders’ beliefs createsan incentive for a firm to go private, due to the instability of alignment between the beliefs of managersand shareholders about future growth opportunities. and Garmaise (2001) studies the interactions betweeninvestors’ heterogenous beliefs and security design.
5

There is a growing empirical evidence supporting the importance of shareholder hetero-
geneity. Matvos and Ostrovsky (2008) find systematic heterogeneity in voting among mutual
funds – some mutual funds are consistently more lenient towards managerial proposals than
others. Cronqvist and Fahlenbrach (2008), find evidence for a persistent heterogeneity be-
tween blockholders; in their data, there are significant blockholder fixed effects in different
corporate policies.8 Chen, Harford, and Li (2007) document that independent long-term
institutions are more inclined than others to monitor management.
PREDICTION 1 (Mutual fund type): Reflecting the heterogeneity in mutual funds’
attitudes on corporate investment policies, capital expenditures are systematically related
to individual mutual funds that hold the firms’ shares.
How can mutual funds enforce their will on the management of their portfolio companies?
Theories of shareholder influence can be roughly divided into two groups, depending on
whether the influence is done by direct and active influence (“voice”) or by the threat of
exit. Theories of voice usually tie shareholder influence to holding sizes (e.g., Shleifer and
Vishny, 1986; Burkart, Gromb, and Panunzi, 1997; Maug, 1998; Admati, Pfleiderer, and
Zechner, 1994; Kahn and Winton, 1998). In the theories of exit shareholders can sell their
shares causing the stock price to reflect their information (e.g., Admati and Pfleiderer, 2009;
Edmans, 2009; Edmans and Manso, 2009). Management, whose compensation is tied to
prices, would then have an incentive to cater to the interests of shareholders. Both groups
of theories – voice and exit – predict that illegal trading charges should inhibit the ability
of mutual funds that belonged to implicated families to influence firms’ investments. In
the theories of voice, this would happen since distressed funds would have to reduce their
holdings due to outflows. In the theories of exit, the outflows induced by the scandal would
lead to an increase in the probability that shareholders would sell their shares for reasons
unrelated to the firms’ fundamental characteristics, which would hurt the effectiveness of the
threat of exit as a disciplining device.
8There are 111 mutual funds in their sample. They are, however, unable to reject the hypothesis thatthe correlation between the presence of these mutual funds and investment policies is due to selection.
6

Combining the shock to ownership caused by the trading scandal and the estimate of
mutual fund type leads to the following directional prediction on the effect of the scandal
on corporate investments. If mutual funds have a particular attitude towards corporate
investments, and they have been influencing corporate investments accordingly prior to the
scandal, then following the scandal, investments should move in an opposite direction from
the fund type.
PREDICTION 2 (Differential effect of the scandal): The effect of the scandal on capital
expenditures will move in a direction opposite from the mutual fund type. For firms held
by funds from implicated families, the decrease in capital expenditures will be bigger if the
fund is of the higher type.
Theories of governance by exit are especially well suited to describe a group of share-
holders with relatively small holding sizes, such as mutual funds. Mutual funds are required
to disclose their holdings and are required to comply with diversification requirements that
make it hard to accumulate blocks of stock.9 On the other hand, because of their size,
mutual funds might enjoy economies of scale in monitoring. And diversifying investments
over a large number of similar firms could further decrease the costs of monitoring. There-
fore mutual funds may have the information necessary to form an opinion about the firm’s
policies. And indeed, recent empirical work by Parrino, Sias, and Starks (2003) and Chen,
Harford, and Li (2007) shows that institutional investors act consistent with the theories
of exit. Parrino, Sias, and Starks (2003) find that institutional investors sell their holdings
before forced CEO turnover, and the long-term returns are negative following their exit.
Better informed (larger) shareholders exhibit a greater tendency to sell these shares. Chen,
Harford, and Li (2007) find that shareholders tend to sell their shares before value-reducing
mergers.
9See, e.g., Kahan and Rock (2006) for the description of regulatory environment for mutual funds industry.Fifty percent of the fund’s assets are subject to limitation that prevents a fund from holding more than 10%of the firm’s assets, and the stock of any single company cannot exceed 5% of the value of the fund. Moreover,if a fund wants to advertise itself as diversified, then 75% of the fund must be subject to this requirement. Tothe extent that accumulating large blocks that are also significant relative to the fund’s size is an importantfactor for the fund’s incentives as a monitor, this regulation makes it harder for funds to be effective monitors.
7

The models of governance by exit, however, make some additional predictions that can
help to identify whether the channel they are describing is indeed the mechanism that drives
the results. For their mechanism to work, management has to care about the price of
the company’s stock. If managerial well-being is not tied to prices, the threat of exit will
not have much of an effect. Also, shareholder influence should be weaker for firms with
illiquid stock. The intuition behind this prediction in the theories of exit is that higher
transaction costs make the threat to exit less credible.10 Finally, common to all theories of
shareholder influence is the prediction that shareholder influence will increase if a particular
firm constitutes an important part of a shareholder’s portfolio.
PREDICTION 3 (Managerial compensation): The effects of the scandal on corporate
investment will be stronger in firms where managerial compensation is more sensitive to
stock prices.
PREDICTION 4 (Liquidity): The effects of the scandal on corporate investment will be
stronger in firms with a more liquid stock.
PREDICTION 5 (Holding size): The effect of the scandal on corporate investment will
be stronger in firms which constitute an important part of an implicated mutual fund’s
portfolio.
3. Mutual Fund Trading Scandal of 2003
The trading scandal started on September 3, 2003, when New York Attorney General Eliot
Spitzer announced a settlement with certain hedge funds accused of illegal trades with funds
that belonged to four mutual fund groups (Bank of America, Janus, Strong, and Bank
One). The illegal trading practices included late trading and market timing. Following this
10This prediction could be also found in the voice literature (e.g., Maug, 1998), where liquidity is importantsince it facilitates the building of the blocks of stocks necessary to exert influence. Since mutual funds donot tend to hold large blocks of stock, however, this prediction more closely corresponds to the models ofgovernance by exit in my sample.
8

announcement, a large-scale regulatory inquiry resulted in litigation in which 25 mutual fund
families were implicated in illegal trading practices.
Late trading is an illegal practice which involves trading in the funds’ shares after the
closing deadline, but at the closing prices. Mutual funds in the United States stop trading
at 4pm, and any orders that are submitted at the same day after 4pm have to be executed
at the next day’s prices. However, some mutual funds allowed traders to trade after 4pm at
4pm prices, sometimes as late as 9pm on the same day.
Market timing is a form of rapid trading which takes advantage of stale prices. Prices of
frequently traded securities get updated often enough, but for thinly traded securities long
time might pass between trades. This makes mutual funds that hold securities that are not
often traded near the 4 pm closing time highly susceptible to stale prices – a problem that
is especially pronounced in international funds, small-company stock funds, and high-yield
bond funds. To illustrate, consider an international fund that holds securities traded in
New York, Tokyo and London. At 4pm New York time, the prices on the London traded
securities held by this fund would be 4.5 hours old, and the prices of Tokyo-listed securities
would be 15 hours old. When market prices are available, the law instructs mutual funds to
price their portfolio at the current value. But if the current prices are stale, the law allows
funds to estimate the fair value of the security. In this example, when the management fails
to properly adjust the price of the mutual fund a market-timer could easily exploit the stale
prices if there is a correlation between the U.S. and Japanese markets.11
The scandal thus provides a natural experiment where an exogenous shock to the liabil-
ities of mutual fund families resulted in changes in their asset side, therefore affecting their
ownership patterns. This shock is appealing because it was arguably unrelated to the unob-
servable factors that drive corporate investments, and it had significant negative short-term
consequences for the flows of implicated mutual fund families. Figure I shows monthly flows
of funds and cumulative flows for funds from implicated and unimplicated families. Flows
are defined as Flowit = [TNAit − TNAit−1 ∗ (1 + Rit)]/TNAit−1, where TNAit is total net
11This activity is not illegal per se. Most of the formal charges brought by the SEC and Spitzer wereagainst funds that secretly allowed market timing for selected groups of traders, sometimes contrary to whatwas promised in their prospectuses.
9
assets under management of fund i at time t. As can be seen in the figure, immediately
following the start of the scandal, flows of the implicated funds decreased significantly. Fig-
ure ?? shows cumulative flows for funds from investigated and non-investigated families. It
shows a very significant outflows from investigated families, relative to an un-investigated
group. Within a year from the beginning of the scandal, funds from implicated families lost
14.1% of their initial capital due to outflows. After two years, cumulative outflows reached
24.3%. In the meantime, families not implicated in the scandal gained almost 12% due to
inflows of capital into their funds.
4. Data
Data in this study are obtained from several sources. Data on holdings of mutual fund
families come from the Thomson-Reuters Mutual Fund Holdings database, which includes
holding information for all mutual funds that report their holdings with the SEC.
I collect the data on funds implicated in the 2003/4 trading scandal from the online busi-
ness publications (such as the Financial Times and the Wall Street Journal), SEC litigation
publications, and Stanford Law School Securities Class Action Clearinghouse, which pro-
vides information relating to the prosecution, defense and settlement of federal class action
securities fraud litigation, and other online sources.
Data on mutual fund families come from Morninstar Inc. database and CRSP Survivor-
Bias-Free Mutual Fund Database.
The data on mergers and acquisitions come from the SDC Platinum database. The data
on CEO compensation are from the Exucomp database. Firm-level accounting variables are
obtained from Compustat, and returns and stock prices are from CRSP. I match Compus-
tat with Thomson-Reuters Holdings data using Mflinks, available on WRDS. Appendix A
provides details on the definitions of variables.
Much of holdings data are reported quarterly, although mutual funds are only required
to disclose their holdings semiannually. In addition, a small number of funds report late.
10

Following the literature that studies mutual fund holdings, in order to fill such gaps, I impute
the holdings for the missing quarters using the information from the recent quarter.12
The final sample consists of a mutual fund-firm matched panel dataset with 4765 funds
and 12586 firms between 1980 and 2008 (4103 funds and 7904 firms after 2000). Firms
in the sample are publicly traded U.S. corporations with valid Compustat data that could
be matched to the Thomson holdings data.13 In order to be included in my sample, the
mutual fund needs to have valid holding data in the Thomson-Reuters Mutual Fund Holdings
database, as well as a valid link between the holding data and CRSP Mutual Funds database.
In addition, I exclude a small number of funds for which I could not find the fund family
information.
Table I presents some descriptive statistics and compares funds implicated and non-
implicated families and the firms they held in 2003. Funds that belonged to implicated
families were slightly larger. The mean and the standard deviation of fund types were
similar in two groups, and they held a similar firms in terms of observable characteristics.
5. Results
5.1. Estimation of Mutual Fund Types
I estimate the types of mutual funds as a fund fixed effect from the following triple fixed
effects regression of corporate investments on time-varying firm characteristics, time effects,
firm fixed effects, and mutual fund fixed effects:
Iijt = βXijt + θi + ψj + εijt, (1)
12See, e.g., Marcin Kacperczyk and Zheng (2008).13In addition, I exclude regulated utilities (SIC codes 4900-4949) and financial institutions (SIC codes in
the 6000 range) and funds that have on average fewer than 10 identified stock positions and have less thanUS$5 million in assets under management .
11

where Iijt is an investment policy (capex or acquisitions) in firm i that was held by fund j at
quarter t, Xijt is a set of time-varying variables that includes time fixed effects and controls
(cashflow, lagged log of total assets, lagged Tobin’s Q), θi is a firm fixed effect, ψj is a mutual
fund fixed effect, and εijt is a regression residual. I use the estimated ψ̂j as a proxy for the
type of a mutual fund j.
Abowd, Kramarz, and Margolis (1999) develop a methodology where firm and fund fixed
effects (in their application, worker and firm fixed effects) can be separately estimated if we
observe enough movements of funds across firms. They propose a way to identify the effects
through the “group connection.” To define a connection, start with any firm and include all
mutual funds that ever held it. For each of these funds, add all the firms they ever held.
Continue these steps until no new funds or firms are added to the group. In my sample,
there is only one such group; all firms and mutual funds families are connected. The number
of identifiable fixed effects equals to the number of firms + the number of funds - 1.14 The
estimation involves differencing out firm effects, then estimating the fund fixed effects using
the least squares dummy variable approach, and then backing out the firm effects. Appendix
B provides a more detailed description of the methodology.
This method has some advantages over the least squares dummy variable method usu-
ally used in corporate finance literature (e.g., Bertrand and Schoar, 2003; Cronqvist and
Fahlenbrach, 2008). Most important, using the least squares approach becomes computa-
tionally difficult in datasets with large number of firms and shareholders, and differencing
out firm effects solves this problem.15 But this methodology shares an important downside
with the literature that uses such fixed effects for identification. It assumes exogenous mo-
bility, conditional on observable variables and fixed effects. Given this assumption, the fixed
effect represents a causal impact of mutual funds on capital expenditures. Although this is
a standard assumption in the literature that uses this or similar estimation techniques, in
my setting it is clearly unrealistic. Using this measure together with the exogenous shock
14The estimated effects are normalized to one of the fixed effects, which makes it hard to interpret theactual size of the fixed effects. Instead, my analysis will essentially exploit the differences between thesefixed effects.
15In addition, this methodology allows identifying the fixed effects for firms that were held by only onefund and funds that held only one firm throughout the sample period (1215 firms and 46 funds in my sample).
12

to ownership mitigates this concern. If the type reflects only selection of families into cer-
tain types of firms, it would not be reflected in the real corporate investment policies when
interacted with exogenous shock to ownership.
Each row in Table II Panel A shows the F-Statistic for the joint significance of the mutual
fund fixed effects in Equation 1 for capex (rows (1), (3)) and the number of acquisitions (rows
(2), (4)). The first two rows show the results for the full sample, and the 3d and the 4th row
show the results for the pre-2000 sample (out-of-sample estimates). In a triple-differences
regressions (described below), I use the out-of-sample estimate of type in order to mitigate
a concern of spurious correlation.
Consistent with the view that there is a significant heterogeneity between mutual funds
in their attitude toward corporate investments, I reject the hypothesis that all fund effects
are zero in all specifications.16
In order to better understand the origins of this heterogeneity, I examine the correlation
of the estimated fixed effects with mutual fund characteristics in Panels B and C of Table II.
Panel B shows the average type for different styles of mutual funds–growth, value, core, and
other (the rest). Average capex fixed effect is much higher in growth funds than in value
funds and in core funds. Same is true for the average acquisitions fixed effect. Growth funds
seem to appreciate investments and high-investment firms more than other types of funds.
Pane C of Table II regresses the estimated type on fund characteristics (style and size).
Again, we see that the fixed effects are positively correlated with growth funds and negatively
correlated with core and value. Importantly, it is also evident from the low R2 of these
regressions that there is much more information in the fixed effect than can be captured by
simply examining the fund investment styles.
16These results are also consistent with the findings reported by Cronqvist and Fahlenbrach (2008), whofind that individual blockholder fixed effects are statistically significant in explaining variation in corporateinvestment, particularly in the case of mutual funds that held blocks in their sample.
13
5.2. The Effect of the Trading Scandal on Investments
To estimate the effect of mutual fund ownership, estimate the following two equations on a
sample between the year 2000 and 2007, inclusive. First, a simple difference-in-differences
specification that does not account for mutual fund heterogeneity: 17
Iijt = β1Xijt + θi + β2Post ∗ Scandalj + β3Scandalj + β4Post+ εijt, (2)
where Iijt is either capex or number of acquisitions made by firm i, that was held by fund
j during quarter t. Scandalj is a dummy variable that indicates whether a mutual fund j
belonged to an implicated family, Post is a dummy variable indicator of the post-scandal
period, Xijt is a vector of time-varying controls that includes year effects, θi is a firm fixed
effect, and εijt is the regression residual. The coefficient of interest here is β2, the average
effect of the scandal on investments.
Second, I examine the interaction of the shareholder type with the indicator whether a
fund belonged to a family implicated in the trading scandal. In particular, I estimate the
following triple differences specification:
Iijt = β1Xijt + θi + β2Post ∗ Scandalj + β3Post ∗ Scandalj ∗ Typej
+ β4Typej + β5Post+ β6Scandalj
+ β7Post ∗ Typej + β8Scandalj ∗ Typej + εijt,
(3)
where Typej is the type of fund j as defined above.
The coefficients of interest in equation 3 are β3 and β2 + β3 ∗ ˜Typej. The coefficient β3
measures how the effect of the scandal varies with the family type. The total effect of the
scandal can be computed as β2 + β3 ∗ ˜Typej, where ˜Typej is a particular family type.
17Throughout the analysis, the standard errors are clustered on the firm level and the observations areweighted by the inverse of the standard error of the estimated mutual fund type to account for the estimationerror.
14

Intuitively, the regression in equation 3 first compares the level of investment before
and after the scandal separately for the treatment group (firms held by implicated families)
and the control group, creating a difference for each group. Then the regression takes the
difference between these two separate differences. This provides an estimate of the scandal
on investment. The interaction with type provides the third difference, allowing the scandal
to have a separate effect for firms held by distinct types. This third differencing is a direct
test of the main hypothesis of this paper, that is, the hypothesis that firms that happened
to have implicated shareholders of higher types experienced bigger drops in investments.
Figure II presents a simplified version of the triple differences analysis. It shows an
average capital expenditures ratio before and after the scandal, breaking these averages by
quintiles of mutual funds’ types. The upper panel of the figure shows the changes in average
capex for firms held by funds from implicated families. Average capex increased in firms
held by funds of lower types (1st and 2nd quintile), did not change in firms held by funds of
medium type (3d quintile), and increased in firms held by funds of high types (4th and 5th
quintile). The raw data, therefore, supports the hypothesis that the same shock resulted in
a different responses in firms held by different types of mutual funds.
Table III presents the main results of this paper. Dependent variables are capex (columns
(1), (2)) and number of acquisitions (columns (3),(4)). In column (1) and (3) we see the
effect of the scandal without allowing for heterogeneity across mutual funds (equation 2).
The average effect of the scandal is a decrease of -0.001 in capex and an increase of 0.01 in
the number of acquisitions.
Columns (2) and (4) present the results of equation 3 for capex and number of acquisi-
tions. Consistent with the hypothesis that the scandal will impact investments asymmetri-
cally, in the direction opposite to the mutual fund type, the data show that the coefficient
β3 on triple interaction is negative in both specifications.18 In other words, following the
scandal, investments decreased more in firms held by mutual funds of higher types.
18F-tests (unreported) show that the coefficients on Post ∗Scandal and Post ∗Scandal ∗FamilyType arejointly significant at the 1 percent level for capex and at the 5 percent level for acquisitions.
15

The heterogeneity analysis also produces economically significant results. A one standard
deviation increase in mutual fund type would result in an additional decrease of 2.7% of the
standard deviation (2.5% of the mean) of capital expenditures in 2003. A shift from the
average type to a mutual fund’s type of the 95th percentile would decrease capex by 3.9%
of a standard deviation (3.6%) of the mean. On the other side of the type distribution, a
shift to a type of the 10th percentile would increase capex by 2.3% of a standard deviation
(2.1% of the mean). In fact, a shock to any type below the 30th percentile would result in
an increase in capex.
The analysis of the effect of the scandal on acquisitions also shows economically significant
results. A one standard deviation increase in mutual fund type results in a decrease of 3.4%
of a standard deviation (6.8% of the mean) in the number of acquisitions. A shift from the
average type to the 95th percentile would decrease the number of acquisitions by 4.1% of a
standard deviation (8.2% of the mean). And a shift to a type of a 10th percentile from the
mean would increase the number of acquisitions by 3.9% of a standard deviation (7.8% of
the mean).
According to Table III, mutual fund trading scandal had a significant impact on the real
investments. The average effect of the scandal was statistically significant for both capex
and acquisitions. It was economically large for acquisitions (an increase of about 3% of a
standard deviation) and less so for capex (1% of a standard deviation decrease). The average
effect, however, hides an important heterogeneity between mutual funds. While a shock to
ownership by high types resulted in a decrease in investments, a shock to low types resulted
in an increase. To emphasize, looking at the relatively extreme points of the type distribution
we learn that replacing a mutual fund of a lowest 1st percentile of type with a fund of a 99th
percentile, the effect of a shock would change from an increase in capex of 5% of a standard
deviation to a decrease of a 8.3% of a standard deviation.
Table IV directly test a prediction of theories where shareholders influence firms by the
threat of exit that the impact of shareholders will be stronger in firms where managerial
wealth is sensitive to share prices. I split the sample into two parts – one where wealth-
performance sensitivity (WPS) is higher than the median, and one where it lower than the
16
median. The measure of WPS is the dollar change in CEO wealth for a 100 percentage point
change in firm value, divided by annual flow compensation. I follow the methodology of Core
and Guay (2002), augmented by Alex Edmans and Landier (2008).19
Table IV shows that mutual fund influence is most pronounced in firms with high WPS.
The sign of the coefficient on the triple interaction term is still negative in a subsample with
low WPS, but the coefficient is smaller and not statistically significant. This suggests that
governance by small shareholders, such as mutual funds, hinges upon the price impact of
their exit; in firms where CEOs care less about share price, mutual funds will have less of
an ability to influence firms.20
Table V tests whether mutual funds’ influence is stronger in firms with a more liquid stock.
I sort the firms in my sample based on whether they were above median in Amihud (2002)
illiquidity measure defined as the yearly average of 1000000 ∗ |Return|(|price|∗volume) over all days with
non-zero volume, using daily data. Again, the sign of the coefficient on the triple interaction
of scandal with mutual fund type is the same in both subsamples, but only in a subsample
of firms with liquid stock the results are economically and statistically significant.21 This
result is consistent with the view that shareholders will find it harder to influence firms with
illiquid stock, supporting the theories of influence by exit, as well as Maug (1998).
Table VI tests an additional prediction from the theories of shareholder influence, namely
that the effect of the scandal will be stronger for firms which represent an important part
of a mutual fund’s portfolio. I sort companies based on their weight in the fund’s portfolio,
and classify a firm as important if its weight in the portfolio was larger than the median.
The table shows that although the results remain statistically significant in a subsample
of unimportant holdings, they are much more economically significant in a subsample of
important holdings.22
19I thank Alex Edmans for making the WPS data available on his website.20The differences between the coefficients in the two subsamples are statistically significant at the 5% level.
For expositional clarity, I present the results separately for each subsample. The tests of the differencesbetween subsamples were performed on the pooled regression (untabulated).
21As in the case of the split by WPS, the differences between the coefficients in the two subsamples arestatistically significant at the 5% level.
22The differences between the coefficients in the two subsamples are statistically significant at the 5% levelfor capex, and at the 10% level for the number of acquisitions.
17

5.2.1. Robustness Tests
I perform several robustness tests to verify the validity of my results. The first concern is
that facing an adverse shock to flows mutual funds may get rid of firms that do not fit their
types, in which case we would see a drop in investments following a scandal because firms
would decrease investments regardless of the shock. To some extent this concern is already
mitigated in my setting since the regression involves the actual holdings of mutual funds
following the scandal. It could be the case, however, that mutual funds significantly decreased
these holdings, without dropping them entirely. In other words, this selection concern implies
that mutual funds of high (low) identified firms that would decrease (increase) investments
following the scandal and selectively decreased their holdings in those firms.
Table VII examines a testable hypothesis that comes from this selection concern. If
mutual funds expect certain firms would change investments in a direction opposite to their
types, they are more likely to decrease their holdings in these firms prior to the scandal.
Column (1) regresses the dummy variable that gets a value of 1 if a mutual fund decreased
its holding in a firm prior to the scandal (between 2000 and 2003) on a quintile of a mutual
fund type interacted with a dummy for a decrease in investments (capex, column (1) and
acquisitions, column (2)).23 The selection hypothesis implies that as the fund type increases
from the first to the fifth quintile, the coefficient on the interaction term will be positive;
funds of higher types are would be expected to decrease their holdings in firms that are about
to decrease their investments. The lack of significant positive coefficient on the interaction
terms for higher types implies that mutual funds were not decreasing their holdings in firms
that shifted investments in a direction opposite to their types after the scandal.
The second concern is that a spurious correlations that could lead to the significant
coefficient of the triple interaction coefficient from Equation 3. Although this concern is
partially mitigated by the fact that I use out-of-sample estimates of type, due to the large
size of my sample, it is still important to directly verify the robustness of my main results.
23Several different time periods were examined which provided similar results.
18

Figure III shows a histogram of t-statistics from a 1000 regressions from Equation 3,
where instead of an estimated mutual fund type, I use a placebo type variable.24 For capex,
only 2.1% and for the number of acquisitions 2.5% of the t-statistics were significant at the
95% level.25
6. Conclusion
Mutual funds hold a significant portion of publicly traded U.S. firms, but little empirical
evidence exists on their importance for the real activity of these firms. The lack of empirical
evidence of a real impact of such a large group of investors is particularly intriguing since
many theoretical papers and anecdotes suggest the impact should exist.
I provide evidence on the impact of mutual funds on the real investment activities of
their portfolio companies. My identification strategy exploits the fact that the mutual funds’
holdings, and thus their ownership in publicly traded companies, are tied to flows of capital
into and out of these funds. Therefore, an exogenous shock to the funds’ liabilities provides
a natural experiment, in which the ownership of these investors is changing for reasons
unrelated to the fundamentals of the portfolio companies. For this purpose, I use the 2003
mutual fund trading scandal, where 25 large mutual fund families were implicated in illegal
trading practices that included market timing and late trading. Using a triple-differences-in-
differences framework, I allow the effect of the shock to vary across mutual funds along the
type dimension – a measure of their historical impact on firm investment policies. I estimate
the type as an individual fund’s fixed effect from a regression that decomposes investment
policies of firms into time varying and fixed firm, year, and shareholder components. This
variable allows for classification of mutual fund families according to their historical relation
to firms’ investment policies.
24For each regression, the placebo is drawn from a normal distribution using sample moments of theestimated type.
25None of the placebo t-statistics was as high as the estimated in Table III.
19
The results are consistent with the theories on shareholder influence. I find that firms held
by mutual funds experience a change in the level of their capital expenditures. I document
that for firms held by funds of higher types, that is, funds whose portfolio companies tend
to have higher investment levels, the scandal resulted in a decrease in investments. The
same shock to shareholders of lower types resulted in an increase in investments level of
their portfolio companies. Moreover, the results are much stronger for firms with higher
sensitivity of CEO compensation to stock prices, firms with liquid shares, and firms that
constitute important holdings in mutual funds’ portfolios.
The contribution of the paper is twofold. First, it provides causal evidence on the impact
of mutual funds, and, more generally of institutional shareholders, on real investments. The
results are consistent with the view that institutional investors have a real impact on the
companies they hold. In addition, as part of the identification strategy, I show that the effect
of the same shock has different implications for firms held by different shareholders. This
finding highlights the importance of taking into account individual shareholder heterogeneity
when assessing shareholders’ influence on the companies they hold.
Second, the paper provides micro-level evidence of a link between the real and the finan-
cial sides of firms. I provide a direct test of the hypothesis that exogenous shocks to the
liability side of institutional investors alter the effect of these investors on the real activities
of their portfolio companies. In particular, I show that the exposure of mutual funds to
shocks unrelated to the fundamental characteristics of their portfolio companies affect the
funds’ ability to participate in the process of managing these firms. This link is especially
important given the significance of these shareholders in the ownership of the U.S. firms.
20

References
Abowd, John M., Robert H. Creecy, and Francis Kramarz, 2002, Computing person and
firm effects using linked longitudinal employer-employee data., Discussion paper.
Abowd, John M., Francis Kramarz, and David N. Margolis, 1999, High wage workers and
high wage firms, Econometrica 67, 251–333.
Acemoglu, Daron, Victor Chernozhukov, and Muhamet Yildiz, 2006, Learning and disagree-
ment in an uncertain world, NBER Working Papers 12648 National Bureau of Economic
Research, Inc.
Admati, Anat R., and Paul Pfleiderer, 2009, The “wall street walk” and shareholder activism:
Exit as a form of voice, Review of Financial Studies.
, and Josef Zechner, 1994, Large shareholder activism, risk sharing, and financial
market equilibrium, Journal of Political Economy 102, 1097–1130.
Alex Edmans, Xavier Gabaix, and Augustin Landier, 2008, A multiplicative model of optimal
ceo incentives in market equilibrium, Review of Financial Studies 22, 4881–4917.
Amihud, Yakov, 2002, Illiquidity and stock returns: Cross-section and time-series feffects,
Journal of Financial Markets 5, 31–56.
Bertrand, Marianne, and Antoinette Schoar, 2003, Managing with style: The effect of man-
agers on firm policies, Quarterly Journal of Economics 118, 1169–1208.
Boot, Arnoud W. A., Radhakrishnan Gopalan, and Anjan V. Thakor, 2008, Market liquidity,
investor participation, and managerial autonomy: Why do firms go private?, Journal of
Finance 63, 2013–2059.
Burkart, Mike, Denis Gromb, and Fausto Panunzi, 1997, Large shareholders, monitoring,
and the value of the firm, The Quarterly Journal of Economics 112, 693–728.
Bushee, Brian J., 1998, The influence of institutional investors on myopic r&d investment
behavior, The Accounting Review 73, 305–333.
21

Chen, Xia, Jarrad Harford, and Kai Li, 2007, Monitoring: Which institutions matter?,
Journal of Financial Economics 86, 279–305.
Core, John, and Wayne Guay, 2002, Estimating the value of employee stock option portfolios
and their sensitivities to price and volatility, Journal of Accounting Research 40, 613–630.
Cripps, Martin W., Jeffrey C. Ely, George J. Mailath, and Larry Samuelson, 2008, Common
learning, Econometrica 76, 909–933.
Cronqvist, Henrik, and Rudiger Fahlenbrach, 2008, Large shareholders and corporate poli-
cies, Review of Financial Studies 12.
Edmans, Alex, 2009, Blockholder trading, market efficiency, and managerial myopia, The
Journal of Finance p. Forthcoming.
, and Gustavo Manso, 2009, Governance Through Exit and Voice: A Theory of
Multiple Blockholders, SSRN eLibrary.
Garmaise, Mark, 2001, Rational Beliefs and Security Design, Rev. Financ. Stud. 14, 1183–
1213.
Hansen, Gary S., and Charles W. L. Hill, 1991, Are institutional investors myopic? a time-
series study of four technology- driven industries, Strategic Management Journal 12, 1–16.
Hirshleifer, David, and Yoon Suh, 1992, Risk, managerial effort, and project choice, Journal
of Financial Intermediation 2, 308–345.
Holmstrom, Bengt, and Laurence Weiss, 1985, Managerial incentives, investment and aggre-
gate implications: Scale effects, The Review of Economic Studies 52, 403–425.
Kahan, Marcel, and Edward B. Rock, 2006, Hedge funds in corporate governance and cor-
porate control, Law Working Paper N. 76/2006.
Kahn, Charles, and Andrew Winton, 1998, Ownership structure, speculation, and share-
holder intervention, Journal of Finance 53, 99–129.
Kurz, Mordecai, 1994a, On rational belief equilibria, Economic Theory 4, 859–76.
22

, 1994b, On the structure and diversity of rational beliefs, Economic Theory 4, 877–
900.
Lambert, Richard A., 1986, Executive effort and selection of risky projects, The RAND
Journal of Economics 17, 77–88.
Marcin Kacperczyk, Clemens Sialm, and Lu Zheng, 2008, Unobserved actions of mutual
funds, Review of Financial Studies 21, 2379–2416.
Matvos, Gregor, and Michael Ostrovsky, 2008, Heterogeneity and peer effects in mutual fund
proxy voting, Journal of Financial Economics 89, 391–403.
Maug, Ernst, 1998, Large shareholders as monitors: Is there a trade-off between liquidity
and control?, Journal of Finance 53, 65–98.
Narayanan, M P, 1985, Managerial incentives for short-term results, Journal of Finance 40,
1469–84.
Parrino, Robert, Richard W. Sias, and Laura T. Starks, 2003, Voting with their feet: insti-
tutional ownership changes around forced ceo turnover, Journal of Financial Economics
68, 3–46.
Scharfstein, David S., and Jeremy C. Stein, 1990, Herd behavior and investment, American
Economic Review 80, 465–479.
Shleifer, Andrei, and Robert Vishny, 1986, Large shareholders and corporate control, Journal
of Political Economy 94, 461–488.
Stein, Jeremy, 1989, Overreactions in the options market, Journal of Finance 44, 1011–1022.
Stein, Jeremy C, 1988, Takeover threats and managerial myopia, Journal of Political Econ-
omy 96, 61–80.
Wahal, Sunil, and John J. McConnell, 2000, Do institutional investors exacerbate managerial
myopia?, Journal of Corporate Finance 6, 307–329.
23

Appendix A: Variable Definitions
• Investment equals capital expenditures over lagged net property, plant, and equipment.
• ROA equals the ratio of EBITDA over lagged total assets.
• Operating return on assets is the ratio of operating cash flow over lagged total assets.
• Tobin’s Q equals the ratio of the market value of assets (book value of assets plus the
market value of common equity less the sum of the book value of common equity and
deferred taxes) over the book value of assets.
• Total assets is the log of book assets.
• Amihud (2002) illiquidity measure is defined as the yearly average of 1000000∗ |Return|(DollarTradingV olume)
over all days with non-zero volume, using daily data.
• Mutual fund-level flow: Flowjt = [TNAjt − TNAjt−1 ∗ (1 + Rjt)]/TNAjt−1, where
TNAjt denotes total net assets, and Rjt is the return of the mutual fund j in month t.
24
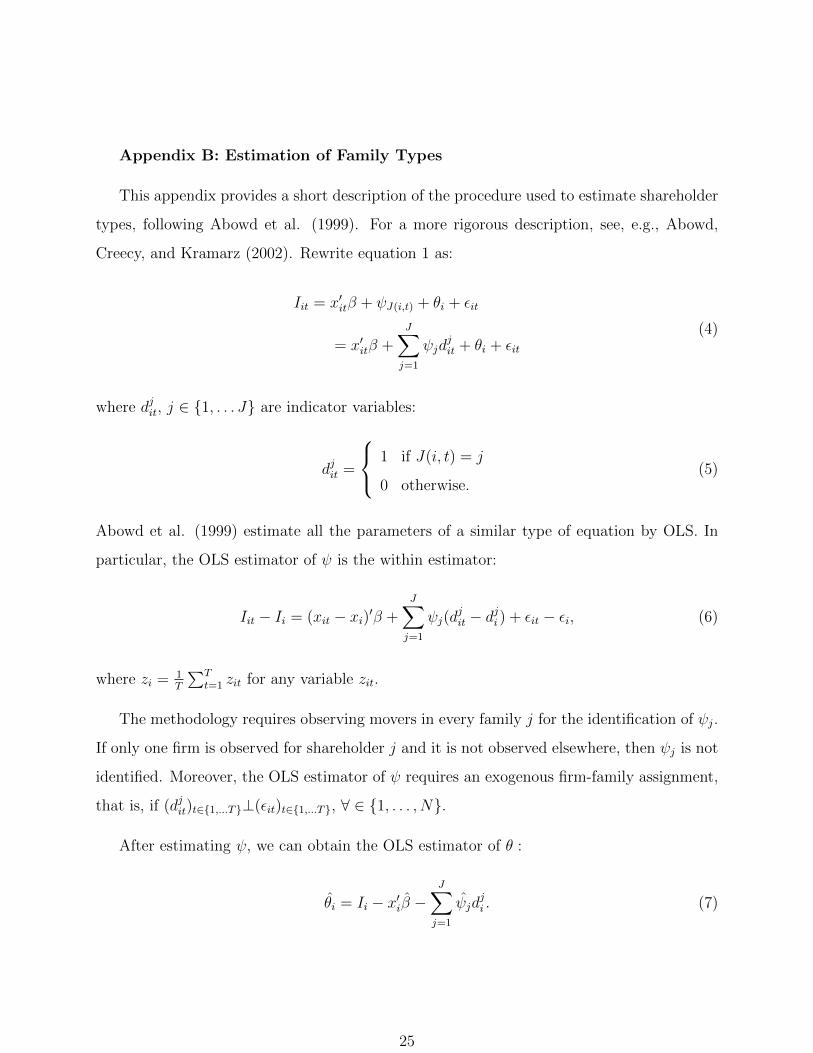
Appendix B: Estimation of Family Types
This appendix provides a short description of the procedure used to estimate shareholder
types, following Abowd et al. (1999). For a more rigorous description, see, e.g., Abowd,
Creecy, and Kramarz (2002). Rewrite equation 1 as:
Iit = x′itβ + ψJ(i,t) + θi + εit
= x′itβ +J∑j=1
ψjdjit + θi + εit
(4)
where djit, j ∈ {1, . . . J} are indicator variables:
djit =
1 if J(i, t) = j
0 otherwise.(5)
Abowd et al. (1999) estimate all the parameters of a similar type of equation by OLS. In
particular, the OLS estimator of ψ is the within estimator:
Iit − Ii = (xit − xi)′β +J∑j=1
ψj(djit − d
ji ) + εit − εi, (6)
where zi = 1T
∑Tt=1 zit for any variable zit.
The methodology requires observing movers in every family j for the identification of ψj.
If only one firm is observed for shareholder j and it is not observed elsewhere, then ψj is not
identified. Moreover, the OLS estimator of ψ requires an exogenous firm-family assignment,
that is, if (djit)t∈{1,...T}⊥(εit)t∈{1,...T}, ∀ ∈ {1, . . . , N}.
After estimating ψ, we can obtain the OLS estimator of θ :
θ̂i = Ii − x′iβ̂ −J∑j=1
ψ̂jdji . (7)
25

Figure I:Monthly Flows for Funds from Implicated and Non-Implicated Families.The upper plot shows monthly capital flows separately for funds from families implicated the 2003 mutualfund trading scandal, and funds from non-implicated families. Flows for fund j are defined as Flowjt =[TNAjt−TNAjt−1 ∗(1+Rjt)]/TNAjt−1, where TNAjt is total net assets of fund j in period t. The verticalline is placed at September 2003, the beginning of the scandal.
The lower plot shows cumulative monthly capital flows separately for funds from implicated and non-
implicated families, starting September 2003.
26

Figure II:Average CapEx Ratio by Mutual Fund Type Before and After the Scandal.
Average CapEx ratio (capital expenditures over lagged PP&E) before and after the 2003 scandal byquintile of mutual fund type. The upper (lower) graph is for funds from implicated (non-implicated)
families. Mutual fund is a fixed effect (ψ̂j) estimated out of sample by running a three-way fixed effectsregression Iit = βXit + θi + ψj + εit.
27

Figure III:Robustness: Distribution of T-Statistics from a Placebo Regression
(a) Each plot is a distribution of t-statistics from a regression Iit = β1Xit +θi +β2Post∗Scandal+β3Post∗Scandal ∗ PlaceboTypej + β4Post ∗ Scandal + β5Post + β6PlaceboTypej + β7Post ∗ PlaceboTypej +β8Scandal ∗ PlaceboTypej + εit, where Iit is one of the dependent variables (CapEx over lagged PP&Eor Number of Acquisitions) of firm i at time t, Xit is a set of time-varying firm-level characteristics andyear fixed effects, θi is the firm fixed effect, and εit is the residual. Xit consists of time effects, laggedlogarithm of total assets, cashflow, and lagged Tobin’s Q. Details on the definition of variables are inAppendix A. Standard errors are clustered at the firm level. Observations are weighted by the inverseof the standard error of the estimated mutual fund type, obtained in the first step regressions.
(b) PlaceboType is drawn from a normal distribution with a sample moments of a Type estimated in aregression Iit = βXit + θi + ψj + εit, where ψj is a mutual fund’s fixed effect, used as a measure of afund’s type.
28

Table IDescriptive Statistics
Descriptive statistics for 2003 for implicated and non-implicated families separately. Sample is quarterly mutual fund-firmmatched panel. Number of funds is the overall number of funds in implicated and non-implicated families. CapEx is capitalexpenditures over lagged net PP&E. Detailed descriptions of variables are in Appendix A.
Implicated Families Non-Implicated Families
Mean Std. Dev. Mean Std. Dev.
Fund CharacteristicsNumber of Funds 821 2632Fund Size (millions) 288 795 283 872Number of Portfolio Firms 3305 4696Number of port. Firms per Fund 121 126 140 242Mean CapEx Type 0.0012 0.004 0.001 0.0041Mean Acquisition Type -0.036 0.039 -0.038 0.043
Firm CharacteristicsCapEx 0.067 0.060 0.065 0.061N. of Acquisitions 0.337 0.672 0.298 0.634Market Cap 15503 37409 14712 37728
29

Table IIMutual Fund Types – Fixed Effects Estimation
(a) The dependent variables are CapEx (capital expenditures over lagged net PP&E) in columns and Acquisitions (number ofacquisitions). Sample is quarterly mutual fund-firm matched panel. The date range is 2000 - 2007. Details on the definitionof variables are in Appendix A. Standard errors are clustered at the firm level.
(b) In Panel A, each raw reports the result from fixed effects panel regressions Iit = βXit +θi +ψj + εit, where Iit is one of thedependent variables of firm i at time t, Xit is a set of time-varying firm-level characteristics and year fixed effects, θi is thefirm fixed effect, ψj is a mutual fund fixed effect, and εit is the residual. Xit consists of time effects, lagged logarithm oftotal assets, cashflow, and lagged Tobin’s Q. The F-statistic is for joint significance of mutual fund fixed effects. P-valuesand the number of constraints are reported in parentheses.
(c) Panel B reports the average fixed effect by the style of the mutual fund (Growth, Value, Core, and Other).
(d) Panel C reports the result of the regression of estimated mutual fund fixed effects on the fund’s style and size. Theregression is weighted by the inverse of the standard error of the estimated fixed effect.
Panel A: F-tests on Mutual Fund Fixed Effects
F-Stat, fund FE N Adj. R2
Full Sample
CapEx 11.06 (<.0001, 4764) 14609275 0.534Acquisitions 4.51 (<.0001, 4764) 12936085 0.350
Before 2000
CapEx 5.99 (<.0001, 3234) 3431571 0.525Acquisitions 4.93 (<.0001, 3234) 3538703 0.349
Panel B: Fixed Effects and Fund Characteristics
Ave. CapEx Fixed Effect Ave. Acquisitions Fixed EffectGrowth Funds 0.00215 -0.02529Value Funds 0.00003 -0.05555Core Funds -0.00015 -0.03688Other Funds 0.00059 -0.03802
Panel C: Fixed Effects and Fund Characteristics (Regression)
(1) (2)CapEx Fixed Effect Acquisitions Fixed Effect
Growth Fund 0.002*** 0.012***(0.000) (0.002)
Value Fund -0.000 -0.018***(0.000) (0.002)
Core Fund -0.001*** 0.000(0.000) (0.002)
Log(Fund Size) -0.000 0.000(0.000) (0.000)
Constant 0.001*** -0.038***(0.000) (0.002)
Observations 2,720 2,720R-squared 0.053 0.047Std. err. in parentheses*** p<0.01, ** p<0.05, * p<0.1
30

Table IIIThe Effect of the Trading Scandal on Corporate Investments
(a) The dependent variables are CapEx (capital expenditures over lagged net PP&E) in columns (1)and (2), Acquisitions(number of acquisitions) in columns (3) and (4). Sample is quarterly mutual fund-firm matched panel. The date rangeis 2000 - 2007. Details on the definition of variables are in Appendix A. Standard errors are clustered at the firm level.Observations are weighted by the inverse of the standard error of the estimated mutual fund type, obtained in the firststep regressions.
(b) Columns (1) and (3) examine the effect of the mutual fund trading scandal on capex and acquisitions. The regression is:Iit = β1Xit + θi + β2Post ∗ Scandal + β3Scandal + β4Post+ εit, where Iit is one of the dependent variables of firm i attime t, Xit is a set of time-varying firm-level characteristics and year fixed effects, θi is the firm fixed effect, scandal is adummy variable that equals 1 if a family was implicated in the 2003 trading scandal, post is a dummy variable that gets avalue of 1 for the quarters including and after the scandal, and εit is the residual.
(c) Columns (2) and (4) examine the effect of the scandal for firms held by different types of mutual funds. The regressionis: Iit = β1Xit + θi + β2Post ∗ Scandal + β3Post ∗ Scandal ∗ Typej + β4Post ∗ Scandal + β5Post+ β6Typej + β7Post ∗Typej +β8Scandal ∗Typej + εit, where Iit is one of the dependent variables of firm i at time t, Xit is a set of time-varyingfirm-level characteristics and year fixed effects, θi is the firm fixed effect, scandal is a dummy variable that equals 1 if afamily was implicated in the 2003/4 trading scandal, post is a dummy variable that gets a value of 1 for the years including
and after 2003, and εit is the residual. Typej is a mutual fund family type – fixed effect (ψ̂j) estimated out of sample(before the year 2000) by running a three-way fixed effects regression Iit = βXit + θi + ψj + εit.
(1) (2) (3) (4)
CapEx CapEx Acquis. Acquis.
Scandal*Post*Type -0.412*** -0.584***(0.084) (0.103)
Post*Scandal -0.001*** 0.000 0.010** -0.012*(0.000) (0.000) (0.005) (0.006)
Scandal 0.001*** 0.000 -0.007* 0.019***(0.000) (0.000) (0.004) (0.005)
Post 0.004** 0.004** 0.024 0.028(0.002) (0.002) (0.026) (0.038)
Type 1.059*** 0.115***(0.064) (0.042)
Post*Type -0.694*** 0.232(0.070) (0.353)
Scandal*Type -0.023 0.595***(0.061) (0.097)
Cashflow 0.009*** 0.009*** 0.023* 0.013(0.002) (0.001) (0.012) (0.019)
Lagged Log of Total Assets 0.012*** 0.010*** 0.079** 0.163***(0.002) (0.002) (0.037) (0.039)
Lagged Tobin’s Q 0.024*** 0.024*** 0.079*** 0.110***(0.001) (0.001) (0.030) (0.035)
Observations 9,286,868 9,286,868 9,286,868 9,286,868R-squared 0.526 0.528 0.315 0.338Robust std. err. in parentheses*** p<0.01, ** p<0.05, * p<0.1
31

Tab
leIV
:T
he
Eff
ect
ofth
eT
radin
gSca
ndal
onC
orp
orat
eIn
vest
men
tby
the
Sen
siti
vit
yof
CE
OW
ealt
hto
Pri
ces
(a)
Th
ed
epen
den
tvari
ab
les
are
Cap
Ex
(cap
ital
exp
end
itu
res
over
lagged
net
PP
&E
)in
colu
mn
s(1
)-(4
),A
cqu
isit
ion
s(n
um
ber
of
acq
uis
itio
ns)
inco
lum
ns
(5)-
(8).
Sam
ple
isqu
art
erly
mu
tual
fun
d-fi
rmm
atc
hed
pan
el.
Th
ed
ate
ran
ge
is2000
-2007.
Det
ails
on
the
defi
nit
ion
of
vari
ab
les
are
availab
lein
Ap
pen
dix
A.
Sta
nd
ard
erro
rsare
clu
ster
edat
the
firm
level
.O
bse
rvati
on
sare
wei
ghte
dby
the
inver
seof
the
stan
dard
erro
rof
the
esti
mate
dm
utu
al
fun
dty
pe,
ob
tain
edin
the
firs
tst
epre
gre
ssio
ns.
(b)
WP
Sis
the
dollar
chan
ge
inC
EO
wea
lth
for
a100
poin
tch
an
ge
infi
rmvalu
e.L
ow
(hig
h)
WP
Sfi
rms
are
firm
sw
ith
low
erth
an
med
ian
WP
S.
(c)
Colu
mn
s(1
)an
d(2
)ex
am
ine
the
effec
tof
the
scan
dal
on
cap
exfo
rlo
wW
PS
firm
s.I i
t=β1X
it+θ i
+β2Post∗Scandal+
β3Scandal+
β4Post
+ε i
t,
wh
ereI i
tis
on
eof
the
dep
end
ent
vari
ab
les
of
firm
iat
tim
et,X
itis
ase
tof
tim
e-vary
ing
firm
-lev
elch
ara
cter
isti
csan
dyea
rfi
xed
effec
ts,θ i
isth
efi
rmfixed
effec
t,scandal
isa
du
mm
yvari
ab
leth
at
equ
als
1if
afa
mily
was
imp
lica
ted
inth
e2003
trad
ing
scan
dal,post
isa
du
mm
yvari
ab
leth
at
get
sa
valu
eof
1fo
rth
equ
art
ers
incl
ud
ing
an
daft
erth
esc
an
dal,
and
ε it
isth
ere
sid
ual.
Colu
mn
s(5
)an
d(6
)re
pea
tth
isan
aly
sis
for
the
nu
mb
erof
acq
uis
itio
ns.
(d)
Colu
mn
s(3
)an
d(4
)ex
am
ine
the
effec
tof
the
scan
dal
for
low
afi
rms
hel
dby
diff
eren
tty
pes
of
mu
tual
fun
ds.
Th
ere
gre
ssio
nis
:I i
t=β1X
it+θ i
+β2Post∗Scandal+
β3Post∗Scandal∗Type j
+β4Post∗Scandal+β5Post
+β6Type j
+β7Post∗Type j
+β8Scandal∗Type j
+ε i
t,
wh
ereI i
tis
on
eof
the
dep
end
ent
vari
ab
les
of
firm
iat
tim
et,X
itis
ase
tof
tim
e-vary
ing
firm
-lev
elch
ara
cter
isti
csan
dyea
rfi
xed
effec
ts,θ i
isth
efi
rmfi
xed
effec
t,scandal
isa
du
mm
yvari
ab
leth
at
equ
als
1if
afa
mily
was
imp
lica
ted
inth
e2003/4
trad
ing
scan
dal,post
isa
du
mm
yvari
ab
leth
at
get
sa
valu
eof
1fo
rth
eyea
rsin
clu
din
gand
aft
er2003,
an
dε i
tis
the
resi
du
al.Type j
isa
mu
tual
fun
dfa
mily
typ
e–
fixed
effec
t( ψ̂
j)
esti
mate
dou
tof
sam
ple
(bef
ore
the
yea
r2000)
by
run
nin
ga
thre
e-w
ay
fixed
effec
tsre
gre
ssio
nI i
t=βX
it+θ i
+ψj
+ε i
t.
Colu
mn
s(7
)an
d(8
)re
pea
tth
isan
aly
sis
for
the
nu
mb
erof
acq
uis
itio
ns.
(1)
(2)
(3)
(4)
(5)
(6)
(7)
(8)
Cap
Ex
Cap
Ex
Cap
Ex
Cap
Ex
Acq
uis
.A
cqu
is.
Acq
uis
.A
cqu
is.
Low
WP
SH
igh
WP
SL
ow
WP
SH
igh
WP
SL
ow
WP
SH
igh
WP
SL
ow
WP
SH
igh
WP
S
Sca
nd
al*
Post
*T
yp
e-0
.105
-0.4
15***
-0.0
17
-0.4
49**
(0.0
87)
(0.0
92)
(0.1
16)
(0.1
84)
Post
*S
can
dal
0.0
00
-0.0
01**
0.0
00
-0.0
01
0.0
09
0.0
16***
0.0
11*
-0.0
16
(0.0
00)
(0.0
00)
(0.0
00)
(0.0
01)
(0.0
07)
(0.0
05)
(0.0
06)
(0.0
10)
Sca
nd
al
0.0
00
0.0
01*
-0.0
00
0.0
00
-0.0
04
-0.0
04
-0.0
06
0.0
21**
(0.0
00)
(0.0
00)
(0.0
00)
(0.0
00)
(0.0
04)
(0.0
03)
(0.0
05)
(0.0
08)
Post
0.0
08***
0.0
00
0.0
08***
0.0
00
-0.0
36
0.0
83*
0.1
06**
0.1
22**
(0.0
02)
(0.0
03)
(0.0
02)
(0.0
03)
(0.0
48)
(0.0
48)
(0.0
53)
(0.0
57)
Typ
e0.5
51***
0.4
92***
0.1
22
0.7
90***
(0.0
87)
(0.0
88)
(0.1
28)
(0.2
36)
Post
*T
yp
e-0
.320***
-0.3
04***
0.4
91**
0.3
94***
(0.1
02)
(0.0
95)
(0.2
18)
(0.1
51)
Sca
nd
al*
Typ
e-0
.104
-0.0
73
-0.0
41
0.0
21
(0.0
81)
(0.0
68)
(0.0
83)
(0.0
20)
Cash
flow
0.0
11***
0.0
17***
0.0
11***
0.0
17***
0.0
21
0.0
16
0.0
15
0.0
08
(0.0
03)
(0.0
04)
(0.0
03)
(0.0
04)
(0.0
41)
(0.0
38)
(0.0
38)
(0.0
35)
Lagged
Log
of
Tota
lA
sset
s0.0
10***
0.0
08*
0.0
10***
0.0
08*
0.2
59***
0.1
07*
0.1
04*
0.1
53***
(0.0
02)
(0.0
04)
(0.0
02)
(0.0
04)
(0.0
94)
(0.0
56)
(0.0
56)
(0.0
40)
Lagged
Tob
in’s
Q0.0
18***
0.0
24***
0.0
18***
0.0
24***
0.1
72**
0.0
80***
0.0
78***
0.0
88***
(0.0
02)
(0.0
03)
(0.0
02)
(0.0
03)
(0.0
83)
(0.0
27)
(0.0
27)
(0.0
27)
Ob
serv
ati
on
s3,5
11,9
17
3,5
60,2
02
3,5
11,9
17
3,5
60,2
02
3,5
11,9
17
3,5
60,2
02
3,5
11,9
17
3,5
60,2
02
R-s
qu
are
d0.5
09
0.5
42
0.5
09
0.5
43
0.3
63
0.3
26
0.3
63
0.3
26
Rob
ust
std
.er
r.in
pare
nth
eses
***
p<
0.0
1,
**
p<
0.0
5,
*p<
0.1
32

Tab
leV
:T
he
Eff
ect
ofth
eT
radin
gSca
ndal
onC
orp
orat
eIn
vest
men
tby
the
Liq
uid
ity
ofth
eF
irm
Sto
ck
(a)
Th
ed
epen
den
tvari
ab
les
are
Cap
Ex
(cap
ital
exp
end
itu
res
over
lagged
net
PP
&E
)in
colu
mn
s(1
)-(4
),A
cqu
isit
ion
s(n
um
ber
of
acq
uis
itio
ns)
inco
lum
ns
(5)-
(8).
Sam
ple
isqu
art
erly
mu
tual
fun
d-fi
rmm
atc
hed
pan
el.
Th
ed
ate
ran
ge
is2000
-2007.
Det
ails
on
the
defi
nit
ion
of
vari
ab
les
are
availab
lein
Ap
pen
dix
A.
Sta
nd
ard
erro
rsare
clu
ster
edat
the
firm
level
.O
bse
rvati
on
sare
wei
ghte
dby
the
inver
seof
the
stan
dard
erro
rof
the
esti
mate
dm
utu
al
fun
dty
pe,
ob
tain
edin
the
firs
tst
epre
gre
ssio
ns.
(b)
WP
Sis
the
dollar
chan
ge
inC
EO
wea
lth
for
a100
poin
tch
an
ge
infi
rmvalu
e.L
ow
(hig
h)
WP
Sfi
rms
are
firm
sw
ith
low
erth
an
med
ian
WP
S.
(c)
Colu
mn
s(1
)an
d(2
)ex
am
ine
the
effec
tof
the
scan
dal
on
cap
exfo
rlo
wW
PS
firm
s.I i
t=β1X
it+θ i
+β2Post∗Scandal+
β3Scandal+
β4Post
+ε i
t,
wh
ereI i
tis
on
eof
the
dep
end
ent
vari
ab
les
of
firm
iat
tim
et,X
itis
ase
tof
tim
e-vary
ing
firm
-lev
elch
ara
cter
isti
csan
dyea
rfi
xed
effec
ts,θ i
isth
efi
rmfixed
effec
t,scandal
isa
du
mm
yvari
ab
leth
at
equ
als
1if
afa
mily
was
imp
lica
ted
inth
e2003
trad
ing
scan
dal,post
isa
du
mm
yvari
ab
leth
at
get
sa
valu
eof
1fo
rth
equ
art
ers
incl
ud
ing
an
daft
erth
esc
an
dal,
and
ε it
isth
ere
sid
ual.
Colu
mn
s(5
)an
d(6
)re
pea
tth
isan
aly
sis
for
the
nu
mb
erof
acq
uis
itio
ns.
(d)
Colu
mn
s(3
)an
d(4
)ex
am
ine
the
effec
tof
the
scan
dal
for
low
afi
rms
hel
dby
diff
eren
tty
pes
of
mu
tual
fun
ds.
Th
ere
gre
ssio
nis
:I i
t=β1X
it+θ i
+β2Post∗Scandal+
β3Post∗Scandal∗Type j
+β4Post∗Scandal+β5Post
+β6Type j
+β7Post∗Type j
+β8Scandal∗Type j
+ε i
t,
wh
ereI i
tis
on
eof
the
dep
end
ent
vari
ab
les
of
firm
iat
tim
et,X
itis
ase
tof
tim
e-vary
ing
firm
-lev
elch
ara
cter
isti
csan
dyea
rfi
xed
effec
ts,θ i
isth
efi
rmfi
xed
effec
t,scandal
isa
du
mm
yvari
ab
leth
at
equ
als
1if
afa
mily
was
imp
lica
ted
inth
e2003/4
trad
ing
scan
dal,post
isa
du
mm
yvari
ab
leth
at
get
sa
valu
eof
1fo
rth
eyea
rsin
clu
din
gand
aft
er2003,
an
dε i
tis
the
resi
du
al.Type j
isa
mu
tual
fun
dfa
mily
typ
e–
fixed
effec
t( ψ̂
j)
esti
mate
dou
tof
sam
ple
(bef
ore
the
yea
r2000)
by
run
nin
ga
thre
e-w
ay
fixed
effec
tsre
gre
ssio
nI i
t=βX
it+θ i
+ψj
+ε i
t.
Colu
mn
s(7
)an
d(8
)re
pea
tth
isan
aly
sis
for
the
nu
mb
erof
acq
uis
itio
ns.
(1)
(2)
(3)
(4)
(5)
(6)
(7)
(8)
Cap
Ex
Cap
Ex
Cap
Ex
Cap
Ex
Acq
uis
.A
cqu
is.
Acq
uis
.A
cqu
is.
Liq
uid
Illiqu
idL
iqu
idIl
liqu
idL
iqu
idIl
liqu
idL
iqu
idIl
liqu
id
Sca
nd
al*
Post
*T
yp
e-0
.452***
-0.1
67
-0.4
46***
-0.1
60
(0.1
18)
(0.1
15)
(0.1
63)
(0.1
40)
Post
*S
can
dal
-0.0
01***
-0.0
01*
-0.0
01**
-0.0
01**
0.0
09*
0.0
04
-0.0
22**
0.0
01
(0.0
00)
(0.0
00)
(0.0
00)
(0.0
00)
(0.0
05)
(0.0
03)
(0.0
09)
(0.0
00)
Sca
nd
al
0.0
00*
0.0
01***
0.0
00
0.0
00
-0.0
03
0.0
03*
0.0
28***
-0.0
00
(0.0
00)
(0.0
00)
(0.0
00)
(0.0
00)
(0.0
03)
(0.0
02)
(0.0
07)
(0.0
00)
Post
0.0
03
0.0
01
0.0
05*
0.0
03
0.0
14
0.0
16
0.0
21
0.0
01
(0.0
03)
(0.0
02)
(0.0
03)
(0.0
03)
(0.0
56)
(0.0
18)
(0.0
19)
(0.0
02)
Typ
e0.7
62***
0.4
98***
0.1
06***
0.7
98***
(0.0
72)
(0.0
84)
(0.0
14)
(0.0
54)
Post
*T
yp
e-0
.460***
-0.3
20**
0.1
28
-0.7
98***
(0.1
18)
(0.1
26)
(0.0
81)
(0.0
93)
Sca
nd
al*
Typ
e0.0
38
-0.1
20**
0.5
42***
-0.0
22
(0.0
50)
(0.0
61)
(0.1
34)
(0.0
83)
Cash
flow
0.0
15**
0.0
03*
0.0
21***
0.0
15**
0.0
48
0.0
02
-0.0
09
0.0
03**
(0.0
06)
(0.0
02)
(0.0
06)
(0.0
06)
(0.0
61)
(0.0
08)
(0.0
07)
(0.0
02)
Lagged
Log
of
Tota
lA
sset
s0.0
25***
0.0
22***
-0.0
03
0.0
25***
0.3
75***
0.0
06
0.0
18
0.0
22***
(0.0
07)
(0.0
03)
(0.0
02)
(0.0
07)
(0.1
18)
(0.0
14)
(0.0
15)
(0.0
03)
Lagged
Tob
in’s
Q0.0
26***
0.0
27***
0.0
20***
0.0
26***
0.1
97***
0.0
34***
0.0
51***
0.0
27***
(0.0
04)
(0.0
01)
(0.0
03)
(0.0
04)
(0.0
72)
(0.0
06)
(0.0
05)
(0.0
01)
Ob
serv
ati
on
s2,6
77,1
86
2,7
48,8
75
2,6
77,1
86
2,7
48,8
75
2,6
77,1
86
2,7
48,8
75
2,6
77,1
86
2,7
48,8
75
R-s
qu
are
d0.5
81
0.4
73
0.5
81
0.4
74
0.3
47
0.3
12
0.5
81
0.4
74
Rob
ust
std
.er
r.in
pare
nth
eses
***
p<
0.0
1,
**
p<
0.0
5,
*p<
0.1
33

Tab
leV
I:T
he
Eff
ect
ofth
eT
radin
gSca
ndal
onC
orp
orat
eIn
vest
men
tby
the
Imp
orta
nce
ofth
eH
oldin
gfo
rth
eM
utu
alF
und
(a)
Th
ed
epen
den
tvari
ab
les
are
Cap
Ex
(cap
ital
exp
end
itu
res
over
lagged
net
PP
&E
)in
colu
mn
s(1
)-(4
),A
cqu
isit
ion
s(n
um
ber
of
acq
uis
itio
ns)
inco
lum
ns
(5)-
(8).
Sam
ple
isqu
art
erly
mu
tual
fun
d-fi
rmm
atc
hed
pan
el.
Th
ed
ate
ran
ge
is2000
-2007.
Det
ails
on
the
defi
nit
ion
of
vari
ab
les
are
availab
lein
Ap
pen
dix
A.
Sta
nd
ard
erro
rsare
clu
ster
edat
the
firm
level
.O
bse
rvati
on
sare
wei
ghte
dby
the
inver
seof
the
stan
dard
erro
rof
the
esti
mate
dm
utu
al
fun
dty
pe,
ob
tain
edin
the
firs
tst
epre
gre
ssio
ns.
(b)
WP
Sis
the
dollar
chan
ge
inC
EO
wea
lth
for
a100
poin
tch
an
ge
infi
rmvalu
e.L
ow
(hig
h)
WP
Sfi
rms
are
firm
sw
ith
low
erth
an
med
ian
WP
S.
(c)
Colu
mn
s(1
)an
d(2
)ex
am
ine
the
effec
tof
the
scan
dal
on
cap
exfo
rlo
wW
PS
firm
s.I i
t=β1X
it+θ i
+β2Post∗Scandal+
β3Scandal+
β4Post
+ε i
t,
wh
ereI i
tis
on
eof
the
dep
end
ent
vari
ab
les
of
firm
iat
tim
et,X
itis
ase
tof
tim
e-vary
ing
firm
-lev
elch
ara
cter
isti
csan
dyea
rfi
xed
effec
ts,θ i
isth
efi
rmfixed
effec
t,scandal
isa
du
mm
yvari
ab
leth
at
equ
als
1if
afa
mily
was
imp
lica
ted
inth
e2003
trad
ing
scan
dal,post
isa
du
mm
yvari
ab
leth
at
get
sa
valu
eof
1fo
rth
equ
art
ers
incl
ud
ing
an
daft
erth
esc
an
dal,
and
ε it
isth
ere
sid
ual.
Colu
mn
s(5
)an
d(6
)re
pea
tth
isan
aly
sis
for
the
nu
mb
erof
acq
uis
itio
ns.
(d)
Colu
mn
s(3
)an
d(4
)ex
am
ine
the
effec
tof
the
scan
dal
for
low
afi
rms
hel
dby
diff
eren
tty
pes
of
mu
tual
fun
ds.
Th
ere
gre
ssio
nis
:I i
t=β1X
it+θ i
+β2Post∗Scandal+
β3Post∗Scandal∗Type j
+β4Post∗Scandal+β5Post
+β6Type j
+β7Post∗Type j
+β8Scandal∗Type j
+ε i
t,
wh
ereI i
tis
on
eof
the
dep
end
ent
vari
ab
les
of
firm
iat
tim
et,X
itis
ase
tof
tim
e-vary
ing
firm
-lev
elch
ara
cter
isti
csan
dyea
rfi
xed
effec
ts,θ i
isth
efi
rmfi
xed
effec
t,scandal
isa
du
mm
yvari
ab
leth
at
equ
als
1if
afa
mily
was
imp
lica
ted
inth
e2003/4
trad
ing
scan
dal,post
isa
du
mm
yvari
ab
leth
at
get
sa
valu
eof
1fo
rth
eyea
rsin
clu
din
gand
aft
er2003,
an
dε i
tis
the
resi
du
al.Type j
isa
mu
tual
fun
dfa
mily
typ
e–
fixed
effec
t( ψ̂
j)
esti
mate
dou
tof
sam
ple
(bef
ore
the
yea
r2000)
by
run
nin
ga
thre
e-w
ay
fixed
effec
tsre
gre
ssio
nI i
t=βX
it+θ i
+ψj
+ε i
t.
Colu
mn
s(7
)an
d(8
)re
pea
tth
isan
aly
sis
for
the
nu
mb
erof
acq
uis
itio
ns.
(1)
(2)
(3)
(4)
(5)
(6)
(7)
(8)
Cap
Ex
Cap
Ex
Cap
Ex
Cap
Ex
Acq
uis
.A
cqu
is.
Acq
uis
.A
cqu
is.
Un
imp
ort
ant
Imp
ort
ant
Un
imp
ort
ant
Imp
ort
ant
Un
imp
ort
ant
Imp
ort
ant
Un
imp
ort
ant
Imp
ort
ant
Sca
nd
al*
Post
*T
yp
e-0
.256**
-0.5
43***
-0.2
68*
-0.5
60***
(0.1
17)
(0.0
93)
(0.1
37)
(0.1
41)
Post
*S
can
dal
-0.0
00
-0.0
02***
-0.0
01*
-0.0
01*
0.0
12**
0.0
19**
-0.0
06
-0.0
09
(0.0
00)
(0.0
00)
(0.0
00)
(0.0
00)
(0.0
05)
(0.0
08)
(0.0
08)
(0.0
09)
Sca
nd
al
0.0
00
0.0
01***
0.0
01**
0.0
01***
-0.0
02
-0.0
11*
0.0
13*
0.0
13**
(0.0
00)
(0.0
00)
(0.0
00)
(0.0
00)
(0.0
04)
(0.0
06)
(0.0
07)
(0.0
05)
Post
0.0
03
0.0
04**
0.0
04**
0.0
04***
-0.0
13
0.0
59
0.0
03
0.0
59
(0.0
02)
(0.0
02)
(0.0
02)
(0.0
02)
(0.0
25)
(0.0
43)
(0.0
27)
(0.0
63)
Typ
e1.1
15***
1.2
40***
0.0
18
0.1
21*
(0.0
67)
(0.0
46)
(0.0
17)
(0.0
70)
Post
*T
yp
e-0
.759***
-0.7
87***
0.4
14***
0.1
61
(0.0
80)
(0.0
63)
(0.1
30)
(0.5
89)
Sca
nd
al*
Typ
e-0
.033
0.1
70***
0.3
16***
0.5
74***
(0.0
89)
(0.0
57)
(0.1
21)
(0.1
38)
Cash
flow
0.0
10***
0.0
08***
0.0
08***
0.0
10***
0.0
06
0.0
42**
0.0
01
0.0
38
(0.0
02)
(0.0
02)
(0.0
02)
(0.0
02)
(0.0
15)
(0.0
17)
(0.0
15)
(0.0
34)
Lagged
Log
of
Tota
lA
sset
s0.0
09***
0.0
15***
0.0
13***
0.0
02**
0.0
70***
0.0
94
0.0
80***
0.2
08***
(0.0
03)
(0.0
02)
(0.0
02)
(0.0
01)
(0.0
25)
(0.0
72)
(0.0
22)
(0.0
61)
Lagged
Tob
in’s
Q0.0
21***
0.0
26***
0.0
26***
0.0
25***
0.0
59***
0.0
97*
0.0
61***
0.1
43**
(0.0
02)
(0.0
01)
(0.0
01)
(0.0
01)
(0.0
12)
(0.0
54)
(0.0
11)
(0.0
59)
Ob
serv
ati
on
s4,4
78,8
52
4,8
08,0
16
4,4
78,8
52
4,8
08,0
16
4,4
78,8
52
4,8
08,0
16
4,4
78,8
52
4,8
08,0
16
R-s
qu
are
d0.4
94
0.5
07
0.4
94
0.5
08
0.2
43
0.3
61
0.2
44
0.3
61
Rob
ust
std
.er
r.in
pare
nth
eses
***
p<
0.0
1,
**
p<
0.0
5,
*p<
0.1
34

Table VIIRobustness Test: Selective Selling/Decrease in Holding Size
(a) This table tests whether mutual funds implicated in the scandal selectively sold companies that did not fit their types.Each column is a regression of of a dummy variable that gets the value of 1 if a fund decreased its holding in a firm, on adummy variable that gets the value of 1 for each quintile of the mutual fund type, a dummy that gets a value of 1 if a firmdecreased CapEx (column 1) or Acquisitions (column 2) following the scandal, and the interaction between the two.
(b) The Sample is mutual fund-firm matched cross-section in the second quarter of 2003, just prior to the mutual fund tradingscandal. Standard errors are clustered on the firm level and details on the definitions of variables are available in AppendixA.
(1) (2)
Decreased Holding Size Decreased Holding SizeBefore Scandal Before Scandal(CapEx) (Acquisitions)
Decrease Investments X Type 2nd Quintile 0.002 -0.004(0.022) (0.018)
Decrease Investments X Type 3nd Quintile 0.007 -0.000(0.017) (0.017)
Decrease Investments X Type 4th Quintile 0.005 -0.005(0.019) (0.014)
Decrease Investments X Type 5th Quintile -0.002 -0.008(0.022) (0.013)
Fund Type 2nd Quintile -0.013 -0.056***(0.012) (0.010)
Fund Type 3d Quintile -0.057*** 0.019**(0.011) (0.009)
Fund Type 4th Quintile -0.099*** -0.072***(0.011) (0.008)
Fund Type 5th Quintile -0.128*** -0.068***(0.013) (0.008)
Decrease Investments -0.013 0.000(0.027) (0.012)
Observations 28,816 28,816R-squared 0.022 0.016Robust std. err. in parentheses*** p<0.01, ** p<0.05, * p<0.1
35