
The Political Economy of NGO Service Provision: Evidence ...

Electronic copy available at: http://ssrn.com/abstract=2419611
The Impact of Mergers on Quality Provision: Evidence from the Airline Industry
Jeffrey T. Prince and Daniel H. Simon∗
April 2014
Abstract
We examine how mergers affect quality provision by analyzing five U.S. airline mergers,
focusing on on-time performance (OTP). We find mild evidence that merging carriers’ OTP
worsens in the short run. However, we find consistent evidence that in the long run, their OTP
improves. Subsequent analyses indicate efficiency gains, not reduced load factor or passenger
volume, underlie our long-run result. Additional analyses of quality provision (e.g., flight
cancellations) show no long-run worsening in these areas by merging firms. In the long run,
airline mergers do not result in worsening performance, at least along several measures, and
provide some time-saving efficiencies.
∗Jeffrey Prince is at the Kelley School of Business at Indiana University, and Daniel Simon is at the School of Public and Environmental Affairs at Indiana University. They can be reached at [email protected], and [email protected], respectively.
1
Electronic copy available at: http://ssrn.com/abstract=2419611
1. Introduction
“If US Airways and American Airlines go ahead with their merger as expected,
passengers should probably brace themselves for a host of traveling snafus -- from lost bags to
flight delays and reservation headaches -- that typically accompany such airline deals”
(money.cnn.com, February 13, 2013)
The US airline industry has experienced substantial consolidation over the past 15 years.
Ten of the major carriers in the US market have merged with each other during this period, with
US Airways and American Airlines completing another merger as this paper was written,
reducing the number of major US carriers from five to four. This consolidation has raised
concerns about the effects on air travelers. While academic researchers and regulators have
mainly focused on the price effects of mergers, in the popular press some have suggested that
these airline mergers negatively impact service quality. In this paper, we test whether and how
airline mergers impact service quality, focusing primarily on OTP.
Theoretical explanations for how mergers impact firm behavior and outcomes generally
fall into two categories: efficiencies and market power. The first posits that merging firms create
value by eliminating redundant resources to exploit economies of scale. This added value can
result in lower prices for consumers as well as higher stock market value. The second argues
that mergers do not create value, but rather, merely transfer value from customers to the merging
firms, in the form of higher prices. In this latter case, researchers argue that mergers create
market power, which the merged firm exploits through higher prices, and which ultimately can
lead to higher market value. However, not all mergers create market power. The clearest case in
which a merger can create market power is a horizontal merger of rival firms.
Efficiencies and market power that result from a merger may also impact non-price
behavior, such as quality provision. However, the mechanisms behind these effects are not as
straightforward as they are with price. For example, reductions in fixed assets after a merger
may have a detrimental effect on quality, but transfers of best practices likely will improve it.
With regard to market power, theoretical predictions about its relationship with quality provision
are mixed. Nevertheless, even if we assume that increased market power per se leads to lower
quality, reductions in quantity (following price increases due to market power) may concurrently
lead to higher quality.
2

Numerous empirical studies have examined the effects of mergers and acquisitions on
firm performance, stock price, and prices. The results are largely ambiguous. However, certain
trends are relatively well established. In particular, most empirical studies conclude that acquirer
shareholders gain little if at all, and might even lose, on average (Malmendier, Moretti & Peters,
2012; Agrawal, Jaffe, & Mandelker, 1992: Jensen & Ruback, 1983). In contrast, many empirical
studies demonstrate that target firm shareholders benefit from mergers, with the result that the
combined stock market value of the merging firms is increased (Firth, 1980; Malatesta, 1983).
With regard to price, most researchers find that market power effects dominate efficiency effects,
with prices rising post-merger (Kim & Singal, 1993; Prager & Hannan, 1998; Dafny, 2005).
To our knowledge, this paper is the first to look at quality responses to airline mergers,
and is one of a small number of papers that analyzes quality response to mergers of any kind. Of
the extant literature that looks at quality response to mergers, the focus has primarily been on
hospitals and quality of care (often measured in terms of mortality rate). The findings, as
summarized in Vogt and Town (2006), are quite mixed – some find increased quality while
others find decreased quality or no change. More recently, Fan (2013) uses a structural model to
simulate the price and quality impacts of consolidation in the newspaper market. Although
focused on a different market, our analysis serves as a complement to hers. Her analysis
intricately models the fundamental economic forces at play in a market allowing her to forecast
outcomes of various counterfactuals, while ours uses data from realized counterfactuals (i.e.,
actual mergers) to measure what occurred in those instances.
Understanding how quality provision is related to mergers is important for managers,
because it can significantly impact how they assess acquisition opportunities. This research also
has public policy ramifications. Antitrust regulators generally examine only the price effects of
acquisitions. But, this study suggests that consumer welfare may also be affected through the
impact of mergers on service quality.
The airline industry provides an ideal setting to analyze the effect of mergers on quality
for three main reasons. First, airline OTP provides a good measure of service quality. Second,
because OTP data are collected and reported at the flight level, we can track OTP for both the
acquirer and target firm following the merger, allowing us to separately assess the impact of the
merger on each firm. Third, when airlines merge, there is variation across their route structures
in the opportunities for exploiting market power and efficiencies; on some routes, the merging
3

airlines compete pre-merger, while in other cases, only one of the merging airlines offers service.
Those routes with overlapping service should provide greater opportunities for the merging
carriers to exploit efficiency gains and market power. Exploiting these variations across routes
allows us to better assess market power and efficiency effects.
To explore the effects of mergers on service quality, we analyze OTP for five major
airline mergers that have occurred since 2000: American Airlines’ acquisition of TWA in 2001;
America West’s acquisition of US Airways in 2005; Delta’s acquisition of Northwest in 2008;
United’s acquisition of Continental in 2010; and Southwest’s acquisition of Air Tran in 2011.
To identify these merger effects, we examine OTP before and after the merger. We include three
years of pre-merger data and up to five years post-merger (although in the cases of the most
recent mergers we do not have five years of post-merger data). We allow the effect of the merger
to vary over time, comparing the short- and long-run effects. Moreover, to control for other
factors that occurred contemporaneously with the mergers, and which might have also influenced
OTP, we include merging carriers' rivals in our sample, i.e., airlines that did not undertake
mergers. By comparing the change in OTP for merged airlines versus that of non-merging
airlines, we are better able to identify the impact of the mergers on airline service quality.
We find little evidence to support concerns of worsening performance following a
merger. While we find some mild (statistically insignificant) worsening of OTP in the two years
immediately following a merger, particularly on routes where both airlines operated pre-merger,
in the long-run (3-5 years) OTP improves. In particular, we find that travel time falls by roughly
1.4 minutes for merging airlines 3-5 years after the merger relative to pre-merger times.
At the very least, this finding of long-run improvement implies merging airlines are not
worsening OTP after the merger, at least in the long run. It may be less clear though whether a
1.4-minute improvement is substantial. To put this figure in context, we note that it is very
similar in magnitude to the measured effect of a route moving from being a monopoly to non-
monopoly (Mazzeo, 2003).
Further analysis suggests that this long-run improvement in OTP is driven by efficiency
gains; we find no evidence that market power is driving the observed improvement in merging
carriers’ long-run OTP. If that were the case, then we should observe worsening (or at least less
improved) long-run OTP after controlling for passenger volume, and this is not the case. In
general merging carriers’ long-run, post-merger OTP is better than their pre-merger OTP, even
4

after controlling for changes in output. Hence, the long-run improvement is indicative of
efficiency gains, rather than a side effect of reduced output from increased market power.
Because the vast majority of the routes in our data do not involve overlapping operations
among the merging airlines prior to the merger, the lack of evidence of market power is not
surprising; mergers have no effect on market power on such routes. In contrast, mergers create
significant jumps in concentration on routes where the merging firms did overlap in their
operations, suggesting opportunities to exercise greater market power on these routes may have
materialized post-merger. When we focus our analysis on only these overlapping routes, we do
see a greater short-run worsening of OTP, consistent with these airlines exercising greater market
power. However, this is also consistent with post-merger integration inefficiencies, as routes
where both merging airlines operated pre-merger may also pose the greatest integration
difficulties, at least in the short run. We also find that rival firms on these overlapping routes do
not exhibit any signs of worsening in the short run, as market power effects might suggest.
Hence, our additional analysis cannot fully disentangle whether the mild evidence we find of
short-run worsening of OTP is being driven by market power or integration challenges.
However, whether analyzing the full data or looking only at overlapping routes, the long-run
improvement in OTP persists (and does so after controlling for passenger volume), indicating
that efficiencies ultimately dominate either of these possible short-run effects
Taken together, these results suggest that airline mergers have minimal negative impacts
on OTP, and likely result in long-run improvements due to efficiencies. This finding has an
interesting alignment with that of Focarelli and Panetta (2003), who find that efficiencies
outweigh market power in the long run when studying the effects of bank mergers on deposit
rates. Hence, policymakers may want to consider these potential impacts on non-price
dimensions, in addition to impacts on price, when assessing a proposed merger.
2. How Might a Merger Affect Quality Provision?
A great deal of prior literature has assessed how mergers affect firms’ prices, focusing on
two main sets of explanations: efficiencies and market power (e.g., Carlton et al., 1980; Kim &
Singal, 1993; Focarelli & Panetta, 2003). Mergers can impact firms’ efficiency in several
different ways. Merging firms may exploit economies of scale resulting from their larger size.
They may also gain economies of scope, as merging may enable the merging firms to enter new
5

markets. Firms may also achieve efficiencies through the transfer of cost-saving practices. At
the same time, mergers can increase market power. When firms in the same market merge,
particularly in cases where they each have substantial market share, they can increase their
market power by merging. As a result, the impact of mergers on prices is ambiguous, depending
on which effect is greater: the market power effect or the efficiency effect.
Reflecting this ambiguity, results from empirical tests of merger effects on prices are
mixed. Looking at airline mergers, Kim and Singal (1993) find that merging firms and their
rivals both raise prices relative to airlines flying other routes, following the announcement and
the completion of a merger. In the case of bank mergers, Sapienza (2002) finds that when a bank
acquires another bank with a small local market share, the merged firm reduces the rates it
charges borrowers. However, when the target has a large local market share, the merged firm
exploits its market power by increasing its interest rate for borrowers. Prager and Hannan (1998)
find that following mergers that violate the US Department of Justice bank merger guidelines,
the merged banks exploit their increased market power by reducing the deposit rates they pay.
Kahn et al. (2000) find that large in-market mergers lead to higher rates on individual loans, but
automobile loans are unaffected. In the most detailed study of bank mergers, Focarelli and
Panetta (2003) find that in the first two years post-merger, merged banks reduce the rates that
they pay on deposits. However, in the following years, the banks increase the rates that they pay
for deposits. For hospital mergers, the results are also inconsistent. However, several of the
more rigorous studies find that hospitals raise prices following mergers. Dafny (2005), Krishnan
(2001), and Capps and Dranove (2004) all find that when hospital mergers increase
concentration, the increase in market power leads to higher prices.
While researchers have focused on the impact of mergers on prices, mergers may also
affect firms’ provision of quality. Again, efficiency and market power provide the primary
explanations. However, unlike in the case of prices, where the effects of efficiency and market
power are clear, there are multiple possible mechanisms through which efficiency and market
power could be affecting quality, and the direction of the effects is ambiguous.
As noted above, there are several mechanisms through which merging firms may achieve
efficiencies, the net effect of which is ambiguous for quality. Merging airlines may consolidate
operations and reduce their expenditures on maintenance, ground crews, and ticketing agents,
and reduce the number of aircraft and landing slots that serve particular airports. Further, when
6

both merging carriers serve a common route, they may reduce the number of flights serving the
route post merger. Although reducing fixed costs certainly reduces the firm’s total costs, it may
lead to lower quality, e.g., worse OTP. For example, a single check-in location at the airport
may slow down processing time. In addition, reducing the number of flights on a route may
worsen OTP if it results in higher load factors (which tend to worsen OTP).
While reducing fixed assets may increase efficiency at the expense of quality, merging
firms may also increase efficiencies by combining and maintaining assets. In this case, however,
the larger combined pool of resources may provide flexibility that enhances service quality.
Specifically, more available ground crews and gate agents, more landing slots, and larger
numbers of planes at an airport can provide increased flexibility to readjust resources in response
to delays and equipment failures. In addition, the combined firm may be able to move the
combined passenger base using fewer, larger planes, which typically fly faster.
Firms may also achieve efficiencies that improve quality through transfer of best
practices. For example, if an airline with a record of superior OTP acquires an airline that offers
lower OTP, the acquiring carrier may restructure the operations of the target or transfer some
best practices to the target in order to enhance its OTP.
It is also possible that a merger will lead to inefficiencies that may negatively impact
quality provision. One reason this may happen stems from the difficulties associated with
integrating operations of the merging firms. This can include difficulties in combining airline
fleets, unionized labor forces, IT systems, route structures, etc. These integration difficulties are
frequently cited as a leading cause of the poor success records of mergers (Maruna and Morrell,
2010). They could result in quality worsening after a merger.
Along with its effects on efficiency, merging may also increase market power. This may
impact quality, but again in an ambiguous way. On the one hand, the merged airline may exploit
its market power by reducing its investments in quality1. This would be the case if it determines
that the negative effect on demand will be small (and outweighed by the cost savings) because of
the reduced threat of competition (resulting from the merger). Such a response is consistent
with recent research which finds that OTP is higher (lower) in more (less) competitive markets
(e.g., Mazzeo 2003, Rupp et al., 2003; Rupp & Holmes, 2006; Prince and Simon 2009).
1 Market power may also lead to unintentional worsening of quality, as the absence of competitive pressures may cause the merged firm to become complacent, allowing X-inefficiency to grow.
7
On the other hand, market power may instead lead to improved quality. When firms
exploit market power by raising prices, the reduced number of passengers may cause OTP to
improve, unless the merging carriers reduce their investments in other inputs by a corresponding
amount. If not, the lower load factors (i.e., proportion of a flight that is full) would cause OTP to
improve, because the time it takes to load and unload a plane is directly tied to load factor2.
Little empirical research has examined the impact of mergers on quality provision. Of the
extant literature that does look at quality response to mergers, the focus has primarily been on
hospitals and quality of care for procedures (often measured in terms of mortality rate). The
findings, as summarized in Vogt and Town (2006) are quite mixed – some find increased quality
while others find decreased quality or no change. Most notably, Ho and Hamilton (2000) find
that readmission rates for heart attack and stroke patients and early discharge of newborns
increased in some cases. However, in other cases, they find no evidence that mergers negatively
impacted quality, leading them to conclude that “the adverse consequences of increased market
power on the quality of care require further substantiation” (Ho and Hamilton, 2000).
To conclude this section, we note that the aforementioned (potential) effects of a merger
on quality may manifest at different points in time. As discussed above, airlines may struggle at
first to integrate their operations after a merger and consequently perform poorly in the short run.
However, as time passes and they better learn how to work efficiently as a single entity,
performance may improve, potentially exceeding pre-merger OTP levels. In contrast, airlines
should be able to exploit market power immediately (Kim & Singal, 1993). Recognizing this
possibility, our approach allows for differing effects over time, distinguishing short-run versus
long-run effects (and also investigating the role of pre-merger changes in OTP), in line with the
approach of Focarelli and Panetta (2003).
2 In addition, the elimination of competition between two firms due to a merger may eliminate especially cut-throat price competition between these firms, ultimately leading to higher quality. Prince and Simon (2013) find suggestive evidence that entry by a low-cost carrier (LCC) can cause incumbents (generally non-LCCs) to worsen OTP in order to compete harder on price. However, we believe such an effect is unlikely here since none of the mergers we examine involve a LCC and non-LCC.
8
3. Data
We examine the effect of mergers on airline service quality using Bureau of
Transportation Statistics data on OTP. In total our dataset spans 15 years (Q2 1998-Q2 2013)3
and comprises roughly 100 million domestic flights by 26 US carriers.4 To make estimation
more manageable, we aggregate our data into carrier-route-quarter cells. We then estimate
weighted least-squares models, weighting each observation by the number of flights in that cell.
Doing so yields identical estimates to those we would obtain running OLS on the disaggregated
flight-level data.
We define a route as an origin-destination pair. In other words, O’Hare-Dulles and
Dulles-O’Hare are two separate routes. We make this distinction because OTP is a flight-level
phenomenon, rather than an itinerary-level phenomenon like fares. Similarly, because OTP is
measured only for individual flights, we restrict our analysis to non-stop service. In total, we
observe 3,917 routes in our sample.
3.1 Measuring Mergers
We observe five mergers in our sample. The nine largest carriers in our sample are
among the ten carriers involved in these mergers, with the other carrier being Air Tran.5 For each
merger in our sample, we compare pre- and post-merger OTP for the merging carriers (with that
for non-merging carriers), on each route in which they compete. To do so, we examine data for
the three years (12 quarters) preceding each merger, and for up to five years (20 quarters)
following the merger. For example, the first merger in our sample, American and TWA, was
completed on April 9, 2001. Therefore, for this merger, we include data from the second quarter
of 1998-first quarter of 2006. Three of the mergers were completed at the end of 2009 or later.6
Therefore, we have less than five years of post-merger data for these mergers. Nonetheless, even
for our most recent merger, between Southwest and Air Tran, which was completed in Q2 2011,
we have eight quarters of post-merger data. This is more than many studies include. For
3 We exclude data from the third quarter of 2013 (the last quarter for which data were available at the time we conducted our analysis), because Southwest experienced a large, sudden drop in its OTP that was highly anomalous. 4 All US carriers with at least 1% of domestic market share are required to report OTP data. In addition, some smaller carriers report OTP data, for at least some years, as well. 5 The nine major carriers are America West, American, Continental, Delta, Northwest, Southwest, TWA, United, and US Air. 6 On routes where two mergers occur within five years, we exclude all observations following the second merger.
9
example, Kim and Singal (1993) include only one quarter of post-merger data in their study of
airline mergers. In Table 1, we list each of the five mergers, their closing date, and the first post-
merger quarter for each merger.
[Table 1 about here]
Following Focarelli and Panetta (2003), we distinguish between a merger’s short-term
and long-term effects. To do so, we divide the post-merger period into two periods: the first two
years following the merger comprise the short term, while the following three years (years 3-5
post merger) make up the long term. We include separate dummy variables to identify the short-
run and long-run effects. These are the two primary variables of interest in our analysis.
To measure the impact of mergers, we must first determine when each merger occurs. In
four of the mergers in our sample, the merger was completed within nine days of the start (end)
of a quarter. In these cases, we treat the merger as occurring just prior to the beginning of the
current (following) quarter. For example, the United-Continental merger was finalized on
October 1, 2010. In this case, we assume that the post-merger period begins with the fourth
quarter of 2010, while the third quarter of 2010 is the last quarter of the pre-merger period.
Similarly, the Northwest-Delta merger was completed on December 31, 2009. Therefore, we
assume that the post-merger period begins with the first quarter of 2010. The one exception is
the Southwest-Air Tran merger, which was completed on May 2, 2011. Because the completion
date falls near the middle of the second quarter, we treat the first quarter (2011) as the end of the
pre-merger period, and we treat the third quarter as the beginning of the post-merger period. We
drop observations for the second quarter (2011) on all routes served by Southwest or Air Tran
from our sample.
Each merger combines two separate carriers into one merged entity. For some cases, this
can make it difficult to assess the change in performance pre- and post-merger. In some cases,
this is not a problem. For example, on many routes, the merged Northwest-Delta airline
continued to operate flights under both the Northwest and Delta brands, just as they did pre-
merger. This allows us to compare the change in Northwest OTP pre- and post-merger, and the
same for Delta. However, in some cases where the merging airlines both compete on a route
prior to the merger, the airlines consolidate route-level operations post-merger, making it
difficult to compare pre-and post-merger service levels. Similarly, in three of the five mergers,
10
one of the two carrier brands is eliminated. For example, when American and TWA merged, all
of the American-TWA flights began flying under the American brand shortly after the merger.
To deal with these issues, we modify the carrier identifiers, which allow us to make pre-
and post-merger comparisons. Specifically, we make the following modifications to the carrier
identifiers found in the raw data:
1. If both merging carriers operate on the same route pre-merger, and then consolidate
operations post merger, we treat the pre-merger observations for both carriers, along with
the post-merger observations for the remaining carrier as all being observations from the
same carrier, which has a distinct identifier from either of the individual merging carriers.
For example, American and TWA both served the JFK-LAX route prior to their 2001
merger. Following the merger, both carriers’ flights began flying under the American
brand. In this case, we would create a new identifier, AATW, which would apply to both
carriers’ flights pre and post merger. In addition, we would combine the carriers’ pre-
merger operations by taking a weighted average of their pre-merger data (weighted by the
number of flights each of the merging carriers flies on the route), such that the combined
pre-merger values would be comparable with the consolidated post-merger data.
2. If one of the brands is eliminated post merger, we apply the pre-merger identifier to the
post-merger flights on the routes that the eliminated brand flew pre-merger, on those
routes that were only served by the eliminated brand prior to the merger. For example,
when TWA and American merged, any route served by TWA, but not American pre-
merger, became an American route post-merger. We reclassify all of the post-merger
flights on these routes as TWA routes. In this way, we are able to compare the merging
carrier’s pre-and post-merger OTP on this route.
3.2 Measuring OTP
In published reports, the DOT generally defines a flight to be late if it arrives at the gate
at least 15 minutes late. Hence, our first measure of OTP measures the proportion of carrier i’s
flights on route j in quarter t that arrives at least 15 minutes late. Our second measure of OTP is
the average number of minutes late (or early) that carrier i’s flights on route j in quarter t arrive
at the gate, relative to its scheduled arrival time.
11

Both of these measures of OTP compare the elapsed time from scheduled departure to
actual arrival time with the scheduled time for the flight (scheduled departure time to scheduled
arrival time). This means that airlines can manipulate a flight’s OTP by lengthening the
scheduled time for the flight. Consequently, we include two more measures of OTP: Scheduled
Time and Travel Time. Scheduled Time is the amount of time from the scheduled departure time
to the scheduled arrival time. Travel Time, as first described by Mayer and Sinai (2003),
measures only the time from when the flight is scheduled to depart until the time that it actually
arrives. In this way, it measures actual elapsed time plus the delay in departing the airport. It is
unaffected by changes in the scheduled time for the flight. For this reason, the bulk of our
analysis will focus on Travel Time.
In Table 2 we provide some summary statistics for the OTP measures.
[Table 2 about here]
4. Empirical Strategy
An important issue in assessing the impact of mergers is creating the appropriate
counterfactual. In this study, we use a difference-in-differences identification strategy, in which
we compare route-level changes in OTP for merging carriers, pre-and post-merger, with
contemporaneous changes in OTP for non-merging carriers. That is, we use the change in OTP
of non-merging airlines as a counterfactual for the change in performance of the merging
carriers. Our approach differs from some other airline merger studies (including Kim and Singal
(1993)), which compare changes in route-level outcomes pre- and post-merger for routes with
and without mergers.
Our approach, which uses non-merging airlines as a control group, offers two important
advantages. First, our approach controls for conditions which change differently for routes with
and without mergers. For example, if merging carriers’ route networks included more routes
that were experiencing growth, this would cause one to underestimate the efficiency gains from
mergers using the approach measuring route-level changes in performance (because the routes
with mergers would see a decline in OTP caused by the increase in passenger volume).
Second, our approach allows us to identify the effect for the merging carriers only,
without pooling the effects for the merging carriers and non-merging rivals. This is important
12

because it seems likely that the effects on service quality would be greater for the merging
carriers than for their rivals. Merging carriers may experience increases or reductions in
efficiency that the non-merging rivals do not experience. Moreover, unlike in the case of pricing,
it is less clear that market power benefits will be shared by rivals, at least not immediately.
Because prices are under management’s direct control and are easily observable, increases in
market power are likely to affect prices of non-merging rivals similarly to the merging firms.
But, service quality is less directly under the control of management. Therefore, it is less clear
that if merging carriers reduce investments in OTP, as a result of an increase in market power,
that we should expect to see a similar worsening of OTP by the non-merging rivals.
To implement this approach, we estimate the following OTP model:
OTPijt = B1 Merger_02ijt + B2Merger_35ijt + B3Controlsijt + uij+Merging_Carrier*vt+eijt
where OTPijt is one of the measures of OTP for carrier i on route j in quarter t.
Merger_02ijt is a dummy variable indicating whether the carrier merged during the previous two
years (eight quarters). Similarly, Merger_35ijt indicates whether the carrier merged between two
years and five years (9-20 quarters) earlier. Controlsijt is a vector of route- and carrier-level
control variables. We include controls for congestion at the endpoint airports by including counts
of the number of flights flying out of the two endpoint airports (Flights_Originjt and
Flights_Destjt) during the same three-hour block. We also control for carrier financial distress
with three bankruptcy-related dummies: Bankrupt_f1ijt indicates the carrier will enter bankruptcy
during the coming year; Bankruptijt indicates the carrier is in bankrupctcy; and Bankrupt_l1ijt
indicates the carrier left bankruptcy during the previous year. In addition, in some models we
control for the carrier’s load factor (Loadijt) or ts passenger volume on the route (lnPassengersijt).
The uij are carrier-route fixed effects that control for unobserved differences across carriers and
routes, and the vt are quarterly fixed effects that control for any industry-wide changes in OTP.
Because we observe markedly different trends in on-time performance across the sample time
period for merging versus non-merging carriers, we include a separate set of quarterly fixed
effects for each set of carriers. Finally, in all models, we cluster our standard errors by carrier to
account for correlation in the standard errors across routes and over time for each carrier.
13

In assessing the impact of mergers, the coefficient on Merger_02 (B1) indicates the short-
term effect of the merger, while the coefficient on Merger_35 (B2) captures the longer-term
effect. More specifically, the coefficient on Merger_02 (B1) captures the change in OTP for
carrier i on route j in the first two years (eight quarters) after merging relative to the change in
OTP for carriers that have not merged during the previous two years, during the same time
period. Similarly, the coefficient on Merger_35 (B2) captures the change in OTP for carrier i on
route j in the third-fifth years (9th-20th quarters) after merging relative to the change in OTP for
carriers that have not merged during the previous 3-5 years, during the same time period. If
either B1 or B2 are positive, this would indicate worsening OTP (more delays) resulting from the
merger. On the other hand, if B1 or B2 are negative, this would indicate improving OTP.
Our analysis proceeds as follows. In our baseline analysis, we examine the overall effect
of mergers on OTP without conditioning on load factor or passenger volume. Next, we examine
whether endogeneity is confounding our analysis. Third, we attempt to identify market power
and efficiency effects by controlling for passenger volume and load factor. Fourth, we compare
the effects for routes with overlapping mergers versus those served by just one merging carrier,
and compare the effects for merging and non-merging rivals on the same route. This fourth step
allows us to directly assess whether there exist any short-run or long-run spillover effects from a
merger on the merging firms’ rivals for the routes where the merger occurs. Next, we look at the
sources of any changes in on-time performance by decomposing on-time performance into
components. We then compare the effects on acquirer and target airlines. Finally, we briefly
consider some other non-OTP measures of service quality.
5. Results
5.1 Baseline Analysis
In Table 3 we report the results of our baseline model. In this specification, we include
the full sample of routes and mergers. Here, we examine the overall impact of mergers on OTP.
The results show that, during the two years immediately following a merger, the fraction of
flights arriving at least 15 minutes late increases by about 1.2 percentage points (compared to a
mean of 21% of flights arriving at least 15 minutes late), while arrival delays increase by about
0.6 minutes (significant at 0.13, and compared to a mean of 2.9 minutes). However, in the longer
term (3-5 years following the merger), we find that arrival delays are unaffected by mergers.
14

[Table 3 about here]
As noted above, however, one concern is that airlines can manipulate the delay measures;
they can reduce delays simply by increasing scheduled flight times without actually improving
service quality. To address this issue, in column 3 we examine whether scheduled flight time is
affected by mergers. The results show that scheduled flight times do not change in the first two
years following merger, but scheduled flights times are cut by about 1.4 minutes 3-5 years after
the merger. Although this effect is not statistically significant, it suggests that the arrival delay
results may understate the long-term negative impact of mergers on actual travel time.
To assess this possibility, we rerun our model using Travel Time as our dependent
variable. As mentioned above, Travel Time does not depend on Schedule Time – it is the time
elapsed from the scheduled departure to actual arrival. We present our results concerning Travel
Time in column 4 of Table 3. Consistent with the other results, the Travel Time results show that
initially OTP worsens a bit following a merger, but in the longer term, it improves. Travel Time
falls by about 1.4 minutes 3-5 years post-merger. For most of the subsequent analyses, we report
results only for Travel Time. This is because the results in Table 3 show that post-merger
changes in scheduled flight times can lead to artificial changes to arrival delays.
The results in Table 3 (and specifically the Travel Time results in column 4), constitute
the unconditional effect of mergers on OTP. These findings indicate that the overall effect of
mergers, through their effect on increased market power and efficiencies, is to mildly worsen
OTP (by a statistically insignificant amount) in the short run and to improve OTP in the long run.
In short, they indicate that concerns about worsening performance are not borne out in the data,
at least with respect to OTP in the long run.
5.2 Assessing endogeneity concerns
As noted above, endogeneity is an important concern when assessing the impact of
mergers. The merging carriers might begin modifying operations (in ways that affect OTP) prior
to merger, and/or they may experience some shock (positive or negative) to their OTP, which
might make them more (or less) likely to be involved in a merger. For example, if one carrier has
a hub airport that experiences significant expansion, this may lead to improved OTP and perhaps
make it more likely to merge. To assess this issue, we examine trends in OTP prior to our
15
mergers for both merging and non-merging carriers. We want to see whether the trends for the
merging carriers are different from those for the non-merging carriers.
Figure 1 shows the average change in Travel Time, by quarter, for the 12 quarters prior to
merger; line 1 shows the trend for the non-merging carriers, while line 2 shows the trend for the
carriers preparing to merge. The data show that for both groups Travel Time varies a lot in the
three years leading up to merger. While there is no clear trend for either the soon-to-be-merging
or non-merging carriers, the mean change in Travel Time for the two sets of carriers are
correlated at 0.55. Thus, it appears that Travel Time trends for both groups are similar in the
three years leading up to a merger.
[Figure 1 about here]
To assess this more precisely, using these data (i.e., using only the twelve quarters of pre-
merger observations for each route), we regress Travel Time on our control variables, a linear
time trend, and the time trend interacted with a dummy variable indicating the two carriers
preparing to merge. This interaction term allows us to assess whether the pre-merger time trend
is different for carriers preparing to merge than it is for their non-merging counterparts.
Consistent with Figure 1, the results in Table 4a indicate that there is not a statistically
significant difference between the pre-merger Travel Time trends for carriers about to merge and
non-merging carriers.
[Table 4a about here]
Although we find no evidence that merging carriers’ OTP was changing pre-merger, we
control for any pre-merger changes by including a dummy variable that indicates whether the
carrier will merge during the following year. These results are in Table 4b, and consistent with
the above results, we find no evidence that the merging carriers’ Travel Time was changing prior
to the merger. Moreover, our baseline results are qualitatively unaffected by the inclusion of the
pre-merger dummy variable. Taken together, these results provide no evidence that the changes
in OTP that we observe post merger, were already beginning to occur prior to the merger.
[Table 4b about here]
16
5.3 Market Power vs. Efficiency
In order to better understand how mergers affect OTP, we explore the underlying
mechanisms: market power and efficiency. As noted above, our baseline findings in Table 3
constitute the unconditional effect of mergers on OTP. These findings indicate that the net effect
of mergers, through the mechanisms of increased market power and efficiencies, is to worsen
OTP (by a statistically insignificant amount) in the short run and to improve OTP in the long run.
However, as discussed in Section 2, both types of mechanism can either improve or worsen OTP.
Therefore, measuring the net effect per se does not tell us about the prevalence of either
mechanism. In the rest of this section we try to differentiate between the efficiency and market
power mechanisms by examining concurrent changes to load factors and passenger volume, and
by analyzing what happens on overlapping routes.
5.3.1 Load Factors and Passenger Volume
As noted in Section 2, market power and efficiencies can both affect changes in
passenger volume and/or load factors. If merging airlines consolidate operations to enhance
efficiency, this might include flying a smaller number of planes, which would increase load
factor (leading to worsening OTP). On the other hand, if merging airlines exploit market power
gains by raising prices, this would reduce passenger volume (leading to improved OTP). Given
that we observe load factors and passenger volume, we can differentiate between these effects,
by examining how OTP changes post-merger after controlling for any changes to load factor or
passenger volume. Specifically, suppose the negative long-term effect of mergers on Travel
Time remains after controlling for passenger volume. Then, this would provide strong evidence
that it reflects time-saving efficiency gains, and is not simply the result of lower passenger
volume due to higher prices, made possible by market power. On the other hand, if we find,
after controlling for load factor, that Travel Time increases in the first two years following a
merger, then that would provide strong evidence that the increase in Travel Time is caused by
the merging airlines exploiting their market power or experiencing integration difficulties, and
not by the merging airlines enhancing efficiency by flying a smaller number of planes and
increasing load factors. We report these results in Table 5.
[Table 5 about here]
17
In the two columns of Table 5, we control for load factor and passenger volume,
respectively. In both cases, adding these controls does not materially affect our results.
Specifically, we still find a positive, but insignificant increase in Travel Time in the short run and
a significant decrease in Travel Time in the long run. Following the reasoning above, the
persistent positive short-run effect is suggestive of the merging airlines either exploiting their
market power or experiencing integration difficulties (rather than just increasing load factors);
however, the statistical insignificance makes this conclusion tenuous. In contrast, the persistent
negative long-run effect provides strong evidence that it is due to efficiency gains, and not
simply the result of lower passenger volume (or passengers per plane).
5.3.2 Overlapping Routes
After controlling for load factor and passenger volume, it appears time-saving
efficiencies dominate the OTP effects of mergers in the long run, while there may be a
combination of market power and integration difficulties worsening OTP in the short run. These
findings are for the full sample. However, the vast majority of our observations are from routes
served by only one merging carrier. Merging should not increase market power on these routes.
In contrast, on overlapping routes, i.e. routes served by both carriers prior to the merger,
we would expect merging carriers to gain market power.7 However, these routes also offer
greater opportunities for increasing efficiency by consolidating route-level operations (Kim &
Singal, 1993) as well as greater potential for integration difficulties. Thus, if these mechanisms
are at work in the manner suggested by our full-sample results, this pattern should be especially
visible on these routes. We report the results of our analysis for overlapping routes in Table 6.
[Table 6 about here]
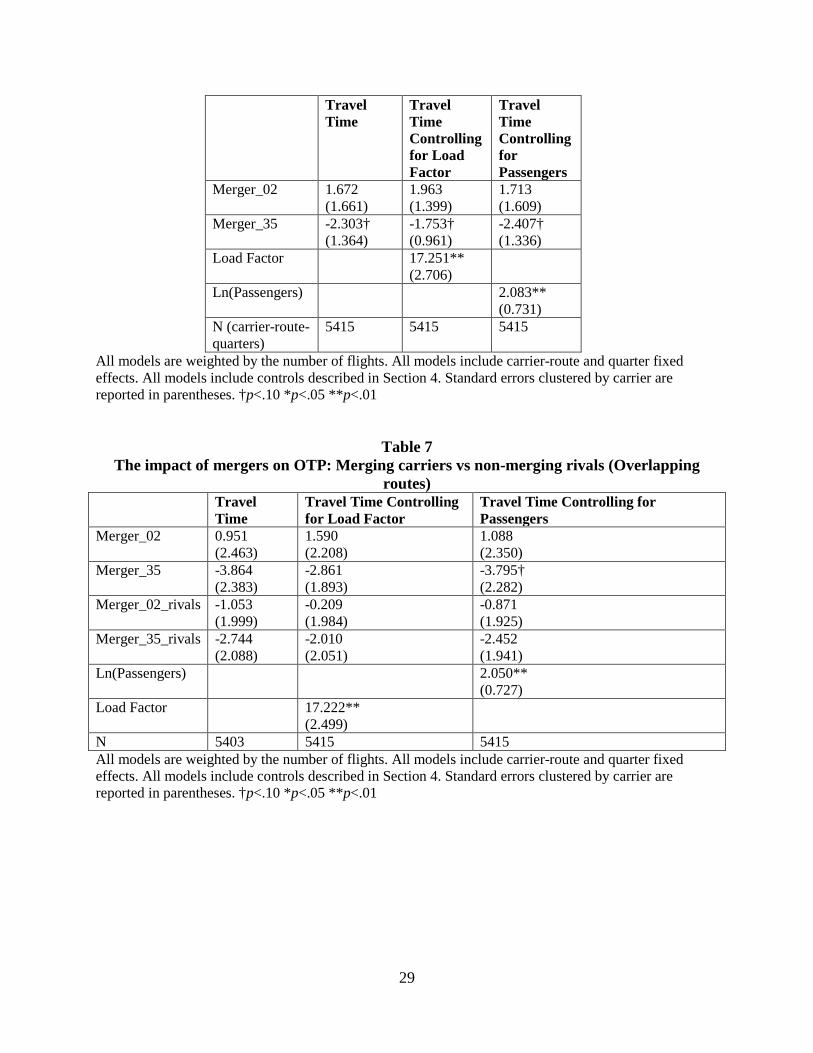
When we restrict our sample to overlapping routes, we lose most of our sample; there are
339 carrier-routes comprising 5415 observations on the overlapping routes. The first column of
Table 6 reports the results for our baseline model. We see the same pattern of results that we
observe in the full sample, but the coefficient magnitudes are substantially larger: the positive
7 Because we see airlines moving in and out of some routes in the OTP dataset, we considered different definitions of overlapping routes. The approach that we use is to include those routes where both merging carriers operated in at least two quarters of the year preceding the merger, or routes where both carriers served the route for at least one quarter during the year preceding the merger and each served the route during at least one quarter two years prior to the merger. Using these two approaches separately yielded similar results.
18

short-run post-merger effect (1.67) is more than twice as large as it is in the full sample, while
the negative long-run effect of mergers (-2.30) is more than 60% larger than in the full sample,
and is statistically significant. In columns 2 and 3 of Table 6, we control for load factor and
passenger volume, respectively. Here, we see little change in the overall pattern, consistent with
what we found for the full sample. Moreover, our long-run effects remain significant at 10%,
despite the small sample.
The results in Table 6 corroborate the mechanisms suggested by what we found in the
full sample, and their enhanced magnitude is consistent with expectations. Namely, they again
show that there may be some combination of market power and integration difficulties in the
short-run causing worsening OTP post-merger, but these yield to significant time-saving
efficiencies in the long run.
We next turn to assessing the effect of mergers on the Travel Time of rival carriers on the
overlapping routes. Doing so sheds light on the competitive effects of mergers on quality, while
also allowing us to control for any unobserved changes occurring on the route at the same time
as the merger. Prior studies find that in some cases rivals follow the merging carriers’ price
changes (Kim & Singal, 1993; Prager & Hannan, 1998), while in other cases they do not (Kahn
et al., 2000). Most recently, Focarelli and Panetta (2003) find that rival banks follow the merging
banks in reducing the deposit rates they offer in the short run, but do not follow the merging
banks in passing on long-run efficiency gains via higher deposit rates.
To examine how mergers affect the OTP of rival carriers on overlapping routes, we
construct a dummy (Rival_02) that equals one if two rival carriers on the route merged within the
previous two years. Similarly, we construct a dummy (Rival_35) that equals one if two rival
carriers on the route merged within the previous 3-5 years. We then include these two dummies
as additional regressors. The interpretation of the coefficient on Merger_02 (Merger_35) is now
slightly different, as it now indicates the change in the merging carriers’ Travel Time in the first
two years post merger (3-5 years post merger) relative to the change in Travel Time for carriers
operating on routes that have not experienced a merger within the past two (3-5) years. Similarly,
the coefficient on Rival_02 (Rival_35) indicates the change in Travel Time for carriers operating
on routes where two rivals merged within the past two (3-5) years relative to carriers operating
on routes that have not experienced a merger within the past two (3-5) years.
19
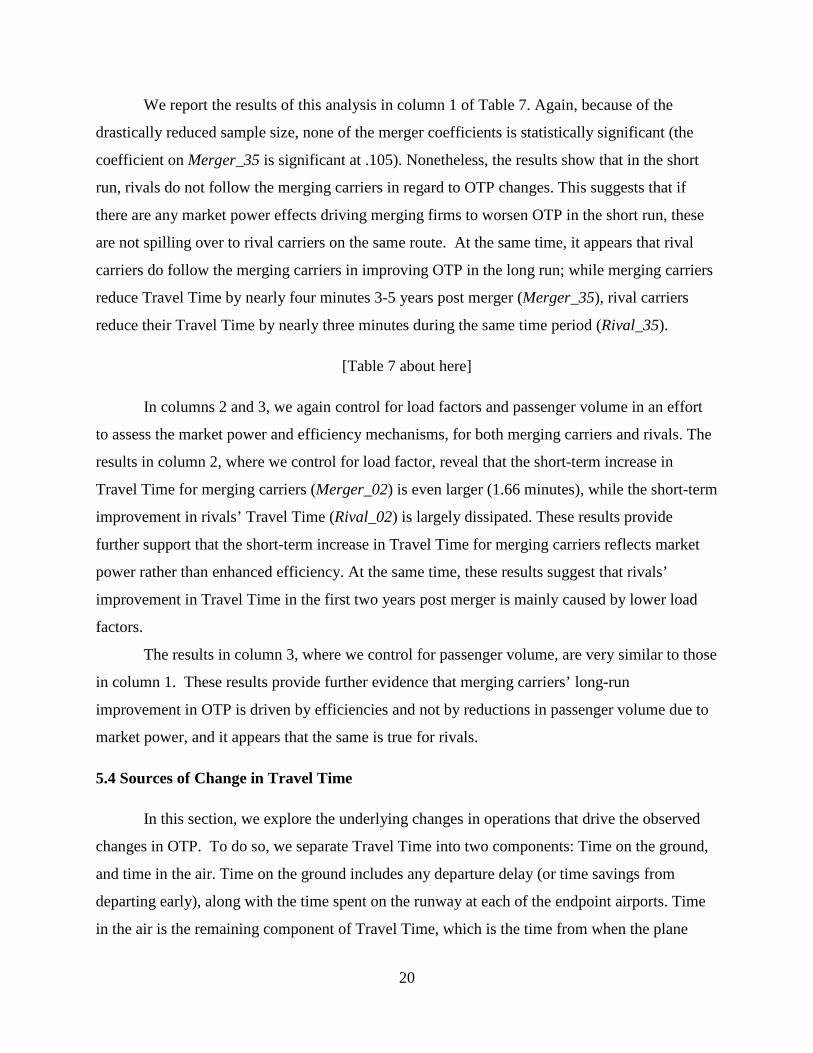
We report the results of this analysis in column 1 of Table 7. Again, because of the
drastically reduced sample size, none of the merger coefficients is statistically significant (the
coefficient on Merger_35 is significant at .105). Nonetheless, the results show that in the short
run, rivals do not follow the merging carriers in regard to OTP changes. This suggests that if
there are any market power effects driving merging firms to worsen OTP in the short run, these
are not spilling over to rival carriers on the same route. At the same time, it appears that rival
carriers do follow the merging carriers in improving OTP in the long run; while merging carriers
reduce Travel Time by nearly four minutes 3-5 years post merger (Merger_35), rival carriers
reduce their Travel Time by nearly three minutes during the same time period (Rival_35).
[Table 7 about here]
In columns 2 and 3, we again control for load factors and passenger volume in an effort
to assess the market power and efficiency mechanisms, for both merging carriers and rivals. The
results in column 2, where we control for load factor, reveal that the short-term increase in
Travel Time for merging carriers (Merger_02) is even larger (1.66 minutes), while the short-term
improvement in rivals’ Travel Time (Rival_02) is largely dissipated. These results provide
further support that the short-term increase in Travel Time for merging carriers reflects market
power rather than enhanced efficiency. At the same time, these results suggest that rivals’
improvement in Travel Time in the first two years post merger is mainly caused by lower load
factors.
The results in column 3, where we control for passenger volume, are very similar to those
in column 1. These results provide further evidence that merging carriers’ long-run
improvement in OTP is driven by efficiencies and not by reductions in passenger volume due to
market power, and it appears that the same is true for rivals.
5.4 Sources of Change in Travel Time
In this section, we explore the underlying changes in operations that drive the observed
changes in OTP. To do so, we separate Travel Time into two components: Time on the ground,
and time in the air. Time on the ground includes any departure delay (or time savings from
departing early), along with the time spent on the runway at each of the endpoint airports. Time
in the air is the remaining component of Travel Time, which is the time from when the plane
20
takes off until it touches down. We examine how each of these components of Travel Time
varies when airlines merge. We report the results in Table 8.
[Table 8 about here]
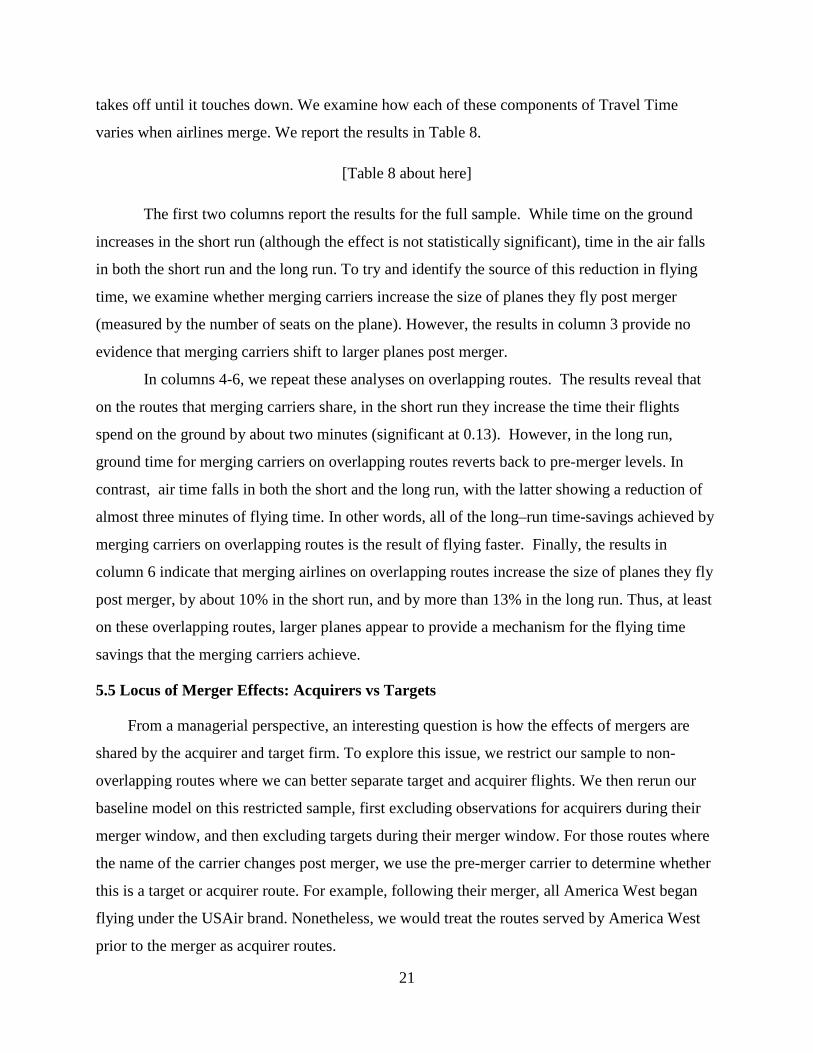
The first two columns report the results for the full sample. While time on the ground
increases in the short run (although the effect is not statistically significant), time in the air falls
in both the short run and the long run. To try and identify the source of this reduction in flying
time, we examine whether merging carriers increase the size of planes they fly post merger
(measured by the number of seats on the plane). However, the results in column 3 provide no
evidence that merging carriers shift to larger planes post merger.
In columns 4-6, we repeat these analyses on overlapping routes. The results reveal that
on the routes that merging carriers share, in the short run they increase the time their flights
spend on the ground by about two minutes (significant at 0.13). However, in the long run,
ground time for merging carriers on overlapping routes reverts back to pre-merger levels. In
contrast, air time falls in both the short and the long run, with the latter showing a reduction of
almost three minutes of flying time. In other words, all of the long–run time-savings achieved by
merging carriers on overlapping routes is the result of flying faster. Finally, the results in
column 6 indicate that merging airlines on overlapping routes increase the size of planes they fly
post merger, by about 10% in the short run, and by more than 13% in the long run. Thus, at least
on these overlapping routes, larger planes appear to provide a mechanism for the flying time
savings that the merging carriers achieve.
5.5 Locus of Merger Effects: Acquirers vs Targets
From a managerial perspective, an interesting question is how the effects of mergers are
shared by the acquirer and target firm. To explore this issue, we restrict our sample to non-
overlapping routes where we can better separate target and acquirer flights. We then rerun our
baseline model on this restricted sample, first excluding observations for acquirers during their
merger window, and then excluding targets during their merger window. For those routes where
the name of the carrier changes post merger, we use the pre-merger carrier to determine whether
this is a target or acquirer route. For example, following their merger, all America West began
flying under the USAir brand. Nonetheless, we would treat the routes served by America West
prior to the merger as acquirer routes.
21
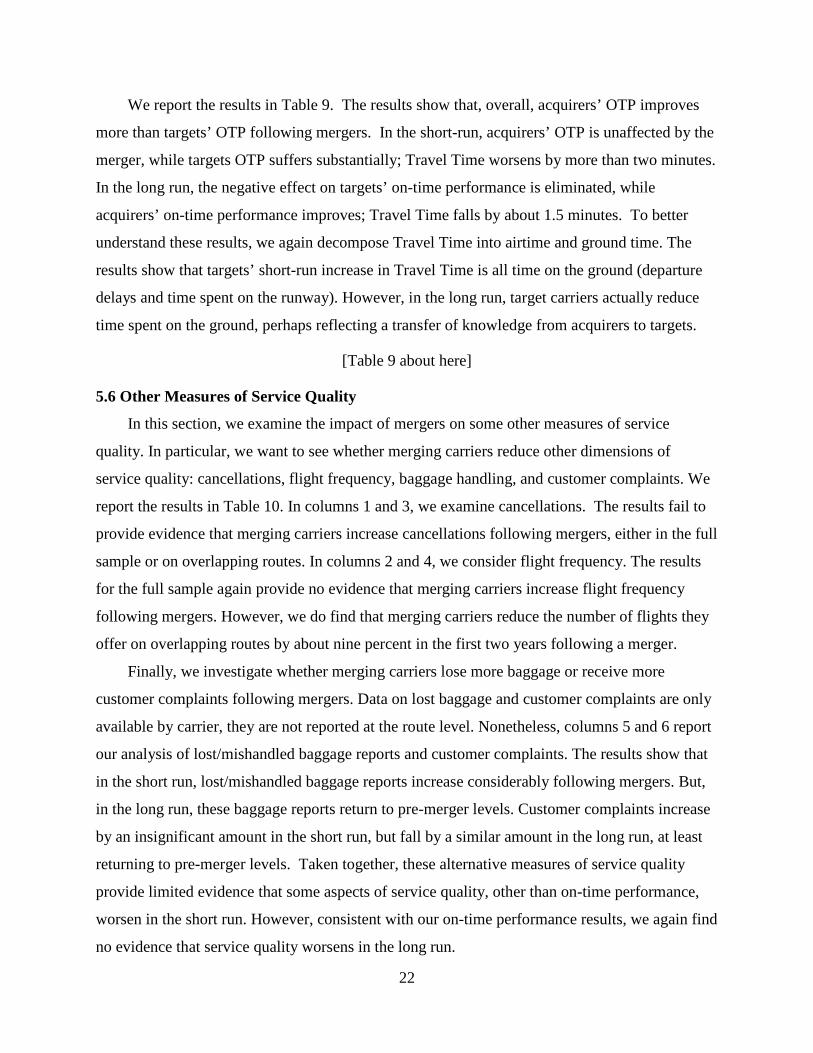
We report the results in Table 9. The results show that, overall, acquirers’ OTP improves
more than targets’ OTP following mergers. In the short-run, acquirers’ OTP is unaffected by the
merger, while targets OTP suffers substantially; Travel Time worsens by more than two minutes.
In the long run, the negative effect on targets’ on-time performance is eliminated, while
acquirers’ on-time performance improves; Travel Time falls by about 1.5 minutes. To better
understand these results, we again decompose Travel Time into airtime and ground time. The
results show that targets’ short-run increase in Travel Time is all time on the ground (departure
delays and time spent on the runway). However, in the long run, target carriers actually reduce
time spent on the ground, perhaps reflecting a transfer of knowledge from acquirers to targets.
[Table 9 about here]
5.6 Other Measures of Service Quality
In this section, we examine the impact of mergers on some other measures of service
quality. In particular, we want to see whether merging carriers reduce other dimensions of
service quality: cancellations, flight frequency, baggage handling, and customer complaints. We
report the results in Table 10. In columns 1 and 3, we examine cancellations. The results fail to
provide evidence that merging carriers increase cancellations following mergers, either in the full
sample or on overlapping routes. In columns 2 and 4, we consider flight frequency. The results
for the full sample again provide no evidence that merging carriers increase flight frequency
following mergers. However, we do find that merging carriers reduce the number of flights they
offer on overlapping routes by about nine percent in the first two years following a merger.
Finally, we investigate whether merging carriers lose more baggage or receive more
customer complaints following mergers. Data on lost baggage and customer complaints are only
available by carrier, they are not reported at the route level. Nonetheless, columns 5 and 6 report
our analysis of lost/mishandled baggage reports and customer complaints. The results show that
in the short run, lost/mishandled baggage reports increase considerably following mergers. But,
in the long run, these baggage reports return to pre-merger levels. Customer complaints increase
by an insignificant amount in the short run, but fall by a similar amount in the long run, at least
returning to pre-merger levels. Taken together, these alternative measures of service quality
provide limited evidence that some aspects of service quality, other than on-time performance,
worsen in the short run. However, consistent with our on-time performance results, we again find
no evidence that service quality worsens in the long run.
22

6. Discussion and Conclusions
In this paper, we examined how mergers affect quality provision. To do so, we looked at
five domestic airline mergers and compared changes in the merging carriers’ OTP pre- and post-
merger with changes in OTP for non-merging carriers over the same time period.
Our baseline analysis yields the following key findings: (1) In the short run, Travel Time
does not change by a significant amount; (2) In the long run, Travel Time improves relative to
pre-merger levels; (3) These effects cannot be explained by pre-merger changes in OTP.
Interestingly, this pattern is rather similar to that found in Focarelli & Panetta (2003), where
merged banks initially pay lower rates on deposits but eventually pay higher rates after a merger.
Additional analyses show that our long-run finding is driven by efficiency gains, since
any reduction in passenger volume stemming from market power does not explain the long-run
OTP improvements we find. They further show that our results are more pronounced on
overlapping routes, where we would expect the underlying mechanisms (market power,
efficiencies) to be most prevalent. Moreover, rivals appear to mimic much of the OTP
improvements of the merging firms in the long run. We find some evidence that efficiency gains
are achieved, at least in part, through the use of larger, faster planes. And, we find that most of
the efficiency gains accrue to acquirer flights. Lastly, we find little evidence that other aspects of
quality worsened.
Overall, our findings suggest that airline mergers ultimately benefit consumers via
enhanced service quality in the form of better OTP, particularly a few years after the merger.
These improvements appear to be due to efficiency gains, and appear to be largely matched by
rivals in the long run. From a welfare standpoint, consumers benefit from shorter travel times
when flying with the merged firms and/or their rivals, and do not appear to suffer losses along
several other key dimensions. As airlines appear to be “scheduling in” these time savings
through shorter schedule times, these improvements can, on the margin, allow some passengers
to make earlier connections, resulting in potentially much larger time savings in such cases. Of
course, a full welfare assessment must consider price changes as well as changes in all other
quality dimensions, but for at least those quality dimensions we examine in our analysis, there
does not appear to be any evidence of any notable worsening.
23

References
Agrawal, A., Jaffe, J., & Mandelker, G. 1992. The Post-Merger Performance of Acquiring Firms: A Re-examination of an Anomaly. The Journal of Finance, 47: 1605-1621. Borenstein, S. 1990. Mergers, Airport Dominance, and Market Power. American Economic Review, 80: 400-404. Capps, C. & Dranove, D. 2004. Hospital Consolidation and Negotiated PPO Prices. Health Affairs, 23: 175-181.
Carlton, D., Landes, W., and Posner, R. 1980. Benefits and Costs of Airline Mergers: A Case Study. Bell Journal of Economics, 11: 65-83.
Dafny, L. 2005. Estimation and Identification of Merger Effects: An Application to Hospital Mergers. NBER working paper.
Fan, Y. 2013. Ownership Consolidation and Product Characteristics: A Study of the US Daily Newspaper Market. American Economic Review, 103: 1598-1628. Firth, M. 1980. Takeovers, Shareholder Returns, and the Theory of the Firm. Quarterly Journal of Economics, 94: 235-260. Focarelli, D. and Panetta, F. 2003. Are Mergers Beneficial to Consumers? Evidence from the Market for Bank Deposits. American Economic Review, 93: 1152-1172.
Jensen, M., and Ruback, R. 1983. The Market for corporate Control: The Scientific Evidence. Journal of Financial Economics, 11: 5-50. Kahn, C., Pennacchi, G., and Sopranzetti, B. 2005. Bank Consolidation and the Dynamics of Consumer Loan Interest Rates. The Journal of Business, 78: 99-134.
Kim, E.H. and Singal, V. 1993. Mergers and Market Power: Evidence from the Airline Industry. American Economic Review, 83: 549-569. Krishnan, R. Market Restructuring and Pricing in the Hospital Industry. Journal of Health Economics, 20: 213-237.
Kwoka, J. and Shumilkina, E. 2010. The Price Effect of Eliminating Potential Competition: Evidence from an Airline Merger. Journal of Industrial Economics, 58: 767-793. Malatesta, P. 1983. The Wealth Effect of Merger Activity and the Objective Functions of Merging Firms. Journal of Financial Economics, 11: 155-181. Malmendier, U., Moretti, E., & Peters, F. 2012. Winning by Losing: Evidence on Overbidding in Mergers. NBER Working Paper.
24

Maruna, M. and Morrell, P. 2010. After the Honeymoon. Airline Business, 26: 74-78. Mazzeo, M. 2003. Competition and service quality in the US airline industry. Review of Industrial Organization, 22: 275-296.
Prager, R. & Hannan, T. 1998. Do Substantial Horizontal Mergers Generate Significant Price Effects? Evidence from the Banking Industry. The Journal of Industrial Economics, 46: 433-452.
Prince, J. & Simon, D. 2013. Do Incumbents Improve Service Quality in Response to Entry? Evidence from Airlines’ OTP. Forthcoming in Management Science.
Rupp, N., Owens, D., & Plumly, L. 2003. Does competition influence airline OTP. In: Lee, D. (Ed.), Advances in airline economics: Competition policy and antitrust, vol. 1. Elsevier.
Rupp, N. & Holmes, G. 2006. An Investigation into the Determinants of Flight Cancellations. Economica, 73:749-783. Sapienza, P. 2002. The Effects of Banking Mergers on Loan Contracts. The Journal of Finance, 57: 329-367.
Singal, V. 1996. Airline Mergers and Competition: An Integration of Stock and Product Price Effects. The Journal of Business, 69: 233-268.
Swan, P. 1970. Durability of Consumption Goods. American Economic Review, 60: 884-894. Vogt, W. and Town, R. 2006. How Has Hospital Consolidation Affected the Price and Quality of Hospital Care? Research Synthesis Project Report No. 9, Robert Wood Johnson Foundation.
Willig, R. 2011. Unilateral Competitive Effects of Mergers: Upward Pricing Pressure, Product Quality, and Other Extensions, Review of Industrial Organization, 39: 19-38.
25

FIGURE
Figure 1 Comparing pre-merger trends in OTP: Merging and non-merging carriers
-5
-4
-3
-2
-1
0
1
2
3
1 2 3 4 5 6 7 8 9 10 11 12Non-merging carrierTraveltime
Merging carrierTraveltime
26

TABLES
Table 1 Merger Summary Data
Merger Completion Date First Post-Merger Quarter American and TWA April 9, 2001 2nd Quarter 2001
America West and USAir September 27, 2005 4th Quarter 2005 Delta and Northwest December 31, 2009 1st Quarter 2010
United and Continental October 1, 2010 4th Quarter 2010 Southwest and AirTran May 2, 2011 3rd Quarter 2011
Table 2 OTP Summary Data
OTP Measure Mean Std Deviation N Fraction of flights arriving at least 15 minutes late
0.21 0.13 133873
Average arrival delay (minutes)
2.94 8.25 133806
Scheduled flight time (minutes)
145.06 81.99 133868
Travel time 151.08 81.72 133870
Table 3 Baseline results: The impact of mergers on OTP
Coefficient Fraction of Flights Arriving at Least 15 Minutes Late
Arrival Delay (minutes)
Scheduled Flight Time (minutes)
Travel Time
Merger_02 0.012† (0.007)
0.570 (0.368)
-0.165 (0.629)
0.745 (0.997)
Merger_35 -0.002 (0.013)
-0.190 (1.094)
-1.417 (1.050)
-1.435† (0.752)
N (carrier-route-quarters)
133873 133806 133868 133870
All models are weighted by the number of flights. All models include carrier-route and quarter fixed effects. All models include controls described in Section 4. Standard errors clustered by carrier are reported in parentheses. †p<.10 *p<.05 **p<.01
27
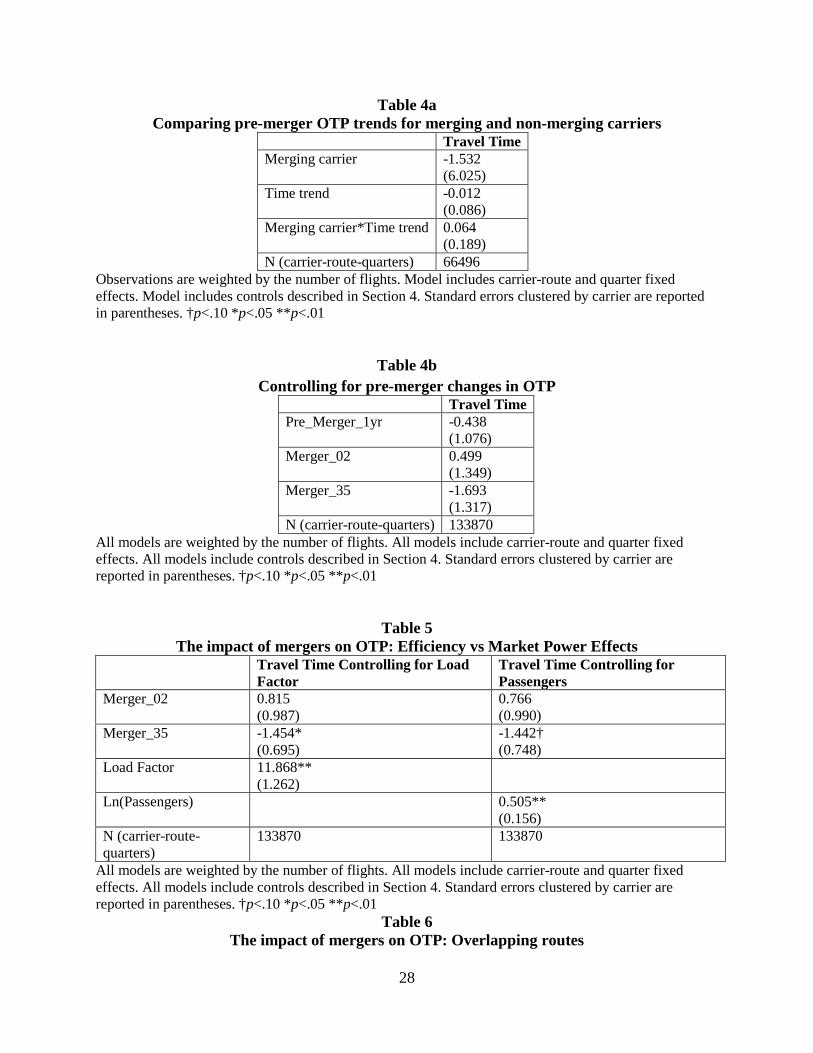
Table 4a Comparing pre-merger OTP trends for merging and non-merging carriers
Travel Time Merging carrier -1.532
(6.025) Time trend -0.012
(0.086) Merging carrier*Time trend 0.064
(0.189) N (carrier-route-quarters) 66496
Observations are weighted by the number of flights. Model includes carrier-route and quarter fixed effects. Model includes controls described in Section 4. Standard errors clustered by carrier are reported in parentheses. †p<.10 *p<.05 **p<.01
Table 4b Controlling for pre-merger changes in OTP
Travel Time Pre_Merger_1yr -0.438
(1.076) Merger_02 0.499
(1.349) Merger_35 -1.693
(1.317) N (carrier-route-quarters) 133870
All models are weighted by the number of flights. All models include carrier-route and quarter fixed effects. All models include controls described in Section 4. Standard errors clustered by carrier are reported in parentheses. †p<.10 *p<.05 **p<.01
Table 5 The impact of mergers on OTP: Efficiency vs Market Power Effects
Travel Time Controlling for Load Factor
Travel Time Controlling for Passengers
Merger_02 0.815 (0.987)
0.766 (0.990)
Merger_35 -1.454* (0.695)
-1.442† (0.748)
Load Factor 11.868** (1.262)
Ln(Passengers) 0.505** (0.156)
N (carrier-route-quarters)
133870 133870
All models are weighted by the number of flights. All models include carrier-route and quarter fixed effects. All models include controls described in Section 4. Standard errors clustered by carrier are reported in parentheses. †p<.10 *p<.05 **p<.01
Table 6 The impact of mergers on OTP: Overlapping routes
28
Travel Time
Travel Time Controlling for Load Factor
Travel Time Controlling for Passengers
Merger_02 1.672 (1.661)
1.963 (1.399)
1.713 (1.609)
Merger_35 -2.303† (1.364)
-1.753† (0.961)
-2.407† (1.336)
Load Factor 17.251** (2.706)
Ln(Passengers) 2.083** (0.731)
N (carrier-route-quarters)
5415 5415 5415
All models are weighted by the number of flights. All models include carrier-route and quarter fixed effects. All models include controls described in Section 4. Standard errors clustered by carrier are reported in parentheses. †p<.10 *p<.05 **p<.01
Table 7 The impact of mergers on OTP: Merging carriers vs non-merging rivals (Overlapping
routes) Travel
Time Travel Time Controlling for Load Factor
Travel Time Controlling for Passengers
Merger_02 0.951 (2.463)
1.590 (2.208)
1.088 (2.350)
Merger_35 -3.864 (2.383)
-2.861 (1.893)
-3.795† (2.282)
Merger_02_rivals -1.053 (1.999)
-0.209 (1.984)
-0.871 (1.925)
Merger_35_rivals -2.744 (2.088)
-2.010 (2.051)
-2.452 (1.941)
Ln(Passengers) 2.050** (0.727)
Load Factor 17.222** (2.499)
N 5403 5415 5415 All models are weighted by the number of flights. All models include carrier-route and quarter fixed effects. All models include controls described in Section 4. Standard errors clustered by carrier are reported in parentheses. †p<.10 *p<.05 **p<.01
29

Table 8 The impact of mergers on components of OTP
All Routes Overlapping Routes Only Ground
Time Air Time
Ln(Seats per Flight)
Ground Time
Air Time Ln(Seats per Flight)
Merger_02 0.778 (0.748)
-0.323* (0.139)
-0.009 (0.009)
2.035 (1.335)
-1.152** (0.128)
0.096** (0.012)
Merger_35 -0.660 (0.554)
-0.848* (0.333)
0.004 (0.015)
0.035 (1.165)
-2.846** (0.197)
0.134** (0.012)
N (carrier-route-quarters)
133821 133869 133870 5411 5414 5415
All models are weighted by the number of flights. All models include carrier-route and quarter fixed effects. All models include controls described in Section 4. Standard errors clustered by carrier are reported in parentheses. †p<.10 *p<.05 **p<.01
Table 9 The impact of mergers on OTP: Acquirers vs Targets
Acquirer Routes Target Routes Travel
Time Ground Time
Air Time
Travel Time
Ground Time
Air Time
Merger_02 0.269 (1.029)
0.360 (0.764)
-0.367* (0.154)
2.262** (0.812)
1.771** (0.604)
-0.022 (0.117)
Merger_35 -1.480† (0.810)
-0.707 (0.611)
-0.787* (0.332)
-0.963 (0.786)
-0.770† (0.444)
-0.307 (0.295)
N (carrier-route-quarters)
96988 96951 96988 64572 64552 64572
All models are weighted by the number of flights. All models include carrier-route and quarter fixed effects. All models include controls described in Section 4. Standard errors clustered by carrier are reported in parentheses. †p<.10 *p<.05 **p<.01
30

Table 10 The impact of mergers on other dimensions of service quality
All Routes Overlapping Routes Only All Carrier-Quarters Fraction
of flights cancelled
Number of flights
Fraction of flights cancelled
Number of flights
Reports of lost or mishandled baggage
All customer complaints
Merger_02 0.003 (0.002)
-0.026 (0.031)
-0.000 (0.001)
-0.093* (0.042)
0.136** (0.046)
0.069 (0.066)
Merger_35 0.002 (0.002)
0.007 (0.048)
0.002 (0.001)
-0.036 (0.065)
0.002 (0.051)
-0.104 (0.109)
N (carrier-route-quarters)
133870 133870 5415 5415 1207 1206
All models are weighted by the number of flights. All models include carrier-route and quarter fixed effects. All models include controls described in Section 4. Standard errors clustered by carrier are reported in parentheses. †p<.10 *p<.05 **p<.01
31


