The Impact of Macroeconomic Factors on Private Equity ...
64
1 This master’s thesis is carried out as a part of the education at the University of Agder and is therefore approved as a part of this education. However, this does not imply that the University answers for the methods that are used or the conclusions that are drawn. University of Agder, 2016 School of Business and Law Department of Economics and Finance The Impact of Macroeconomic Factors on Private Equity Investments A study conducted to analyze how macroeconomic factors affect the amount of private equity invested in countries. Sara Wangen Aarekol Supervisor Trond Randøy
Transcript of The Impact of Macroeconomic Factors on Private Equity ...
1
This master’s thesis is carried out as a part of the education at the University of
Agder and is therefore approved as a part of this education. However, this does
not imply that the University answers for the methods that are used or the
conclusions that are drawn.
University of Agder, 2016
School of Business and Law
Department of Economics and Finance
The Impact of Macroeconomic Factors on Private
Equity Investments
A study conducted to analyze how macroeconomic factors affect the amount of private
equity invested in countries.
Sara Wangen Aarekol
Supervisor
Trond Randøy

2
Acknowledgments
The process of writing this paper has been a journey. The most challenging parts have been to
find a place to start, going through large amounts of theory, sorting out the most relevant
information, and to use the statistical tool SPSS to run analyses. At times, it has seemed
nearly impossible, but overcoming these challenges have been extremely rewarding and has
given me a sense of achievement. Through this time I have learned more than I expected to,
both about the private equity industry and about how it is conduct a study independently.
A number of people have helped me during this time, and I wish to direct my gratitude. First,
I want to thank my supervisor, Trond Randøy, for all the help. I am extremely grateful the
good guidance and constructive feedback. Second, I want to thank my family and friends that
have supported me through this time, especially my mum, Eli, for all help and good advice.

3
List of Abbreviations
PE – Private Equity
GDP – Gross Domestic Product
LP – Limited Partner
GP – General Partner
FDI – Foreign Direct Investment
OLS – Ordinary Least Square

4
Abstract
This study examines how different macroeconomic factors affects the PE activity in countries.
To study this, data was gathered for 49 countries from all over the world, and analysed using
the statistical tool SPSS. The amount of PE invested in a country has been used to measure PE
activity, and this number was divided by GDP to correct for difference in size of economies.
The data was gathered from several secondary sources which are considered to be reliable,
and put in to one table. Several statistical analyses were conducted, with the main focus of
multiple linear regression analysis. From the analysis, two factors appeared to be significant
for the PE activity in a country. The first factor was transparency level. The higher level of
transparency a country has in its public sector, the lower is the level of perceived corruption.
The analysis showed that there is a clear positive relationship between transparency and
investment activity in a country. The second factor was legal system, which differed between
common law and civil law. The analysis showed that the investment activity is significantly
higher in common law countries.

5
TABLE OF CONTENTS
1. INTRODUCTION .............................................................................................................. 8
1.1 THE AIM OF THIS STUDY ........................................................................................... 8
2. PRIVATE EQUITY ............................................................................................................... 9
2.1 AN INTRODUCTION TO PRIVATE EQUITY ................................................................. 9
2.2 HOW INVESTORS CREATE MONEY ....................................................................... 11
2.3 PRIVATE EQUITY - ADVANTAGES AND DISADVANTAGES ............................ 12
2.4 PRIVATE EQUITY TODAY ........................................................................................ 12
3. THEORETICAL BACKGROUND AND RELEVANT LITERATURE ............................ 16
3.1 FOREIGN DIRECT INVESTMENTS .......................................................................... 17
3.2 DRIVERS FOR INTERNATIONALISATION ............................................................. 17
3.3 ANALYSING THE MACROECONOMIC ENVIRONMENT .................................... 19
3.3.1 Politics ..................................................................................................................... 19
3.3.2 Economy .................................................................................................................. 20
3.3.3 Social ....................................................................................................................... 20
3.3.4 Technological .......................................................................................................... 21
3.3.5 Ecological ................................................................................................................ 21
3.3.6 Legal ........................................................................................................................ 21
3.4 MACROECONOMIC FACTORS ................................................................................. 23
3.4.1 Property Rights ........................................................................................................ 23
3.4.2 Level of Corruption ................................................................................................. 24
3.4.3 Legal System ........................................................................................................... 25
3.4.4 Taxation ................................................................................................................... 26
3.4.5 Growth Prospects .................................................................................................... 27
3.4.6 Continent ................................................................................................................. 27
3.5 ANALYSING THE INDUSTRY, COMPETITORS AND THE ORGANISATION ... 28
4. METHODOLOGY ............................................................................................................... 29
4.1 DATA COLLECTION ................................................................................................... 29
4.2 VARIABLES AND THEORETICHAL FRAMEWORK ............................................. 30
4.2.1 Dependent variable .................................................................................................. 30
4.2.2 Independent Variables ............................................................................................. 31
4.3 RESEARCH DESIGN ................................................................................................... 33
4.4 HYPOTHESES .............................................................................................................. 34
4.5 ASSESMENT IF THE VARIABLES ............................................................................ 35

6
4.5.1 Perceived level of corruption .................................................................................. 36
4.5.2 Tax level .................................................................................................................. 36
4.5.3 Growth Prospects .................................................................................................... 37
4.5.4 Legal system ............................................................................................................ 37
4.5.5 Continent ................................................................................................................. 37
4.5.6 Investor Protection .................................................................................................. 37
4.6 AN OVERVIEW OF THE VARIABLES ..................................................................... 38
4.7 RELIABILITY AND VALIDITY ..................................................................................... 40
4.7.1 Reliability .................................................................................................................... 40
4.7.2 Validity ........................................................................................................................ 40
5. STATISTICAL ANALYSIS ................................................................................................ 41
5.1 CORRELATION ANALYSIS ....................................................................................... 41
5.2 Multiple Linear Regression ............................................................................................ 42
5.2.1 Ordinary Least Square ............................................................................................. 44
5.2.2 The Enter Method .................................................................................................... 45
6. DATA ANALYSIS AND RESULTS .................................................................................. 49
6.1 MULTIPLE LINEAR REGRESSION – MEETING ASSUMPTIONS ........................ 49
6.2 TESTING HYPOTHESES ............................................................................................. 50
6.2.1 Testing the overall effect – F-test ............................................................................ 50
6.2.2 Testing for individual significance – T-test ................................................................ 51
7. DISCUSSION, CONCLUSION, LIMITATIONS AND SUGGESTION FOR FURTHER
RESEARCH ............................................................................................................................. 53
7.1 DISCUSSION ................................................................................................................ 53
7.2 CONCLUSION .............................................................................................................. 54
6.4 SUGGESTIONS FOR FURTHER RESEARCH ........................................................... 54
REFERENCES ......................................................................................................................... 55
Appendices ............................................................................................................................... 58
7
List of Figures
Figure 1: Typical Stages of a Private Equity Fund .................................................................. 10
Figure 2: Private Equity Investments Categorized by Age of the Portfolio Company ............ 11 Figure 3: PE capital raised globally ......................................................................................... 13 Figure 4: Exits globally ............................................................................................................ 13 Figure 5: Cash flow from buy out funds in major regions ....................................................... 14 Figure 6: Investment activity .................................................................................................... 15
Figure 7: LPs’ satisfaction with and expectations for PE returns ............................................ 16 Figure 8: Michael Porter’s Five Forces Framework ................................................................ 29
Figure 9: Hypothesises ............................................................................................................. 35 Figure 10: Coneptual framework ............................................................................................. 35 Figure 11: Ordinary Least Square-model ................................................................................. 45
List of Tables
Table 1: Continent Frquency Table .......................................................................................... 28 Table 2: Scales ......................................................................................................................... 36
Table 3: Legal system .............................................................................................................. 37 Table 4: Continent .................................................................................................................... 37
Table 5: The Variables ............................................................................................................. 38 Table 6: An overview over the variables in table 5 .................................................................. 39 Table 7: Continent Decoded ..................................................................................................... 44
Table 8: Correlation Matrix from SPSS ................................................................................... 46 Table 9: Model Summary from SPSS ...................................................................................... 47
Table 10: Coefficient Table from SPSS ................................................................................... 48 Table 11: ANOVA-table .......................................................................................................... 50 Table 12: Coefficients Table .................................................................................................... 51

8
INTRODUCTION
This is a study at a macro level, with the intention of analysing relationships between
macroeconomic factors and private equity activity in different countries. The factors
investigated are gathered from relevant literature, and then analysed using statistical tools.
Before the analysis, an introduction will be given to private equity.
Private equity (PE) is a way of investing that is used all over the world. In short, PE
investments are investments in non-publicly traded firms. They are typically held for three to
seven years, which during this time, the investors tries to increase the value of the investee.
By the end of the investment period, the investments are sold, and investors create returns if
they have been able to increase the value and sell it for a higher price than they bought it for.
The amount of PE activity varies between countries, and to the authors knowledge, there are
no studies that have been done on a global level to try to explain these variations. This is why
this paper will look into different macroeconomic factors that may have an effect on where PE
investors decide to invest, and try to use these factors to explain some of the variations
observed.
1.1 THE AIM OF THIS STUDY
As of today, PE-investments are spread all over the world, and the proportion of PE-activity
in countries vary greatly. In this study, I will try to find an explanation to the variations in PE
investments in countries by analysing macroeconomic factors. The research question for this
thesis is: Can variations in PE activity between countries be explained by macroeconomic
factors?

9
2. PRIVATE EQUITY
2.1 AN INTRODUCTION TO PRIVATE EQUITY
The purpose of PE investments is to buy a business with the intention to sell it with profit
after a certain time. According to Cendrowski, Martin, and Petro (2012, p. 5), a PE investment
is defined as “a medium or long-term equity investment that is not publicly traded on an
exchange”. A PE is investment is typically made for a period of time, before it is sold to
create returns. Normally, these investments are held for three to seven years, while the funds
usually exists for eight to twelve years (Cendrowski et al., 2012, p. 7). Funds are held longer
than the investments’ period because of the time it takes to collect the funds and consider
potential investee companies, and make a choice.
PE can be divided into two parts; fund investing and direct investing. Direct investing means
that investors directly invest their money in an entity. With fund investments, investors put
their money in a PE fund, and a PE firm decides where to invest the money. These types of
arrangements are often structured as limited partnerships (LP), referring to the limited liability
of the investors. Those managing the fund within the PE firm are called general partners, and
they are the ones deciding where and when to invest, and when to exit the investment
(Cendrowski et al., 2012, p. 7).
The life cycle of a PE fund is typically divided into four stages; Organisation/fundraising,
investment, management, and harvest (exit). In other words, a PE fund is not a perpetuity, but
exists for a limited amount of time. Because of this, it is normal for PE firms to then raise
follow-up funds (Cendrowski et al., 2012, p. 21).

10
Figure 1: Typical Stages of a Private Equity Fund
Source: (Cendrowski et al., 2012, p. 7)
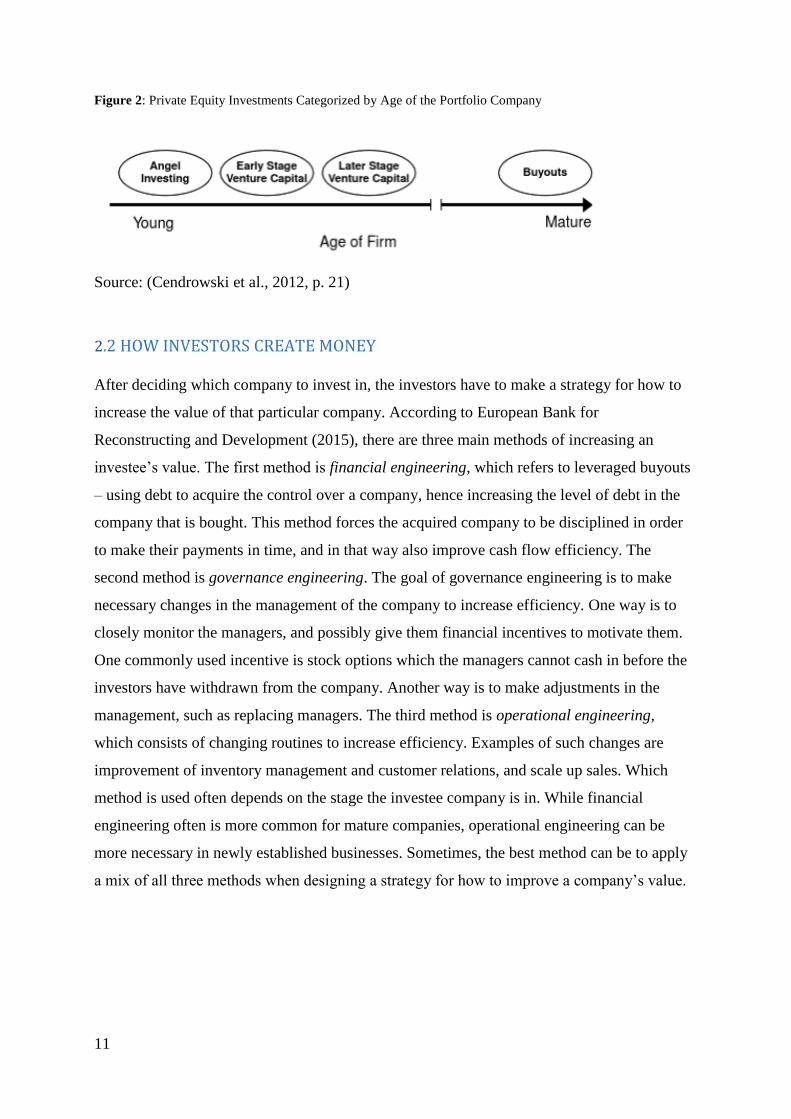
There are several types of PE investments, and these can often be classified by the age of the
portfolio company. Angel investments are typically “high-net-worth individuals who invest in
companies with a feasible idea”, according to Cendrowski et al. (2012, p. 21). Venture capital
(VC) is capital provided either to help the company in the start-up phase, or to help an already
established company to expand their business with new products or over new territories. The
last category of PE investments is leveraged buyouts, which are acquisitions of mature
companies that the PE firms think they can turn around to make higher profits than they
already do (Cendrowski et al., 2012, p. 21).
11
Figure 2: Private Equity Investments Categorized by Age of the Portfolio Company
Source: (Cendrowski et al., 2012, p. 21)
2.2 HOW INVESTORS CREATE MONEY
After deciding which company to invest in, the investors have to make a strategy for how to
increase the value of that particular company. According to European Bank for
Reconstructing and Development (2015), there are three main methods of increasing an
investee’s value. The first method is financial engineering, which refers to leveraged buyouts
– using debt to acquire the control over a company, hence increasing the level of debt in the
company that is bought. This method forces the acquired company to be disciplined in order
to make their payments in time, and in that way also improve cash flow efficiency. The
second method is governance engineering. The goal of governance engineering is to make
necessary changes in the management of the company to increase efficiency. One way is to
closely monitor the managers, and possibly give them financial incentives to motivate them.
One commonly used incentive is stock options which the managers cannot cash in before the
investors have withdrawn from the company. Another way is to make adjustments in the
management, such as replacing managers. The third method is operational engineering,
which consists of changing routines to increase efficiency. Examples of such changes are
improvement of inventory management and customer relations, and scale up sales. Which
method is used often depends on the stage the investee company is in. While financial
engineering often is more common for mature companies, operational engineering can be
more necessary in newly established businesses. Sometimes, the best method can be to apply
a mix of all three methods when designing a strategy for how to improve a company’s value.

12
2.3 PRIVATE EQUITY - ADVANTAGES AND DISADVANTAGES Using PE as a way of investing comes with several advantages. First of all, PE is a way of
reducing the principal-agent problem (European Bank for Reconstructing and Development,
2015). In publicly traded firms, shareholders mainly prioritise profit. Often they diversify risk
by holding portfolios with several investments. To achieve the level of profit the shareholders
demand, it might be necessary for managers to increase the risk, even if it may be against the
managers wishes. Managers cannot diversify risk the same way as shareholders – they have
one job, and risky behaviour may impose danger for their positions. If something should go
wrong, managers can lose their jobs and reputation. PE investments reduce this problem by
aligning managers and investors goals in a better way. While shareholders can sell their shares
if they do not believe managers are maximising profit, PE-investors cannot, since they have
invested all their money in one organisation, and agreed on a long-term deal. Because of this,
PE investors have to closely monitor their investees to make sure managers are working
towards the right goals.
Another advantage with PE is that it contributes to economic development. According to
European Bank for Reconstructing and Development (2015), PE investors need to foster
sound corporate governance and transparency. They transfer skills in their attempt to improve
governance and operations, which the investee companies can benefit from even after the
investment period is over.
Some of the criticism against PE is that it is not as efficient value creation as it seems to be.
Some say that the value creation can be a result of good timing in terms of low borrowing
costs. Another criticism is that PE funds have easy access to superior information, and can
pick whatever company that seems to have a best prospects (European Bank for
Reconstructing and Development, 2015). In that way, the investee company increase the value
by itself, without PE investors contributing to the operational performance.
2.4 PRIVATE EQUITY TODAY Today, the share of PE activity is unevenly distributed among regions. The US is the biggest
actor, more than twice as big as the second biggest, Europe. Measured in dollars, $290bn was
raised in the US, $131bn in Europe, $55bn in Asia and $20bn in the rest of the world in 2014
(Preqin, 2015). We can see that the total value of deals are higher in the US than other major
market in figure 5.

13
During the 2000’s, the PE market went through highs and lows. The early 2000’s were great
years with high growth, but the global financial crisis put a temporary stop for this. After
nursing investees after the crisis, we have started to see a rise in the private equity market
again over the last couple of years.
Figure 3: PE capital raised globally
Source: (Bain & Company, 2016)
Figure 4: Exits globally
Source: (Bain & Company, 2016)

14
As we can see from the figure 3, raised PE capital had a peak in 2007/2008. When the
financial crisis hit, all exit channels got blocked and exits were reduced significantly in the
years after the crisis, which can be seen in figure 4. The financial crisis had a large impact on
many of the investees, and GPs stopped raising funds while nursing these companies. This led
to an overflow of LPs in the market, according to Bain & Company (2016). Figure 3 shows
that the value of PE-funds raised in 2013-2015 have been significantly larger than the
previous years, and Bain & Company (2016) reports considerably better conditions for
fundraisers in these years. The past years have also been excellent for LPs, as distributions
have exceeded contributions since 2011. While the US and Europe have had positive cash
flows from 2011, the Asia-Pacific region did not turn the cash flow around to be positive until
2013. Then, the cash flow from PE investments in the Asia-Pacific region were 1.7 billion,
and more than tripled to 5.9 billion in 2014 (Bain & Company, 2016).
Figure 5: Cash flow from buy out funds in major regions
Source: (Bain & Company, 2016)
15
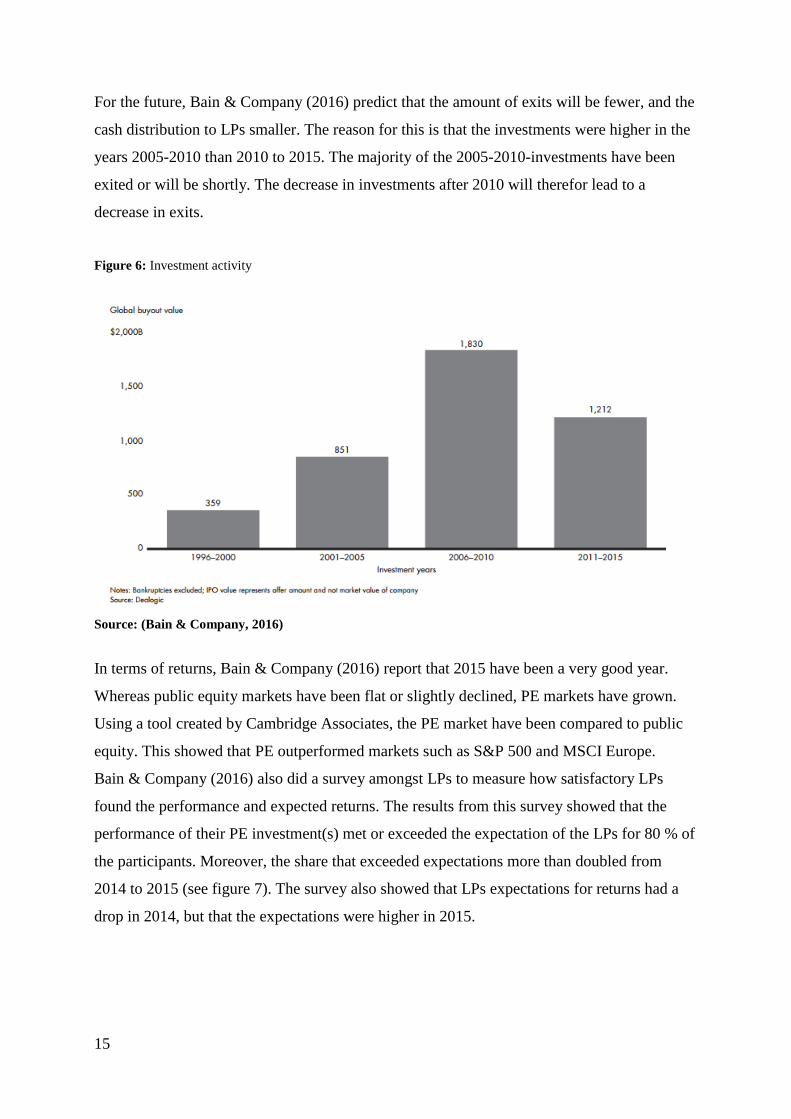
For the future, Bain & Company (2016) predict that the amount of exits will be fewer, and the
cash distribution to LPs smaller. The reason for this is that the investments were higher in the
years 2005-2010 than 2010 to 2015. The majority of the 2005-2010-investments have been
exited or will be shortly. The decrease in investments after 2010 will therefor lead to a
decrease in exits.
Figure 6: Investment activity
Source: (Bain & Company, 2016)
In terms of returns, Bain & Company (2016) report that 2015 have been a very good year.
Whereas public equity markets have been flat or slightly declined, PE markets have grown.
Using a tool created by Cambridge Associates, the PE market have been compared to public
equity. This showed that PE outperformed markets such as S&P 500 and MSCI Europe.
Bain & Company (2016) also did a survey amongst LPs to measure how satisfactory LPs
found the performance and expected returns. The results from this survey showed that the
performance of their PE investment(s) met or exceeded the expectation of the LPs for 80 % of
the participants. Moreover, the share that exceeded expectations more than doubled from
2014 to 2015 (see figure 7). The survey also showed that LPs expectations for returns had a
drop in 2014, but that the expectations were higher in 2015.

16
Figure 7: LPs’ satisfaction with and expectations for PE returns
Source: (Bain & Company, 2016)
3. THEORETICAL BACKGROUND AND RELEVANT LITERATURE
When doing research on the private equity market, several different sources have been used.
One of them is reports from organisations working with PE on a continuous basis. Auditing
firms such as EY and KPMG regularly publish reports where they describe the conditions of
the PE market. There are also organisations representing countries or regions that conduct
research on PE and publish their results publicly. In addition to this, academic literature such
as textbooks and research articles have been studied. Because there are limited theoretical
resources about macroeconomic factors’ impact on where investors choose to invest, some
theory have been gathered from sources about foreign direct investments (FDIs) because of
the similarities between FDIs and PE investments.
When going through reports from PE organisations, it is obvious that different regions
struggle with different challenges. In the report from European Bank for Reconstructing and
Development (2015), they write about how institutional weaknesses can be some of the
reasons for why not more investors chose to invest in the EBDR region. Some of the issues
they list are weak legal protection for minority shareholders, poor corporate governance and
the quality of institutions. MENA also mention institutional weaknesses as a concern, but
17
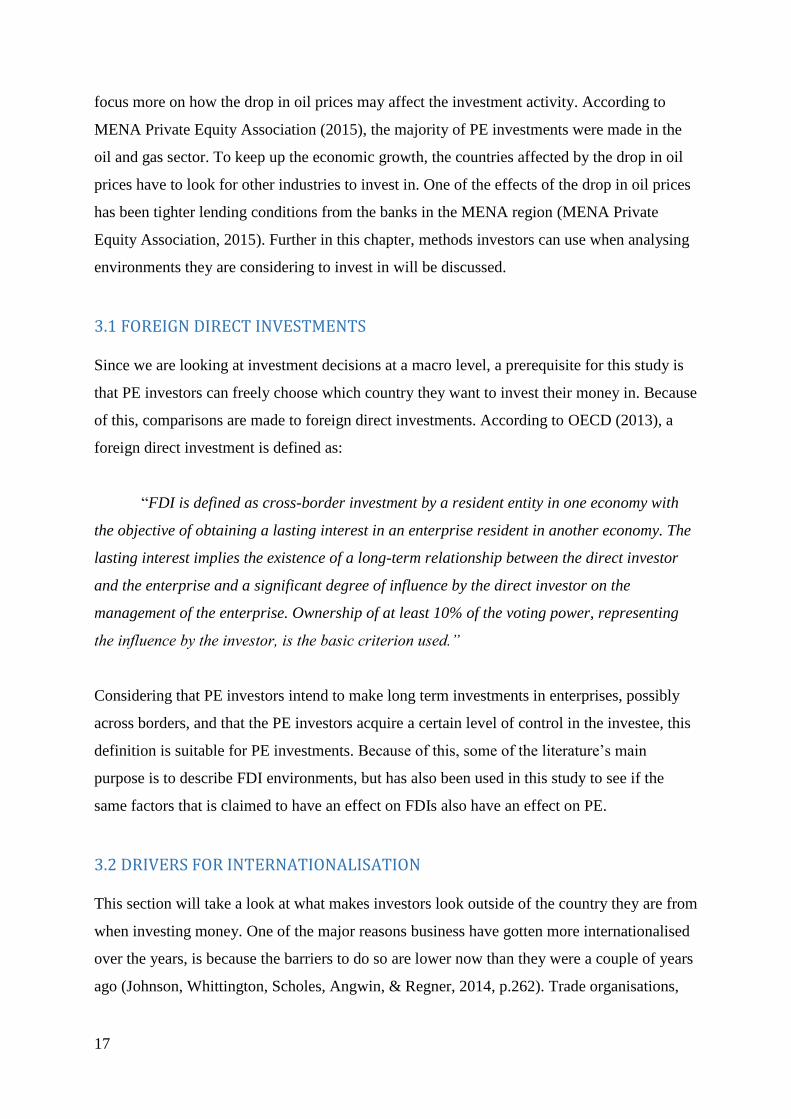
focus more on how the drop in oil prices may affect the investment activity. According to
MENA Private Equity Association (2015), the majority of PE investments were made in the
oil and gas sector. To keep up the economic growth, the countries affected by the drop in oil
prices have to look for other industries to invest in. One of the effects of the drop in oil prices
has been tighter lending conditions from the banks in the MENA region (MENA Private
Equity Association, 2015). Further in this chapter, methods investors can use when analysing
environments they are considering to invest in will be discussed.
3.1 FOREIGN DIRECT INVESTMENTS
Since we are looking at investment decisions at a macro level, a prerequisite for this study is
that PE investors can freely choose which country they want to invest their money in. Because
of this, comparisons are made to foreign direct investments. According to OECD (2013), a
foreign direct investment is defined as:
“FDI is defined as cross-border investment by a resident entity in one economy with
the objective of obtaining a lasting interest in an enterprise resident in another economy. The
lasting interest implies the existence of a long-term relationship between the direct investor
and the enterprise and a significant degree of influence by the direct investor on the
management of the enterprise. Ownership of at least 10% of the voting power, representing
the influence by the investor, is the basic criterion used.”
Considering that PE investors intend to make long term investments in enterprises, possibly
across borders, and that the PE investors acquire a certain level of control in the investee, this
definition is suitable for PE investments. Because of this, some of the literature’s main
purpose is to describe FDI environments, but has also been used in this study to see if the
same factors that is claimed to have an effect on FDIs also have an effect on PE.
3.2 DRIVERS FOR INTERNATIONALISATION
This section will take a look at what makes investors look outside of the country they are from
when investing money. One of the major reasons business have gotten more internationalised
over the years, is because the barriers to do so are lower now than they were a couple of years
ago (Johnson, Whittington, Scholes, Angwin, & Regner, 2014, p.262). Trade organisations,

18
legal framework, taxation rules, etc. is more customized for international trade. In their book,
Johnson et al. (2014) lists possible drivers for internalisation:
Market drivers: similar market characteristics makes it easier to go international.
1. Similar markets and tastes: similarities in markets makes it easy for a producer to
expand to that particular market, because the producer already has the knowledge
to do so. In the PE industry, this can be related to PE investors’ experience within
one market. In an industry where markets vary little across borders, an investor can
use their skills from one region when trying to improve an investee in another
region within the same industry.
2. Global Customer: some services are needed all over the world because a product is
internationalised, i.e. mechanics for car brands such as Toyota. This also relates to
the PE industry in the same way as the first point. An investor with experience
within a certain global industry can use this experience and skills to improve an
investee that is within the same industry.
3. Transferable marketing: products and services can be marketed the same way in
different markets.
Government drivers: reduced barriers such as a legal framework that is more open for
internalisation, liberalisation and adoption of free markets.
Competitive drivers: internationalised competitors puts pressure on businesses to
expand.
There are other factors that applies to the PE industry beside those listed by Johnson et al.
(2014). PE investors look across borders when assessing companies to find those with the best
potential. To do that, investors should carefully analyse the strategic position a potential
investee is in by analysing the macro environment, the industry, competitors and the
organisation.

19
3.3 ANALYSING THE MACROECONOMIC ENVIRONMENT
When making investments, it is important to do a thorough analysis of the environment.
According to Johnson et al. (2014), the environment “gives the organisations their means for
survival”. A useful tool for analysing the macro environment is the PESTEL framework,
which stands for political, economic, social, technological, ecological and legal (Johnson et
al., 2014, p. 34). The though behind the PESTEL framework is to analyse the environment
within each category to identify strengths and weaknesses, and use these to evaluate whether
or not to invest in that environment.
The first category, politics, assess the role of the government and the state in an environment
(Johnson et al., 2014, p.34). The state plays different roles in different countries. Some places,
the state can be a major actor as provider of financial resources, as a customer or a big
stakeholder. In addition, the state has a major influence on the conditions for established
businesses, such as tax levels, accounting rules and guidelines and other legal framework. The
next category, economy, concerns macro economic factors, such as exchange rates, economic
growth and business cycles. Social considers factors such as demographics, cultures,
difference in demand and ethics. Technology concerns the difference in technology in regions,
such as access to internet and software and developed infrastructure. Ecology takes up the
issue of “green” environmental issues, and legal takes legal system and legal constraints into
consideration, (Johnson et al., 2014, p. 34).
3.3.1 Politics
The category politics assesses the role the state has in a country’s economy. The state will
always be a stakeholder in one way or another and always have legislative power to some
extent. It can also be the force behind the legal enforcement. In addition to this, the
government can be a major customer or a provider of finance for many businesses. It is
proven that there is a connection between source of financing and legal system in a country.
In their book, Doupnik and Perera (2015, p. 28) explains how there are four main sources for
financing; banks, the government, from shareholders or privately. They rate regions according
to Hofstede’s cultural dimensions (individualism, power distance, uncertainty avoidance and
long-term orientation), and Gray’s accounting values (professionalism vs. statutory control,
uniformity vs. flexibility, conservatism vs. optimism and secrecy vs. transparency). We are
not going too deep into these dimensions here, but what they showed in their book, is that

20
there is a clear connection between these dimensions and accounting values and source of
financing. In countries where majority of businesses are financed by shareholders, the
necessity is bigger for an open and transparent business, while the demand for disclosure is
lower in countries where the majority of businesses are financed by the governance, banks or
privately. This can further be connected to legal system. Usually, shareholders are the most
common source of funding in common law countries, while banks, governments and privately
financing is more common in code laws (Doupnik & Perera, 2015, p. 28; Gray, 1988; Minkov
& Hofstede, 2011). This will be further explained in the chapter about macroeconomic
factors.
3.3.2 Economy
The economic factor in the PESTEL analysis consider macroeconomic factors that have an
impact on the economy in an environment. Such factors can be economic growth, exchange
rates and inflation. Economic growth is one important economic factor. Growth in i.e. gross
domestic product (GDP) signifies that the economy in a country has grown. Exchange rate is
also an important economic factor, as it can affect profits for companies that trade
internationally. In their report, MENA Private Equity Association (2015) express concern
about how the drop in oil prices might decrease the economic growth, which then might
reduce PE investors’ interest in investing. In a declining marked or a market with no growth,
it will be difficult for businesses to grow. Since the businesses cannot grow with the market,
on businesses growth will be on behalf of another one. This means that the fight to survive
will be harder within a market (Johnson et al., 2014, p.36). In such a market, it will be more
difficult to create returns compared to in growing economies. It will also be very challenging
for newly established businesses to survive.
3.3.3 Social
The factor social takes into considerations factors such as culture and demographics.
Examples on such factors are religion, traditions, distribution of men and women and more.
Another factor that can be placed in this category is corruption. Several studies have been
done about the impact corruption has on economic growth, such as the study conducted by
Mo (2001), in which he found that a 1 % increase in corruption level reduced the growth rate
in GDP by 0.72 %. Another factor is the quality of corporate governance in a country. One of
the key elements for achieving results is good corporate governance, as this is one of the

21
pillars for good decision making. It also creates an “environment for attitudes, mechanisms
and behaviours that allow this well-informed decision making to take place” (European
Private Equity & Venture Capital Association, 2005). Corporate governance has been defined
in several different ways. OECD’s definition is used in this research. They describe corporate
governance as “procedures and processes according to which an organisation is directed and
controlled. The corporate governance structure specifies the distribution of rights and
responsibilities among the different participants in the organisation – such as the board,
managers, shareholders and other stakeholders – and lays down the rules and procedures for
decision-making” (European Central Bank, 2005). In other words, corporate governance is to
give guidelines for how the business should operate, delegate responsibility and control that it
is operating that way.
3.3.4 Technological
The PESTEL-factor about technology considers the technology available. Such technology
can be the availability of data programs, transportation methods, methods of building and
construction and more. We will not spend too much time on analysing this factor since it can
be difficult to quantify and does therefor not fit in this the analysis later on.
3.3.5 Ecological
To evaluate the ecological or “green” aspect of an environment, several different tools can be
used. One tool is to see if it triple bottom line (TBL) reporting is common in the environment.
TBL is a way of reporting that have three bottom lines; one economic line, one social line and
one environmental line (Doupnik & Perera, 2015, p. 739). Investors can also look at indexes
that measure pollution and emission, or investigate which countries that are part of
environmental agreements, such as the Kyoto Protocol and the EU Emission Trading Scheme
(Doupnik & Perera, 2015, p. 739; European Commission, n.d.; United Nations, n.d.).
3.3.6 Legal
Within the legal factor, it can be necessary to investigate the barriers of investing in a region
(i.e. tax barriers), and if the country is part of any trade agreements, such as WTO. As
mentioned in the section about economy, legal system can have an impact on how businesses
are financed in a country. Another legal aspect to consider is the tax level in a country.
According to Doupnik and Perera (2015, p. 541), tax is one of the most significant cost for all

22
businesses. Therefore, some businesses choose to exploit the difference in tax level when
investing internationally.
When using the PESTEL framework, one should not go too much into detail within each
category, as one would end up a vast amount of information, which it would take a lot of
resources to analyse. One should rather look at key drivers for change. Key drivers for change
is defined by Johnson et al. (2014, p.36) as “factors that are likely to have a high impact on
the future success or failure of strategy”. Johnson et al. (2014, p. 37) lists three methods for
doing this:
1. Identifying megatrends - trends that slowly evolve over time, but that later have a large
impact on environmental factors over a long period of time, i.e. the aging population
in the western world.
2. Identifying inflexion points, which are moment when trends shift direction. Examples
of inflexion points are when economies starts to grow after years of stagnation, or
when the unemployment rate starts to decline after years of a growing population of
unemployed.
3. Detecting weak signals that are signs of future inflexion points.
After conducting the PESTEL analysis, one should assess the information gathered. One way
to do this, is to build scenarios. A business should be prepared for the environment to change,
and never rely on only one future scenario. The point of scenario building is not to predict the
future, but to be prepared for possible changes. According to Johnson et al. (2014, p. 38),
there are five basic steps when carrying out a scenario analysis:
1. Defining a scenario scope.
First, one should define a subject for the scenario, the size of the environment
(globally, internationally, local) and a time span.
2. Identifying the key drivers for change as listed above.
3. Developing scenario “stories” where one should use the key drivers identified.
4. Identifying impacts the key drives may have on the future.
5. Establishing early warning systems.
23
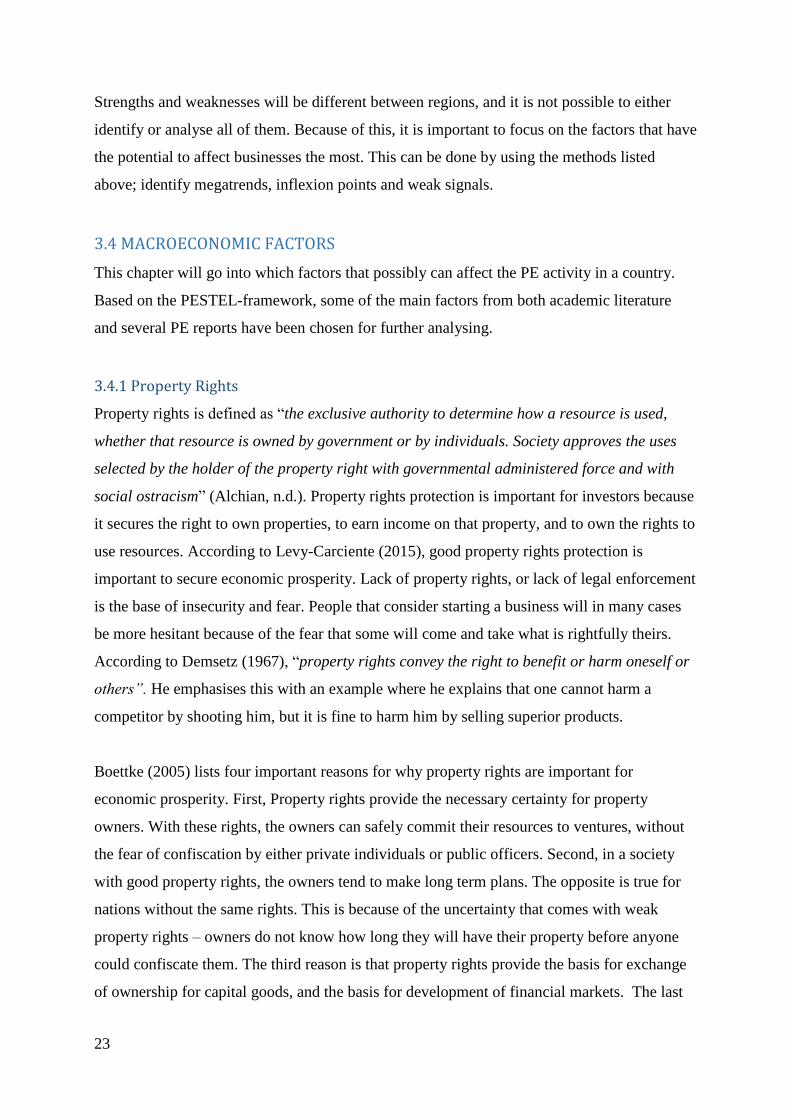
Strengths and weaknesses will be different between regions, and it is not possible to either
identify or analyse all of them. Because of this, it is important to focus on the factors that have
the potential to affect businesses the most. This can be done by using the methods listed
above; identify megatrends, inflexion points and weak signals.
3.4 MACROECONOMIC FACTORS
This chapter will go into which factors that possibly can affect the PE activity in a country.
Based on the PESTEL-framework, some of the main factors from both academic literature
and several PE reports have been chosen for further analysing.
3.4.1 Property Rights
Property rights is defined as “the exclusive authority to determine how a resource is used,
whether that resource is owned by government or by individuals. Society approves the uses
selected by the holder of the property right with governmental administered force and with
social ostracism” (Alchian, n.d.). Property rights protection is important for investors because
it secures the right to own properties, to earn income on that property, and to own the rights to
use resources. According to Levy-Carciente (2015), good property rights protection is
important to secure economic prosperity. Lack of property rights, or lack of legal enforcement
is the base of insecurity and fear. People that consider starting a business will in many cases
be more hesitant because of the fear that some will come and take what is rightfully theirs.
According to Demsetz (1967), “property rights convey the right to benefit or harm oneself or
others”. He emphasises this with an example where he explains that one cannot harm a
competitor by shooting him, but it is fine to harm him by selling superior products.
Boettke (2005) lists four important reasons for why property rights are important for
economic prosperity. First, Property rights provide the necessary certainty for property
owners. With these rights, the owners can safely commit their resources to ventures, without
the fear of confiscation by either private individuals or public officers. Second, in a society
with good property rights, the owners tend to make long term plans. The opposite is true for
nations without the same rights. This is because of the uncertainty that comes with weak
property rights – owners do not know how long they will have their property before anyone
could confiscate them. The third reason is that property rights provide the basis for exchange
of ownership for capital goods, and the basis for development of financial markets. The last
24
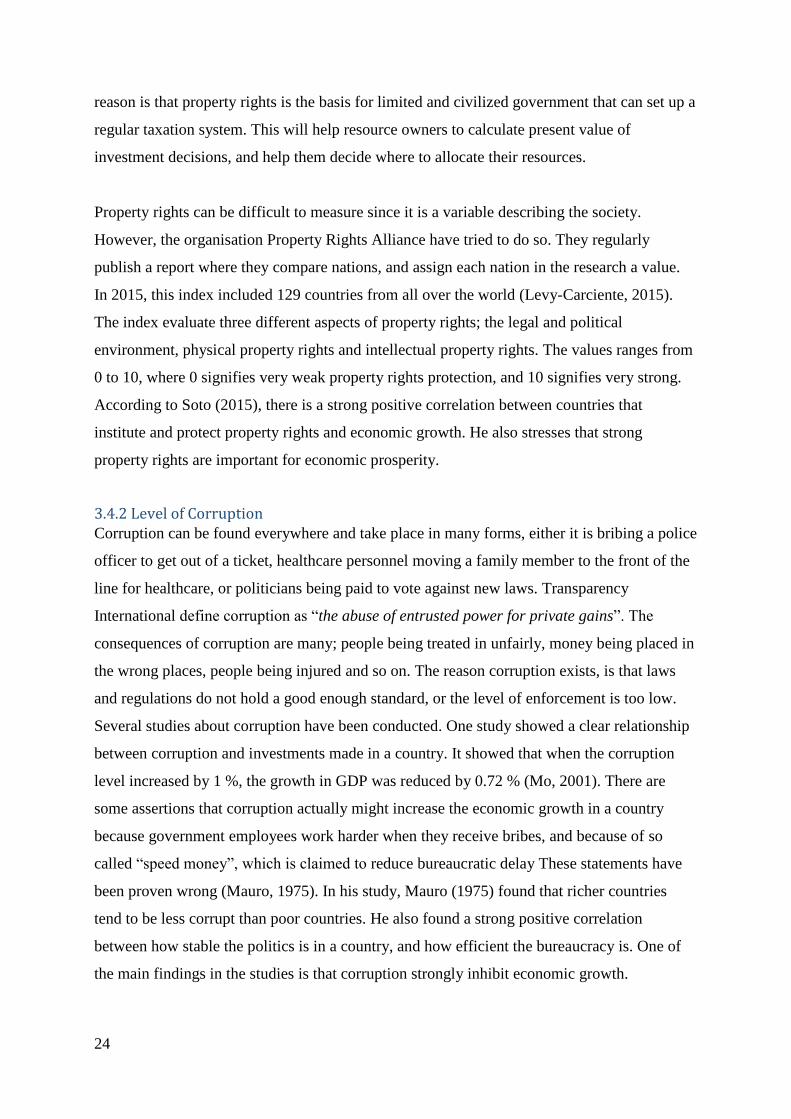
reason is that property rights is the basis for limited and civilized government that can set up a
regular taxation system. This will help resource owners to calculate present value of
investment decisions, and help them decide where to allocate their resources.
Property rights can be difficult to measure since it is a variable describing the society.
However, the organisation Property Rights Alliance have tried to do so. They regularly
publish a report where they compare nations, and assign each nation in the research a value.
In 2015, this index included 129 countries from all over the world (Levy-Carciente, 2015).
The index evaluate three different aspects of property rights; the legal and political
environment, physical property rights and intellectual property rights. The values ranges from
0 to 10, where 0 signifies very weak property rights protection, and 10 signifies very strong.
According to Soto (2015), there is a strong positive correlation between countries that
institute and protect property rights and economic growth. He also stresses that strong
property rights are important for economic prosperity.
3.4.2 Level of Corruption Corruption can be found everywhere and take place in many forms, either it is bribing a police
officer to get out of a ticket, healthcare personnel moving a family member to the front of the
line for healthcare, or politicians being paid to vote against new laws. Transparency
International define corruption as “the abuse of entrusted power for private gains”. The
consequences of corruption are many; people being treated in unfairly, money being placed in
the wrong places, people being injured and so on. The reason corruption exists, is that laws
and regulations do not hold a good enough standard, or the level of enforcement is too low.
Several studies about corruption have been conducted. One study showed a clear relationship
between corruption and investments made in a country. It showed that when the corruption
level increased by 1 %, the growth in GDP was reduced by 0.72 % (Mo, 2001). There are
some assertions that corruption actually might increase the economic growth in a country
because government employees work harder when they receive bribes, and because of so
called “speed money”, which is claimed to reduce bureaucratic delay These statements have
been proven wrong (Mauro, 1975). In his study, Mauro (1975) found that richer countries
tend to be less corrupt than poor countries. He also found a strong positive correlation
between how stable the politics is in a country, and how efficient the bureaucracy is. One of
the main findings in the studies is that corruption strongly inhibit economic growth.

25
To measure the level of corruption in a country, Transparency International’s Corruption
Perception Index is used. This is an index that Transparency International publish annually,
which ranks countries depending on how transparent their public sector is perceived to be.
The index for 2016 includes 167 countries. All of them are ranked between 0 and 100, where
100 indicate that the country has a very clean and transparent public sector, and 0 means that
the public sector is characterised by secrecy. Some interesting findings in this study is that
114 out of the 167 countries studied scores lower than 50 (Transparency International, 2015).
This is as much as 68% of the countries.
It is important to keep in mind that even though a country ranks high on the Corruption Index,
it can still be linked to corruption. The index only assess countries on a national basis, and
does not consider foreign businesses a country has, which might be related to corruption. One
example of such foreign business that has not been included in the index is TeliSonera, which
is partly owned by the Swedish government, and is facing corruption allegations for its
business in Uzbekistan (Transparency International, 2015). Transparency International (2014)
lists several impacts corruption can have on economic growth in a country, such as
misallocation of resources caused by distorted incentives, talented human resources being
drawn towards “lucrative” rather than productive activities and rent-seeking behaviour
creating inefficiencies in the society.
3.4.3 Legal System There are two major legal systems in the world, common law and codified Roman law (also
called civil code law, code law or civil law). Common law has its origin from England, and
was transferred to the countries England colonized from the 16th to the 18th century. Today,
common law is to be found in most English speaking countries. Civil law, on the other hand,
originated from Roman jus civil, and is followed in most non-English speaking countries
(Doupnik & Perera, 2015, p. 28). The foundations for these two legal systems are very
different. Common law was developed to provide strong property rights, and therefore it
limited the crown’s ability to affect the markets. Civil law, on the other hand, was developed
to limit judges interference in the market with the desire to use the state’s power to alter
property rights (Mahoney, 2001). One of the major differences between the two legal systems
is their approach to accounting. Typically, code law countries have corporation law and
accounting law. These are usually very general, does not provided detailed information about
specific accounting practices. Common law countries approach to accounting are more

26
affected by best practice-standards. Another major difference between the two legal systems,
is source of finance. While businesses in most common law countries mainly are financed by
shareholders, businesses in code law countries are predominately financed by banks, the
government or privately (Doupnik & Perera, 2015, p. 28).
It has been proven that there exists a relationship between legal system and economic growth.
A study conducted by Mahoney (2001) shows that this relationship is caused by common law
countries providing better protection for investors than civil law countries, which make them
less attractive to invest in.
Legal systems today are influenced by several cultural factors. There are several versions of
civil code law, i.e. Spanish, French and Roman. Most countries use a version of either
common law or civil code law, but with a customary modification according to the country.
Some countries are use a mix between common and civil law, or a mix of one of the legal
systems and religious law, such as Islamic law (CIA, n.d.). Information about legal system is
gathered from CIA (n.d.). For those countries that use a mix of either common or civil law
and another legal system, only one of the first two has been chosen for this study.
3.4.4 Taxation There are large variations in tax regulations and tax levels between countries. One of the
problems investors should avoid when investing internationally is double taxation. There are
three main approaches when determining jurisdiction for taxation, source of income,
citizenship and residence (Doupnik & Perera, 2015, p. 549). Taxation based on source of
income means that income is taxed where it is earned. Taxation based on citizenship means
that a person has to pay tax on earnings where he/she has a citizenship, no matter which
country the earnings are made. Taxation based on residence means that a person has to pay
tax to the country where he or she has permanent residence. To avoid double taxation,
investors should be aware of taxation rules when investing in foreign markets.
Taxation levels affect PE entries and exits in two ways. First, large differences in corporate
tax and personal income tax can create incentives for start ups, which create investment
opportunities. Second, it is possible that investors avoid countries with high tax rates, even
though the author has not found any research that shows any correlation between high tax
rates and PE investments in a country (Groh, Liechtenstein, Lieser, & Biesinger, 2015). Tax is

27
one of the most significant costs for businesses, which might create incentives for investing in
tax havens. A tax haven is defined by Doupnik and Perera (2015, p. 544) as “a jurisdiction
with abnormally low corporate income”. In our sample, we have included three countries that
can be considered as tax havens. These countries are Hungary, Switzerland and Lebanon with
corporate tax levels 10%, 12% and 15% respectively (EY, n.d.).
The information about corporate tax levels for all countries is gathered from EY’s Worldwide
Corporate Tax Guide. For most countries there are several regulations that have the possibility
to affect the final tax level, but to be able to quantify the data, these have not been included in
this study.
3.4.5 Growth Prospects A growing economy indicates a healthy and expanding economy. Growth in the economy is
often used as a reference to how well the economy is doing. When researches study how
different factors affect an economy, they often use growth in the economy (i.e. growth in
GDP or GDP per capita) as a measure.
Growth prospects has been included in this study as one of the independent variables for
several reasons. One of the reasons is that economic growth makes a market more attractive,
since it allows businesses to grow with the expanding market instead of growing on behalf of
other businesses (Johnson et al., 2014, p. 42). Economic growth is closely related to, and often
an indicator for, how well market is doing. Based on this, I wish to study if the expected
growth will affect PE investors’ decision-making.
Growth prospects is measured in expected growth in GDP, and the data is gathered from The
World Bank (n.d.). The World Bank provides growth prospects for the next three years. From
this, the average growth has been calculated.
3.4.6 Continent Continent is included as a control variable, as the study looks at countries from all parts of the
world. The data gathered about PE has mainly been collected from sources that have only
analysed one continent or region. Most data has been available about European countries. In
Oceania, New Zealand and Australia have been combined in to one factor because of the
difficulty of finding the correct numbers for each as separate countries. North America and

28
Oceania have been gathered to one group because of the similarities between the continents,
and because of the low number of countries in each continent. Some of the similarities
between these two continents are that they have a western culture, they both use common law
as legal system and the level of corruption is relatively low.
Table 1: Continent Frquency Table
Control: continent
Frequency Percent Valid Percent
Cumulative
Percent
Valid Europe 21 42,9 42,9 42,9
North America & Oceania 2 4,1 4,1 46,9
Asia 10 20,4 20,4 67,3
South America 6 12,2 12,2 79,6
Africa 10 20,4 20,4 100,0
Total 49 100,0 100,0
3.5 ANALYSING THE INDUSTRY, COMPETITORS AND THE ORGANISATION
After having analysed the macro environment, investors should look at the industry and
strategic group of the potential investee. A good analysis of the industry, competitors and the
organisation, can mean the difference between success and failure for a business. The
industry is defined by Johnson et al. (2014, p. 41-60) as “a group of firms producing products
and services that are essentially the same”, and can be analysed in several ways. One
approach is Michael Porter’s five forces framework, which looks at several industry related
factors. The stronger the forces are, the less attractive is the industry to invest in. Both
competitors and the organisation can be analysed by doing a thorough SWOT analysis.

29
Figure 8: Michael Porter’s Five Forces Framework
Source: (CCMA, 2013)
4. METHODOLOGY
4.1 DATA COLLECTION
Reports published by different PE organisations shows that the organisations emphasise
different factors when reviewing the period that has been and when making recommendations
for the coming period. From these factors, I have chosen to focus on level of corruption, legal
system, tax level and growth prospects. For this purpose, data has been collected from
secondary sources. This is due to restricted time and resources. Each source has been
carefully considered, and thought to be reliable. Data regarding legal system is collected from
CIA (n.d.), tax level from EY (n.d.), growth prospects from The World Bank (n.d.) and level
of corruption from Transparency International (2015). As opposed to legal system and tax
level, which are fixed values, level of corruption is how Transparency International perceive
corruption to be in countries, and can therefore be biased. To control for this, corruption level
has been compared to rankings that are believed to have a high correlation from other
independent organisations. The rankings from Transparency International have therefore been
compared to the IPRI Property Index, which should measure some of the same things
considering that property rights should be higher in a country where the level of corruption is
low.
30
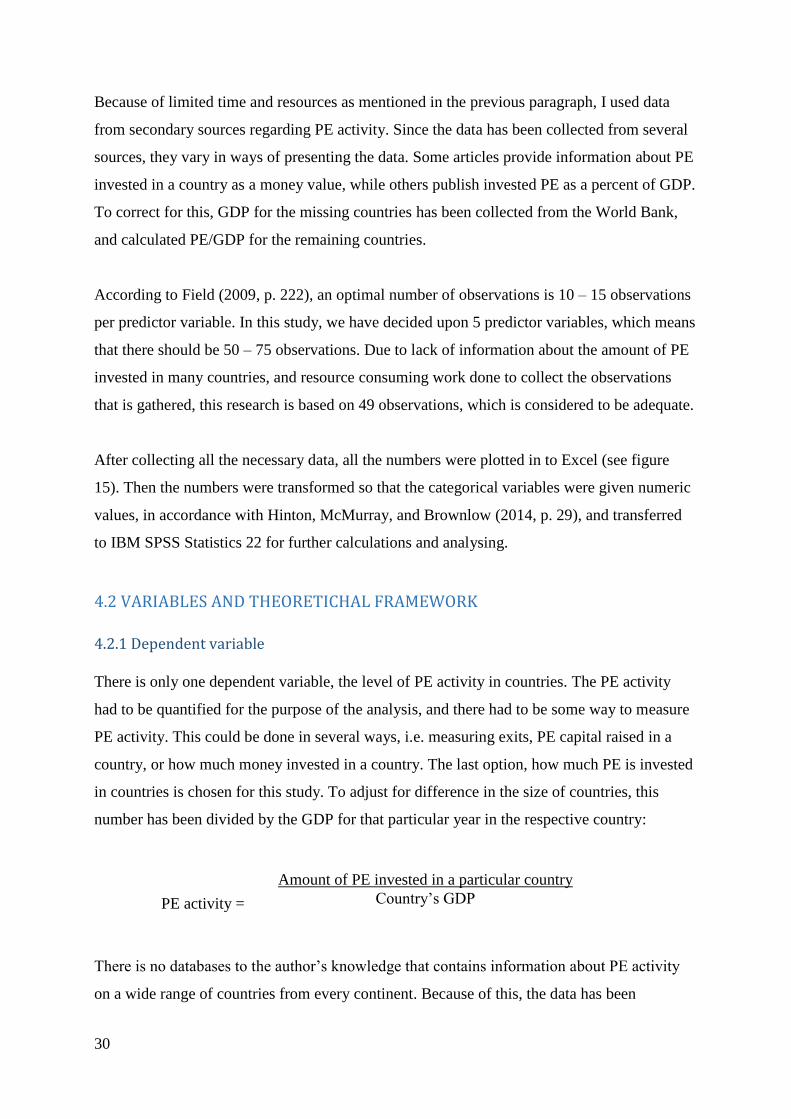
Because of limited time and resources as mentioned in the previous paragraph, I used data
from secondary sources regarding PE activity. Since the data has been collected from several
sources, they vary in ways of presenting the data. Some articles provide information about PE
invested in a country as a money value, while others publish invested PE as a percent of GDP.
To correct for this, GDP for the missing countries has been collected from the World Bank,
and calculated PE/GDP for the remaining countries.
According to Field (2009, p. 222), an optimal number of observations is 10 – 15 observations
per predictor variable. In this study, we have decided upon 5 predictor variables, which means
that there should be 50 – 75 observations. Due to lack of information about the amount of PE
invested in many countries, and resource consuming work done to collect the observations
that is gathered, this research is based on 49 observations, which is considered to be adequate.
After collecting all the necessary data, all the numbers were plotted in to Excel (see figure
15). Then the numbers were transformed so that the categorical variables were given numeric
values, in accordance with Hinton, McMurray, and Brownlow (2014, p. 29), and transferred
to IBM SPSS Statistics 22 for further calculations and analysing.
4.2 VARIABLES AND THEORETICHAL FRAMEWORK
4.2.1 Dependent variable
There is only one dependent variable, the level of PE activity in countries. The PE activity
had to be quantified for the purpose of the analysis, and there had to be some way to measure
PE activity. This could be done in several ways, i.e. measuring exits, PE capital raised in a
country, or how much money invested in a country. The last option, how much PE is invested
in countries is chosen for this study. To adjust for difference in the size of countries, this
number has been divided by the GDP for that particular year in the respective country:
There is no databases to the author’s knowledge that contains information about PE activity
on a wide range of countries from every continent. Because of this, the data has been
PE activity =
Amount of PE invested in a particular country
Country’s GDP
31
collected from different sources. The datasets on PE-money invested in countries have
contained information on amounts over different lengths of time. To correct this, the sum of
invested PE for a period was divided by the number of years in that period to find the average.
Then the average GDP for the same period of time was calculated. The average invested PE
was then divided on the average GDP.
4.2.2 Independent Variables
The independent variables are perceived level of corruption, tax level, expected growth rate
and legal system. The variable “investor protection” is also included for the purpose of testing
reliability, as it is believed to have a high positive correlation with the variable corruption.
Continent is included as a control variable.
Perceived Level of Transparency
Transparency International annually publish a report in which they rate countries accordind to
how corrupt they are perceived to be. The index rates countries on a scale from 0 – 100,
where 100 signifies a very clean and transparent public sector and 0 signifies a public sector
with no transparency. The thoughts behind the Corruption Perception Index is that the more
transparent the public sector is in a country, the less corruption will it be in that country. This
variable is included as an explanatory variable because corruption correlates negatively with
economic growth, and can therefor affect how attractive an investor consider a country to be.
A high level of transparency indicates a low level of corruption.
Tax level
It is la limited amount of literature that describes the relationship between tax level and
investment activity. However, tax is one of the most significant costs for a business, and
reduces both profit and cash flows (Doupnik & Perera, 2015, p. 541). This is why tax level is
included as an explanatory variable for investors’ decision-making.
Corporate tax level is measured as the percentage of corporate income.

32
Growth Prospects
According to Johnson et al. (2014, p. 41), markets will be more attractive to invest in if there
is growth in it. Businesses can grow with the expanding market and there will be less fight for
resources, compared to a market with no growth, or a declining economy. Growth prospects
are included to investigate if there is any connection between the forecasted growth in
countries and how much PE investors have invested in them. Data about growth prospects is
gathered from The World Bank (n.d.). The data shows the forecasted growth in GDP for the
next three years, and from this an average has been calculated.
Legal system
Legal system is included as an explanatory variable for two reasons. First, there is proven to
be a significant difference in earnings in common law and civil law countries (Mahoney,
2001). Second, there is a clear difference between source of finance in the two legal systems,
where businesses in common law countries are mainly financed by shareholders, while
banks, families and the government mainly finance businesses in civil law countries (Doupnik
& Perera, 2015, p. 28). This variable is included to see if countries attract investors based on
their legal system.
Continent
There is limited literature that shows a relationship between invested PE and continents.
However, it seems to be a clear distinction between the continents since most PE
organisations are region or specific. Also, several PE funds have specialised themselves on
one region or continent. Continent is included as a control variable to check whether or not
there exists any relationship between the amount of PE invested in a country and which
continent the respective country is in.
Investor protection
The variable investor protection is the combined effect of several factors, such as the level of
legal enforcement, the quality of legal institution, level of corruption and how developed the
property rights are. The measure used for investor protection is property rights. Property
rights is a measure of how well the legal rights, physical property and intellectual property is
protected in a country (Soto, 2015).
Data on property rights is collected from The International Property Rights Index 2015 (Levy-
Carciente, 2015). In the index 129 countries are rated from 0 -10, where 10 signifies that the
33
property rights in a country is exceptional and 0 is very poor property rights. Property rights is
a continuous variable at interval scale
4.3 RESEARCH DESIGN
During the time of research, a hypothetico-deductive method was applied. The hypothetico-
deductive approach is to start with a theoretical framework, derive hypotheses from it and
then test the hypotheses. This method was chosen because it seems more fitting than a fully
deductive or inductive approach. The hypothetico-deductive method consists of seven steps
according to Sekaran and Bougie (2013, p. 23):
3. Identify a broad problem area.
4. Define the problem statement.
5. Develop hypotheses.
6. Determine measures.
7. Collect data.
8. Analyse data.
9. Interpret data.
The first step is to decide the subject of this study. After doing some research, it has been
possible to narrow the subject down to a research question which is “Can variations in PE
activity between countries be explained by macroeconomic factors?”. Next, more specific
theory was studied, before a theoretical framework was developed. A theoretical framework is
the base for the hypothethico-deductive method, and is a model that shows the relationship
one believes to be between the variables (Sekaran & Bougie, 2013, p. 67). The theoretical
framework is showed in figure 11, which shows the independent variables that are believed to
have an effect on the dependent variable. A dependent variable is the variable of interest,
which variance we are trying to study, whereas an independent variable is a variable
influencing the dependent variable, and possibly causing the variations (Sekaran & Bougie,
2013, p. 67). The theoretical framework also shows control variables. The theoretical
framework is the foundation for the rest of the study, and is the base when developing
hypothesises.

34
4.4 HYPOTHESES
Based on the theoretical framework and the review of the macroeconomic factors above,
hypothesises can be developed. A hypothesis is a statement of the relationship one is
expecting to find between the variables (Sekaran & Bougie, 2013, p. 68). The hypotheses
developed are both directional and nondirectional. As we can see in the conceptual framework
in figure 11, we believe the level of transparency level and growth prospects to have a
positive influence on PE activity, and tax level to have a negative influence. The
nondirectional hypothesis will be the one about legal system since there is no expectations for
how this variable will influence the dependent variable. When using the hypothtico-deductive
method, the hypotheses should be falsifiable (Sekaran & Bougie, 2013, p. 24).
The first hypothesis is based on how the literature suggests that corruption hinders economic
development, and increases the risk when investing. Transparency International’s corruption
index measure how “transparent” a nation is. The less transparent a nation is, the more corrupt
is that nation perceived to be according to Transparency International (2015), hence there is
believed to be a positive relationship between transparency and PE activity:
H1: The higher the level of transparency in a country, the higher will invested PE be.
Taxation is also one of the factors suggested to have an impact on PE investments in a
country, but the author has still not found any empirical evidence for this. That is why the
second hypothesis is included:
H2: The higher the level of tax in a country, the lower will the amount of PE invested in that
country be.
The third hypothesis is included because a market is perceived as more attractive when the
economy is growing compared to a declining economy:
H3: Expected growth rate has a positive correlation with PE invested in a country.
The theory does not provide any evidence or research that suggests a correlation between
legal system and investments in a country, but the theory does provide proof that there is a

35
difference in how businesses are funded in countries. It is interesting to see whether this can
have an impact on the level of PE activity in a country:
H4: There is a clear difference in level of PE activity between common law and civil law
countries.
Figure 9: Hypothesises
Factor Impact on PE invested in a country
Transparency level +
Tax level -
Growth prospects +
Legal system +/-
Figure 10: Coneptual framework
4.5 ASSESMENT IF THE VARIABLES
The predictor variables in this study comes in the form of both discrete and continuous
variables. The difference between these two is that while continuous variables is expressed in
numbers (such as age and temperature), discrete variables come in the form of categories (i.e.
gender and country). Further on, the continuous variables come in different types of scales:

36
Table 2: Scales
Nominal scale Assigned numbers to categories (i.e.
gender). The numbers express groups that
are mutually exclusive and collectively
exhaustive.
Ordinal scale A ranking scale that differ between low and
high values (i.e. for measuring preferences).
However, there is no measure for the
distance between the numbers.
Interval scale A ranking scale that differ between low and
high values, where one can measure the
distance between the numbers. This scale
has no unique zero.
Ratio scale A ranking scale with a unique zero, where
the difference is equal between each
number.
Source: (Sekaran & Bougie, 2013, p. 211 - 218)
The predictor variable legal system and the control variable continent are both discrete
variables in which the categories have been assigned numbers from the nominal scale level.
The other variables, perceived level of corruption, tax level and growth prospects are
continuous variables.
4.5.1 Perceived level of corruption Data about level of corruption is gathered from Transparency International (2015). Each year
they publish an index that rates countries from 0 – 100 according to how corrupt their public
sector is perceived to be. A score of 100 signifies a very transparent public sector with little or
no corruption, while 0 signifies a very corrupt public sector. Perceived level of corruption is a
continuous variable at ratio scale.
4.5.2 Tax level Data about corporate tax level is gathered from EY (n.d.), and is measured as a percentage of
corporate income. Tax level is a continuous variable at ratio scale.

37
4.5.3 Growth Prospects Growth prospects is a the annual percentage the GDP is expected to grow over the next three
years (The World Bank, n.d.). To fit this into this study, the average growth rate is calculated.
Growth prospects is a continuous variable at ratio scale.
4.5.4 Legal system Legal system is a dichotomous variable. We differ between 0 = Civil Code Law and 1 =
Common Law.
Table 3: Legal system
Common law 0
Civil law 1
4.5.5 Continent Continent is also a dichotomous variable with the values 0 = Europe, 1 = North America and
Oceania, 2 = Asia, 3 = South America and 4 = Africa. To adapt this to the statistical analyses,
dummy variables are created, which will be further explained in the statistical analysis part.
Table 4: Continent
Europe 0
North America 1
Asia 2
South America 3
Africa 4
4.5.6 Investor Protection Investor protection is not included as one of the independent variables because it is expected
to measure roughly the same as perceived level of corruption. The reason this variable is
included, is to use it as a reliability measure for the corruption-variable. Investor protection is
measured on a scale from 0-10, where 0 indicates little protection and 10 indicates very good
protection for investors (Levy-Carciente, 2015).

38
4.6 AN OVERVIEW OF THE VARIABLES
Table 5: The Variables
Source: (African Private Equity and Venture Association (AVCA), 2015a, 2015b, 2015c; Alpha, 2012;
Bain & Company, 2016; CIA, n.d.; Commission, 2015; European Private Equity & Venture Capital
Association, 2014; EY, n.d.; Investments, n.d.; Levy-Carciente, 2015; The World Bank, 2015, n.d.;
Transparency International, 2015)

39
Table 6: An overview over the variables in table 5
PE/GDP Growth
Prospects
IPRI
Property
Index
Transparany
Level
Tax Level
Lowest Bulgaria,
0.01 %
Brazil,
0.13 %
Nigeria,
3.4 points
Kenya &
Uganda,
25
Bulgaria &
Hungary,
10 %
Highest United States,
1.27 %
India,
7.86 %
Switzerland,
8.3 points
Denmark,
91
Argentina,
35 %
Average, all
countries
0.27 % 3.19 % 6.1 points 56.41 23.67 %
Average for
Europe
0.256 % 2.27 % 7.07 71.62 21.30 %
Average for
North
America and
Oceania
1.113 % 2.55 % 7.65 78 32.00 %
Average for
Asia
0.299 % 3.51 % 5.71 48.9 21.28 %
Average for
South
America
0.717 % 2.53 % 4.97 41.33 26.25 %
Average for
Africa
0.192 % 5.32 % 4.83 36.7 27.60 %
The table in figure 16 shows a simple overview of the values for the different variables. What
we can see, is that western countries such as European countries, the US, Australia and New
Zealand rates significantly higher on Transparency International and IPRI’s indexes, which
are related to corruption and quality of legal enforcement. It is also a distinct difference
between the continents when it comes to future growth prospects, where the estimated growth
is about twice as high for African countries than for European countries, the US and Oceanic
countries. As for tax levels, European and Asian countries have the lowest average tax, and
the US and Oceania the highest. One should also notice the variations in PE/GDP between
continents, which rates from 0.192 % - 1.113 %. These relations are going to be analysed in
the following paragraphs to see whether the independent variables play a role in the variations
in PE/GDP, or if the values are random.
40
4.7 RELIABILITY AND VALIDITY To find out whether or not or our measures are actually measuring the concepts we want them
to, we check the validity and reliability. Reliability is a test to check the consistency of what
we are measuring, while validity is a test to see if we actually measure the concepts we want
to measure (Sekaran & Bougie, 2013, p. 225 - 229).
4.7.1 Reliability The variables tax level, legal system and continent are fixed values. These variables cannot be
particularly influenced by bias, so they are considered to be reliable.
For testing the reliability of perceived level of corruption, a parallel-form reliability test has
been used (Sekaran & Bougie, 2013, p. 229). This reliability test compares two data sets that
are believed to measure the same concept, and a high correlation indicate that the data set are
reliable. The perceived level of transparency for each country in this study has been compared
to another data set which are believed to have similar measures. This data set is IPRI’s
Property Index. These data sets are believed to measure the same concepts because strong
property rights can is only possible in places where there exists a good legal framework, and
the quality of legal enforcement is strong. A nation with a high level of corruption will not
have these factors in place. Both the data set from Transparency International and IPRI are
based on research undertaken by different, independent organisations. These data sets have
correlation 0,964, and are highly correlated (the correlation matrix can be found in the
appendix). This indicate that the variable is reliable.
For the last variable, growth prospects, there is no obvious way to measure reliability, since it
is an estimate. However, this data is a forecast by the World Bank, a well known organisation
that has a lot of influence on the world economy, and that is considered a reliable source in.
4.7.2 Validity Validity is if we are measuring what we want to measure. In other words, that our measuring
instrument is not significantly affected by bias. Validity tests are commonly placed in three
categories; content validity, criterion-related validity and construct validity (Sekaran &
Bougie, 2013, p. 225-228). The first category, content validity, tests that the measuring
instrument measures what it should measure with high accuracy, and not other concepts. Face
41
validity is one type of content validity, and is a validity test where experts on the subject
evaluate the measuring instrument (Sekaran & Bougie, 2013, p. 225-228). The second
category, criterion-related validity, is concerned with if the measures are what they are
expected to be (Sekaran & Bougie, 2013, p. 225-228). The third category, construct validity,
is according to Sekaran and Bougie (2013, p. 227) “how well the results obtained from the use
of the measure fit the theories around which the test is designed”. Construct validity can be
assessed through convergent and discriminant validity. The first of the two, convergent
validity, is that the results highly correlate with other instruments measuring the same
concept. The second, discriminant validity, is obtained when the measure does not correlate
with tests it is not believed to correlate with.
5. STATISTICAL ANALYSIS
As explained in the section about methodology, the data was first put into Excel, and then
adapted to and transferred to IBM SPSS statistics 2. For further analysing, multilinear
regression is considered to be the best suited method, since we wish to look at the impact the
predictor variables have on the dependent variable. According to Løvås (2015, p. 299),
multilinear regression is a tool that helps us find the best linear correlation between the
predictor variables and the dependent variable.
5.1 CORRELATION ANALYSIS
Before conducting a multilinear regression analysis, one can carry out a bivariate correlation
analysis to check the independent relationship between each predictor variable and the
criterion variable, to see if the relationship is significant. The significance level is 0.05. Two
variables can have a correlation coefficient that ranges between -1 to 1. A correlation
coefficient equal to 1 means perfect correlation, while -1 means that the variables are
perfectly negatively correlated. A correlation equal to 0 means that the variables are not
correlated at all.
One way to measure the linear relationship between variables is Pearson’s correlation,
denoted as r. When using Pearson’s correlation, certain criteria must be met (Hinton et al.,
2014, p. 298):
- The data has to be at interval or ratio, from continuous distributions
- The relationship between the variables should be linear
42
- The points are evenly distributed along a straight line
- The samples are drawn from normally distributed populations
If any of these criteria is not met, one can use Spearman’s correlation or Kendall’s tau if one
have a small data set (Field, 2009, p. 177). Spearman’s correlation matrix can be found in the
appendices.
5.2 Multiple Linear Regression
According to Studenmund (2014, p 5), regression analysis is a tool to make quantitative
estimates of relationships that previously have only been completely theoretical in nature. The
main objective of such an analysis is to see how the dependent variable moves when the
values of the independent variables change. In this study, we want to see how PE/GDP varies
between countries according to what values the independent variables (growth prospects,
corruption level, legal system and tax level) have.
A single-equation regression model is the simplest kind of regression model. With this, one
can test the effect one variable has on another. This linear line can be written as (Studenmund,
2014, p. 7):
Y = α + β1X (1)
Where α and β1 are coefficients and are constant numbers. α is called the intercept, and shows
at which value X is equal to zero. β1 represents the slope coefficient, and shows how much Y
will increase if X increases with one unit (Studenmund, 2014, p. 7). We can further increase
this model by including more independent variables. It will then become a multiple regression
model.
Multiple regression is a tool that allows one to look at the impact of more than one predictor
variable on the criterion variable at the same time, and finds the best linear relationship
between these (Hinton et al., 2014, p. 325). If n is the amount of observations, the linear
relationship can be written as (Løvås, 2015, p. 299):
Yi = α + β1x1i + β2x2i + β3x3i + … + βnxni + ei (2)
43
The α and the βs are the coefficients. All the coefficients have constant values, and have to be
estimated. For this purpose, the ordinary least square method will be used. In the expression
(2) above, x1i, x2i, xi3, …, xni are the explanatory variables, where xi is the ith observation of
the dependent variable (Studenmund, 2014, p. 12).
The last variable in the equation, ei, is the stochastic error term (Studenmund, 2014, p. 12).
This variable represents variance in the equation that cannot be explained by the other
variables, and is the difference between the observed Y and the estimated Y (Studenmund,
2014, p. 16).
Studenmund (2014, p. 98) lists assumptions that must be met in order for OLS estimators to
be the best available:
I. The regression model is linear, is correctly specified, and has an additive error term.
II. The error term has a zero population mean.
III. All explanatory variables are uncorrelated with the error term.
IV. Observations of the error term are uncorrelated with each other (no serial correlation)
V. The error term has a constant variance (no heteroskedaticity).
VI. No explanatory variable is a perfect linear function of any other explanatory
variable(s) (no perfect multicollinearity).
VII. The error term is normally distributed.
Adapting equation (2) into this research, this gives us this equation:
(3)
(PE/GDP)i = α + β1Growthi + β2Transparencyi + β3Taxi + β4LegalSystemi +
β5Continenti + ei
However, if a nominal variable is to be used in a multiple linear regression, they have to be
assigned the values “0” or “1”. Nominal variables with more than two variables have to be
decoded to fit the model because multiple linear regression cannot handle nominal variables
with more than two levels. According to Field (2009, p. 254), one can do this by creating new
variables where one is assigned “1”, and the rest “0”. One have to do this for all the values in
the dichotomous variable. In this research, Continent is the variable that will have to be
decoded. The five new variable will then look like this:

44
Table 7: Continent Decoded
Dummy
1
Dummy
2
Dummy
3
Dummy
4
Dummy
5
Europe 1 0 0 0 0
North America and Oceania
(NA&Oc)
0 1 0 0 0
Asia 0 0 1 0 0
South America (SA) 0 0 0 1 0
Africa 0 0 0 0 1
When we insert this into equation (3), we have to leave out one of the dummy variables. The
one we leave out is called the comparison variable, and is the one we compare all the other
variables to. Often, such a comparison variable is the one with the highest population (Field,
2009, p. 254). In our case, this will be Europe (see frequencies table in appendix). The new
equation will then look like:
(4)
(PE/GDP)i = α + β1Growthi + β2Transparencyi + β3Taxi + β4LegalSystemi +
β5NA&Oci + β6Asiai + β7SAi + β8Africai + ei
5.2.1 Ordinary Least Square
An ordinary least square approach has been applied. Ordinary least square (OLS) method has
been used to minimize the random error, or in other words, the sum of squared residuals.
Løvås (2015, p. 288) explains OLS as the line that gives the smallest sums of squares. If you
plot all observations into a coordinate, and you draw a straight line between them, the OLS
method is to find that line that gives the smallest sum of the areal of the squares between the
line and the plots.

45
Figure 11: Ordinary Least Square-model
Source: (Løvås, 2015, p. 289)
5.2.2 The Enter Method When analysing the numbers in SPSS Statistics, the enter method is used. This is because we
want to see the effect all the explanatory variables have on the independent variable, instead
of letting the program choose the most relevant variables for us. The enter method allows us
to test all the predictor variables at once. (Hinton et al., 2014, p. 328). In his book, Field
(2009, p. 541) recommend a method where the approach is to run one regression analysis, and
see which predictors that contribute substantially to the model’s ability to predict the
outcome. Then one should do another regression analysis, and only include the important
variables. However, to get a complete overview of all the independent variables effect on the
dependent variable, the enter method has been used so that all the independent variables have
been included. The result from the regression analysis, using the enter method in SPSS 22, is:

46
Table 8: Correlation Matrix from SPSS

47
From the figure we can see that the variables considered to be significant at a 95 %
confidence interval are transparency level, legal system and tax level. For the purpose of this
study, all variables will be included, even if they have a significance value under 0.05.
Alternatively, we could have used other methods to exclude these, such as a stepwise method
which adds one and one variable according to how well they correlate with the dependent
variable. From the table in figure 19, we can see that the variable growth prospects barely
correlate with PE/GDP, and that it is not a significant variable at a 95 % confidence level.
Table 9: Model Summary from SPSS
Further, on, we can see that the correlation between all the variables, R, is 0.816, and that the
adjusted R2 is 0.595 in figure 20. This indicates that the current model explains 59.5 % of the
variance in this model. When running the test without growth prospects as an independent
variable, which is the variable with the least significance in the model, adjusted R2 is reduced
to 0.582 – which signifies that this variable does not have a large effect on the outcome if it is
included in the model.
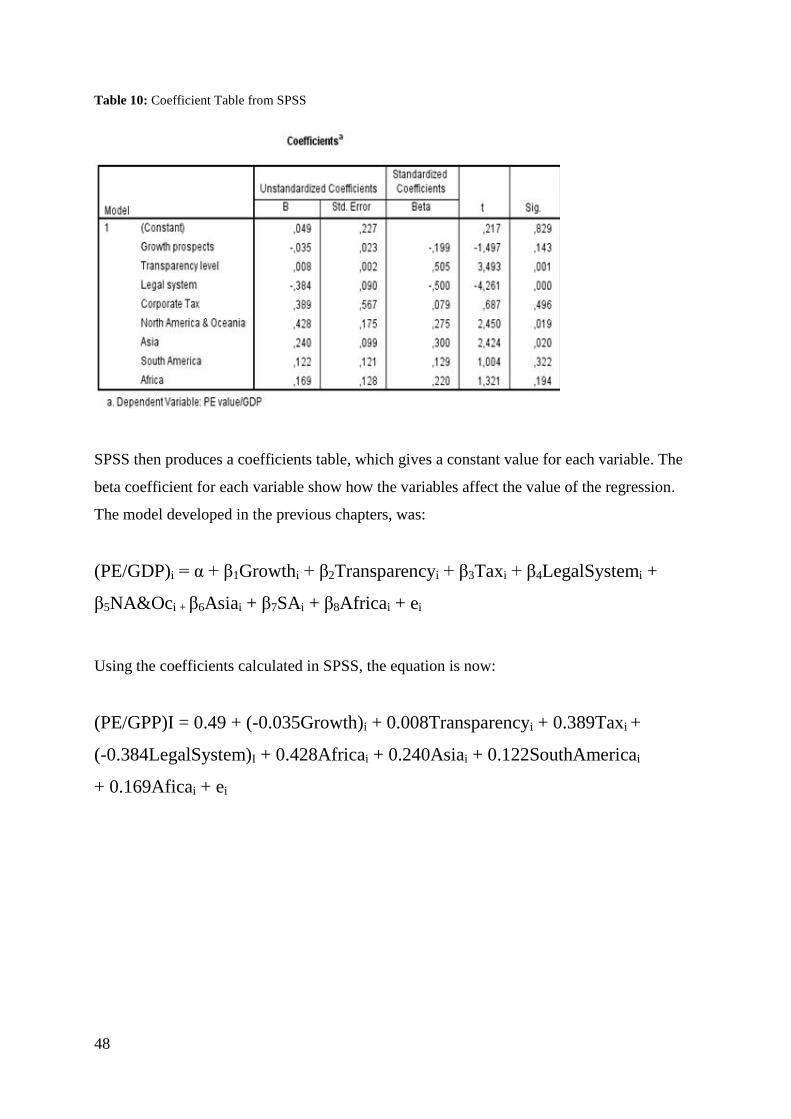
48
Table 10: Coefficient Table from SPSS
SPSS then produces a coefficients table, which gives a constant value for each variable. The
beta coefficient for each variable show how the variables affect the value of the regression.
The model developed in the previous chapters, was:
(PE/GDP)i = α + β1Growthi + β2Transparencyi + β3Taxi + β4LegalSystemi +
β5NA&Oci + β6Asiai + β7SAi + β8Africai + ei
Using the coefficients calculated in SPSS, the equation is now:
(PE/GPP)I = 0.49 + (-0.035Growth)i + 0.008Transparencyi + 0.389Taxi +
(-0.384LegalSystem)I + 0.428Africai + 0.240Asiai + 0.122SouthAmericai
+ 0.169Aficai + ei
49
6. DATA ANALYSIS AND RESULTS
6.1 MULTIPLE LINEAR REGRESSION – MEETING ASSUMPTIONS
Before going any further, the assumptions for multiple linear regression has to be checked.
The first assumption is that all predictor variables have to be quantitative or categorical, and
the outcome variable should be quantitative and unbound, meaning that there should not be
anything limiting the variability of the outcome (Field, 2009, p. 247-251). Both the criteria for
the predictor variables and the dependent variable are met.
Second, there should be some variation in the value of all predictor variables (Field, 2009, p.
247-251). This is tested by comparing means in SPSS.
The third criteria is that there is no perfect multicollinearity (Field, 2009, p. 247-251). If any
of the variables have a higher correlation than 0.8, the relationship will be investigated to see
if this is multicollinearity. By using the correlation tool in SPSS, we find that the highest
correlation between two variables is 0,632, using Spearman’s correlation (in the appendix)
since the assumption about only interval and ratio level for Pearson’s correlation is violated.
This correlation is between the variables PE/GDP and perceived corruption level.
The fourth assumption is that the independent variables do not correlate with any external
variables (Field, 2009, p. 247-251).
The fifth assumption is the assumption about homoscedasticity – that the variance should be
relatively equal at each level for the predictors (Field, 2009, p. 247-251). One can check for
homoscedasticity by looking at a scatterplot with the standardised residual on one side, and
the standardised predicted value on the other, where the dots should be evenly dispersed
(Field, 2009, p. 247-251). This scatterplot is included in the appendix, and it clearly shows
that the dots are not evenly spread out, but gathered in a cluster in the down left corner, and
funnels out a bit towards the right side. This indicates heteroscedasticity – that the variance is
not equal at all levels of the predictor variable.
The sixth assumption is that error should be random (Field, 2009, p. 247-251). In other words,
the residual terms should be uncorrelated. This assumption can be tested with the Durbin-
Watson test. The test gives a correlation value from 0 – 4, where 2 indicates no correlation,
and 0 and 4 indicates highly positive or negative correlation. Running the Durblin-Watson test
in SPSS, the Durblin-Watson correlation is 2,317, which is fairly close to 2, and acceptable in
this test. The Durbin-Watson test can be found in the appendices. This test can only test

50
continuous variables – it needs some sort of order in the variables. Because of this, the
dichotomous variables legal system and continent are excluded.
The last assumptions for multiple linear regression is linearity (a linear relationship between
the predictor variables and the outcome variable), normally distributed errors, and
independence in the outcome of the variable (Field, 2009, p. 247-251). The normality of error
can be checked with the histogram which can be found in the appendix. When the residual is
normally distributed, the line in the histogram should have a bell shape (Field, 2009, p. 247-
251). The histogram is bell shaped, but a little skewed, which implies that there is some error.
This can also be seen in the normal probability plot in the appendix, which should lay as close
to the line as possible.
There are some violations of the assumptions. The model can however be used to draw
conclusions about the sample, but the regression cannot be generalized (Field, 2009, p. 251).
6.2 TESTING HYPOTHESES There are two ways for testing how good the model and the variables are, a F-test and a T-
test. The F-test concentrates on all the variables’ effect on the dependent variable, while the
T-test focuses on each variables independent effect on the independent variable.
6.2.1 Testing the overall effect – F-test First, we are going to look at the F-value. When conducting a F-test, one have two
hypothesises:
H0: B1 = B2 = B3 = … = Bx = 0 There is no relationship between the independent and
dependent variables in the model.
HA: One or more slope coefficients (B1, B2, B3…) have an effect on the independent variable.
Table 11: ANOVA-table
ANOVAa
Model Sum of Squares df Mean Square F Sig.
1 Regression 3,089 8 ,386 9,433 ,000b
Residual 1,556 38 ,041
Total 4,645 46
a. Dependent Variable: PE value/GDP
b. Predictors: (Constant), Africa, North America & Oceania, South America, Asia, Legal system,
Corporate Tax, Growth prospects, Transparency level

51
From the ANOVA table in figure 22 we can see that the F-value 9.433 is significant at
p < 0.001. This tells us that it is less than 0.1 % chance of the F-ratio being this high if the
null hypothesis was true (Field, 2009, p. 207). This supports the hypothesis about one or more
of the independent variables having an effect on the dependent variable.
6.2.2 Testing for individual significance – T-test
For an independent variable to have an effect on the dependent variable, the slope coefficient
should must be different from 0. What the t-test does, is to test if the observed value of the
dependent variable would be likely to occur even if the b-value (the slope coefficient) of an
independent variable was 0 (Field, 2009, p. 208). The hypotheses for the t-test are:
H0: β = 0 the independent variable have no effect on the dependent variable
HA β ≠ 0 the independent variable have an effect on the dependent variable
This study uses a 0.05 significance level, which means that the null hypothesis is rejected if
the p value is equal to or lower than 0.05
Table 12: Coefficients Table

52
Hypothesis 1: “The higher level of transparency in a country, the higher will invested PE
be”.
From the correlation matrix in figure 22, we see that transparency is the independent variable
with the second highest correlation with PE/GDP, and with a significance value of 0.01. The
significance value supports that the level of transparency has an effect on PE/GDP.
Furthermore, the positive correlation of 0.424, which can be found in the correlation matrix,
indicate that this effect is positive – that investors invest more in countries with a high level of
transparency.
Hypothesis 2:” The higher level of tax in a country, the lower will the amount of PE invested
in that country be”.
The significance value for the variable tax level is 0.496, and we cannot reject the null
hypothesis. We can therefore not support that tax level affects how much PE that is invested
in a country.
Hypothesis 3: Expected growth rate has a positive correlation with PE invested in a country.
The independent variable growth prospects has a p-value of 0.143 > 0.05. Based on this we
cannot reject the null hypothesis, or support that growth rate has an effect on PE/GDP in a
country.
Hypothesis 4: There is a clear difference in level of PE activity between common law and
civil law countries.
The independent variable legal system has a p-value of 0.000. Since 0.000 < 0.005, we can
reject the null hypothesis, and support the hypothesis about legal system having an effect on
how much PE is invested in a country. As mentioned in the chapter about variables, legal
system is a dummy variable with the values 0 and 1, where 0 represent common law countries
and 1 represent civil law countries. The slope coefficient for legal system is -0.384, which
indicates that there is less PE invested in civil law countries.

53
7. DISCUSSION, CONCLUSION, LIMITATIONS AND SUGGESTION FOR
FURTHER RESEARCH
7.1 DISCUSSION
The theory does not state any macro economic factors that are more likely to have an
influence on investors decision making than others, or that analyses how the macroeconomic
environment can impact PE activity in a country . However, going through the statistical
analysis, there were some macroeconomic factors that stood out.
Several research articles have found that corruption affects investments negatively, which
increased the expectations for how much this variable would affect PE activity. After
conducting the statistical analysis, the results clearly shows that this is the case in this study
to.
Earlier research has shown that there is a difference between the source of financing between
common and civil law countries, where financing from shareholders is more common in
common law countries, while banks and private funding is more common in civil law
countries. This variable was included to see if this had any effect on PE investors’
preferences. It was also included because theory stated that earnings normally are higher for
investors in common law countries. After doing the statistical analysis, the results showed that
legal system has the highest correlation with PE activity amongst the independent variables,
and is the variable with the biggest influence on PE.
The theory did not show any clear relationship between tax level and PE activity in countries.
Still, tax is one of the biggest costs for businesses, and the theory does indicate that some
businesses invest in countries with lower tax levels to reduce costs. The regression did not
show a significant relationship between tax level and PE activity.
The last independent variable, growth prospects, was included because theory stated that
attractiveness in a market would be higher in a country with growth than one with no growth.
This variable is only a forecast, and it is no way of knowing if what the actual growth in GDP
will be for the coming years. The regression analysis did not show any statistical relationship
between growth prospects and PE activity.

54
7.2 CONCLUSION
The aim of this study was to see if there existed any relationships between PE activity in a
country and any country specific factors. To specify, I wanted to answer the question “Can
variations in PE activity between countries be explained by macroeconomic factors?”. The
theory suggested several potential factors from which I chose to analyse four of them. Two of
the four factors showed a significant relationship with PE activity. These factors were
perceived level of corruption (or perceived level of transparency) and legal system. For
corruption level, the statistical analysis showed that a 1% increase in corruption level
decreases invested PE/GDP by 0.08%. It also showed that invested PE is significantly higher
in common law countries than it is in civil law countries. The statistical model showed that
59,5% of the variations (adjusted r2 = 0,595) in invested PE in a country could be explained
by the independent factors in the model, indicating that the model has a high explanatory
power.
6.4 SUGGESTIONS FOR FURTHER RESEARCH
In this study, we are only looking at the relationship between macroeconomic factors and PE
activity in countries. It would be interesting to see if the independent variables in this study
actually have an effect on PE investors outcome, hence if investors have a higher return in
common law countries and countries with little or no corruption.
Another idea for further research is to get the perspective of investors. By interviewing
investors or giving them questionnaires, one could get some insight in what they consider
important when looking for investment opportunities. Doing that, one could also examine
which reasons they have for investing in PE compared to other investment opportunities, such
as stocks and bonds.

55
REFERENCES
African Private Equity and Venture Association (AVCA). AVCA Spotlight on East Africa
Private Equity. Retrieved January 14th, 2016, from http://www.avca-
africa.org/product/avca-spotlight-on-east-africa-private-equity/
African Private Equity and Venture Association (AVCA). (2015a). AVCA Spotlight on North
Africa Private Equity.
African Private Equity and Venture Association (AVCA). (2015b). AVCA Spotlight on
Southern Africa Private Equity.
African Private Equity and Venture Association (AVCA). (2015c). AVCA Spotlight on West
Africa Private Equity.
Alchian, A. A. (n.d.). Property Rights. 2nd. Retrieved 27.05, 2016, from
http://www.econlib.org/library/Enc/PropertyRights.html
Alpha, A. A. (2012). Jean-Paul Sartre Comments on New Asian PE Boom. Retrieved 14.03,
2016, from http://www.allaboutalpha.com/blog/2012/09/10/jean-paul-sartre-
comments-on-new-asian-pe-boom/
Bain & Company. (2016). Global Private Equity Report 2016 Retrieved from
http://www.bain.com/bainweb/PDFs/Bain_and_Company_Global_Private_Equity_Re
port_2016.pdf
Boettke, P. (2005, April 2005). The Role of Private Property in a Free Society. Retrieved
04.02, 2016, from http://www.virginiainstitute.org/viewpoint/2005_04_2.html
CCMA. (2013). Porter’s five forces of competitive position analysis. Retrieved 06.05, 2016,
from http://www.cgma.org/Resources/Tools/essential-tools/Pages/porters-five-
forces.aspx?TestCookiesEnabled=redirect
Cendrowski, H., Martin, J. P., & Petro, L. W. (2012). Wiley Finance : Private Equity :
History, Governance, and Operations (2nd Edition). Somerset, NJ, USA: John Wiley
& Sons.
CIA. (n.d.). The World Fact Book. Retrieved 11.03, 20016, from
https://www.cia.gov/library/publications/the-world-factbook/fields/2100.html
Commission, E. (2015). Commision Staff Working Document. Retrieved 05.03, 2016, from
http://eur-lex.europa.eu/legal-
content/EN/TXT/HTML/?uri=CELEX:52015SC0183&from=EN
Demsetz, H. (1967). Toward a Theory of Property Rights. The American Economic Review,
57(2), 347-359.
Doupnik, T., & Perera, H. (2015). International Accounting (fourth edition ed.): McGraw-Hill
Education.
European Bank for Reconstructing and Development. (2015). Transition Report 2015-2016
Trends and Value Creation in Private Equity Retrieved from
http://webcache.googleusercontent.com/search?q=cache:9AAGeP759KAJ:www.ebrd.
com/documents/oce/pdf-transition-report-201516-private-
equity.pdf+&cd=1&hl=no&ct=clnk&gl=no
European Central Bank. (2005). Annual Report 2004 Retrieved from
https://www.ecb.europa.eu/pub/pdf/annrep/ar2004en.pdf?4cc01c9b5ba4f31492c002bd
7b5c954e
European Commission. (n.d., 21.04.2016). The EU Emissions Trading System (EU ETS).
Retrieved 07.05, 2016, from http://ec.europa.eu/clima/policies/ets/index_en.htm
European Private Equity & Venture Capital Association. (2005). EVCA Corporate
Governance Guidelines Guidelines and good practice in the management of privately

56
held companies in the private equity and venture capital industry Retrieved from
http://www.investeurope.eu/uploadedFiles/Home/Toolbox/Industry_Standards/evca_c
orporate_governance_guidelines_2010.pdf
European Private Equity & Venture Capital Association. (2014). European Private Equity
Activity.
EY. (n.d.). 2015 Worldwide Corporate Tax Guide. Retrieved 11.03, 2016, from
http://www.ey.com/GL/en/Services/Tax/Worldwide-Corporate-Tax-Guide---Country-
list
Field, A. (2009). Discovering Statistics using SPSS (and sex and drugs and rock 'n' roll)
(Third edition ed.): SAGE publications Ltd.
Gray, S. J. (1988). Towards a Theory of Cultural Influence on the Development of
Accounting Systems Internationally. 24 (1), 1-15. doi:10.1111/j.1467-
6281.1988.tb00200.x
Groh, A., Liechtenstein, H., Lieser, K., & Biesinger, M. (2015). The Venture Capital &
Private Equity Country Attractiveness Index. Retrieved 25.01, 2016, from
http://blog.iese.edu/vcpeindex/profiles/
Hinton, P., McMurray, I., & Brownlow, C. (2014). SPSS Explained Retrieved from
http://bibsys-
almaprimo.hosted.exlibrisgroup.com/primo_library/libweb/action/dlSearch.do?vid=U
BA&institution=UBA&institution=UBA&search_scope=default_scope&lang=nor&pr
efLang=no_NO&afterPDS=true&check=checked&query=any,contains,spss+explaine
d&SearchButton=
Investments, S. (n.d.). Theory & Market Data.
Johnson, G., Whittington, R., Scholes, K., Angwin, D., & Regner, P. (2014). Exploring
Strategy (Tenth edition ed.): Pearson.
Levy-Carciente, D. S. (2015). 2015 International Property Rights Retrieved from
https://s3.amazonaws.com/ipri2015/2015+IPRI+final.pdf
Løvås, G. G. (2015). Statistikk for universiteter og høyskoler (3. utgave ed.):
Universitetsforlaget.
Mahoney, P. G. (2001). The Common Law and Economic Growth: Hayek Might Be Right.
The Journal of Legal Studies, 30(2), 503-522.
Mauro, P. (1975). Corruption and Growth. The Quarterly Journal of Economics, 110(3), 681-
712.
MENA Private Equity Association. (2015). MENA Private Equity and Venture Capital Report
2014 Retrieved from
http://www2.deloitte.com/content/dam/Deloitte/xe/Documents/finance/me_fa_9th_M
ENA_Private_Equity_and_Venture_Capital_Annual_Report_2014.pdf
Minkov, M., & Hofstede, G. (2011). The Evolution of Hofstede's Doctrine. Cross Cultural
Management: An International Journal, 18(1), 10-20. doi:
10.1108/13527601111104269
Mo, P. H. (2001). Corruption and Economic Growth. Journal of Comparative Economics, 29,
66-79. http://ac.els-cdn.com/S0147596700917037/1-s2.0-S0147596700917037-
main.pdf?_tid=5008a132-087f-11e6-94f5-
00000aacb35f&acdnat=1461325537_704b59d4d01395838ee628a49834c1cc
doi::10.1006/jcec.2000.1703
OECD. (2013). OECD Factbook 2013: Economic, Environmental and Social Statistics.
Retrieved 20.04, 2016, from http://www.oecd-ilibrary.org/sites/factbook-2013-
en/04/02/01/index.html?itemId=/content/chapter/factbook-2013-34-en

57
Preqin. (2015). 2015 Preqin Global Private Equity & Venture Capital Report Retrieved
from https://www.preqin.com/docs/reports/2015-Preqin-Global-Private-Equity-and-
Venture-Capital-Report-Sample-Pages.pdf
Sekaran, U., & Bougie, R. (2013). Research methods for business : a skill-building approach
(6th ed. ed.). Chichester: Wiley.
Soto, H. D. (2015). Introduction. Retrieved 16.05, 2016, from
http://internationalpropertyrightsindex.org/introduction
Studenmund, A. H. (2014). Using Econometrics: A Practical Guide (Sixth edition ed.):
Pearson Education Limited
The World Bank. (2015). GDP at Market Prices. Retrieved 11.03, 2016, from
http://data.worldbank.org/indicator/NY.GDP.MKTP.CD/countries/DZ?page=1&displa
y=default
The World Bank. (n.d.). Countries and Economies. Retrieved 11.03, 2016
Transparency International. How do you define corruption? Retrieved 03.02, 2016, from
http://www.transparency.org/what-is-corruption/#define
Transparency International. (2014). The Impact of Corruption on Growth and Inequality
Retrieved from
http://www.transparency.org/whatwedo/answer/the_impact_of_corruption_on_growth
_and_inequality
Transparency International. (2015). Corruption Perceptions Index 2015: Results Retrieved
01.02, 2016, from http://www.transparency.org/cpi2015#results-table
United Nations. (n.d., n.d.). Kyoto Protocol. Retrieved 07.05, 2016, from
http://unfccc.int/kyoto_protocol/items/2830.php

58
Appendices
Appendix 1: Correlation between Transparency International’s Transparency Index and
IPRI’s Property Rights Index
Model Summary
Model R R Square Adjusted R Square
Std. Error of the
Estimate
1
,964a ,928 ,927 5,678
a. Predictors: (Constant), IPRI (property rights index)

59
Appendix 2: Spearman’s Correlation Matrix

60
Appendix 3: Scatterplot
Appendix 4: Durbin-Watson Test
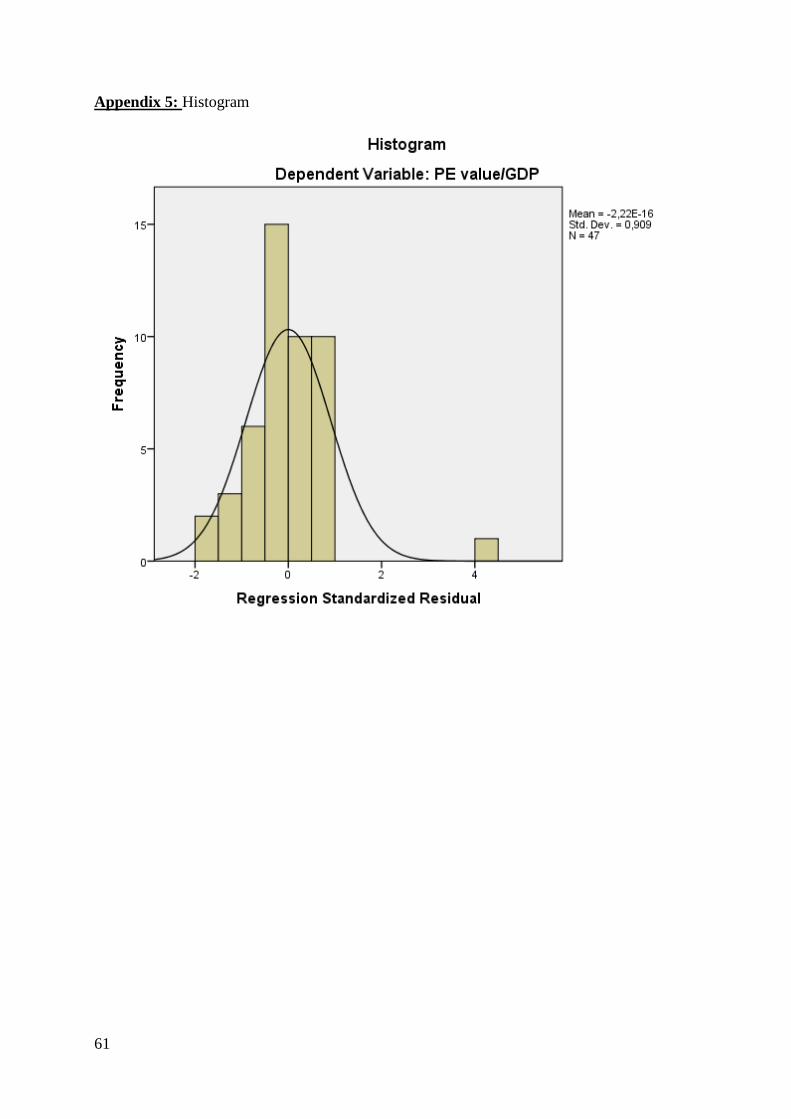
61
Appendix 5: Histogram

62
Appendix 6: Normal Probability Plot

63
Appendix 7: Reflection Paper
Reflection Paper
This study concentrates on which macroeconomic factors that affect the PE activity in
countries. PE activity was measured in amount of PE invested in a country, and divided by the
country’s GDP. The macroeconomic factors studied were perceived corruption level, tax
level, future growth prospects and legal system. What I found, was that two factors indeed
had an influence on PE activity. First of all was legal system. The study showed that there
were a clear relationship between legal system and PE activity, and that more PE was invested
in common law countries compared to civil law countries. Second, I found that there is a clear
positive correlation between how transparent a country is, and how much PE investors chose
to invest. The more transparent a nation is the less corrupt is it perceived to be.
In today’s society, the barriers for investing internationally is lower than ever before. Because
of this, I wanted to do a study on an international level, so I could get a holistic picture over
the PE industry. The barriers are low because the countries are getting more adapted for a
global economy. Legal frameworks everywhere have been changed to open up for this trend –
regulations are more fitted for international trade and tax regulations are specified for
organisations that do business in more than one country. We have also gotten several trade
organisations that are working towards an even more internationalised economy with lower
barriers.
Internationalisation creates several opportunities for PE investors. First, an international
marked means that the amount of PE investees increase drastically. The investors can freely
choose whether they want to pick a potential market by country, industry or other parameters.
Second, internationalisation makes it possible to transfer knowledge and skills across
However, internationalisation can also create obstacles for investors. An international market
means that there will be more competitors, and the competition might get harder for the good
investee firm. This is especially a threat for smaller PE funds that might struggle with
gathering funds if they have to compete with larger funds.
The PE industry, especially within venture capital, promotes innovation in itself. PE investors
look for businesses to invest in that has a major potential to increase in value, and such
potentials often comes in form of innovative businesses. For a business to gain a competitive

64
advantage, they need to come up with a new and better way of producing goods. By
supporting these businesses, PE investors also support innovation.
Today, the most common way for businesses to get support from PE funds is that they have to
apply directly to the fundraiser. One possible improvement for the global PE industry could
be to create a better platform where companies can apply for funds. One could create a
webpage where both PE investors could write about their fund and businesses could write
about themselves and why they should get supported. Such a platform would make the market
more efficient. PE investors would not miss potential investees because the investees did not
apply for support, and the other way around.
As the PE industry is a very broad field, there are several important issues related to
responsibility and ethics. One example of this is the issue that arise if the workers an investee
company do not do the job they are supposed to. Such neglecting may harm the value of the
business, and reduce profit when exiting the investment. To avoid this, investors should look
at potential solutions for motivating the workers, such as good incentives.