“The Impact of Globalization on the U.S. Flexible ... · PDF file• SWOT for small,...
142
“The Impact of Globalization on the U.S. Flexible Packaging Industry and the Opportunities Created for the Industry by Globalization” for the Flexible Packaging Association October 4, 2006 Michael Richmond, Ph.D. and Brian F. Wagner - PTIS and Graham Cox and Ania Krolak - PIRA
Transcript of “The Impact of Globalization on the U.S. Flexible ... · PDF file• SWOT for small,...

“The Impact of Globalization on the U.S. Flexible Packaging Industry and the Opportunities Created for
the Industry by Globalization”for the Flexible Packaging Association
October 4, 2006
Michael Richmond, Ph.D. and Brian F. Wagner - PTISand
Graham Cox and Ania Krolak - PIRA

AGENDA
I. BACKGROUND AND ESSENCE
II. THE GLOBALIZATION STORY – OVERVIEW• Emerging Markets
III. CUSTOMER, RETAILER, CONVERTER OVERVIEW• Survey and Research Summary
IV. INFLUENCES, ISSUES AND DRIVERS
V. THREATS AND OPPORTUNITIES FOR FPA
VI. BUSINESS MODELS• External• Internal
VII. SUMMARY AND RECOMMEDATIONS
BACKGROUND AND ESSENCE

FPA Team Meeting – Work Essence
• 'The report will provide FPA members with insights and recommendations. It will highlight opportunities and risks created for them by globalization. It will assist them in the process of formulating their own winning strategies based on the assessment of their strengths and weaknesses. It will suggest the winning strategies on how to change threats created by globalization into opportunities. The recommendation will focus on the ways of ensuring that the US flexible converters maintain their competitive edge and profitability in the world shaped by globalization.’
• The report will include recommendations for member companies, subdivided into valuable recommendations for small, medium and large flexible packaging converters.

FPA Globalization project process – 2006
• FPA• FPA Leader
Team• FPA
Membership• Survey
participation (summary)
• Individual member companies
• Other
• Business Models– Small Converters– Midsize Converters– Large Converters
• SWOT for small, medium, larger Converters• Where growth opportunities exist regionally• Global sales of flexible packaging regionally• Flexible converter locations globally• Top 5 regions for growth/what it would take to
compete• Comparison of US vs other Regions - flexible
packaging innovation• Barriers to innovation in the US• Protection of IP• Topline directional data, raw materials flow,
pricing, and future scenarios.• How environmental packaging regulations
differ regionally• Regional/global pressures for sustainable
packaging• What impacts exchange rates have on the US
flexible packaging industry's ability to compete globally
• Impact of imports on flexible packaging
• FPA Leader Team/PIRA/PTIS Work Session
• PTIS/PIRA coming together to utilize their breadth and depth of resources and knowledge to deliver the FPA Globalization Project based on “funnel approach” of developing extreme knowledge- base and refinement, both separate and together
• Triangulation and assimilation of primary and secondary work
Primary Research• Brand Owner Surveys• Converter Surveys• Retail Surveys• Contract Manufacturing
Surveys
Global Reports/Studies/Conferences• Global Packaging Summit• China Pack• IOPP Packaging Summit• Global Pouch Forum• PACE• SPC Coke Meeting• PS Sustainability Report• PTIS Packaging Innovation
Report• The World Market for
Consumer Packaging• Sustainability: It’s impact on
Global Consumption to 2010• Packaging Newsletters and
other secondary proprietary and public sources
• PTIS• PIRA• 85 Leaders
Globally• FPA
CUSTOMERSOUTPUTSPROCESSINPUTSSUPPLIERS

The Value Chain
DisposalCONSUMERS
Retail Channels
Foodservice / Institutional
CPGs –Packagers/
Manufacturers
Contract Packagers / Manufacturers / 3P Service Providers
Converters
Equipment Suppliers
Raw Material Suppliers
Sustainable Packaging
•Bemis
•Alcan
•Small/Midsize
•½ of Top 20
•Dow
•ExxonMobil
•DuPont
•Kraft
•Kellogg's
•Wal-Mart
•Carrefour
•+Growth Region Leaders
•All research grounded in consumer insight and trends
•PMMI Data•Power Packaging/ Exel Logistics/ DHL
•Others Local and Regional
Examples of Value Chain Primary Contacts Across The Value Chain

AGENDA
I. BACKGROUND AND ESSENCE
II. THE GLOBALIZATION STORY – OVERVIEW• Emerging Markets
III. CUSTOMER, RETAILER, CONVERTER OVERVIEW• Survey and Research Summary
IV. INFLUENCES, ISSUES AND DRIVERS
V. THREATS AND OPPORTUNITIES FOR FPA
VI. BUSINESS MODELS• External• Internal
VII. SUMMARY AND RECOMMEDATIONS

THE GLOBALIZATION STORY - OVERVIEWEmerging Markets
Presented by:Graham Cox
Head of International ConsultancyPira International
4 October 2006

China - Summary• Population 1,306 million
(60% rural and poor)
• Emerging middle class especially in big cities
• Retail becoming very dynamic
• JV’s major way of doing business
• Western companies becoming active (food and packaging)
• Packaging of good standard, with some added-value aspects
• Strategic alliances key to success

China - Retail
• Becoming very dynamic
• Western names gaining ground, especially Carrefour
• ‘Modern’ retailing now 50% of grocery sales
• Biggest growth in urban areas
• Still price sensitive, but convenience and healthy living climbing the agenda
• Much use of POS and in-store theatre techniques (degree of replicating wet markets!)
• Private label beginning

Winners and losersof the Chinese market
Modern retail israpidly developing

Modern retail standardsare second to none
Carrefour leads the way

Combining global best practice …
... with local knowledge

Domestic retailers are learning fast

How to appeal to the Chinese market

Price competitivenessis key

Communicating price competitiveness

Importance of generating in-store theatre

China – Packaging Supply
• Paper and plastics dominate
• Market highly fragmented, often regionally based
• Amcor, Alcan, Sealed Air all have significant presence
• Possible study needed into local supply situation

China – Supply Chain
• In Asia in general 38% of food wasted between farms and consumers
• In China, estimated losses (food wastage) are US$3 billion
• Distribution systems improving but analysis of chilled systems in detail necessary by international food companies

India - Summary
• Population 1.1 billion and rising
• Major rich/poor separation - middle class now 30% of population, but 25% living below poverty line
• Heavy middle class elements in big cities (especially Mumbai and Delhi)
• Retail mainly ‘unorganised’ but Western input starting (e.g. SPAR)
• Packaging again of high standard (good Institute of Packaging)
• Local studies essential to establish supplier base
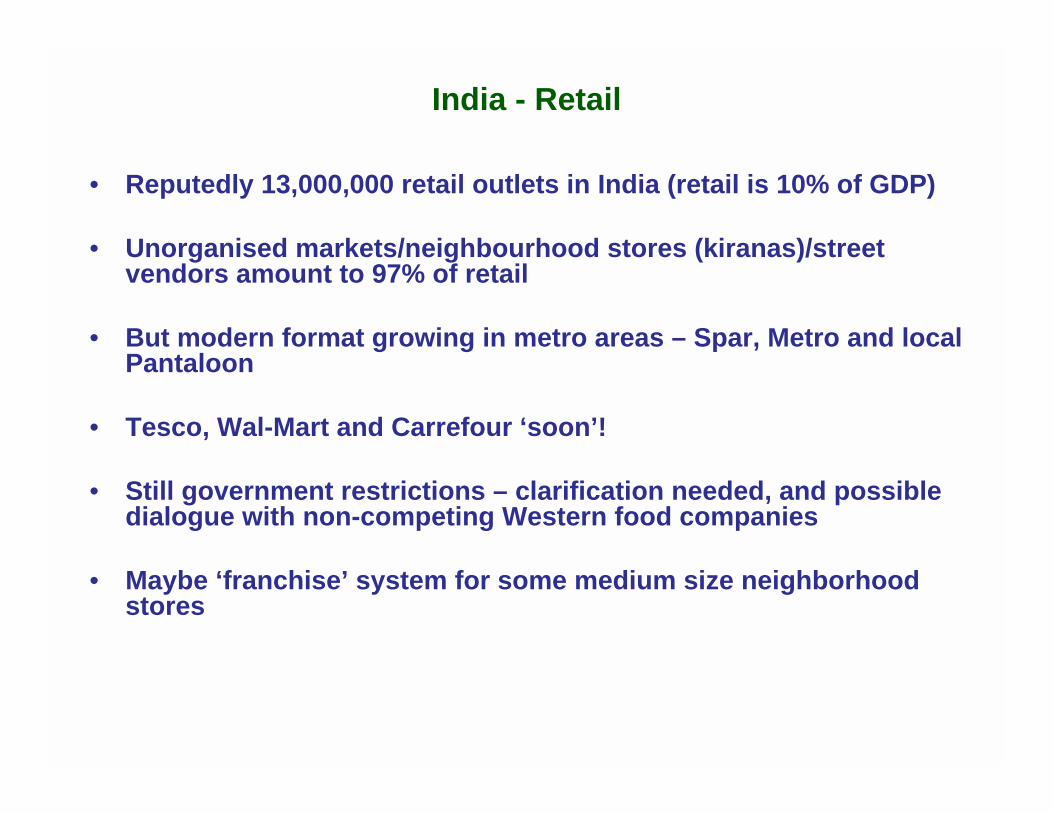
India - Retail
• Reputedly 13,000,000 retail outlets in India (retail is 10% of GDP)
• Unorganised markets/neighbourhood stores (kiranas)/street vendors amount to 97% of retail
• But modern format growing in metro areas – Spar, Metro and local Pantaloon
• Tesco, Wal-Mart and Carrefour ‘soon’!
• Still government restrictions – clarification needed, and possible dialogue with non-competing Western food companies
• Maybe ‘franchise’ system for some medium size neighborhood stores

The traditional Indian retail market

The traditional trade

The traditional trade

Neighbourhood stores (‘Kiranas’)
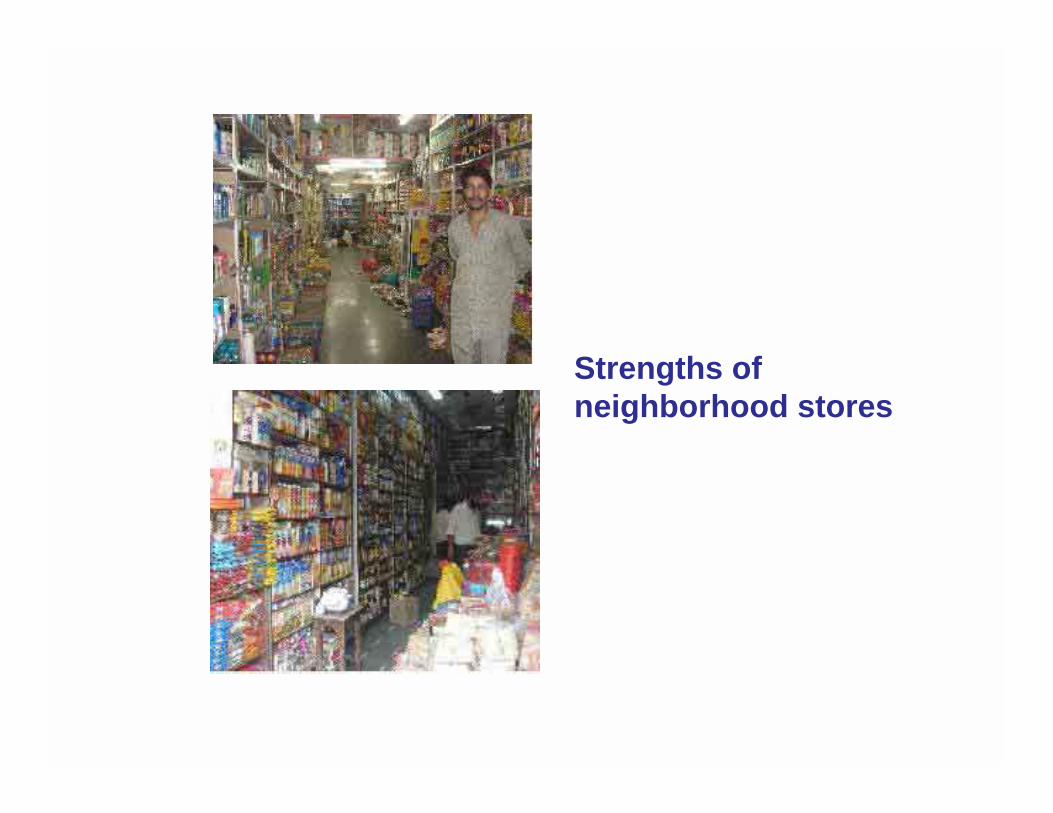
Strengths ofneighborhood stores
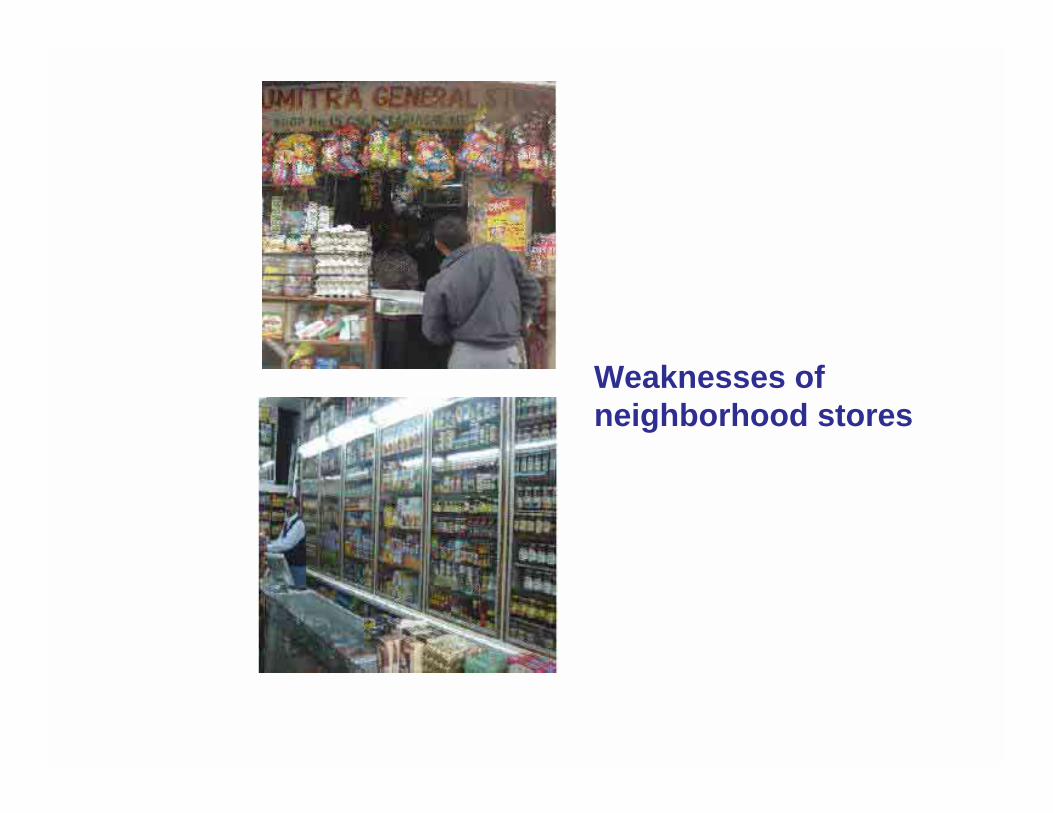
Weaknesses ofneighborhood stores

Development of modern retail in India

Domestic retailers are developing fast

International retailers are set to expand
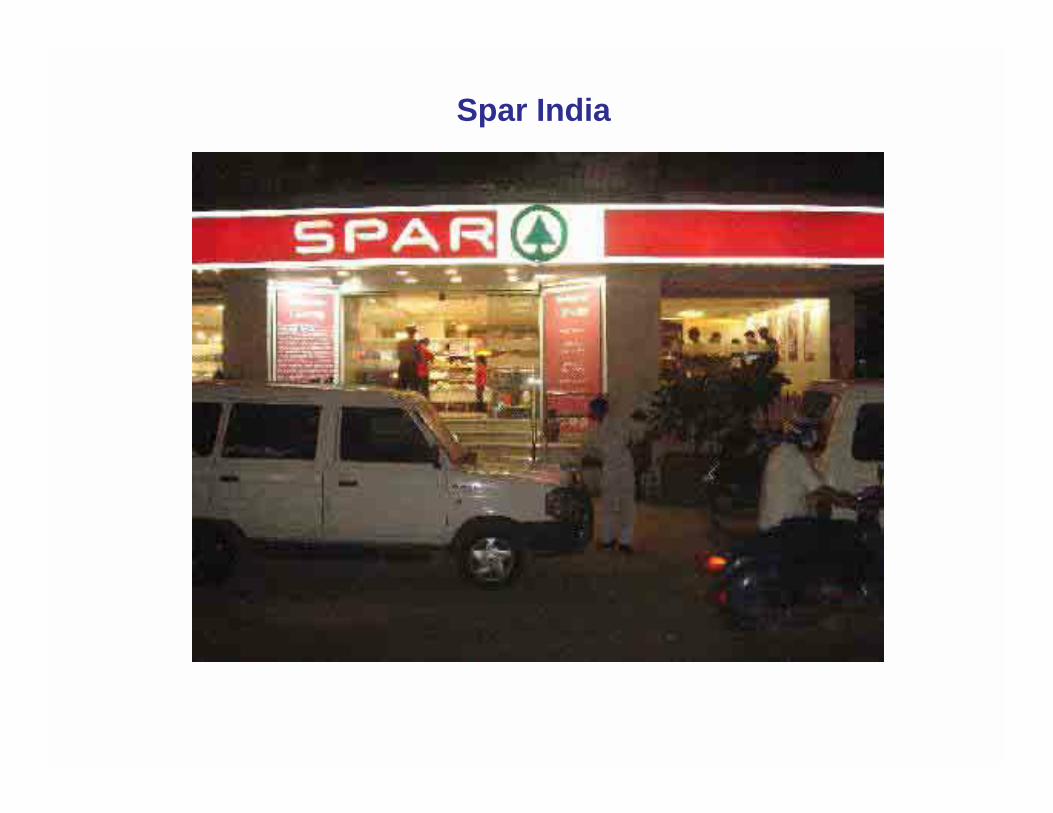
Spar India
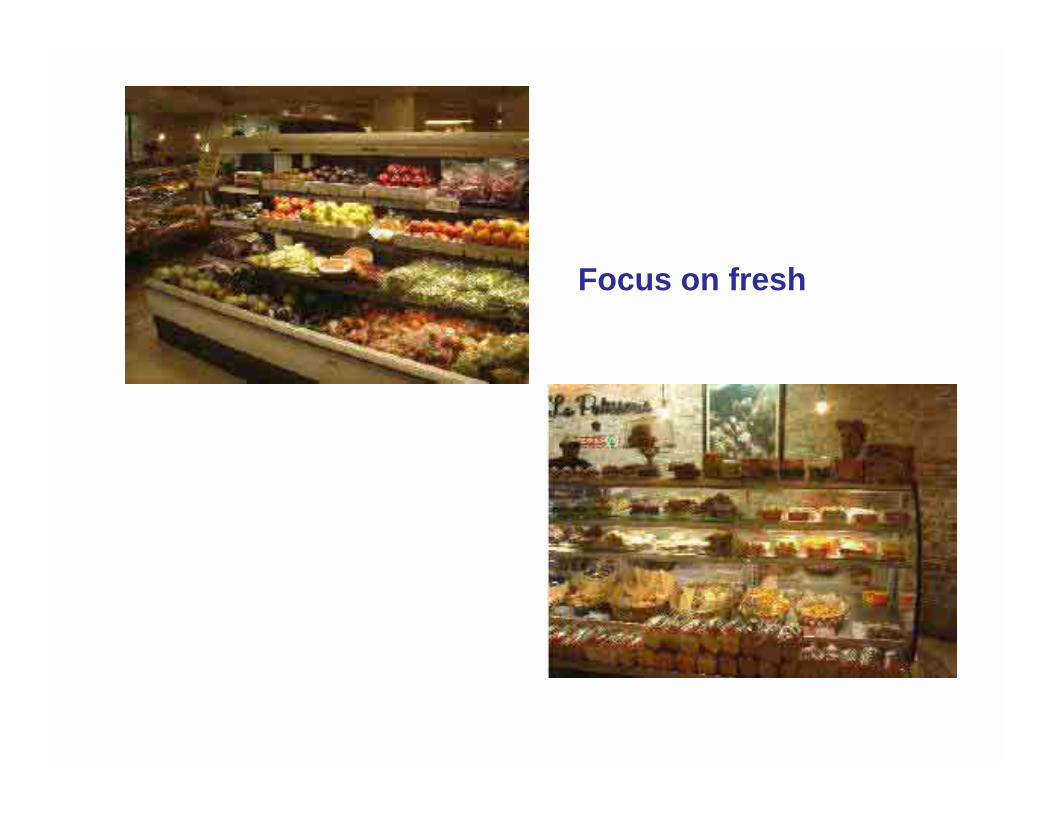
Focus on fresh

Wide groceryassortment

India – Packaging Supply
• Packaging sector worth US$9 billion and highly fragmented
• Flexible represents almost a quarter, but highly fragmented (maybe 600/800 converters)
• Not many Western companies present, but interest growing

India – Supply Chain
• Distribution networks traditionally archaic
• Shortage of chilled distribution
• Comparison – West usually 2-3 touch points, India 12!

Russia - Summary
• Population 143 million (73% urbanised)
• Most affluent areas are Moscow and St Petersburg, where Western influence is high
• Most Western companies based near big cities
• Western packaging companies present
• Packaging again of reasonable standard (some imports)
• Corruption still an issue, but less than historically

Russia - Retail
• Major Western operators – Metro, Auchan and Spar
• Tesco and Carrefour have had success in Central Europe so can be expected shortly
• Modern retail format stores 4000 in 2004 (400 in 2000)
• High number of SKUs to cater for population types and affluence but also to try to fill shelf gaps caused by ‘unreliable deliveries’
• Private label awareness very high

Russia – Packaging Supply
• Largest single market for flexibles in old Eastern block, and this sector growing at 12%+ per annum
• In food sector, 72% packed in ‘flexibles’
• Mixture of local and Western packaging companies (Amcor, Alcan and Sealed Air)
• Instances of Western companies ‘encouraging’ their global suppliers to move to the region for security of supply
• Production costs much lower than Central Europe – Western companies likely to capitalize on this

Russia – Supply Chain
• Outside conurbations, supply chains not well controlled
• Chilled distribution a particular problem
• However, Western logistics companies interest in Russia may improve things
• Local study needed

Brazil - Summary
• Population 186 million (84% urbanized)
• More stability these days after historical financial messes
• Different to some other regions – need for products for both middle and low income groups
• Packaging adequate, some innovations, possibilities of ‘value-added’
• No particular trade and legal barriers

Brazil - Retail
• South America generally – modern format equates to 5%
• New shopping malls, but do not include food supermarkets
• Wal-Mart entered in 1995, and recently bought 150 stores from Portuguese group
– This will make Wal-Mart number 3 retailer after Brazilian ‘Companhia Brasiliera de Distribuicao and Carrefour’
– Since then have announced plans for 15 new stores, and modernization of others (€287 million investment in total)
Brazil – Packaging Supply
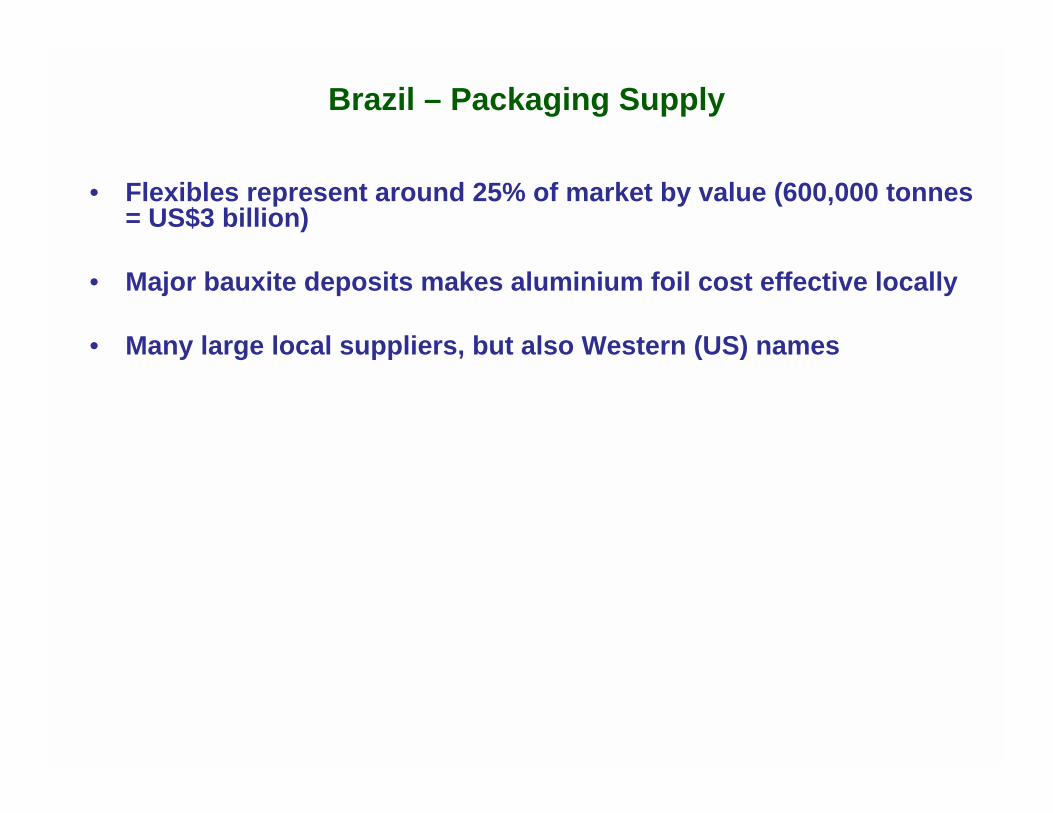
• Flexibles represent around 25% of market by value (600,000 tonnes = US$3 billion)
• Major bauxite deposits makes aluminium foil cost effective locally
• Many large local suppliers, but also Western (US) names

Brazil – Supply Chain
• No major issues discovered
• High urbanization may be helpful factor
• But again, local study would be useful in view of size of country, i.e. are US logistics companies present

Mexico - Summary
• Population 100 million of which 75% urbanised
• Almost 10% of population live in Mexico City
• Middle class reckoned to equate to 20,000,000
• Retail split between modern format and old fashioned stores (informal economy)
• Large number of Free Trade agreements, close links to, and influence from, US
• Personal touch important in relationships
• Older generation still shop daily at ‘abarrotes’

Mexico - Retail
• Modern format growing fast – 60% of food products sold through supermarkets (around 4,500 of these)
• Wal-Mart control 30% of market under Wal-Mart Supercenter, Superama, Bodegas Aurrera and Sam’s Club banners
• Many other groups, often regional within Mexico
• Carrefour now have 22 stores and expanding
• Traditional market will continue to give ground to supermarkets as shopping habits change
• Consumers seeking more imported processed foods

Mexico – Packaging Supply
• Flexible packaging is the predominant format, especially in food
• Two thirds of food packaged in flexible materials, where plastics dominates
• Apparent good local suppliers where initial details suggest theymay be worthy of consideration
• Western (US) companies also involved, including Cryovac and Alcan who seem to be the leader in food packaging and have 3 sites there
• Probably balanced supply potential between US and local suppliers

Mexico – Supply Chain
• Research indicates that there are good distribution networks
• Bakery group Grupo Industrial Bimbo specifically instanced in this regard
• Distribution from US also well controlled
• Possibility of links with US logistics providers?

AGENDA
I. BACKGROUND AND ESSENCE
II. THE GLOBALIZATION STORY – OVERVIEW• Emerging Markets
III. CUSTOMER, RETAILER, CONVERTER OVERVIEW• Survey and Research Summary
IV. INFLUENCES, ISSUES AND DRIVERS
V. THREATS AND OPPORTUNITIES FOR FPA
VI. BUSINESS MODELS• External• Internal
VII. SUMMARY AND RECOMMEDATIONS

CUSTOMER, RETAILER, CONVERTER OVERVIEW
Presented by:Michael Richmond, Ph.D.
PTIS4 October 2006

BRAND OWNER OVERVIEW
Global and Local

Global and Local Brand Owners
• Top 50 Global Brand Owners
• Globalization and Its Impact
• Global and Local Verbatims
• Global Brand Owner Purchasing Strategies
• Top Brand Owners in China and India - Comparison

Top 50 Global Brand Owners
Source: Company annual reports, Hoovers, Pira estimates (in italics)
2005 Rank Company Name Country End-use segment
2003 Revenue (US dollars in
millions)
2003 Operating Profit (US dollars in millions)
2003 Operating Margin (%)
2004 Revenue (US dollars in
millions)
2004 Operating Profit (US dollars in millions)
2004 Operating Margin (%)
2005 Revenue (US dollars in
millions)
2005 Operating Profit (US dollars in millions)
2005 Operating Margin (%)
1 Nestle S.A. Switzerland Food & beverages 70823 7165 10.1 68048 8706 12.8 73180 9528 13.02 Unilever UK/Netherlands Food & beverages; home & personal care 53674 7015 13.1 54413 4621 8.5 60000 n/a n/a3 Procter & Gamble USA Food & beverages; home & personal care 43377 7853 18.1 51407 9827 19.1 56741 10927 19.34 Pfizer USA Pharma/Healthcare 45188 10800 23.9 52516 17024 32.4 51298 14925 29.15 Johnson & Johnson USA Pharma/Healthcare 41862 10871 26.0 47348 12863 27.2 50514 13371 26.56 British American Tobacco plc UK Tobacco 43071 2974 6.9 42000 3118 7.4 41260 4321 10.57 GlaxoSmithKline plc UK Pharma/Healthcare 38238 11637 30.4 39032 11791 30.2 37262 11199 30.18 Kraft Foods Inc (Altria) USA Food & beverages, Tobacco 31010 5973 19.3 32168 5218 16.2 34113 5123 15.09 Sanofi -Aventis France Pharma/Healthcare 10118 3383 33.4 20377 -3415 -16.8 33745 5463 16.2
10 PepsiCo, Inc USA Food & beverages 26971 4987 18.5 29261 5409 18.5 32562 5922 18.211 Novartis AG Switzerland Pharma/Healthcare 24864 5889 23.7 28247 7002 24.8 32212 7268 22.612 Roche Switzerland Pharma/Healthcare 25132 5046 20.1 27630 7933 28.7 26985 6588 24.413 Tyson Foods USA Food 24549 913 3.7 26441 1011 3.8 26014 812 3.114 AstraZeneca UK Pharma/Healthcare 21850 3911 17.9 21426 4455 20.8 23950 6309 26.315 The Coca Cola Company USA Food & beverages 21044 5221 24.8 21962 5698 25.9 23104 6085 26.316 Abbott Laboratories USA Pharma/Healthcare 19680 3423 17.4 19680 4177 21.2 22338 4379 19.617 Merck & Co. USA Pharma/Healthcare 22486 8457 37.6 22939 6622 28.9 22012 5859 26.618 3M USA Pharma/Healthcare 18232 3806 20.9 20011 4578 22.9 21167 5009 23.719 L'Oreal France Personal care 17609 2465 14.0 19824 2948 14.9 20500 n/a n/a20 Sara Lee USA Food 18291 1671 9.1 19566 1652 8.4 19254 1446 7.521 BristolMyers Squibb USA Pharma/Healthcare 20894 4947 23.7 19380 4464 23.0 19207 3951 20.622 Wyeth USA Pharma/Healthcare 15850 3912 24.7 17358 4150 23.9 18756 4457 23.823 Mars USA Food & beverages 17500 n/a n/a 18000 n/a n/a 18500 n/a n/a24 LVMH Moet Hennessey France Beverages 15015 2739 18.2 17218 3301 19.2 18000 n/a n/a25 Diageo UK Beverages 15624 3385 21.7 16161 3466 21.4 16163 3096 19.226 Danone France Food & beverages 16508 2239 13.6 18558 2492 13.4 15414 2259 14.727 Anheiser Busch USA Beverages 14147 3199 22.6 14934 3361 22.5 15036 2726 18.128 Henkel Germany Home & personal care 11844 886 7.5 14448 2619 18.1 15000 n/a n/a29 Eli Lilly & Company USA Pharma/Healthcare 12582 3502 27.8 13858 3659 26.4 14645 3649 24.930 ConAgra Foods USA Food 19839 1514 7.6 14522 1383 9.5 14567 1267 8.731 Heineken NV Netherlands Beverages 11617 1534 13.2 13647 1702 12.5 14000 n/a n/a32 Kirin Brewery Japan Beverages 10882 948 8.7 11745 1050 8.9 13841 n/a n/a33 InBev (Interbrew & AmBev) Belgium Beverages 8842 1053 11.9 11687 1787 15.3 13000 n/a n/a34 SabMiller UK Beverages 8295 803 9.7 11366 1519 13.4 12901 2361 18.335 Amgen USA Pharma/Healthcare 8356 3071 36.8 10550 3902 37.0 12430 4897 39.436 Boehringer Ingelheim Corp Germany Pharma/Healthcare 10000 n/a n/a 10433 n/a n/a 12195 n/a n/a37 Bayer Healthcare Germany Pharma/Healthcare 10000 n/a n/a 11574 1223 10.6 12060 1409 11.738 Cadbury/Schweppes UK Food & beverages 11487 1877 16.3 12918 2137 16.5 11796 1807 15.339 Colgate-Palmolive Company USA Home & personal care 9903 2139 21.6 10584 2198 20.8 11396 2284 20.040 Smithfield Foods USA Food 9000 n/a n/a 9267 368 4.0 11354 582 5.141 General Mills USA Food & beverages 10506 1925 18.3 11070 1992 18.0 11244 1992 17.742 Dean Foods Company USA Food & beverages 9185 697 7.6 10822 696 6.4 10506 646 6.143 Kellogg USA Food 8811 1455 16.5 9614 1681 17.5 10177 1750 17.244 Associated British Foods UK Food & beverages 8180 680 8.3 9291 777 8.4 9909 858 8.745 Baxter International USA Pharma/Healthcare 8906 1616 18.1 9509 1149 12.1 9849 1530 15.546 Swift & Company USA Food 8432 120 1.4 9879 142 1.4 9669 79 0.847 Schering Plough USA Pharma/Healthcare 8334 558 6.7 8272 -216 -2.6 9508 -77 -0.848 H.J. Heinz USA Food 8200 n/a n/a 8414 1379 16.4 8912 1355 15.249 Kao Corporation Japan Home & personal care 7220 959 13.3 8544 1133 13.3 8711 1129 13.050 Avon Products USA Personal care 6876 1039 15.1 7748 1226 15.8 8150 1149 14.1
Total 954028 1027919 1086957
= surveyed by PTIS/PIRA

Taking a Look at the United States
• 12 out of the top 20 global Brand Owners are US companies: P&G, Pfizer, J&J, Kraft, PepsiCo, Tyson Foods, Coca-Cola, Abbott, Merck, 3M, Sara Lee, BMS
• 11 out of the top 20 global flexible packaging converters are UScompanies: Bemis, Sealed Air, Pactiv, Printpack, Pliant, Alcoa, Covalence, Sonoco, Exopack, Smurfit, Packaging Dynamics
• The US food retail market = the largest in the world (21%)
• US Food and Beverage is a One Trillion Dollar per annum business
• Surveys results: Small, medium and large converters see the US as a High Growth Opportunity Country (HGOC)

Increased Manufacturing Presencein Developing World
• Global Brand Owners manufacturing presence in developing world is increasing:– P&G – Out of 89 plants, 29 plants are in developing countries (China x 3,
Brazil x 2, Thailand x 2, Saudi Arabia x 2, India, Russia, etc)
– Kraft – new plants in Mexico, China and Russia
– Nestlé Purina – building a plant in Russia
– Kellogg’s – plants in China, Mexico, Guatemala and Brazil
– Danone - 32% of turnover comes from outside the US and Western Europe
– Coca Cola – global, but expanding even further into ‘off-the beaten track’countries, e.g. bottling plant in Georgia and Uzbekistan (ex-USSR).

Global Brand Owners’ 2005 Turnovers
Source: Unilever and Pira estimates
The top global brand owners have a strong presence in other than NA and EUR regions. Their presence in the developing world is growing at a high rate.
0%10%20%30%40%50%60%70%80%90%
100%
Nestlé
Unileve
r
Procter &
Gam
bleDano
nePep
siCo
L'Oréa
lHenk
elCoca
-Cola
Cadbury
Beirers
dorf
NAEURROW

Increased Manufacturing Presencein Developing World
• Global converters follow in the footsteps of their customers (Brand Owners) and set up their plants in HGOC to serve their clients:– 34% of Bemis’ 2005 sales came outside the US plants
– ‘Many of our customers are looking to grow in more rapidly developing and emerging markets. Our customers want suppliers they know andtrust to partner with them in developing business in those locations’,
Chief Executive, Global Flexible Packaging Converter

Global Brand Owners’ Purchasing Strategies• There is a clear shift toward more global packaging, including flexible
packaging, purchasing at the expense of regional and local purchasing
• The driver is cost and complexity (hence cost) reduction with the selection of the highest quality. Global Brand Owners exercise their buying power and try to achieve economies of scale
• Imports of unprinted and low value added flexible packaging materials by US-based Brand Owners are evident. High-value added flexible packaging is mainly sourced from US converters, however, there is evidence of some higher value products (such as zipper stand-up pouches manufactured in China by local converters), being shipped to NA
• In HGOC, the majority of flexible packaging used by global Brand Owners is supplied by global converters, but there is evidence of some %, typically 10%, supplied by local converters
• Some global Brand Owners have contracts for global supply of semi-finished materials (e.g. unprinted oriented films, paper for labels, PE resins, etc)
• Customer/converter contracts: the current typical length is 2-3 years but they would be shorter in the future

Global Brand Owners’ Purchasing Strategies
• Relationship of global Brand Owners with converters –Verbatim– ‘Packaging suppliers that wish to supply our company have to be truly
global and have globally competitive cost structures, as more and more prices will be globally benchmarked. Converters that become preferred suppliers will use optimal cost structures, show innovation, be responsive and offer short lead times, behave ethically and share our values such as corporate social responsibility (CSR) and cradle-to-cradle packaging principles; they will be well integrated global players with coherent management. We envisage forming aligned agendas with a group of supplier companies that increasingly work together for common gain.’
» Head of Global Packaging Supply Chain, top 10 global CPG Brand Owner

LOCAL BRAND OWNERS

Top 10 Brand Owners in China
= surveyed by PTIS/PIRA
2003 2004 2005
1 Yunnan Hongta Group Co., Ltd. Yunnan Tobacco 4,065 2,004 4,109
2 Shanghai Pharmaceutical Group Co., Ltd. Shanghai Pharmaceutical 1,823 2,193 2,472
3 China National Pharmaceutical Group CorporatioBeijing Pharmaceutical 1,199 1,499 2,444
4 Shanghai Tobacco (Group) Co. Shanghai Tobacco 2,662 1,909 2,362
5 Amway China Guangdong Personal care 5,832 1,283 2,146
6 Henan Shineway Group Co., Ltd. Henan Food & Beverage 1,029 1,471 1,958
7 Guangzhou P&G Guangdong Personal care 616 1,386 1,798
8 Tianjin Pharmaceutical Group Co., Ltd. Tianjin Pharmaceutical 1,015 1,224 1,472
9 Hunan Changsha Tobacco Plant Hunan Tobacco 953 1,101 1,465
10 Zhejiang Hangzhou Wahaha Group Co., Ltd. Zhejiang Food & Beverage 908 1,233 1,394
Note: The data of turnover was acquired from the company's websites, reported articles and statistic data of authority and association.
Rank by 2005 turnover Company
Turnover (USD m)Location End use segments

Top 10 Brand Owners in India
= surveyed by PTIS/PIRA
Rank by 2005 turnover Company End use segment Turnover (USD m)
2003 2004 2005
1 Hindustan Lever Ltd. Pesonal care, Pharma 2,278 2,231 2,458
2 ITC Ltd. Tobacco 1,438 1,717 1,722
3 Coca Cola India Food & Beverages 824 876 955
4 PepsiCo India Food & Beverages 700 923
5 Ranbaxy Laboratories Ltd. Pharma 876 789 775
6 GlaxoSmithKline Pharmaceuticals Ltd. Pharma 265 329 350
7 Cadila Healthcare Ltd. Pharma 266 250 291
8 Britannia Industries Ltd. Food 327 359 381
9 Dabur India Ltd. Pharma, Beverages 255 282 304
10 Amul Food & Beverages 616 672 868

Local Brand Owners’ Purchasing Strategies
• The survey shows no evidence of sophisticated (flexible) packaging purchasing strategies, but quality and price are paramount
• Almost 99% local flexible packaging purchasing, very little use of imported materials. China imports high value-added flexible materials mainly from Japan, India – mainly from Europe
• Need for more value-added flexible packaging by locals (mainly Chinese, e.g. edible sausage casings, high barrier materials) –technology transfer could address this gap, as imported flexiblepackaging is/would be too expensive
• The Indian flexible packaging industry, despite being half of the Chinese, seems to be technologically more advanced than the Chinese one and no significant unmet needs have been mentioned by the respondents
• The important question: ‘How could the US converters who are not your current flexible packaging become your suppliers?’ was answered by the vast majority with a single word: ‘Price’

RETAILERS AND CONTRACT MANUFACTURERS
Survey Summaries

RETAILERS

Top Global Retailers
35,718USSears, Roebuck & Co.2042,906DEAldi GmbH & Co. oHG10
35,823USSafeway, Inc.1944,793NLKoninklijke Ahold N.V.9
36,345JPAEON Co., Ltd1845,682USTarget Corp.8
36,464USLowe’s Cos. Inc.1747,146USCostco Wholesale Corp.7
37,373FRGroupe Auchan S.A.1656,434USKroger6
37,508USWalgreen Co.1562,505UKTesco plc5
39,897USAlbertsons1469,781DEMetro AG4
41,721DEITM Développement International (aka Intermarché )1373,094USThe Home Depot Inc.3
42,782DERewe-Zentral AG1289,568FRCarrefour S.A.2
42,793DESchwarz Unternehmens Treuhand KG11285,222USWal Mart Stores Inc.1
Sales (US$mil)
OriginCompany nameRankSales (US$mil)
OriginCompany nameRank
Top 20 global retailers by retail sales (financial year 2004)
Source: The ninth annual 2006 Global Powers of Retailing report was written by Deloitte Touche
: Surveyed by PTIS/PIRA
Note: Few North American Retailers are truly Global

US Retailers
• Most US Retailers are not currently looking to grow globally except Wal-Mart
• Retailers are focusing an increasing amount of attention on their own private label brands. In NA, this is managed mostly by third party –Daymon, Alliance, Crossmark, Acosta
• Interviews suggest there are three levels of category specific private label that the majority of retailers are stocking
1. Value brands (good quality at a low price – targeted at limited assortment, extreme value retailers and dollar stores)
2. Store Banner brands (generally use the store name as the brand and are positioned as equal to or better than national brands); and
3. Premium or Super Premium brands (targeted at gourmet or specialty brands)
• The opportunity for packaging improvements are in two areas…– Premium and super premium private label; and – Leading edge retailers that use top corporate label sales & marketing
agencies such as Daymon Worldwide (e.g., HEB, Wegmans, Meijer, etc.)

US Retailers
• Most survey participants want to remain anonymous and do not want to be quoted in the research reports
• The current level of competition in the national brand marketplace has created a level of sensitivity that can be aggravated by unwanted publicity for a retailer’s private label
• Large US retailers are focused heavily on Category Management – ex. Retailers recognize they can’t compete in frozen meals or pizzas, but can in clothing, pet food, cereal, etc.
• An increasing focus on National Brand development may result in additional pressure on suppliers for differentiated packaging and graphics in the Food/CPG marketplace
CONTRACT MANUFACTURERS

Contract Manufacturers
• Power Packaging is the closest thing to a “global” contract manufacturer
– Acquired by Exel Logistics (UK), and since purchased by DHL (Germany) – No presence outside of North America– None of the contract packagers interviewed are packaging imported product
• Contract manufacturers seldom specify packaging, but instead the specifications are set by their customers, the brand owners
• In growth regions, Brand Owner plants are often set up initially with a contract manufacturing mentality – flexible, smaller volume – to start
• Trend towards building/purchasing packaging equipment outside of the US – materials are qualified on that equipment and lead to importing of film produced elsewhere, ex. Stick packs from Sanko (Japan)
• Flexible packaging converter support is highly valued for start ups, and on-going maintenance – converters are viewed as allies

CONVERTERS
Survey Results vs Brand Owners

Small, Medium and Global Converters
• Top Global Converters
• Survey Results and Insights
• Comments and Verbatims
• Converter Squeeze Diagram

Top Global Converters
AustriaMondi Packaging10
AustriaConstantia Teich 9
USAAlcoa Flexible Packaging8
USAPliant7
USAPrintpack 6
USAPactiv Corporation5
AustraliaAmcor Flexibles Inc4
USASealed Air (Cryovac)3
USABemis Flexible Packaging2
CanadaAlcan Packaging1
otherAsiaLAEURNA
Flexible packaging plants
HQ countryCompany Name2005 Rank
Yellow = manufacturing presenceRed = strong manufacturing presence (10+ plants)

Top Global Converters
• The 2005 revenues of the top 20 global flexible packaging converters accounted for approx. 34% of the total value of the world flexible packaging market
• Global converters have a very strong presence in developed regions, with only a handful of plants in developing countries
• Global converters follow in their customers’ footsteps, however, the demand must be guaranteed in developing countries to justify ROI (greenfield plant investment = approx. USD 25 m)
• Some large US converters have no plants in Asia; their presence in Latin America is more pronounced.
• Global converters serve global customers in developing countries, very little is supplied to local (indigenous) customers
SURVEY RESULT COMPARISON
Brand Owners and ConvertersNets and Insights

Brand Owner Current Climate and Trends• The words most frequently used by both global AND large local brand
owners across all end-use segments to describe the current business climate are:
• ‘Competitive’• ‘Challenging’• ‘Pressure’• ‘Competition’
• The most important issues for Global Brand Owners are: – the rising oil and energy prices– strong competition – pressure from private label/generic products– environmental pressures.
• Packaging, including flexible packaging, continues to be a buyers market
• The pressures experienced by the Brand Owners are passed onto their (flexible) packaging suppliers. Brand Owners want better quality/innovative flexible packaging, supplied at a lower price in a shorter time (supply chain squeeze continuous ⇒ better, cheaper faster!)
Brand Owner Current Climate and Trends
• Global Brand Owners’ view – Verbatim
– ‘A very competitive market that is becoming more global. There is a need to source cheaper solutions whilst maintaining quality.’
» Print and Packaging Services Manager, Global personal care Brand Owner
– ‘The retail pressure and the control over the marketplace have an affect on everything we do as well as how we do things regarding bringing products to market. The consumer is the ultimate customer but the path to those consumers is the retail industry.’
» Global Packaging Manager, global top 10 FMCG Brand Owner
– ‘Certainly competitive. Major multiples dictate what we do. Own-labels are a threat to sales. Globally very price sensitive – competing with other brands with more money.’
» Packaging Technologists, Large European beverage Brand Owner that opened a plant in China 19 months ago

Brand Owner Current Climate and Trends
• Local Brand Owners’ views - Verbatim
– ‘The competition is very fierce in food industry, and the updating and upgrading of food products is quick. With the rising price of packaging, pressure on the production cost in our companies is increasing.’
» Packaging Director, large Chinese food Brand Owner
– ‘Quality and timely delivery are our main considerations to achieve success in a competitive market.’
» Flexible Packaging Manager, large Indian pharma Brand Owner
– ‘Fierce competition in the industry and the great price increase of the raw material will bring negative impact to our company.’
» Packaging Director, large state-owned Chinese food & drink manufacturer
– ‘There is large development potential in food industry. 90% of our products are exported, mainly to Japan, America and Australia, seldom sold in domestic market. It’s easy to purchase packaging material and we can purchase at any time.’
» Packaging Director, large Chinese food Brand Owner

Nets/Insights: Health and Wellness companies seemed to view their growth opportunities in the United States and Canada
Over 60% of respondents believed there were good growth opportunities in China for their companies
Brand Owners: Where do you perceive the highest growth opportunities for your business to lie?
0%10%20%30%40%50%60%70%
China
Asia
Brazil
Centra
l / E. E
urope
India
Russia
L.Amer
ica / M
exico
Middle
East
US / Cana
da
Africa
S. Amer
ica (n
ot ...
UK / W. E
urop
e

Nets / Insights:Cost containment concerns stand out as key issues from converters with the price of raw materials, industry overcapacity, and the ability to pass on higher costs to customers all cited as the top 3 concerns among converters.
Converters: What are the key issues shaping / affecting your business?
0%10%20%30%40%50%60%70%80%90%
RM pricing /
oil
Overcapacity
Push cos
t to cu
stomers
Overseas
competitio
n
Labor / Benefits
costs
Innovation p
ush from c..
.
Decreased
order size
Wall St. p
ressure
Overseas
presence

Converters: Where do you perceive the highest growth opportunities for your business to lie?
0%10%20%30%40%50%60%
US / Can
ada
China
Brazil
L. Ameri
ca / M
exico
Russia
UK / W. E
urope
Asia India
E. Euro
pe
Africa
Nets/Insights: Larger converters seem to be targeting the BRIC countries for their growth, but nearly all small – mid size converters still view the US and Canada as their main opportunities for growth.
Converters outside the US will also see the US as an HGOC, and they too could pose a threat.
Language, distance and logistics have posed threats in the past, but these can all be solved.

Nets and Insights:Brand Owners are more than twice as likely to view China as one of their greatest growth opportunities, while most converters cite the US / Canada as where they anticipate their greatest growth
Where do you perceive the highest growth opportunities for your business to lie?
0%10%20%30%40%50%60%70%
China
AsiaBraz
il
Centra
l / E. E
urope
India
Russia
L.Ameri
ca / M
exico
Middle
East
US / Cana
daAfric
a
S. Ameri
ca (n
ot Br...
UK / W. E
urope%
of r
espo
ndan
ts
Brand Owners
Converters

Brand Owners: How could the US SML converters who are not your current flex pack suppliers become your
suppliers in HGOC?
0%10%20%30%40%50%
Region
al Pres
enc..
.
Service
Innov
ation
Pricing
Not much
opport
...Sup
erior
Value (
n..
Quality
Reliab
ility
Niche a
reas
Capac
ity

Nets / Insights:• One respondent from a European company found US suppliers to
not be proactive in customer service and using old technologies.This company tends to look for suppliers with more of a “can-do”attitude, which they tend to find from suppliers in China and Japan.
• Very, very little (<10% for most companies, if at all) sourcing of packaging from outside the US right now for products made in theUS – but many Brand Owners are looking at opportunities to source either commodity materials or barrier films from China or Mexico.
• While conducting this research, two of the leading global BrandOwners had teams traveling to China to explore new packaging sourcing alternatives.
Brand Owners: How could the US SML converters who are not your current flexible packaging suppliers
become your suppliers in HGOC?

Converters: What is your company’s unique selling point (USP)?
0%10%20%30%40%50%60%
Innov
ative
tech
nolo.
..Sup
erior
servi
ce
Turnaro
und t
ime /
fl...
Value a
dded
tech
no...
Quality
Produc
t port
folio
Manage
ment
Price /
Exc
hang
e ra..
Ability
to su
pply
glob..
.
Notes / Observations: Most suppliers believe their unique selling points are specialtyniche products or technologies that they can offer customers to help them stand out on the shelf, or provide a performance advantage over others.
Smaller suppliers also felt that they were better able to compete with superior service as well as enhanced speed to market or flexibility for their customers.

What are the unique selling points that would allow US SME converters who are not your current flex
pack suppliers to become your suppliers in HGOCs?
0%
10%
20%
30%
40%
50%
60%
Regional P
resence in
HGOCServic
e
Innovation
Pricing
Not much
opportunity
Superior Valu
e (not c
ost based
)
Quality
Reliability
Speed to Market / F
lexibility
% respondants
Brand OwnersConverters
Brand Owners: What converter Capabilities could provide opportunity in HGOCs?
Converters: What are your companies unique selling points (USPs)?
Nets / Insights:• The biggest opportunity cited by Brand Owners for SML converters
is to have a regional presence in HGOC, while less than 10% of the converters cited this as a unique selling point for themselves
• Both converters and Brand Owners felt innovation, service and superior value (not based solely on pricing) were opportunities for SME converters to break in with Brand Owners
• While nearly 30% of converters felt that that speed to market and flexibility were unique selling points, it was not nearly as important to Brand Owners in HGOCs.

Brand Owner: Is your company involved in packaging sustainability/environmentally friendly
packaging initiatives?
71%
18%
12%
Yes
No
Informal

Brand Owner Interest in Sustainable Packaging
• Comments/Insights• Looking at using PLA, particularly overseas (UK, Germany, Australia)• Some mention other countries legislating PLA similar to Germany
would help push PLA use• Others looking at using recycled PET in food and pharmaceutical
containers• More companies focus on packaging and sustainability on their
website• One company concerned that push only coming from Wal-Mart, not
other retailers -- is it worth it?• Others are pushing sustainability initiatives on suppliers and asking
them to bring in new ideas• Most companies are not actively measuring their results -- those that
are measuring are looking through cost savings or waste reduction• Opportunity for suppliers/converters to help BO’s

Converter: Is your company involved in Sustainable/ Environmentally friendly Packaging initiatives?
Brand Owner
Yes, 71%
Informal, 12%
No, 18%
Converters
Yes, 47%
No, 27%
Informal, 27%Opportunity to
Align with Your Customers

Yes, 47%
No, 27%
Informal, 27%
Converter: Is your company involved in Sustainable/ Environmentally friendly Packaging initiatives?
While nearly half of the respondents stated that they have a sustainability program, the definition or description of what they viewed as their sustainability program varied widely. Some examples include:
•Use of PLA for products•Focus on increased recycling within plants and reducing waste going to landfills•Diverse product portfolio with sustainable products•Measuring waste stream reductions
About a quarter of all respondents said that they are informallyinvolved in sustainability in that they do not have a formal sustainability program themselves, but do respond on customized projects for customers based on their requests.
Some of the responses from those companies that do not have a sustainability program suggested they did not feel it would help profitability or increase sales.
•A number of respondents also mentioned Wal-Mart’s impact on the sustainability push and that it was why their customers were interested in sustainability.

Supply Chain Squeeze
FlexiblePackagingIndustry
Customers &
Retailers
New Entrants
Substitutes
Suppliers
Source: Amcor Flexibles

Converter Squeeze Diagram - 2006
Converters
Resin Prices
Global Labor
Raw Material 2X Margins
Excess Capacity
Political Conditions
Environmental Pressures
Multinational Brand Owners
NA Talent Issues
Retailers
CPGs 3X Converter Margins
Film is Target for Export from China/India/SA
FragmentationLack of Differentiation

Converter - Verbatim Comments• Based on a recent trip to China, “It represents a real opportunity and a
real threat – China is very hungry.”– Medium-sized Converter President
• Issues shaping business climate: “Increased multiplying of SKUs, customers now have hundreds more SKUs.”
– Small/Medium-sized Converter President
• Paraphrased from question on highest growth opportunity countries (HGOC): “Biggest growth is in the U.S.”
– Small/Medium/Large Converter Presidents
• “Customers really like people that understand their business. You can save them hours – you should see their eyes light up”
– Converter CEO• “Resin prices and wages will continue to be lower in China for the
foreseeable future.”– Converter Marketing Director

AGENDA
I. BACKGROUND AND ESSENCE
II. THE GLOBALIZATION STORY – OVERVIEW• Emerging Markets
III. CUSTOMER, RETAILER, CONVERTER OVERVIEW• Survey and Research Summary
IV. INFLUENCES, ISSUES AND DRIVERS
V. THREATS AND OPPORTUNITIES FOR FPA
VI. BUSINESS MODELS• External• Internal
VII. SUMMARY AND RECOMMEDATIONS

INFLUENCES, ISSUES AND DRIVERS
Presented by:Graham Cox
Head of International ConsultancyPira International
4 October 2006

Consumers
• Covered in earlier presentation but in summary:
– Burgeoning middle class with increasing Western tastes and aspirations
– Moving to Western shopping patterns and formats
– But still large rural populations living their old ways

Channels
• Leading on from previous slide
– Vary from country to country
– Leading Western retail chains increasing presence by the month
– Still lots of ‘neighbourhood stores’ and markets
– Different tiers of product for different consumers/channels, packed differently

Supply Chain
• Distribution and logistics issues (especially food)
• Alliances will be vital, and will include logistics providers
• Think regionally (these are big countries)
• Scope for real supply chain innovation
• Solutions provision – should converter also be packer?
• Future of 3PL and 4 PL

‘Food Miles’
• Exercising minds in Europe, and presumably USA
• Likely extension to include componentry used in food packaging
• What is the possibility of this affecting decisions?

Politics and Government Influences
• Exchange rate fluctuation
• Continuing discussions at WTO re tariffs, etc – they exist in some markets, and can be applied ‘flexibly’!
• Corruption still exists in some places – but maybe equally applied so no great disadvantages
• Recommended 3P approach:– PATIENCE– PRESENCE– PRUDENCE

Chinese Food Packaging Machinery
• Doubled from 2001-2005 (E6.6bn)
• Annual growth rate of 17.5% (Research in China firm)
• Food Industry sales in china showing 25% annual growth
• Enhanced trust by consumers and improved equipment reliability have helped drive the increases
• Food/Packaging machinery exports was $607MM in 2005 (31% increase vs. 2001) and expected to increase to $1.27bn by 2010
• Comment: Strong growth for internal needs and export. Supported by improved trust internally and likely lower cost and improved technology for export

E-Commerce
• E-Auctions still around – emerging markets quite happy to participate
• But bigger multi-national brands becoming disenchanted with then
• E-Business very much an enabler rather than the decision maker

Material Flow for US Converters
Imported Raw Materials• N. America 100%
• Europe 60%
• SE Asia 53%
• India 13%
• S. America 13%
Exported Packaging• Mexico 54%
• Canada 38%
• Europe 38%
• S. America 15%
• Global 15%
• SE Asia 8%
US ConverterUS Converter
Net: According to data extracted from interviews with converters, all US converters interviewed are using raw materials from N. America for their packaging products…some resins and other raw materials are being purchased from outside of the US. Currently only a small percentage said they are exporting finished/converted material outside of NA.

Sustainability (1)
• A real factor, and not just a fad!viz Wal-Mart

Sustainability (2)Some definitions for consideration:
Plastics that contain recycled material that has been previously used in consumer, rather than industrial products.
Post-consumer recycled plastics
Oil-based plastics, such as polyethylene terephthalate, that can be fully recycled and made into new products.
Recyclable plastics
Oil-based plastics containing an additive that causes them to break down, leaving behind a small amount of polymer residue.
Degradable/oxo-biodegradable plastics
Plastics that will fully decompose in a composting environment. Only plastics made from organic materials, such as starch, can compost.
Biodegradable/ compostable plastics
Plastics made from raw materials that are renewable. These can be annually renewable (such as corn starch) or materials like cellulose from wood.
Plastics from renewable resources (Sustainable)

Minimization
• Whether for environmental reasons, cost reasons or both, major advantage for flexible packaging

AGENDA
I. BACKGROUND AND ESSENCE
II. THE GLOBALIZATION STORY – OVERVIEW• Emerging Markets
III. CUSTOMER, RETAILER, CONVERTER OVERVIEW• Survey and Research Summary
IV. INFLUENCES, ISSUES AND DRIVERS
V. THREATS AND OPPORTUNITIES FOR FPA
VI. BUSINESS MODELS• External• Internal
VII. SUMMARY AND RECOMMEDATIONS

THREATS AND OPPORTUNITIES FOR FPA
Presented by:Michael Richmond, Ph.D.
PTIS4 October 2006

CONVERTER SWOT ANALYSIS

SWOT Results and Insights
• Small, medium and large converter SWOTs
• Opportunities and Threats
• Import/Export Insights

Large Converters - SWOT
Threats• Customer(s) purchased by non-customer• Customer(s) bought by foreign company• Customer(s) matrix getting more complex, contract manufacturing, decision making• Political changes• New substitutes• BRIC imports to U.S. significant and growing• No presence with brand owner in BRIC
Opportunities•Use tech knowledge to establish global partnerships•Use capital to expand global presence•Develop relationships with small/medium converters for contract work• BRIC country value added product growth• Presence with brand owner in BRIC
Weaknesses• Comparatively slower decision-making• Limited global presence• Dependence on a few large customers• Short runs due to SKU proliferation (no real short run offering)• No consumer recovery of flexibles
Strengths• Access to capital• Leverage with suppliers• Plants outside the U.S.• Significant technical / IP resources• Contracts with multi-nationals• Warehousing/logistics

Medium Converters - SWOT
Threats• Customer(s) bought by non-customer• Customer(s) bought by foreign entity• Customer(s) matrix getting more complex, contract manufacturing, decision making• Forced sale to large domestic or foreign converter• Low wage flexible converters start
exporting to the U.S.• Political changes• New substitutes• Lack of differentiation• Import growth by BRIC in U.S.
Opportunities• Develop niche products for world-wide sale• Partner with large, foreign converter• Sell-out to large multi-national converter • Develop sub-contractor roles with large converters• Regulated products• Small run sizes• Relationships • Develop cultural understanding and relationships in HGOC for potential growth/expansion
Weaknesses• No foreign operations• Limited R&D resources• Limited customer base• Lack of capital to become a global operation• No sustainable packaging programs
Strengths• Moderate capital available• Technical expertise in some areas• Ability to make quick decisions• Leverage with some suppliers• A few multi-national customers• Flexibility

Small Converters - SWOT
Threats• Customer(s) bought by foreign or domestic non-customer• Low-wage flexible converters exporting to the U.S. especially value-added products• Forced sale to large foreign or domestic
converter • New substitutes• Lack of differentiation• Import growth by BRIC in U.S.
Opportunities• Look for niche products to sell worldwide• Partner with foreign converter• Sell to larger foreign or domestic converter• Sub-contract to larger converter• Focus on speed-to-market opportunities• Focus on local customer base• Regulated products• Small run sizes• Relationships (know customer’s business)• BRIC country growth
Weaknesses• Limited capital• Limited R&D resources• Limited supplier leverage• No foreign operations• No sustainable packaging programs
Strengths• Ability to make quick decisions• Technical and manufacturing expertise in niche product areas• Loyal customer base• Flexibility

Import / Export Insights
Consumer Goods Imports from Interest Countries* as % of Total Imports to US
26%29%
31%32%
36%
0%
5%
10%
15%
20%
25%
30%
35%
40%
2001 2002 2003 2004 2005
Perc
ent
*China, Brazil, India, Russia
•36% of US Imports are from BRIC Countries
•US$360.5 billions (2005)
• China remains by far the largest source of imports, accounting for two-thirds of the 4-country total and almost 15% of the world’s total imports into the US in 2005.

2005 US Imports by End-Use Category
Consumer Goods27%
Capital Goods28%
Petroleum16%
Industrial Supplies7%
Food, Feed & Beverage
4%Other Goods3%
Automotive Vehicles
15%
Total = $1.67 Trillion
Import / Export Insights
Consumer Goods Import Trends. Imports of consumer goods, those most likely to provide opportunities for flexible packaging, accounted for over 27% of all goods imported in 2005.

Growth Rates Of Imports That OutpaceGrowth Rates Of Consumption
• US producers of goods and by extension, those that package those goods are in fact seeing erosion of their markets
• Our surveys suggest that very little is packaged when it gets tothe US. Data is not available to quantify this amount, but offshore production is reducing the US packaging market potential
• We have worked with broad statistical groupings (rather than breaking out specific market categories/segments) to cancel out the effects of individual market segments – further research can be conducted to identify most vulnerable market categories

Import / Export Threat Summary
• Consistently Rapid Growth of Packageable Goods Imports Exceeding US Consumption Growth
• China's Broad Participation
• Multibillion Dollar Annual Impact On Industry - $360.5 billion
• The threat is real and growing!

1
1
1
1
1
1
1
1
1
Rank
Opportunity to develop stronger converter/CP relationships, especially regionally
•Global Brand Owners may have more than 250 contract packagers providing product/services for them
Opportunity to look at for new solutions in the future
•Global Supply Chain /Logistics is in it's infancy
Focus on Regulated customers•Regulated products in US (Food, Pharma) may provide safety net for US converters
Opportunity to go to D&E for purchases and even to consolidate purchases to be more competitive against imports
•Significant raw Material Purchasing by small and medium converters
Great time to develop converter/retail partnerships
•Lack of retail sophistication - all aspects (specifying packaging, managing suppliers, design, etc
With Retail push – great time to develop Sustainable packaging action plans. Based on the surveys, very few companies in the value chain have them
•Retail push on sustainable packaging in US will provide new converter opportunities.
Good opportunity to focus on new flexible growth products – dairy/juices/teas/hot drinks in D&E Countries
•pouch growth for single serve beverages in D&E, both hot and cold products?
Good opportunity to focus on new flexible growth products – dairy/juices/teas/hot drinks in D&E Countries
•on-the-go has been going on for a while but looks like it will hit the D&E markets and that will be a big one
Margin building and differentiating for converter specialties
•Developed countries focus on added value structures
Implications = Ah HasThreats/Opportunities

1Says there really is growth in the USA and it is value/benefit growth
•U.S. considered HGOC by Brand Owners, Retailers and Converters
3•Niche products
3New flexible solutions leading to new product delivery solutions and growth opportunity defined by packaging
•Stick packs are creating new product opportunities in the US, while a common package format in Japan and Europe.
2
2
2
2
2
1
1
1
11Rank
Potential to grow with them•Developing markets focus on monolayer / simple structures, Flexible to flexible opportunities
Flexibles perceived as single use, on the go, compact. disposable.
•Growth of on the go
•Influence of global specs
Flexible solutions ranging from stick packs to large pouch formats for many products
•Minis and maxis. Very small/large products and packages.
Mass customization fit. Reduced inventory levels. More packages per square foot of shelf space.
•Growth in brand extensions (more skus =more packaging)
Real opportunity to be service provider and increase margin opportunity
•Demand that converters must be innovators
Good value added and margin adding opportunity for all converters
•Continuing choice of pouches to replace other formats
Good business sense and provides triple bottom line results – supported by sustainability and cost drivers
•Trend to minimization for cost reasons (some products)
Good business sense and provides triple bottom line results
•Trend to minimization for environmental reasons
Continue to see retail drive packaging growth•Growth of PL in value packaging
Implications = Ah HasThreats/Opportunities

Opportunities• Solutions Provision
– Artwork/DAM– VMI (CPFR) Collar Planning for Costing Replenishment– Sonoco Model
• Small/Medium – Look at BRIC as Sources of Supply– Quality Film
• Minimization Requirements Will Drive Innovation– Substrate Combinations– Programs– Processes
• US as HGOC– By Sector?– Less Shopping Time
• Consumer Trend Drivers– Changing Demographics and Domestic Habits– “Brand” Extensions– Be Nice to Your Customers – More Products
• Shelf Life Linked to Modern Retail Techniques

Opportunities• Small/Medium – Set Up Plant in HGOC – Top Line Growth• May Be No Connection to US Base. Supply HGOC Only (Greenfield)• Increase Pressure to Supply Own Needs (Tariffs)• Move with Current Customers
– 3 Ps – Patience, Presence, Prudence• Learn From Brand Owner Knowledge – Best Practices
– Where Buying Film?• Sustainability – Develop a Policy/Strategy• Align with Brand Owners/Retailers
– Association – Policy/Strategy– Individual Members– Energy Reduction Favors Films– Source Reduction – Films– Global/Regional Brand Owner Policy– Can FPA Influence Legislation Rather Than Be a Victim of It?– Creative Solutions

Opportunities• Retail sophistication
Question: Are suppliers able to get involved in contract packaging or management of contract packaging?Supply chain management?Managing outsourcing?Goal? = Reduces length of the supply chain?
• Tiering: Tier 1, 2, 3, suppliers
5PL5PL
4PL4PL
3PL3PL
2PL2PL
1PL1PL
Outsourcing Opportunities

AGENDA
I. BACKGROUND AND ESSENCE
II. THE GLOBALIZATION STORY – OVERVIEW• Emerging Markets
III. CUSTOMER, RETAILER, CONVERTER OVERVIEW• Survey and Research Summary
IV. INFLUENCES, ISSUES AND DRIVERS
V. THREATS AND OPPORTUNITIES FOR FPA
VI. BUSINESS MODELS• External• Internal
VII. SUMMARY AND RECOMMEDATIONS

BUSINESS MODELS
Presented by:Graham Cox
Head of International ConsultancyPira International
4 October 2006

Opportunities for US Converters
Opportunity
External (Global = Proactive)
Internal (Domestic = Reactive)
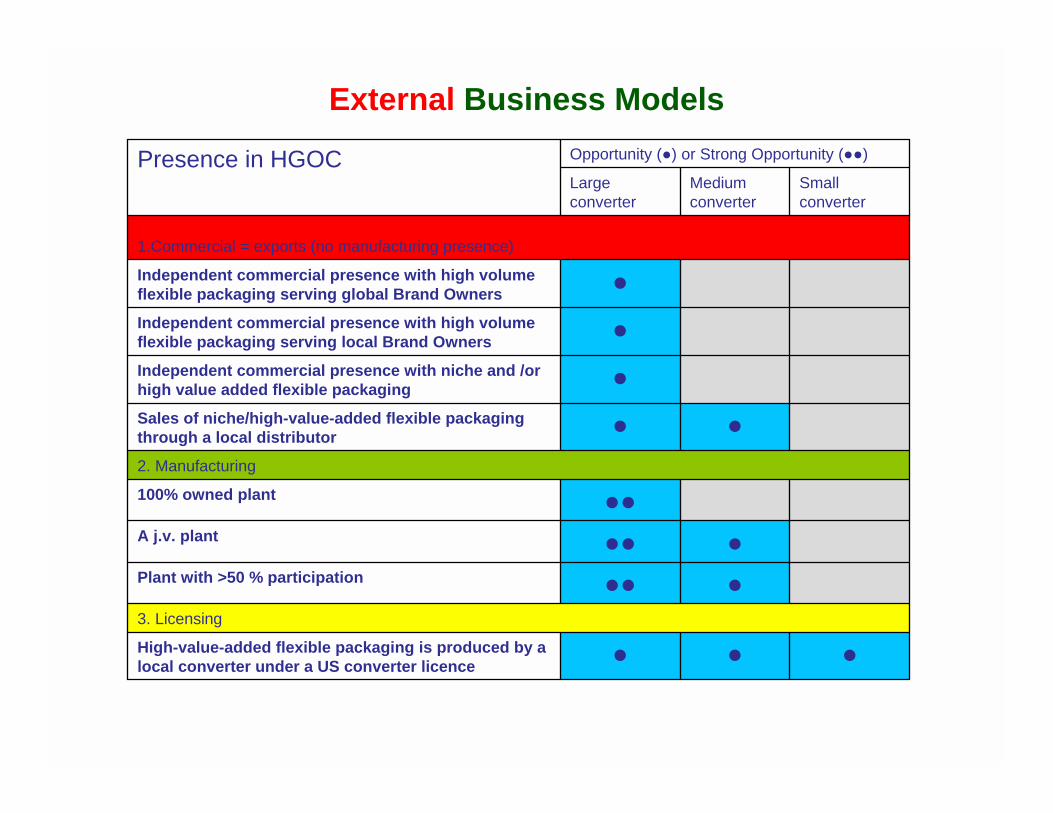
External Business Models
●●●High-value-added flexible packaging is produced by a local converter under a US converter licence
3. Licensing
●●●Plant with >50 % participation
●●●A j.v. plant
●●100% owned plant
2. Manufacturing
●●Sales of niche/high-value-added flexible packaging through a local distributor
●Independent commercial presence with niche and /or high value added flexible packaging
●Independent commercial presence with high volume flexible packaging serving local Brand Owners
●Independent commercial presence with high volume flexible packaging serving global Brand Owners
1.Commercial = exports (no manufacturing presence)
Small converter
Medium converter
Large converter
Opportunity (●) or Strong Opportunity (●●)Presence in HGOC

External Business Models
●●Sales of niche/high-value-added flexible packaging through a local distributor
●Independent commercial presence with niche and /or high value added flexible packaging
●Independent commercial presence with high volume flexible packaging serving local Brand Owners
●Independent commercial presence with high volume flexible packaging serving global Brand Owners
1.Commercial = exports (no manufacturing presence)
Small converter
Medium converter
Large converter
Opportunity (●) Strong Opportunity (●●)
Presence in HGOC

External Business Models
●●●Plant with >50 % participation
●●●A j.v. plant
●●100% owned plant
2. Manufacturing
Small converter
Medium converter
Large converter
Opportunity (●) Strong Opportunity (●●)
Presence in HGOC

External Business Models
●●●High-value-added flexible packaging is produced by a local converter under a US converter licence
3. Licensing
Small converter
Medium converter
Large converter
Opportunity (●) Strong Opportunity (●●)
Presence in HGOC

Internal Business Models
●●●●●●Use FPA as a platform to promote your products and gain strategic insights
●●●●●Form a purchasing/outsourcing consortium/collaborative network with other US converters
●●●●●Merge with another US converter to achieve economies of scale
●●●●●●Form a strategic partnership/aligned agenda with your key customers/other converters/equipment manufacturers/ raw materials suppliers
5. Strategic
●●●●●●Lean manufacturing and other operational improvements (e.g. cash flow)
●●●●●●Outsourcing non-core business , e.g. IT, HR, etc
●●●●●●Purchasing of raw materials (polymers, aluminum foil, paper, unprinted bio-oriented films, inks etc) from HGOC/in bulk
4. Price competitiveness (through cost reduction)
●●●Additional service offering, e.g. Collaborative Planning Forecasting and Replenishment (CPFR), Vendor Managed Inventory (VMI), pack design, etc
●●●●●Order flexibility (no minimum order)
●●●●●Short lead times
3. Service
●●●●●●Establish plants closer to main clients
2. Manufacturing location
●●●●●Focus on sustainable flexible packaging
●●●●●Niche/innovative/high-value added flexible packaging
1. Commercial
Small converter
Medium converter
Large converter
Opportunity (●) or Strong Opportunity (●●)Ways of addressing the need created by globalization

Internal Business Models
●●●●●Focus on sustainable flexible packaging
●●●●●Niche/innovative/high-value added flexible packaging
1. Commercial
Small converter
Medium converter
Large converter
Opportunity (●) Strong Opportunity (●●)
Ways of addressing the need created by globalization

Internal Business Models
●●●Additional service offering, e.g. Collaborative Planning Forecasting and Replenishment (CPFR), Vendor Managed Inventory (VMI), pack design, etc
●●●●●Order flexibility (no minimum order)
●●●●●Short lead times
3. Service
●●●●●●Establish plants closer to main clients
2. Manufacturing location
Small converter
Medium converter
Large converter
Opportunity (●) Strong Opportunity (●●)
Ways of addressing the need created by globalization

Internal Business Models
●●●●●●Lean manufacturing and other operational improvements (e.g. cash flow)
●●●●●●Outsourcing non-core business , e.g. IT, HR, etc
●●●●●●Purchasing of raw materials (polymers, aluminum foil, paper, unprinted bio-oriented films, inks etc) from HGOC/in bulk
4. Price competitiveness (through cost reduction)
Small converter
Medium converter
Large converter
Opportunity (●) Strong Opportunity (●●)
Ways of addressing the need created by globalization

Internal Business Models
●●●●●●Use FPA as a platform to promote your products and gain strategic insights
●●●●●Form a purchasing/outsourcing consortium/collaborative network with other US converters
●●●●●Merge with another US converter to achieve economies of scale
●●●●●●Form a strategic partnership/aligned agenda with your key customers/other converters/equipment manufacturers/ raw materials suppliers
5. Strategic
Small converter
Medium converter
Large converter
Opportunity (●) Strong Opportunity (●●)
Ways of addressing the need created by globalization

AGENDA
I. BACKGROUND AND ESSENCE
II. THE GLOBALIZATION STORY – OVERVIEW• Emerging Markets
III. CUSTOMER, RETAILER, CONVERTER OVERVIEW• Survey and Research Summary
IV. INFLUENCES, ISSUES AND DRIVERS
V. THREATS AND OPPORTUNITIES FOR FPA
VI. BUSINESS MODELS• External• Internal
VII. SUMMARY AND RECOMMEDATIONS

Summary Comments and Insights• Value-added/high technologies/niche products will continue to be
sourced from the West but there are first signs of value added pouches with zippers and high end graphics going to Canada from China
• High interest in sourcing simple (undecorated) materials from emerging markets (notably China) is evident: existing examples of USA/Mexico and China as well as Western Europe/Eastern Europe and Middle East
• Opportunities created by globalization can be external (global) and internal (domestic)
• NA Markets have high material and labor costs compared to China/SA but many converters are going to South America and China for raw materials

Summary Comments and Insights
• Flexible packaging growing faster in emerging markets than in developed economies. Small, medium and large converters all recognize that global market is growing, especially in SE Asia
• Global Brand Owners are becoming more global and are looking for global suppliers on this basis Regional and global flexible packaging purchasing growing and will grow still further
• Global flexible packaging purchasers still regard the West as having better technologies and high quality in general – but emerging markets are catching up
• Supply Chain, Logistics/Deliveries and local service and even language barriers prevent NA companies from sourcing globally, and provide barriers to setting up business in HGOCs
Summary Comments and Insights• External opportunities exist for large and medium size US
converters to establish presence in emerging markets by one or more business models (JV, technology transfer, licence deals, agencies, etc)
• Small and medium US converters can exploit mainly internal opportunities. In fact, they are happy focusing on US/NA Markets. Opportunity exists for small/medium size converters to support large converters as they develop new global business
• Consideration by all converters to purchase other raw materials (notably polymers) from these markets to increase competitiveness: look in detail at purchasing arrangements

Summary Comments and Insights
• Other ways of achieving competitiveness include:– Possible co-operation deals to increase effectiveness (other
converters, equipment suppliers, raw materials suppliers)– Develop new models for supply to US customers – strategic
alliances, solutions provision, tiered supply, etc.– Consider cost-saving techniques for existing supply
arrangements – outsourcing, shift arrangements, etc.– Decide when to work as individual companies and when as
an industry (FPA)– Ensure flexibility of thought in dealings with customers –
things can change again tomorrow

Summary and Recommendations
• Globalization is real and flexible packaging converters need to look at both the opportunities and threats of the continued movement toward a flat world
• Review the business models to see if there are fits for your organizations
• Be sure and read the Final Word Document to gain additional insights and opportunities from this exciting project
• Please contact PTIS or Pira regarding additional comments and questions

The Researchers Thank You• Packaging and Technology Integrated Solutions, LLC (PTIS)
helps individuals and client companies by delivering focused strategic & tactical results across packaging & technology. PTIS has made important contributions to more than 100 clients over the last five years in areas including project management, leading productivity programs, staffing, strategy and business assessment and new growth initiatives through packaging. PTIS has completed research programs for leading trade associations, and developed multiclient reports for Packaging Strategies, and PakIntell. PTIS works across the packaging value chain.
• Pira International is the leading independent centre for research, consultancy, publishing, training and information services for the packaging, printing, publishing and paper industries. Pira focuses on providing benefits and adding value to enhance the performance and profitability of companies in our industry sectors. Pira has a track-record of delivering value to clients for over 75 years.