The Impact of Globalization on Obesity Epidemic in...
18
The Impact of Globalization on Obesity Epidemic in Brazil Sílvia H. G. de Miranda – ESALQ- USP/Brazil Dragan Miljkovic – NDSU/USA Ana L. Kassouf – ESALQ-USP/Brazil Fabíola C. Oliveira –ESALQ/USP San Diego 9-11, 2012 IATRC Annual Meeting
Transcript of The Impact of Globalization on Obesity Epidemic in...
The Impact of Globalization on Obesity Epidemic in Brazil
Sílvia H. G. de Miranda – ESALQ- USP/Brazil
Dragan Miljkovic – NDSU/USA
Ana L. Kassouf – ESALQ-USP/Brazil
Fabíola C. Oliveira –ESALQ/USP
San Diego 9-11, 2012
IATRC Annual Meeting

Outline
I – Introduction
- Objectives
II – A Model of Trade with a Cross-Border Externality
III – Empirical Model and Database
IV - Results

I - Introduction
• Ongoing research
• There are debates about the externalities caused by trade liberalization, such as the environmental degradation.
• As globalization is a broader process compared to trade liberalization, other externalities might exist such as adverse impacts on cultural diversity, spreading infectious diseases and obesity global epidemic
• Obesity has increased in developed countries as well as developing countries.
• FAO (2008): obesity increases rapidly in developing countries, even in those where hunger still exists

Figure 1 – Brazilian Agribusiness and total trade balance: imports and exports (Current US$ Billion). Brazil: 1989-2011. Source: based on Agrostat database, apud MAPA

Figure 2 – Foreign Direct Investment in Brazil, 1975-2011 (US$ Million). Source: Payment Balance. Source: Bacen (www.bacen.gov.br).
0
10,000
20,000
30,000
40,000
50,000
60,000
70,000
19
75
19
76
19
77
19
78
19
79
19
80
19
81
19
82
19
83
19
84
19
85
19
86
19
87
19
88
19
89
19
90
19
91
19
92
19
93
19
94
19
95
19
96
19
97
19
98
19
99
20
00
20
01
20
02
20
03
20
04
20
05
20
06
20
07
20
08
20
09
20
10
20
11
US$
Mil
lio
n
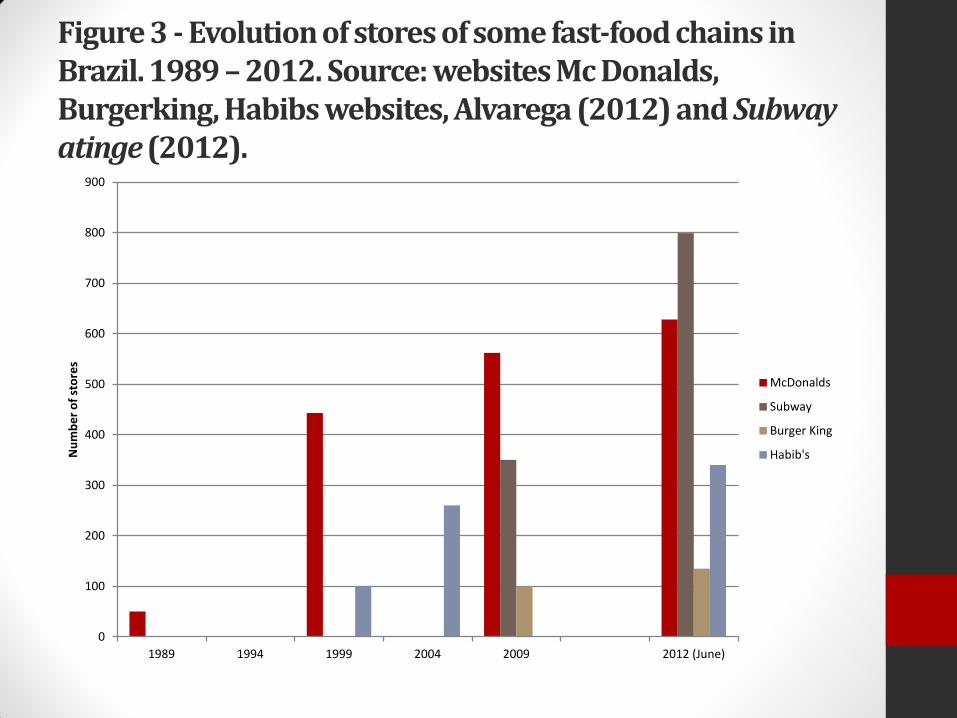
Figure 3 - Evolution of stores of some fast-food chains in Brazil. 1989 – 2012. Source: websites Mc Donalds, Burgerking, Habibs websites, Alvarega (2012) and Subway atinge (2012).
0
100
200
300
400
500
600
700
800
900
1989 1994 1999 2004 2009 2012 (June)
Nu
mb
er
of
sto
res
McDonalds
Subway
Burger King
Habib's

Objective
To determine the likely effects of globalization on the global epidemic of obesity, and particularly to examine the
Brazilian case.
Theoretical Model’s Outcome
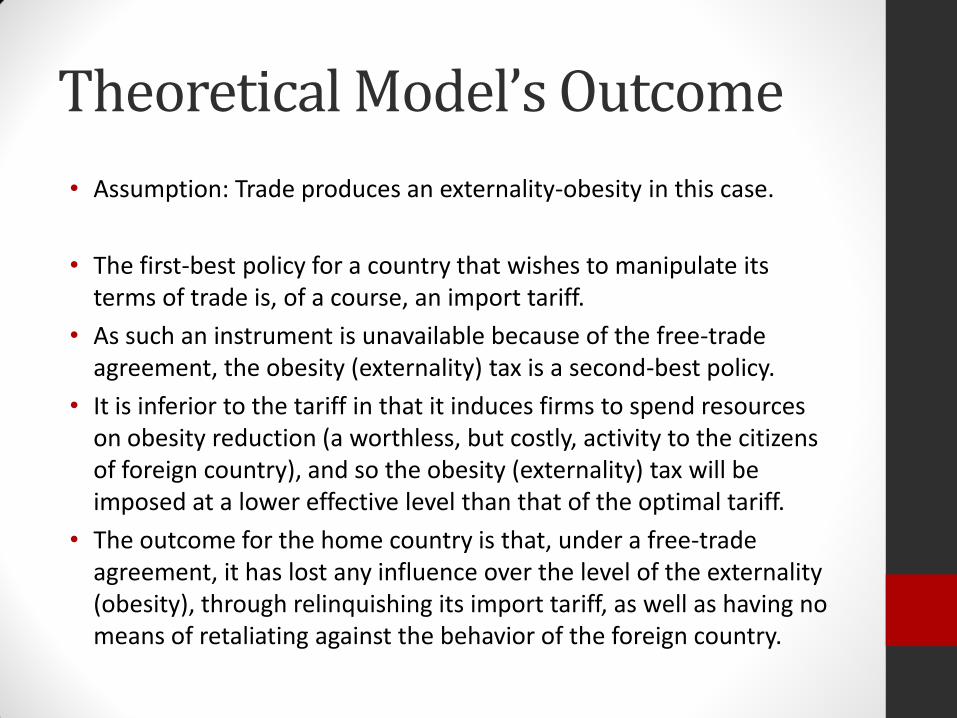
• Assumption: Trade produces an externality-obesity in this case.
• The first-best policy for a country that wishes to manipulate its terms of trade is, of a course, an import tariff.
• As such an instrument is unavailable because of the free-trade agreement, the obesity (externality) tax is a second-best policy.
• It is inferior to the tariff in that it induces firms to spend resources on obesity reduction (a worthless, but costly, activity to the citizens of foreign country), and so the obesity (externality) tax will be imposed at a lower effective level than that of the optimal tariff.
• The outcome for the home country is that, under a free-trade agreement, it has lost any influence over the level of the externality (obesity), through relinquishing its import tariff, as well as having no means of retaliating against the behavior of the foreign country.

II – Empirical model and database: Database
ENDEF
(1974-1975)
PNSN
(1989)
POF (2002-
2003)
POF
(2008-
2009*)
Overweight
Male 18.6 29.5 41.0 50.1
Female 28.6 40.7 39.2 48.0
Obesity
Male 2.8 5.1 8.8 12.4
Female 7.8 12.8 12.7 16.9
Total - 11.7 13.1
Table 1 – Prevalence of overweight and obesity in population older than 20 years, by gender. Brazil, ENDEF (1974-75), PNSN (1989) and POF (2002-03, 2008-09). In % of population

Database
• PANEL – 26 states plus the Federal District
• Period - 1989, 2002 and 2008
• Restrictions on anthropometric statistics
• Independent variables: number of overweight and obese people (or percent in total population)
• Explanatory variables - trade (exports/imports flow), average income, schooling years, economically active people, consumption of sugar, sodas, beans (traditional staple food in Brazil) and prepared food
• Several control variables - race, male/female and age of population.
• Source: POF, PNAD (IBGE) and PNSA (Ministry of Health)
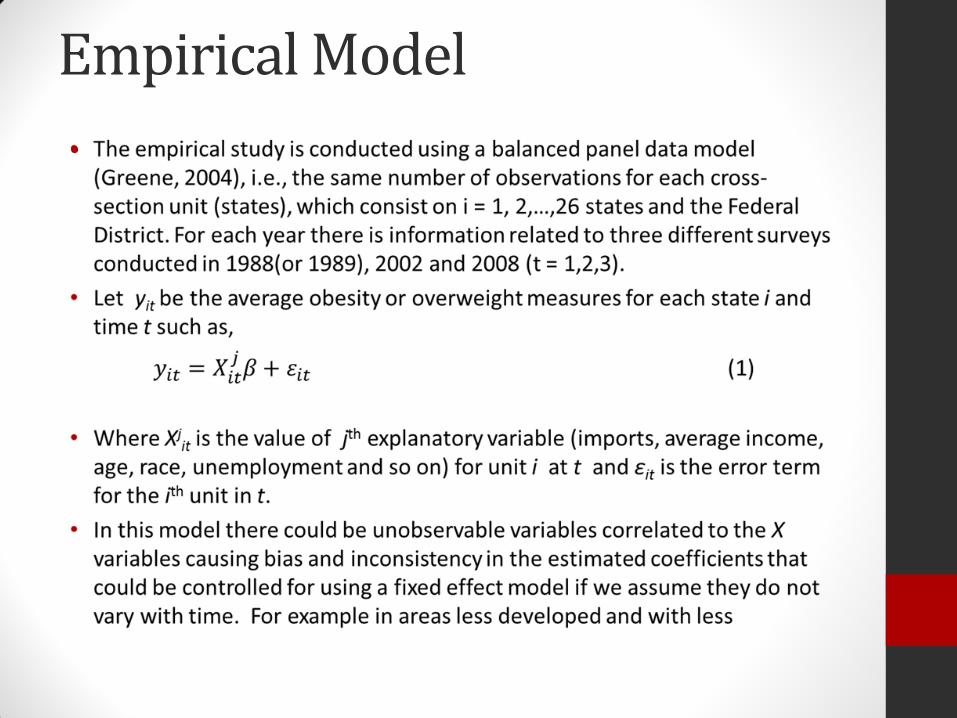
Empirical Model
•
Results and Discussion
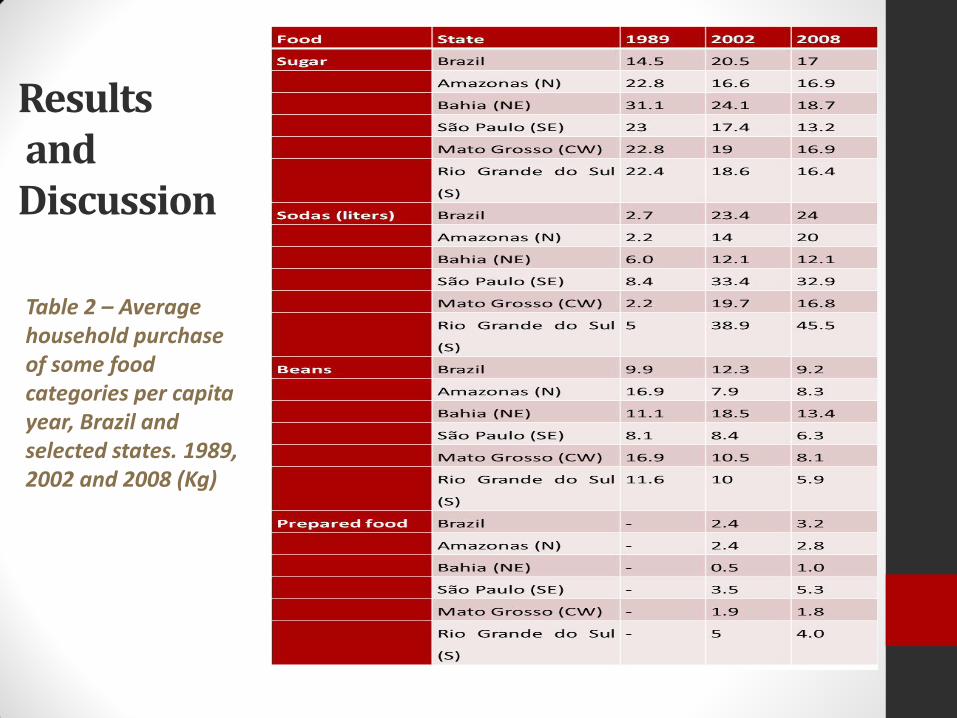
Table 2 – Average household purchase of some food categories per capita year, Brazil and selected states. 1989, 2002 and 2008 (Kg)

Figure 4 – Total imports by Brazilian state, in real US$ billion values
0.00
10,000,000,000.00
20,000,000,000.00
30,000,000,000.00
40,000,000,000.00
50,000,000,000.00
60,000,000,000.00
70,000,000,000.00 R
on
do
nia
Acr
e
Am
azo
nas
Ro
raim
a
Par
á
Am
apá
Toca
nti
ns
Mar
anh
ão
Pia
uí
Cea
rá
Rio
G. N
ort
e
Par
aíb
a
Per
nam
bu
co
Ala
goas
Serg
ipe
Bah
ia
Min
as G
erai
s
Esp
írit
o S
anto
Rio
de
Jan
eiro
São
Pau
lo
Par
aná
San
ta C
atar
ina
Rio
G. d
o S
ul
Mat
o G
ross
o S
ul
Mat
o G
ross
o
Go
iás
Dis
trit
o F
eder
al
1989 2002 2008

Table 3 - Some anthropometric, household and social data for selected states. Brazil. 1989, 2002 and 2003. Sources: POF, PNAD, PNSA
State Overweigh (% pop.)
Obesity (% pop.)
Household income p.c./ year* (R$ real values 2008)
Average schooling years for people older than 10 years
Brazil - 1989 25.62 8.8 4.4
Amazonas (N) 27.12 8.64 366.30 4.8
Bahia (NE) 20.64 5.14 229.78 3.1
São Paulo (SE) 27.42 9.89 608.70 5.2
Mato Grosso (CW) 24.80 7.87 392.41 4.0
Rio Grande Sul (S) 28.42 11.86 423.75 4.9
Brazil - 2002 28.78 10.51 6.4
Amazonas (N) 25.62 7.81 500.27 6.8
Bahia (NE) 24.25 7.80 375.45 5.0
São Paulo (SE) 30.66 12.36 924.44 7.5
Mato Grosso (CW) 28.78 8.83 643.80 6.3
Rio Grande Sul (S) 32.54 14.45 781.19 6.9
Brazil - 2008 33.97 14.64 7.3
Amazonas (N) 36.19 11.01 563.43 7.2
Bahia (NE) 29.78 11.14 503.38 6.1
São Paulo (SE) 35.45 16.31 1002.84 8.3
Mato Grosso (CW) 32.19 14.50 828.39 7.2
Rio GrandeSul (S) 37.09 19.82 934.19 7.7

Table 4 – Results of fixed effects panel model for Brazil (26 states + Federal district). Dependent variable: log of ratio of obese and overweigh people (older than 20 years) in the total population. 1989, 2002 and 2008
Variables Overweight Obesity
Log of trade openness 0.0440* (0.0257) 0.1017* (0.0523)
log of per capita family income (in real values for
2008)
-0.0783 (0.0971)
Gender (female percentage in total population) -0.0214 (0.01399) -0.0198 (0.0319)
Average years of schooling (for people older than 10) -0.2167** (0.0965)
“Mulato” people (% in total population) -0.0377 (0.0482) -0.1179 (0.1014)
Yellow people (% in total population) -0.0341 (0.0701) -0.1725 (0.1499)
Black people (% in total population) -0.0457 (0.0512) -0.1209 (0.1061)
White people (% in total population) -0.0403 (0.0485) -0.1160 (0.1022)
Percentage of households with TV 0.0072*** (0.0019) 0.0132*** (0.0032)
Household purchase of beans (kg p.c./year) 0.0050 (0.00352) 0.0211*** (0.0074)
Household purchase of sodas (liters p.c./year) 0.0045** (0.0022)1 0.0074 (0.0046)2
Binary variable for 2002 -0.0819 (0.0540) 0.1791 (0.2006)
Binary variable for 2008 0.0687 (0.0732) 0.7278** (0.3025)
Constant 8.0150 (5.0424) 14.3422 (10.5134)
States fixed effects (27 units) Yes Yes
Year fixed effects (3 years) Yes Yes
Number of observations 79 79
Robust standard errors. ***Significant at 1% level, ** Significant at 5% level, * Significant at 10% level. Note: the variables gender and race are controls. In the case of race, native indian people were left out. 1 It is significant at 5.2% 2 It is significant at 11 percent level
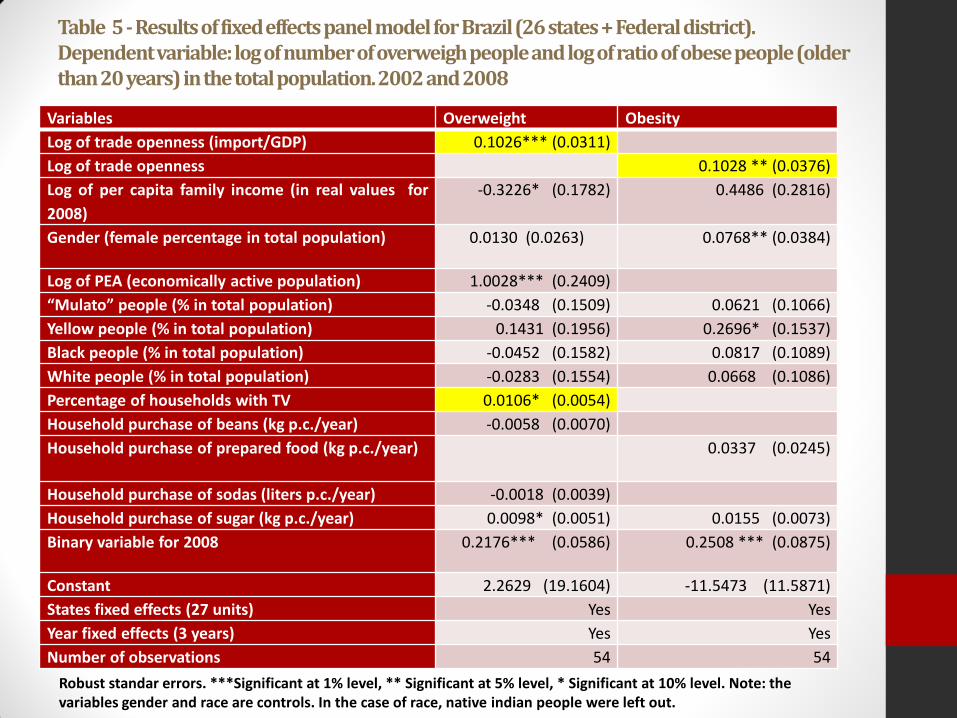
Table 5 - Results of fixed effects panel model for Brazil (26 states + Federal district). Dependent variable: log of number of overweigh people and log of ratio of obese people (older than 20 years) in the total population. 2002 and 2008
Variables Overweight Obesity
Log of trade openness (import/GDP) 0.1026*** (0.0311)
Log of trade openness 0.1028 ** (0.0376)
Log of per capita family income (in real values for
2008)
-0.3226* (0.1782) 0.4486 (0.2816)
Gender (female percentage in total population) 0.0130 (0.0263) 0.0768** (0.0384)
Log of PEA (economically active population) 1.0028*** (0.2409)
“Mulato” people (% in total population) -0.0348 (0.1509) 0.0621 (0.1066)
Yellow people (% in total population) 0.1431 (0.1956) 0.2696* (0.1537)
Black people (% in total population) -0.0452 (0.1582) 0.0817 (0.1089)
White people (% in total population) -0.0283 (0.1554) 0.0668 (0.1086)
Percentage of households with TV 0.0106* (0.0054)
Household purchase of beans (kg p.c./year) -0.0058 (0.0070)
Household purchase of prepared food (kg p.c./year) 0.0337 (0.0245)
Household purchase of sodas (liters p.c./year) -0.0018 (0.0039)
Household purchase of sugar (kg p.c./year) 0.0098* (0.0051) 0.0155 (0.0073)
Binary variable for 2008 0.2176*** (0.0586) 0.2508 *** (0.0875)
Constant 2.2629 (19.1604) -11.5473 (11.5871)
States fixed effects (27 units) Yes Yes
Year fixed effects (3 years) Yes Yes
Number of observations 54 54
Robust standar errors. ***Significant at 1% level, ** Significant at 5% level, * Significant at 10% level. Note: the variables gender and race are controls. In the case of race, native indian people were left out.

Final remarks
• The study shows limited evidence of effects of globalization over anthropometric measures in Brazil
• However there are some evidences that trade openness has positive effects on the number of overweight and obese people and effects differ according to states
• Models for overweight performed better than for obesity, with more robustness
• Database has some restrictions and they are currently being worked on to improve the treatment to FDI variable and to other variables that indicate a change of life style that could affect obesity and overweigh ratios

Acknowledgments
• TO FAPESP – FUNDAÇÃO DE AMPARO À PESQUISA DO ESTADO DE SÃO PAULO, SÃO PAULO, BRAZIL FOR SPONSORING A PART OF THIS STUDY