The Impact of Elastic Logistics on Brand Loyalty and ...
23
International Journal of Management and Social Researches Uluslararası Yönetim ve Sosyal Araştırmalar Dergisi ISSN:2148-1415/ e-ISSN:2651-3072 Cilt 7, Sayı 14, Yıl 2020 Makale Başvuru/Kabul Tarihleri: Received/Accepted Dates: 01.09.2020/05.11.2020 Research The Impact of Elastic Logistics on Brand Loyalty and Customer Satisfaction Zainab Abdulhameed BEIROUTY Ph.D. Student at Yeditepe University Istanbul, Turkey ORCID: 0000-0002-0167-3499 Abstract Each business seeks a competitive advantage to win the market race and build a strong brand value that leads to customer satisfaction and loyalty. In logistics, flexibility in customization to the maximum customer preferability can make a difference. Consumer’s demand for customization in shipping, tracking cargo, prices, and shipping quantity have pushed logistics companies to invent the concept of elastic logistic. This study aims to examine the impact of elastic logistics on customer loyalty and customer satisfaction depending on service quality and pricing strategy on elastic logistics. The relationship between elastic logistics services, satisfaction, and customer loyalty in the courier sector will be hypothesized to be positive. To identify factors that affect customer loyalty of elastic logistic services; a conceptual model is developed to test the hypotheses using quantitative research methods by conducting a survey and distributing it on a convenience sample. The service quality in the elastic logistics industry is given special consideration in a matter of responsiveness, reliability, customer service, support, and network quality. The study shows excellent support for the proposed hypotheses, especially in the Asia region. Keywords: Elastic Logistics Systems, Efficiency Of Distribution, Customer Satisfaction, Quality Of Services, Customer Loyalty, Flexibility, Agile Systems. INTRODUCTION Elastic Logistics means flexibility in aligning logistics capabilities with customer needs. Alternatively, it is the ability to provide the customer with his preferences in shipping through a flexible cloud-based supply chain fixes adjusting companies to market alterations to meet the consumer’s demand at lower costs enhancing the customer’s experience through digitalizing the supply chain process offering a real-time visibility option. The definition of supply chain management was already stated in business literature as early as (Forrester 1958-1961), which indicated that industrial firms’ performance relied on ‘interactions between knowledge flows, resources, manpower, and capital equipment.’ However, given its informative conceptualization, the actual term supply chain management did not materialize until the early 1980s (Oliver & Webber 1). Several scholars have proposed that we are now moving into a new phase where firm efficiency and competitive advantage can be related to supply chain effectiveness (Lambert, et al., 1998; Gun-asekaran, et al., 2001). According to recent studies, the field
Transcript of The Impact of Elastic Logistics on Brand Loyalty and ...
International Journal of Management and Social Researches Uluslararası Yönetim ve Sosyal Araştırmalar Dergisi
ISSN:2148-1415/ e-ISSN:2651-3072
Cilt 7, Sayı 14, Yıl 2020
Makale Başvuru/Kabul Tarihleri: Received/Accepted Dates:
01.09.2020/05.11.2020
Research
The Impact of Elastic Logistics on Brand Loyalty and Customer Satisfaction
Zainab Abdulhameed BEIROUTY
Ph.D. Student at Yeditepe University
Istanbul, Turkey
ORCID: 0000-0002-0167-3499
Abstract
Each business seeks a competitive advantage to win the market race and build a strong brand value that leads to customer
satisfaction and loyalty. In logistics, flexibility in customization to the maximum customer preferability can make a
difference. Consumer’s demand for customization in shipping, tracking cargo, prices, and shipping quantity have pushed
logistics companies to invent the concept of elastic logistic. This study aims to examine the impact of elastic logistics on
customer loyalty and customer satisfaction depending on service quality and pricing strategy on elastic logistics. The
relationship between elastic logistics services, satisfaction, and customer loyalty in the courier sector will be hypothesized
to be positive. To identify factors that affect customer loyalty of elastic logistic services; a conceptual model is developed to
test the hypotheses using quantitative research methods by conducting a survey and distributing it on a convenience
sample. The service quality in the elastic logistics industry is given special consideration in a matter of responsiveness,
reliability, customer service, support, and network quality. The study shows excellent support for the proposed hypotheses,
especially in the Asia region.
Keywords: Elastic Logistics Systems, Efficiency Of Distribution, Customer Satisfaction, Quality Of Services, Customer Loyalty,
Flexibility, Agile Systems.
INTRODUCTION
Elastic Logistics means flexibility in aligning logistics capabilities with customer needs. Alternatively, it
is the ability to provide the customer with his preferences in shipping through a flexible cloud-based
supply chain fixes adjusting companies to market alterations to meet the consumer’s demand at
lower costs enhancing the customer’s experience through digitalizing the supply chain process
offering a real-time visibility option.
The definition of supply chain management was already stated in business literature as early as
(Forrester 1958-1961), which indicated that industrial firms’ performance relied on ‘interactions
between knowledge flows, resources, manpower, and capital equipment.’ However, given its
informative conceptualization, the actual term supply chain management did not materialize until
the early 1980s (Oliver & Webber 1). Several scholars have proposed that we are now moving into a
new phase where firm efficiency and competitive advantage can be related to supply chain
effectiveness (Lambert, et al., 1998; Gun-asekaran, et al., 2001). According to recent studies, the field
http: //www.uysad.com 7 (14) 2020
326
of elastic logistics and resilience is still new, and the researchers are emerging in this field, which
opens the space to contribute to this field by studying this paper. Customer satisfaction has attracted
growing interest in recent literature on e-commerce (Burt & Sparks, 2003). Several reports have
demonstrated the importance of diverse organizational factors in assessing the satisfaction and
engagement of consumers and, eventually, the effectiveness of companies (e.g., Collier & Bienstock,
2006; Hsiao, 2009). All of these studies have concentrated on the relationship between company
success and logistics success. Through literature; logistics efficiency has been analyzed as a single
factor or as part of a group of organizational variables
This paper’s objective is to study the impact of elasticity in logistics on customer loyalty and
satisfaction. Studying the relationship between the service’s quality and the pricing policy affects the
customer’s satisfaction. The results might help companies develop a long-term strategic plan that
can assure sustainable business success and higher competitive advantage for the companies in the
market and see if customer satisfaction leads to more loyalty.
The potential of a company to attract and maintain clients is critical to its growth. Consumer loyalty
requires a deep preference on the part of the consumer for a company for which many component
providers are available (Dick & Basu, 1994; Otim & Grover, 2006). It is also influenced by a customer’s
positive experience of buying it. A variety of factors relate to service – flexibility, product quality,
distribution, return policy, etc. Naturally, some of these elements are concentrated on the
company’s efficient logistic efficiency. The reason behind these hypotheses comes from the
increasing demand for logistics, which creates the need to find a competitive advantage increasing
customer satisfaction and loyalty depending on the quality of the service, cost, or efficiency. Deciding
which factor is more critical to the customer will define the shape of the relationship between the
customer and the logistics company, and the ability to customize the customer’s preferences and
demands will probably lead to more customer satisfaction and increase brand loyalty.
1. Literature Review
● Theoretical Background
(Sarkis, 2001) described agility as the capacity of continuous and sometimes unpredictable transition
in an environment of productivity. (DeVor et al., 1997) considered agility as a provider of products
and services to function profitably in an ongoingly and volatile competitive climate while (Sharifi &
Zhang, 1999) described agility as a capacity to overcome sudden changes, to withstand unforeseen
market challenges, and to maximize the opportunities of transition. (Dove, 1994, 1999) provided a
detailed description of agility that also came into being through (Yusuf et al., 1999), which was used
to understand and explain agility as a means of effectively leveraging competitive foundations
(speed, versatility, constructive creativity, efficiency, profitability). This description stresses the need
to combine resources as a prerequisite for agility. (Yusuf et al., 1999) responded to Dove's concept of
agility by defining some preconditions to agility, which added to the research base. Recent
definitions conceive of agility as a framework enabling companies to adapt rapidly to the diverse
demands of customers (Brown & Bessant, 2003; Vinodh, 2010).
Flexibility is commonly used as an appropriate response to environmental vulnerability (Gerwin,
1993). In particular, this represents a system's ability to adapt or to respond on time, commitment,
expense, or results with low penalties. (Crowe, 1992; Upton, 1994; Morlok & Chung, 2004). Flexibility
is thus seen as a constructive trait that is intended to shape a structure rather than a reactive action,
which can, in turn, lead to a risk to time, energy, expense, and efficiency. Flexibility in range refers to
conditions or attitudes, while reactions refer to the ease at which a system will change, often
http: //www.uysad.com 7 (14) 2020
327
articulated as regards expense or time (Naim et al., 2006). (Lummus et al., 2003) suggest that
flexibility in the logistics refers to the punctuality of the supply chain in responding to consumer
demand and the degree of its speed and destination changes.
The growing perceptions of consumers are one of the most significant external influences that affect
businesses. In order to be successful, companies need to understand clearly the requirements and
constraints of the marketplace and then develop a strategy that meets the needs of both logistics
system requirements and customers (Landis, 1999). One of the main objectives of logistics
management is to meet customer requirements while reducing costs. There has recently been some
significant debate about the "lean" and "agile" paradigms as key enablers (Steele, 2001). In order to
differentiate between the lean and agile concepts, (Naylor et al., 1999) propose:
“Agility means using industry information and a virtual organization to take advantage of the growth
in a competitive marketplace.”
“Leanness means creating a value chain to minimize all waste and to maintain a consistent plan.”
The area of flexibility in the supply chain is still at an early stage, and consensus has not been reached
as regards meanings, scope, significance, and implementation. (De Toni & Tonchia, 1998), Bernardes
& Hanna, 2009), argue that the lack of research into supply chain flexibility may be focused on the
limited theoretical framework to explain what specifically needs to be included in supply chain
flexibility in system terms, but also the calculation of how it should be done. Authors, such as (Slack,
1983), (Parnaby, 1987), and (Stevenson & Spring, 2007), have highlighted the challenge of
quantifying flexibility earlier. The former argued against efforts to create a standardized flexibility
metri
Based on the scarce literature on supply systems flexibility and elasticity, we simplify supply chain
flexibility by using two main concepts: supplier flexibility and service flexibility. Supplier flexibilities
refer to the ability of the supply chain organizer to link a network of supply chain vendors by
choosing and changing vendors (Duclos et al., 2003; Gosain et al., 2005), which helps the supply
system to respond to customer demands. Work in the supply chain management has, over the last
two decades concentrated in pursuit of strategic advantage on the need to establish better ties
between consumers, manufacturers and related players (Dwyer et al.,1987; Lamming, 1993; Kanter,
1994; Handfield & Bechtel, 2002). In this sense, Lean emphasized the need to establish supplier
relationships, decrease suppliers' number, upstream transition, and empowerment (Sako et al.,
1995; Rich & Hines 1997; Ikeda, 2000). However, increasing market dynamics and higher levels of
volatility has increased the need for companies to become flexible and to adapt to consumer
demands while concentrating on operating within a complex and continuous state of transition as
part of a collaborative literature thread on agility (Childerhouse & Towill, 2000; Lee, 2004).
(Swafford et al., 2006) stressed that it was primarily the supply chain structure that described the
flexibility of the supply network as the adaptability of its nodes, indicating a narrow perception of
supply chain flexibility that is in line with the notion of linear flexibility and the principle of resilient
networks. In comparison, the truth of sourcing flexibility is that, indeed, not a single supplier's
sensitivity is the primary cause of the Supply chain, but the leading company's capacity to organize
the entire supply chain easily and reinvent the network.
The elastic logistics represents first, fast and best growth. (Christopher,2000) describes elasticity as
"a company's ability to respond quickly to shifts in volume and complexity demand" in order to meet
competitive and unpredictable markets. The elastic approach increases the performance capabilities
to even more than historically established methods, and strategies are feasible. Elasticity is no longer

http: //www.uysad.com 7 (14) 2020
328
enough simply to respond quickly, and at the right time, so lean, responsive is not enough, but the
argument goes much further.
According to (Vonderembse et al., 2006), Elastic logistics can respond to customer demands through
virtual clouds and IT-based systems to ensure efficient and fast customer's response and quickly able
to solve any problem that customers can face and adapt to any market change. In the corporate
environment, the knowledge of demand is obtained from automated networks rather than from
inventory-based information; the timely exchange of information decreases management
sophistication. The information infrastructure should be up-to-date and accurate and should be able
to connect quickly. In the ideal case, a shared information system would connect both participants in
a virtual supply chain.
Supply Chain Management (SCM) seeks to improve profitability by tightly combining internal
operations within a company and connecting them with vendors, consumers, and other channel
participants' external activities (Kim, 2009). The business can achieve superior supply chain efficiency
through cross-functional alignment and collaboration with vendors or consumers (Swink et al., 2007).
Many companies have recognized the advantages of incorporation with supply chain suppliers, and
convergence of the supply chain has been seen as one of the critical performance enhancement
drivers. Further systematic work on the interaction between integration and efficiency has been
done by (Min & Menzer, 2004; Rodrigues et al., 2004; Stank et al., 2001).
Much integration was associated with performance; a considerable amount of work was also done
into the relationship between customer satisfaction and efficiency. The results show that customers
satisfied have a positive correlation with performance (Lambert et al., 1998; Narayanan et al., 2011).
One goal of optimizing the supply chain is to enhance customer satisfaction and customer loyalty, we
believe the missing element is customer satisfaction.
● Quality of service and customer satisfaction
Marketing experts and analysts have successfully controlled consumer experience quality and
improved client engagement (Rust & Chung 2006, Zeithaml et al., 1996). Specific research finds that
greater consumer satisfaction resulted in a higher degree of customer engagement and word-of-
mouth reviews (Guo et al., 2009; Lai et al., 2009). The increasing competition in brand marketing has
driven businesses to find differentiating approaches to attract and retain consumers. The
individualization of goods to fulfill consumer demands is among the differentiation techniques used
by corporations (Beatty et al., 2015; Tam & Ho, 2005). The idea that customizations enable
customers to decide which goods are tailored to their needs has, in particular, become more and
more common compared to standardization. In their research, for example, (Jin et al., 2012)
illustrate how packing tours frequently customize trips according to the personal needs of travelers.
Standardization has been used to make the economic indicators more consistent and accurate, to
decrease costs, and to improve profitability. The degree of product customization in recent years has
risen and is projected to continue in the future. For example, after-sales car services, the hotel
industry studies. (Sandoff, 2005; Wang et al., 2010) and Dell Computers. Some of these services
incorporate customization with standardization. For example, "standardization" lets workers prevent
errors and anomalies in delivering "customized" services in the hotel industry.
Many studies have connected service quality to consumer satisfaction, such as they study (Cronin et
al., 2000). However, there has been little work to determine whether customization and
standardization have an immediate effect on service quality and indirectly influence customer
loyalty. This distance is addressed in the present report. The key to customer satisfaction and loyalty
http: //www.uysad.com 7 (14) 2020
329
is the development of customization strategies that offer customers superior service and ensure that
operations are operating smoothly and efficiently; this is what elastic logistics are trying to provide.
(Lundahl et al., 2009) were investigating the impact on customer loyalty of bank-SME relations in
theoretical and practical aspects in service management. The analysis reveals a strong connection
between the theoretical and practical aspects of service development and customer satisfaction. (De
Keyser & Lariviere, 2014) argue that the quality of service both technically and functionally has a
positive effect on consumer satisfaction. The new work indicates that practical and technological
values play a significant role in ensuring customer loyalty in offering high-quality services. Hence, it is
essential to evaluate the impact of each strategy on specific facets of service quality and use multiple
approaches and improve the efficiency of the service.
Satisfaction is characterized by contrasting the perceived quality of a service and its precedent
(Oliver, 1981) as the feeling of gratification or deception. Consumer satisfaction is an experience
following decision-making. Quality of service and customer satisfaction are similarly associated, but
can not be interchanged, as both definitions require a distinction between quality requirements and
the provided service.
Throughout the age of extreme competition, improved service quality can be a vital consideration to
differentiate and boost organizational performance (Namukasa, 2013). Some researchers have
explored the dimensions and calculating challenges of the subjective essence of service quality.
Researchers have given significant attention to the conceptual and empirical relationship between
service quality and customer satisfaction, making it a key marketing instrument (Gustafsson et al.,
1999). While the quality of service has been calculated very well, the quality is still unexplored. It
involves a close analysis of the service efficiency of elastic logistics. The special and substantially
different design of the elastic logistics industry from other providers allows further studies to
examine the freight companies' level of operation and their effect on customers' overall satisfaction.
This research is, therefore, aimed at evaluating the consumer expectations of the service level and
the resulting customer loyalty on a SERVQUAL scale. (Parasuraman et al., 1988 a,b) which proposed
five measurement scales for quality as reliability, assurance, tangibles, empathy, and responsiveness.
● Customer Loyalty
In addition to the repeated procurement of the service, the consumer loyalty corresponds to a
friendly disposition to an individual and conduct of repeat patronage (Dick & Basu, 1994); a condition
in which repeat transactions are followed by a relational association and repeated purchasing
expectations and actions—corresponding to a constructive attitude towards the brander. Consumer
loyalty was often introduced as a behavioral mechanism and often as a mental attitude.
In order to boost its sustainable practices, globalization stresses on various sectors were applied.
Besides, the rise in legislation applicable to a significant number of manufacturing facilities, including
social restrictions on environmental protection, highlights the value of environmental policies as a
strategic gain. Furthermore, a product or company customer loyalty system must be built, which will
help goods, facilities, and marketing efforts for sales and transactions regularly and word of mouth
for the retention of the customer base and continual growth. The previous study has shown that
perceived quality and customer loyalty have relationships (Aydin & Özer, 2005), which justify this
research hypothesis of the impact of service quality on customer and brand loyalty.
Marketing research has been developed as behavior or attitudinal tests of consumer satisfaction
(Oliver, 1999) acknowledged that the buying habits (compliance) would no longer differentiate
between real loyalty and artificial loyalty, resulting in a lack of preference or pure convenience, They
http: //www.uysad.com 7 (14) 2020
330
first presented these two aspects of loyalty. From this argument in the literature, what appears to
have prevailed is that behavioral and commitment interventions are both important and significant.
Both attitudinal and behavioral tests have been used in recent research to gather relevant consumer
satisfaction signals (McMullan, 2005). Such two dimensions of loyalty as present interpersonal loyalty
and future expectations have been conceptualized from a new angle by (Baumann et al., 2011), and
this research reflects this line of reasoning. The two dimensions of allegiance are modeled
independently for this article's purposes, as the goal is to analyze the implications of predictors on
both dimensions (Zeithaml et al., 1996).
● Customer satisfaction and customer loyalty
(Hallowell, 1996) has identified a positive link between satisfaction and loyalty; (Moutinho & Smith,
2000) have found a positive correlation between satisfaction and retention; (Veloutsou et al., 2004)
have found that there is a positive relation also. The association between satisfaction and loyalty is
well known both within and beyond retail banking, for example. A recent study found that customer
satisfaction and loyalty have a non-linear association. Unmet customer loyalty is disproportionately
low, and increased satisfaction will not result in greater customer loyalty (Baumann et al., 2012b).
This result indicates that while consumers' satisfaction determines consumer loyalty, it is possible to
improve customer loyalty modeling so that more responsive drivers can be detected. Therefore, in
this research, the impact of customer satisfaction on the loyalty of customers in the logistics sector
and courier services mainly will be hypothesized to have a relation.
● Price Fairness and cost Impact
The price fairness or cost determination in customer's conception is known as what is given up or
exchanged to receive the service from the customer perspective (Zeithaml, 1988). The price is often
used to assess the quality of the product in an alien reference for customers. Price fairness is
conceptualized as a vital criterion assessment parameter as "the consumer's evaluation and the
associated emotions of whether a supplier has a fair, rational and justifiable difference (or lack of
gap) between the quality and that of the comparatives of another group" (Xia et al., 2004). Price
fairness emerges as a 'price as of right, equitable or legal, subjective meaning by the consumer
versus wrong, unfair, or unlawful' (Campbell, 2007).
Referring to the equity theory and principle of dual entitlement, from the customer viewpoint; the
given price for the service menu provided will be perceived as fair and acceptable if this level of price
meets their demands and customizations. Additionally, according to the S–O-R (stimulus organism
response) theory, customers' internal evaluation for acceptable and fair prices of cargo services
menus may determine customers' assessments, which may enhance their revisit and word of mouth
intentions towards elastic logistic services. Empirical evidence in previous hospitality studies
indicates a positive linkage between perceived quality and price fairness (Jin et al., 2016). Therefore,
it is pleasurable to expect that, when service is perceived as having high quality, customers perceive
the cost of service to be fair and can be increased. In line with this prediction, the hypotheses of cost
and pricing strategy impact on customer satisfaction and loyalty were proposed.
2. Research Question and Model
Due to the tremendous advances in technologies of all business sectors. The research question to be
investigated is, “What is the effect of elastic logistics in a matter of quality and pricing on customer
satisfaction and brand loyalty?”
http: //www.uysad.com 7 (14) 2020
331
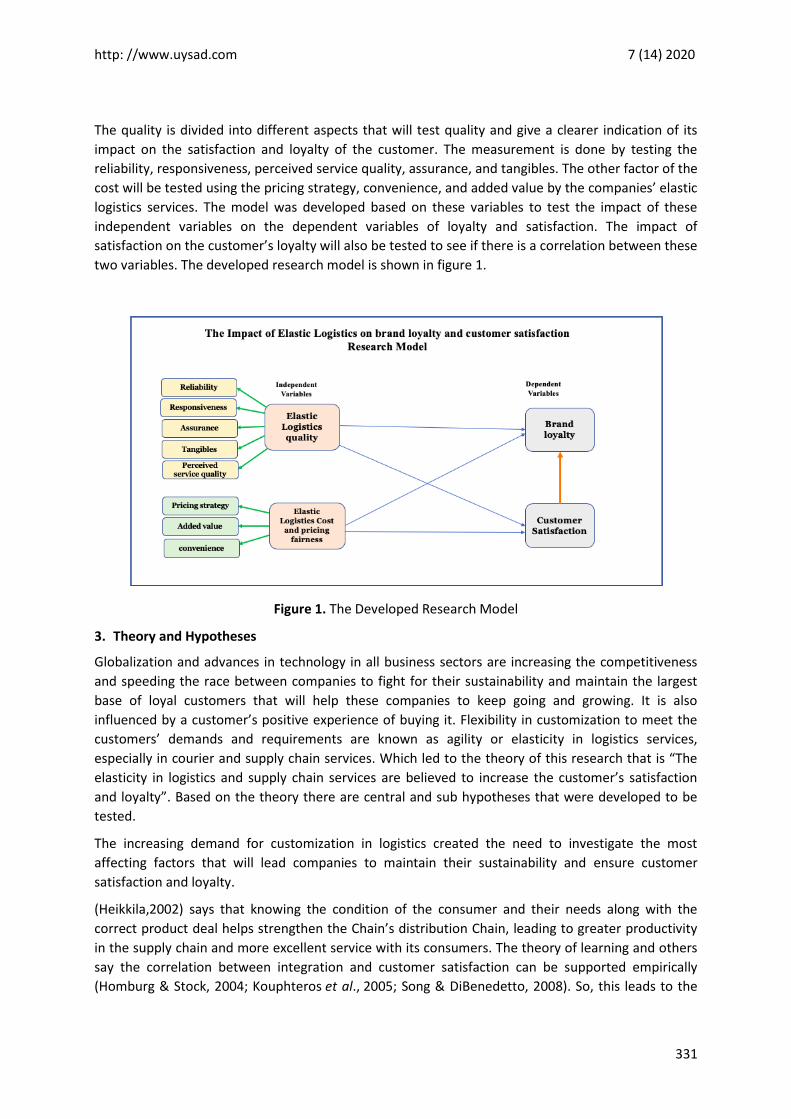
The quality is divided into different aspects that will test quality and give a clearer indication of its
impact on the satisfaction and loyalty of the customer. The measurement is done by testing the
reliability, responsiveness, perceived service quality, assurance, and tangibles. The other factor of the
cost will be tested using the pricing strategy, convenience, and added value by the companies’ elastic
logistics services. The model was developed based on these variables to test the impact of these
independent variables on the dependent variables of loyalty and satisfaction. The impact of
satisfaction on the customer’s loyalty will also be tested to see if there is a correlation between these
two variables. The developed research model is shown in figure 1.
Figure 1. The Developed Research Model
3. Theory and Hypotheses
Globalization and advances in technology in all business sectors are increasing the competitiveness
and speeding the race between companies to fight for their sustainability and maintain the largest
base of loyal customers that will help these companies to keep going and growing. It is also
influenced by a customer’s positive experience of buying it. Flexibility in customization to meet the
customers’ demands and requirements are known as agility or elasticity in logistics services,
especially in courier and supply chain services. Which led to the theory of this research that is “The
elasticity in logistics and supply chain services are believed to increase the customer’s satisfaction
and loyalty”. Based on the theory there are central and sub hypotheses that were developed to be
tested.
The increasing demand for customization in logistics created the need to investigate the most
affecting factors that will lead companies to maintain their sustainability and ensure customer
satisfaction and loyalty.
(Heikkila,2002) says that knowing the condition of the consumer and their needs along with the
correct product deal helps strengthen the Chain’s distribution Chain, leading to greater productivity
in the supply chain and more excellent service with its consumers. The theory of learning and others
say the correlation between integration and customer satisfaction can be supported empirically
(Homburg & Stock, 2004; Kouphteros et al., 2005; Song & DiBenedetto, 2008). So, this leads to the
http: //www.uysad.com 7 (14) 2020
332
hypotheses of the study that link internal processes with external services and customers’ feedback
and attitudes toward this integration, which will be tested through this research.
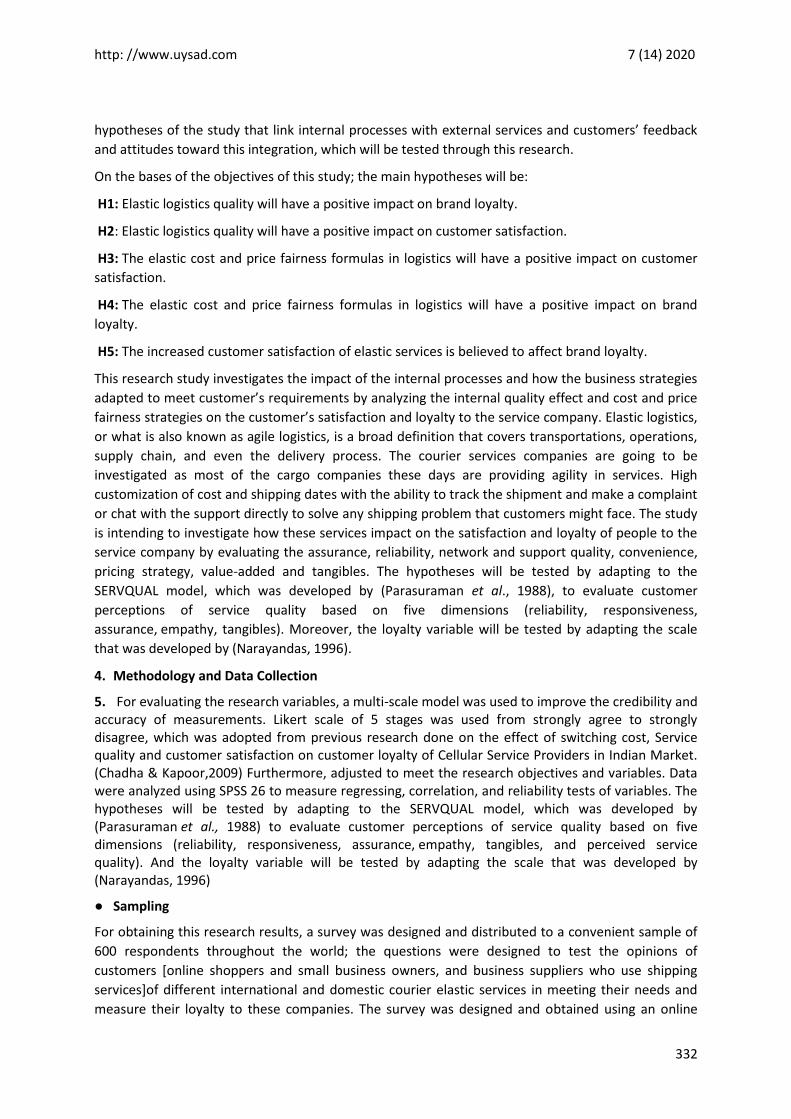
On the bases of the objectives of this study; the main hypotheses will be:
H1: Elastic logistics quality will have a positive impact on brand loyalty.
H2: Elastic logistics quality will have a positive impact on customer satisfaction.
H3: The elastic cost and price fairness formulas in logistics will have a positive impact on customer
satisfaction.
H4: The elastic cost and price fairness formulas in logistics will have a positive impact on brand
loyalty.
H5: The increased customer satisfaction of elastic services is believed to affect brand loyalty.
This research study investigates the impact of the internal processes and how the business strategies
adapted to meet customer’s requirements by analyzing the internal quality effect and cost and price
fairness strategies on the customer’s satisfaction and loyalty to the service company. Elastic logistics,
or what is also known as agile logistics, is a broad definition that covers transportations, operations,
supply chain, and even the delivery process. The courier services companies are going to be
investigated as most of the cargo companies these days are providing agility in services. High
customization of cost and shipping dates with the ability to track the shipment and make a complaint
or chat with the support directly to solve any shipping problem that customers might face. The study
is intending to investigate how these services impact on the satisfaction and loyalty of people to the
service company by evaluating the assurance, reliability, network and support quality, convenience,
pricing strategy, value-added and tangibles. The hypotheses will be tested by adapting to the
SERVQUAL model, which was developed by (Parasuraman et al., 1988), to evaluate customer
perceptions of service quality based on five dimensions (reliability, responsiveness,
assurance, empathy, tangibles). Moreover, the loyalty variable will be tested by adapting the scale
that was developed by (Narayandas, 1996).
4. Methodology and Data Collection
5. For evaluating the research variables, a multi-scale model was used to improve the credibility and accuracy of measurements. Likert scale of 5 stages was used from strongly agree to strongly disagree, which was adopted from previous research done on the effect of switching cost, Service quality and customer satisfaction on customer loyalty of Cellular Service Providers in Indian Market. (Chadha & Kapoor,2009) Furthermore, adjusted to meet the research objectives and variables. Data were analyzed using SPSS 26 to measure regressing, correlation, and reliability tests of variables. The hypotheses will be tested by adapting to the SERVQUAL model, which was developed by (Parasuraman et al., 1988) to evaluate customer perceptions of service quality based on five dimensions (reliability, responsiveness, assurance, empathy, tangibles, and perceived service quality). And the loyalty variable will be tested by adapting the scale that was developed by (Narayandas, 1996)
● Sampling
For obtaining this research results, a survey was designed and distributed to a convenient sample of
600 respondents throughout the world; the questions were designed to test the opinions of
customers [online shoppers and small business owners, and business suppliers who use shipping
services]of different international and domestic courier elastic services in meeting their needs and
measure their loyalty to these companies. The survey was designed and obtained using an online
http: //www.uysad.com 7 (14) 2020
333
survey platform (SurveyMonkey). Only 427 responded to the survey with a response rate of %71. The
respondents were divided as 201 females, and 213 males and nine persons preferred not to declare
their gender. And ages were between 18 and 55 years old; the majority of responses were between
the ages of 25-35 years old. The majority of responses were from Asia, with a percentage of %81.73,
which might make this study the result apply only to countries of Asia.
● Measurement of Variables
For the validation of the hypotheses, two primary measurement variables were tested based on the
literature and were divided into a multi-item scale. The adopted scale of the SERVQUAL instrument
included assurance, reliability, tangibles, perceived quality, and responsiveness to measure service
quality of elastic logistics. The Likert scale was added up by three additional dimensions to test cost
variables based on the added value, convenience, and pricing strategy. The measurement scales
were adopted from the previous study conducted to test the impact of Indian carrier services on
customer satisfaction and loyalty (Chadah, S.K., & Kapoor, D., 2009). Each of the items was evaluated
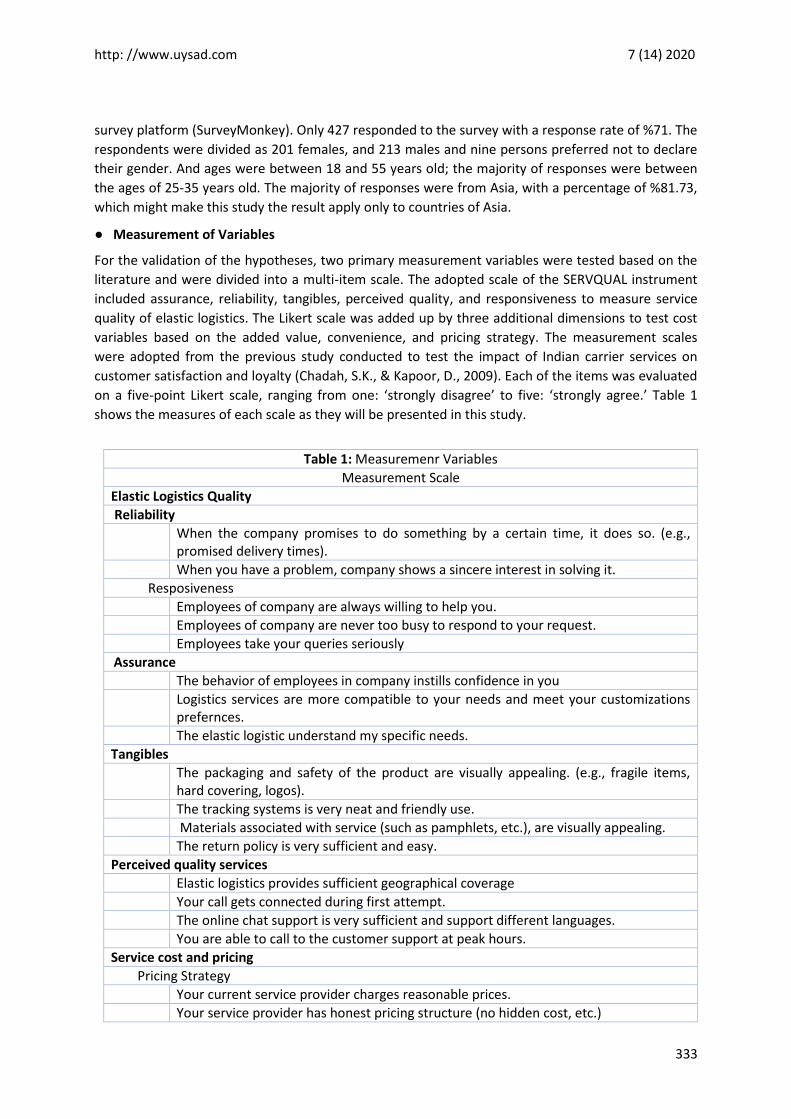
on a five-point Likert scale, ranging from one: ‘strongly disagree’ to five: ‘strongly agree.’ Table 1
shows the measures of each scale as they will be presented in this study.
Table 1: Measuremenr Variables
Measurement Scale
I. Elastic Logistics Quality
Reliability
1. When the company promises to do something by a certain time, it does so. (e.g., promised delivery times).
2. When you have a problem, company shows a sincere interest in solving it.
Resposiveness
3. Employees of company are always willing to help you.
4. Employees of company are never too busy to respond to your request.
5. Employees take your queries seriously
Assurance
6. The behavior of employees in company instills confidence in you
7. Logistics services are more compatible to your needs and meet your customizations prefernces.
8. The elastic logistic understand my specific needs.
Tangibles
9. The packaging and safety of the product are visually appealing. (e.g., fragile items, hard covering, logos).
The tracking systems is very neat and friendly use.
Materials associated with service (such as pamphlets, etc.), are visually appealing.
The return policy is very sufficient and easy.
Perceived quality services
Elastic logistics provides sufficient geographical coverage
Your call gets connected during first attempt.
The online chat support is very sufficient and support different languages.
You are able to call to the customer support at peak hours.
Service cost and pricing
Pricing Strategy
1. Your current service provider charges reasonable prices.
2. Your service provider has honest pricing structure (no hidden cost, etc.)
http: //www.uysad.com 7 (14) 2020
334
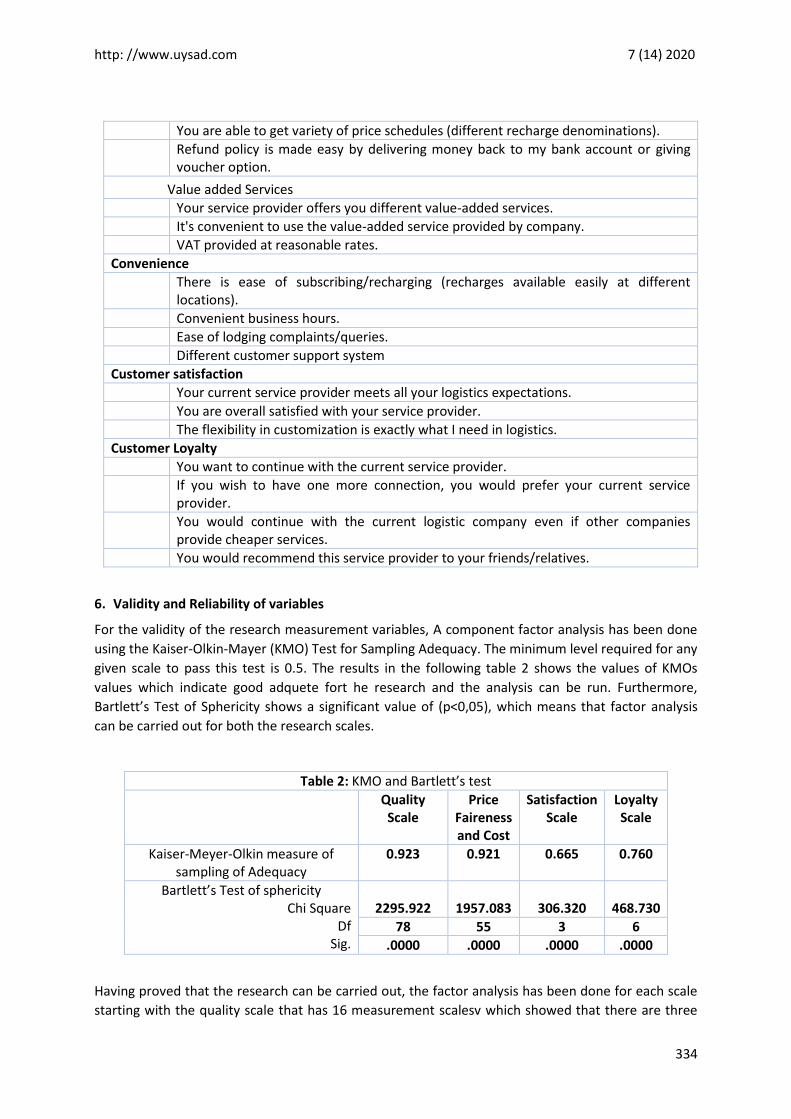
3. You are able to get variety of price schedules (different recharge denominations).
4. Refund policy is made easy by delivering money back to my bank account or giving voucher option.
a. Value added Services
5. Your service provider offers you different value-added services.
6. It's convenient to use the value-added service provided by company.
7. VAT provided at reasonable rates.
Convenience
8. There is ease of subscribing/recharging (recharges available easily at different locations).
9. Convenient business hours.
Ease of lodging complaints/queries.
Different customer support system
Customer satisfaction
1. Your current service provider meets all your logistics expectations.
2. You are overall satisfied with your service provider.
3. The flexibility in customization is exactly what I need in logistics.
Customer Loyalty
1. You want to continue with the current service provider.
2. If you wish to have one more connection, you would prefer your current service provider.
3. You would continue with the current logistic company even if other companies provide cheaper services.
4. You would recommend this service provider to your friends/relatives.
6. Validity and Reliability of variables
For the validity of the research measurement variables, A component factor analysis has been done
using the Kaiser-Olkin-Mayer (KMO) Test for Sampling Adequacy. The minimum level required for any
given scale to pass this test is 0.5. The results in the following table 2 shows the values of KMOs
values which indicate good adquete fort he research and the analysis can be run. Furthermore,
Bartlett’s Test of Sphericity shows a significant value of (p<0,05), which means that factor analysis
can be carried out for both the research scales.
Table 2: KMO and Bartlett’s test
Quality Scale
Price Faireness and Cost
Satisfaction Scale
Loyalty Scale
Kaiser-Meyer-Olkin measure of sampling of Adequacy
0.923 0.921 0.665 0.760
Bartlett’s Test of sphericity Chi Square
Df Sig.
2295.922
1957.083
306.320
468.730
78 55 3 6
.0000 .0000 .0000 .0000
Having proved that the research can be carried out, the factor analysis has been done for each scale
starting with the quality scale that has 16 measurement scalesv which showed that there are three
http: //www.uysad.com 7 (14) 2020
335
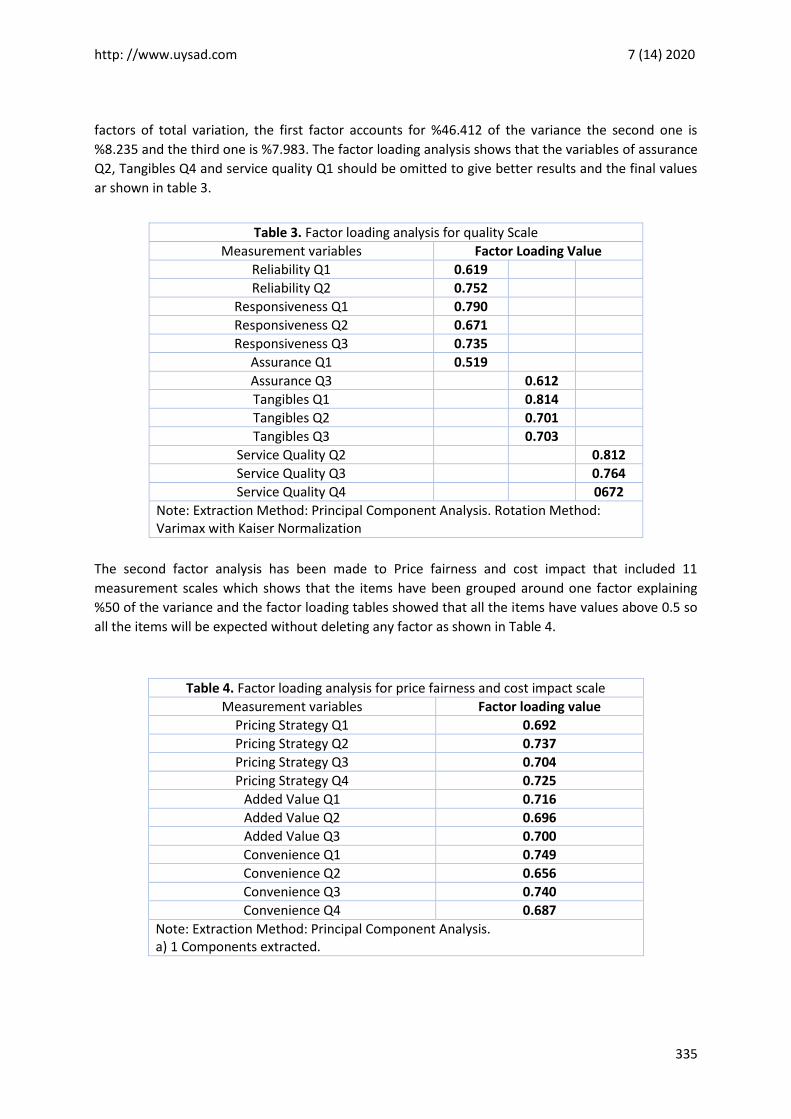
factors of total variation, the first factor accounts for %46.412 of the variance the second one is
%8.235 and the third one is %7.983. The factor loading analysis shows that the variables of assurance
Q2, Tangibles Q4 and service quality Q1 should be omitted to give better results and the final values
ar shown in table 3.
Table 3. Factor loading analysis for quality Scale
Measurement variables Factor Loading Value
Reliability Q1 0.619
Reliability Q2 0.752
Responsiveness Q1 0.790
Responsiveness Q2 0.671
Responsiveness Q3 0.735
Assurance Q1 0.519
Assurance Q3 0.612
Tangibles Q1 0.814
Tangibles Q2 0.701
Tangibles Q3 0.703
Service Quality Q2 0.812
Service Quality Q3 0.764
Service Quality Q4 0672
Note: Extraction Method: Principal Component Analysis. Rotation Method: Varimax with Kaiser Normalization
The second factor analysis has been made to Price fairness and cost impact that included 11
measurement scales which shows that the items have been grouped around one factor explaining
%50 of the variance and the factor loading tables showed that all the items have values above 0.5 so
all the items will be expected without deleting any factor as shown in Table 4.
Table 4. Factor loading analysis for price fairness and cost impact scale
Measurement variables Factor loading value
Pricing Strategy Q1 0.692
Pricing Strategy Q2 0.737
Pricing Strategy Q3 0.704
Pricing Strategy Q4 0.725
Added Value Q1 0.716
Added Value Q2 0.696
Added Value Q3 0.700
Convenience Q1 0.749
Convenience Q2 0.656
Convenience Q3 0.740
Convenience Q4 0.687
Note: Extraction Method: Principal Component Analysis. a) 1 Components extracted.
http: //www.uysad.com 7 (14) 2020
336
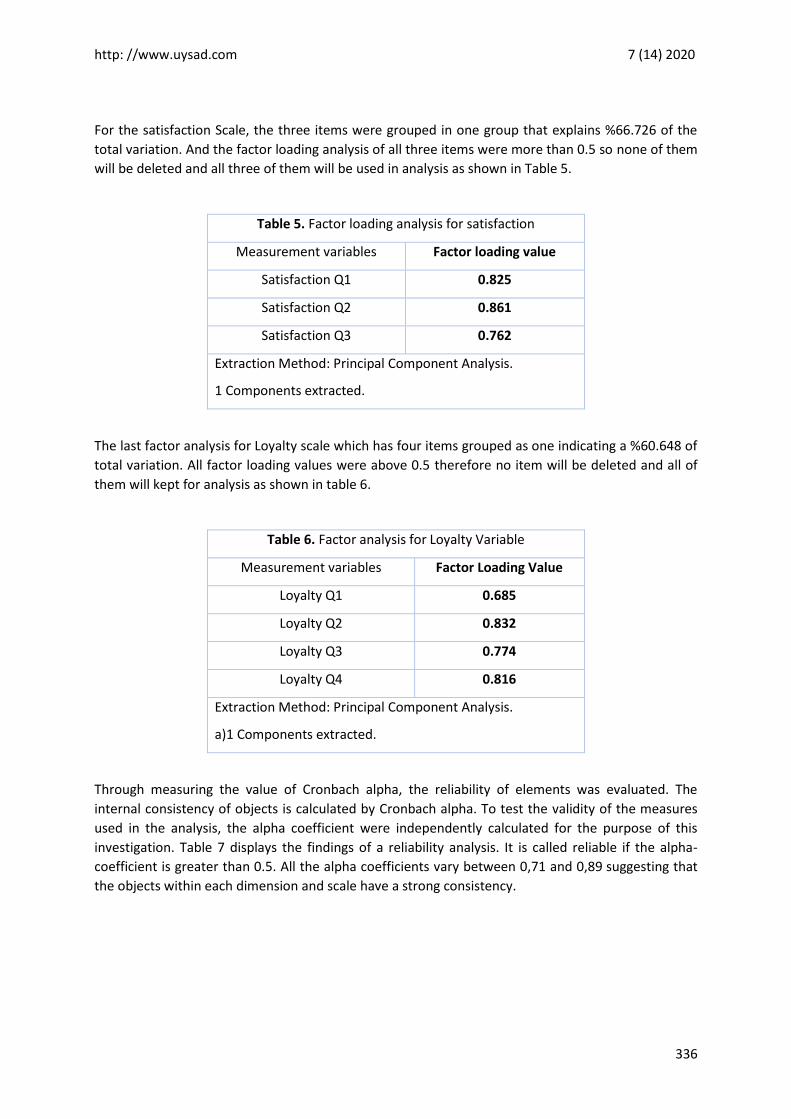
For the satisfaction Scale, the three items were grouped in one group that explains %66.726 of the
total variation. And the factor loading analysis of all three items were more than 0.5 so none of them
will be deleted and all three of them will be used in analysis as shown in Table 5.
Table 5. Factor loading analysis for satisfaction
Measurement variables Factor loading value
Satisfaction Q1 0.825
Satisfaction Q2 0.861
Satisfaction Q3 0.762
Extraction Method: Principal Component Analysis.
1 Components extracted.
The last factor analysis for Loyalty scale which has four items grouped as one indicating a %60.648 of
total variation. All factor loading values were above 0.5 therefore no item will be deleted and all of
them will kept for analysis as shown in table 6.
Table 6. Factor analysis for Loyalty Variable
Measurement variables Factor Loading Value
Loyalty Q1 0.685
Loyalty Q2 0.832
Loyalty Q3 0.774
Loyalty Q4 0.816
Extraction Method: Principal Component Analysis.
a)1 Components extracted.
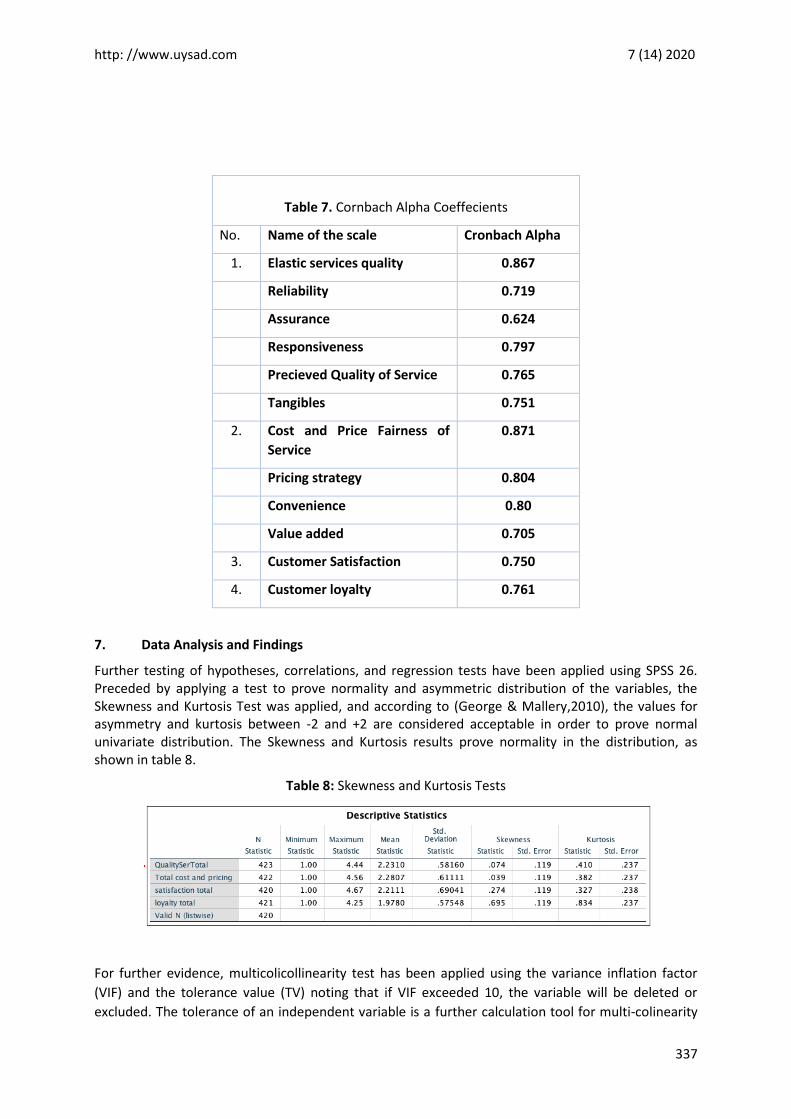
Through measuring the value of Cronbach alpha, the reliability of elements was evaluated. The
internal consistency of objects is calculated by Cronbach alpha. To test the validity of the measures
used in the analysis, the alpha coefficient were independently calculated for the purpose of this
investigation. Table 7 displays the findings of a reliability analysis. It is called reliable if the alpha-
coefficient is greater than 0.5. All the alpha coefficients vary between 0,71 and 0,89 suggesting that
the objects within each dimension and scale have a strong consistency.
http: //www.uysad.com 7 (14) 2020
337
Table 7. Cornbach Alpha Coeffecients
No. Name of the scale Cronbach Alpha
1. Elastic services quality 0.867
Reliability 0.719
Assurance 0.624
Responsiveness 0.797
Precieved Quality of Service 0.765
Tangibles 0.751
2. Cost and Price Fairness of
Service
0.871
Pricing strategy 0.804
Convenience 0.80
Value added 0.705
3. Customer Satisfaction 0.750
4. Customer loyalty 0.761
7. Data Analysis and Findings
Further testing of hypotheses, correlations, and regression tests have been applied using SPSS 26. Preceded by applying a test to prove normality and asymmetric distribution of the variables, the Skewness and Kurtosis Test was applied, and according to (George & Mallery,2010), the values for asymmetry and kurtosis between -2 and +2 are considered acceptable in order to prove normal univariate distribution. The Skewness and Kurtosis results prove normality in the distribution, as shown in table 8.
Table 8: Skewness and Kurtosis Tests
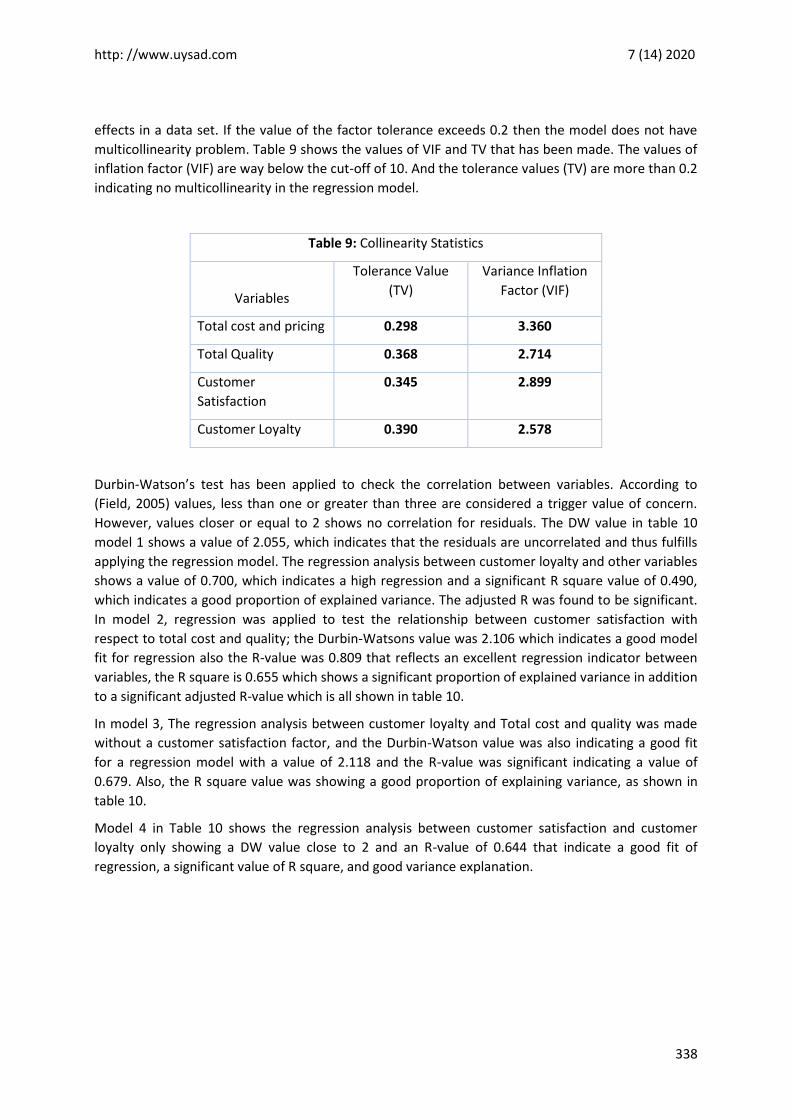
For further evidence, multicolicollinearity test has been applied using the variance inflation factor
(VIF) and the tolerance value (TV) noting that if VIF exceeded 10, the variable will be deleted or
excluded. The tolerance of an independent variable is a further calculation tool for multi-colinearity
http: //www.uysad.com 7 (14) 2020
338
effects in a data set. If the value of the factor tolerance exceeds 0.2 then the model does not have
multicollinearity problem. Table 9 shows the values of VIF and TV that has been made. The values of
inflation factor (VIF) are way below the cut-off of 10. And the tolerance values (TV) are more than 0.2
indicating no multicollinearity in the regression model.
Table 9: Collinearity Statistics
Variables
Tolerance Value
(TV)
Variance Inflation
Factor (VIF)
Total cost and pricing 0.298 3.360
Total Quality 0.368 2.714
Customer
Satisfaction
0.345 2.899
Customer Loyalty 0.390 2.578
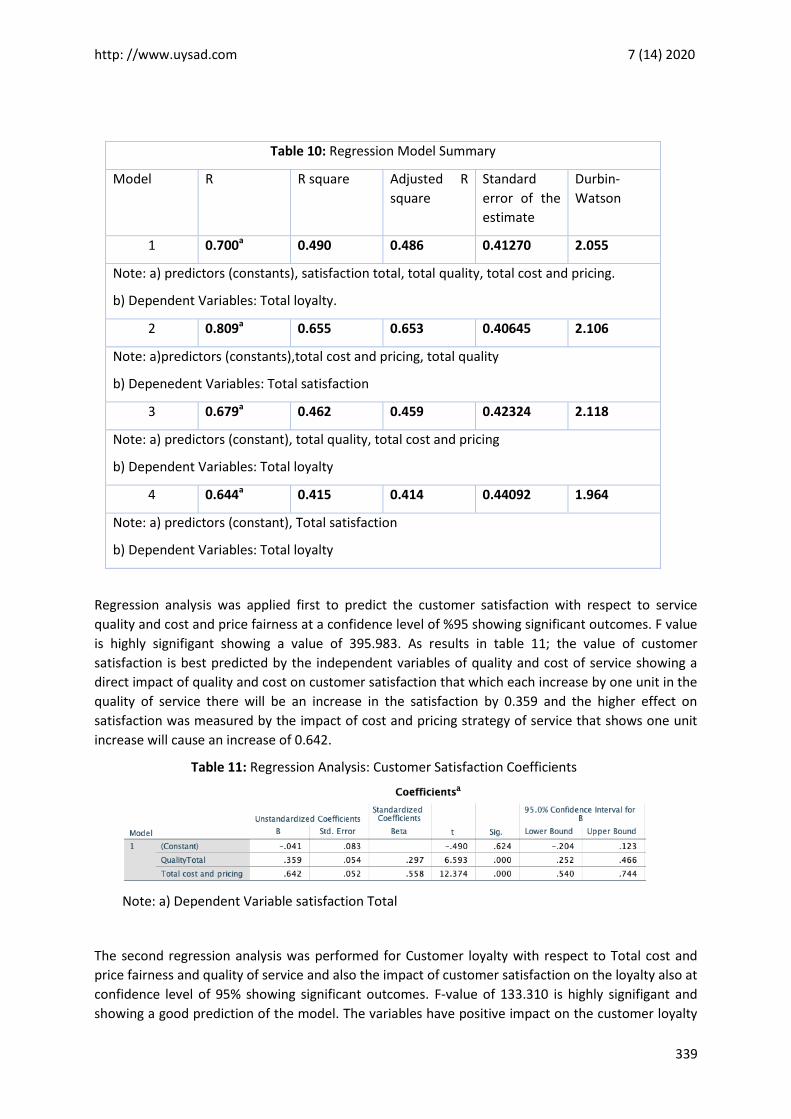
Durbin-Watson’s test has been applied to check the correlation between variables. According to
(Field, 2005) values, less than one or greater than three are considered a trigger value of concern.
However, values closer or equal to 2 shows no correlation for residuals. The DW value in table 10
model 1 shows a value of 2.055, which indicates that the residuals are uncorrelated and thus fulfills
applying the regression model. The regression analysis between customer loyalty and other variables
shows a value of 0.700, which indicates a high regression and a significant R square value of 0.490,
which indicates a good proportion of explained variance. The adjusted R was found to be significant.
In model 2, regression was applied to test the relationship between customer satisfaction with
respect to total cost and quality; the Durbin-Watsons value was 2.106 which indicates a good model
fit for regression also the R-value was 0.809 that reflects an excellent regression indicator between
variables, the R square is 0.655 which shows a significant proportion of explained variance in addition
to a significant adjusted R-value which is all shown in table 10.
In model 3, The regression analysis between customer loyalty and Total cost and quality was made
without a customer satisfaction factor, and the Durbin-Watson value was also indicating a good fit
for a regression model with a value of 2.118 and the R-value was significant indicating a value of
0.679. Also, the R square value was showing a good proportion of explaining variance, as shown in
table 10.
Model 4 in Table 10 shows the regression analysis between customer satisfaction and customer
loyalty only showing a DW value close to 2 and an R-value of 0.644 that indicate a good fit of
regression, a significant value of R square, and good variance explanation.
http: //www.uysad.com 7 (14) 2020
339
Table 10: Regression Model Summary
Model R R square Adjusted R
square
Standard
error of the
estimate
Durbin-
Watson
1 0.700a 0.490 0.486 0.41270 2.055
Note: a) predictors (constants), satisfaction total, total quality, total cost and pricing.
b) Dependent Variables: Total loyalty.
2 0.809a 0.655 0.653 0.40645 2.106
Note: a)predictors (constants),total cost and pricing, total quality
b) Depenedent Variables: Total satisfaction
3 0.679a 0.462 0.459 0.42324 2.118
Note: a) predictors (constant), total quality, total cost and pricing
b) Dependent Variables: Total loyalty
4 0.644a 0.415 0.414 0.44092 1.964
Note: a) predictors (constant), Total satisfaction
b) Dependent Variables: Total loyalty
Regression analysis was applied first to predict the customer satisfaction with respect to service
quality and cost and price fairness at a confidence level of %95 showing significant outcomes. F value
is highly signifigant showing a value of 395.983. As results in table 11; the value of customer
satisfaction is best predicted by the independent variables of quality and cost of service showing a
direct impact of quality and cost on customer satisfaction that which each increase by one unit in the
quality of service there will be an increase in the satisfaction by 0.359 and the higher effect on
satisfaction was measured by the impact of cost and pricing strategy of service that shows one unit
increase will cause an increase of 0.642.
Table 11: Regression Analysis: Customer Satisfaction Coefficients
Note: a) Dependent Variable satisfaction Total
The second regression analysis was performed for Customer loyalty with respect to Total cost and
price fairness and quality of service and also the impact of customer satisfaction on the loyalty also at
confidence level of 95% showing significant outcomes. F-value of 133.310 is highly signifigant and
showing a good prediction of the model. The variables have positive impact on the customer loyalty
http: //www.uysad.com 7 (14) 2020
340
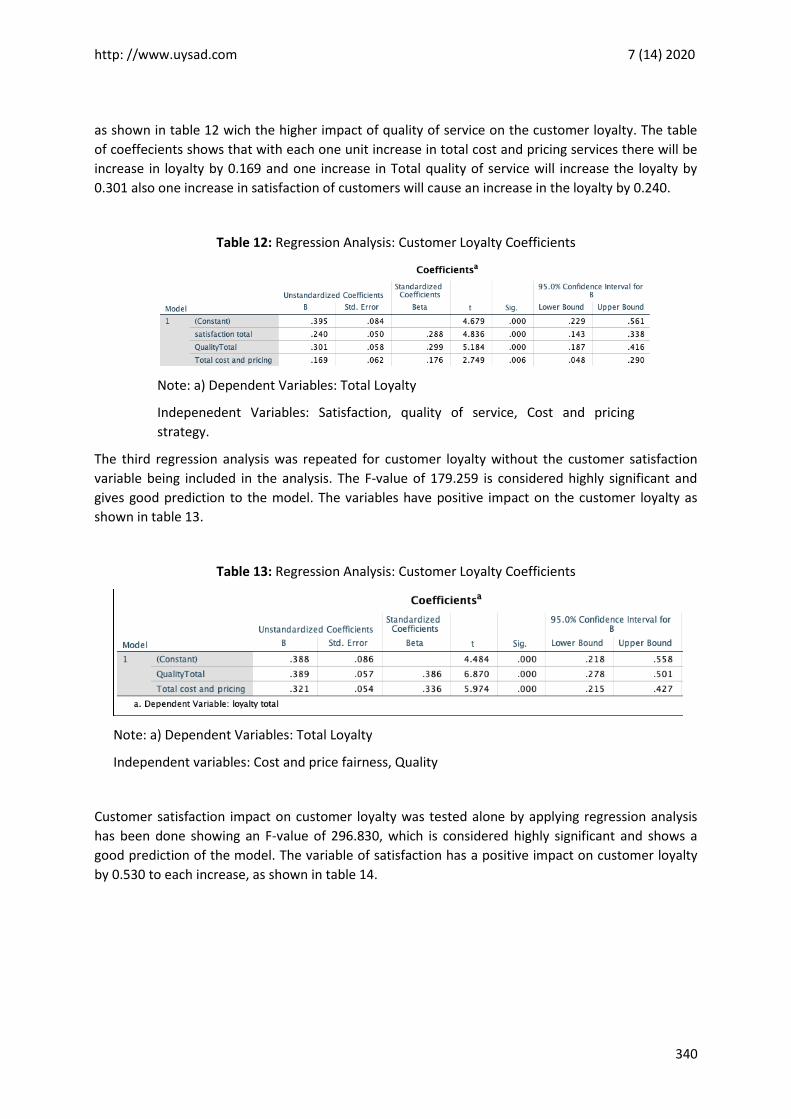
as shown in table 12 wich the higher impact of quality of service on the customer loyalty. The table
of coeffecients shows that with each one unit increase in total cost and pricing services there will be
increase in loyalty by 0.169 and one increase in Total quality of service will increase the loyalty by
0.301 also one increase in satisfaction of customers will cause an increase in the loyalty by 0.240.
Table 12: Regression Analysis: Customer Loyalty Coefficients
Note: a) Dependent Variables: Total Loyalty
Indepenedent Variables: Satisfaction, quality of service, Cost and pricing
strategy.
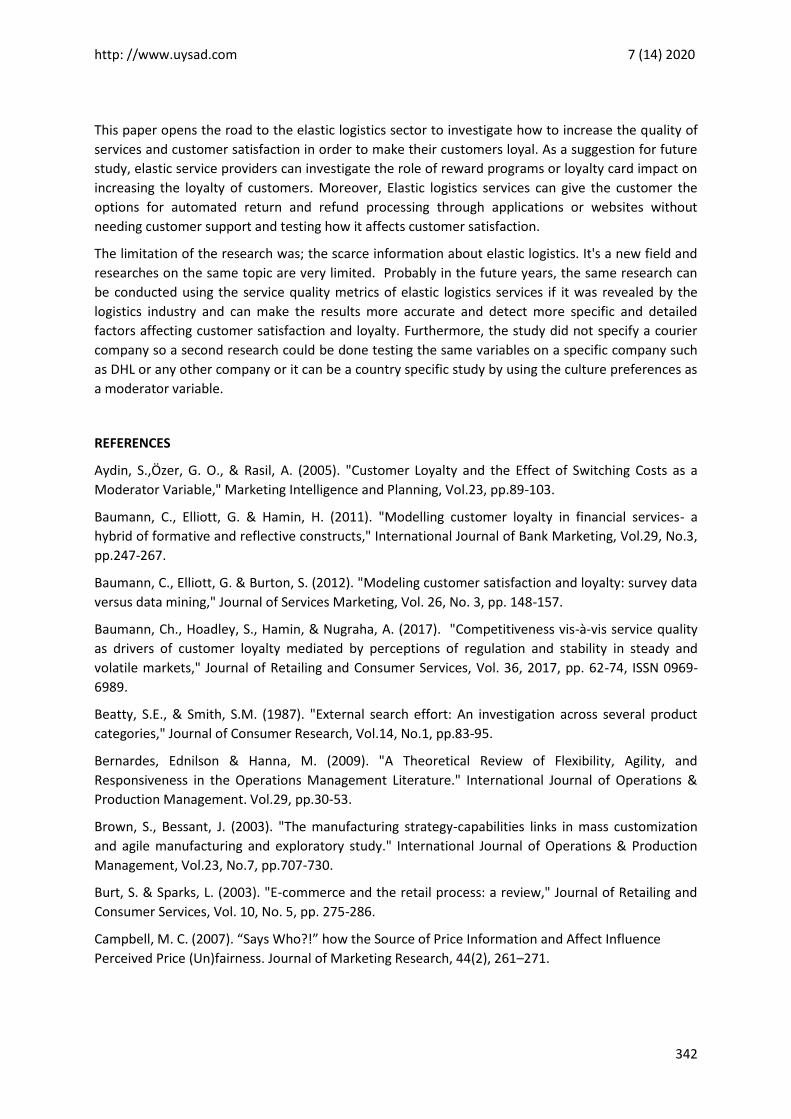
The third regression analysis was repeated for customer loyalty without the customer satisfaction
variable being included in the analysis. The F-value of 179.259 is considered highly significant and
gives good prediction to the model. The variables have positive impact on the customer loyalty as
shown in table 13.
Table 13: Regression Analysis: Customer Loyalty Coefficients
Note: a) Dependent Variables: Total Loyalty
Independent variables: Cost and price fairness, Quality
Customer satisfaction impact on customer loyalty was tested alone by applying regression analysis
has been done showing an F-value of 296.830, which is considered highly significant and shows a
good prediction of the model. The variable of satisfaction has a positive impact on customer loyalty
by 0.530 to each increase, as shown in table 14.

http: //www.uysad.com 7 (14) 2020
341
Table 14: Regression Analysis: Customer satisfaction Coefficients
Note: a) Dependent Variables: customer loyalty
b) Independent Variables: Customer satisfaction
To further test the research hypotheses, Pearson correlations were computed at a scale level of %95,
showing a strong association between quality of service and customer satisfaction and loyalty.
Moreover, there is a strong association between cost and pricing of service and customer satisfaction
and loyalty, as shown in table 15.
Table 15: Correlation Between Service cost and pricing, Service Quality,
Customer Satisfaction and Customer Loyalty
Correlation Service cost Service quality Customer
Satisfaction
Customer Loyalty 0.633 0.645 0.644
Customer
Satisfaction
0.787 0.727 1
Note:* Correlation is significant at the 0.01 level (two-tailed).
Based on the correlation and regression results, the research hypotheses are supported and proved
to be correct.
CONCLUSION
The study aimed to investigate the impact of elastic logistics service quality and pricing and cost on
customer satisfaction and customer loyalty, which was found to be positive. The study showed that
the quality of service is the major factor that affects satisfaction and leads to customer loyalty. The
more the customer feels that this company is providing a good quality service and can trust their
promises, the company can say that this customer can be loyal. This shows that the quality of
services is an important factor for elastic logistics business to invest in continuously improve in order
to maintain customer satisfaction and loyalty. For this sector, probably the quality of services and
pricing strategy and the ability to adapt to customers' needs and market changes can be considered
the major factor that ensures the company competitive advantage and its sustainability in the
market.
http: //www.uysad.com 7 (14) 2020
342
This paper opens the road to the elastic logistics sector to investigate how to increase the quality of
services and customer satisfaction in order to make their customers loyal. As a suggestion for future
study, elastic service providers can investigate the role of reward programs or loyalty card impact on
increasing the loyalty of customers. Moreover, Elastic logistics services can give the customer the
options for automated return and refund processing through applications or websites without
needing customer support and testing how it affects customer satisfaction.
The limitation of the research was; the scarce information about elastic logistics. It's a new field and
researches on the same topic are very limited. Probably in the future years, the same research can
be conducted using the service quality metrics of elastic logistics services if it was revealed by the
logistics industry and can make the results more accurate and detect more specific and detailed
factors affecting customer satisfaction and loyalty. Furthermore, the study did not specify a courier
company so a second research could be done testing the same variables on a specific company such
as DHL or any other company or it can be a country specific study by using the culture preferences as
a moderator variable.
REFERENCES
Aydin, S.,Özer, G. O., & Rasil, A. (2005). "Customer Loyalty and the Effect of Switching Costs as a
Moderator Variable," Marketing Intelligence and Planning, Vol.23, pp.89-103.
Baumann, C., Elliott, G. & Hamin, H. (2011). "Modelling customer loyalty in financial services- a
hybrid of formative and reflective constructs," International Journal of Bank Marketing, Vol.29, No.3,
pp.247-267.
Baumann, C., Elliott, G. & Burton, S. (2012). "Modeling customer satisfaction and loyalty: survey data
versus data mining," Journal of Services Marketing, Vol. 26, No. 3, pp. 148-157.
Baumann, Ch., Hoadley, S., Hamin, & Nugraha, A. (2017). "Competitiveness vis-à-vis service quality
as drivers of customer loyalty mediated by perceptions of regulation and stability in steady and
volatile markets," Journal of Retailing and Consumer Services, Vol. 36, 2017, pp. 62-74, ISSN 0969-
6989.
Beatty, S.E., & Smith, S.M. (1987). "External search effort: An investigation across several product
categories," Journal of Consumer Research, Vol.14, No.1, pp.83-95.
Bernardes, Ednilson & Hanna, M. (2009). "A Theoretical Review of Flexibility, Agility, and
Responsiveness in the Operations Management Literature." International Journal of Operations &
Production Management. Vol.29, pp.30-53.
Brown, S., Bessant, J. (2003). "The manufacturing strategy-capabilities links in mass customization
and agile manufacturing and exploratory study." International Journal of Operations & Production
Management, Vol.23, No.7, pp.707-730.
Burt, S. & Sparks, L. (2003). "E-commerce and the retail process: a review," Journal of Retailing and
Consumer Services, Vol. 10, No. 5, pp. 275-286.
Campbell, M. C. (2007). “Says Who?!” how the Source of Price Information and Affect Influence
Perceived Price (Un)fairness. Journal of Marketing Research, 44(2), 261–271.
http: //www.uysad.com 7 (14) 2020
343
Chadha S. K., & Kapoor, D. (2009). "Effect of switching cost, service quality, and customer satisfaction
on customer loyalty of cellular service providers in Indian Market," ICFAI Journal of Marketing
Management, Vol. 8, ed: IUP Publications, pp.23-37.
Childerhouse, P. & Towill, D. (2000). "Engineering supply chains to match customer requirements,"
Logistics Information Management, Vol.13, No. 6, pp.337-346.
Christopher, M. (2000). "The agile supply chain: competing in volatile markets." Industrial Marketing
Management, Vol.29, No.1, pp.37-44.
Collier, J. & Bienstock, C. (2006). "Measuring Service Quality in E-Retailing." Journal of Service
Research. Vol.8, pp.260-275.
Collins, R.S. & Schmenner R.W. (1993). "Achieving rigid flexibility: Factory focus for the 1990s".
European Management Journal, Vol.11, No.4, pp.443–447.
Cooper, M., Lambert, D., & Pagh, J. (1998). "Supply Chain Management: More than a New Name for
Logistics," The International Journal of Logistics Management, Vol.8:1, pp.1-13.
Cronin, J.J., Brady, M.K., & Hult, G.T.M. (2000). "Assessing the effects of quality, value, and customer
satisfaction on consumer behavioral intentions in service," Environment Journal of Retailing,
Vol.76(2), pp.193-218.
Crowe, T.J. (1992). "Integration is Not Synonymous with Flexibility," International Journal of
Operations & Production Management, Vol. 12, No. 10, pp. 26-33.
De Keyser, A., & Lariviere, B. (2014). "How technical and functional service quality drive consumer
happiness: Moderating influences of channel usage." Journal of Service Management, Vol.25, pp.30-
48.
De Toni, A., & Tonchia, S. (1998). "Manufacturing Flexibility: A Literature Review.", International
Journal of Production Research, Vol.36, No.6, pp.1587–1617.
Devor, R., Graves, R., & Miles, J. (1997). "Agile manufacturing research: accomplishments and
opportunities," IIE Transactions, Vol.29, No.10, pp.813-823,
Dick, A.S., and Basu, K. (1994), "Customer loyalty: toward an integrated conceptual framework."
Journal of the Academy of Marketing Science, Vol.22, No.2, pp.99–113.
Dove, R. (1994), "Tools for analyzing and constructing agility," Proceedings of the Third Annual Agility
Forum Conference/Workshop, Austin, TX.
Dove, R. (1999). "Knowledge management, responsibility, and the agile enterprise," Journal of
Knowledge Management, Vol.3, No.1, pp.18-35.
Duclos, L.K., Vokurka, R.J. & Lummus, R.R. (2003). "A conceptual model of supply chain flexibility,"
Industrial Management and Data Systems, Vol.103, pp.446-456.
Dwyer, F.R., Schurr, P., & Sejo, O. (1987). "Developing buyer-seller relationships." Journal of
Marketing, Vol.51, No.2, pp.11-27.
Field, A. (2005), “Reliability analysis. In: Field, A., Ed., Discovering Statistics Using spss”. 2nd Edition,
Sage, London, Chapter 15.
Forrester, J. (1958). "Industrial Dynamics, a major breakthrough for decision makers'', Harvard
Business Review, July-August, pp.37-66.
http: //www.uysad.com 7 (14) 2020
344
Forrester, J.W. (1961). "Industrial Dynamics," MIT Press, Cambridge, MA.
George, D. and Mallery, P. (2010). “SPSS for Windows Step by Step: A Simple Guide and Reference
17.0 Update 10th Edition”, Pearson, Boston.
Gerwin, D. (1993). "Manufacturing flexibility: a strategic perspective," Management Science, Vol. 39,
No.4, pp.395–410.
Gosain, S., Malhotra, A., & Sawy, O.A.E. (2005). "Coordinating for flexibility in e-Business supply
chains" Journal of Management Information Systems, Vol.21, No.3, pp.7-45.
Gunasekaran, A., Patel, C., & Tirtiroglu, E. (2001). "Performance Measures and Metrics in a Supply
Chain Environment," International Journal of Operations and Production Management, Vol.21,
pp.71-77.
Guo, L., Xiao, JJ., & Chuanyi, T. (2009). "Understanding the psychological process underlying
customer satisfaction and retention in a relational service," Journal of Business Research, Elsevier,
vol.62(11), p.p1152-1159, November.
Hallowell, R. (1996), "The relationships of customer satisfaction, customer loyalty, and profitability:
an empirical study." International Journal of Service Industry Management, Vol. 7, No. 4, pp.27-42.
Handfield, R. & Bechtel, C. (2002). "The role of trust and relationship structure in improving supply
chain responsiveness." Industrial Marketing Management, Vol.31, No.4, pp.367-382.
Heikkilä, J. (2002). "From Supply to Demand Chain Management: Efficiency and Customer
Satisfaction." Journal of Operations Management, Vol.20, pp.747-767.
Homburg, C., & Stock, R.M. (2004). "The link between salespeople's job satisfaction and customer
satisfaction in a business-to-business context: a dyadic analysis.", Journal of Academy of Marketing
Science, Vol.32, No.2, pp.144–158.
Hsiao, C.H., & Bai, C.J. (2000). "The Study on Customer Satisfaction Analysis for Banking Industry: An
Example of P Bank in Taichung." Taiwan Banking and Finance Quarterly, Vol.24, pp.225–250.
Ikeda, M. (2000). "The new product development system of the Japanese automobile industry. In
Jurgens, New Product Development and Production Networks, Springer-Verlag, Berlin.
Jin, L., He, Y., & Song, H. (2012). "Service customization: To upgrade or to downgrade? An
investigation of how option framing affects tourists' choice of package-tour services". Tourism
Management, Vol.33
Jin, N., Line, N.D. & Merkebu, J. (2016). "The effects of image and price fairness: a consideration of
delight and loyalty in the waterpark industry" International Journal of Contemporary Hospitality
Management, Vol.28, No.9, pp.1895-1914
Kanter, R.M. (1994). "Collaborative Advantage: the art of alliances," Harvard Business Review, Vol.72,
No.4, pp.96-108.
Kasiri, L., Cheng, K., Sambasivan, M., & Sidin, S., (2017), "Integration of standardization and
customization: Impact on service quality, customer satisfaction, and loyalty." Journal of Retailing and
Consumer Services, Vol. 35, Pp.91-97.
Kim, S.W. (2009), "An investigation on the direct and indirect effect of supply chain integration on
firm performance," International Journal of Production Economics, Vol.119, No.2, pp.328-346
http: //www.uysad.com 7 (14) 2020
345
Kouphteros, X., Vonderembse, M., & Jayaram, J. (2005). "Internal and external integration for
product development: the contingency effects of uncertainty, equivocality, and platform strategy."
Decision Sciences, Vol.36, No.1, pp.97–133.
Lai, F., Griffin, M., & Babin, B.J. (2009). "How quality, value, image, and satisfaction create loyalty at a
Chinese telecom." Journal of Business Research, Vol.62, No.10, pp.980-986.
Lamming, R.C. (1993). "Beyond partnership: strategies for innovation and lean supply." Prentice-Hall,
Hemel Hempstead.
Landis, G. (1999). "Converting customer expectations into achievable results." Hospital materiel
management quarterly, Vol.21, pp.7-11.
Lee, H.L. (2004). "The triple-A supply chain." Harvard Business Review. Vol.82, No.10, pp.102-112.
Lummus, R., Duclos, L., & Vokurka, R. (2003). "Supply chain flexibility: building a new model" Global
Journal Flexible Systems Management., Vol.4, pp.1-13
Lundahl, N., Vegholm, F., & Silver, L. (2009). "Technical and functional determinants of customer
satisfaction in the bank-SME relationship. Managing Service Quality", An International Journal,
Vol.19, No.5, pp.581-594.
McMullan, R. (2005). "A multiple-item scale for measuring customer loyalty development." Journal of
Services Marketing, Vol.19, No.7, pp.470-481.
Min, S. & Mentzer, J.T. (2004), “Developing and Measuring Supply Chain Management Concepts”.
Journal of Business Logistics, Vol.25, pp.63-99.
Morlok, E.K., Chang, D.J. (2004). "Measuring capacity flexibility of a transportation system,"
Transportation Research Part A: Policy and Practice, Vol.38, Issue.6, Pp.405-420,
Moutinho, L. & Smith, A. (2000), "Modelling bank customer satisfaction through mediation of
attitudes towards human and automated banking," International Journal of Bank Marketing, Vol.18,
No.3, pp.124-134.
Naim, M.M., Potter, A.T., Mason, R.J. & Bateman, N. (2006), "The role of transport flexibility in
logistics provision." International Journal of Logistics Management, Vol.17, No.3, pp.297-311.
Namukasa, J. (2013). "The influence of airline service quality on passenger satisfaction and loyalty:
The case of Uganda airline industry." The TQM Journal, Vol.25.
Narayanan, V.K. & Zane, Lee & Kemmerer, Benedict. (2011). “The Cognitive Perspective in Strategy:
An Integrative Review”, Journal of Management, Vol.37, pp.305-351.
Narayanan, V.K. & Zane, Lee & Kemmerer, Benedict. (2011). “The Cognitive Perspective in Strategy:
An Integrative Review”, Journal of Management, Vol.37, pp.305-351.
Narayandas, N. (1996), "The link between customer satisfaction and customer loyalty: an empirical
investigation'', Working paper, Harvard Business School, pp.97-017.
Naylor, J.B., Naim, M.M. & Berry, D., (1999), "Leagility: integrating the lean and agile manufacturing
paradigms in the total supply chain," International Journal of Production Economics, Vol. 62, No.1/2,
pp.12-19.
Oliver, R.L. (1980). "A cognitive model of the antecedents and consequences of satisfaction
decisions," Journal of Marketing Research, Vol. 17, No. 4, pp.460-469.
http: //www.uysad.com 7 (14) 2020
346
Oliver, R.L., (1999) "Whence consumer loyalty," Journal of Marketing, Vol. 63., pp. 33–44.
Otim, S. & Grover, V. (2006). "An empirical study on Web-based services and customer loyalty."
European Journal of Information Systems. Vol.15, pp.527-541.
Parasuraman, Zeithaml, L.L. & Berry, (1988). "SERVQUAL: a multiple-item scale for measuring
consumer perceptions of service quality," J. Retailing, Vol. 64, No.1, pp. 12-40.
Parnaby, J., & Donovan, J.R. (1987). "Education and training in manufacturing systems engineering,"
IEE Proceedings A (Physical Science, Measurement and Instrumentation, Management and
Education, Reviews), Vol.134, No.10, pp.816-824.
Ramanathan, R., (2010), "The moderating roles of risk and efficiency on the relationship between
logistics performance and customer loyalty in e-commerce," Transportation Research Part E: Logistics
and Transportation Review, Vol.46, Issue 6, Pp. 950-962.
Rich, N., and Hines, P. (1997). "Supply-chain management and time-based competition: the role of
the supplier association." International Journal of Physical Distribution & Logistics Management,
Vol.27, No.3, pp.210-25.
Rust, R.T., Chung, T.S. (2006). "Marketing models of service and relationships." Marketing Science,
Vol.26, No.6, pp.560-580.
Sako, M., Lamming, R.C., & Helper, S.M. (1995). "Supplier relations in the UK car industry: good news.
– bad news." European Journal of Purchasing and Supply Management, Vol.1, No.4, pp.237- 248.
Sandoff, M. (2005). "Customization and standardization in hotels-A paradox or not?". International
Journal of Contemporary Hospitality Management, Vol.17, No.6/7, pp.529-535.
Sharifi, H. & Zhang, Z. (1999). "A Methodology for Achieving Agility in Manufacturing Organizations:
An Introduction." International Journal of Production Economics, Vol.62, pp.7-22.
Slack, N., (1983). "Flexibility as a manufacturing objective." International Journal of Operations and
Production Management. Vol.3, No.3, pp.4–13
Song, M., & Di Benedetto, C.A. (2008). "Supplier's involvement and success of radical new product
development in new ventures." Journal of Operations Management, Vol.26, No.1), pp.1–22.
Stank, Theodore & Keller, Scott & Daugherty, Patricia. (2001). “Supply Chain Collaboration and
Logistics Service Performance”, Journal of Business Logistics, Vol.22, pp.29-48.
Steele, A.L. (2001). "Cost drivers and other management issues in the JIT supply chain environment."
Production and Inventory Management Journal. Vol.42, pp.61-67.
Stevenson, M., & Spring, M. (2007). "Flexibility from a Supply Chain Perspective: Definition and
Review." International Journal of Operations & Production Management. Vol.27, pp.685-713.
Swafford, P.M., Ghosh, S., & Nagash, N.M. (2006). "A framework for assessing value chain agility"—
International Journal of Operations & Production Management, Vol.26, No.2, pp.118-140.
Swink, M., Narasimhan, R. & Wang, C. (2007), "Managing beyond the factory walls: effects of four
types of strategic integration on manufacturing plant performance," Journal of Operations
Management, Vol. 25, No.1, pp. 148-164.
Talluri, S., & Sarkis, J. (2001). "A computational geometry approach for benchmarking." International
Journal of Operations & Production Management, Vol.21, pp.210-222.
http: //www.uysad.com 7 (14) 2020
347
Tam, K.Y., & Ho, S.Y. (2006). "Understanding the impact of web personalization on user information
processing and decision outcomes," MIS Quarterly, Vol.30, No.4, pp.865-890
Upton, D.M. (1994). "The Management of Manufacturing Flexibility." California Management Review,
Vol.36, No.2, pp.72–89.
Veloutsou, C., Daskou, S., & Daskou, A., (2004), "Are the determinants of bank loyalty brand-
specific," Journal of Financial Services Marketing, Vol. 9, No. 2, pp.113-25.
Vickery, S.n., Calantone, R., Droge, C. (1999). "Supply chain flexibility: an empirical study.", The
Journal of Supply Chain Management, Vol.35, No.3, pp.16-24
Vinodh, S., Sundararaj, G., Devadasan, S.R., & Rajanayagam, D. (2009). "TADS-ABC: a system for
costing total agile design system." International Journal of Production Research, Vol.47, No.24,
pp.6941e6966.
Vonderembse, M.A., Uppal, M., Huang, S.H., & Dismukes, J.P. (2006). "Designing supply chains:
towards theory development." International Journal of Production Economics, Vol.100, No.2, pp.223-
238.
Walter, W.C., Chung, A.Y.K., Yam, M., & Chan, F.S. (2004). "Networked enterprise: A new business
model for global sourcing," International Journal of Production Economics, Vol.87, Issue.3, Pp.267-
280.
Wang, Y., Bell, D. & Padmanabhan, V. (2009). "Manufacturer-owned retail stores." Marketing Letters.
Vol.20, pp.107-124.
Wilding, R., Beverly, W., Gligor, M., & Holcomb M.C. (2012). "Understanding the role of logistics
capabilities in achieving supply chain agility; a systematic literature review." Supply Chain
Management: An International Journal, Vol.17, No.4, pp.438–453.
Witell, Lars & Johnson, Michael & Gustafsson, Anders. (2001). "The impact of quality practices on
customer satisfaction and business results: Product versus service organizations." Journal of Quality
Management. Vol.6. Pp.5-27.
Xia, L., Monroe, K., Cox, J., Kent, B., & Jones, J. (2004). "The Price Is Unfair! A Conceptual Framework
of Price Fairness Perceptions". Journal of Marketing. Vol.68. pp.1-15.
Yu, W., Jacobs, M., Salisbury, W., & Enns, H. (2013). "The effects of supply chain integration on
customer satisfaction and financial performance: An organizational learning perspective."
International Journal of Production Economics. Vol.146, pp.346-358.
Yusuf, Y.Y., Gunasekaran, A., Adeleye, E.O., & Sivayoganathan, K., (2004), "Agile supply chain
capabilities: determinants of competitive objectives," European Journal of Operational Research, Vol.
159, No. 2, pp.379-92
Zeithaml, V.A. (1988), "Consumer Perceptions of Price, Quality, and Value: A Means-End Model and
Synthesis of Evidence," Journal of Marketing, Vol. 52, (July), pp. 2-22.
Zeithaml, V.A., Berry, L.L., Parasuraman, A. (1996). "The behavioral consequences of service quality."
Journal of Marketing, Vol.60, No.2, pp.31-46.