The Impact of Education Decentralization on Education ...
164
Georgia State University Georgia State University ScholarWorks @ Georgia State University ScholarWorks @ Georgia State University Economics Dissertations 1-5-2007 The Impact of Education Decentralization on Education Output: A The Impact of Education Decentralization on Education Output: A Cross-Country Study Cross-Country Study Eunice Heredia-Ortiz Follow this and additional works at: https://scholarworks.gsu.edu/econ_diss Part of the Economics Commons Recommended Citation Recommended Citation Heredia-Ortiz, Eunice, "The Impact of Education Decentralization on Education Output: A Cross-Country Study." Dissertation, Georgia State University, 2007. https://scholarworks.gsu.edu/econ_diss/21 This Dissertation is brought to you for free and open access by ScholarWorks @ Georgia State University. It has been accepted for inclusion in Economics Dissertations by an authorized administrator of ScholarWorks @ Georgia State University. For more information, please contact [email protected].
Transcript of The Impact of Education Decentralization on Education ...

Georgia State University Georgia State University
ScholarWorks @ Georgia State University ScholarWorks @ Georgia State University
Economics Dissertations
1-5-2007
The Impact of Education Decentralization on Education Output: A The Impact of Education Decentralization on Education Output: A
Cross-Country Study Cross-Country Study
Eunice Heredia-Ortiz
Follow this and additional works at: https://scholarworks.gsu.edu/econ_diss
Part of the Economics Commons
Recommended Citation Recommended Citation Heredia-Ortiz, Eunice, "The Impact of Education Decentralization on Education Output: A Cross-Country Study." Dissertation, Georgia State University, 2007. https://scholarworks.gsu.edu/econ_diss/21
This Dissertation is brought to you for free and open access by ScholarWorks @ Georgia State University. It has been accepted for inclusion in Economics Dissertations by an authorized administrator of ScholarWorks @ Georgia State University. For more information, please contact [email protected].

PERMISSION TO BORROW
In presenting this dissertation as a partial fulfillment of the requirements for an advanced degree from Georgia State University, I agree that the Library of the University shall make it available for inspection and circulation in accordance with its regulations governing materials of this type. I agree that permission to quote from, to copy from, or to publish this dissertation may be granted by the author or, in his or her absence, the professor under whose direction it was written or, in his or her absence, by the Dean of the Andrew Young School of Policy Studies. Such quoting, copying, or publishing must be solely for scholarly purposes and must not involve potential financial gain. It is understood that any copying from or publication of this dissertation which involves potential gain will not be allowed without written permission of the author.
Signature of the Author

NOTICE TO BORROWERS
All dissertations deposited in the Georgia State University Library must be used only in accordance with the stipulations prescribed by the author in the preceding statement.
The author of this dissertation is:
Eunice Heredia-Ortíz 31 Devonshire Ct. Alpharetta, GA 20033 The director of this dissertation is:
Jorge L. Martinez-Vazquez Department of Economics Andrew Young School of Policy Studies Georgia State University Users of this dissertation not regularly enrolled as students at Georgia State University are required to attest acceptance of the preceding stipulations by signing below. Libraries borrowing this dissertation for the use of their patrons are required to see that each user records here the information requested.
Type of use Name of User Address Date (Examination only or copying)

THE IMPACT OF EDUCATION DECENTRALIZATION ON EDUCATION OUTPUT: A CROSS-COUNTRY STUDY
BY
EUNICE HEREDIA-ORTIZ
A Dissertation Submitted in Partial Fulfillment Of the Requirements for the Degree
of Doctor of Philosophy
in the Andrew Young School of Policy Studies
of Georgia State University
GEORGIA STATE UNIVERSITY 2006

Copyright by Eunice Heredia
2006

ACCEPTANCE
This dissertation was prepared under the direction of the candidate’s Dissertation Committee. It has been approved and accepted by all members of that committee, and it has been accepted in partial fulfillment of the requirements for the degree of Doctor of Philosophy in Economics in the Andrew Young School of Policy Studies of Georgia State University.
Dissertation Chair: Jorge L. Martinez-Vazquez Committee: Robert M. McNab David L. Sjoquist Mary Beth Walker
Electronic Version Approved: Roy W. Bahl, Dean Andrew Young School of Policy Studies Georgia State University December 2006

ACKNOWLEDGEMENTS
First and foremost, I would like to thank God, the creator of all things, for his continuous provision of strength and blessings through the journey of my life. Just when I think that things cannot happen, He always lays his mighty hand to make them happen.
I would like to express my sincere gratitude and acknowledge the contribution to the completion of this dissertation to my husband Telmo Ortíz and my parents, Dr. José Heredia and Ana María de Heredia (Bolivia). Telmo’s encouragement and patience during the writing of this dissertation is invaluable, especially now that we expect the birth of our first baby. My parents provided the guidance and encouragement from the early years of my life. They taught me what is important in life, and they sacrificed a lot in order to support their three children through higher education even during difficult times. I hope we have made you proud. My siblings, Ana Karina Champion and Josué Heredia; you are the best sister and brother I could have ever had. God bless you always.
Professionally, I cannot express enough gratitude and appreciation to my dissertation committee chair and mentor, Dr. Jorge Martinez-Vazquez. Thank you for your kindness, encouragement and support throughout the years. If it were not for your faith in me, I would not have made it this far. The passion that you exert in what you do has been a great inspiration in my life.
I am also greatly thankful to the members of my dissertation committee, Dr. Robert McNab, Dr. David Sjoquist, and Dr. Mary Beth Walker, for taking the time to provide valuable comments and guidance that helped to shape and complete this dissertation. I would also like to thank Dr. Yongsheng Xu for his comments on the theoretical model. My sincere gratitude to my friends and colleagues at the International Studies Program for their support. Dr. Jamie Boex for being a great mentor on the practical application of the principles of decentralization, especially in the most remote areas of the world. Dr. Mark Rider for providing advice on “how to finish your dissertation while being a Research Associate.” Dr. Felix Rioja provided support and advice for me to start the Ph.D. program at Georgia State University. Finally, I would like to recognize the faculty and staff at Georgia State University for your care and sharing of knowledge throughout the years.
Friendship is a privilege and I have been blessed to have great friends who provided incalculable support and encouragement. In particular, Dr. A.J. Sumell and Dr. Javier Arze (whom I can now call doctor) have been great friends, colleagues and family from the beginning of the journey through grad school. We were once youngsters with big dreams, and I now rejoice that these dreams are coming true. My friends, Dr. Guevera Yao and Dr. Paul Kagundu (whom I can also now call doctor), provided me with their time and invaluable advice in the completion of this dissertation. I will always be indebted to you.
Lastly, my sincere appreciation for all of those that I did not include in these paragraphs but who are somehow part of this achievement. I did not forget about you.
vi

TABLE OF CONTENTS
Page ACKNOWLEDGEMENTS........................................................................................................... vi
TABLE OF CONTENTS.............................................................................................................. vii
LIST OF TABLES...........................................................................................................................x
LIST OF FIGURES ...................................................................................................................... xii
ABSTRACT................................................................................................................................. xiii
Chapter One: Introduction ...............................................................................................................1
Motivation............................................................................................................................3
The Need for Theoretical Analysis ......................................................................................6
The Need for Additional Empirical Analysis ......................................................................8
Overview of the Dissertation ...............................................................................................9
Chapter Two: Review of the Literature .........................................................................................11
Defining and Measuring Education Output .......................................................................12
Defining and Measuring Education Decentralization........................................................14
Theory of Education Decentralization and Service Delivery ............................................18
The Empirical Literature....................................................................................................22
Education Decentralization to Lower Levels of Government ...............................24
Education Decentralization to the School Level (SBM)........................................29
Education Decentralization and Community Participation....................................34
Conclusion .........................................................................................................................37
vii

Chapter Three: A Model of Education Decentralization ...............................................................39
The Theoretical Model.......................................................................................................41
Education Decentralization and Student and Household Inputs............................44
Education Decentralization and School Related Inputs.........................................46
Education Decentralization and Student and Teacher Effort.................................48
The Optimization Problem.................................................................................................51
How does the optimal level of Education Decentralization affect Education Output? .................................................................................................53
The Hypothesis Framework...............................................................................................55
Concluding Thoughts from the Theoretical Analysis........................................................57
Chapter Four: Empirical Methodology..........................................................................................58
Data Description and Sources............................................................................................59
Education Output Data...........................................................................................59
Education Decentralization Data ...........................................................................62
Other Explanatory Variables..................................................................................66
Empirical Models...............................................................................................................67
Estimation Equations .............................................................................................71
Education Decentralization and Household and School Factors ...........................73
Econometric Issues: Endogeneity ......................................................................................76
viii

Chapter Five: Estimation Results...................................................................................................79
Education Decentralization and Education Output: All Countries ....................................80
Education Decentralization and Primary Repetition Rate .....................................80
Education Decentralization and Primary Dropout Rate.........................................83
Education Decentralization and Primary Net Enrollment Rate .............................86
Education Decentralization and Primary Completion Rate ...................................88
Education Decentralization and Student Test Scores in Science...........................90
Education Decentralization and Decision-Making: Sub-sample of Countries ..................93
Chapter Six: Conclusion ................................................................................................................99
Appendix A: Country Experiences with Education Decentralization .........................................103
Appendix B: Theoretical Appendix .............................................................................................121
Appendix C: Data Description and Sources ................................................................................123
Appendix D: The Two-Stage Least-Squares Estimation .............................................................134
Appendix E: Estimation Results ..................................................................................................138
References....................................................................................................................................142
VITA............................................................................................................................................149
ix

LIST OF TABLES
Table Page
1. Types of decisions in education that may be decentralized.......................................................17
2. Percentage of decisions relating to public sector education taken at each level of government ................................................................................................................................65
3. Fixed and Random Effects Estimation Results for all Sample Countries. Dependent
Variable: Repetition Rate at the Primary Level ........................................................................81 4. 2SLS/IV Estimation Results for all Sample Countries. Dependent Variable: Dropout
Rate at the Primary Level ..........................................................................................................85 5. Estimation Results for all Sample Countries. Dependent Variable: Net Enrollment Rate
at the Primary Level ..................................................................................................................87 6. Fixed and Random Effects Estimation Results for all Sample Countries. Dependent
Variable: Completion Rate at the Primary Level .....................................................................89 7. Fixed and Random Effects Estimation Results for all Sample Countries. Dependent
Variable: International Test Scores in Science at the Primary Level .......................................92 8. Estimation Results for Sub-Sample of Countries. Dependent Variable: International
Test Scores in Science at the Primary Level .............................................................................95 9. Estimation Results for Sub-Sample of Countries. Dependent Variable: Repetition Rate
at the Primary Level ..................................................................................................................96 C.1 Data Sources..........................................................................................................................123
C.2 Descriptive Statistics .............................................................................................................126
C.3 List of All Sample Countries.................................................................................................128
C.4 List of Sub-Sample of Countries...........................................................................................129
C.5 Correlation Matrix.................................................................................................................130
C.6 International comparative tests of student learning...............................................................131
D.1 Instrumental Variables and Education Decentralization ......................................................137
x

E.1 Pooled LS Estimates. Dependent Variable: Current Expenditures per Pupil at the Primary Level.........................................................................................................................138
E.2 Pooled LS Estimates. Dependent Variable: Repetition Rate.................................................139
E.3 Pooled LS Estimates. Dependent Variable: Completion Rate ..............................................140
E.4 Pooled LS Estimates. Dependent Variable: Science Test Scores..........................................141
xi

LIST OF FIGURES
Figure Page
C.1 Partial Correlation between Completion Rates and Education Decentralization .................132
C.2 Partial Correlation between Repetition Rates and Education Decentralization ...................132
C.3 Partial Correlation between Dropout Rates and Education Decentralization ......................132
C.4 Partial Correlation between Net Enrollment Rates and Education Decentralization ...........133
C.5 Partial Correlation between Science Test Scores and Education Decentralization .............133
xii

ABSTRACT
THE IMPACT OF EDUCATION DECENTRALIZATION ON EDUCATION OUTPUT: A CROSS-COUNTRY STUDY
By
EUNICE HEREDIA-ORTIZ
November 2006
Committee Chair: Dr. Jorge L. Martinez-Vazquez Major Department: Economics
This dissertation examines, both theoretically and empirically, the impact of
expenditure decentralization and decision-making in education on education output
measured through net enrollment rates, repetition rates, dropout rates, completion rates,
and test scores in science at the primary school level. We develop a theoretical model
based on a behavioral production function model that investigates the potential direct
effects of education decentralization on output, and indirect effects of education
decentralization through its impact on family, school and teacher inputs.
We develop an unbalanced panel data model of education decentralization by
using various econometric estimators on a dataset of fifty nine countries, developed and
developing countries, covering the period 1970-2004 in five-year intervals. The empirical
analysis in this dissertation improves upon previous empirical studies of education
decentralization by using up-to-date comparative international data over time on
measures of education decentralization and various indicators of primary schooling.
We find empirical support that expenditure decentralization in education
significantly improves repetition rates, dropout rates, completion rates and test scores at
xiii

the primary school level. We are unable to find a significant effect on primary net
enrollment rates. Further, we find that decisions on education planning and personnel
management have a greater influence on education output when taken at the intermediate
level of government (states and provinces). At the same time we find that allocating
decisions on education at the school level can also significantly improve education
output.
Our empirical results support the hypothesized positive link between education
decentralization and education outcomes. Additionally, this study is consistent with the
recent trend towards decentralizing education around the world.
xiv

CHAPTER ONE
INTRODUCTION
This dissertation explores the impact of the decentralization of expenditure and
decision-making authority in the area of education on the output of publicly provided
primary education.1 Decentralization in education can range from the deconcentration of
administrative authority to more comprehensive regulatory and financial control, and it
can extend across all education functions. In this study we define the term “education
decentralization” to mean the process of devolution of fiscal and decision-making
authority, from higher to lower levels of government and organizational units, affecting
the way school systems make policy about resource generation and spending;
organization of instruction (curricula, textbooks, teaching methods, schedule); personnel
management (hiring/firing, pay scales, assigning teaching responsibilities, training); and
planning and managing public schools.
A number of researchers suggest that human capital–in the form of quantity of
schooling and quality–plays an important role in economic development and per capita
income growth. Education not only helps to improve the income-earning potential but it
also has the ability to empower individuals; education enables individuals to participate
in local and national government, it provides skills and knowledge to improve quality of
1 Chapter Three provides a more detailed discussion on the definition and measurement of education output.
1

2
life, and to become more productive (World Bank 1995a). Therefore, investigating
whether education decentralization might improve the outcomes associated with the
provision of education is of primary importance in order to obtain better governance,
quality of life, and overall economic growth. Our model investigates the direct and
indirect effects that decentralization of education expenditures and decision-making
might have (positive or negative) on education services at the primary school level.
Specifically, we investigate the direct effect of education decentralization on education
output indicators and the potential indirect effects through family and school inputs. As
we discuss throughout this dissertation, the findings could have significant policy
implications since most countries are moving towards some form of decentralized
delivery of education services.
Empirically, our model estimates the effects of education decentralization on
primary education provision. We evaluate different indicators of primary education
provision performance, namely we measure access to education through net enrollment
rates; cohort flows through dropout and repetition rates, and completion rates; and
student learning through test scores.2 We estimate our model based on a panel data set of
developed and developing countries for five-year intervals from 1970 to 2004.
We further investigate the effect of education decentralization for a sub sample of
countries, mainly OECD countries, employing traditional measures of education
decentralization (expenditure decentralization) versus a more comprehensive measure of
education decentralization that includes measures of decision-making autonomy in the
2 The literature has used different indicators for the performance of education systems. We evaluate the ones that have been most commonly used in the literature. The indicators most commonly criticized are repetition and dropout rates because they can be strongly influenced by variation in the promotion standards of education systems.

3
education process. Lastly, our goal is to provide a discussion on the policy implications
of our empirical results.
Motivation
For many decades now, there has been a consensus on the importance of
education in economic performance. Globally, education has gained attention due to the
two Millennium Development Goals that are directly related to education (achieving
universal primary education and promoting gender equality), and education is argued to
also help promote achievement of several other MDG goals, such as reducing poverty,
reducing child mortality, improving maternal health, lowering the prevalence of
HIV/AIDS, and ensuring environmental sustainability (Birdsall 1993; Deny, Harmon,
and Redmon 2000; Psacharopoulos and Woodhall 1985; Ranis, Stewart, and Ramirez
2000).
Despite the many advantages of education, including the potential to lift people
out of poverty, in many countries education provision has failed in terms of affordable
access, technical quality, client responsiveness, and output. Millions of children around
the world fail to gain access to schooling, and an even larger number of those who enroll
leave prematurely, dropping out before basic skills of literacy and numeracy are achieved
(World Bank 2003). This will likely have negative implications to economic growth and
development in a country.
While education continues to receive great attention in policy debates, reforming
education to provide adequate access, equity, and quality education, involves redefining

4
the role of government in education management and finance. Proponents of fiscal
decentralization and decentralized education argue that decision-making in the delivery
of education services that are closer to the people, at lower levels of government, may
translate into better education service delivery and improved output (Fiske 1996; Hanson
and Ulrich 1994).
As a result of this apparent positive link between education decentralization and
education output, international financial organizations, notably the World Bank and the
United Nations, have facilitated efforts for decentralization reforms in developing
countries. Over the past two decades, decentralization has moved to the forefront of
policy discussions in developed, developing, and transitional countries. Decentralization
of the provision of education, as a component of overall decentralization, has often been
viewed as one of the first functions to be assigned to lower levels of government. In some
instances, the decision to decentralize education is pursued for the wrong reasons. For
example, central governments may impose unfunded mandates, which are expenditure
requirements on sub-national governments arising from the absence of adequate funding
or in order to meet deficit targets at the central level (Prud'homme 1995; Tanzi 1996).
These unfunded mandates compromise the efficient provision of education services.
Our goal in this dissertation is to analyze, theoretically and empirically, the
impact of education decentralization on education output. We believe that the course of
research of this dissertation is timely and pertinent given the lack of consensus in the
literature about the effect of education decentralization on education outputs. While there
is a possibility that there is improvement in education outputs due to education

5
decentralization,3 others argue that centralization of education systems should be
preferred in developing countries where there is considerable instability, often immature
democratic systems, and where weak fiscal and technical capacity of sub-national
governments may hinder equitable and efficient provision of education services. Whether
education decentralization has an effect on the performance of education systems and
what is the magnitude of this effect are yet to be determined.
Furthermore, the literature is abundant with specific country case studies on the
impact of education decentralization on education output, but there is less evidence, if
any, on comparative studies of education decentralization across countries over time.
Considering that no two countries are the same, it is essential that the literature provides
evidence of this impact across countries and over time.
Understanding the factors that contribute to the production of education and
exploring the link between education decentralization and the outcomes of this policy on
the education system is important for the following reasons: (1) it will contribute to the
literature explaining the effect of education decentralization on education output across
countries and over time, and (2) from the policymakers’ point of view, if education
decentralization leads to improved outcomes of education provision in terms of greater
access through higher enrollment rates; greater efficiency through lower repetition and
dropout rates, as well as better student test scores, then international financial institutions,
bilateral donors and governments should focus on decentralization reforms that enhance
the responsibilities of sub-national governments in delivering education services. This
3 See Lobo (1995), Lange (1988), and Sawada (2000).
6
would contribute, according to evidence, to the betterment of human capital and the
improvement of economic performance.
The Need for Theoretical Analysis
Principal-agent models,4 educational production functions,5 teacher power and
patronage models6 have all been used to examine the question of education outputs and
expenditures. Only recently, with the rise of decentralization reforms have these models
began to incorporate education decentralization as a potential influencing variable with
respect to education outputs. These models hypothesize that education outputs are
influenced by school inputs; management structure; household inputs; community
participation; and many other outside forces such as the political environment.
The production function models are widely used in more recent studies of
education decentralization. There is a need to extend the existing theoretical models on
education decentralization and education output in order to establish a firm basis for the
empirical work such as that carried out in this dissertation. Most of the existing
theoretical models have primarily examined the role of education decentralization reform
and differences across regions in one specific country and do not account for the
behavioral effects of the agents in the education process. The theoretical models in these
studies were adapted to only one specific form of decentralization, leaving no room for
4 For principal-agent models Holmes, DeSimone and Rupp (2003); Otsuka, Chuma, and Hayami (1992); and Sawada (2000). 5 For production function models see: Hanushek (1995); Ozler (2001); Pritchett and Filmer (1997); and Sawada (2000). 6 See Olson (1965) and Pritchett and Filmer (1997).

7
theoretical specifications that can account for different types of education
decentralization across countries.7
Although specific country analysis of education decentralization can provide
policymakers with significant insight on a type of reform and its influence on education
outputs, cross-country studies can provide planners with guidance on a balance between
centralized and decentralized decision-making of education functions. Examining the
distribution of decision-making authority in different countries with respect to the
educational functions can also help determine a plan about an optimal level of
government decision-making power sharing that is best suited in any given set of
circumstances based on countries’ characteristics, experiences, and outputs of education.
Although Lee and Barro (2001) developed a production function model to investigate the
factors that affect education output across countries, their model does not incorporate
education decentralization as a determinant of education output.
We argue that the failure to develop a model that is adaptable to different types of
education decentralization and to include behavioral effects on the inputs of the education
process has inhibited researchers’ ability to perform cross-country comparative studies of
decentralization’s influence on education outputs. One of the objectives of this
dissertation is to develop a theoretical model of decentralization that investigates the
potential effect of education decentralization that is adaptable to different forms of
education decentralization policies to take full advantage of cross-country experiences.
7 Examples of studies that incorporate one type of decentralization are: Jimenez and Sawada (1999) and the EDUCO program of Community Participation and Teacher Effort in El Salvador; Prawda (1993a) and the implementation of a voucher program in Chile; and Hoxby (2000) and the increase in competition through local financing in the United States.

8
The theoretical model we present in Chapter Three of this dissertation extends
previously developed production function models, and incorporates an education
decentralization parameter which affects the production of education.
The Need for Additional Empirical Research
Numerous countries around the world are considering or are implementing
education decentralization reforms, yet empirical knowledge of the relationship between
education decentralization and education output remains ambiguous. The ambiguity
could be the result of a number of measurement problems and the lack of international
comparative data.
The focus of previous empirical research about the impact of education
decentralization on education output has been on individual country analysis.8 This
approach makes sense; characteristics of education decentralization and the output of
education are affected by social, cultural, economic, and political determinants which are
country-specific. There remains a need to expand the possibility of generalizing results
through comparative case studies. Studies have relied on cross-sectional data, even
though education decentralization is an extensive process whose impact, we believe, is
only quantifiable over time. In addition, measuring education output has been a
controversial issue in the literature. Can education output be measured by the number of
students enrolled in school, the number of students who graduate each year, the number
of dropout students, the number of repeaters, or the results of test scores? Does
8 See Galiani and Schargrodsky (2002); Lange (1988); Lobo et al. (1995); Ozler (2001); Prawda (1993b); and Sawada (2000).

9
decentralization influence the measures listed above differently? Recent studies have
attempted to study the effect of education decentralization on education output measured
via results in mathematics, science and language tests. However, these data are still very
limited for international comparative studies.
This study extends the empirical literature on the relationship between education
decentralization and education output. For instance, this study analyzes this relationship
in the context of an international comparative study over time, using different measures
of education output, and comparing results between using traditional measures of
education decentralization and a more comprehensive measure of education
decentralization that includes decision making autonomy across functions within the
education system. To the best of our knowledge, this study is the first to use panel data
for a large set of countries in examining the relationship between education
decentralization and education output.
Overview of the Dissertation
The rest of the dissertation is organized as follows: Chapter Two provides
definitions on education decentralization and education output, as well as a brief review
of the empirical literature on education decentralization and education output. Individual
country case studies on education decentralization reforms can be found in Appendix A.
In Chapter Three, we develop a simple production function model of education that
introduces education decentralization as a factor in the production of education output.
The chapter concludes presenting the testable hypotheses derived from the theoretical

10
model concerning the relationship between education decentralization and its impact on
education output. Chapter Four describes the empirical estimation methods and the data.
Chapter Five presents and discusses the empirical results. Chapter Six concludes this
dissertation providing a discussion on the policy implications based on the empirical
results obtained in the previous chapter.

CHAPTER TWO
REVIEW OF THE LITERATURE
The apparent correlation between education decentralization and education output
has generated numerous research studies and policy debates in the past decade. The
existing literature on this relationship abounds with country specific studies, although
cross-country comparative studies of this relationship are very limited. The literature is
motivated by the importance of determining what influences the provision of education in
order to improve education output. In this chapter, we provide a survey of some of the
main findings emerging from some of these studies. We will discuss measures of
education output used in the literature, and highlight some of the difficulties in measuring
and assessing the impact of education decentralization, theoretically and empirically.
The rest of this chapter is organized as follows. In the first section we briefly
review the definition of education output and the various indicators of education output
that have been used in the literature. In the second section, we review the definition of
education decentralization and the different measures of such that have been used by
researchers in this area. In the third section, we review the theoretical links between
education decentralization and education output as established in the literature. In the
fourth section, we highlight the empirical literature on education decentralization and the
11

12
problems encountered in empirically measuring the true impact of education
decentralization on education output. The last section presents a conclusion and the
expected main contributions of this research study on the existing literature.
Defining and Measuring Education Output
The provision of education is a complex process and its goal is to help achieve a
range of outcomes.9 Education outputs themselves are affected by an array of education
inputs including factors other than government activities, notably student and parent time,
student ability, family, peer group, and other factors. We define educational output as
what education systems and schools produce to contribute to education outcomes.
For many years, governments have sought to improve measures and indicators of
government educational services. Measuring the output of government education is
difficult, and the literature uses the terms output, outcomes, and output quality,
interchangeably to refer to the same set of indicators. Measures of output in the publicly-
funded education sector generally are divided into two components: the volume of output
(pupil number and cohort flows) and the quality of output (achievement in test scores)
(Atkinson 2005).
Because there is no consensus in the literature about the most appropriate measure
of education output, we evaluate the commonly used proxies of education output in
primary education. We consider that our measures of the completion of primary
9 Broadly defined, education outcomes include the preparation of individuals (students) for participation in society and in the economy through the labor market.

13
education and test scores are better measures of education output, than some other
indicators commonly used in the literature. These other indicators–enrollment rates,
dropout and repetition rates–might not exactly capture the concept of education output,
but we analyze them as well, as they might provide an understanding of the multiple
purposes of education decentralization policies.
Access or the level of popular participation in the education sector is generally
measured through enrollment rates. Literacy rates show the accumulated achievement of
primary education and literacy programs in imparting basic literacy skills to the
population. Another set of education output indicators are those related to cohort flows:
repetition rates and dropout rates. Although these indicators are claimed to measure the
internal efficiency of the education system, such indicators are also used in the literature
as indicators of education quality (Lee and Barro 2001). Repetition rates are measured as
the percentage of repeaters in the total number of students enrolled at a given level, and
the dropout rate is measured as the proportion of pupils who start primary school but do
not eventually attain the final grade of primary school. These measures are often
criticized because they can be strongly influenced by variations in the promotion
standards of education systems.10
A final type of education output indicator often used to monitor the quality of
education output is test scores. These capture the level of knowledge of pupils. However,
measuring and comparing the performance of students for a broad number of countries
can be difficult and costly. A potential problem with international assessments is that
10 For example, a country can mandate no repetition in primary grades. Hence, repetition rates in these countries should drop to zero.

14
student performance in specific areas reflects different national emphasis in school
curricula. A further problem involves the difficulty in obtaining representative samples of
pupils (Lee and Barro 2001). Fortunately, indicators of students’ scores on international
comparable tests have become more frequent in the last decade and they have begun to
cover a broader number of countries.
To summarize, we evaluate education output as net enrollment rates, completion
rates, repetition rates, dropout rates, and student test scores. Despite the weaknesses in
some of these measures, all of the above education output indicators have been used in
previous literature as proxies for education output. For example, see Lee and Barro
(2001); Lobo et al. (1995); Mahal, Srivasta and Sanan (2000); and Prawda (1993b).
Defining and Measuring Education Decentralization
The literature on the decentralization of education presents a variety of definitions
and ways that power is transferred via decentralization. Strictly speaking, we refer to
decentralization in education as the devolution of authority from a higher to a lower level
of authority. Devolution, which is often considered the strongest form of decentralization,
is the permanent transfer of authority over financial, administrative, or pedagogical
matters from higher to lower levels of government. Four possible levels of authority are
considered in this dissertation: the central government; the intermediate level of
government (provincial, state or regional governing bodies); local government
(municipal, county or district governments); and schools.

15
Other definitions of education decentralization that the literature presents are
deconcentration and delegation. Deconcentration is a process where there is a shift in
management responsibilities to lower levels of government but central government is in
control. This is the weakest form of decentralization. On the other hand, delegation is a
more general approach to decentralization where the central government lends authority
to lower levels of government or organizational units, with the understanding that the
delegated authority can be withdrawn.11
The literature recognizes that given decentralization’s multidimensional nature,
measuring any decentralization policy is a difficult task. The fact has been commonly
discussed in the fiscal decentralization literature, although at a much less extent in the
education decentralization literature.12 Just as fiscal decentralization is generally
measured in the literature as the sub-national share of total government spending,
education decentralization may also be measured in its fiscal dimension as the sub-
national education spending share of total government spending in education. While this
approach ignores the importance of measuring the level of decision making at which
functions in education take place, given the lack of data to perform cross-country studies,
the fiscal dimension measure of education decentralization may be the only proxy that
would be consistent for a wider set of countries.
Education decentralization has been measured in different ways based on the
variety of labels and strategies that it has taken. Differences in measuring education
decentralization in the literature may explain the conflicting results in evaluations of
11 For a complete discussion on the differences between deconcentration, delegation, and devolution see Fiske (1996); Guess, Loehr and Martinez-Vazquez (1997); Hanson (1997); McGinn and Welsh (1999); and Rondinelli, Nellis, and Cheema (1984).

16
education decentralization policies. The variety of education decentralization strategies
include policies of community and parental participation, school autonomy, school choice
and voucher programs, charter schools, and sub-national and local resource
management.13 In this approach, education decentralization has been generally measured
as dummy variables representing whether a school may be autonomous, or a chartered
school, or a community school, or presence of de jure autonomy and decentralization,
and so forth. This dummy variable approach is generally found in country case studies.
Where data are available, education decentralization has been measured as the
differences in the management of schools with respect to how many decisions, which
decisions, and to what degree decisions are being taken at a certain government level or
organization level rather than some other level. According to OECD methodology,
education decentralization can be measured on the basis of the location of decision-
making affecting each of the four types of decisions in education systems: organization of
instruction (curricula, textbooks, teaching methods, schedule); personnel management
(hiring/firing, pay, assigning teaching responsibilities, training); planning and structures;
and resources and spending (Organisation for Economic Co-operation and Development
1998). See Table 1 for a detailed description of decisions that may be decentralized.
While OECD provides data on decision making for each of the above mentioned four
types of decisions, these are only available for OECD countries for a limited period of
time. However, this data represents a starting point for a more comprehensive measure of
education decentralization in cross-country studies.
12 For examples see: Bird (2000); Guess, Loehr, and Martinez-Vazquez (1997); and Martinez-Vazquez and McNab (2003). 13 See Appendix A for an overview of country case studies with different forms of education decentralization policies.

17
In sum, we can see that the multiple dimensions of education decentralization
pose serious empirical challenges in investigating the true impact of education
decentralization on education. Provided the limited data availability for a comprehensive
measure of education decentralization for a large set of countries, in this dissertation we
use the fiscal measure for education decentralization for developing and developed
countries; and where data permits, we examine a sub sample of OECD countries for
which a more comprehensive measure of education decentralization is feasible.
Table1. Types of decisions in education that may be decentralized
Organization of Instruction Select School attended by student. Set instruction time. Choose textbooks. Define curriculum content. Determine teaching methods. Personnel Management Hire and fire school director. Recruit and hire teachers. Set or augment teacher pay scale. Assign teaching responsibilities. Determine provision of in-service training. Planning and Structures Create or close a school. Selection of programs offered in a school. Definition of course content.
Set examinations to monitor school performance.
Resources Develop school improvement plan. Allocate personnel budget. Allocate non-personnel budget.
Allocate resources for in-service teacher training.
Source: Organisation for Economic Co-operation and Development (1998)

18
Theory of Education Decentralization and Education Service Delivery
There is currently a global trend towards the decentralizing of education systems.
Most countries are experimenting or contemplating some form of decentralization.14
Proponents of education decentralization claim that “reorganization will improve the
quality of teaching and learning by locating decisions closer to the point at which they
must be carried out and be energizing teachers and administrators to do a better job”
(Fiske 1996, p. 24). Although the impact of education decentralization has been analyzed
in the literature for nearly fifteen years, there is still no consensus on whether these
policies positively impact education output and schooling.
Given that primary and secondary education are often considered a national
priority both on efficiency and equity grounds, central government involvement in the
financing and regulation of education (including determining curricula and setting
educational standards) is generally universal, especially in developing countries.
Conversely, in other countries, such as the case in the United States, these are
responsibilities of sub-national governments. Nonetheless, in accordance with the
subsidiarity principle, the actual provision or delivery of basic education is often
characterized by decentralized provision, where local governments are responsible for
assuring the actual provision of education. While there is no simple rule to follow when
it comes to decentralizing education; the issue becomes one of finding a balance between
degrees of centralized and decentralized decision-making of functions in education across
different levels of government, given the education system objectives.

19
Assuming that the correct institutions are in place,15 the potential gains in the
framework of decentralized education service delivery found in the literature can be
summarized as follows:16
i. Better information and targeting. Local governments have a more institutionalized linkage with beneficiary communities, improved information, and the incentive to use this information; therefore, local governments are better placed to identify the needs, to respect local social identities, and to respond more efficiently to local variations in conditions, tastes, standards, affordability, location requirements and so on for services or infrastructure. Community participation can improve the information flow leading to improved project performance and better targeting. Local governments are better informed not only about local preferences and politics but also about local variations and costs, so they can potentially allocate resources more efficiently than the central government.
ii. Innovation and creative approaches. Having many suppliers of education can lead
to a wide variety of experiences and innovation through competition among sub-national governments. It also encourages providers to act to satisfy the wishes of the local community. Additionally, demand side inducements and choice, if well designed, can be very valuable for education improvement.
iii. Cost/service link. Improved efficiency levels of service provision are achieved
when there is a link between costs and benefits. When local governments have autonomy to levy fees and local taxes, there is not only a great potential for improved revenue mobilization and increased resources available for redistribution and allocation of programs, but this also reinforces local accountability.
iv. Improved efficiency. This deals with how educational resources are used. It is
argued that decentralization leads to more efficiency by eliminating bureaucratic procedures and motivating local officials to be accountable to citizens for resource allocation. In a centralized system, decisions are mostly made outside and far away from where the actual issue is located. Assuming that local government units are more informed about the specific needs of their communities, then allowing local governments to decide on resource allocation will result in better efficiency.
v. Greater voice and participation. Decentralization empowers citizens through the
creation of institutions that promote greater voice and participation, and giving 14 A survey of developing and transitional nations by Dillinger (1994) indicates that out of 75 such economies with populations greater than 5 million, all but 12 have experienced some type of transfer of power to local governments. 15 Underlying assumptions include (i) elected that officials are responsive to constituents, (ii) planning and budgeting allows for public involvement, and (iii) local bodies indeed have discretion in expenditure decisions. 16 See Burki, Perry and Dillinger (1999); Fiske (1996); Oates (1972); Winkler and Gershberg (2000).

20
citizens a greater management role. The assumption is that decentralization works by enhancing citizen’s political voice in a way that results in improved education services, however, this could go either way on both theoretical and empirical grounds. Although decentralization is no panacea, if correct institutions are in place, it can be very promising. While direct parental participation is considered a weak link to affect service delivery when there is no local autonomy to make changes, providing direct parent and community participation in schools can be a promising strategy for school improvement.
vi. Strengthened accountability relationships. Accountability relationships between
local authorities, citizens, providers and the center are strengthened, as there is greater voice, information, responsiveness and monitoring.
Based on the above potential gains due to decentralized education delivery,
moving decision-making closer to the needs of each school and finding the right balance
of centralized and decentralized responsibilities will improve education provision by
focusing more on cultural differences and learning environments. In addition, it will
improve accountability by giving incentives for quality performance to teachers and
school officials (Hanushek and Rivkin 2003). Similarly, closer parent-school partnership
through decentralization can improve both the school and home environment to learning.
Recent studies argue that education decentralization influences the behavior of
parents and school agents in the education process.17 Education decentralization may
influence household behavior including those related to the time each child spends in
school and learning at home, time each adult spends helping with homework, choice of
school, education related expenditures among others. Moreover, the argument that
accountability relationships strengthen through decentralization are believed to improve
education output by giving incentives for quality performance to education officials,
teachers and schools themselves. Additionally, having many suppliers of education
17 For examples see Behrman and King (2001); Filmer (2002); Jimenez and Paqueo (1996); Jimenez and Sawada (1999); Lobo et al. (1995); and Sawada (2000).

21
through education decentralization is argued to lead to increasing "competitiveness" of
the system and encouraging providers to improve performance (Oates 1972).
However, the assumptions that education decentralization improves education
output as presented above presume a world in which democracy works well, in which all
externalities are captured locally, and sufficient institutional capacity is present to
undertake responsibilities. The argument is only valid under the assumption that
governance capacity of the receiving institution is at least as efficient as the central
government to run the program, and that the central government is unable to match the
preferences of the median-voter of each jurisdiction.18 In the absence of these
presumptions it is argued that decentralization in education may increase disparities in
access, learning outputs, and disparities and inequality in expenditures (Elmore, Fuller,
and Orfield 1996; Godwin and Kemerer 2002).
Studies such as Bahl and Nath (1986), Bahl and Linn (1992) and
Prud’homme(1995) argue that efficiency gains due to decentralization are not significant
in developing and transitional countries. Prud’homme (1995) and Tanzi (1996) argue that
allocative gains arising from a better match to heterogeneous tastes in developing
countries are minimal. Another argument states that developing countries may not gain
allocative efficiency through school competition because their citizens may be too poor to
“vote with their feet” (Davoodi and Zou 1998). Others argue that the central government
is better able to attract better personnel and is able to bargain better wages and career
18 For examples of competition positively influencing education outcomes see Hoxby (1994); Hoxby (2000); and Ritzen, van Dommelen and De Vijlder (1997).

22
prospects. Moreover, it is argued that centralized provision of public goods should have
the advantage of production efficiency over local governments due to economies of scale.
Despite the counterarguments for decentralization, education has not been the
only public service to undergo decentralization reforms in the past years. Countries have
implemented decentralization in health service delivery, transportation, road services and
others. Preliminary studies show that there may be positive effects of decentralization in
public service delivery. In the health sector, for example, Robalino, Picazo and Voetberg
(2001) analyze the impact of fiscal decentralization on mortality rates in a panel data of
low and high income countries. The authors find that higher fiscal decentralization is
consistently and significantly associated with lower mortality rates, particularly for poor
countries. However, there are studies that have found negative or no significant
relationship between decentralization in service delivery and output of the service
(Arredondo and Orozco 2006), reiterating that this effect remains an empirical question.
The Empirical Literature
The preceding section demonstrates that theoretical studies offer an ambiguous
response to the question of the impact of education decentralization on education output.
In fact, the theoretical literature supports two opposing arguments. One wave in the
literature argues that education decentralization would improve education output through
better knowledge of local environment, better voice and accountability relationships, and
so on. The other wave disagrees and argues that education decentralization may likely

23
cause local elite capture, increase disparities in access, learning outputs, and disparities
and inequality in expenditures.
While the question of the effect of education decentralization is strictly empirical,
the current empirical literature is mixed and limited. Most investigations conclude that
the effect depends on whether basic assumptions have been met and on the type of
education decentralization policy that is implemented. As indicated earlier, education
decentralization can take a myriad of forms, ranging from centralized provision, to
provision by regional and local governments, to community-level or school-level control
over service delivery. In addition, education decentralization is multi-dimensional in
which it not only encompasses responsibility for resources but also the decision-making
on specific functions in the education system (i.e., organization of instruction,
management functions, and planning and structures). Consequently, it is reasonable to
suspect that the different dimensions of education decentralization might have different
impact on education service delivery, and on output depending on how it is measured.
Hence there is a need for additional empirical investigations. We now explore some of
the empirical work that has been done in this area and the limitations encountered in
these studies.
As discussed previously, a big challenge in any empirical study involving
education decentralization and education output is quantifying these two. The literature
on education decentralization is growing but it is still mostly descriptive in nature.
Empirical studies have generally suffered from weak baseline data. Indeed, there is no
perfect measure of education decentralization as well as no perfect measure of education
output. Numerous empirical studies have employed different indicators of both education

24
decentralization and education output. We will review various studies in the empirical
literature according to the form of education decentralization policy that is evaluated.
Education Decentralization to Lower Levels of Government
The level of education decentralization varies widely from country to country.
Based on Government Finance Statistics data, the share of sub-national spending on
education is on average 51 percent of total education spending in 62 countries from 1970
to 2004. Additionally, an OECD survey on decision-making in education (based on
decisions described in table 1) across 38 countries, mainly OECD, shows that 71 percent
of decisions in education are taken at the sub-national level, of which 16 percent are
taken at the regional level, 18 percent at the local government level, and 38 percent at the
school level from 1990 to 2004.19
In many federal countries–Brazil, Canada, Germany, India–the states or provinces
have constitutional responsibility for education, although the responsibility for primary
and secondary education in many of these countries in turn is devolved to the local
government level. Many other countries have devolved the responsibility for delivering
primary and secondary education to local governments guided by the “subsidiarity
principle” in devolving expenditure assignments between different government levels.20
In analyzing the impact of education decentralization on different education
outputs, Winkler and Gershberg (2000) find that in Brazil, where most authority
concentrates at the state government level, decentralization has increased enrollment rates
but it has done little to improve on regional inequities in access to schooling and output
19 See Chapter Four for a description of data sources and countries in the sample.

25
measured through test scores. Chile’s experience, where decision-making authority has
increasingly being transferred to municipalities, also suggests that decentralization does
not by itself remove inequalities between localities. In particular, output measured
through test scores in poorer communities continues to lag.
Burki, Perry and Dillinger (1999) in their analysis of education decentralization in
Latin American countries suggest that transferring responsibility for primary education to
local governments may not be sufficient. They argue that only when management is
decentralized to community school boards and school directors that the positive impacts
of decentralization appear. According to the authors, decentralizing education to state
government as in Colombia and Mexico is unlikely to improve output. In contrast, efforts
to shift management power to community groups and school directors as in special cases
in Nicaragua, El Salvador, and Minas Gerais, Brazil, are likely to show results.
A study by Filmer (2002) of Argentina, where primary education is in the hands
of the provinces, uses a production function model to examine the impact on student
learning of school autonomy and parental participation. Their analysis describes
autonomy as the extent to which the school itself may choose inputs, and parental
participation as the kind of leverage parents (students and the local community) are given
in school operations. The study utilizes a cross-sectional data set to analyze the impact of
autonomy and parental participation on student language and math test scores in sixth and
seventh grades, in urban public and private as well as rural public schools. This study
derives an autonomy and parental participation index from a set of 12 variables that
measure the degree of school autonomy in decision-making about teacher management
20 The subsidiarity principle suggests that government services should be provided at the lowest level of government that is capable of efficiently providing this good or service.

26
and organization; curricular and pedagogical matters; and relations with parents.
Similarly, parental participation is derived from 16 variables that measure the degree of
parental participation involvement in teachers’ management and organization; curricular
and pedagogical matters; parents’ convocations; and participation in other matters. The
results are that autonomy and participation are found to be positive and significantly
related to learning in mathematics (not language). Moreover, the effect is stronger among
the poorest schools and as strong for children of poorer households.
The major weakness in Eskeland and Filmer’s study, however, is the possibility
that the results of this study may be biased due to endogeneity between unobserved
variables and autonomy and participation. Despite the richness of the dataset (over
24,000 observations at the student level) the lack of data forced the author to use weak
instrumental variables, for example, excluding certain explanatory variables from the
production function model and using them as instruments. Their results, however, may
have relevance in the education decentralization literature in stressing that if
responsibility is moved from the center to the regions or local government level, the
results are beneficial if this raises autonomy and participation in schools.
On locally funded primary education, Jimenez and Paqueo (1996) investigate the
impact of local contributions on efficiency through a cost function, using financial
resources and student achievement data from Philippine primary schools. The authors
measure the degree of decentralization as the proportion of school’s total expenditures
financed by local contributions, such as contributions from the local school board,
municipal government, Parent Teacher Associations (PTA) and other local sources.

27
Jimenez and Paqueo estimate a simple double-log Cobb-Douglas cost function
determined by two measures of school output, student enrollment and average score of
fourth grade students in mathematics, English and Filipino. This study finds that schools
which rely more heavily on local sources are more efficient, meaning that they have
lower costs while holding constant for enrollment and test scores. “A 1 percent increase
in the share of financing coming from local sources will lead to a decline in total costs of
0.135 percent, or about the cost of providing for a place for one more student” (Jimenez
and Paqueo 1996).
Although the results of this study have constituted a great contribution to the
literature on decentralization, the results yet have to be tested in a number of ways. As the
authors state, the study needs to be further tested with more flexible functional forms of
cost structure; however, such functional forms have been limited due to the limited
number of observations and measures of input costs. In addition, the results from this
study may not be generalized to other levels of schooling. For example, Lockheed and
Zhao (1993) estimate the effect of variables such as the relative influence of the central
authority compared to the school principal’s on the school’s organization; the principal’s
and teachers’ influence on the curriculum and selection of students; and community
involvement variables. They find that the extent of school decision-making has no
positive effect on student learning in secondary schools in Philippines.
Studies on locally provided education in the United States have concentrated on
the study of the impact of school choice on education outputs. Locally provided
education in the United States has provided parents to be able to exercise school choice
by moving into another school district or to private schools. This type of choice is often

28
referred to “voting with your feet” which substantially raises education productivity,
according to recent studies. Hoxby (2000)21 analyzes the effects of public school choice
by looking at 6,523 metropolitan school districts in the United States. By looking at the
“market concentration” in each metropolitan area and holding other factors constant,
Hoxby intended to isolate the effect that public school choice had on school
productivity. In order to test whether increased public school choice had any effect on
school productivity, Hoxby used data from the U.S. Department of Education’s “National
Educational Longitudinal Survey,” and the U.S. Department of Labor’s “National
Longitudinal Survey of Youth.” The study finds that a statistically significant amount of
the variation in American students’ achievement is explained by Tiebout choice. In other
words, if all other things were equal, students in areas with extreme Tiebout choice (i.e.,
Boston) would be expected to score one-quarter to one-half of a standard deviation higher
on achievement tests than an identical student in an area with no Tiebout choice (i.e.,
Miami).
Given the different results of regional provision of education and school choice in
the United States and other countries, the impact of decentralization of education to
regional or local governments and whether it improves the output of education still
remains an open empirical question. Most of the recent literature on education
decentralization has gone beyond the study of education provided at the regional and
local level, but instead has concentrated on the analysis of school-based management and
community participation in management.
21 For further studies on School Choice and Student Performance see Stevans and Sessions (2000).

29
Education Decentralization to the School Level–School-Based Management
School-based management is a management framework which devolves decision-
making to schools to enable them to make school-based policies to better meet students’
needs and to improve learning outcomes. The argument for school-based management
states that actors who have the best information about schools needs are best able to make
appropriate decisions about the use of resources and teaching methods. While the current
literature abounds with empirical studies of school-based management, we review some
of the most renowned case studies.
In Nicaragua, decentralization reform gives public schools greater autonomy by
shifting responsibility for key areas of decision-making in education from the Ministry of
Education directly to the schools themselves. The reform gives considerable decision-
making power to participating schools in areas of administration, finance, and pedagogy.
In 1991, councils were established in all public schools to ensure that the educational
community, in particular parents, participate in making schools decision in different
functions. Councils consisted of school principals, teachers, parents and students, and
decisions were reached by voting.
King and Ozler (2000) examine the impact of Nicaragua’s school autonomy
reform on learning within an education production function approach. Controlling for
school and household inputs, the authors estimate the effect of local power of autonomy
(decisions made by a council of principal, teachers, and parents) on learning in math and
languages at the primary and secondary levels. The empirical evaluation assumes a linear
functional form explained by student characteristics, household characteristics, teacher
characteristics, school characteristics, dummies for urban or rural areas, regional
30
dummies, and type of school (private or private subsidized). The measure of school
autonomy is measured in two ways: one is a dummy variable representing de jure
autonomy, whether a public school has officially signed a contract with the Ministry of
Education transforming it school council into a Consejo Directivo. The authors argue that
de jure autonomy does not necessarily translate into greater autonomy. Some traditional
schools are as autonomous in practice as the so-called autonomous schools. Moreover,
some schools that are supposed to be autonomous (de jure) remain centrally controlled as
some traditional schools. In order to differentiate between these schools, the authors
develop another measure of autonomy called de facto. This second measure of school
autonomy indicates the percentage of key decisions made by the school council rather
than the central or local government.
The variable of de facto autonomy is derived from a questionnaire about the locus
of decision-making for 25 school decision areas given to school principals and random
samples of council members and teachers for each school in the sample. The variable is
constructed as an index according to the importance of the decision on improving school
quality. Among these decisions areas are: curriculum, hiring and firing teachers, planning
and preparing the budget, and other functions.22 One of the major issues encountered in
this study is the endogeneity of school participation in the decentralization reform and the
endogeneity of the number of decisions being made at the school regardless of autonomy
status granted by the Ministry of Education. The endogeneity in this study arises from the
possibility that the decision of making a school autonomous may be simultaneously
determined with student achievement. Due to the availability of quantitative and
22 For more detail on constructing the de facto autonomy variable see Appendix A in King and Ozler (2000).

31
qualitative measure in this study, the authors find significant instruments that determined
de jure and de facto autonomy including size of school, director’s characteristics,
enrollment rates, and municipality education indicators.
King and Ozler find that autonomous public schools in Nicaragua are making
more decisions about pedagogical and personnel matters than traditional public schools.
Their education production function estimates show that de jure autonomy (measured as
a dummy variable), has no statistically significant impact on student achievement
(measured by standardized test scores). On the other hand, de facto autonomy (measured
as an index on the locus of 25 school decisions) is positively and significantly related
with student performance in primary schools, in particular, decisions related to hiring and
firing personnel and their compensation. Moreover, they find that decentralization of
pedagogical methods and curricular choices has no effect on student achievement, nor do
teacher’s influence on these decisions. As in the case of the EDUCO program in El
Salvador, the authors find that teacher attendance also increased significantly due to the
decentralization reform.
School Based Management (SBM) in the United States has become popular in the
last decade. Chicago, for example, adopted a structure-based educational reform focusing
on governance in 1988 and a content based reform in 1995 that focused on improving
student learning. These reforms created elected parent-led school councils with power to
hire and fire the school director. In addition, the school director works closely with the
council to prepare and monitor school development plans. Directors were delegated
power to increase discretion in allocating the budget, and increased control over
curriculum decisions. The mayor of the city was also given control over a central district

32
school board and a corporate-style management team. The mayor, along with the council,
was given the power to impose a sanction on poorly performing schools, and evaluating
and dismissing principals. Byrk (1998) evaluates the performance of the SBM in Chicago
with longitudinal case study data on 22 schools, survey responses from principals and
teachers in 269 schools, and supplementary system-wide administrative data. The authors
identify four types of school politics in this study: strong democracy; consolidated
principal power; maintenance; and adversarial. Their findings suggest that an increase in
local democratic participation has an impact on elementary reading and math test scores
which showed consistent gains over the years. 23 At the same time, Wong (1998) notes
that graduation rates for high school seniors improved in 1997 after the reform in 1995.
In a similar manner, a content based educational reform was initiated in Memphis
in 1995, where the city granted autonomy to individual schools. Each school formed an
advisory school council integrated by the director, teachers, parents, and community
members. Each council had the objective of diagnosing needs in the school, agreeing on
reforms, and monitoring progress in student learning. According to Winkler and
Gershberg (2000) each school was required to adopt a school-based reform from eight
different school restructuring models.24 A study of the Memphis Restructuring Initiative
(MRI) confirmed the Chicago results by finding significantly higher student achievement
gains in experimental schools (those which undertook school-based management) than a
group of control schools. This new study analyzes academic achievement focusing on a
measure of “value added” assessments after three years of the MRI.
23 For example, a 19 percent gain in achievement for fifth graders was reported between 1992 and 1996.

33
Robertson and Briggs (1998) examine the impact of School-Based Management
on improving schools in several states of the United States and provinces in Canada.
Using data from twenty-two case studies of schools in four North American school
districts,25 the analysis is guided by a non-mathematical theoretical model that describes
the process through which SBM can lead to school improvement. The authors argue that
the SBM process should firstly improve the decision-making process in schools which
will consequently enable for strategic and operational changes that build effective school
culture. Each school case study was coded to assess the amount of change occurring in
the five variables in the model: decision-making process; strategic and operational
changes; school culture; individual behavior; and school quality. These variables were
then rated either “high” or “low” according to the evidence provided on improvement of
each variable. The method used in this study is of coding and analysis.26 The analysis
indicates that schools in the sample most frequently exhibited positive changes in two
areas, decision-making process and school culture. Moreover, strategic and operational
changes and individual behavior were less likely to undergo positive changes. Although
the authors support the validity of the model, there are many issues with the data and
methodology used. Some of these issues include the lack of information regarding staff
behavior change, the analysis used does not allow for causality tests, and the assumption
that improvement in school culture necessarily translates into school improvement.
As shown in empirical studies, the impact of school-based management on
education output through evaluations in Nicaragua, Chicago and Memphis provide strong
24 Among these models are: increased school autonomy (pedagogic matters); common vision in school goals in school development plans; performance targets set between school director and central administration; teacher development activities at the school level, and monitoring of progress. 25 Includes school districts in California, Kentucky, Virginia, and Edmonton and Alberta in Canada.

34
evidence that educational decentralization can improve learning. We now turn to the last
form of education decentralization that we will review, community participation.
Education Decentralization and Community Participation
This type of education decentralization is based on the premise that persons who
are not education professionals can govern schools effectively. The argument is that
community participation in reform implementation ensures that policies match with the
local preferences. According to World Bank (1995b), education output can be improved
when schools are able to allocate resources according to local conditions and become
accountable to parents and communities through their participation in school
management.
School-based management shifts responsibility and power not only to school
actors (principals and teachers) but also to communities, parents, and even students.
Berhman and King (2001) state that greater parental involvement through participation in
financing or through participation in school management committees is associated with
better performance in schools.
In El Salvador, community-managed schools emerged during the 1980s when
public schools could not be extended to rural areas because of the country's civil war. In
1991, El Salvador's Ministry of Education decided to draw on this prototype to expand
preprimary and primary education in rural areas through the EDUCO program
(Educación con la Participación de la Comunidad). At present, EDUCO schools are each
managed autonomously by a community education association (CEAs) elected from
26 For more details on the method used refer to pages 40-43 in Robertson and Briggs (1998).

35
among students’ parents, who are mostly rural workers who receive training by
supervisors. CEAs enter into a one year renewable contract with the ministry, and the
agreement outlines rights, responsibilities, and financial transfers. With the money
directly transferred to them, CEAs select, hire, fire, and monitor teachers, in addition to
managing schools funds and raising additional resources.
A study by Jimenez and Sawada (1999) assesses the EDUCO (“Education with
the Participation of the Community”) experience by comparing teacher absenteeism and
student achievement in math and language in third grade students in EDUCO schools
with that of traditional schools. By estimating school production functions using three
measures of education outputs, the study uses an OLS regression method on student level
test scores and days missed due to teacher’s absence as dependent variables, and
explanatory variables on household characteristics, school inputs and a dummy variable
equal to 1 if the school is EDUCO and 0 otherwise. The study controls for student
characteristics and selection bias (since EDUCO schools were not randomly selected)
using an exogenously determined formula for targeting EDUCO schools as an
instrumental variable. Jimenez and Sawada find no effect on students test scores due to
EDUCO programs; however, they find that EDUCO schools, with their close community
monitoring of the school, had fewer days of teacher absenteeism than traditional schools.
They also find positively and statistically significant EDUCO participation effects based
on increased coverage of education in rural areas; increase in enrollment for preschools
and grades 1 and 3; better teacher attendance, performance and commitment; and
improved interrelationships between the Ministry, schools, international organizations
and communities.

36
Another study in El Salvador by Sawada (2000) utilizes a principal-agent
framework to show that the parental associations (principal) can affect not only teacher’s
(agent) efforts and performance by imposing an appropriate incentive scheme but also
school-level input through delegated school management. Sawada replicates the
production function model from Jimenez and Sawada (1999) with alternative set of
variables. Sawada estimates a teacher compensation function, teacher effort function, and
input demand functions, based on the theoretical implications of the principal-agent
framework. Sawada also empirically examines the effect of parents and community
involvement on two measures of education outputs, standardized test scores in
mathematics and language among 594 third-grade students from EDUCO and Traditional
schools in 1996. Sawada finds that student performance is positively and significantly
related to the number of visits by CEAs. Sawada’s empirical results indicate that the
degree of community participation positively affects the slope of the teacher’s wage
equation. Hence, teacher’s effort level in the traditional schools is consistently lower than
that in the EDUCO schools. Parental Associations are found to affect not only teacher
effort and their performance by imposing an incentive scheme but also school level
inputs by decentralized school management (CEAs).
The empirical results from Jimenez and Sawada (1999) and Sawada (2000)
support the view that decentralization of education system should involve delegation of
school administration and teacher management to the community group. However, while
the authors mention that test score measures may be unresponsive to short-run changes in
school governance, they could have alternatively measured education output as school
enrollment over time to capture not only changes in access to education but also any time

37
effects in the implementation of the EDUCO programs. After all, one of the principal
objectives for implementing the EDUCO program is to increase educational supply.
Moreover, a more comprehensive measure of education decentralization in addition to the
EDUCO dummy variable, such as decision-making functions delegated to CEAs and
parental associations would have provided more insight about what functions to delegate
to schools and community groups in the education process in order to raise student
achievement.
The EDUCO model has developed into a major schooling model in the country
where traditional schools now have more parent participation in school governance and
management, and are more autonomous with the supporting block financing.
Conclusion
Overall the empirical literature on the impact of education decentralization, in its
various forms, on education output in countries around the world show that there is no
consensus on this effect. Case studies such those in El Salvador, Nicaragua, Chicago and
Memphis provide strong evidence that education decentralization can improve education
outputs. At the same time, however, other studies find that education decentralization
may have no significant impact on education output, or negative effects such as
increasing inequalities.
Nevertheless, the current literature makes it clear that the effect of education
decentralization may be different depending on the country, on the type of
decentralization reform, and on the method of measuring education output.

38
In this dissertation, we will improve upon the studies surveyed in at least three
ways. First, we develop a comparative empirical study about the impact of education
decentralization and education outputs across different countries. Next, we use different
measures of education output in order to compare how the impact of education
decentralization may differ depending on the chosen output indicator. Finally, we
compare different measures of education decentralization, one based on traditional
measures of education decentralization through sub-national share of education spending
and the other based on a more comprehensive measure including the locus of decision
making across different levels.
The next chapter develops a production function theoretical model of education
that examines the effects of education decentralization in the production of education.

CHAPTER THREE
A MODEL OF EDUCATION DECENTRALIZATION
In the previous chapter, we examined the current state of the literature and
different country experiences with education decentralization. We noted that the literature
consistently emphasizes the direct and indirect effects of education decentralization
(economic efficiency, transparency, accountability, responsiveness to service provision,
better input management) on education output; however, these have not been thoroughly
incorporated in a theoretical model.27
Theoretically, the impact of education decentralization on education output has
been represented through principal-agent models, for example Holmes, DeSimone, and
Rupp (2003), Otsuka, Chuma, and Hayami (1992), and Sawada (2000), which only
capture the behavioral effect of the policy and not the technical efficiency changes.
Martinez-Vazquez and McNab (2003) argue that when analyzing decentralization,
27 Ozler (2001) develops a production function approach to education decentralization for Nicaragua. However, the model does not explore theoretically the efficiency gains of the reform with the use of economic theory. Prichett and Filmer (1997) propose a new positive theory of education spending based on technical and behavioral effects, however, it does not include education decentralization. Lastly, Jimenez and Paqueo (1996) investigate local contributions on the efficiency of public schools concentrating on the Philippines case. It develops a cost-minimizing structure that does no allow for behavioral effects.
39

40
representative agent models suffer a common fault by assuming that the preferences of a
single individual (the representative agent) proxy for the aggregated preferences of all
agents in the economy. They further argue that from a policy perspective the approach is
flawed since after a policy change, the representative agent model assumes that the
choice of the representative agent continues to coincide with the aggregate choice of all
the agents in the economy. From a fiscal decentralization perspective, the authors argue
that representative agent models do not capture the most important argument for
decentralization, the potential gains in allocative efficiency resulting from sub-national
governments’ more closely matching the heterogeneous preferences of jurisdictions.
Other studies such as Ozler (2001), Pritchett and Filmer (1997), and Sawada
(2000) have employed a production function approach; nevertheless, these models have
not been fully developed to include the array of effects (direct and indirect effects) of
education decentralization in the education process. Previous attempts using production
function approaches have not demonstrated through economic theory the potential
technical efficiency gains of education decentralization as well as the behavioral and
organizational effects on the production of education output. Moreover, most previous
studies have analyzed education decentralization reform in one single country, that is,
developing a theoretical model applicable to the specific reform in that country. As it has
been discussed previously, no two countries have applied the same form of education
decentralization reform, hence, the need for developing a theoretical model that is
adaptable to a comparative study of education decentralization reforms across countries.
The significant advantage of using the production approach instead of the principal-agent
model is that it allows the inclusion of the indirect effects of education decentralization

41
on the education production process and thus it allows us to examine the technical
efficiency gains due to the reforms while it does not constraint preferences to be uniform.
With this in mind, we now turn to developing a theoretical model to investigate the
impact of education decentralization on education output.
The objective of this chapter is to present a theoretical model for framing the
question of what is the impact of education decentralization on the hypothesized
education output. The chapter is organized as follows. In the next section, we develop a
theoretical framework of education based on a production function approach which links
education decentralization to the production of education output. The third section
presents a hypotheses framework for examining the impact of education decentralization
on education output. We conclude the section and the chapter by specifying the testable
hypotheses that form the foundation of the estimation equations that are discussed in
Chapter Four.
The Theoretical Model
The production of education output results from the interaction of the behaviors of
various agents who take part in the schooling process such as students, parents, teachers,
and administrators at various levels. Even if agents do not take part directly in the
educational system, they may still affect education outputs if they influence the
environment in which students learn. Following Ozler (2001), Pritchett and Filmer (1997)
and Sawada (2000), we employ a behavioral production function model that adds
behavioral effects of education decentralization to a conventional production function
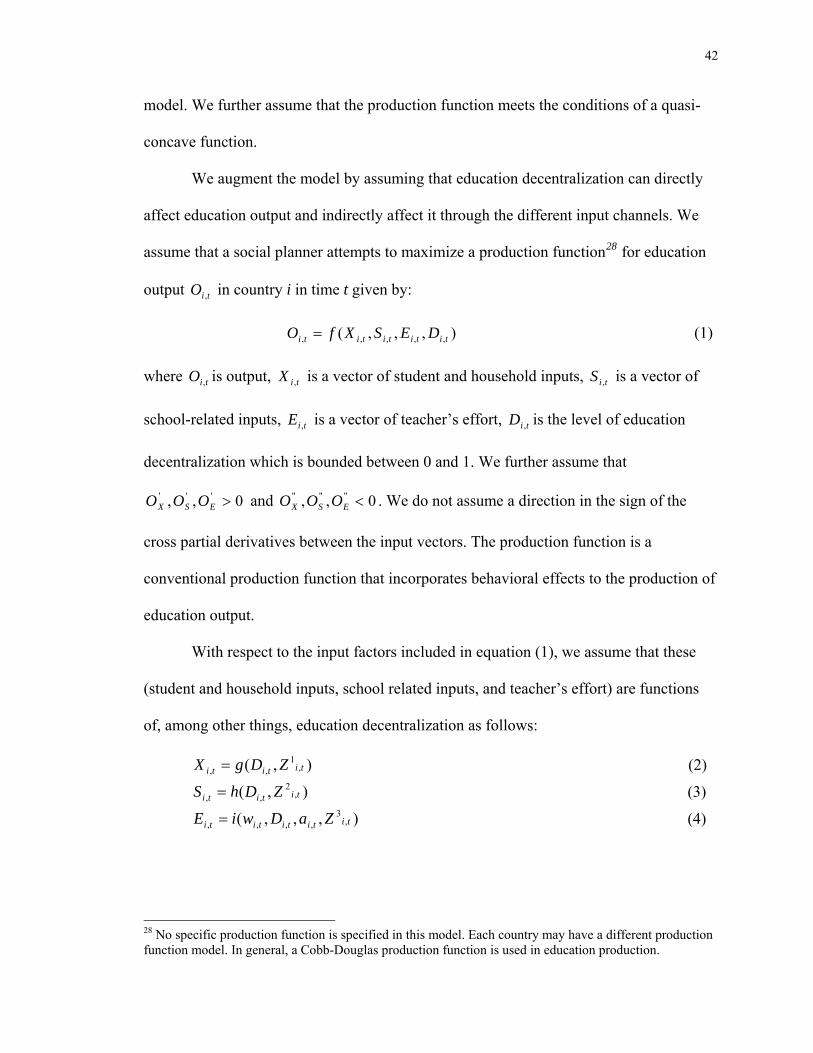
42
model. We further assume that the production function meets the conditions of a quasi-
concave function.
We augment the model by assuming that education decentralization can directly
affect education output and indirectly affect it through the different input channels. We
assume that a social planner attempts to maximize a production function28 for education
output in country i in time t given by: tiO ,
),,,( ,,,,, tititititi DESXfO = (1)
where is output, is a vector of student and household inputs, is a vector of
school-related inputs, is a vector of teacher’s effort, is the level of education
decentralization which is bounded between 0 and 1. We further assume that
and . We do not assume a direction in the sign of the
cross partial derivatives between the input vectors. The production function is a
conventional production function that incorporates behavioral effects to the production of
education output.
tiO , tiX , tiS ,
tiE , tiD ,
0,, ''' >ESX OOO 0,, """ <ESX OOO
With respect to the input factors included in equation (1), we assume that these
(student and household inputs, school related inputs, and teacher’s effort) are functions
of, among other things, education decentralization as follows:
),( ,1
,, tititi ZDgX = (2)
),( ,2
,, tititi ZDhS = (3)
),,,( ,3
,,,, tititititi ZaDwiE = (4)
28 No specific production function is specified in this model. Each country may have a different production function model. In general, a Cobb-Douglas production function is used in education production.

43
where (j=1,2,3) are vectors of exogenous variables explaining the behavior of the
three variables of interest. Additionally, is teacher’s salary, and represents
teacher’s altruism.
tijZ ,
tiw , tia ,
Our production function in equation (1) states that, at any time in country i, the
output of education is dependent upon student and household inputs, school inputs,
teacher’s effort, and the direct and indirect effects of education decentralization.
Education output can increase if the level or quality of inputs increase, or, assuming the
joint effect of education decentralization is positive when the level of education
decentralization increases. On the other hand, education output can decrease if the level
or quality of inputs decrease, or assuming the joint effect of education decentralization is
negative when the level of education decentralization increases.
We note that education decentralization may affect education output through two
channels, a potential direct effect on output, and a series of potential indirect effects.
Taking the first-order derivative of equation (1) with respect to education decentralization
we obtain
''.
''.
''.
'DDEDSDX OEOSOXO
DO
+++=∂∂ (5)
where the subscript refers to the first-order partial derivative of the variable with respect
to education decentralization. For simplicity, we exclude the country and time subscripts.
Equation (5) above represents the marginal product of education decentralization, the
additional output that can be produced by employing one more unit of education
decentralization while holding all other inputs constant. We can observe in the above
equation that decentralization may affect education output directly and indirectly through
the vectors of student and household inputs, school-related inputs, and teacher’s effort.

44
Given that education decentralization is bounded between zero (complete
centralization) and one (complete decentralization), the marginal product of education
decentralization depends on how much of it is used in the production of education. With
respect to the education decentralization input, given that it is bounded, it may be
possible for a country to use complete decentralization (or complete centralization) while
keeping the amount of other inputs fixed.
Following general production function theory, we hypothesize that the marginal
product of education decentralization may be positive or negative, depending on the
country. We do assume, however, that there is an optimal level of education
decentralization for which education output reaches a maximum value. This may be
anywhere between zero and one (including 0 and 1), and it is the goal of this dissertation
to calculate it empirically. Following equation (5) the impact of education
decentralization on education output depends on the sign and the magnitude of the direct
effect of education decentralization on output given by and the indirect effect of
education decentralization on output through X, S and E.
'DO
We now turn to explaining intuitively the potential indirect effects that education
decentralization may have on education output through each of the inputs in the
production function model.
Education Decentralization and Student and Household Inputs
In our model, the vector of inputs from student and household characteristics
is a function that is determined by education decentralization and
a vector of exogenous variables . We hypothesize that the effect of education
),( ,1
,, tititi ZDgX = tiD ,
tiZ ,1

45
decentralization on student and household inputs can be positive or negative, depending
on the type of policy implemented and on the institutional condition of the country at the
time the education decentralization policy is implemented.
Recent literature on education decentralization, such as Behrman and King
(2001), Filmer (2002), Jimenez and Paqueo (1996), Jimenez and Sawada (1999), Lobo et
al. (1995), and Sawada (2000), argues that education decentralization may have a positive
effect on education output if the policy reform is based on local financing, community
participation, school-based management and other decentralization policies affecting
student and household inputs. It is hypothesized that these education decentralization
reforms affect household behavior through voice, participation, and school choice.
Greater community participation and closer parent-school partnership through
decentralization makes citizens feel as if they part of the education process which can
lead to improvements in the home environment to learning and the allocation of
household resources for education including those related with the time each child spends
in school and learning at home, time each adult spends helping with homework, choice of
school, and education related expenditures among others. In addition, school choice and
local financing provides households with the opportunity to choose the school that their
children attend, thus, they would choose the community that offers services that better
match their preferences in education.
All of the above assumptions would increase the quantity and quality of our
vector of student and household inputs. However, the assumptions above presume a
world in which democracy works well, and the existence of institutions that would allow
consumers to participate in the education process. In the absence of these conditions we

46
may find that decentralization in education may have a negative effect by increasing
disparities in learning outputs, and disparities and inequality in expenditures (Elmore,
Fuller, and Orfield 1996; Godwin and Kemerer 2002).
Education Decentralization and School-Related Inputs
With respect to the vector of school-related inputs in our production function,29
is a function that is determined by education decentralization and a
vector of exogenous variables . We hypothesize that the effect of education
decentralization on school related inputs can be positive or negative depending on the
type of policy implemented and on the quality of governance and institutional conditions
of the country at the time the education decentralization policy is implemented.
),( 2,,, tititi ZDhS = tiD ,
2,tiZ
The literature on education decentralization emphasizes its effect on school-
related inputs in the production function. Education decentralization reforms
characterized by local funding, greater voice and community participation, greater local
or school autonomy, and greater competition between schools, are hypothesized to result
in reallocation of resources and a change in school agents’ behavior.30 In a centralized
system of governance, school administrators are accountable not to parents and students
but to the ministries of education. Since the costs of monitoring, inspecting and enforcing
detailed procedures are often high, these ministries set norms of budgetary allocation for
teachers and inputs. If these norms do not match the school’s needs or the community’s
29 School related inputs may be variables related to resources provided by schools such as spending per pupil, pupil-teacher ratio, number of school days, books, etc. 30 To see examples of studies that have found a positive impact of local financing, participation, autonomy on education see Filmer (2002), Jimenez and Paqueo (1996), Jimenez and Sawada (1999), King and Ozler (2000), and Hoxby (1994).

47
preferences, school administrators do not have the decision-making power or the
incentive to change them. Thus, education decentralization through greater school
autonomy and greater community participation may improve school-related inputs such
as student-teacher ratio, class size, infrastructure, maintenance, and books, by focusing in
cultural differences and learning environments, to better matching the needs of their
constituents. Moreover, overlays of bureaucratic procedure would be diminished or
eliminated that would otherwise occur in a more centralized system of governance.
In addition, it is argued that greater community participation would encourage
parents and the community to participate in the education process by monitoring school
performance and thus increasing accountability. If school principals behave differently
due to an increase in monitoring and accountability, then education inputs from teachers
and organization will improve. Schools that are financially accountable to the
communities they serve may be more responsive to their clients. School management
would be accountable to school councils and parents on student performance, thus,
affecting the quality of organization and management of schools.
Lastly, if education decentralization introduces competition between schools such
that households can "vote with their feet" (Tiebout 1956) by selecting the community and
school in which they live, the threat to move imposes competition on governmental units
and schools. Theoretically, this competition forces them to be more efficient in supplying
goods and services out of taxes. Thus, education decentralization would not only affect
the quality of inputs, but it would also encourage for new innovative organizational and
teaching methods provided in schools.
48
Nevertheless, the above arguments are based on the assumption that governance
capacity of the receiving institution is at least as efficient as the central government to run
the program, and that the central government is unable to match the preferences of the
median-voter of each jurisdiction, and that citizens can easily move between localities.31
In addition, if financial and administrative responsibility to local politicians or school
administrators increases rent-seeking activities, or results in poor allocation of resources
due to lack of institutional capacity, or externalities are spilled over, or there are
diseconomies of scale, then education decentralization would adversely affect the
allocation of school-related inputs.
Education Decentralization and Teacher Effort
In our model, teacher effort is a function of teacher’s
salary , teacher’s altruism , education decentralization , and a vector of
exogenous variables . We further hypothesize that education decentralization may
have a positive or negative effect on teacher’s effort.
),,,( ,3
,,,, tititititi ZDawiE =
tiw , tia , tiD ,
tiZ ,3
Education decentralization that results in changes in management and
organization, decision-making authority related to teachers, and voice and participation of
parents and the community, is argued to affect teacher-related inputs in the education
process. In a centralized system of education, the ministry of education determines
teacher standards and qualifications, training programs, control recruitment, promotion,
leave, transfers, discipline, and lines of communication among others. Yet, it can be very
31 For examples of competition positively influencing education outcomes see Hoxby (1994), Hoxby (2000), Ritzen, van Dommelen, and De Vijlder (1997).

49
costly for the central government to provide pedagogical support, supervision, and
teachers’ recruitment that match the needs of a specific area or school; as well as to
inspect and monitor teacher’s performance, working conditions, promotions and
discipline. Recent literature on education decentralization argues that teacher
management and school autonomy that is closer to the schools and the community
positively affects the level of teacher-related inputs.32 Local governments and schools
can be more responsive to the recruitment of teachers with certain qualifications required
in a school. Moreover, teacher support and training can be targeted to fulfill those areas
where there are known deficiencies in teachers’ education and experience. Education
decentralization may directly influence teacher inputs, such as imposing a mandatory
training and rewarding education advancement. On the other hand, it is argued that some
local governments and schools may be unable to hire qualified teachers in the local labor
market, or are not capable to locally bargain teacher’s salaries. In this case, greater
decision-making on teacher management at the local level would not improve the level of
teacher-related input. However, the argument is not about decentralizing all functions in
the education process, but to find the right balance between centrally managed decisions
and local autonomy.
Sawada (2000) finds that teacher’s effort levels in the traditional centrally-
managed schools are consistently lower than that in the community-managed EDUCO
schools. A teacher that puts more effort into the learning process of students is more
likely to improve his/her teaching methods, and in turn improve learning output. Ozler
(2001) states that the promise to pay teachers a certain wage and to provide certain
32 For reference related to teacher management and teacher incentive programs see Gaynor (1998), Jimenez and Paqueo (1996), King and Ozler (2000), and Sawada (2000).

50
benefits is legally enforceable, but the teacher’s commitment to provide a certain level of
effort is not. Therefore, teachers’ effort depends on the different factors and incentives
that affect their effort level. In our model, we assume that teacher’s effort level is an
increasing function of salary received, teacher’s altruism, and other exogenous variables.
First, teacher’s effort level depends on the salary and payments received. Rewarding
teachers for their work with a sufficient wage plays an important role in keeping teacher’s
motivated to do a good job. Wages should also be sufficient so that teachers would prefer
to keep their jobs given the alternatives available. Recent studies argue that incentive
payment schedules based on performance positively affect teacher’s effort level.33
Second, teacher’s effort is a function of teacher’s altruism, which is based on “personal
responsibility.” The greater teachers’ own motivation and commitment to the learning
process, the greater the quality of teacher-related inputs.
With respect to the effect of education decentralization on teacher’s effort, we
hypothesize that the impact may be positive or negative depending on whether certain
conditions are met. Education decentralization that provides community and parental
participation, school autonomy, and decision-making to hire and fire teachers to school
directors are likely to affect the level of monitoring and thus affect teacher’s effort level.
When parents and local community become part of the education process, monitoring of
teacher’s performance increases. Teachers that are constantly monitored by parents and
the community are more likely to become accountable for student’s performance, thus,
teachers would increase their effort level at improving their teaching quality. Moreover, if
33 Jacobson (1998) in a study in the United States concluded that the implementation of an incentive plan that monetarily rewarded high rates of teacher attendance was accompanied by a significant reduction in teacher absences.

51
local councils and school director have the decision-making power to hire and fire,
teachers fear not having job stability and they similarly increase their effort level at
improving their teaching quality.34 In order for a system of monitoring to be successful, it
should be credible (i.e., sanctions should be enforceable) and the information available
regarding teacher productivity should be accurate. Thus, sanctions enforcement,
performance monitoring, and community involvement determine whether education
decentralization would positively affect teacher’s effort level, which in turn affects
teacher’s direct input.
On the other hand, if schools and local community and parent’s associations are
not committed at monitoring teacher’s performance, or if corruption converts the hiring
and firing of teachers into a rent-seeking opportunity, then education decentralization
would not be successful at improving teachers’ effort levels and at improving the teacher-
related inputs.
The Optimization Problem
The principal goal of the social planner is to find optimal levels of input variables and the
level of education decentralization that maximizes education output given by:
),,,(_
,,,, DESXfO titititi = (6)
34 See Sawada (2000).

52
where we assume that each country has an initial level of education decentralization ,
and the problem is to maximize the input variables subject to a fixed budget
constraint given by:
_D
tititi ESX ,,, ,,
BESXP tititii ≤),,( ,,, (7)
where we assume that costs are related to the input variables and there is no cost to adjust
the level of education decentralization.35 We set up the Lagrange expression as follows:
)],,([),,,(L ,,,
_
,,, tititijtititi ESXPBDESXf −+= λ (8)
setting the partial derivatives of L equal to zero, with respect to each of the variables we
wish to optimize, namely (for simplicity we disregard the subscripts), yields
the equations representing the necessary first order conditions for an interior maximum.
tititi ESX ,,, ,,
36
The first three of these imply:
'
'
'
'
S
X
S
X
PP
OO
= (9)
'
'
'
'
E
X
E
X
PP
OO
= (10)
'
'
'
'
E
S
E
S
PP
OO
= (11)
Equations (9-11) are precisely the first-order condition for a constrained maximum, the
critical point for the function L. When costs are at a minimum, the extra output obtained
from the last dollar spent on an input must be the same for all inputs. Whenever the ratios
of the marginal products to inputs prices differ across inputs, it will always be possible to
35 Country experiences indicate that there may be significant costs related to initially implementing decentralization, and that it may be more expensive in developing countries. However, for simplicity, we assume that costs related to adjusting the level of education decentralization beyond some initial cost is zero.

53
make a cost-saving substitution in favor of the input with the higher marginal product per
dollar ratio. We can make a similar interpretation by defining the ratios on the left-hand
side of equations (9-11) as the marginal rate of technical substitution, which must be
equal to the relative prices of inputs.37
The equations can be solved for . Such a solution will have two
properties: (i) the optimal values will obey the budget constraint; and (ii)
among the values of that satisfy the constraint will make L (and hence ) as
large as possible. Sufficient conditions for these equations to represent a relative
maximum are that the second partial derivatives are less than zero, or negative. Assuming
that the second-order conditions are met, the implicit function theorem applies and
assures that each is a function of the parameter . Therefore, we obtain:
∗∗∗ ESX ,,
∗∗∗ ESX ,,
∗∗∗ ESX ,, tiO ,
∗∗∗ ESX ,,_D
)(,, DXX titi∗∗ = (12)
)(,, DSS titi∗∗ = (13)
)(,, DEE titi∗∗ = (14)
where denote the minimum-cost optimal values of when D is
given.
∗∗∗ ESX ,, tititi ESX ,,, ,,
How does the optimal level of Education Decentralization affect Education Output?
Our model assumes that the parameter D, which is bounded between 0 (complete
centralization) and 1 (complete decentralization) affects education both directly and
36 See theoretical Appendix B for a more detailed derivation of equations. 37 Marginal Rate of Technical Substitution (MRTS) is the rate at which one input can be exchanged for another without altering the total level of output.
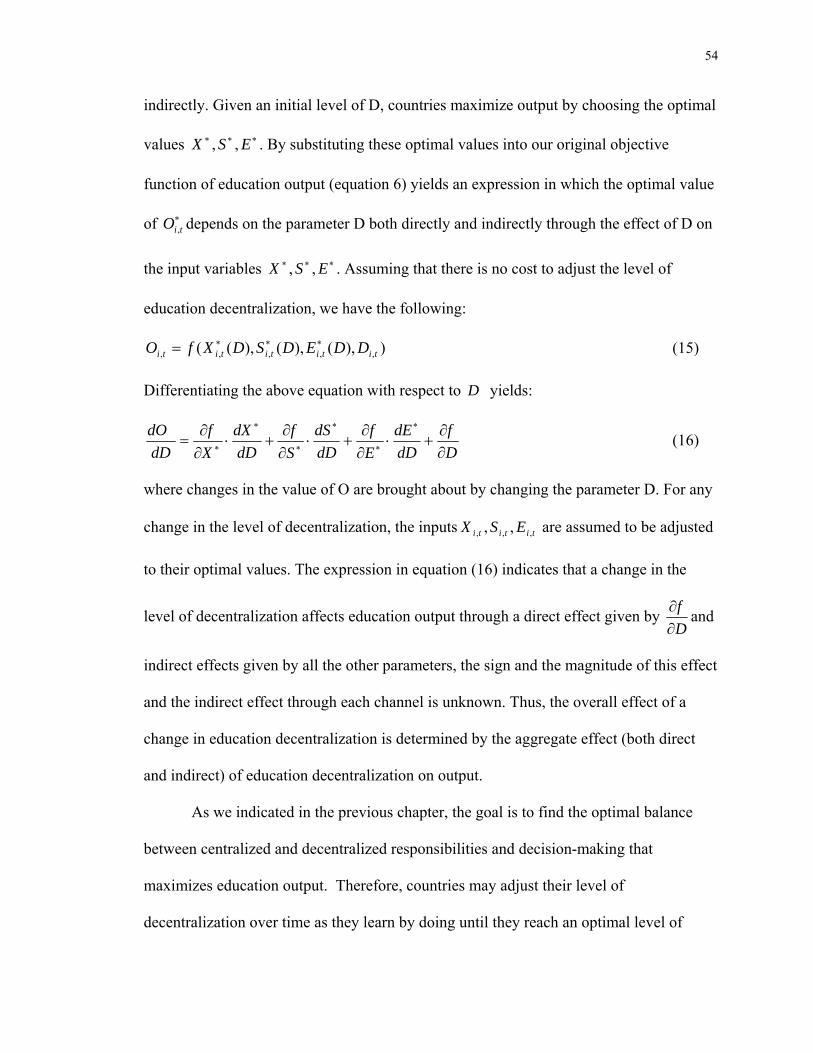
54
indirectly. Given an initial level of D, countries maximize output by choosing the optimal
values . By substituting these optimal values into our original objective
function of education output (equation 6) yields an expression in which the optimal value
of depends on the parameter D both directly and indirectly through the effect of D on
the input variables . Assuming that there is no cost to adjust the level of
education decentralization, we have the following:
∗∗∗ ESX ,,
∗tiO ,
∗∗∗ ESX ,,
)),(),(),(( ,,,,, tititititi DDEDSDXfO ∗∗∗= (15)
Differentiating the above equation with respect to yields: D
Df
dDdE
Ef
dDdS
Sf
dDdX
Xf
dDdO
∂∂
+⋅∂∂
+⋅∂∂
+⋅∂∂
=∗
∗
∗
∗
∗
∗ (16)
where changes in the value of O are brought about by changing the parameter D. For any
change in the level of decentralization, the inputs are assumed to be adjusted
to their optimal values. The expression in equation (16) indicates that a change in the
level of decentralization affects education output through a direct effect given by
tititi ESX ,,, ,,
Df
∂∂ and
indirect effects given by all the other parameters, the sign and the magnitude of this effect
and the indirect effect through each channel is unknown. Thus, the overall effect of a
change in education decentralization is determined by the aggregate effect (both direct
and indirect) of education decentralization on output.
As we indicated in the previous chapter, the goal is to find the optimal balance
between centralized and decentralized responsibilities and decision-making that
maximizes education output. Therefore, countries may adjust their level of
decentralization over time as they learn by doing until they reach an optimal level of

55
decentralization that maximizes the output of education systems. Thus, we assume that
there is an optimal level of D, say , at which countries find the right balance of
centralized and decentralized responsibilities across government, and where output
reaches its maximal value, , given by:
∗D
∗O
]),(),(),([ ,,,,∗∗∗∗∗∗∗∗ = DDEDSDXfO titititi (17)
In general, for any initial level of education decentralization such
that , the goal is to find the optimal level of education decentralization that
provides the input combination that yields the highest possible output. We have assumed
that technical efficiency is the social planner’s objective regardless of the level of
education decentralization. Therefore, when a country reaches the optimal level of
education decentralization (the right balance of decision-making between levels of
government and organizational units), output quantity will achieve its maximum value for
a given fixed budget.
00,iD
∗≠ tii DD ,00,
∗tiD ,
In the same manner, if education decentralization results in inefficient allocation
of resources, rent-seeking activities, politically corrupt processes, local capture, or if a
country changes the level of education decentralization away from the optimal level, then
education decentralization may have a joint negative effect in the production process
having a negative impact on output.
The Hypothesis Framework
We now develop the empirical hypotheses that will be tested in Chapter Four. The
question of the relationship between education decentralization and education output is
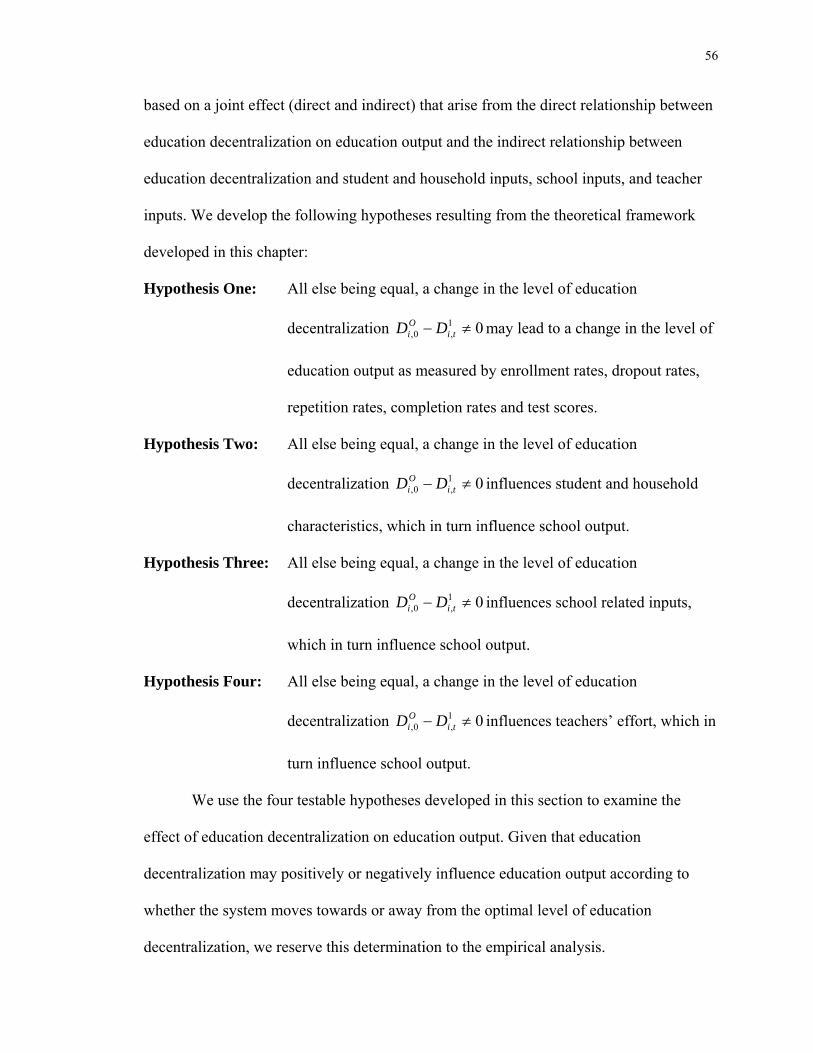
56
based on a joint effect (direct and indirect) that arise from the direct relationship between
education decentralization on education output and the indirect relationship between
education decentralization and student and household inputs, school inputs, and teacher
inputs. We develop the following hypotheses resulting from the theoretical framework
developed in this chapter:
Hypothesis One: All else being equal, a change in the level of education
decentralization may lead to a change in the level of
education output as measured by enrollment rates, dropout rates,
repetition rates, completion rates and test scores.
01,0, ≠− ti
Oi DD
Hypothesis Two: All else being equal, a change in the level of education
decentralization influences student and household
characteristics, which in turn influence school output.
01,0, ≠− ti
Oi DD
Hypothesis Three: All else being equal, a change in the level of education
decentralization influences school related inputs,
which in turn influence school output.
01,0, ≠− ti
Oi DD
Hypothesis Four: All else being equal, a change in the level of education
decentralization influences teachers’ effort, which in
turn influence school output.
01,0, ≠− ti
Oi DD
We use the four testable hypotheses developed in this section to examine the
effect of education decentralization on education output. Given that education
decentralization may positively or negatively influence education output according to
whether the system moves towards or away from the optimal level of education
decentralization, we reserve this determination to the empirical analysis.

57
Concluding Thoughts from the Theoretical Analysis
In summary, we have determined that there potentially exists a direct and indirect
effect of education decentralization on education output. The magnitude and the size of
the total effect of education decentralization on education output in the long run is
theoretically indeterminate due to some potential channels through which this effect is
transmitted. In our model, we examined three potential transmission channels–student
and household inputs, and school and teacher inputs. This theoretical ambiguity in the
effect of education decentralization justifies the case for empirical analysis.
Further, we show that over time there is an optimal level of education
decentralization that would maximize education output for given optimal levels of other
education inputs. Therefore, there may be countries that are either above, below, or at the
optimal level of decentralization. It is our goal to estimate the optimal level of education
decentralization empirically.
Lastly, the literature suggests that there may be differences on the hypothesized
impact of education decentralization on education output depending on the way that these
are measured. We therefore test for the alleged differences in the effect by comparing
different methods of measurement used.
In Chapter Four, we develop the empirical framework within which we will test
the hypotheses developed in this chapter.

CHAPTER FOUR
EMPIRICAL METHODOLOGY
In Chapter Three we developed a behavioral production function model of
education that included potential direct and indirect effects of education decentralization
in the production of education. Based on this theoretical model, the objective of this
chapter is to develop an empirical methodology for analyzing various aspects of the
effect of education decentralization on education output. The objective is to analyze
empirically the marginal impact of education decentralization on several indicators of
education output. Using several indicators of education output allows us to examine
whether there is an effect of education decentralization on each of these indicators, and
what the magnitude of the effect is. If the empirical findings are consistent across
different proxies for education output, then we have more evidence to support the effect.
Using both the traditional measure of education decentralization and a more
comprehensive measure of education decentralization allows us to explore the influence
of education decentralization through its fiscal dimension and its decision-making
autonomy dimension. As previously indicated, we will do a sub-sample regression
analysis for OECD countries where education decentralization is measured not only
through its fiscal dimension but also through a measure of decision-making in education
at various levels of government.
58

59
In the following section, we discuss the data sources that are used for the
estimations reported in Chapter Five. In the third section of this chapter, we develop the
empirical framework and specify the estimation equations that are used to test the
hypotheses about the impact of education decentralization on education output developed
in Chapter Three. In this section we discuss the two-way error components model for
unbalanced panels as well as the fixed and random effects models. Then, we present the
specification of the estimation equations that we will use in Chapter Five to estimate the
influence of education decentralization on education output. We conclude the chapter by
briefly discussing the potential econometric problems that may adversely affect the
estimation of the testable hypotheses, and we introduce the instrumental variable/two-
stage least-squares estimation approach.
Data Description and Sources
In our empirical estimation we employ an unbalanced panel data set of fifty nine
countries covering the period 1970-2004 in five-year intervals. Details on data categories
and sources are provided in the following subsections. The definitions and the summary
statistics of all variables are presented in Appendix C.
Education Output Data
The measurement of education output continues to be a center of debate among
researchers in the education and decentralization literatures. Various measures of
education output have been used in comparative and specific country studies. Most of

60
these are driven by issues of data availability and international standard measures of
education output. For years, studies have measured education output by the ratio of
enrollment rates, dropout rates, repetition rates, completion rates, and test scores, all of
which we use in this dissertation.38 Data on dropout and repetition rates were obtained
from Barro and Lee’s International Measures of Schooling Years and Schooling Quality
Dataset, for years 1965-2000, and updated by the World Bank’s comprehensive Online
Database of Education Statistics (EDStats).39 Variables on net enrollment rates and
completion rates were obtained from the World Bank’s World Development Indicators,
2005 CD-ROM, and updated with the Organization for Economic Co-operation and
Development (OECD) Education Online Database,40 and the World Bank’s
comprehensive Online Database of Education Statistics (EDStats).
Often, education output has been measured by nationally administered test scores
in mathematics, language, and science. If the purpose is to perform a comparative study
across countries, data availability and standard examination of students is very limited.
Since 1959, the International Association for the Evaluation of Educational Achievement
(IEA), the International Study Center (ISC),41 and the Organization for Economic Co-
operation and Development (OECD)42 have conducted comparative studies in
educational achievement. These studies contain educational variables in different subjects
(reading, math and science) and age groups (9-10, 13-14, and the last year of secondary
school). Each test uses a common assessment questionnaire that reflects the curricula of
38 For an overview of these studies see Mahal, Srivasta and Sanan (2000); Lobo et al. (1995); Prawda (1993b). 39 For Barro and Lee’s data set see http://www.cid.harvard.edu/ciddata/ciddata.html and for World Bank’s online data see http://www1.worldbank.org/education/edstats (accessed September 2006). 40 See http://www1.oecd.org/scripts/cde/members/EDU_UOEAuthenticate.asp (accessed September 2006). 41 For an overview of studies performed by IEA and ISC, see http://isc.bc.edu (accessed September 2006). 42 For an overview of PISA surveys, see http://www.oecd.org (accessed October 2006).

61
all participating countries. While these data are very useful in educational research, they
are very limited for comparative studies since not all the same countries have participated
in all studies. Until 1995, from studies directed by IEA only two countries (England and
the United States) had taken part in every large-scale comparison of achievement in
mathematics and science.43 New surveys from the International Association for the
Evaluation of Educational Achievement (IEA) such as Trend’s in Mathematics and
Science Study (TIMSS) and OECD’s Program for International for International Student
Assessment (PISA) have been improved and will be repeated every three years. In this
dissertation, we hope to evaluate a sub-sample of countries using test scores as a measure
of output. Data on test scores was obtained from Barro and Lee’s International Measures
of Schooling Years and Schooling Quality Dataset, and updated with test score results
from PISA and TIMSS recent survey results.44 Considering that in this study we evaluate
the outcomes of education decentralization on primary level education, we only evaluate
test scores for 9 and 10 year-olds (age at the end of primary school). Considering that
science tests have been most frequently performed in this age group, we evaluate science
test scores for 9 and 10-year olds as follows: First International Science Study (FISS) for
1970; Second International Science Study (SISS) for 1985; International Association for
the Evaluation of Educational Progress (IAEP 2) for 1990; Third International
Mathematics and Science Study (TIMSS-95) for 1995; and the Trends in International
Mathematics and Science Study (TIMSS-03) for 2004. Scales range from 0 to 1000, with
a mean of 500 and standard deviation of 100. For comparability of data we transformed
all data to percentage form.
43 See Appendix C, Table C.6 for a list of comparative international tests.

62
Education Decentralization Data
The measurement of decentralization of education continues to be a hot topic of
debate among researchers. This debate is induced in part by the complexity of the
concept but also by the lack of data necessary to develop a complete measure that would
effectively capture all the decision-making functions, and the responsibility and authority
of different government levels in the education system. In general, decentralization has
been measured as the level of government at which revenue and expenditure
responsibility in education occurs.45 Alternatively, recent studies have measured different
forms of education decentralization with dummy variables.46 For example, they have
measured education decentralization as dummy variable equal to 1 for schools with
community participation, schools with voucher systems, charter schools, and others.47
Ideally, we would wish to construct a panel data measure of education
decentralization that would effectively quantify the activities of sub-national
governments resulting from independent decision making. For example, activities that are
under the control of sub-national governments, even if funded by the central government,
would be classified as a sub-national government activity. However, constructing such a
measure would require information on grants and transfers between various levels of
government, whether these grants and transfers are under the control of the central or
recipient level of government, or if the grants are conditional, block, or lump-sum.
44 For PISA test results see http://www.pisa.oecd.org, for TIMSS test results see TIMSS and PIRLS International Study Center at http://timss.bc.edu (accessed June 2006). 45 For an example see Thomas (2001). 46 For example, Galiani and Schargrodsky (2002) measures decentralization as a dummy variable that equals unity if school j in period t is administered by the national government. Ozler (2001) measures education decentralization in Nicaragua as dummy equal to 1 if the school presents de facto decentralization.

63
Unfortunately, the primary data source for public sector revenues and expenditures, the
International Monetary Fund’ Government Finance Statistics (GFS), does not contain
detailed information regarding grants and transfers to develop the ideal measure of
education decentralization. This lack of available information leads to a fiscal dimension
measure of education decentralization as the ratio of total sub-national expenditures in
education to general government expenditures in education.48 The IMF functional
categories include consolidated education expenditures, state/regional education
expenditure, and local government education expenditures.
The weakness in defining education decentralization as the ratio of sub-national
government expenditures in education is that it does not capture the extent of sub-
national government autonomy in decisions about expenditure in the delivery of
education services. In order to fill this gap in our fiscal measure of education
decentralization, we complement the fiscal dimension measure with a measure of
decision-making autonomy of sub-national governments (state/regional and local) and
organizational units (the schools), by the percentage of decisions in education functions
that are taken at each level of government and the school level. This data, however, are
only available for specific countries (mainly OECD) and for limited time spans. Yet, their
use represents, we think, a positive contribution to achieving a better measure of
decentralization in education.
Data on decision-making autonomy is available for fourteen countries in 1990-
1992 from Meuret, Prod'hom, and Stocker (1995) and for thirty countries from the
47 See Jimenez and Sawada (1999). 48 General government expenditures are equal to the expenditures of the consolidated central government (budgetary central government, extra-budgetary funds, and social security) and the expenditures of sub-national governments.

64
Organization for Economic Co-operation and Development publication, Education at a
Glance, Annual Reports 1998 and 2003(Organisation for Economic Co-operation and
Development 1998, 2004). Because our input measures are available for five-year
intervals, we matched the inputs measures with decision-making data to the nearest year
to which it is available. Therefore, data from 1998 is matched with data in year 1995 and
data from 2003 is matched with data in 2004. Due to limited data availability on decision-
making in education functions, this dissertation tests the posed hypotheses by using a
sub-sample of mainly OECD countries according to the availability of information. This
approach, we believe, will provide some useful information regarding the effect of
decision-making at different levels of government on education output.
Based on OECD methodology, our indicator of decision making in education
functions are based on decisions on four domains or categories: organization of
instruction, personnel management, planning and structures, and resources. Therefore, the
percentage of decisions taken at a particular administrative level (central, intermediate,
local or school) can be interpreted as a measure of the importance of that particular level
for decision-making in that education function. Table 2 presents the percentage of
decisions relating to public sector education taken at each level of government, where the
sum of decision across levels sum to 100 percent.49 From the table, we can see that
central government is dominant in Portugal, Turkey and Uruguay; regional decision-
making is predominant in India and Argentina; local decision-making is important in
France and the United States; and the school level is particularly important in decision-
making in Finland, New Zealand and Norway.
49 In our dataset, when we refer to decisions taken at the sub-national level refers to decisions taken at levels other than the central government level.

65
Table 2. Percentage of decisions relating to public sector education taken at each level of government 1990 1998 2003 Country Cent Int Loc Sch Total Cent Int Loc Sch Total Cent Int Loc Sch Total Argentina - - - - 3 68 0 29 100 - - - - Australia - - - - - - - - - 0 76 0 24 100 Austria 28 26 8 38 100 35 18 22 25 100 0 76 0 24 100 Belgium 0 25 50 25 100 1 73 0 26 100 26 22 23 29 100 Chile - - - - - 7 3 54 36 100 - - - - - China - - - - - 21 3 30 46 100 - - - - - Czech Republic - - - - - 17 21 10 52 100 0 57 0 43 100 Denmark 15 0 44 41 100 26 0 43 31 100 7 1 32 60 100 Finland 13 0 47 40 100 0 0 64 36 100 11 0 4 85 100 France 33 36 0 31 100 33 38 0 29 100 2 0 71 27 100 Germany 7 18 42 33 100 4 43 16 37 100 24 45 0 31 100 Greece - - - - - 55 22 0 23 100 4 47 17 32 100 Hungary - - - - - 0 0 35 65 100 80 4 3 13 100 Iceland - - - - - - - - - - 3 0 29 68 100 India - - - - - 0 91 0 9 100 - - - - - Indonesia - - - - - 63 7 0 30 100 - - - - - Ireland 19 0 8 73 100 47 0 0 53 100 - - - - - Italy - - - - - 39 25 3 33 100 25 0 50 25 100 Japan - - - - - - - - - - 23 16 15 46 100 Jordan - - - - - 65 0 19 16 100 - - - - - Korea, Rep. - - - - - 37 38 0 25 100 12 21 44 23 100 Luxembourg - - - - - - - - - - 10 34 8 48 100 Malaysia - - - - - 82 0 0 18 100 - - - - - Mexico - - - - - - - - - - 66 0 0 34 100 Netherlands - - - - - 24 0 3 73 100 31 47 0 22 100 New Zealand 29 0 0 71 100 34 0 0 66 100 0 0 0 100 100 Norway 23 0 45 32 100 36 0 55 9 100 25 0 0 75 100 Paraguay - - - - - 67 0 0 33 100 - - - - - Philippines - - - - - 37 24 0 39 100 - - - - - Portugal 57 3 0 40 100 69 7 0 24 100 31 0 32 37 100 Slovak Republic - - - - - - - - - - 51 8 0 41 100 Spain 33 13 26 28 100 3 56 0 41 100 33 2 15 50 100 Sweden 4 0 48 48 100 12 0 22 66 100 0 72 0 28 100 Switzerland 0 50 40 10 100 - - - - - - - - - - Thailand 55 0 0 45 100 55 - - 45 100 - - - - - Turkey 94 0 0 6 100 94 - - 6 100 - - - - - Turkey - - - - - - - - - - 17 0 36 47 100 United Kingdom - - - - - 14.5 0 34.5 51 100 18 0 38 44 100 United States 0 3 71 26 100 0 2 69 29 100 - - - - - Uruguay - - - - - 100 0 0 0 100 - - - - -
OECD further provides data on decision making in education by domain. For
example, we have data on the percentage of decisions taken at each level of government

66
for organization of instruction, personnel management, planning and structures, and
resource, where the percentage of decisions across levels of government sum to 100 for
each domain.
Other Explanatory Variables
On the basis of our theoretical model of the production function for education, it
is necessary to identify and measure the education inputs that take part in the production
of education. Since this dissertation is a comparative study across countries at the
aggregate level, then we also need information at the aggregate level on countries’ school
resources, and household characteristics. We use input measures of school resources that
include pupil-teacher ratios, real public educational spending per student, salaries of
teachers, and length of the school year obtained from Barro and Lee’s International
Measures of Schooling Years and Schooling Quality Dataset, for years 1965-2000, and
updated by the World Bank’s comprehensive Online Database of education statistics
(EDStats). Our measures of family factors include GDP per capita, as a proxy for parents’
income; parents’ education level measured through the average years of primary
schooling in the population 25 and over; and fertility rate as a proxy for the average
number of children in a household which proxies for the amount of time that parents
would dedicate to their children. The data on GDP per capita and fertility were obtained
from the World Bank’s World Development Indicators, 2005 CD-ROM, and the proxy for
parents’ education was obtained from Barro and Lee’s International Data on Educational
Attainment: Updates and Implications dataset on education attainment across countries.50
50 Data were obtained from http://www.cid.harvard.edu/ciddata/ciddata.html (accessed August 2004).

67
Additionally, we use demographic and governance control variables obtained
from the World Bank’s World Development Indicators, 2005 CD-ROM and Freedom
House’s Survey of Freedom 2003,51 including population density, rule of law, political
rights, civil liberties, and corruption. In analyzing education decentralization, it is
important to consider governance indicators since the argument for decentralization
presumes a world in which democracy works well, and in which all externalities are
captured locally.52
Empirical Models
Empirical studies about education decentralization and education output in
general have been country-specific examinations. Comparative studies across countries
have not been common, except for studies that investigate schooling output without
investigating the impact from decentralization.53 In particular, we are not aware of any
panel data study across countries in the literature that examines the impact of education
decentralization on education outputs in various countries. Education decentralization and
many other policies are processes that occur over time, results such as any improvement
on education outputs may occur also only over time, and even some distance away from
the time of reform implementation. Thus, we believe that the use of panel data is more
appropriate to the question of the influence of education decentralization on education
output, since cross-sectional analysis may result in incorrect inferences as to the nature of
51 For an overview of the SOF, see http://www.freedomhouse.org/ratings/index.htm (accessed May 2006). 52 Winkler and Gershberg (2000). 53 Examples of panel data studies of schooling output include Heyneman and Loxley (1983), Hanushek (1995), Hanushek and Kimko (2000), and Lee and Barro (2001).

68
education decentralization. In this section we first discuss the general form of the two-
way error components model, and we then develop the estimation equations for each of
the testable hypotheses.
In our model of estimating the impact of education decentralization on education
output, it is likely that numerous unobservable individual country factors will be present.
These factors among others include student capacity, teachers’ altruism, and parents’
encouragement in a certain country, which significantly influence the education process
of students. These unobservable factors can be classified as those that vary across
countries but not across time, those that vary across time but not countries, and those that
vary across countries and time. In addition, the data set is an unbalanced sample where
the number of time-series observations for each country in the sample is less than or
equal to T, where T is the maximum number of time-period observations in the sample.
Following Hsiao (1986) and Baltagi (1995), the general form of the unbalanced
two-way error components panel data model is
ititti uXY += β', tNi ,...,1= Tt ,...,1= (22)
where i denotes countries and t denotes time. If the sample were balanced, i would range
from 1 to N, where N is the number of countries in the sample. However, the sample is
unbalanced and i ranges from 1 to , where (tN NNt ≤ ) is the number of countries
observed in year t and we can define the total number of observations as .
Following Baltagi (1995), we can decompose the error term as follows
tt Nn ∑=
itu
ittiitu νλμ ++= tNi ,...,1= Tt ,...,1= (23)
where iμ denotes the unobservable country specific effect, tλ is the unobservable time
effect and itν is the remainder stochastic disturbance term. tλ is country-invariant and it

69
accounts for any time specific effect that is not included in the regression. For example, it
could account for any shock that occurs over time which could affect education output.
If we explicitly assume that the country and time specific effects are jointly equal to zero,
then the most efficient method of estimation is to pool all the countries in the sample.
Additionally, we would assume that individual countries share the same intercept and
slope terms. Under these assumptions, we would pool the observations and apply the
Least Squares (LS) estimation methodology to estimate the impact of education
decentralization.
However, the LS estimator is inefficient in the presence of unobserved individual
specific effects and inconsistent if the individual effects are correlated with any of the
regressors. Panel data methods such as fixed effects (FE) and random effects (RE)
estimation procedures are designed to remedy some of these shortcomings.
Assume that the iμ and tλ are fixed parameters to be estimated; the itν are identically
independently distributed (IID) with zero mean and constant variance ;
represents the matrix of regressors, which are assumed independent of
)),0(~( 2νσν IIDit
iX itν for all i and
t; and represents the dependent variable of interest. We can estimate the impact of
education decentralization using a two-way fixed effects error components model using
the dummy variable structure and the unbalanced two-way error components model.
tiy ,
When using a fixed effects approach, we need not assume that the are
independent of the
tiX ,
iμ and tλ , that is, we do not have to explicitly assume that the
regressors are independent of the country specific or time specific effects. Inferences,
however, are conditional on the N countries and T time periods observed in the sample.

70
The fixed effects model is costly in terms of degrees of freedom lost relative to the
random effects approach.
The alternative to using a two-way fixed effects error components model is to use
a two-way random effects error components model. In the case of the random effects
approach, we assume that the country and time specific effects are randomly distributed
and that the parametric function varies from country to country. Since the time specific
and country specific effects are random variables that are independently, identically
distributed with zero mean and constant variance, the random effects is more efficient in
the absence of heteroscedasticity and serial correlation than the fixed effects model. The
random effects model also allows the inclusion of time and country invariant regressors.
However, the assumption that country and time specific effects are uncorrelated with the
regressors may be strong when applied to the purpose of this study. If this assumption is
violated, the random effects model would produce inconsistent estimates. If the
assumption is not violated, the random effects model would be consistent and more
efficient than the fixed effects model if the assumption of no serial correlation and
homoscedasticity are valid in the model.
The Hausman (1978) specification test is used to compare the appropriateness of
the fixed effects model relative to the random effects model. The test is based on the
difference between RE and FE estimates. Under the null hypothesis, unobserved
individual effects are uncorrelated with observed explanatory variables. Both the random
effects and fixed effects are consistent but the random effect is efficient. Therefore, a
statistically significant difference between the two estimators is evidence against the null
of no correlation between the country-specific unobserved effects and the observed
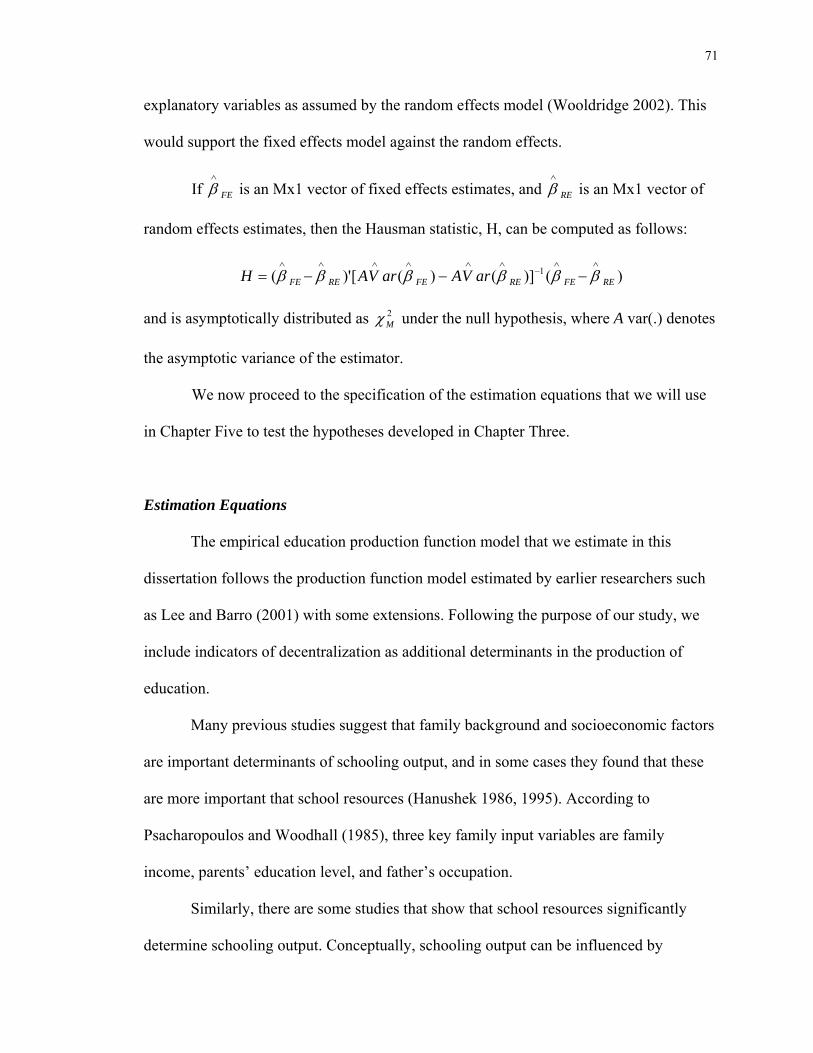
71
explanatory variables as assumed by the random effects model (Wooldridge 2002). This
would support the fixed effects model against the random effects.
If is an Mx1 vector of fixed effects estimates, and is an Mx1 vector of
random effects estimates, then the Hausman statistic, H, can be computed as follows:
FE
∧
β RE
∧
β
)()]()([)'( 1REFEREFEREFE arVAarVAH
∧∧−
∧∧∧∧∧∧
−−−= ββββββ
and is asymptotically distributed as under the null hypothesis, where A var(.) denotes
the asymptotic variance of the estimator.
2Mχ
We now proceed to the specification of the estimation equations that we will use
in Chapter Five to test the hypotheses developed in Chapter Three.
Estimation Equations
The empirical education production function model that we estimate in this
dissertation follows the production function model estimated by earlier researchers such
as Lee and Barro (2001) with some extensions. Following the purpose of our study, we
include indicators of decentralization as additional determinants in the production of
education.
Many previous studies suggest that family background and socioeconomic factors
are important determinants of schooling output, and in some cases they found that these
are more important that school resources (Hanushek 1986, 1995). According to
Psacharopoulos and Woodhall (1985), three key family input variables are family
income, parents’ education level, and father’s occupation.
Similarly, there are some studies that show that school resources significantly
determine schooling output. Conceptually, schooling output can be influenced by

72
resources available such as pupil-teacher ratios, expenditure per pupil, teacher salary and
education level, availability of material, and others (Lee and Barro 2001). However,
various studies have found no convincing evidence for a positive effect between school
resources and output (Hanushek 1986, 1995, 2003). There is evidence to suspect that
school resources have a much stronger effect on output in developing countries than in
developed ones as evidenced by Heynemen and Loxley (1983).
The model we estimate in this study is within the framework of the previous
production function models. In addition to the “traditional” determinants of education
output, household characteristics and school-related inputs, we include indicators of
education decentralization and additional control variables as determinants of variations
in education output. Ideally, we would control for teacher’s effort by including variables
such as teachers’ absenteeism rate; however, lack of data limits our model and disables us
to control for teacher’s effort. Therefore, the general education production equation we
estimate can be expressed as follows:
ittitititititi ZDSXO νλμβββββ +++++++= ,4,3,2,10, (18)
where denotes education output (enrollment rates, repetition rates, dropout rates,
completion rates, test scores) in country i in year t; is a vector of student and
household characteristics (proxy for parents’ income, education level, and average
number of children in a household); is a vector of school and teacher related inputs
(pupil-teacher ratio, expenditure per pupil, teacher’s salaries, number of school days in a
year), is a vector of control variables (including population density and indicators of
governance and quality of institutions). is an indicator of education decentralization
tiO ,
tiX ,
tiS ,
tiZ ,
tiD ,

73
(ratio of sub-national expenditures in education to total expenditures in education, and
level of decision-making in education functions).
A priori, we would expect that a positive relationship exists between household
and school inputs, and education output. We cannot a priori sign the relationship between
decentralization and education output, as it may be positive or negative depending on the
minimum assumptions for decentralization discussed in Chapter Three.
We estimate equation (18) with different indicators of education output and
different indicators of decentralization and analyze any common trend or difference in
results. The basic econometric model, however, is the same, except for changes in the
dependent variable of education output and changes in the variable of education
decentralization. As mentioned before, to estimate the influence of decision-making in
education functions, we use a sub-sample of countries where this data is available.
To this point we have examined the potential direct effect of education decentralization
on education output. We now turn to examine the potential influence of education
decentralization on output through household and school factors.
Education Decentralization and Household and School Factors
Based on our theoretical model developed in Chapter Three, we argue that there
potentially exists an indirect relationship between education decentralization and
education output through the effect of education decentralization on student and
household characteristics, school-related inputs, and teachers’ effort level. We further
hypothesize that these effects may be positive or negative.

74
While theoretically we showed that education decentralization may indirectly
influence education output, data limitations restrict us from testing this hypothesis by
estimating separate equations on the influence of education decentralization on each of
these input factors. Nevertheless, we make an attempt to investigate the impact of
education decentralization on real government current educational expenditure per pupil
at primary school (PPP-adjusted) controlling for student enrollment, population density,
and GDP per capita and present estimation results in Table E.1 (Appendix E). We find
that education decentralization positively affects spending per pupil at the 10 percent
significance level, suggesting that there potentially exists a significant relationship
between education decentralization and education spending per pupil at the primary level.
Based on the inability to estimate separate equations on the indirect effect of
education decentralization for each input factor in our main model, we therefore explore
interaction effects between education decentralization and household and school inputs.
We test interaction effects to the model to test the joint effect of the input variables on
education output over and above their separate effect.54
Based on the above discussion, the general form of the estimation equation with
interaction effects is:
ittitititititititititi ZDDSSDXXO νλμβββββββ +++++∗++∗++= ,6,5,,4,3,,2,10, )()( (19)
In interpreting the results from equation (19), we say that if the coefficient of an
interaction variable is positive then the higher the level of decentralization, the greater the
effect of X or S on education output. On the contrary, a negative value for the interaction
54 Note that interaction effects do not measure the indirect effect of education decentralization on education output. Instead, they allow us to make a more accurate estimation of the relationship between inputs and output and to explain more of the variation in the dependent variable.

75
term would imply that the higher the level of decentralization, the smaller the effect of X
or S on education output.
Lastly, we suspect that there may exist a non-linear relationship between
education decentralization and education output. Using a scatter plot diagram of the
relationship between these two variables shows that there may be a non-linear
relationship between decentralization and some of our education output indicators.55
Therefore, based on this suspicion, we test whether education decentralization effects are
non-linear. We capture the non-linear relationship by including the square of education
decentralization to equation (19) above, to capture the quadratic fit suggested in the
scatter plot figures, as follows:
tititititititititi SDXDXDDXY ,62,,5,,4
2,3,2,1, )()( γγγγγγα +∗+∗++++=
ittitititititi ZDSDS νλμγγγ ++++∗+∗+ ,92,,8,,7 )()( (20)
The marginal effect of education decentralization on education output in equation
(20) is given by the
expression tititititititi DSSDXXD ,,8,7,,5,4,32 222 ∗++∗+++ γγγγγγ , where
titititi DTSX ,,,, ,,, represent the mean values of the vector of inputs and education
decentralization in our sample. Thus, the critical level of education decentralization
(assuming that interaction variables are different from zero) beyond which the sign of the
marginal effect is reversed is given by:
)(2)2(
,8,53
,7,42,
titi
tititi SX
SXD
γγγγγγ
++++
−= (21)

76
Econometric Issues: Endogeneity
Before we move forward with the estimation of the testable hypothesis in Chapter
Five, we test and control for potential econometric issues that could confound the
estimates. We now briefly identify and discuss the potential problem as well as the
possible methodology of controlling the issue, if present. In particular, in this section, we
discuss the issue of endogeneity.56
Literature on education decentralization that investigates the impact on education
output and quality often argue that there may potentially be a problem of endogeneity in
the analysis (Filmer 2002; King and Ozler 2000). The problem of endogeneity, as
suspected in the literature, potentially arises from the possibility that the decision of a
country to decentralize education is a not a random event, but instead those countries that
believe that decentralization will improve education output are those that may
decentralize. In practice, the question of endogeneity has rarely been addressed in the
education decentralization literature, mostly because of the lack of good instrumental
variables. Other studies, such as King and Ozler (2000) have been able to address the
issue through instrumental variables due to the richness of their data in examining
education decentralization in Nicaragua.
Before being quick to claim that the analysis of education decentralization in this
dissertation may present an econometric problem of endogeneity, we present a brief
55 See Appendix C for scatter plot figures that show the relationship between education output indicators and education decentralization. 56 The potential issue of serial correlation in panel data is partially mitigated in our case by the fact that our dependent variable is measured using five-year averages. Additionally, using the Wooldrige (2002) autocorrelation test for panel data, we fail to reject the null hypothesis of no first-order autocorrelation at the 10% significance level. We performed this test in Stata using the user-written program, xtserial,

77
discussion on the choice of education decentralization in different countries and how
endogeneity may actually not be an issue in our analysis. First, we argue that in most
countries education decentralization is part of a broad political reform, where the choice
to decentralize the education sector is part of an overall decentralization program to
promote poverty reduction, better governance and economic growth in a country instead
of a sector specific reform aimed solely at improving education outcomes, as evidenced
in recent studies on education decentralization national strategies in countries around the
world (UNESCO 2003, 2005; Winkler and Gershberg 2004).57
Second, we argue that even in countries where decentralization strategies are
restricted to the education sector, the purpose is generally to reform the entire education
system and not only to achieve improvement in education outcomes, such as
diversification of financing, restructuring of the management and redistribution of
political power, and improvement in the allocation of teaching resources (UNESCO
2005; World Bank 2000).
Third, we argue that the potential problem of endogeneity may be greater in
country case empirical studies where the education decentralization strategy is not to
decentralize all schools in the system, but instead to decentralize some districts or schools
in the country (Filmer 2002; King and Ozler 2000). Then, the problem of endogeneity
becomes severe where the decision of making a district or a school autonomous may not
be random, but instead it may be simultaneously determined with indicators of education
quality and student achievement.
proposed by David Drukker. With regards to the possibility of heterocedasticity, we report robust standard errors in all estimations, Pooled OLS, fixed effects and random effects. 57 The correlation index between education decentralization and fiscal decentralization (economy-wide decentralization) is 0.75.

78
Since every country has different reasons for and methods of decentralizing, there
are wide variations in decentralization reforms across countries. While we have provided
strong reasons about why we may not face the issue of endogeneity in our model, for
completeness, we use the Hausman (1978) specification test to test the null hypothesis of
exogeneity. We perform this test by regressing education decentralization (the potential
endogenous regressor) using various instrumental variables such as total population,
ethnic fractionalization, index of freedom, and a dummy variable equal to 1 if the country
is a former British colony or 0 otherwise.58 We conduct the endogeneity specification test
for each of the output indicators with the instruments specified above and exogenous
variables in the model. In the results chapter, Chapter Five, we report the results of
endogeneity tests for each model estimated. If we reject the null hypothesis of
exogeneity, then we consider that the Two-Stage Least Squares (2SLS) or instrumental
variable (IV) estimation is the most appropriate estimation method to deal with the
potential endogeneity problem of our data.59
58 Previous studies have related colonial heritage as a predictor of fiscal authority and organization. For example see Diaz-Cayeros (2004) who argues that former French colonies should be more centralized, while former British colonies are expected to be more decentralized. The author estimates centralization of government using information about colonial heritage as a predictor. 59 See Appendix D for an explanation of the two-stage least-squares estimation technique and for regression results of instrumental variables and education decentralization.

CHAPTER FIVE
ESTIMATION RESULTS
In the previous chapter we presented the basic estimation equations and the
empirical methodology for the analysis of the impact of education decentralization on
education output that we will perform in this chapter. The main goal of this dissertation is
to examine the impact of education decentralization on education outputs. To do this, in
this chapter we compare the results about the influence of education decentralization on
different measures of education output. An important reason to consider different
indicators of education output is that this approach will provide a robustness test of the
conclusions otherwise reached with any one of the models alone. Of course, it is possible
that education decentralization may positively or negatively influence the different
measures of education output. There is a higher chance that education decentralization
will have different effects on the various output measures. Only the actual empirical
analysis can provide more information about the relationship between different measures
of education outputs.
In the first section of the chapter we report and discuss empirical findings derived
from our testable hypothesis regarding the joint effects of education decentralization on
education outputs for the entire sample of countries. For each education output indicator
we estimate equations using Pooled LS estimation and panel data fixed effects (FE) an
random effects (RE) approaches. Where necessary, we control for the endogeneity of
education decentralization, reporting two-stage least-squares (2SLS)/instrumental
79

80
variable (IV) estimators.60 In the second section, we report and discuss empirical findings
of education decentralization using more disaggregated data on decision-making in
education at different levels of government; because of data availability this is done only
for a sub-sample of countries (mainly OECD). Appendix C presents data description,
descriptive statistics, list of countries in each sample, as well as simple correlation
between variables.
Education Decentralization and Education Output: All Countries
Here we analyze the question of whether education decentralization significantly
influences education output indicators as measured by student repetition rates, dropout
rates, net enrollment rates, completion rates, and test scores in science at the primary
school level. We analyze and report the results separately for each indicator.
Education Decentralization and Primary Repetition Rate
The descriptive statistics in Table C.2 (Appendix C) show that primary repetition
rates for the entire country sample period 1970-2004 ranges from zero to 15 percent, with
a sample mean of 3.12 percent. Over time, the sample mean has decreased from 6.5
percent in 1975 to 1.6 percent in 2004. Countries that have achieved zero repetition rates
are mainly European and Asian countries. In our sample, the highest repetition rate of 15
percent is found in India in 1975.
60 When education decentralization fails to reject the null hypothesis of exogeneity, we report instrumental variable estimation.

81
We start our analysis with the question of whether education decentralization
significantly influences repetition rates. Recall that in the previous chapter we discussed
the adequacy of repetition rates as a measure of education output, and that analysis will
not be repeated here.
Table 3. Fixed and Random Effects Estimation Results for all Sample Countries. Dependent Variable: Repetition Rate at the Primary Level One-Way
FE One-Way
RE Two-Way
FE Two-Way
RE Educ. Decent -0.139** -0.102** -0.136** -0.096** (Expenditure) (0.055) (0.041) (0.055) (0.038)
Fertility Rate 0.019 0.028 -0.287 -0.286 (0.569)
(0.162) (0.562) (0.174)
# of school days -0.012 0.002 (0.032) (0.030) Pop. Density 0.031 0.040 0.002 (0.027)
(0.029) (0.003)
Ratio of per pupil -0.402*** -0.452*** -0.354** -0.396*** Exp. to GDP p.c. (0.151)
(0.113) (0.134) (0.109)
Adult Avg. years 0.196 0.490 1.031 0.987** of schooling (0.631)
(0.420) (0.669) (0.385)
Decent. x adult 0.007 -0.001 0.005 -0.002 Schooling (0.009)
(0.006) (0.009) (0.005)
Decent. x educ 0.004** 0.005*** 0.004* 0.004*** Spending (0.002)
(0.002) (0.002) (0.002)
Log GDP p.c. -0.504 1.671* 1.769 0.727 (2.081)
(0.958) (2.523) (0.887)
Infant Mortality 0.220*** 0.166*** 0.195*** 0.144*** (0.070)
(0.052) (0.066) (0.048)
Observations 108 108 108 108 R-squared 0.56 0.64 Countries 35 35 35 35 Note: Robust standard errors in parentheses * significant at 10%; ** significant at 5%; *** significant at 1%.
82
As discussed earlier, the education decentralization variable may be endogenous
which would cause estimates to be inconsistent; this problem would call for the use of an
instrumental variable approach. In this case, the Hausman endogeneity test fails to reject
the null hypothesis that education decentralization is exogenous with a p-value of 0.37,
therefore here we report fixed and random effects estimators. The results in Table 3
indicate that the coefficients for education decentralization are negative and significant,
indicating that an increase in the level of education decentralization significantly lowers
repetition rates at the primary school level, ceteris paribus.
In comparing the appropriateness of fixed effects versus random effects
estimation, we conducted the Hausman specification test of the null hypothesis of no
correlation between the country unobserved fixed effects and the regressors with the
result that we are able to reject the null with a p-value of 0.0237. This suggests that the
fixed effects model is more appropriate. Thus, following the estimates of the fixed effects
model, the magnitude of the total effect of education decentralization on the dependent
variable is given by the sum of three terms:
[-.136 + 0.005 adult schooling + 0.004 per pupil spending].
Evaluating the marginal effect at the mean values for the explanatory variables we
obtain a value of -0.0265. That is, a 10 percent increase in education decentralization is
associated with a 0.265 percent reduction in the repetition rate, all else constant.61
As far as the effect of family inputs, we find that the effect of infant mortality is
positive and significant at the 1 percent level, indicating that as the level of infant
mortality increases so does the rate of repetition in primary school. The magnitude of the
61 We obtain -0.0265 by substituting mean values for adult education and per pupil spending, as follows: -0.136+0.005*(7.88)+0.004*(17.53)

83
coefficient indicates that a 10 percent increase in infant mortality rate increases primary
repetition rates by approximately 2 percent. The proxy for parents’ education and income
are found to be non significant.
With respect to the measure of school resources, we find that education spending
per pupil relative to GDP per capita is negative and significant indicating that countries
with higher spending per pupil achieve lower repetition rates. This is consistent with
some of the education literature that finds a positive effect of education spending on
education output.
Education Decentralization and Primary Dropout Rate
We now turn to examine estimation results when dropout rate at the primary
school level is the dependent variable. In our sample, primary dropout rates range from
zero to 41 percent, with a sample mean of 7.61 percent for the period 1975-2004. Over
time, the sample mean decreased from 9.76 percent in 1975 to 5 percent in 2004.
Countries that have achieved zero dropout rates at the primary school level are mainly
European countries and Japan. The highest dropout rate at the primary school level of 41
percent is found for Paraguay in 1990.
When we performed the Hausman endogeneity test we reject the null hypothesis
that education decentralization is exogenous with a p-value of 0.00004, therefore, we
only report results for the 2SLS/IV estimations in Table 4. As described in Chapter Four,
we instrument for education decentralization using total population, ethnic
fractionalization, an index for quality of governance, and a dummy variable for whether
the country is a former British colony. In order to choose between the fixed and random

84
effects estimators, we perform a Hausman specification test which fails to reject the null
hypothesis of no correlation between the country observed fixed effects and the
regressors with a p-value of 0.996. This suggests that using the random effects estimator
is appropriate.
As illustrated in Figure C.3, the relationship between education decentralization
and dropout rates may not be linear. To account for the quadratic fit suggested by Figure
C.3, we include the square term of the instrumented education decentralization variable.
Results in column 2 of Table 4 show a negative and statistically significant coefficient in
the linear part while the sign on the quadratic term is positive and statistically significant
at the 10 percent level. These findings confirm the U-shape pattern observed in the
graphical illustration, which suggests that education decentralization is likely to improve
dropout rates up to a certain critical level beyond which any increase in the share of sub-
national expenditures in education may actually increase dropout rates. Specifically, an
increase in expenditure decentralization in education beyond a critical threshold of
approximately 62.25 percent would appear to lead to an increase in dropout rates.62 We
must note that most developing and developed countries are below this threshold, as the
mean of expenditure decentralization in education is 48 percent and 53 percent,
respectively. If we analyze mean values by regions, only South East Asia, represented by
India in our sample, has a mean value of education decentralization greater than the
threshold, at 89%.63 The magnitude of the marginal effect of education decentralization is
62 This critical decentralization level is obtained by setting the partial derivative of the estimation equation to zero and solving for education decentralization EducDec= - (β1/ 2 β2)=(1.245/(2*0.010))=. Solving for education decentralization using the estimated coefficients in column 2 of Table 4 yields the decentralization threshold of 62.25%. 63 The high measure of expenditure decentralization in India has been highly criticized in the past since most expenditure in India is taken at the state level and little decentralization has occurred beyond this

85
given by [-1.245 + 0.020 education decentralization], where evaluated at the mean value
results in a marginal effect of -0.2272. That is, a 10 percent increase in education
decentralization is associated with a 2.28 percent reduction in the dropout rate, all else
constant.64
Table 4. 2SLS/IV Estimation Results for all Sample Countries Dependent Variable: Dropout Rate at the Primary Level IV
Fixed Effects+ IV
Random Effects+ Educ. Decent -1.226 -1.245* (Expenditure) (0.642)
(0.748)
Square Educ. Decent 0.005 0.010* (Expenditure) (0.005)
(0.006)
Fertility Rate 1.115 -1.191 (1.362)
(1.095)
Pupil-teacher ratio -0.243 0.119 (0.176)
(0.195)
Ratio of per pupil -0.175 -0.670 Exp. to GDP p/c (0.377)
(0.458)
# of school days -0.099 (0.185) Observations 110 110 Number of countries 34 34 Note: Standard errors in parentheses. + Year dummies included. * significant at 10%; ** significant at 5%; *** significant at 1%.
In addition to education decentralization, the input variables included in the
regression are those that have been found to significantly impact education output in the
previous literature. Variables such as pupil-teacher ratio and spending per pupil appear to
have the correct sign but they are non-significant. The positive sign of the pupil-teacher
level. Considering that a state in India may in itself be the size of a country, decentralization to the state level in India may not mean genuine decentralization.

86
ratio coefficient indicates that as the classroom size gets larger the dropout rate increases.
On the other hand, the negative sign in the ratio of spending per pupil to GDP per capita
indicates that in countries with greater spending per pupil the dropout rate is lower. As far
as the interaction variables in the equations with dropout rates, these were generally not
significantly different from zero and therefore they were excluded in the final estimating
equation.
Education Decentralization and Primary Net Enrollment Rate
We now turn to the estimation results when the dependent variable is the net enrollment
rate at the primary school level. Descriptive statistics show that primary net enrollment
rates range from 72 to 100 percent, with a sample mean of 94 percent for the period
1975-2004. Over time, the sample mean has remained in the 93 and 95 percent range.
Most developed countries have achieved full enrollment at the primary level including
some developing countries such as Albania, Argentina, Chile, Mexico, Russia and others.
The lowest enrollment rate in our sample is found in Indonesia with 72 percent in 1975.
The estimation results in Table 5 suggest that education decentralization does not
significantly influence student net enrollment rates over time. Only in the pooled LS
estimation with fiscal decentralization (column 2) do we find that the variable of
decentralization significantly influences net enrollment rates. However, when we use
fiscal decentralization as a proxy for education decentralization in the panel data
estimations, the coefficient of fiscal decentralization is also not significant.
64 We obtain -0.2272 by substituting the mean value for education decentralization as follows: -1.245 + 0.020 (50.89).

87
Table 5. Estimation Results for all Sample Countries: Dependent Variable: Net Enrollment Rate at the Primary Level Pooled LS Pooled LS One-Way
FE One-Way
RE Two-Way
FE Two-Way
RE Educ. Decent 0.008 -0.037 0.012 0.003 0.015 (Expenditure) (0.018)
(0.034) (0.026) (0.036) (0.024)
Fiscal Decent. 0.144** (All Expenditure) (0.067)
Fertility Rate -0.399 0.200 -3.349*** -0.950 -4.171*** -0.621 (0.308)
(0.446) (1.059) (0.587) (1.208) (0.573)
Pupil-teacher -0.302*** -0.838*** -0.006 -0.273*** 0.081 -0.236*** Ratio (0.081)
(0.140) (0.147) (0.083) (0.170) (0.077)
# of school days -0.059 0.013 -0.154* 0.000 -0.037 (0.052)
(0.055) (0.088) (0.000) (0.080)
Pop. Density 0.005** 0.005 -0.014 0.001 -0.009 0.003 (0.002)
(0.003) (0.012) (0.003) (0.017) (0.003)
Ratio of per pupil -0.140 -0.518*** -0.037 -0.087 -0.071 -0.118 Exp. to GDP p/c (0.104)
(0.155) (0.103) (0.091) (0.089) (0.086)
Observations 111 210 103 101 111 111 R-squared 0.23 0.36 0.35 0.41 Countries 38 37 41 41 Note: Robust standard errors in parentheses * significant at 10%; ** significant at 5%; *** significant at 1%
A Hausman endogeneity test fails to reject the null that education decentralization
is exogenous with a p-value of 0.7376. Table 5 presents pooled LS and fixed and random
effect estimators. A Hausman specification fails to reject the null of no correlation
between the country observed fixed effects and regressors with a p-value of 0.6825,
suggesting that using the random effects estimation is appropriate. Thus, when examining
the impact of other explanatory variables, we find that only the pupil-teacher ratio
significantly influences net enrollment at the 1 percent level. The negative sign indicates
that greater classroom density reduces the net enrollments.

88
Although the sign of the estimated coefficient for decentralization would indicate
a positive relationship between education decentralization and net enrollment rates, the
estimated coefficient for decentralization is never statistically significant. This may be the
result of the low variability of net enrollments over time as many countries in the past 15
years have reached, or are close to reaching the full primary enrollment mark.
Education Decentralization and Primary Completion Rate
We now turn to estimating the hypothesized influence of education
decentralization on primary completion rates. In our sample, primary completion rates
range from 61 to 100 percent, with a sample mean of 95 percent for the period 1990-
2004. Over time, the sample mean has increased from 93 in 1990 to 97 percent in 2004.
The lowest completion rate of 61 percent in our sample is for Switzerland in 1990;
however, in most recent years Switzerland has achieved the 100 completion rate mark.65
As far as the issue of endogeneity of education decentralization in the completion
rates model, we fail to reject the null of exogeneity with a p-value of 0.69. Therefore, we
report only the fixed and random effects estimators in Table 6. In this table, we report the
fixed and random effects estimators for education decentralization in columns 1 and 2,
and those using fiscal decentralization in columns 3 and 4. The estimation coefficients
for both fixed and random effects suggest a positive influence of education
decentralization on student completion rates. A Hausman specification test of the null
hypothesis of no correlation between the country unobserved fixed effects and regressors
suggests the fixed effects model is more appropriate with a p-value of 0.0391 for
65 These changes in the data are quite likely the result of exogenous policies involving criteria of graduation and grade repetition in particular countries. These issues were discussed in the previous chapter.

89
education decentralization; however, the random effects model is more appropriate when
fiscal decentralization is used as the explanatory variable with a p-value of 0.1154.
Table 6. Fixed and Random Effects Estimation Results for all Sample Countries: Dependent Variable: Completion Rate at the Primary Level One-Way
FE One-Way
RE One-Way
FE One-Way
RE Educ. Decent. 0.141* 0.016 (Expenditure) (0.082) (0.033)
Fiscal Decent. 0.382* 0.344*** (Expenditure) (0.203)
(0.097)
Log GDP p.c. -2.679 2.525* 7.477 5.555** (8.643)
(1.366) (4.924) (2.558)
Pupil-Teacher 0.195 -0.108 -0.017 -0.531* Ratio (0.524)
(0.175) (0.349) (0.289)
Ratio of per pupil 0.134 -0.042 0.091 -0.138 Exp. to GDP p/c (0.131)
(0.108) (0.116) (0.130)
Fertility Rate -7.755** -0.050 -6.869*** -1.959** (3.692)
(0.709) (2.414) (0.951)
Observations 115 115 145 145 R-squared 0.23 0.33 Countries 45 45 60 60 Note: Standard errors in parentheses * significant at 10%; ** significant at 5%; *** significant at 1%.
The fixed effect estimator for education decentralization suggests that there is a
positive and significant influence of education decentralization on completion rate at the
10% significance level. With respect to the magnitude of the effect, a 10% increase in the
level of expenditure decentralization in education results in an increase of the student
completion rate of approximately 1.4%, ceteris paribus. The random effect estimator for
fiscal decentralization also suggests a positive and significant effect on completion rate,

90
where a 10% increase in fiscal decentralization will lead to an improvement of
completion rate by 3.4%, ceteris paribus.
Turning to the other explanatory variables, based on the panel data estimations,
we note the strong effects of family inputs on completion rates. The fertility rate is
negative and statistically significant at the 5% level for each of the estimation models. As
one might expect, these results suggest that countries where families have a greater
number of children tend to experience lower student completion rates at the primary
level. Additionally, the model with fiscal decentralization indicates a positive and
significant influence of the proxy for parents’ income on completion rates, meaning that
in higher-income countries students tend to achieve higher completion rates at the
primary level.
With respect to the measures of school resources, for the pupil-teacher ratio, as
was the case for enrollment rates, the negative and significant coefficient indicates that
the greater the classroom density the lower student completions rates. The ratio of
spending per pupil to GDP per capita turns out to be insignificant for the panel data
estimators.
Education Decentralization and Primary Students Test Scores in Science
Finally, we turn to examining the influence of education decentralization on
student test scores in science at the primary school level. We choose to evaluate test
scores in science because it is the subject that has been evaluated for more years for
students at the primary level. Test scores in science for primary students are available for
1985, 1990, 1995 and 2004. Other subjects are available for a longer time series but they

91
evaluate students in lower secondary and secondary education levels. Despite our small
sample size, we have decided to report the estimation results in the hope that in future
years, with the increment of country participation in comparative achievement studies,
the sample size of countries may improve and buttress our preliminary findings. This is
our hope anyway considering that test scores may be one of the most important indicators
of education performance.
The variable test scores ranges from 0 to 1000, with a mean of 500 and standard
deviation of 100. For comparability of data we transformed all data to percentage form.
In our sample, test scores range from 46.6 to 66.9 percent, where the lowest test score of
46.6 is achieved in Norway in 2004 and the highest of 66.9 is achieved in Italy in 1990.
A Hausman endogeneity test fails to reject the null hypothesis that education
decentralization is exogenous with a p-value of 0.3737. Therefore, Table 7 presents the
panel data fixed and random effect estimators for education decentralization and fiscal
decentralization. The Hausman specification test fails to reject the null hypothesis of no
correlation between the country unobserved fixed effects and regressors with a p-value of
0.6547. Thus, we focus our discussion on the estimation results for the random effects
model (in columns 2 and 3 of Table 7). The estimated coefficients for education
decentralization and fiscal decentralization suggest a positive and significant relationship
between decentralization and student test scores. The magnitude of the effect of
education decentralization indicates that a 10 percent increase in education
decentralization is associated with approximately 1 percentage point increase in student
test scores. Similarly, a 10 percent increase in fiscal decentralization is associated with a
1.7 percentage point increase in student test scores, all else constant.

92
Table 7. Fixed and Random Effects Estimation Results for all Sample Countries. Dependent Variable: International Test Scores in Science at the Primary Level
One-Way FE+
One-Way RE+
Two-Way RE
Educ. Decent 1.792 0.096** (Expenditure) (0.863)
(0.044)
Fiscal Decent 0.172** (Expenditure)
(0.051)
Ratio of per pupil -0.618 -0.473** -0.018 Exp. to GDP p/c (0.694)
(0.219) (0.180)
Pupil-Teacher 0.239 -0.019 -0.414* Ratio (1.055)
(0.232) (0.231)
Fertility Rate 24.060* -0.152 0.663 (8.921)
(0.701) (0.352)
Pop. Density 0.181 0.014 (0.369)
(0.023)
Infant -0.726 -0.113 Mortality (1.482)
(0.191)
Adult Avg. years 4.055 0.113 of schooling (2.587)
(0.832)
Observations 27 27 39 Countries 16 16 24 R-squared 0.72 Note: Standard errors in parentheses. +Robust standard errors where indicated. * significant at 10%; ** significant at 5%; *** significant at 1%.
With respect to the other explanatory variables, the effects of family inputs on
student achievement appear to be non significant. However, the positive sign in the proxy
for parent’s education suggest that countries where parents achieve greater years of
schooling are likely to effect positively on the level of student achievement. The negative
sign of infant mortality rate, once again suggests that countries with high infant mortality
rates are likely to achieve lower test scores of student achievement.

93
With respect to the variables capturing school resources, pupil teacher ratio is
negative and significant in column 3, while per pupil spending is not significant. In
addition, the pupil teacher ratio is negatively related to test scores; thus, smaller class size
appears to be associated with improved pupil achievement. The estimated coefficients for
the interaction variables between education decentralization and other education inputs
were generally not significantly different from zero and were therefore excluded from the
final estimations.
Education Decentralization and Decision-Making: An Analysis with a Sub-sample of
Countries
We now turn to estimating the effects of education decentralization when this key
explanatory variable is measured in a finer way than expenditure decentralization through
what decisions on education are actually taken at different levels of government.
Examining the impact of education decentralization when this is measured via indicators
for the level of decision-making in different education functions may provide us with
better information on the relationship between decentralization and education outcomes.
This type of analysis may also help us understand what form of decentralized decisions
may have the strongest impact on education output.
Based on data from OECD, we have indicators for decision-making authority in
four categories of education systems: organization of instruction, personnel management,
planning and structures, and resources.66 We measure three decentralized levels at which
decisions in each of these four categories may be taken: the intermediate level (regions
66 See Table 1 for a detailed description of the types of decisions in education that may be decentralized in each of the four categories we present in this study.

94
and provinces), local level (municipalities), and school level. When we refer to sub-
national decision-making, we denote decisions taken at all levels below the central
government level.
The main disadvantage of our analysis of education decentralization through
decision-making is the low number of observations, which does not allow us to perform
fixed and random effects estimations. Therefore, we confine our discussion to the results
obtained from the pooled LS regressions. First, we explore the effect of sub-national
decision-making (aggregate measure including intermediate, local and school level) on
each of the output indicators. The results are mixed. We find that sub-national decision-
making is significant only when we try to explain performance in terms of test scores and
repetition rates (as dependent variables.) Based on these results, we concentrate our
discussion on test scores and repetition rates by further exploring the significance of sub-
national decision-making by analyzing the disaggregated effect of sub-national decision-
making for each level of government.
Table 8 reports the estimation results when the dependent variable is science test
scores. All estimating equations (the different columns) present a positive and significant
effect of expenditure decentralization on education, which is consistent with our results
found in the previous section. Column 1 of Table 8 shows the results of the effect of
education decisions taken at the intermediate level. The effect is positive and significant
at the 1% significance level, implying that decentralized decisions on education taken at
the intermediate level of government improve test scores.
Table 8. Estimation Results for Sub-Sample of Countries. Dependent Variable: International Test Scores in Science at the Primary Level+
Pooled LS Pooled LS Pooled LS

95
Educ. Decent 0.028* 0.047** 0.047** (Expenditure) (0.015) (0.021) (0.018)
% Decisions at 0.200*** Intermediate level (0.058)
% Decisions at 0.025 Local level (0.043)
% Decisions at -0.021 School level (0.030)
Fertility Rate 1.061*** 0.489 0.718 (0.263) (0.566) (0.475)
Ratio of per pupil -0.069 0.003 -0.008 Exp. to GDP p/c (0.108) (0.208) (0.201)
Pupil-Teacher Ratio -0.203 0.152 0.077 (0.139) (0.184) (0.113)
Population Density -0.005** -0.001 -0.001 (0.002) (0.002) (0.001)
Observations 22 22 22 R-squared 0.85 0.76 0.77 Note: Robust standard errors in parentheses. + Year Dummies included. * significant at 10%; ** significant at 5%; *** significant at 1%
As far as the magnitude of the effect, we can say that a 10 percent increase in
decisions taken at the intermediate level of government improves test scores in science by
2 percentage points. When we disaggregate the effect of intermediate decisions into
decisions about planning, organization, personnel, and resources, we find a positive and
significant effect of personnel and planning decision on test scores, while decisions about
resources and organization were also positive but not significant. These results suggest
that an increase in decision-making at the intermediate level in personnel management
and planning will raise student achievement.

96
As far as the effect of decisions taken at the local and school level on test scores,
column 2 of Table 8 shows a positive although not significant effect of decision-making
at the local government level on test scores. Column 3 of Table 8 shows a negative but
again not significant effect of decision-making at the school level on test scores.
Table 9. Estimation Results for Sub-Sample Countries. Dependent Variable: Repetition Rate at the Primary Level+
Pooled LS Pooled LS Pooled LS
Educ. Decent -0.032*** -0.032*** -0.027** (Expenditure) (0.009) (0.010) (0.011)
% Decisions at -0.043** School level (0.018)
% Decisions at 0.020 Intermediate level (0.014)
% Decisions at 0.013 Local level (0.019)
Ratio of per pupil -0.201*** -0.151*** -0.186*** Exp. to GDP p/c (0.044) (0.047) (0.050)
Fertility Rate -0.286 -0.297 -0.386* (0.178) (0.195) (0.183)
Freedom -0.019 0.246 0.258 (0.221) (0.209) (0.280)
Observations 22 22 22 R-squared 0.76 0.74 0.72 Note: Robust standard errors in parentheses. + Year Dummies included. * significant at 10%; ** significant at 5%; *** significant at 1%
With respect to the effect of decentralized decision-making on repetition rates,
Table 9 reports the estimation results where decision-making at the school level is found
to have a negative and significant effect on repetition rates at the 5% significance level
(column 1). As far as the magnitude of the effect, we can say that a 10 percent increase in
97
“decisions taken at the school level” improves repetition rates by 0.43 percentage points.
When we disaggregate the effect of school decisions on repetition rates into decisions
about planning, organization, personnel, and resources, we still find a negative effect for
each of these on repetition rates, although the disaggregated effects are not significant.
These results suggest that an increase in decision-making in each category (planning,
organization, personnel and resources) by itself may not lead to an improvement in
repetition rates, while an increase in all of these categories together will improve
outcomes regarding repetition rates.
For the effects of decision making at the intermediate and local levels on
repetition rates, column 2 of Table 9 shows a positive but not significant effect for
decision-making at the intermediate level, while column 3 shows a positive and not
significant effect for decision-making at the local level.
In summary, we find some interesting results when we measure the effect of
education decentralization through the percentage of decisions in education taken at
different sub-national levels. The results are quite different depending on the dependent
variables being evaluated. More decision-making power at the intermediate level of
government appears to improve student test scores; more specifically, these results are
present for decision-making about planning and personnel management. In addition, the
presence of more decision making authority in education at the school level is found to
significantly improve repetition rate outcomes. The estimation results also show that
larger decision making authority at the intermediate level positively affects completion
rates and enrollment rates.

98
As mentioned throughout this dissertation, the purpose of education
decentralization generally is not to decentralize all expenditures and decisions to one sole
level of government or organizational unit; instead the purpose may be to find a balance
in the decision making authority that should be allocated to each level of government.
Our results suggest that decisions on planning and personnel management have a greater
influence on education output when taken at the intermediate level of government (states,
provinces, etc.). At the same time we find that decisions at the school level can also
significantly improve education output. However, we find that decentralizing decisions
solely to the school level may not lead to improvements in education output. These
results contrast quite significantly with those found by (Burki, Perry, and Dillinger 1999)
for Latin America. Clearly, further analysis will be necessary to have a more definite
answer to the questions posed here; in particular, we will need a bigger sample of
countries for which indicators of decision-making in education are available.

CHAPTER SIX
CONCLUSION
In this dissertation, we have explored the impact of expenditure decentralization
and decision-making authority in the area of education on the outputs of publicly
provided primary education. We started by reviewing the literature on education
decentralization in Chapter Two where we presented results from various country case
studies on the direct and indirect effects that education decentralization may have on
education output. While the potential relationship between education decentralization and
its outcomes on education is still ambiguous in the literature, we determined there is a
need for additional theoretical and empirical research for exploring the alleged
relationship.
In Chapter Three, we developed a theoretical production function model that
incorporates behavioral effects of the agents in the education process. We illustrated how
education decentralization may directly and indirectly affect education output through its
influence in student and family inputs, school resources, and teachers’ effort. From the
theoretical model, we developed four testable hypothesis concerning the relationship
between education decentralization and education output.
After discussing our data sources and empirical methodology in Chapter Four, in
Chapter Five we explored empirically the effect of education decentralization on
education output using a panel data set from a sample of developed and developing
99

100
countries for five-year intervals during the period 1970-2004.67 We employed pooled LS,
fixed and random effects estimators, as well as two-stage least-squares estimators to deal
with some of the common problems associated with studies of education output and
education decentralization, namely unobserved effects and endogeneity. We analyzed
multiple indicators for education output in order to explore a range of possible effects of
education decentralization on repetition rates, dropout rates, net enrolment rates,
completion rates, and international comparative student test scores in science at the
primary school level.
Summarizing, our empirical findings support the existence of the hypothesized
positive effects of education decentralization on education output. With respect to the
influence of expenditure decentralization on education output we find empirical support
for the proposition that education decentralization may significantly improve repetition
rates, dropout rates, completion rates, and test scores in science at the primary school
level, everything else constant. With respect to the effect on net enrollment rates,
although the regression coefficients are positive, we were unable to find a significant
effect of education decentralization.
With regard to the effect of measures of family and school inputs on education
output, our results are mixed. We used different measures of family inputs such as
proxies for family size, family income, education of parents, and health of children.
Measures of school and teacher inputs include spending per pupil as a percentage of GDP
per capita, pupil-teacher ratio, and the number of school days in a year. Our empirical
findings suggest that infant mortality significantly affects repetition and completion rates.
67 The sample size is smaller in some regressions depending on data availability.

101
We also found a negative and significant effect of family size and a positive and
significant effect of parents’ income on completion rates. Lastly, the proxy for class size,
the pupil-teacher ratio, was found to negatively and significantly affect net enrollment
rates and completion rates, all else constant.
With respect to the influence of decentralized decision-making in education, we
find that both decision taking at the intermediate and school levels significantly improve
education output. Specifically, our results suggest that decisions on planning and
personnel management have a greater influence on education output when taken at the
intermediate level of government (states, provinces, etc.). At the same time we find that
decisions at the school level can also significantly improve education output. However,
we also find that allocating a portion of decisions for a sole category of education
decisions may not lead to improvements in education output.
Our results have a number of implications regarding decentralization policy.
While many cross-sectional country case studies have not been able to find any
significant effect of education decentralization on education output, it might help to
evaluate decentralization policies with a panel data set where observation are allowed to
vary over time; our results reaffirm the conjecture of the superiority of panel data
estimation. Second, our empirical evidence suggests that education decentralization may
have different effects depending on the indicator chosen for schooling performance. For
example, our findings show that when education output is measured through enrollment
rates, we fail to find any significant effect of education decentralization. Third, our
empirical results support the efforts of international financial institutions, bilateral donors
and many governments around the world that have embarked on the decentralization of

102
education decisions to levels of government below the central level in order to improve
education output. Lastly, given that educational attainment and human capital is
considered to be a key determinant in reducing poverty and improving economic
performance, policy-makers may want to consider education decentralization as a tool to
influence education indicators to ultimately fight poverty and achieve economic growth.
We believe that the inclusion of additional explanatory variables and the
balancing of the panel data set with additional observations, as they become available,
will significantly improve our empirical knowledge about the impact of education
decentralization on education outputs. Additionally, it will be useful to examine the
indirect effects of education decentralization on education output and further explore the
effect of corruption in the model as data becomes available. Furthermore, it will be
necessary to examine the effect of education decentralization on performance at other
levels of education, especially secondary education.

103
APPENDIX A
COUNTRY EXPERIENCES WITH EDUCATION DECENTRALIZATION
In Chapter Two of this dissertation, we examined the current state of the literature
of the impact of education decentralization on education output in terms of theoretical
modeling and empirical methodology. This appendix extends the examination of
education decentralization by taking a deeper look at the design of education
decentralization reforms in different countries beyond what has been covered in Chapter
Two. The objective is to examine the background and development and transition of the
implementation of education decentralization reforms. We now turn to examining these
country experiences.
Education Decentralization Reforms
While there are a myriad of decentralization experiences in the educational
sphere, we can draw upon some of these experiences to motivate the theoretical analysis
in the succeeding chapters. In this section, we examine a number of country specific
cases and discuss the impact of the decentralization reforms on education quality. We
conclude the section with a summary discussion on how country specific studies have
contributed so far to the literature on education decentralization and education quality,
and a discussion about how this dissertation will contribute to the existing gap in the
literature.

104
Market-based Competition and School Choice
A different type of education decentralization reform currently being proposed
involves improving education outputs through market-based competition and choice. The
term “school choice” means giving parents the power and opportunity to choose the
school their child will attend.
Traditionally, children in the U.S. are assigned to a public school according to
where they live. People of means are considered to have school choice, because they can
afford to move to an area according to the schools available (i.e., where the quality of
public schools is high), or they can choose to enroll their child in a private school. Parents
without such means, until recently, generally had no choice of school, and had to send
their child to the school assigned to them by the district, regardless of the school’s quality
or appropriateness for their child. One hypothesis for school choice reforms is that
competition between local governments promotes efficient use of resources and reduces
the overall size of government. Moreover, residents will “vote with their feet” by moving
to another locality according to local taxes and the quality of education services.68
Another hypothesis states that under school choice technical efficiency improves through
availability of better information at the local level.
School choice means better educational opportunity, because it uses the dynamics
of consumer opportunity and provider competition to drive service quality. There are
different types of school choice programs. According to the U.S. for Education Reform
there are full school choice programs, private scholarship programs, and charter schools.
Full school choice programs, or voucher programs, are government financed per-pupil
68 See Brennan and Buchanan (1980) and Tiebut (1956).

105
subsidies given to parents allowing them to enroll the student in a public or private school
of their choice. The rationale is that parents are given choice and schools are required to
compete for students in order to survive and the quality of education is expected to
improve.69 In a similar manner, private scholarship programs provide private funds to
families of low socio-economic status giving them to opportunity to choose between
schools.
Charter schools is a new form of choice, where schools are independent public
schools, designed and operated by educators, parents, community leaders, educational
entrepreneurs and others. Charter school designs differ according to the country of
implementation, but in general they are sponsored by designated local or state
educational organizations who monitor their quality and integrity, but allow them to
operate freed from the traditional bureaucratic system of public schools. Charter schools
design and deliver programs tailored to educational excellence and community needs.70
School Choice programs have been implemented in countries like Chile, Belgium, and
the United States. Several examples are discussed in this section.
Voucher Program in Chile
In Chile, the Pinochet government introduced in 1980 a modified voucher scheme
and municipalized public education to increase competition among schools for students,
and thereby raise the accountability and efficiency of schools through higher levels of
student achievement. Under the voucher system, families can choose to send their
children to free subsidized schools, either municipal or private, or they can choose fee-
69 For a discussion on school vouchers see Hanson (1997), McGinn and Welsh (1999), and Parry (1997a). 70 See McGinn and Welsh (1999), p. 45.

106
paying private schools if they can afford the tuition fees. Because this reform is one
where money follows the student, it entails real choice.71 Recent studies have indicated
no significant differences in student achievement among public and private voucher
schools.
A study by Parry (1997b) examines the impact of education vouchers in the
Chilean experience. This study evaluates two of the fundamental argument supporting the
use of education vouchers: first, do private schools produce higher quality education than
public schools; and secondly, does competition force schools to produce higher quality
education. The authors use data collected in 1990 measuring student achievement through
fourth-grade student test scores in mathematics and Spanish. The difference between
private, public, and private-subsidized schools is measured through the use of dummy
and interactions variables. One fault in this analysis, however, is that student background
characteristics are roughly measured through dummy variables that control for parent’s
level of education and socio-economic level. This is the only variable used for explaining
student background. This study finds that public schools achieve higher performance with
disadvantaged children while private-subsidized schools produce higher scores with ‘high
quality’ students (students whose parents have high education level). Private and public
schools seem to have specialized in a way that public schools achieve better results with
disadvantaged students and private schools achieve better results with higher quality
students.
71 Vegas (1999).
107
A study by Vegas (1999) also of Chile explores the voucher programs using a
national assessment data set (SIMCE) that includes information on teacher demographics
and labor market characteristics, as well as teacher perceptions about school
management. The study finds that when teacher data is matched with school-level data on
student achievement, some teacher and school characteristics affect student performance,
but a great deal of unexplained variance among sectors remains important in predicting
student outputs. Moreover, teacher education, decentralization of decision-making
authority, school’s schedule enforcement and teacher’s autonomy in designing teaching
plans and implementing projects all appear to affect student outputs. Teacher autonomy
was found to have a positive effect on student outputs only when decision-making
authority is decentralized.
Increased Local Autonomy in Zimbabwe
An example of increased local autonomy that failed is that of Zimbabwe. In the
late 1980’s the Ministry of Education issued rulings to delegate decision-making power
to local communities for construction of primary schools, authority to hire and fire
teachers, and disbursing to schools the per capita grants and teacher’s salaries paid to
them by the education ministry. The Ministry of Education retained the authority of
designing the curriculum, conducting examinations, and training teachers. This new
system had some difficulties. Teachers were not getting paid on time, and some district
councils were found retaining some of per-pupil grants for non-educational activities
instead of passing them to individual schools. Moreover, the central government
discovered numerous wages paid to phantom teachers. In summary, the efforts for

108
education decentralization in Zimbabwe failed and overall quality of education stayed
low.72
Decentralization Reform in Minas Gerais, Brazil
In Minas Gerais, Brazil, in the early 1990s, low student test scores and high
repetition and dropout rates raised concerns about the education system. Only about 40%
of students completed all eight grades of primary school. The low performance of
education outputs was attributed to inadequate funding, poorly trained teachers, rigid
pedagogies, and over regulated management.73 The state government then enacted an
educational reform to grant financial, administrative, and pedagogical autonomy to
elected boards in each school composed of teachers, parents, and students over the age of
sixteen. Each board was given autonomy to decide in a democratic fashion how to spend
grant funds and locally raised education revenues. The boards were also allowed to
decisions on curriculum, pedagogy, the school calendar, and other functions. However,
teachers’ union bargaining was maintained at the state level. Lobo et al. (1995) state that
school autonomy and greater transparency in decision-making in Minas Gerais has led to
increased operational efficiency. Although an empirical evaluation of the effects of
greater school autonomy in Minas Gerais has not been performed, early results of the
1994 student achievement tests of third graders show that in comparison with 1992,
scores rose by 7 percent in science, 20 percent in Portuguese, and 41 percent in
mathematics.
72 Fiske (1996), pp. 19-20. 73 Fiske (1996), pp. 14-15.

109
School Autonomy and Decentralization in The Netherlands74
The Dutch education system has been decentralized and demand-driven since
1917. Almost 70 percent of schools in the Netherlands are administered and governed by
private school boards. Public and private schools are funded by the government on an
equal footing, and most parents have a choice of several schools near their homes.
Parental choice has spurred some schools to develop a unique profile and to
improve the education they offer. While schools are free to determine what is taught and
how, the Ministry of Education does impose a number of statutory quality standards. The
Education Inspectorate is charged by the Minister of Education with supervising the
manner in which schools fulfill their responsibilities.
In recent years, there has been a trend towards greater autonomy and
decentralization. Many central government powers have been transferred to the level of
the individual school. Central government control is increasingly confined to broad
policy-making and to creating the right conditions for the provision of quality education.
Institutions are being given greater freedom in the way they allocate their resources and
manage their own affairs, although they still answer to government for their performance
and policies. Schools receive extra funds to combat educational disadvantage. Additional
funding is provided for schools in districts and regions with high numbers of
underprivileged families.
74 See Patrinos (2000).

110
School Voucher System in Sweden75
Sweden has carried out a radical reform of its primary and secondary school
system in the 1990s. A voucher system has replaced the earlier centralized system, and a
parental choice reform has been instituted. Under the new system, all independent
schools approved by the National Agency for Education are entitled to public funding.
Parents are free to choose any school for their children. This has lead to a significant rise
in both the number of independent schools, and in the number of students attending
independent schools.
New school enrollment rules allows money to follow students, and municipalities
are required to provide capitation grants to each private school equal to 85 percent of the
public school cost. This new funding system enables nearly 90 percent of the private
schools to be free from charging fees. As a result, enrollments in private schools continue
to grow, more than doubling in recent years to reach almost 3 percent of total
enrollments.
The Nacka municipality, outside Stockholm, created this particularly effective
voucher system. Each year, parents are given a catalog profiling all the local schools plus
a voucher that is to be handed over to the school of their choice. (Sweden, incidentally, is
one of the few countries where an actual physical voucher is used.) Parents who do not
choose a school are contacted by some of the closest schools to encourage an active
choice. Active choice also is promoted by requiring parents to present a new voucher
before the first, fourth, and seventh grade even if the child is attending the same school.
Private and public schools alike follow the national curriculum. The competition this has
75 Ibid.

111
caused between schools for pupils has resulted in more efficient allocations of funds and
clearer institutional focus. However, fears that increased competition from independent
schools would hurt public schools are thus found not to be warranted.
Capitation Grants in Armenia76
The government of Armenia, under its Model Charter for autonomous schools, is
embarking on a reform strategy that will place more responsibility at school level. The
project will support establishment of the necessary framework for managing education
reform, including development of detailed implementation plans and capacity building
for reforms of school finance and governance. Schools will receive lump sum funding
from the Treasury on a capitation basis, and will be free to allocate these funds between
different inputs within specified limits such as minimum salary rates. They will manage
their budgets themselves, with the exception of major capital expenses. Newly
established school boards, managed by principals selected by the board will manage
budgets. Pilot implementation has just begun in 10 percent of the country's schools. The
project funds technical assistance to help in defining details of the new funding formula,
legal and regulatory framework, accountability and reporting requirements, and will fund
training of school principals, board members and accountants.
The Pilot School Improvement Program is designed to build management
capacity at the school level to match the autonomy reforms by providing grants up to
$10,000 to schools for self-identified projects. These will be for investment projects, and
76 Prepared by Grace Lang in response to a query from the Educational Advisory Service. Reproduced here for the Decentralization & School-Based Management Resource Kit. Coordinated by Karen Edge, Education Reform and Management Group, HDNED, World Bank (2000).

112
not for normal recurrent costs or reconstruction/civil works. Typical components so far
have included purchase of equipment and teaching materials, teacher training in new
subjects/methods–geared either to teaching the core curriculum better, or to introducing
extra-curricular classes. Projects must show a strategy for sustainability and have
included providing paid services to the community (e.g., computer or language training)
or selling product of extracurricular vocational activities (e.g., agricultural/food
products). Schools must be autonomous and finance 10 percent of costs.
Spain’s Democratization and Decentralization Reform
Over the past 20 years, Spain has decentralized many aspects of its formerly
centralized education system to 17 Autonomous Communities (ACs). The ACs were
established in 1978, to support the transition to democracy from the former dictatorship
government. This regional democratization also accommodated the historic regions
(Catalonia, Basque Country and Galicia) that were demanding autonomy. Throughout
Spain’s 20-year decentralization process there have been interruptions often due to
changes in elected national governments. In January 2000, after a 20-year
decentralization process, the last of the 17 regional governments received decision-
making authority over education (Hanson 1997).
The decentralization process in Spain began after General Franco’s death in 1975
and marked the end of his 40-year authoritative and centralized regime. Under Franco,
education served the elite. Textbooks and curriculum were strictly centralized in support
of religion, Franco and the regime. Hanson notes that, "prior to the democratic transition
of 1977 (when the first free elections were held), the system of public education at the

113
elementary, secondary and university levels was frequently characterized in the research
literature as administratively and organizationally centralized, economically under-
funded, politically controlled, and academically conservative."
In 1978, the 50 provinces were reconfigured into 17 ACs. The ACs reestablished
many historic regions around language, tradition, and culture. Each AC was required to
establish democratically elected parliaments and adopt a degree of self-rule. The
decentralization to the regions was designed to be implemented gradually, based on their
administrative capacity. In 1980, 6 of the 17 regions had been decentralized. The
Ministry of Education (MEC) established the “minimum academic requirements” on
curriculum content to meet the goal of having one educational system composed of 17
integrated, semi-autonomous bodies rather than separate educational systems. The
requirements formalized the MEC’s regulation of 55 to 65 percent of the curriculum,
while still granting curricular freedom to reflect local and regional priorities.
The central government established a block grant funding system. The ACs
received block transfers that included funding for education, health, and transport. In
addition, Inter-Territorial Compensation Funds (FCI) were established to achieve greater
financial equity between wealthy and impoverished regions. By 1996, education spending
had increased to over 5 percent of GDP compared to 1.8 percent in 1975.
In 1985, Spain enacted the Right to Education Law (LODE), reinforcing the
decentralization and democratization of education. After this law, the following
administrative structure was enforced (Hanson 1997):
State School Council (Consejo Escolar del Estado). The CEE is an 80 member national level advisory body. It is required to meet at least once a year and provide feedback on the state of education in Spain. The council and its members are also encouraged to submit proposals for educational change. The CEE membership includes

114
representation from: teachers; parents; administrative and staff; trade unions; private schools; tertiary institutions; MEC administrators (10%); and, education scholars. The presence of Ministry appointed delegates (10%) has often served as a disincentive for Council members to critique Ministry proposals and has often challenged the effectiveness of the Council.
Conference of Education Counselors. The Conference brings the Minister of
Education and the Chief Education Officers from each AC. It is required to meet at least once a year and is comprised of 5 subcommittees that explore a range of educational issues. Hanson notes that the Conference has faced challenges due to the politics of the participants.
Education Council (Consejos Escolares del Centro). The LODE established
Consejos Escolares del Centro (CEC) in each of the 17 ACs. According to Hanson, there were few CECs in effect during the first years of the reform.
Local School Council (Consejos Escolares). LODE also required the creation of
Consejos Escolares (CE) in every public and private school receiving government funding.
School Principal. The primary focus of the principal is implementing the policies
of the CE. The principal’s responsibilities also include managing the school budget and overseeing personnel issues. The principal also works with the Chief of Academic studies to guide the teaching and learning processes. The school principal is elected by an absolute majority vote of the School Council members and can be fired by a two-thirds majority.
After 20 years of decentralization reform Hanson and Ulrich (1994) state that
"School Based Management (SBM) is playing an important symbolic role in democratic
participation at the local level, but has not as yet demonstrated the anticipated
improvement in administrative processes." While the three different levels of
administration were designed to collaborate and work together, there is little or no
evidence that this has occurred. The authors also note that "almost without exception, the
interviews conducted for this study revealed that educators…recognized that the practice
of school-based management was not proving to be an effective mechanism for
improving the quality of management and/or education in the schools.”77
77 Hanson and Ulrich (1994), page 20.

115
While SBM may not yet have achieved all of its stated goals, it has been
successful in establishing a more widespread acceptance of the government’s
commitment to democratic participation. The number of public schools increased from
1,100 in 1975 to approximately 3,000 in 1995, thus increasing access to education.
Moreover, in 1975, only 70 percent of 14 year olds were in school compared to
approximately 100 percent of 15 year olds enrolled in 1995.78 Unfortunately, the long-
term impact of these changes has yet to be observed and evaluated.
Education Decentralization Efforts in Mexico
Before the Mexican educational reform in 1993, the education system was highly
centralized and highly inefficient. One out of seven primary-age students lacked access to
school, and in poor states such as Chiapas less than 20 percent of students were in school.
In addition, newly hired teachers waited over a year for their first paychecks, and any
mistakes would have to be corrected by a costly and time-consuming trip to the capital.79
The education decentralization process was implemented in three stages. Between
1978 and 1982, the Ministry of Education deconcentrated management of the education
system to each of the thirty-one states of Mexico. Each state was given responsibility
from budgeting and managing schools to the writing of curriculum and textbook choice.
Revenue generation, core curriculum design and labor policy remained at the central
level. During this first stage of reform, preschool enrollments increased, as well as
78 Hanson (1997), page 15. 79 Fiske (1996), page 17.
116
primary and secondary enrollment rates, especially in rural areas (Mexico's education
decentralization process 1993).
During the second phase of the reform, 1983 to 1988, the government intended to
transfer additional control to the authority of the states. Nevertheless, it failed because of
teacher unions’ opposition of negotiating with thirty-one states. Moreover, central
government staff members resisted due to their interests in the centralized system and
their long-standing cooperative arrangements with teachers (Fiske 1996).
In 1988, a new government came to power and negotiated an agreement with the
national teachers union which permitted the 1993 “Ley General de la Educación.” This
new law transferred most educational decision-making authority for primary and
secondary schools to the state governments. However, the central government’s role in
financing education through negotiated transfers to the states resulted in de facto
continued centralization. It was not until 1998 that decentralization was in place when
education transfers became automatic. The central government continues to directly
operate a system of rural schools called CONAFE (National Board for Educational
Improvement), which ensures learning opportunities for remote rural areas, especially for
indigenous children (Fiske 1996).
While decentralization efforts in Mexico have not been primarily focused on
improving learning, some components of the reform may have a positive impact on
learning such as changes in teacher evaluations and pay as well as additional resources
for poor and indigenous rural children. While CONAFE schools give parents a more
important role than is found in the traditional public schools, teachers and parents are not
yet actively engaged in leads to learning improvements at the level of the school. An

117
empirical study would help to determine any learning output improvement from
education decentralization reforms.
From Decentralization to Centralization to Decentralization in Colombia80
Colombia is an interesting case of a country that implemented centralization
reforms to correct a failed decentralized system. After twenty years, Colombia once again
implements decentralization reforms as a medium of improving public services.
Following World War II, Colombia implemented decentralization reforms to
break up an “oligarchical democracy” where political elites of the Conservative and
Liberal Parties and the Roman Catholic Church controlled the country. Under the original
decentralization reform, local municipalities exercised considerable control over
education but lacked the financial, administrative, and political capacity to generate
revenues, manage schools, and deal with teacher strikes.
The centralized system established in 1970 was created to correct the
decentralized system. The Ministry of Education in Bogotá controlled all important
decisions regarding curricula, textbooks, and other matters of educational policy. In
addition, teachers were employees of the central government whose salaries were
negotiated at the central level. This new system was successful at improving educational
efficiency and at ending teacher strikes. However, after two decades, the centralized
system developed into bureaucratic arteries which were unable to cope with growing
demands for local autonomy. Moreover, during the centralized system, late 1980s,
80 Fiske (1996), pages 1-4.

118
Colombia was at the edge of political, economic, and social collapse. Terrorist guerrillas
and the corrupting influence of drug cartels had invaded the country. The government’s
step to restore credibility was to give ordinary citizens a greater role in managing public
institutions.
The first step into greater decentralization was in 1985, when popular elections of
the mayors of Colombia’s 1,024 municipalities and thirty-three state governors were
instituted. In 1989, Congress approved to give municipalities a greater role in decisions
of the education and health sectors. The government’s new decentralization reform was
an effort to “municipalize” basic education and to increase the autonomy of local schools.
Financial resources were transferred to municipalities and departments, and schools were
given responsibility for managing personnel, design parts of the curriculum, and control
aspects of finance. Moreover, parents and teachers were to gain greater voice in running
schools and a voucher system for poor students was instituted at the secondary level. The
legislation was adopted in 1993 and 1994 after continuous resistance from teacher
unions. Local schools did not obtain autonomy to select, hire, and sanction personnel. A
system of teacher evaluation was established, but measures of student output, such as test
scores, were excluded.
The effects of the new decentralization reform were mixed. The 1994 budget for
education increased to 3.65 percent of GDP, which was above the target figure of 3.5
percent. In addition, parent and community groups were not well organized, nor were the
mayors and governors who had been recently elected. In summary, the decentralization
effort in Colombia was successfully at improving legitimacy of the government, but the

119
impact was diminished by failure of support from important players including governors,
community members and teachers.
Indonesia and Philippine’s Local Funding
James, King and Suryadi (1996) investigate the impact of private vs. public
finance of education and private vs. public management of schools on school cost and
efficiency. The authors use a multi-product production function subject to a budget based
on central government funding and local sources (parental fees and contributions). A
Cobb-Douglas variable cost function is then derived and empirically tested to estimate
efficiency as the cost per student of achieving a given level of academic performance and
a given level of enrollment. A key issue in the cost function estimation is the presence of
endogeneity in the source of funding. Instruments for local share of funding are then used
to solve the issue.
James, King and Suryadi find that in Indonesia, where schools generally operate
at very low funding levels, more money is likely to bring better school quality as
measured by examination scores. Private management is found to be more efficient than
public management in achieving academic quality. Moreover, this study finds that local
funding further enhances efficiency whether the school is public or private; however, the
incremental effect declines as the local funding share increases.
In the study of the impact of local contributions on the efficiency of management
and finance in Indonesia, the authors measure only the fiscal dimension of community
funding and not the decision-making community involvement. Since community and
parental contributions plays an important role in education funding (30 percent of total

120
education funding) in Indonesia, does the community and parental associations have a
word in the decision-making process of education functions? If yes, how does it
contribute to efficiency effect estimated? These are some of the questions that could be
further explored about education decentralization in Indonesia.
Concluding Thoughts
Based on the country experiences with education decentralization presented in
this appendix, we can observe that education decentralization reforms vary from country
to country, starting from the motives for implementation to the mix of decision power
devolution. Moreover, once again we see that the results of these reforms are mixed.
There is no consensus in the literature as to the impact of education decentralization on
education output. The influence of education decentralization on education output can
only be determined empirically.

121
APPENDIX B
THEORETICAL APPENDIX
The problem of the social planner is to maximize the following production function:
),,,(_
,,,, DESXfO titititi = (1a)
subject to
BESXP tititii ≤),,( ,,, (2a)
where
),( ,1
_
, titi ZDgX = (3a)
),( ,2
_
, titi ZDhS = (4a)
),,,( ,3
,
_
,, titititi ZaDwjE = (5a)
We set up the Lagrange function as follows:
)],,([),,,(L ,,,
_
,,, tititijtititi ESXPBDESXf −+= λ (6a)
setting the partial derivatives of L equal to zero, with respect to each of the variables we
wish to optimize (for simplicity we disregard the subscripts): tititi ESX ,,, ,,
0'' =−=∂∂
XX POXL λ
(7a)
0'' =−=∂∂
SS POSL λ
(8a)
0'' =−=∂∂
EE POEL λ
(9a)
0),,( ,,, =−=∂∂
tititij ESXPBLλ (10a)

122
Solving forλ in equation (7-9), yields the following equations:
'
'
X
X
PO
=λ (7’a)
'
'
S
S
PO
=λ (8’a)
'
'
E
E
PO
=λ (9’a)
Substituting for λ into equations (7-9), yields the following:
'
'
'
'
S
X
S
X
PP
OO
= (10a)
'
'
'
'
E
X
E
X
PP
OO
= (11a)
'
'
'
'
E
S
E
S
PP
OO
= (12a)

123
APPENDIX C
DATA DESCRIPTION AND SOURCES
Table C1. Data Sources Variable Variable Description Primary Data Source A) Measures of Education Output
Primary Dropout Rate
Proportion of pupils who start primary school but do not eventually attain the final grade of primary school.
Barro, J. Robert and Jong-Wha Lee, 2000, updated with World Bank’s EdStats 2006.
Primary Repetition Rate
Proportion of pupils who are enrolled in a given grade and enroll in the same grade in the following school year.
Barro, J. Robert and Jong-Wha Lee, 2000, updated with World Bank’s EdStats 2006.
Primary Net Enrollment Rate
Ratio of official school-aged children enrolled in primary school to the total population of children of official primary school age.
World Bank’s World Development Indicators 2004 CD-ROM; updated with OECD’s Education Stats 2006 and World Bank’s EdStats 2006.
Primary Completion Rate
Ratio of the total number of students successfully completing or graduating from the last year of primary school in a given year to the total number of children of official graduation age in the population.
World Bank’s World Development Indicators 2004 CD-ROM; updated with OECD’s Education Stats 2006 and World Bank’s EdStats 2006.
Test Scores Examinations in mathematics, science and reading conducted in various years for primary and secondary students of the same age or grade group. Scales range from 0 to 1000, with a mean of 500 and standard deviation of 100. For comparability of data we transformed all data to percentage form.
Barro, J. Robert and Jong-Wha Lee, 2000 and updated with TIMSS 1995 and 2003 results.
B) Measures of Family Inputs
GDP per capita (PPP)
GDP per capita based on purchasing power parity (PPP). PPP GDP is gross domestic product converted to international dollars using purchasing power parity rates. An international dollar has the same purchasing power over GDP as the U.S. dollar has in the United States. GDP is the sum of gross value added by all resident producers in the economy plus any product taxes and minus any subsidies not included in the value of the products. It is calculated without making deductions for depreciation of fabricated
World Bank’s World Development Indicators 2004 CD-ROM

124
assets or for depletion and degradation of natural resources. Data are in current international dollars.
Real GDP per capita (PPP) (in Log)
Log of GDP per capita. World Bank’s World Development Indicators 2004 CD-ROM
Percentage of “Primary School Complete” in population 25 and over
A measure of education attainment in terms of the percentage of population over the age of 25 years that have completed primary education level.
Barro, J. Robert and Jong-Wha Lee, 2000.
Average years of Primary Schooling in population 25 and over
A measure of education attainment in terms of the average years of primary schooling for the total population over the age of 25 years.
Barro, J. Robert and Jong-Wha Lee, 2000.
Average years of Schooling in Population 25 and over
A measure of education attainment in terms of the average years of schooling for the total population over the age of 25 years.
Barro, J. Robert and Jong-Wha Lee, 2000.
Fertility Rate Total fertility rate represents the number of children that would be born to a woman if she were to live to the end of her childbearing years and bear children in accordance with prevailing age-specific fertility rates.
World Bank’s World Development Indicators 2004 CD-ROM
C) Measures of School Resources:
Real Gov’t Current Education expenditure Per pupil – Primary (PPP)
Real government education expenditure per pupil at the primary school level.
Barro, J. Robert and Jong-Wha Lee, 2000.
Pupil-teacher Ratio Primary School
Measure of average number of pupils per teacher at the primary level for any given year.
Barro, J. Robert and Jong-Wha Lee, 2000, update with UNESCO and OECDstats 2006.
School Days (no.) The length of the school year in terms of days.
Barro, J. Robert and Jong-Wha Lee, 2000.
Real Primary Teacher Salary (PPP)
Average real salary of primary school teachers. Barro, J. Robert and Jong-Wha Lee, 2000, update with UNESCO and OECDstats 2006.
D) Measures of Decentralization
Expenditure Decentralization - All
Share of expenditures of all sub-national governments (net of transfers to other levels of government) in total expenditures of consolidated central budget measured in percents. Scale from 0 to 100.
Database on Fiscal Indicators, by the World Bank, based on IMF’s Government Finance Statistics. Data from Government Finance

125
Statistics 2004 was added Education Decentralization decision-making autonomy
Level at which decisions are taken in various functions in education: organization of instruction, planning and structures; personnel management; and resources.
OECD (1995), and OECD’s Education at a Glance 1998, 2003.
E) Other Explanatory Variables
Population density
Population density is midyear population divided by land area in square kilometers.
World Bank’s World Development Indicators 2004 CD-ROM
Rule of Law And index on a scale of 0 to 6 that measures perceptions of crime, the effectiveness, independence, and impartiality of the judiciary. In general, it measures the extent to which economic agents respect the rules that govern their interactions. The higher the score, the better the performance of the respective country.
Kaufman and Kraay (2002)
Corruption Indices An index on a scale of 0 to 6 that measures perceptions of corruption. Corruption in this context is defined as the exercise of public power for private gain. A higher score indicates lower expectations of corruption.
Transparency International
Political Rights A country rating on a scale of 1 to 7 that indicates the degree of political rights in regard to existence of free and fair elections, competitive parties or other political groupings, an opposition that plays a significant role in political decision-making, and the rights of minority groups to self-government. A rating of 1 indicates highest level of political rights (closest to ideals) suggested in the survey.
Freedom in the World 2003; Freedom House
Civil Liberties A country rating on a scale of 1 to 7 that indicates the degree of civil liberties in regard to aspects such as the degree of freedom of expression, assembly, association, education, religion, and an equitable system of rule of law. A rating of 1 indicates the highest level of civil liberties.
Freedom in the World 2003; Freedom House
Freedom An average of the index of political rights and the index of civil liberties.
Kagundu (2006)

126
Table C2. Descriptive Statistics Variables Mean Std. Dev. Min Max Observations Education Indicators Primary Dropout overall 7.614216 10.15053 0 41 N = 204 Rate between 9.000619 0 37.93333 n = 57 within 3.502271 -7.969117 19.86422 T-bar = 3.57895 Primary Repetition overall 3.119487 3.106699 0 15 N = 195 Rate between 2.632106 0 11.08 n = 57 within 1.38879 -2.120513 12.0052 T-bar = 3.42105 Net overall 93.88623 5.834477 72 101 N = 193 Enrollment Rate between 5.618859 76 100 n = 59 within 2.932492 75.34123 103.5577 T-bar = 3.27119 Primary Completion overall 95.22234 8.075666 61 107.6 N = 141 Rate between 6.571977 76.20555 103.3 n = 53 within 4.929043 71.88901 108.7668 T-bar = 2.66038 Science Test Scores overall 54.58696 4.600773 46.6 66.9 N = 46 Primary Level between 3.532338 47.3 59.7 n = 23 within 3.402137 46.93695 62.29946 T-bar = 2 Family Inputs: Real GDP per capita overall 14386.08 9859.483 729.1319 57296.92 N = 236 (PPP) between 9055.029 844.6488 33177.55 n = 61 within 3311.968 2495.88 38505.45 T-bar = 3.86885 Real GDP per capita overall 9.235264 0.9418597 6.591855 10.956 N = 236 (PPP) (in Log) between 0.9587599 6.729481 10.34176 n = 61 within 0.1757107 8.692822 9.927343 T-bar = 3.86885 Percentage of “Primary
overall 18.98112 8.641359 3.7 42.7 N = 143
School Complete” in between 8.494092 4.06 41.65 n = 40 population 25 and over within 3.333876 10.93112 31.24112 T = 3.575 Average years of overall 4.879951 1.2636 1.915 7.667 N = 143 Primary Schooling in between 1.267869 2.480667 7.6615 n = 40 population 25 and over within 0.2560874 4.133551 5.899284 T = 3.575 Average years of overall 7.887161 2.401819 2.359 12.247 N = 143 Schooling in between 2.30873 3.243667 12.0086 n = 40 Population 25 and over within 0.6068424 5.928561 9.50456 T = 3.575 Fertility overall 3.671114 1.821308 0.9483333 7.3 N = 226 Rate between 1.713694 1.080378 6.82275 n = 59 within 0.5294255 0.8369716 5.638472 T-bar = 3.83051 School Resources: Real Gov’t Current overall 2502.147 2130.809 62.2 9744.4 N = 151 Education expenditure between 1910.119 62.2 6596.05 n = 54 Per pupil – Primary (PPP)
within 1033.885 -437.9136 5750.487 T = 2.7963
Real Govt Current overall 17.5346 8.011231 3 50.6 N = 216 Education expenditure between 7.51456 3 36.35 n = 58 Per pupil –Primary (% of GDP per capita
within 4.069974 -3.798735 36.4346 T-bar = 3.72414

127
Pupil-teacher Ratio overall 19.05627 8.090012 6.1 60.6 N = 234 Primary School between 7.082374 8.7 47.65714 n = 61 within 2.662903 9.099125 31.99912 T-bar = 3.83607 School Days (no.) overall 194.0311 14.11755 165 234 N = 161 between 14.71394 165 234 n = 45 within 0 194.0311 194.0311 T = 3.57778 Real Primary Teacher overall 9.733677 0.812774 6.909753 11.11033 N = 108 Salary (PPP)- Log between 0.8050884 7.726287 10.82472 n = 41 within 0.2541529 8.917142 10.55021 T = 2.63415 Decentralization Indicators: Expenditure overall 21.57483 16.35571 1.521749 77.98507 N = 410 Decentralization - All between 15.761 1.533219 61.84563 n = 102 within 3.94572 -13.95999 43.30912 T-bar = 4.01961 Education Expenditure overall 50.89109 32.42615 0 100 N = 239 Decentralization - between 32.04365 0 94.70226 n = 62 Sub-national within 7.324805 22.18322 84.86884 T-bar = 3.85484 Education Expenditure overall 21.57483 16.35571 1.521749 77.98507 N = 89 Decentralization - between 15.761 1.533219 61.84563 n = 30 Local within 3.94572 -13.95999 43.30912 T-bar = 2.96667 Decision-making overall 71.30822 26.81503 0 100 N = 73 Sub-national level- between 26.11101 0 100 n = 39 All functions within 13.85031 13.97489 121.3082 T-bar = 1.87179 Decision-making overall 16.10959 23.11659 0 91 N = 73 Intermediate level- between 21.43068 0 91 n = 39 All functions within 13.37182 -8.557078 64.10959 T-bar = 1.87179 Decision-making overall 18.71918 21.59362 0 71 N = 73 Local level- between 16.88965 0 70 n = 39 All functions within 14.67747 -15.61416 66.05251 T-bar = 1.87179 Decision-making overall 38.17808 19.66338 0 100 N = 73 School level- between 16.73329 0 79 n = 39 All functions within 11.87278 8.511416 74.51142 T-bar = 1.87179 Other Control Variables: Population Density overall 190.6309 712.8033 1.410518 6502.879 N = 229 between 799.7825 1.492294 6156.897 n = 61 within 42.82184 -282.7153 536.6128 T-bar = 3.7541 Rule of Law overall 4.704951 1.589269 0.44 6 N = 138 between 1.412164 1.25 6 n = 39 within 0.6113412 2.378951 6.938951 T = 3.53846 Corruption Indices overall 4.502286 1.468823 0.02 6 N = 138 between 1.398543 1.353333 6 n = 39 within 0.3860097 3.008432 5.718432 T = 3.53846 Freedom overall 2.04108 1.438384 1 6.7 N = 145 between 1.494367 1 6.7 n = 40 within 0.3940374 0.3410806 4.52108 T = 3.625

128
Table C.3 List of All Sample Countries Latin America & Caribbean Argentina Bolivia Chile Ecuador Mexico Panama Paraguay East Asia & Pacific China Indonesia Mongolia Thailand Europe and Central Asia Albania Azerbaijan Belarus Bulgaria Croatia Czech Republic Estonia Georgia Hungary Kazakhstan Kyrgyz Republic Latvia Lithuania Moldova Poland Romania Russian Federation Slovak Republic Slovenia Tajikistan Turkey Ukraine
South Asia India Sub-Saharan Africa Mauritius Zimbawe OECD Australia Austria Belgium Canada Denmark Finland France Germany Greece Iceland Ireland Italy Japan Korea, Rep. Luxembourg Netherlands New Zealand Norway Portugal Spain Sweden Switzerland United Kingdom United States Non-OECD Greenland Israel

129
Table C.4 List of Sub-Sample of Countries OECD Australia Austria Belgium Denmark Finland France Germany Greece Iceland Ireland Italy Japan Korea, Rep. Luxembourg Netherlands New Zealand Norway Portugal Spain Sweden Switzerland United Kingdom United States
Latin America & Caribbean Argentina Chile Mexico Paraguay Uruguay Middle East & North Africa Jordan South Asia India Europe and Central Asia Czech Republic Hungary Slovak Republic Turkey East Asia & Pacific China Indonesia Malaysia Philippines Thailand

130
Table C.5 Correlation Matrix
(a) (b) (c) (d) (e) (f) (g) (h) (i) (j) (k) (l) (m) (n) (o) (a) 1
(b) 0.51 1 (c) -0.89 -0.07 1 (d) -0.74 -0.44 0.69 1 (e) -0.41 -0.48 0.35 0.46 1 (f) 0.67 -0.08 -0.82 -0.76 0.06 1 (g) 0.18 -0.75 -0.59 0.00 0.18 0.54 1 (h) -0.34 0.51 0.64 0.42 -0.35 -0.90 -0.77 1 (i) 0.00 0.66 0.35 0.29 -0.45 -0.73 -0.68 0.93 1 (j) -0.71 -0.36 0.66 0.96 0.19 -0.85 -0.04 0.57 0.44 1 (k) 0.44 0.88 -0.09 -0.28 -0.76 -0.29 -0.62 0.67 0.83 -0.09 1 (l) 0.67 0.16 -0.66 -0.06 -0.37 0.17 0.41 -0.06 0.28 0.02 0.37 1
(m) -0.49 -0.44 0.40 0.92 0.22 -0.66 0.21 0.37 0.34 0.94 -0.16 0.30 1 (n) 0.49 0.24 -0.42 -0.72 0.27 0.80 0.00 -0.62 -0.54 -0.89 -0.17 -0.23 -0.84 1 (o) -0.89 -0.35 0.88 0.94 0.38 -0.87 -0.24 0.57 0.33 0.92 -0.22 -0.35 0.77 -0.70 1
Variables Definition
(a) Dropout rate (f) Education decentralization (k) Average years of schooling of adults (b) Repetition rate (g) Fiscal Decentralization (l) Per pupil spending (% GDP per capita) (c) Net enrolment rate (h) Fertility rate (m) Log of GDP per capita (d) Completion rate (i) Pupil-Teacher ratio (n) Infant mortality (e) Science Test Scores (j) # school days (o) Population Density

131
Table C.6 International comparative tests of student learning Date of Testing Sponsor Study
Age Groups tested No. of countries
1964 IEA First International Mathematics Study (FIMS) 13, 17/18 12
1970-71 IEA First International Science Study (FISS) 10, 14, 17/18 19
1980-82 IEA Second International Mathematics Study (SIMSS) 13, 17/18 21
1984 IEA Second International Science Study (SISS) 10, 14, 17/18 23
1988 IEA
International Association for the Evaluation of Educational Progress first study (IAEP 1): Mathematics and Science 13 6
1991 IEA
International Association for the Evaluation of Educational Progress first study (IAEP 2): Mathematics and Science 9, 13 20
1995 IEA The Third International Mathematics and Science Study (TIMSS-95) 9, 13, 17/18 46
1999 IEA Trends in International Mathematics and Science Study (TIMSS-R 99) 13, 14 38
2000 OECD Program for International Student Assessment (PISA) Reading, Mathematics and Science 15 32
2001 IEA Progress in International Reading Literacy (PIRLS) 9, 10 35
2003 IEA Trends in International Mathematics and Science Study (TIMSS-03) 8, 13 N/A
2003, 2006 PISA Program for International Student Assessment (PISA) Reading, Mathematics and Science 15 32

Figure C.3 Partial correlation between Dropout Rates and Education Decentralization
Figure C.2 Partial Correlation between Repetition Rates and Education Decentralization
Figure C.1 Partial Correlation between Completion Rates and Education Decentralization
132
6575
8595
1 11 21 31 41 51 61 71 81 91deceducv
compl_prim 95% CIFitted values
510
150
1 11 21 31 41 51 61 71 81 91 101deceducv
reppri 95% CIFitted values
1020
3040
50
1 11 21 31 41 51 61 71 81 91 101deceducv
drop 95% CIFitted values

133
Figure C.4 Partial Correlation between Net Enrollment Rates and Education Decentralization
7080
9010
0
1 11 21 31 41 51 61 71 81 91deceducv
net_enrol_prim 95% CIFitted values
Figure C.5 Partial Correlation between Science Test Scores in Primary Level and Education Decentralization
4555
65
1 11 21 31 41 51 61 71 81 91deceducv
test 10sci_prim 95% CIFitted values

134
APPENDIX D
TWO-STAGE LEAST-SQUARES ESTIMATION
An instrumental variable (IV, or instrument) can be used in regression analysis to
produce a consistent estimator when the explanatory variables (covariates) are correlated
with the error terms. This can be caused by endogeneity, by omitted covariates, or by
measurement errors in the covariates. In this situation, ordinary linear regression
produces biased and inconsistent estimates. However, if an instrument is available,
consistent estimates may still be obtained. An instrument is a variable that does not itself
belong in the regression, that is correlated with the suspect explanatory variable, and that
is uncorrelated with the error term.
The instrument must be correlated with the model's predicting (endogenous
explanatory) variable. The instrument cannot be correlated with the error term in the
second stage model (that is, the instrument cannot suffer from the same problem as the
original predicting variable). The instrument must act on the outcome only through the
predicting variable, not directly.
An instrumental variable is one that is correlated with the independent variable
but not with the error term. Suppose X is the T x K matrix of explanatory variables
resulting from T observations on K variables. Let Z be a T x K matrix of instruments.
Then,
εβεββ '1''1''1' )()()()( ZXZXZXZYZXZIV
−−−∧
+=+==

135
One computational method often used for implementing the technique is two-
stage least-squares (2SLS). Under the 2SLS approach, in a first stage, each endogenous
covariate (predictor variable) is regressed on all valid instruments, including the full set
of exogenous covariates in the main regression. Since the instruments are exogenous,
these approximations of the endogenous covariates will not be correlated with the error
term. So, intuitively they provide a way to analyze the relationship between the outcome
variable and the endogenous covariates. In the second stage, the regression of interest is
estimated as usual, except that in this each endogenous covariate is replaced with its
approximation estimated in the first stage. The slope estimator thus obtained is consistent.
Instrumenting for Education Decentralization
In order to correct for potential endogeneity bias, we instrument for education
decentralization using a dummy variable for colonial heritage, ethnic fractionalization,
total population, and an indicator of governance. Colonial heritage, whether a country is a
former British colony, is considered to be a good predictor of fiscal authority and
organization (Diaz-Cayeros 2004; La Porta et al. 1998). The use of ethnic
fractionalization follows from the link between the existence of multiple cultural,
linguistic, and/or religious identities and the use of decentralized arrangements to
accommodate the needs and wants of the population (Amoretti and Bermeo 2004; Linz
1999; Stepan 1999). At the same time, larger countries may adopt more decentralized
systems to better cater preferences of their citizens and to bring government closer to the

136
people (Fisman and Gatti 2000). Furthermore, there is a link between good governance
and decentralization, where good governance is a good predictor of decentralization.
Using the above instrumental variables for education decentralization, we run a
reduced form model including all exogenous variables in our main regression. Table D.1
below, reports estimation results where the F test on instruments is the test statistic on the
joint significance of instruments in the first-stage regression. The instruments perform
well; the F-statistic of their joint significance in the first stage regression is 2.97 and is
highly significant.

137
Table D.1 Instrumental Variables and Education Decentralization Pooled LS Log Total Population 2.773*
(1.669)
Dummy for Former British -16.072* Colony
(8.414)
Ethnic Fractionalization 29.987**
(15.010)
Index of Freedom -5.504*
(3.179)
Pupil-Teacher Ratio 2.762***
(0.598)
Population Density -0.010
(0.020)
Avg. years of Schooling 1.342 (Adults >25)
(3.343)
Ratio of per pupil 0.517 Exp. to GDP p.c.
(0.474)
# of school days 0.867***
(0.240)
Log GDP per capita 29.154***
(8.358)
Fertility Rate -0.087 (1.718) F-Test of Instruments 2.97
[0.0226] Observations 126 R-squared 0.35 Note: Standard errors in parentheses . F-test of instruments, p-value in brackets. * significant at 10%; ** significant at 5%; *** significant at 1%

138
APPENDIX E
ESTIMATION RESULTS
Table E.1 Pooled LS Estimates. Dependent Variable: Current Expenditures per Pupil at the Primary Level Pooled LS
Education Decentralization 5.990* (Expenditure) (3.383)
Net Enrollment Rate – Primary 19.806 (23.494)
Population Density 0.463*** (0.056)
Log GDP per capita 1,876.082*** (167.676)
Observations 117 R-squared 0.63 Note: Robust standard errors in parentheses * significant at 10%; ** significant at 5%; *** significant at 1%.

139
Table E.2 Pooled LS Estimates. Dependent Variable: Repetition Rate Pooled
LS Pooled
LS Pooled
LS Educ. Decent 0.028*** -0.419** (Expenditure) (0.009)
(0.190)
Fiscal Decent. 0.057*** (All Expenditure) (0.020)
Fertility Rate -0.029 -0.169* 0.292* (0.139)
(0.100) (0.158)
Pupil-Teacher 0.044 -0.054 Ratio (0.046)
(0.048)
# of school days 0.013 0.007 0.055*** (0.024)
(0.021) (0.018)
Pop. Density -0.001 0.005* (0.003)
(0.003)
Ratio of per pupil -0.124** 0.437*** 0.182*** Exp. to GDP p.c. (0.054)
(0.094) (0.048)
Adult Avg. years 0.889** of schooling (0.420)
Decent. x adult -0.004 Schooling (0.006)
Decent. x educ 0.004*** Spending (0.001)
Log GDP p.c. -0.860 (1.544)
Decent x 0.033 GDP p.c. (0.020)
Infant Mortality 0.034 0.083*** (0.075)
(0.013)
Observations 108 108 250 R-squared 0.34 0.55 0.46 Note: Robust standard errors in parentheses * significant at 10%; ** significant at 5%; *** significant at 1%.

140
Table E.3 Pooled LS Estimates. Dependent Variable: Completion Rate Pooled LS Pooled LS
Educ. Decent 0.595** (Expenditure) (0.291)
Fiscal Decent. 0.194** (Expenditure) (0.087)
Log GDP p.c. 6.210*** (1.655)
Infant Mortality -0.190** (0.084)
Pupil-Teacher -0.598*** Ratio (0.223)
Ratio of per pupil -0.232 -0.386** Exp. to GDP p/c (0.141)
(0.154)
Fertility Rate -0.174 (0.516)
Decent x log GDP -0.064* p.c. (0.033)
Observations 81 146 R-squared 0.20 0.41 Note: Robust standard errors in parentheses * significant at 10%; ** significant at 5%; *** significant at 1%.

141
Table E.4 Pooled LS Estimates. Dependent Variable: Science Test Scores Pooled
LS Pooled
LS Pooled
LS Pooled
LS Pooled
LS Educ. Decent 0.051** 0.056*** 0.071** 0.053** (Expenditure) (0.021) (0.020) (0.027) (0.020)
Fiscal Decent 0.132** (Expenditure) (0.059)
Ratio of per pupil -0.321 -0.313** -0.314** -0.333** -0.150 Exp. to GDP p/c (0.198)
(0.128) (0.126) (0.126) (0.225)
Pupil-Teacher -0.004 -0.363 Ratio (0.205)
(0.298)
Fertility Rate 0.042 0.595 (0.310)
(0.376)
Pop. Density -0.005*** -0.005*** (0.001) (0.001)
Infant -0.015 Mortality (0.108)
Adult Avg. years 0.181 of schooling (0.628)
Log GDP p.c. 1.443 2.926*** (1.055)
(1.303)
Observations 41 43 29 44 39 R-squared 0.24 0.25 0.28 0.22 0.36 Note: Robust standard errors in parentheses * significant at 10%; ** significant at 5%; *** significant at 1%.

REFERENCES
Amoretti, Ugo M. and Nancy Gina Bermeo. 2004. Federalism and Territorial Cleavages.
Baltimore, M.D.: Johns Hopkins University Press.
Arredondo, Armando and Emanuel Orozco. 2006. Effects of Health Decentralization, Financing and Governance in Mexico. Journal of Public Health 40, no. 1: 152-60.
Atkinson, A. 2005. Atkinson review: Final report. Measurement of Government Output and Productivity for Government Accounts: Palgrave, MacMillan, Basingstoke.
Bahl, Roy W. and Johannes F. Linn. 1992. Urban Public Finance in Developing Countries. Oxford; New York; Toronto and Melbourne: Oxford University Press for the World Bank.
Bahl, Roy W. and Shyam Nath. 1986. Public Expenditure Decentralization in Developing Countries. Government and Policy 4: 405-18.
Baltagi, Badi H. 1995. Econometric Analysis of Panel Data. Chichester ; New York: Wiley.
Behrman, Jere R. and Elizabeth M. King. 2001. Household Schooling Behaviors and Decentralization. Economics of Education Review 20, no. 4: 321-41.
Bird, Richard. 2000. Rationales and Forms of Decentralization. Paper Presented at the Rotman School of Management, University of Toronto.
Birdsall, N. 1993. Social Development in Economic Development. Policy Research Working Paper Series Working Paper No. 1123: The World Bank.
Brennan, Geoffrey and James M. Buchanan. 1980. The Power to Tax: Analytical Foundations of a Fiscal Constitution. Cambridge: Cambridge University Press.
Bryk, Anthony S. 1998. Charting Chicago School Reform : Democratic Localism as a Lever for Change. Boulder, Colo.: Westview Press.
Burki, Shahid Javed, Guillermo E. Perry, and William R. Dillinger. 1999. Beyond the Center: Decentralizing the State. Washington, D.C.: World Bank.
Davoodi, Hamid and Heng-fu Zou. 1998. Fiscal Decentralization and Economic Growth: A Cross-Country Study. Journal of Urban Economics 43, no. 2: 244-57.
Deny, Kevin J., Colm P. Harmon, and Sandra Redmon. 2000. Functional Literacy, Educational Attainment and Earnings - Evidence from the International Literacy Survey. The Institute for Fiscal Studies, Working Paper 00/09.
142

143
Diaz-Cayeros, Alberto. 2004. The Centralization of Fiscal Authority: An Empirical Investigation. Working Paper: Stanford University.
Dillinger, William R. and netLibrary Inc. Decentralization and its Implications for Urban Service Delivery. Published for the Urban Management Programme by The World Bank., Washington, D.C.
Elmore, Richard, B. Fuller, and G. Orfield. 1996. Who Chooses, Who Looses? Culture, Institutions, and the Unequal Effects of School Choice. New York: Teacher's College Press, Columbia University.
Filmer, Deon. 2002. Autonomy, Participation, and Learning in Argentine Schools: Findings and their Implications for Decentralization: The World Bank, Policy Research Working Paper Series: 2766.
Fiske, Edward B. Decentralization of Education: Politics and Consensus. World Bank,, Washington, D.C.
Fisman, Raymond J. and Roberta Gatti. 2000. Decentralization and Corruption: Evidence Across Countries. World Bank Policy Research Working Paper No. 2290.
Galiani, Sebastian and Ernesto Schargrodsky. 2002. Evaluating the Impact of School Decentralization on Educational Quality. Economia: Journal of the Latin American and Caribbean Economic Association 2, no. 2: 275-302.
Gaynor, Cathy. 1998. Education Decentralization: Teacher Management. Washington D.C.: The World Bank.
Godwin, R. Kenneth and Frank R. Kemerer. 2002. School Choice Tradeoffs: Liberty, Equity, and Diversity. Austin: University of Texas Press.
Guess, George M., William Loehr, and Jorge Martinez-Vazquez. 1997. Fiscal Decentralization: A Methodology for Case Studies: Briefing Note for CAER Consulting Assistance on Economic Reform II. Discussion Papers, No. 3.
Hanson, Mark. 1997. Education Decentralization: Issues and Challenges. Partnership for the Educational Revitalization in the Americas No. 9.
Hanson, Mark E. and Carolyn Ulrich. 1994. Democracy, Decentralization and School-Based management in Spain: University of California - Riverside.
Hanushek, Eric A. 1986. The Economics of Schooling: Production and Efficiency in Public Schools. Journal of Economic Literature 24: 1141-77.
________. 1995. Interpreting Recent Research on Schooling in Developing Countries. World Bank Research Observer 10, no. 2: 227-46.

144
________. 2003. The Failure of Input-Based Schooling Policies. Economic Journal 113, no. 485: 98.
Hanushek, Eric A. and Dennis D. Kimko. 2000. Schooling, Labor-Force Quality, and the Growth of Nations. American Economic Review 90, no. 5: 1184-1208.
Hanushek, Eric A. and Steven G. Rivkin. 2003. Does Public School Competition Affect Teacher Quality? In The economics of school choice:23-47. Chicago and London: University of Chicago Press.
Hausman, Jerry A. 1978. Specification Tests in Econometrics. Econometrica 46, no. 6: 1251-71.
Heyneman, S. and W. Loxley. 1983. The Effect of Primary School Quality on Academic Achievement Across Twenty-Nine High and Low-Income Countries. American Journal of Sociology 88: 1162-94.
Holmes, George M., Jeff DeSimone, and Nicholas G. Rupp. 2003. Does School Choice Increase School Quality?: National Bureau of Economic Research, Inc, NBER Working Papers: 9683.
Hoxby, Caroline M. 2000. Does Competition Among Public Schools Benefit Students and Taxpayers? American Economic Review 90, no. 5: 1209-38.
Hoxby, Caroline Minter. 1994. Do Private Schools Provide Competition for Public Schools?: National Bureau of Economic Research, Inc, NBER Working Papers: 4978.
Hsiao, C. 1986. Analysis of Panel Data. New York: Cambridge University Press.
Jacobson, S.L. 1998. The Effects of Pay Incentives on Teacher Absenteeism. The Journal of Human Resources 24, no. 2: 280-7.
James, Estelle, Elizabeth M. King, and Ace Suryadi. 1996. Finance, Management, and Costs of Public and Private Schools in Indonesia. Economics of Education Review 15, no. 4: 387-98.
Jimenez, Emmanuel and Vicente Paqueo. 1996. Do Local Contributions Affect the Efficiency of Public Primary Schools? Economics of Education Review 15, no. 4: 377-86.
Jimenez, Emmanuel and Yasuyuki Sawada. 1999. Do Community-Managed Schools Work? An Evaluation of El Salvador's Educo program. World Bank Economic Review 13, no. 3: 415-41.
Kagundu, Paul. 2006. The Quality of Governance, Composition of Public Expenditures, and Economic Growth: An Empirical Analysis, Georgia State University.

145
Kaufman, Daniel and Aart Kraay. 2002. Governance Indicators, Aid Allocation, and the Millennium Challenge account: Unpublished draft for discussion, World Bank, Washington, D.C.
King, Elizabeth M. and Berk Ozler. 2000. What's Decentralization Got to Do with Learning? Endogenous School Quality and Student Performance in Nicaragua: The World Bank, Development Research Group.
La Porta, Rafael, Florencio Lopez-de-Silanes, Andrei Shleifer, and Robert Vishny. 1998. The Quality of Government. Journal of Law, Economics, and Organization 15: 222-279.
Lange, David. 1988. Tomorrow's schools: The Reform of Education Administration in New Zealand. New Zealand: Wellington, Government Publisher.
Lee, Jong-Wha and Robert J. Barro. 2001. Schooling Quality in a Cross-Section of Countries. Economica 68, no. 272: 465-88.
Linz, Juan J. 1999. Democracy, Multinationalism and Federalism. In Demokratie in Ost und West, ed. W. Bush and A. Merkel:382-401. Frankfurt am Main: Suhrkamp.
Lobo, Thereza, André Guedes, Ana Lucia Amaral, and Robert Walker. 1995. Decentralized Management of Education in Minas Gerais, brazil. In World Bank Seminar on Education Decentralization. Washington D.C.: World Bank.
Lockheed, M.E. and Q. Zhao. 1993. The Empty Opportunity: Local Control and Secondary School Achievement in the Philippines. International Journal of Education Development 13, no. 1: 45-62.
Mahal, A., V. Srivasta, and D. Sanan. 2000. Decentralization and Public Sector Delivery of Health and Education Services: Evidence from Rural India. In Governance, Decentralization and Reform in China, India and Russia, ed. J. Dethier, 25:236-277. Boston, Dordrecht, London: Kluwer Academic Publishers.
Martinez-Vazquez, Jorge and Robert M. McNab. 2003. Fiscal Decentralization, Macrostability and growth. In Working Paper No. 11/03: Instituto de Estudios Fiscales.
McGinn, N. and T. Welsh. 1999. Decentralization of Education: Why, When, What and How? Edited by Fundamentals of Educational Planning Series: UNESCO.
Meuret, Denis., Jacques Prod'hom, and Eugene Stocker. 1995. Decision-Making in 14 OECD Education Systems. Indicators of Education Systems. Paris ; [Washington, D.C.]: Organisation for Economic Co-operation and Development.
Oates, Wallace E. 1972. Fiscal Federalism. New York,: Harcourt Brace Jovanovich.

146
Olson, Mancur. 1965. The Logic of Collective Action; Public Goods and the Theory of Groups. Harvard economic studies ; v. 124. Cambridge, Mass.,: Harvard University Press.
Organisation for Economic Co-operation and Development. 1998. Education at a Glance: OECD Indicators 1998. Paris and Washington D.C.: OECD.
________. 2004. Education at a glance: OECD Indicators 2004. Paris and Washington, D.C.: OECD.
Otsuka, Keijiro, Hiroyuki Chuma, and Yujiro Hayami. 1992. Land and Labor Contracts in Agrarian Economies: Theories and Facts. Journal of Economic Literature 30, no. 4: 1965-2018.
Ozler, Berk. 2001. Decentralization and Student Achievement: The Case of Nicaragua's School Autonomy Reform. Ph.D.
Parry, Taryn Rounds. 1997a. Decentralization and Privatization: Education Policy in Chile. Journal of Public Policy 17, no. 1: 107-33.
________. 1997b. Theory Meets Reality in the Education Voucher Debate: Some Evidence from Chile. Education Economics 5, no. 3: 307-31.
Patrinos, H.A. 2000. Market Forces in Education. European Journal of Education 35, no. 1: 61-80.
Prawda, Juan. 1993a. Education Decentralization in Latin America: Lessons Learned. International Journal of Educational Development 13, no. 3: 253-64.
________. 1993b. Mexico's Education Decentralization Process. World Bank Conference on Decentralization of Education Systems January 12-13.
Pritchett, Lant and Deon Filmer. 1997. What Educational Production Functions Really Show?. A Positive Theory of Education Spending. Development Research Group Working Paper No. 1795: The World Bank.
Prud'homme, Remy. 1995. The Dangers of Decentralization. World Bank Research Observer 10, no. 2: 201-20.
Psacharopoulos, G. and M. Woodhall. 1985. Education for Development: An Analysis of Investment Choices. Oxford: Oxford University Press for the World Bank.
Ranis, G., F. Stewart, and A. Ramirez. 2000. Economic Growth and Human Development. World Development 28, no. 2: 197-219.
Ritzen, Jozef M. M., Jan van Dommelen, and Frans J. de Vijlder. 1997. School Finance and School Choice in the Netherlands. Economics of Education Review 16, no. 3: 329-35.

147
Robalino, David A., Oscar F. Picazo, and Albertus Voetberg. 2001. Does Fiscal Decentralization Improve Health Outputs? Evidence from a Cross-Country Analysis: The World Bank, Country Economics Department Paper Series No. 2565.
Robertson, Peter J. and Kerri L. Briggs. 1998. Improving Schools Through School-Based Management: An Examination of the Process of Change. School Effectiveness and School Improvement 9, no. 1: 28-57.
Rondinelli, D.A., J.R. Nellis, and G.S. Cheema. 1984. Decentralization in Developing Countries: A Review of Recent Experience: The World Bank, Staff Working Paper No. 581.
Sawada, Yasuyuki. 2000. Community Participation, Teacher Effort, and Education Outcomes: The Case of El Salvador's Educo Program: The Davidson Institute Working Paper Series No. 307, University of Michigan Business School.
Stepan, Alfred. 1999. Toward a New Comparative Analysis of Democracy and Federalism: 'demos constraining' and 'demos enabling' federations Dados 42, no. 2.
Stevans, Lonnie K. and David N. Sessions. 2000. Private/Public School Choice and Student Performance Revisited. Education Economics 8, no. 2: 169-84.
Tanzi, Vito. 1996. Fiscal Federalism and Decentralization: A Review of Some Efficiency and Macroeconomic Aspects. In Annual World Bank Conference on Development Economics, 1995:295-316. Washington, D.C.: World Bank.
Thomas, Kathleen M. 2001. Does the Centralization of Public Education Cause a Decline in Per Pupil Spending?: The University of Texas at Dallas, Research Scholar Working Paper.
Tiebout, Charles M. 1956. A Pure Theory of Local Expenditures. The Journal of Political Economy 64, no. 5: 416-424.
UNESCO. 2003. From Targets to Reform: National Strategies in Action. In Education For All Global Monitoring Report 2003/4: Gender and Education For All: The Leap to Equality, ed. Scientific and Cultural Organization United Nations Educational:416. New York: UNESCO Publishing.
________. 2005. Decentralization in Education: National Policies and Practices. Education Policies and Strategies. Paris: United Nations Educational, Scientific,and Cultural Organization.
Vegas, Emiliana. 1999. School Choice, Student Performance, and Teacher and School Characteristics: The Chilean Case: The World Bank, Policy Research Working Paper Series: 2833.

148
Winkler, Donald R. and Alec Ian Gershberg. 2000. Education Decentralization in Latin America: The Effects on the Quality of Schooling. In Annual World Bank Conference on Development in Latin America and the Caribbean, 1999: Decentralization and Accountability of the Public Sector: Proceedings of a conference held in Valdivia, Chile, June 20-22, 1999:203-25. Washington, D.C.: World Bank.
________. 2004. Education Decentralization in Africa: A Review of Recent Policy and Practice. In Building state capacity in Africa: New Approaches, Emerging Lessons, ed. Sahr John Kpundeh and Brian Levy 377. Washington D.C.: World Bank Publications.
Wong, K. 1998. Transforming Urban School Systems: Integrated Governance in Chicago and Birmingham (U.K.). In Cross-Atlantic Conference - A Working Conference on School Reform in Chicago and Birmingham.
Wooldridge, Jeffrey M. 2002. Econometric Analysis of Cross Section and Panel Data. Cambridge and London: MIT Press.
World Bank. 1995a. Development in Practice: Priorities and Strategies for Education. Washington D.C.: World Bank.
________. 1995b. Staff appraisal Report: El Salvador Basic Education Modernization Project: IBRD Report: 14129-ES.
________. 2000. Decentralization & School-Based Management Resource Kit: The World Bank. Education Reform & Management Thematic Group, HDNED.
________. 2003. World Development Report 2004: Making Services Work for Poor People. Washington, D.C.: Oxford University Press.
VITA
Eunice Heredia-Ortíz was born on May 13, 1978 in Santa Cruz, Bolivia. She
received a Bachelor of Arts and a Bachelor of Science degree from East Stroudsburg
University, Pennsylvania in 2000; a Master’s degree in Economics in 2002 and her Ph.D.
in Economics in December 2006 from Georgia State University, Atlanta, Georgia. While
at Georgia State University, Eunice worked as a Graduate Research Assistant and
Instructor in the Department of Economics (August 1999–December 2004). She was the
recipient of the 2003 Theodore C. Boyden Excellence in Teaching Award, and for her
contributions in the public finance field she was the recipient of the 2004 E. D. Jack
Dunn Fellowship.
Since December 2004, Eunice has served as a Research Associate with the
International Studies Program at the Andrew Young School of Policy Studies of Georgia
State University. Eunice was co-author of numerous articles and reports on
intergovernmental fiscal relations, such as a report on fiscal reform for the Government
of India and a report on Poverty and Fiscal Decentralization for the United States Agency
for International Development. Additionally, she has contributed to different research
projects involving intergovernmental fiscal relations, fiscal policy reform, and fiscal
management for the World Bank and United Nations Development Program. She has co-
facilitated various training courses on fiscal decentralization and decentralized public
education for government officials from around the world, including in-country trainings
in Bangladesh and East Timor.
Her research interests include public finance, public policy, education policy,
intergovernmental relations and sub-national government performance.
149