The Impact of Dental Hygiene Scope of Practice in 2016 on ... · • Important to assess the impact...
16
The Impact of Dental Hygiene Scope of Practice in 2016 on a Population Oral Health Outcome: A Multilevel Logistic Modeling Analysis Presented by: Margaret Langelier, MSHSA Center for Health Workforce Studies School of Public Health | University at Albany, SUNY [Email address] June 26, 2017 AcademyHealth Annual Research Meeting Hyatt Regency, New Orleans, LA
Transcript of The Impact of Dental Hygiene Scope of Practice in 2016 on ... · • Important to assess the impact...

The Impact of Dental Hygiene Scope of Practice in 2016 on a Population Oral Health Outcome: A Multilevel Logistic Modeling Analysis
Presented by: Margaret Langelier, MSHSACenter for Health Workforce StudiesSchool of Public Health | University at Albany, SUNY[Email address]
June 26, 2017
AcademyHealth Annual Research Meeting
Hyatt Regency, New Orleans, LA
Acknowledgements
oralhealthworkforce.org 2
Co-authors of this work included Tracey Continelli, PhD, Simona Surdu, MD, PhD, Bridget Baker, MA, and Rachel Carter
Funding from:
Health Resources and Services Administration (HRSA grant U81HP27843)

Evidence of the Impacts of the Move to Value Based Care in Oral Health
• Increasing emphasis on improving oral health literacy
• Focus on prevention and early intervention in disease process
o New materials – glass ionomer sealants, silver diamine fluoride
• Integration of oral health services in primary care settings
• Movement to implement use of diagnostic codes to enable monitoring of quality and research activities
• Proliferation of electronic dental records and efforts to integrate the health record
• Consolidation into large group practices to increase efficiencies
• Recognition of importance of risk assessment to triage patients to most appropriate level of care
o To foster better use of existing capacity
o To accommodate uneven distribution of professionals
o To use capable technology to improve access and navigate patients to appropriate providers through applications of teledentistry
• Emergence of team based models of care delivery
• Initiatives to move oral health workforce into the wider community
o Mobile and portable dentistry in schools, long-term care, etc.
• Strategies for reducing oral disease burden have shifted from an emphasis on treatment of disease to a focus on prevention and management. This shift requires engagement of an inclusive oral health care team, especially dental hygienists
oralhealthworkforce.org3

The Impact of This Shifting Paradigm on the Oral Health and Health Workforce
• Expansion of roles for existing workforceo Expanded function dental assistants (DAs)o Public health dental hygienists (DHs)/Independent practice dental hygienistso Advanced dental therapists, dental hygiene therapists
• New workforce models• Community dental health coordinator
o Case finding, care coordination, community and patient education and engagemento Stand alone credential or add on for the DH or the DA
• Dental Therapistso Basic restorative services
• Engagement of professionals in medicine• Interprofessional education, Smiles for Life• Training primary care clinicians to screen and refer and medical assistants and nurses in
application of fluoride, especially for children• Movement to integration of services especially in safety net settings
• Progression in scope of practice has impacted professional roleso Change in perception of DHs from dental extender to preventive oral health specialisto Increasingly practicing in public health settings•
oralhealthworkforce.org 4
Dental Hygienists and the 2001 and 2014 Dental Hygiene Professional Practice Index
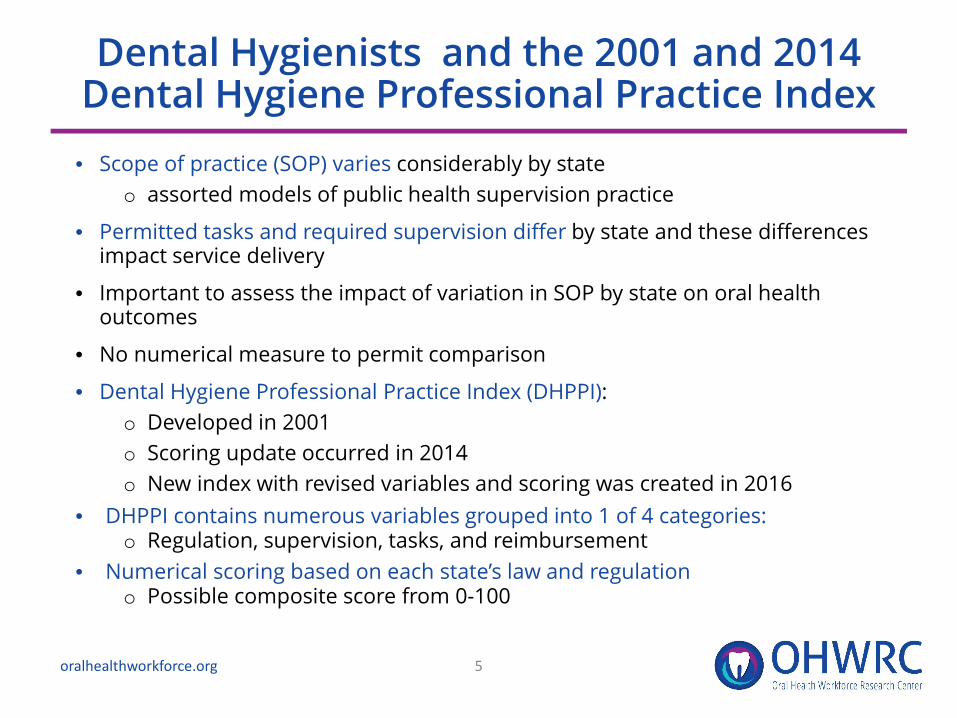
• Scope of practice (SOP) varies considerably by state o assorted models of public health supervision practice
• Permitted tasks and required supervision differ by state and these differences impact service delivery
• Important to assess the impact of variation in SOP by state on oral health outcomes
• No numerical measure to permit comparison
• Dental Hygiene Professional Practice Index (DHPPI):o Developed in 2001o Scoring update occurred in 2014 o New index with revised variables and scoring was created in 2016
• DHPPI contains numerous variables grouped into 1 of 4 categories:o Regulation, supervision, tasks, and reimbursement
• Numerical scoring based on each state’s law and regulationo Possible composite score from 0-100
oralhealthworkforce.org 5
The 2001 and 2014 DHPPI
oralhealthworkforce.org 6
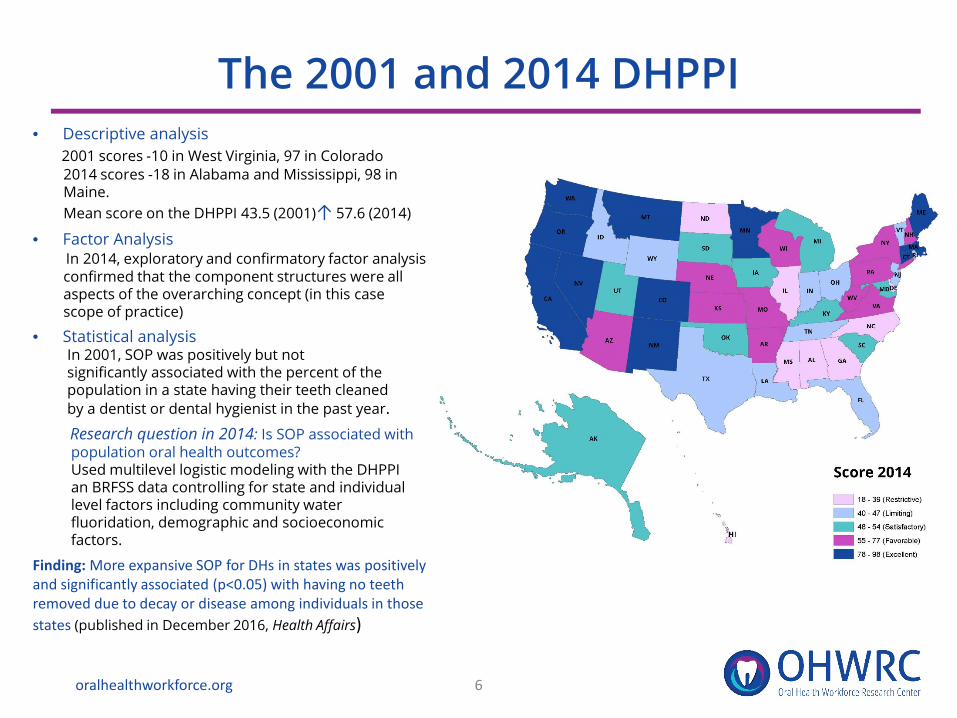
• Descriptive analysis2001 scores -10 in West Virginia, 97 in Colorado2014 scores -18 in Alabama and Mississippi, 98 inMaine. Mean score on the DHPPI 43.5 (2001)↑ 57.6 (2014)
• Factor AnalysisIn 2014, exploratory and confirmatory factor analysisconfirmed that the component structures were all aspects of the overarching concept (in this case scope of practice)
• Statistical analysisIn 2001, SOP was positively but not significantly associated with the percent of thepopulation in a state having their teeth cleanedby a dentist or dental hygienist in the past year.Research question in 2014: Is SOP associated withpopulation oral health outcomes?Used multilevel logistic modeling with the DHPPI an BRFSS data controlling for state and individual level factors including community water fluoridation, demographic and socioeconomic factors.
Finding: More expansive SOP for DHs in states was positively and significantly associated (p<0.05) with having no teeth removed due to decay or disease among individuals in those states (published in December 2016, Health Affairs)
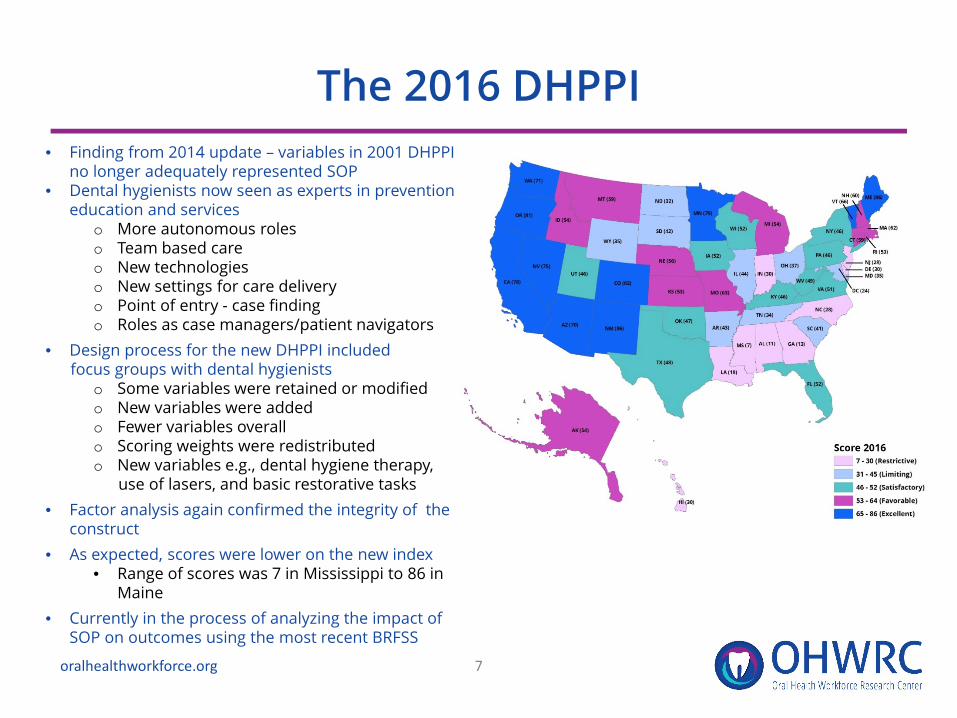
The 2016 DHPPI• Finding from 2014 update – variables in 2001 DHPPI
no longer adequately represented SOP• Dental hygienists now seen as experts in prevention
education and serviceso More autonomous roleso Team based careo New technologieso New settings for care delivery o Point of entry - case findingo Roles as case managers/patient navigators
• Design process for the new DHPPI included focus groups with dental hygienists
o Some variables were retained or modified o New variables were addedo Fewer variables overallo Scoring weights were redistributedo New variables e.g., dental hygiene therapy,
use of lasers, and basic restorative tasks• Factor analysis again confirmed the integrity of the
construct• As expected, scores were lower on the new index
• Range of scores was 7 in Mississippi to 86 in Maine
• Currently in the process of analyzing the impact of SOP on outcomes using the most recent BRFSS
oralhealthworkforce.org 7

Changing Scope of Practice for Dental Hygienists – 2001, 2014, 2016
oralhealthworkforce.org 8
High scoring states in 2014 were also high scoring on the new index (e.g., ME, CO, CA, WA, NM were each classified as excellent environments at each scoring)
Some states were innovators in expanding practice opportunities for dental hygienists (e.g., MN with advanced dental therapy, VT recently enabled dental therapy; the model requires professionals to also be dental hygienists)
Other states used a slower, more incremental approach to increasing scope of practice (e.g., IA classified as satisfactory at each scoring)
Some low scoring states were consistently low scoring (e.g., GA, MS, NC classified as restrictive at each scoring)
An Analysis of the 2016 SOP on Oral Health Outcomes in the Population
• Research question: Does the state level scope of practice for dental hygienists impact the oral health of adults in those states, controlling for all other relevant factors?
• Methods: o Exploratory and Confirmatory Factor Analysiso Least squares regression using Hierarchical Linear
Modeling
• Datao Dental Hygiene Professional Practice Index, 2016o Oral Health Surveillance Data - BRFSS
– Individual level data on having no teeth removed due to decay or disease
o State level data from a variety of sources
oralhealthworkforce.org 9
The Factor Analysis
oralhealthworkforce.org 10
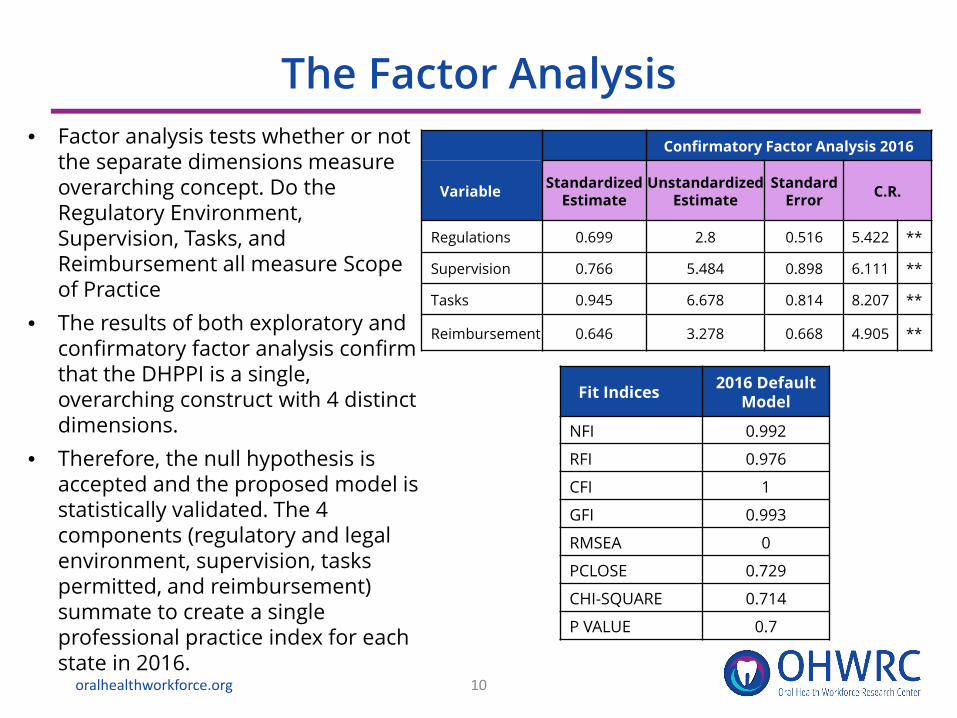
• Factor analysis tests whether or not the separate dimensions measure overarching concept. Do the Regulatory Environment, Supervision, Tasks, and Reimbursement all measure Scope of Practice
• The results of both exploratory and confirmatory factor analysis confirm that the DHPPI is a single, overarching construct with 4 distinct dimensions.
• Therefore, the null hypothesis is accepted and the proposed model is statistically validated. The 4 components (regulatory and legal environment, supervision, tasks permitted, and reimbursement) summate to create a single professional practice index for each state in 2016.
Confirmatory Factor Analysis 2016
Variable Standardized Estimate
Unstandardized Estimate
Standard Error C.R.
Regulations 0.699 2.8 0.516 5.422 **
Supervision 0.766 5.484 0.898 6.111 **
Tasks 0.945 6.678 0.814 8.207 **
Reimbursement 0.646 3.278 0.668 4.905 **
Fit Indices 2016 Default Model
NFI 0.992
RFI 0.976
CFI 1
GFI 0.993
RMSEA 0
PCLOSE 0.729
CHI-SQUARE 0.714
P VALUE 0.7
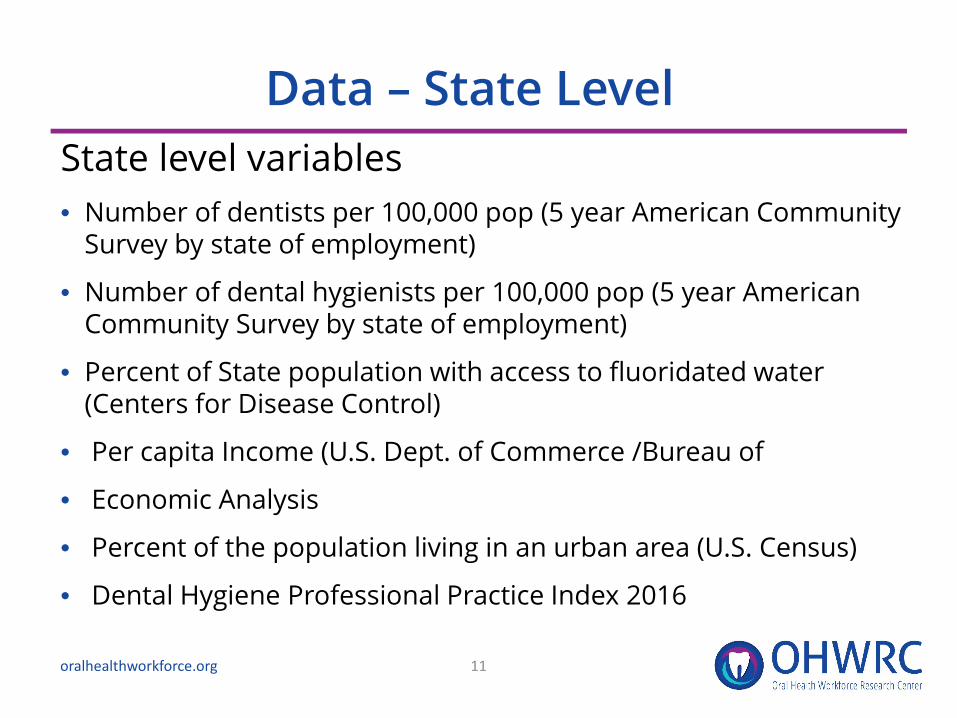
Data – State Level State level variables • Number of dentists per 100,000 pop (5 year American Community
Survey by state of employment)
• Number of dental hygienists per 100,000 pop (5 year American Community Survey by state of employment)
• Percent of State population with access to fluoridated water (Centers for Disease Control)
• Per capita Income (U.S. Dept. of Commerce /Bureau of
• Economic Analysis
• Percent of the population living in an urban area (U.S. Census)
• Dental Hygiene Professional Practice Index 2016
11oralhealthworkforce.org
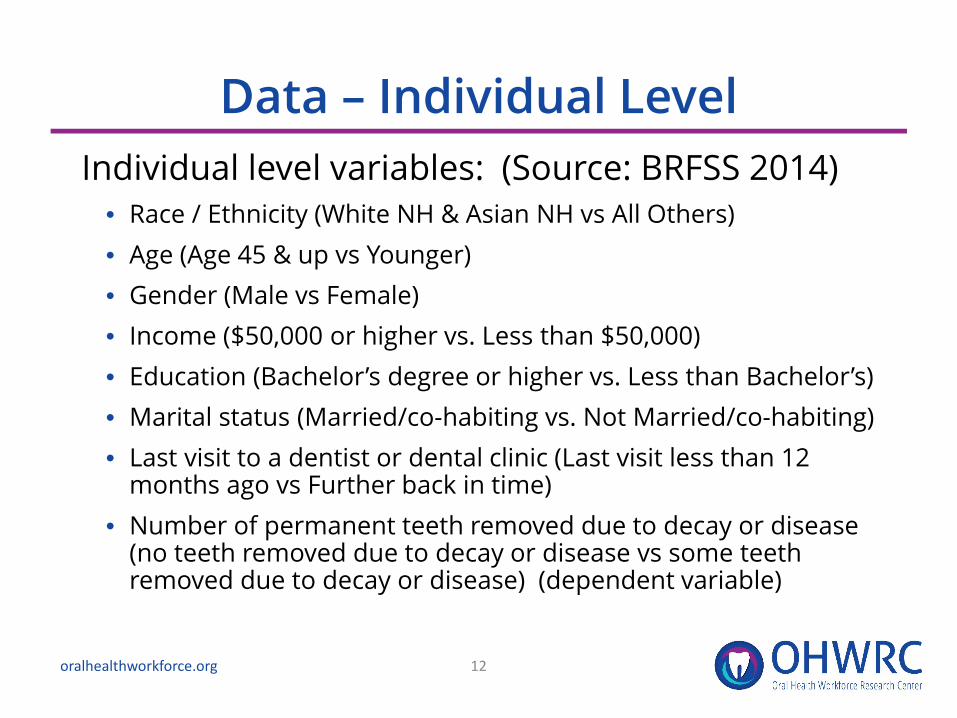
Data – Individual LevelIndividual level variables: (Source: BRFSS 2014)
• Race / Ethnicity (White NH & Asian NH vs All Others)• Age (Age 45 & up vs Younger)• Gender (Male vs Female)• Income ($50,000 or higher vs. Less than $50,000)• Education (Bachelor’s degree or higher vs. Less than Bachelor’s)• Marital status (Married/co-habiting vs. Not Married/co-habiting)• Last visit to a dentist or dental clinic (Last visit less than 12
months ago vs Further back in time)• Number of permanent teeth removed due to decay or disease
(no teeth removed due to decay or disease vs some teeth removed due to decay or disease) (dependent variable)
12oralhealthworkforce.org
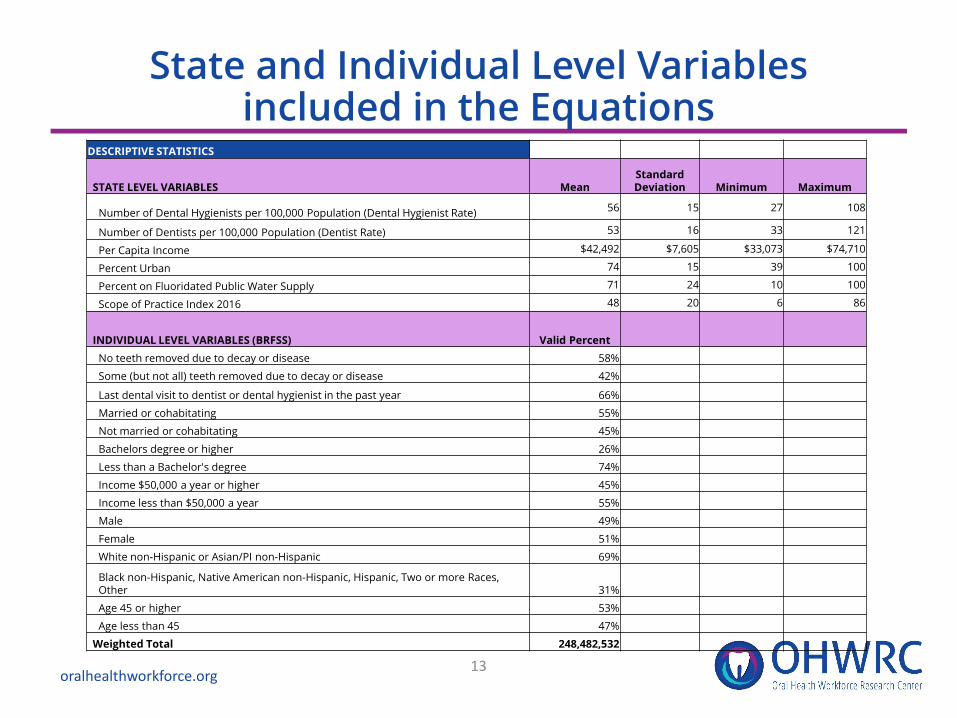
State and Individual Level Variables included in the Equations
13oralhealthworkforce.org
DESCRIPTIVE STATISTICS
STATE LEVEL VARIABLES MeanStandard Deviation Minimum Maximum
Number of Dental Hygienists per 100,000 Population (Dental Hygienist Rate) 56 15 27 108
Number of Dentists per 100,000 Population (Dentist Rate) 53 16 33 121
Per Capita Income $42,492 $7,605 $33,073 $74,710
Percent Urban 74 15 39 100
Percent on Fluoridated Public Water Supply 71 24 10 100
Scope of Practice Index 2016 48 20 6 86
INDIVIDUAL LEVEL VARIABLES (BRFSS) Valid PercentNo teeth removed due to decay or disease 58%
Some (but not all) teeth removed due to decay or disease 42%
Last dental visit to dentist or dental hygienist in the past year 66%
Married or cohabitating 55%
Not married or cohabitating 45%
Bachelors degree or higher 26%
Less than a Bachelor's degree 74%
Income $50,000 a year or higher 45%
Income less than $50,000 a year 55%
Male 49%
Female 51%
White non-Hispanic or Asian/PI non-Hispanic 69%
Black non-Hispanic, Native American non-Hispanic, Hispanic, Two or more Races, Other 31%
Age 45 or higher 53%
Age less than 45 47%
Weighted Total 248,482,532
The Results of the Multi Level Logistic Modeling
oralhealthworkforce.org 14
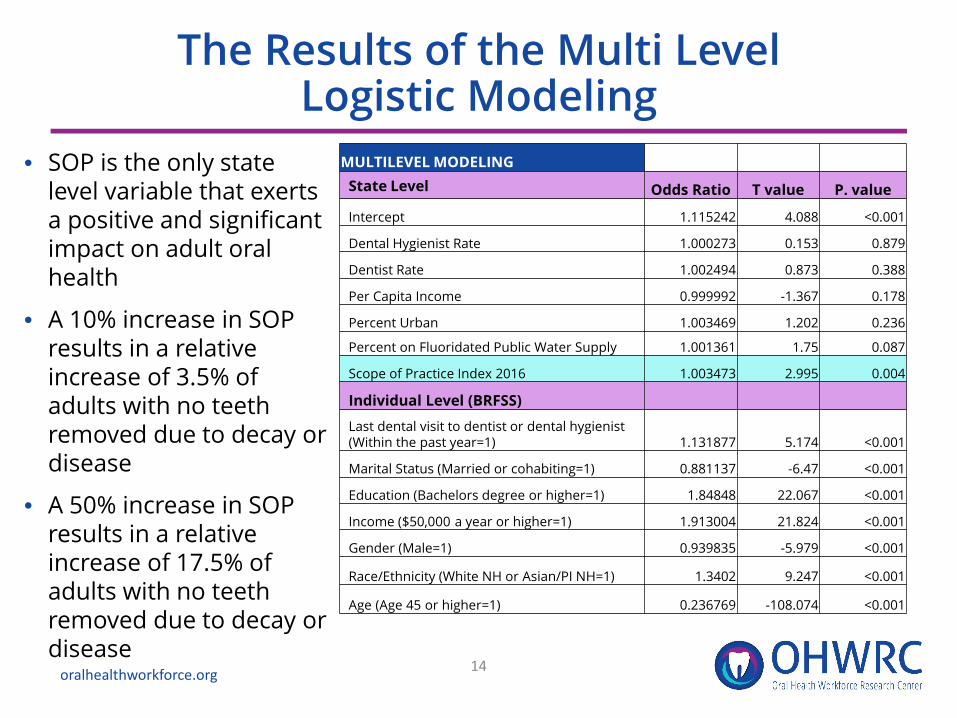
• SOP is the only state level variable that exerts a positive and significant impact on adult oral health
• A 10% increase in SOP results in a relative increase of 3.5% of adults with no teeth removed due to decay or disease
• A 50% increase in SOP results in a relative increase of 17.5% of adults with no teeth removed due to decay or disease
MULTILEVEL MODELINGState Level Odds Ratio T value P. value
Intercept 1.115242 4.088 <0.001
Dental Hygienist Rate 1.000273 0.153 0.879
Dentist Rate 1.002494 0.873 0.388
Per Capita Income 0.999992 -1.367 0.178
Percent Urban 1.003469 1.202 0.236
Percent on Fluoridated Public Water Supply 1.001361 1.75 0.087
Scope of Practice Index 2016 1.003473 2.995 0.004
Individual Level (BRFSS)
Last dental visit to dentist or dental hygienist (Within the past year=1) 1.131877 5.174 <0.001
Marital Status (Married or cohabiting=1) 0.881137 -6.47 <0.001
Education (Bachelors degree or higher=1) 1.84848 22.067 <0.001
Income ($50,000 a year or higher=1) 1.913004 21.824 <0.001
Gender (Male=1) 0.939835 -5.979 <0.001
Race/Ethnicity (White NH or Asian/PI NH=1) 1.3402 9.247 <0.001
Age (Age 45 or higher=1) 0.236769 -108.074 <0.001

Results• Scope of Practice Index (DHPPI) is the only state
level variable that exerts a positive and significant impact on adult oral health.
• A 10% increase in the Scope of Practice Index (DHPPI) results in a 3.5% relative increase in the percentage of adults with no teeth removed due to decay or disease.
• A 50% increase in the Scope of Practice Index (DHPPI) results in a 17.5% relative increase in the percentage of adults with no teeth removed due to decay or disease.
15oralhealthworkforce.org

Conclusions and Next Steps
• SOP is an important consideration when designing workforce strategies to increase access to and utilization of preventive oral health services
• Placing DHs in community settings and enabling service delivery with autonomy within professional competencies may improve outcomes
• In the process of analyzing data to determine the impact of scope of practice on access to oral health services and on oral health outcomes for children
• Preliminary analysis suggests an interaction effect which would support the importance of oral health care teams
• There may be a tipping point at which scope of practice expansion makes a significant difference relative to the oral health of the population.
oralhealthworkforce.org 16