relational models theory and their associations with cultural orientations and personal value

Full Terms & Conditions of access and use can be found athttp://www.tandfonline.com/action/journalInformation?journalCode=rijh20
Download by: [US International University - Africa] Date: 25 October 2016, At: 01:42
The International Journal of Human ResourceManagement
ISSN: 0958-5192 (Print) 1466-4399 (Online) Journal homepage: http://www.tandfonline.com/loi/rijh20
The impact of cultural value orientations onindividual HRM preferences in developingcountries: lessons from Kenyan organizations
Stephen M. Nyambegera , Paul Sparrow & Kevin Daniels
To cite this article: Stephen M. Nyambegera , Paul Sparrow & Kevin Daniels (2000) The impactof cultural value orientations on individual HRM preferences in developing countries: lessonsfrom Kenyan organizations, The International Journal of Human Resource Management, 11:4,639-663, DOI: 10.1080/09585190050075042
To link to this article: http://dx.doi.org/10.1080/09585190050075042
Published online: 18 Feb 2011.
Submit your article to this journal
Article views: 368
View related articles
Citing articles: 21 View citing articles

The impact of cultural value orientationson individual HRM preferences indeveloping countries: lessons fromKenyan organizations
Stephen M. Nyambegera, Paul Sparrow and Kevin Daniels
Abstract The intention of the study is to examine the impact that individual nationalculture value orientations have on the preference for the design of HR policies andpractices. The value orientation structure and preferences for thirty-four HR designchoices are studied in a sample of 274 Kenyan employees from eight multinational, stateand private domestic � rms operating in the manufacturing and processing sector. Thestudy shows that the HR design choices of Kenyan employees re� ect the followingpicture across four factors: high HR involvement/participation: high predictability ofrewards; performance rather than loyalty-based policies; and moderate levels of HRempowerment. Kenyan employee value orientations re� ect: activity thinking over activitydoing; individual over collective relationships; relationship to nature mastery overrelationship to nature harmony; low subjugation to nature; and human nature evil(manipulative). More importantly, three out of the four HR preference factors are values-related, i.e. the individual’s value orientation is highly predictive of their preference forthe design of HR policies and practices. From 9 per cent to 19 per cent of the variancein preferences for involvement, empowerment and predictability of rewards is accountedfor by national culture value orientations. HR involvement preferences are related toactivity thinking values. Predictability of rewards is related to high activity doing.Empowerment HR is related to low relationships hierarchical values. Preferences forperformance versus loyalty-based HRM are intriguingly values-free judgements,although ethnic factors play a role here.
Keywords National culture; value orientations; Kenya; developing countries; HRM.
Introduction
Recently, there has been a great deal of interest in the � eld of comparative humanresource management (CHRM). The majority of research has concentrated ondifferences across developed economies, for example across countries within theEuropean Union (EU) (see, for example, Hiltrop, 1993; Brewster and Hegewisch, 1994;Brewster, 1995; Sparrow and Hiltrop, 1994; Forster and Whipp, 1995) or betweendeveloped countries and newly commercializing regions such as China (see, for
Stephen M. Nyambegera, The University of Shef� eld Management School, 9 Mappin Street,Shef� eld S1 4DT, UK (tel: +44 114 2223355; e-mail: Ecp96SMN@Shef� eld.ac.uk); PaulSparrow, The University of Shef� eld Management School, 9 Mappin Street, Shef� eld S14DT, UK (tel: +44 114 2223346; fax: +44 114 2223348; e-mail: P.Sparrow@Shef� eld.ac.uk); Kevin Daniels, The University of Shef� eld Management School, 9 Mappin Street,Shef� eld S1 4DT, UK (tel: +44 114 2223365; e-mail: K.Daniels@Shef� eld.ac.uk).
Int. J. of Human Resource Management 11:4 August 2000 639–663
The International Journal of Human Resource ManagementISSN 0958-5192 print/ISSN 1466-4399 online © 2000 Taylor & Francis Ltd
http://www.tandf.co.uk/journals

example, Yeung and Wong, 1990; Easterby-Smith et al., 1995). It is only recently thatresearchers have started to write about management issues in developing countries.Here, too, the emphasis is on Asia (Austin, 1990; Jaeger and Kanungo, 1990; Kanungoand Mendonca, 1994; Saunders and Kanungo, 1995) or deregulating economies such asIndia (Budhwar and Sparrow, 1997; Sparrow and Budhwar, 1996). The circumstancesconfronting developing countries, especially Sub-Saharan Africa, have generally beenignored (Kanungo and Wright, 1983; Jaeger, 1986; Mendonca and Kanungo, 1990). Afew researchers have focused on African developing countries (Kiggundu 1989; Blunt,1983; Onyemelukwe, 1973). This work shows that, culturally, employees in developingcountries hold values completely different from those in developed countries. We mightexpect Western HRM paradigms to be even less relevant to the developing nations,whose context is markedly divergent from the developed world (e.g. Shenkar, 1985;Jaeger and Kanungo, 1990; Amante, 1993; Cichon and Gillion, 1993). The question ofthe transferability of these theories or practices becomes evident.
Context of Kenya
Kenya is a developing country situated in the Eastern region of Africa. Afterindependence from Britain in 1963, Kenya started to Africanize most of itsorganizations and invest in businesses, which coincided with intense political activitiescharacterized by ethnic chauvinism and sectionalism (Gershenberg, 1987). Publicorganizations became bureaucratic and autocratic and were used to achieve partisanethnic or political objectives, leading to inef� ciency and ineffectiveness (Cohen, 1993).The use of particularistic criteria in issues of HRM is common in many stateorganizations and has possibly reinforced their level of loss making. Many of thesepublic enterprises have closed down or have been privatized after the intervention ofinternational donors who have tied money to structural adjustments. The private sectoris largely dominated by multinational companies, which therefore have a big economicimpact. Their human resource policies are seen to be better as they attract and retainmore quali� ed personnel. However, most of them are managed by Kenyans except forthe positions of the chief executive and � nancial controller. These multinationalcompanies, as in many African countries, are not as effective as in their domesticoperations, especially in areas of quality of work life, motivation and productivity(Ekpo-Ufot, 1986). Early studies indicate that many small and medium-sized foreigncompanies in Africa are as wanting as the larger indigenous organizations (Akinnusi,1991). Most practise management paternalism, a style that is largely authoritarian andnormally associated with lowering employees’ social status while demanding un-questioning personal allegiance to the employer or manager. However, many employeeshave to endure a poor quality of work life due to the scarcity of alternative jobopportunities.
Three contextual factors are important in interpreting HRM patterns in Kenya: a widerange of ethnic groups; high levels of population growth; and constrained economicdevelopment focused mainly in urban areas. Kenya has forty-three indigenous ethnicgroups, all of which are believed to have come to this part of Africa from other parts.As they spread out they left behind their kinsmen who, over time, developed their ownlanguages and cultures (Grundy, 1968). Alongside African Kenyans are a good numberof Arabs, Indians, and Europeans. English is the of� cial language and Swahili thenational language. With the many ethnic groups and cultures, we can conclude that theKenyan culture is not homogeneous, although an overall national pattern may bediscernible. The impact of such ethnic loyalties on HRM preferences will be examined
640 The International Journal of Human Resource Management

in conjunction with values orientations. Kenya has one of the fastest growingpopulations in the world, standing at 29 million in 1997 (Economic Survey, 1998).Unemployment and underemployment exist, with an unequal distribution of wealth andassets. About 47 per cent of rural and 29 per cent of urban households live in absolutepoverty. Sixty-eight per cent of the rural population is poor compared to 9 per cent inurban areas. The Kenyan economy performed poorly for � ve years in a row from 1993,recording real GDP growth of 0.2% (Economic Survey, 1998).
Culture as an explanatory variable in HRM preferences
Major differentiating factors between First, Second and Third World countries arecontextual, and there is growing support for the perception that country-based elementshave a signi� cant impact on international HRM. Such factors include: economic,political, legal, and historical environments (Begin, 1992; Sundaram and Black, 1992),employee demographics and labour-market characteristics (Teagarden et al., 1992),socio-cultural characteristics of the workforce and society (Laurent, 1983; Torrington,1994). Among these elements, culture has generated more interest in the � eld ofcomparative HRM because of the belief that cultures are at the base of people’sbehaviours. Cultural differences have received wide attention in cross-nationalmanagement research (Brewster and Hegewisch, 1994; Schuler et al., 1993; Grønhaugand Nordhaug, 1992; Pieper, 1990; Dowling and Schuler, 1990). This study usesmeasures of individual values orientations as a proxy for national culture. Culture is nottreated as just a residual explanatory variable, but instead is analysed to see how itexerts a signi� cant in� uence on management and employee behaviour in Kenyanorganizations. We examine the in� uence of cultural value orientations on employeepreferences for HRM policies and practices. Underlying patterns of African culturevalue orientations are examined, as well as the extent to which they explain employeework preferences. The study determines how much variance in individual preference forHR system design can be attributed to the in� uence of value orientations and examineswhich values in� uence which work-related preferences in Kenya.
In comparing cultures of different countries, cross-cultural researchers have concen-trated effort on an examination of managerial values (Hofstede, 1995; Manso-Pinto etal., 1993; Blunt, 1986). These values are often aggregated at a national or societal level,and the most widely used scales are those developed by Hofstede (1980). There are,however, some methodological issues both with Hofstede’s approach and with much ofthe work-related preferences literature in general. The use of aggregated national datacan be misleading when applying societal characteristics to individual behaviourbecause there could be considerable variance in the degree to which individuals adhereto any set of values (Cray and Mallory, 1998). Moreover, Hofstede aggregated workpreferences across what are in practice discrete psychological variables or levels ofanalysis, each of which differs in key properties, such as level of stability or resistanceto change over time and linkage to, initiation of, and predictability of other behaviours.The cultural dimensions are established largely on the basis of aggregated attitudinaldata about a series of work-related preferences. Some of the items re� ect generalattitudes, some are work-values statements, some tap into outcome behaviours such assources of satisfaction, attachment or commitment, and so forth. However, in order tounderstand the constraints that national cultural values might place on internationalmanagement, we need to disentangle the separate constructs that have been broughttogether under the work-related preferences approach to national culture, and revealtheir separate impact on important HRM-linked behaviours. Values, attitudes, and
Nyambegera et al.: The impact of cultural value orientations 641

outcome behaviours all differ in the key properties listed above. Therefore, althoughwidely used, the Hofstede scales have been heavily criticized in terms of the validityand usefulness of the four dimensions at the individual level of analysis (Robinson,1983; Sondergaard, 1994; Dorfman and Howell, 1988; Hunt, 1981; Goodstein, 1981). Ageneral criticism, levelled at many psychometric approaches to the measurement ofcultural values, is that they use scales that do not reveal the totality of relevant culturalvalue dimensions (e.g. Cray and Mallory, 1998; Smith et al., 1996; Sparrow and Wu,1998). The scales tend to tap only work contexts. Finally, another important issue toconsider is the type of population under study. The existing individual differenceliterature under the label of ‘work-related preferences’ has attempted to glean relevantmessages for the � eld of international HRM from the study of national differencesbased on the socio-cultural characteristics of individual employees (McGaughey et al.,1997). However, the frequent use of convenience samples, such as students, captivegroups of managers on education courses selected by MNCs, or employees from singleorganizations within a country (e.g. McGaughey, 1994), raises questions over thevalidity of the resulting description of these work-related preferences. This studyovercomes such shortcomings by taking a more representative sample of multinationalcompanies and other � rms with a wider, more representative sampling frame.
De� ning culture and value orientations
We have argued that we need a much better understanding of how such cultural valuesoperate and in� uence HRM at the individual level. Smith (1992) argues that there is alinkage between cultural values and several organizational behaviours, such as norms ofacceptable behaviour, types of con� ict, and preferred leadership styles. In this study,analyses at the individual level are undertaken to enable a better understanding of therole of cultural values in predicting HRM preferences. The study also employs culturalvalue items that tap a wider domain of life. These are based on the conceptualization ofvalue orientations by Kluckhohn and Strodtbeck (1961), subsequently operationalizedby Maznevski et al. (1993, 1995). Kluckhohn and Strodtbeck (1961) identi� ed severalvalue orientations (VOs) and de� ned them as assumptions or sets of principles that areused to evaluate beliefs, feelings, and intentions. They argue that value orientations doguide behaviour because they give order and direction to human acts and there is arelation to solutions of common day-to-day problems. This is so because individualsexpress culture and its normative qualities through the values that they hold. The basicpremise underlying the VOs is that there are common themes in the problems thatsocieties have faced throughout the ages. The issues that form the value orientations andon which societies can be compared are as follows:
1 Human nature is perceived as good, a mixture of good and evil, or evil.2 Societies can relate to nature by dominating it or living in harmony with it, while
others become subjugated by it.3 Relationships among people are perceived as individualistic, laterally extended
groups, or hierarchical groups.4 Activity in daily living may concentrate on striving for goals and keeping busy
(doing) or re� ecting and living rationally (thinking), or, for others, may take the formof living for the moment and exhibiting spontaneity (being).
Lane and DiStefano (1992) argue that these categories can be used to measure thecultural values of individuals in different groups or sub-groups. Maznevski and others(Maznevski et al., 1993, 1994; Maznevski and DiStefano, 1995) operationalized these
642 The International Journal of Human Resource Management

value orientations which are used to measure cultural value orientations. The mainfeatures or characteristics of the cultural value orientations adopted for this study arebrie� y represented in Figure 1.
Some similarities have been found between Kluckhohn and Strodtbeck’s valueorientations and Hofstede’s cultural dimensions. Maznevski and DiStefano (1995)report similarities between Kluckhohn and Strodtbeck’s ‘activity’ orientation andHofstede’s ‘masculinity’ pole. In a ‘doing’ or ‘masculine’ society, people are likely toview work and work-related activities as core to their existence, they tend to emphasizepersonal accomplishment, achievement, and strong sense of admiration of such virtues.People in such societies will spend more time earning money and doing relatedactivities. On the other hand, people in ‘being’ or ‘feminine’ culture societies act onfeelings experienced and like enjoying the present. These authors also link Kluckhohnand Strodtbeck’s ‘relational category’ to Hofstede’s ‘authority distance’ dimension and‘individualism/collectivism’ poles. In high authority distance societies, one � ndspreference for hierarchical solutions and collective relationships, where respect forauthority is paramount. The opposite is the case with low authority distance societies,as they assume individualistic relationships and those in authority are seen ascolleagues.
The items are used to examine underlying value orientations of a sample of Kenyanemployees. These value orientations are de� ned as assumptions or sets of principlesused to evaluate beliefs, feelings, and intentions. They have been used in a study ofTaiwanese workers, in which signi� cant predictive relationships were found between
ISSUE VARIATION 1 VARIATION 2 VARIATION 3
Relationship tonature
Subjugation
Dominated byexternal forces,
subject to a supremebeing, everything
predetermined
HarmonySpeci� c features
Maintaining balancewith physicalenvironment,
peaceful, maintainingstatus quo
Mastery
Controlling, believeseverything is
possible, valueswork and work
outcomes
Basic humannature
Changeable or not
Limited or unlimitedcreative potential,malleable or � xed
GoodSpeci� c features
Honest, trustworthy
Evil
Corrupt, not to betrusted with
anything
Human activity Doing
Pragmatism,relentless to achieve/
accomplish goals
ThinkingSpeci� c features
Rational and careful
Being
Spontaneity, feelingbased actions
Relationshipamong people
Collectivist
Takes care of group,values group welfare,depends on group for
moral standards
HierarchicalSpeci� c features
Emphasises verticaland horizontalstructures and
in� uence patterns,values status
Individualistic
Takes care of self,values individual
welfare, depends ononeself for moral
guidance
Figure 1 Cultural value orientations and examples of their speci� c features
Nyambegera et al.: The impact of cultural value orientations 643

cultural value orientations and HRM policy and practice preferences (Sparrow and Wu,1998). Importantly, the cultural values items represented unique measurements, andcould be separated from attitudinal items to HRM preferences and outcome behaviourssuch as satisfaction and commitment. Therefore, a more meaningful examination ofpsychological work-related preferences and their impact on HRM policy practice can becarried out by tapping into the in� uence of the cultural value orientation itemsoperationalized by Maznevski and colleagues.
The two research questions to be addressed in this study then are:
RQ1 which cultural value orientations are held by our Kenyan sample?RQ2 which cultural value orientations in� uence HRM policy and practice preferences
and to what extent?
Methodology
Sample and procedure
Data used in this paper were obtained from eight Kenyan manufacturing organizations.Letters were sent out to thirty companies requesting them to participate in the study;eight of them accepted, comprising multinationals, state, and private local � rms. Theorganizations were identi� ed from the Kenya Fact Book (1996). This contained a list ofall major manufacturing companies, with additional information including sector,origin, size, products, and contact addresses and from it we identi� ed thirtyorganizations that satis� ed our selection criteria. We attempted to control the size of the� rms by targeting only those in the manufacturing/processing sector with over 200employees. Additionally, organizations had to have been in operation for not less than� ve years, and had to have a human resource/personnel department. Organizations weretold that they are participating in an international project to assess values and workpractices in Kenya compared to other countries. The project’s intention was to seekviews about issues related to their organizations and also to identify employeepreferences for particular work practices, providing greater understanding of people’spreferences for work practices in Kenya. Further, they were told the bene� ts ofparticipating in the study, for example, providing valuable feedback to assist theirorganizations in their plans for continued improvement in the areas addressed in thesurvey. The eight organizations, based in main urban centres, that agreed to participatewere spread through � ve out of the eight provinces of Kenya (see Table 1).
Government policy required that any study of substantial magnitude should seekpermission from the of� ce of the President. Research assistants were used to help in theadministration of the questionnaires. Formal interviews were held with the chiefexecutive, or his designate, of the participating � rms to organize the logistics of thedata-collection process. Depending on the size of the � rm, between forty and sixtyquestionnaires were given to liaison managers who then distributed them to a randomsample of employees selected right across the organization structure. Respondents wereinstructed to contact research assistants,1 who were available throughout that period toprovide guidance, should they need any clari� cation in completing the questionnaire. Intotal, 500 questionnaires were distributed. In this way a more representative sample wascovered than in other studies, which have tended to comprise only managers or acaptive sample such as students (e.g. Dowling and Nagel, 1986; Weldon and Jehn,1993; McGaughey, 1994). The exercise took a total of � ve months from January to May1998. A covering letter introduced the study and indicated that it was anonymous andcon� dential. To ensure con� dentiality, respondents were instructed not to write their
644 The International Journal of Human Resource Management

names anywhere in the questionnaire. An A4-size envelope was provided in which theysealed the completed questionnaire and returned it to a locked box marked ‘research’,from which surveys were collected by the research assistants. The respondents weretold the objectives of the study were to identify their preferences for HRM policies andpractices. They were informed that the � ndings could be used to help managementensure that actual practice was in line with their desired policies with practice. A totalof 274 out of 500 questionnaires were returned, representing a response rate of 55 percent. This is a very acceptable rate considering that in a Third World country surveysmay not be taken seriously. We feel it was achieved because of the of� cial support ofthe research and the active involvement of research assistants.
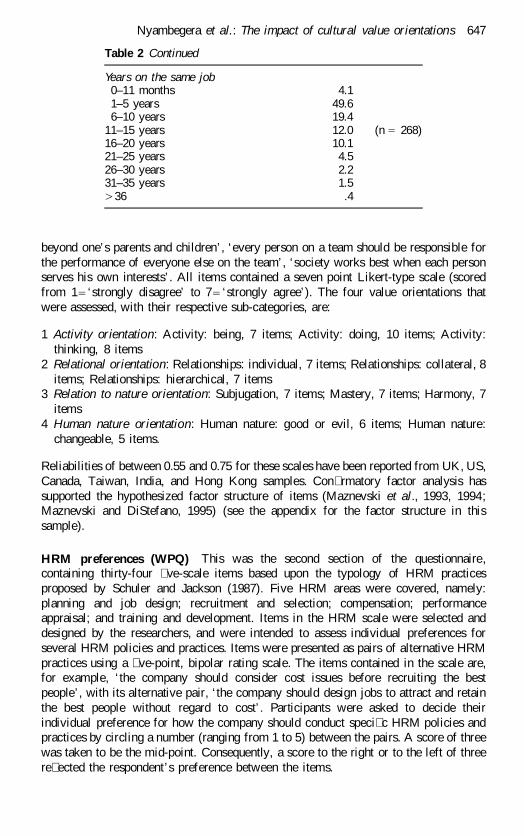
Most (71 per cent) of the respondents where aged between 26 and 45 years, and 89.1per cent possessed at least fourth-form level of education. The majority (75.1 per cent)were from the middle level in the structure, 4.2 per cent were from upper-levelmanagement, while 21 per cent was comprised of lower-level staff. Almost 55 per centhad served the same � rm for between one and ten years, and 69 per cent had been onthe same job during that same period. The ethnic composition of respondents indicatesthat the six big ethnic groups that make up the majority of salaried employment inKenya accounted for 90.3 per cent of the sample. The main reason is that many of theother ethnic groups are either pastoralists or peasants. As expected, the femalepopulation was very low at 11.3 per cent, as most women have just started to joinsalaried employment in most African countries (see Table 2 for a summary ofdemographic characteristics).
Measures
Questionnaires were used to assess cultural value orientations and HRM policy andpractice preferences. The main questionnaire comprised several sections.
The Cultural Perspectives Questionnaire (CPQ4) The � rst section was adaptedfrom the Cultural Perspective Questionnaire (CPQ4) developed by Maznevski andDiStefano (1993, 1995). These items are based upon the work of Kluckhohnand Strodtbeck (1961) on value orientations. The instrument contained statements,ideals, or guides to behaviour, e.g. ‘one’s responsibility for family members should go
Table 1 Participating companies’ characteristics
Company Ownership Products Location Province
Company 1 MNC/plc Tyres and tubes Nairobi NairobiCompany 2 Local/plc Building materials Nairobi NairobiCompany 3 Joint venture Vehicles, etc. Thika CentralCompany 4 Local/private Soft drinks Kisumu NyanzaCompany 5 State Textiles Eldoret Rift ValleyCompany 6 MNC Sausages/pork Nairobi NairobiCompany 7 Joint venture Textiles Eldoret Rift ValleyCompany 8 Public/plc Cement/roo� ng Mombasa Coast
NotesNMC 5 multinational corporation (subsidiary) .Local/plc 5 local, quoted on the Nairobi Stock Exchange.Plc 5 public limited company.
Nyambegera et al.: The impact of cultural value orientations 645

Table 2 Sample demographic characteristics
Age of respondent Percentage, 25 16.226–30 20.331–35 17.036–40 15.1 (n 5 271)41–45 18.146–50 9.251–55 3.056–60 .761–65 .4
Gender of respondentFemale 11.3Male 88.7 (n 5 274)
Ethnic group of respondentKalenjin 12.0Kikuyu 27.8Kisii 5.8Luo 18.9Kamba 7.7 (n 5 259)Luyha 18.1Asian 2.7Other 6.9
Education level of respondentPrimary level 4.8O level 47.1A level 8.5Diploma level 23.2 (n 5 272)Undergraduate 10.3Postgraduate 4.0Other 2.2
Occupation of respondentUpper-level manager 4.2Middle-level manager 15.8Operator 5.3Supervisor 21.9Marketing or sales 8.3Accountant 3.8 (n 5 265)Secretary 4.5Technician 20.0Support staff 14.0Security 2.3
Length of service0–11 months 6.31–5 years 38.86–10 years 15.7
11–15 years 14.216–20 years 18.3 (n 5 268)21–25 years 4.526–30 years 1.931–35 years .4
646 The International Journal of Human Resource Management
beyond one’s parents and children’, ‘every person on a team should be responsible forthe performance of everyone else on the team’, ‘society works best when each personserves his own interests’. All items contained a seven point Likert-type scale (scoredfrom 1 5 ‘strongly disagree’ to 7 5 ‘strongly agree’). The four value orientations thatwere assessed, with their respective sub-categories, are:
1 Activity orientation: Activity: being, 7 items; Activity: doing, 10 items; Activity:thinking, 8 items
2 Relational orientation: Relationships: individual, 7 items; Relationships: collateral, 8items; Relationships: hierarchical, 7 items
3 Relation to nature orientation: Subjugation, 7 items; Mastery, 7 items; Harmony, 7items
4 Human nature orientation: Human nature: good or evil, 6 items; Human nature:changeable, 5 items.
Reliabilities of between 0.55 and 0.75 for these scales have been reported from UK, US,Canada, Taiwan, India, and Hong Kong samples. Con� rmatory factor analysis hassupported the hypothesized factor structure of items (Maznevski et al., 1993, 1994;Maznevski and DiStefano, 1995) (see the appendix for the factor structure in thissample).
HRM preferences (WPQ) This was the second section of the questionnaire,containing thirty-four � ve-scale items based upon the typology of HRM practicesproposed by Schuler and Jackson (1987). Five HRM areas were covered, namely:planning and job design; recruitment and selection; compensation; performanceappraisal; and training and development. Items in the HRM scale were selected anddesigned by the researchers, and were intended to assess individual preferences forseveral HRM policies and practices. Items were presented as pairs of alternative HRMpractices using a � ve-point, bipolar rating scale. The items contained in the scale are,for example, ‘the company should consider cost issues before recruiting the bestpeople’, with its alternative pair, ‘the company should design jobs to attract and retainthe best people without regard to cost’. Participants were asked to decide theirindividual preference for how the company should conduct speci� c HRM policies andpractices by circling a number (ranging from 1 to 5) between the pairs. A score of threewas taken to be the mid-point. Consequently, a score to the right or to the left of threere� ected the respondent’s preference between the items.
Table 2 Continued
Years on the same job0–11 months 4.11–5 years 49.66–10 years 19.4
11–15 years 12.0 (n 5 268)16–20 years 10.121–25 years 4.526–30 years 2.231–35 years 1.5. 36 .4
Nyambegera et al.: The impact of cultural value orientations 647

Results
Cultural value orientations of Kenyan employees
Table 3 presents the means, standard deviations, and alpha reliability coef� cients of thevalue orientation sub-scales. The results represent the picture from the raw datacollected from the Kenyan sample. They paint a picture of the values held by theKenyan sample. Only scales with an alpha greater than 0.60 were taken to be reliableand adopted for this analysis. This is consistent with the authors of the scales’ � ndingof reliabilities of between 0.60 and 0.70 (Maznevski and DiStefano, 1993, Maznevskiet al., 1994). Therefore, after description of the sample’s cultural value orientations,three scales will be dropped from further inferential analysis. The Kenyan sampleshows some variations from commonly held assumptions about the nature of peoplefrom developing countries which could be a product of this country’s history andcurrent economic state. We look at the emerging picture of the Kenyan sample’s valueorientations across the original eleven sub-dimensions.
Activity orientation The activity orientation shows that Kenyans prefer to thinkthings through and to live rationally (Activity: Thinking). On average, they strive toachieve goals and work harder if well rewarded. They view work as central to theirexistence because of the bene� ts work brings to them (Activity: Doing). This could beexplained by the fact that jobs are viewed as being critical not only to the individual’swell-being but also for the well-being of kith and kin. Furthermore, there is a stigmaattached to the unemployed as they cannot contribute to their extended family� nancially. The results indicate that Kenyans are not ‘being’ oriented, which is anorientation characterized by spontaneity. People do not work on feelings as they areexperienced but tend to be re� ective and think things through. People here cannotafford to indulge in unnecessary leisure and they do not live for the moment.
Table 3 Means, standard coef� cients, alphas and items of the cultural scale
Variable Mean Standard deviation Alpha No. of items
Activity orientationBeing 3.89 1.16 .52 7Doing 5.47 .98 .64 10Thinking 6.26 .81 .72 8
Relational orientationCollateral 5.14 1.03 .54 8Hierarchical 4.15 1.27 .62 7Individual 4.99 1.14 .62 7
Relation to natureHarmony 5.66 1.02 .63 7Mastery 5.92 1.06 .69 7Subjugation 2.88 1.24 .70 7
Human natureGood or evil 4.45 1.33 .63 6Changeable or not 4.87 1.25 .50 5
NoteThe sub-categories in italics were dropped from further analysis due to low alpha coef� cients.
648 The International Journal of Human Resource Management

Relationships orientation On relationships among people, the Kenyan sample tendsto value both group (Relational: Collateral) and individual (Relational: Individual)welfare, but group welfare is more valued compared to individual welfare. This is notsurprising, as Sinha and Tripathi (1994) argue that both individualistic and collectivistbehaviours could be found depending on context. They are neutral with regard tohierarchical relations (Relational: Hierarchical). Lane et al. (1997) provided anadditional characterization of this sub-category, and noted that hierarchically orientatedsocieties de� ne the proper relations to others as group oriented, but with two additionalcharacteristics. One is that the position in the group is nested in a hierarchy of othergroups in society. Second, the group’s position in the hierarchy is stable over time, acharacteristic of aristocratic societies and caste systems: one is to look after one’s ownkind, but one knows where one’s kind stands on the status ladder, and mobility betweengroups is highly unlikely, if not impossible. This is not the case in Kenya.
Relation to nature The results of this orientation show that Kenyans tend to be inharmony with the world around them. They tend to behave in concert with theirenvironment. They see no real separation between people and their natural environment,and their beliefs have allowed them to live at peace with the environment. Masteryorientation was scored surprisingly high, perhaps due to the composition of therespondents who are young and educated. A young employee who has got where theyare from scratch, is earning his/her own money, and has great plans for the future couldscore high regardless of his/her environment. One result reported by the Kenyansample, which is presumed by many researchers to be a feature of developing countries,is the issue of being subjugated to nature. Subjugated societies tend to see themselvesas dominated by physical forces and or subject to the will of a supreme being orexternal force. The opposite is found in the case of Kenya. Modern Kenyans, though ina developing country, do not see causality as determined by factors beyond theircontrol, as they will try very hard to live better. This is consistent with other valueorientations which are seen in non-subjugated societies like activity doing and activitythinking, which the Kenyan sample has also exhibited.
Basic human nature The Kenyan study shows that Kenyan’s belief about theinherent character of the human species is that of a mixture of both good and evil, orrather they are neutral on this orientation (Human Nature: Good or Evil). Some peopleare very evil and cannot be trusted but then there are others who are good and can betrusted. The other belief about the changeability of people (Human Nature: Changeable/Unchangeable) is higher. Together, the results indicate a perception that, given the rightsupport and environment, most people would change for the better, and the wrongenvironment can change others to be bad even if they were good.
This analysis has enabled us to reveal cultural value orientations held by our Kenyansample (answering our � rst research question), by using one of the most coherent set ofcultural value scales so far developed. In summary, the results indicate that, on average,the sample can be characterized: as rational and goal oriented; more group thanindividually oriented, but not overly concerned with hierarchy; oriented towardsharmony with the world around, but with a preparedness to control the environment fortheir bene� t; and seeing good, bad, stability and change in people.
An internal reliability of alpha5 0.60 has been set as the limit of acceptability forexploratory research and is considered to be good, although alphas greater than 0.70 arepreferred (Nunnally, 1967). Only eight scales exceeded this limit, and so three were
Nyambegera et al.: The impact of cultural value orientations 649
dropped from further analysis. Two of these scales (Human Nature: Changeable andActivity: Being) were found by Sparrow and Wu (1998) to have low reliability in aTaiwanese sample.
Human resource management policy and practice preferences of Kenyan employees
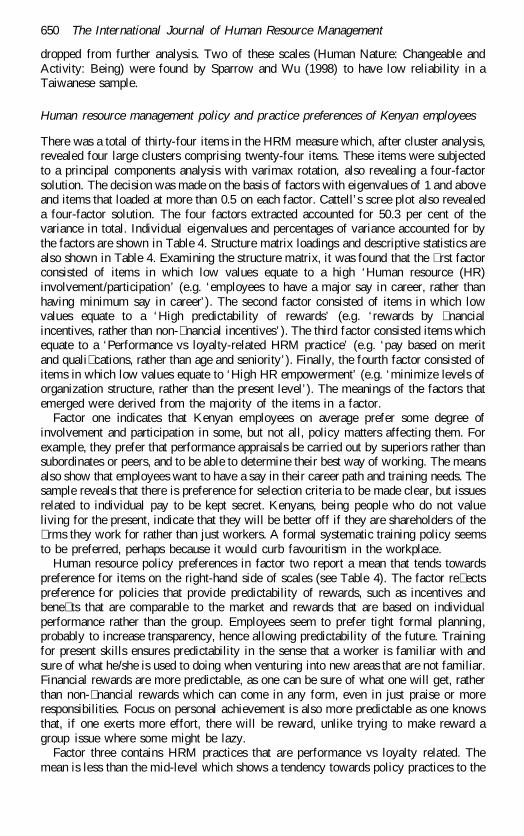
There was a total of thirty-four items in the HRM measure which, after cluster analysis,revealed four large clusters comprising twenty-four items. These items were subjectedto a principal components analysis with varimax rotation, also revealing a four-factorsolution. The decision was made on the basis of factors with eigenvalues of 1 and aboveand items that loaded at more than 0.5 on each factor. Cattell’s scree plot also revealeda four-factor solution. The four factors extracted accounted for 50.3 per cent of thevariance in total. Individual eigenvalues and percentages of variance accounted for bythe factors are shown in Table 4. Structure matrix loadings and descriptive statistics arealso shown in Table 4. Examining the structure matrix, it was found that the � rst factorconsisted of items in which low values equate to a high ‘Human resource (HR)involvement/participation’ (e.g. ‘employees to have a major say in career, rather thanhaving minimum say in career’). The second factor consisted of items in which lowvalues equate to a ‘High predictability of rewards’ (e.g. ‘rewards by � nancialincentives, rather than non-� nancial incentives’). The third factor consisted items whichequate to a ‘Performance vs loyalty-related HRM practice’ (e.g. ‘pay based on meritand quali� cations, rather than age and seniority’). Finally, the fourth factor consisted ofitems in which low values equate to ‘High HR empowerment’ (e.g. ‘minimize levels oforganization structure, rather than the present level’). The meanings of the factors thatemerged were derived from the majority of the items in a factor.
Factor one indicates that Kenyan employees on average prefer some degree ofinvolvement and participation in some, but not all, policy matters affecting them. Forexample, they prefer that performance appraisals be carried out by superiors rather thansubordinates or peers, and to be able to determine their best way of working. The meansalso show that employees want to have a say in their career path and training needs. Thesample reveals that there is preference for selection criteria to be made clear, but issuesrelated to individual pay to be kept secret. Kenyans, being people who do not valueliving for the present, indicate that they will be better off if they are shareholders of the� rms they work for rather than just workers. A formal systematic training policy seemsto be preferred, perhaps because it would curb favouritism in the workplace.
Human resource policy preferences in factor two report a mean that tends towardspreference for items on the right-hand side of scales (see Table 4). The factor re� ectspreference for policies that provide predictability of rewards, such as incentives andbene� ts that are comparable to the market and rewards that are based on individualperformance rather than the group. Employees seem to prefer tight formal planning,probably to increase transparency, hence allowing predictability of the future. Trainingfor present skills ensures predictability in the sense that a worker is familiar with andsure of what he/she is used to doing when venturing into new areas that are not familiar.Financial rewards are more predictable, as one can be sure of what one will get, ratherthan non-� nancial rewards which can come in any form, even in just praise or moreresponsibilities. Focus on personal achievement is also more predictable as one knowsthat, if one exerts more effort, there will be reward, unlike trying to make reward agroup issue where some might be lazy.
Factor three contains HRM practices that are performance vs loyalty related. Themean is less than the mid-level which shows a tendency towards policy practices to the
650 The International Journal of Human Resource Management

Tabl
e 4
Hum
an r
esou
rce
man
agem
ent
item
s m
atri
x lo
adin
gs
Hum
anre
sour
cein
volv
emen
t
Pre
dict
abili
tyof
HR
rew
ards
Perf
orm
ance
vs l
oyal
tyH
RM
pra
ctic
es
Hum
anre
sour
ceem
pow
erm
ent
Hrm
p 11
App
rais
als
by s
ubor
dina
tes/
peer
sA
ppra
isal
s by
sup
erio
rs.7
3H
rmp
12N
ot t
o re
veal
sel
ectio
n cr
iter
iaSe
lect
ion
crit
eria
be
mad
e cl
ear
.72
Hrm
p 13
Not
req
uire
off
the
job
tra
inin
g fo
r em
ploy
ees
Em
ploy
ees
go f
or o
ff t
he j
ob t
rain
ing
.74
Hrm
p 14
Man
agem
ent
dete
rmin
e be
st w
ay t
o w
ork
Wor
kers
det
erm
ine
how
the
y w
ork
.73
Hrm
p 15
Em
ploy
ees
to h
ave
min
imum
say
in
care
erE
mpl
oyee
s to
hav
e m
ajor
say
in
care
er.6
5H
rmp
16In
form
al t
rain
ing
poli
cy o
n ad
hoc
basi
sFo
rmal
, sys
tem
atic
tra
inin
g po
licy
.68
Hrm
p 17
Not
exp
ect
empl
oyee
s to
be
shar
ehol
ders
Em
ploy
ees
be s
hare
hold
ers
of t
he �
rm.7
6H
rmp
18E
mpl
oyee
s’ p
ay b
e m
ade
publ
ic k
now
ledg
eK
eep
empl
oyee
s’ p
erso
nal
pay
secr
et.7
7
Hrm
p 21
Wag
e de
term
inat
ion
com
pare
d w
ith
grou
pW
age
com
para
ble
with
mar
ket
rate
s.5
3H
rmp
22T
rain
ing
for
mor
e tr
ansf
erab
le s
kill
sT
rain
ing
for
impr
ovin
g pr
esen
t sk
ills
.57
Hrm
p 23
Pay
inc
reas
es b
y gr
oup
perf
orm
ance
Pay
incr
ease
s by
per
sona
l pe
rfor
man
ce.6
4H
rmp
24F
ocus
per
form
ance
on
grou
p ac
hiev
emen
tFo
cus
perf
orm
ance
on
pers
onal
ach
ieve
men
t.6
4H
rmp
25R
ewar
ds b
y no
n-�n
anci
al i
ncen
tives
Rew
ards
by
�na
ncia
l in
cent
ives
.61
Hrm
p 26
Loo
se i
nfor
mal
HR
pla
nnin
gT
ight
for
mal
HR
pla
nnin
g.5
6
Hrm
p 31
Pay
reg
ardl
ess
of a
ge a
nd s
enio
rity
Pay
base
d on
age
and
sen
iori
ty.6
6H
rmp
32P
erfo
rman
ce a
ppra
isal
don
e fr
eque
ntly
Perf
orm
ance
app
rais
al o
nce
in a
whi
le.7
2H
rmp
33C
ompa
ny n
eeds
whe
n de
term
inin
g pa
yE
mpl
oyee
nee
ds w
hen
dete
rmin
ing
pay
.68
Hrm
p 34
Fill
vac
anci
es w
ith t
he b
est
peop
le �
rst
Fill
vaca
ncie
s w
ith i
nsid
e pe
ople
�rs
t.6
4H
rmp
35P
rovi
de j
obs
that
mak
e on
e sw
itch
jobs
Prov
ide
jobs
tha
t m
ake
one
an e
xper
t.6
8
Hrm
p 41
Alw
ays
take
cos
t in
to c
onsi
dera
tion
Des
ign
jobs
reg
ardl
ess
of c
ost
.71
Hrm
p 42
Man
ager
s to
det
erm
ine
wha
t is
bes
tE
mpl
oyee
s pa
rtic
ipat
e in
eva
luat
ion
.71
Hrm
p 43
Mai
ntai
n pr
esen
t le
vels
of
stru
ctur
eM
inim
ize
leve
ls o
f or
gani
zatio
n st
ruct
ure
.61
Hrm
p 44
Rew
ards
foc
usin
g on
ly o
n pe
rfor
man
ceR
ewar
ds c
onsi
deri
ng q
uali�
catio
ns &
ski
ll.6
6H
rmp
45G
uara
ntee
em
ploy
men
t se
curi
tyG
uara
ntee
sam
e jo
b se
curi
ty.6
2
Eig
enva
lues
6.11
2.41
2.01
1.61
Perc
ent
of v
aria
nce
25.3
10.0
8.3
6.7
Mea
n3.
813.
512.
433.
31St
anda
rd d
evia
tion
1.16
1.01
1.10
1.09
Alp
ha.8
9.7
0.7
1.7
1
Not
eO
nly
coef
�cie
nts
..5
0 ar
e sh
own
and
all
item
s’ w
ordi
ng h
as b
een
shor
tene
d. T
he m
id-p
oint
is
a sc
ore
of 3
.
Nyambegera et al.: The impact of cultural value orientations 651

left-hand side of items shown in Table 4. These recognize competence and performanceleading to the success of the organization. Again, rewarding on merit rather than ageand seniority is a practice which can go down well with younger employees who mayfeel that their hard work will bene� t them. Furthermore, practices which may lead to theorganization’s success regardless of an individuals’ culture orientation, may be seen ina good light, as they will ensure the organization’s survival and assure continuedemployment. Again, this might be the accepted best practice in most � rms, especiallyin the unstable environments found in developing countries.
The fourth factor contains items that re� ect HR empowerment in the workplace.There is a slight tendency for employees to prefer that the company design jobs tomaintain and retain good people regardless of the cost, as this gives them a sense of jobsecurity in that they cannot be swapped around or declared redundant with the objectiveof reducing costs. The Kenyan sample tends slightly to prefer policies to the left ofitems in Table 4, i.e. policies that empower them through performance evaluations andminimizing layers of management, allowing easier and faster contact with seniors.Rewarding quali� cations and skills is also preferred as it motivates employees on merit.Such a practice assures highly educated and hard-working younger employees thepower to progress. This observation could be attributed to the present composition ofthe Kenyan labour market of young and educated people, re� ected in our sample.
Correlation of cultural value orientations with HRM preferences
The correlation results in Table 5 are taken against a more conservative signi� cancelevel of p , 0.01 to minimize the possibility of type 1 error (Hays, 1988). Activitythinking stands out as having the strongest relationship with HR involvement. Overall,HR involvement is associated with three out of the eight cultural scales, as can be seenfrom Table 5. Predictability of rewards correlates with activity: doing, activity:thinking, relationship: individual and relationships: hierarchical value orientations.Human resource empowerment correlates negatively with human nature: good or evil,relational: hierarchical and relation to nature: subjugation. The results also indicate,rather intriguingly, that preferences for performance vs loyalty-related HRM practiceshave no association with cultural values.
Multiple regression analysis
Table 6 shows the results of the combined effects and overall relationship of the eightcultural scales on HRM preferences.
After controlling for age, gender and ethnic group,2 some signi� cant changes in R2
and B effect are observed in step two of multiple regression analysis. When taking allcultural values together in multivariate analyses, many of the relationships suggested byzero-order correlation become non-signi� cant, but some relationships remain signi� cant(p , .05). Overall, cultural values account for 19 per cent of an individual’s score for‘HR involvement’, and there is a statistically signi� cant relationship to activity:thinking. Cultural values account for 14 per cent of the variance in ‘predictable HRMrewards’ and there are statistically signi� cant relationships with activity: doing,relational: individual and relational: hierarchical. Cultural values account for 9 per centof the variance in ‘human resource empowerment’, and there is a signi� cant negativeassociation with relational: hierarchical. Performance vs loyalty-related HRM practicesagain come out as value free, as no cultural value orientation was signi� cantly relatedto this item. However, demographic factors might explain much of this simple values–
652 The International Journal of Human Resource Management

Tabl
e 5
Stan
dard
dev
iatio
ns,
mea
ns,
alph
as a
nd c
orre
lati
on b
etw
een
cult
ural
val
ue o
rien
tati
ons
and
hum
an r
esou
rce
man
agem
ent
pref
eren
ces
Vari
able
s1
23
45
67
89
1011
12
1A
ctiv
ity:
Doi
ng1.
000
2A
ctiv
ity:
Thi
nkin
g.3
468*
*1.
000
3H
uman
nat
ure:
Goo
d or
evi
l.2
633*
*.1
113
1.00
04
Rel
atio
nal:
Hie
rarc
hica
l.1
043*
.083
1.2
966*
*1.
000
5R
elat
iona
l: I
ndiv
idua
l.2
508*
*.2
631*
*.1
942*
*.2
144*
*1.
000
6R
elat
ion
to n
atur
e: H
arm
ony
.274
2**
.427
0**
.103
3**
.020
0.2
296*
*1.
000
7R
elat
ion
to n
atur
e: M
aste
ry.3
178*
*.4
240*
*.0
725
.075
4.2
141*
*.2
833*
*1.
000
8R
elat
ion
to n
atur
e: S
ubju
gati
on.1
482*
2.1
016
.308
6**
.173
5*.1
488*
2.0
622
2.0
982
1.00
09
Hum
an r
esou
rce
invo
lvem
ent
.198
1**
.355
2**
.030
7.1
265
.095
2.1
406
.154
1*.0
420
1.00
010
Pred
icta
bilit
y of
rew
ards
.208
2**
.149
8*.0
857
.164
1*.2
095*
*.0
095
.115
42
.026
2.4
806*
*1.
000
11Pe
rfor
man
ce-r
elat
ed H
RM
prac
tices
.032
22
.062
.081
12
.056
4.0
876
2.0
172
.010
4.0
614
2.2
604*
*2
.124
51.
000
12H
uman
res
ourc
e em
pow
erm
ent
.023
6.0
019
2.1
650*
2.2
746*
*2
.030
6.0
456
.064
32
.160
7*2
.242
7**
.214
4**
2.0
320
1.00
0
Not
eSi
gni�
cant
cor
rela
tion
at
p,
.01,
are
sho
wn,
*p
,.0
1; *
*p
,.0
01,
n5
274.
Nyambegera et al.: The impact of cultural value orientations 653

Tabl
e 6
Mul
tipl
e re
gres
sion
res
ults
of
cult
ural
val
ue o
rien
tati
ons
on H
RM
pre
fere
nces
Uns
tand
ardi
zed
regr
essi
on c
oef�
cien
tsIn
depe
nden
t va
riab
les
Dep
ende
nt v
aria
bles
Hum
an r
esou
rce
invo
lvem
ent
Pre
dict
abili
ty o
fH
R r
ewar
dsPe
rfor
man
ce v
slo
yalt
y H
RM
pra
ctic
esH
uman
res
ourc
eem
pow
erm
ent
DR
2B
DR
2B
DR
2B
DR
2B
Step
1.1
1***
.10*
**.0
7**
.07*
Age
.03
.05
2.0
2.0
3G
ende
r.0
9.0
3.0
32
.07
Eth
gp a
.67*
*.3
92
1.01
**.1
5E
thgp
b.8
8***
.67*
**2
.70*
*.5
3**
Eth
gp c
.09
2.0
52
.84*
*2
.01
Eth
gp d
.75*
*.3
02
.73*
*2
.05
Eth
gp e
2.1
4.2
52
.52
.41
Eth
gp f
.52*
.79*
**2
.62*
*.1
2E
thgp
g.2
0.5
82
.33
.19
Step
2.1
3***
.09*
**.0
3.0
8**
Act
ivit
y: D
oing
Act
ivit
y: T
hink
ing
Hum
an n
atur
e: G
ood
or E
vil
Rel
atio
nal:
Hie
rarc
hica
lR
elat
iona
l: I
ndiv
idua
lR
elat
ion
to n
atur
e: H
arm
ony
Rel
atio
n to
nat
ure:
Mas
tery
Rel
atio
n to
nat
ure:
Sub
juga
tion
.13
.44*
**2
.08
.08
2.0
2.0
12
.03
.10
.19*
*.0
82
.02
.08*
.15*
*2
.10
2.0
12
.08
.05
2.1
3.0
62
.08
.08
.01
.02
.03
.10
2.0
22
.06
2.2
1***
.02
.01
.03
2.0
7
Not
esS
igni
�ca
nt B
at
p,
.05,
are
sho
wn,
p,
.05*
, p
,.0
1**,
p,
001*
**.
Adj
uste
d R
squ
are
.19
.14
.4.0
9D
egre
es o
f fr
eedo
m17
/253
17/2
5317
/253
17/2
53M
issi
ng d
ata
wer
e de
lete
d li
stw
ise.
Eth
nic
grou
p (E
thgp
) w
as d
umm
y va
riab
le c
oded
. The
ref
eren
ce c
ateg
ory
for
all
dum
my
vari
able
s is
min
ority
gro
ups
like
the
Mas
ai (
past
oral
ists
), a
nd i
nclu
des
Eur
opea
ns,
Am
eric
ans,
and
Ara
bs.
Thi
s gr
oupi
ng o
f m
inor
itie
s w
as c
oded
as
O f
or a
ll se
ven
vari
able
s re
pres
entin
g et
hnic
gro
up.
654 The International Journal of Human Resource Management

HRM preferences link. It can be seen, for example, that ethnic group has an importantrelationship with HRM preferences.
Discussion
One task was to � nd out whether cultural value orientations impact on individualemployee HRM preferences and, if so, to what extent. We would argue that valuesorientations are deep pre-existing structures developed in early socialization, whereasthe preferences for speci� c HR policies (attitudes) develop at a later stage in life. In thiscontext it is reasonable to infer that values predict HR preferences, though we acceptthat correlations cannot conclusively prove this. The hypothesis that cultural valueorientations in� uence individual HRM preferences was supported. However, not allHRM policies and practice preferences are in� uenced by cultural value orientations.From the four factors that emerged, human resource involvement/participation,predictability of rewards, and human resource empowerment were related to culturalvalues, while performance vs loyalty-related HRM practices came out as values free.The study shows that, overall, HRM preferences re� ect a cultural interpretation, as therewere signi� cant associations between cultural values and three HRM factors. This� nding indicates that HRM models with an Anglo-Saxon base are not adaptable tointernational research. Presuming the value orientations of people in developingcountries without delineating the cultural and physical domain is inappropriate. Theactivity thinking sub-category value orientation had the highest in� uence on preferencesfor HR involvement. For example, earlier writings recommend detachment ofemployees in developing countries from the decision-formulation and decision-makingprocess (e.g. Jaeger, 1990). However, the results of this research indicate that it can � twell with the employee’s preference if she/he is involved or participates in the decisionsthat touch on her/his welfare. This is in line with Negandhi’s (1975) � nding thatworkers in developing countries, too, desire ‘quality employment’ by, among otherthings, being given participative leadership and involvement in decision making withintheir organization.
The argument in the developing economy HRM literature to date has been thatdeveloping countries’ socialization makes people passive and reactive to tasks (Jaeger,1990). The results here showed that in general Kenyans would like to think throughissues (Activity: Thinking) before acting. They view work as central to their existence(Activity: Doing), a value that, again, correlates with HR involvement. Relation tonature mastery also demonstrated a signi� cant zero-order correlation with humanresource involvement/participation, which is a re� ection of their high scores on activitythinking and activity doing. A mastery-oriented people, such as those studied in thissample, would prefer to be involved in issues that affect them as they may not believein external forces acting for them. This result is perhaps a re� ection of the increasingnumber of young people in Kenyan organizations, and certainly in our sample.Furthermore, their involvement could lead to management making more informeddecisions.
Three value orientations had a signi� cant relationship to preference for predictabilityof rewards both at the zero-order level and in the multiple regression analysis, namely:Activity: Doing; Relational: Hierarchical and Relational: Individual. In a society likeKenya, a kind of individualism is evident whereby the one who is employed is seen asthe cream of a group/family and he/she should be the one to provide. This calls forimprovement of the individual in order to meet such obligations. If one is looked uponas the sole provider, there is no doubt that one would prefer predictable rewards.
Nyambegera et al.: The impact of cultural value orientations 655

Trompenaars (1993) points out that, in some societies, individualism and collectivismare complementary, whereby the collectivist culture sees the group as its end andimprovements to individual capacities as a means to that end. Again, as pointed outearlier, Sinha and Tripathi (1994) argue that it is possible to � nd both collectivist andindividualistic cultures depending on context, a result reported in this sample. Lane etal. (1997) indicate that among the characteristics of hierarchical societies is thede� nition of relationships as group oriented, which might explain this value’sassociation with predictable rewards. Predictable rewards and incentives are preferredin this sample as they can assure the employee of a future, given the obligations in acollective society like Kenya, where responsibility to kith and kin are very real. Grouprewards are not preferred as it may not be easy to predict when group effort is going tobear fruit. Individually one is able to set targets and exert enough personal effort tomeet them. People who are high on activity doing have their focus on work, they do notspend time in unnecessary leisure and would like to be sure of the bene� ts that accruefrom hard work, especially given the uncertain environment in developing countries.
Relational: Hierarchical was negatively related to policies that depicted humanresource empowerment. In addition, there was a signi� cant negative zero-ordercorrelation with human nature good or evil and relation to nature subjugation. Givenearlier results showing a preference for empowerment, the negative associationindicates that the sample resents centralized arrangements to some extent, especially ifthose in authority manage by fear. In such circumstances, employees prefer to beempowered probably to help reduce the fear created by those in authority. The negativeassociation between human nature good or evil at the zero-order level shows thatemployees believe that some superiors are not honest, hence the quest for empower-ment. Moreover, the negative signi� cant relationship between relation to naturesubjugation and HR empowerment at the zero-order level indicates that Kenyans’ non-dependency on the supernatural or some other external force leads them to seekempowerment to enable them change situations that affect them.
There is a tendency towards the mid-point in the relational hierarchical sub-categoryand human nature good or evil. The results show that hierarchical relations are acceptedbut not appreciated totally. The main reason would be that many in authority have mis-used those positions, mostly by staf� ng the organization with relatives, people from thesame ethnic group or those who are politically expedient, to the extent that those whodo not have such an opportunity tend to resent those in authority. Kamoche (1992) notesthat ethnicity in the workplace might manifest itself in various forms, including: straightfavouritism in recruitment and promotion or in the search for ethnic homogeneity, asobserved by Blunt (1980). Further, this being a collective society, practices offavouritism are on ethnic and kinship lines, indulged in as a way of dischargingobligation to kith and kin. It was apparent from this study that some organizationsemployed a very high proportion of particular ethnic groups, especially if the topmanagers belonged to a speci� c ethnic group. This could point to why the presentgeneration of Kenyans in this sample want to be empowered to question some practiceswithout fear of intimidation.
There is agreement that most people are a mixture of good and evil. The reason wecan attribute the negative relationship between this value orientation and empowermentis that, since not all people are good, even managers can misuse their authority forsel� sh ends. Employees prefer to participate in the evaluation process, as managersalone can use the exercise to intimidate some employees. Tall organization structuresare not preferred because the higher the structure the more likely you are to meet evilmanagers who are able to pass blame to others. Furthermore, managers can use the tall
656 The International Journal of Human Resource Management

structure to frustrate subordinates. Rewards considering quali� cations and skills aremore quanti� able, hence not easily abused by evil-minded superiors. This could be thereason for the non-signi� cant relationship between HR empowerment and human naturegood or evil, when relational hierarchical is controlled in multiple regressionanalysis.
The only factor which came out as ‘values free’ is preference for performance-relatedHRM practices. Overall, there is individual variation among respondents. Consequently,we cannot claim to give a full explanation of why some HRM policies and practices areculture common and others are culture speci� c, other than a linkage to demographic andinternal labour market factors or accepted best practice. These � ndings answer oursecond research question, i.e. which cultural value orientations in� uence HRM policyand practice and to what extent. We have been able to support empirically the aphorismin the international management literature that ‘some practices are culture speci� c whileothers are culture common’. This last point is slightly problematic, given the associationwe have observed with ethnic group. Three of the four HR factors have a clear culturalvalues root. HR involvement preferences are related to activity thinking values.Predictability of rewards is related to high activity doing values. Empowerment HR isrelated to low relationships hierarchical values. However, one of the factors –preferences for performance vs loyalty-based HRM – was intriguingly a values-freejudgement by individuals. Ethnic factors played a role here. It is important to note thatthere were no signi� cant differences in values between the ethnic groups. It wasmembership of certain ethnic groups that was associated with the desire for moreloyalty-based HRM systems – presumably because in such situations the elite of theorganization also re� ects the same ethnic membership and so loyalty is seen to be arelevant performance criterion. Ethnicity outweighs the set of generic cultural valuesexamined in this study when questions about the philosophical focus of the HRMsystem (and its judgement about the basis of performance – i.e. individual competenceor loyalty) come into play. This interaction between ethnicity and cultural values as anexplanation of HRM in a developing country context is a � nding that should inform thedesign of future studies carried out in this area.
Limitations of the present study
Studies employing only self-report measures face the problem of ‘shared methodvariance’ – due to the reliance on a single method of data collection leading to‘contamination’ across the measures. However, self-report measures are the only meansof assessing both individual cultural values and HRM policy preferences. In order toaddress this problem the main parts of the questionnaire were differentiated. By usingdifferent response formats in different sections of the questionnaire ‘cross-contamination’ was minimized (Schmitt, 1994). To ascertain the level of independenceof the measures, the total dataset across cultural values and HRM preferences wassubjected to a principal components analysis with varimax rotation, revealing themeasures were independent, as no cultural value orientation items loaded on HRMpreference items and vice versa. Further, since individual responses to the ques-tionnaires were anonymous, method bias due to social desirability is minimized(Oppenheim, 1992).
Conclusion
HRM is not an exogenous phenomenon, as national culture, structure, and othercontingent factors affect it (Hofstede, 1993; Chandler, 1962; Hickson et al., 1974). The
Nyambegera et al.: The impact of cultural value orientations 657

ability for an organization to reduce the mis� t between employee preference and actualpractice has a signi� cant impact upon perceptions of ‘need satisfaction’ amongemployees. The consequences of a major mis� t may take any of a number of forms oforganizational malaise, such as widespread alienation (Blunt, 1982), high labourturnover, absenteeism, or damage to company property (Blunt and Popoola, 1985).Minimization of the gap between employee preferences and actual practice could leadto high levels of job satisfaction and organizational commitment (Sparrow and Wu,1998). This study shows one way in which such preferences could be predicted fromcultural values. Such in� uence can be linked to management policy and practice and� ndings related to some desirable outcome like job involvement or organizationalcommitment. More meaningful cultural values emerge when using pure cultural valueorientation scales, rather than the Hofstede-type bipolar dimensions. Further, we haveargued that concentrating on the structure of items within work-related preferencemeasures across national samples is not suf� cient. At the individual level, this researchexamined relationships between cultural value orientations and HRM policy andpractice preferences in Kenyan organizations. This is a step towards helpinginternational managers adjust HRM policies to match employee expectations. We haveshown that culture (via its proxy of value orientations) can be studied separately fromother national elements. When this is done we are able to see which value orientationsare held by Kenyans and which of these value orientations impact on HRM policy andpractice and to what extent. Here, HRM preferences re� ected a cultural interpretationleading to the conclusion that adapting American models with US-based values todeveloping economies is not appropriate. It is important for the international managerto know which value orientations are held by a people of a particular country or regionand to what extent those value orientations in� uence work preferences. Then theinternational manager operating in a particular country will know how to realignmanagement policy practice with preference.
This empirical examination of the Kenyan work preferences raises a number of issuesfor future research. First, a better, understanding of HRM policy preferences can begained by examining employees’ cultural values. Second, the � ndings show that, todevelop the area of comparative HRM, it is necessary to understand HRM from anAfrican context. This calls for more studies in other African countries especially, Sub-Saharan Africa. Third, the � ndings question the applicability of US models of HRMlike the Harvard model to international research in general, and developing countries inparticular – as the HRM preferences were predicted by cultural values. This suggests anagenda for future research in developing countries, in that it is important to determinethe likely consequences of mis-match between HRM policies, preferences’ and culturalvalues.
Notes
1 Research assistants were given prior training covering the items in the questionnaire and onhow to respond to possible questions from respondents. They all had some researchexperiences.
2 Ethnic group was coded and analysed as a dummy variable .
Appendix 1
In this paper, we assume the factor structure for the value orientations scale presentedby Maznevski and DiStefano (1995). This is because of the larger size and widergeographical range of their sample, which would ensure greater variance among the
658 The International Journal of Human Resource Management

items. Within one country, it is more likely that there will be a restriction of range inthe items, which will affect the inter-item correlations and hence the factor structure ofthe items for that country. Bearing these limitations of within-country analyses in mind,we nevertheless conducted some analyses to help establish the construct validity of thevalue orientations questionnaire within this Kenyan sample.
It was not possible to conduct exploratory or con� rmatory factor analyses on theentire scale: given seventy-nine items in the value orientations scale and a sample ofless than 300, the ratio of respondents to variables is , 4. This ratio is then not suitablefor multivariate analyses (Tabachnik and Fiddel, 1983). Therefore, we conductedexploratory principal components analyses (PCAs) on each set of items within a givendomain (activity, human nature, human relationships, relationships to nature). For theseanalyses, we chose PCA with oblique rotation (OBLIMIN) rather than con� rmatoryfactor analysis (CFA) because we were initially unsure whether the items wouldconform to theoretical expectations, given the problems outlined above on restriction ofrange. PCA is then useful here for two reasons (Hurley et al., 1997). First, unlike CFA,PCA is able to uncover non-hypothezised cross-loadings. Second, the provision ofeigenvalues in PCA provides direct diagnostic information on the number of factorsunderlying the data. Therefore, PCA provides a number of diagnostics to allow us both:to examine any discrepancies between the structure of the items in this sample and thestructure reported by Maznevski and DiStefano, (1995); and to change the compositionof the scales if discrepancies were too great. Further, CFA using single item indicatorscan be problematic (Kelloway, 1995), especially given single-item indicators are likelyto have small but non-zero loadings on other factors, which could bias � t indices inCFA (Hurley et al., 1997). Oblique rotation was chosen as we expected the factors tocorrelate.
In each case, scree plots indicated the expected number of factors underlying theitems in each domain (i.e., three factors for activity, human relationships andrelationships to nature, two factors for human nature). We considered an item to load ona factor if it had both its highest loading on that factor and the loading exceeded .30. Ineach of the domains, for both pattern and structure matrices, over 90 per cent of theitems’ loadings were consistent with the factor structure reported by (Maznevski andDiStefano, 1995). Full details of these analyses are available from the authors.
After these exploratory analyses, as an additional check on the structure of the data,we constructed thirty-two ‘parcels’, or two- or three-item indicators scales for each ofthe eleven scales. These multiple item indicators are less problematic for CFA(Kelloway, 1995), especially as shared variance among the items comprising the parcelis more likely to re� ect a single latent variable accurately. Each scale had threeindicators associated with it, except human nature – changeable, which had two scales,comprising two items and three items respectively. These multiple item indicators werethen used in a CFA to check the indicators conformed to the expected eleven-factorstructure. A model was speci� ed in which each indicator loaded on its hypothezisedfactor, and factors were allowed to correlate. Factor variances were set to 1, to identifythe model. CFA was conducted on the covariance matrix using the EQS programme(Bentler, 1993). Maximum likelihood estimation was used, with robust statisticsbecause of non-normality in the data. The eleven-factor model indicated acceptable � t(robust Comparative Fit Index 5 0.91). Each indicator loaded on its hypothesised factorin the expected direction (p , .00001).
We then chose to adopt the scales as described by Maznevski and DiStefano (1995)for two reasons. First, the convergence between this sample and the expected pattern ofloadings, especially when taken in context of likely range restriction in Kenya. Second,
Nyambegera et al.: The impact of cultural value orientations 659

by using the original scales, it is then easier to make comparisons between this studyand others.
References
Akinnusi, D.M. (1991) ‘Personnel Management in Africa: A Comparative Analysis of Ghana,Kenya and Nigeria’. In Brewster, C. and Tyson, S. (eds) International Comparisons in HumanResource Management. London: Pitman.
Amante, M.S.V. (1993) ‘Human Resource Management in Japanese Enterprises in thePhilippines: Issues and Problems’, Asia Paci� c Journal of Management, 10(2): 237–45.
Austin, J.E. (1990) Managing in Developing Countries: Strategic Analysis and OperatingTechniques . New York: The Free Press.
Begin, J.P. (1992) ‘Comparative HRM: A Systems Perspective’, International Journal of HumanResource Management, 3(3): 379–408.
Bentler, P.M. (1993) EQS Structural Equations Manual. Los Angeles: BDMP.Blunt, P. (1980) ‘Bureaucracy and Ethnicity in Kenya: Some Conjectures of the Eighties’, Journal
of Applied Behavioural Science, 16(3): 336–53.Blunt, P. (1983) Organizational Theory and Behaviour: An African Perspective. Harlow:
Longman.Blunt, P. (1986) ‘Managerial Motivation in Kenya and Malawi: A Cross-cultural Comparison’,
The Journal of African Studies, 24(1): 165–75.Blunt, P. and Popoola, O. (1985) Personnel Management in Africa. Harlow: Longman.Brewster, C. (1995) ‘Towards a European Model of Human Resource Management’, Journal of
International Business, 26(1): 1–22.Brewster, C. and Hegewisch, A. (eds) (1994) Policy and Practice in European Human Resource
Management. London: Routledge.Budhwar, P. and Sparrow, P.R. (1997) ‘Evaluating Levels of Strategic Integration and
Development of Human Resource Management in India’, International Journal of HumanResource Management, 8(4): 476–94.
Chandler, A.D. (1962) Strategy and Structure: Chapters in the History of American Enterprise.Cambridge, MA: MIT Press.
Cichon, M. and Gillion, C. (1993) ‘The Financing of Health Care in Developing Countries’,International Labour Review, 132(2): 173–86.
Cohen, J.M. (1993) ‘Importance of Public Service Reform: the Case of Kenya’, The Journal ofModern African Studies, 31(3): 449–76.
Cray, D. and Mallory, G.R. (1998) Making Sense of Managing Culture. International ThompsonBusiness Press.
Dorfman, P.W. and Howell, J.P. (1988) ‘Dimensions of National Culture and EffectiveLeadership Patterns: Hofstede Revisited’, Advances in International Comparative Management,3: 127–150.
Dowling, P. and Nagel, T. (1986) ‘Nationality and Work Attitudes: A Study of AustralianAmerican Business Majors’, Journal of Management, 12(1): 121–8.
Dowling, P.J. and Schuler, R.S. (1990) International Dimensions of Human Resource Manage-ment. Boston, MA: PWS-Kent.
Easterby-Smith, M., Malina, D. and Yuan, L. (1995) ‘How Culture-sensitive is HRM? AComparative Analysis of Practice in Chinese and UK Companies’, International Journal ofHuman Resource Management, 6(1): 31–59.
Economic Survey (1998) The Kenya Economic Survey. Nairobi: Government Printers.Ekpo-Ufot, A. (1986) ‘Personnel Functions, Practices and Productivity in Nigeria’. In Damanchi,
U.G. and Seibel, D.H. (eds) Management Problems in Africa. London: Macmillin, pp.292–314.
Forster, N. and Whipp, R. (1995) ‘Future of European Human Resource Management: AContingent Approach’, European Management Journal, 13(4): 434–42.
Gershenberg, I. (1987) ‘The Training and Spread of Managerial Know-how: A ComparativeAnalysis of Multinational and other Firms in Kenya’, World Development, 15(7): 931–9.
660 The International Journal of Human Resource Management

Goodstein, L.D. (1981) ‘American Business Values and Cultural Imperialism’, OrganizationalDynamics, 10(1): 49–54.
Grønhaug, K. and Nordhaug, O. (1992) ‘International Human Resource Management: AnEnvironmental Perspective’, International Journal of Human Resource Management, 3(1):1–14.
Grundy, K. (1968) The Lands and Peoples of Kenya, Uganda and Tanzania. A. & C. Black.Hays, W.L. (1988) Statistics , 4th edn. New York: Holt, Rinehart & Winston.Hickson, D.J., Hinings, C.R., McMillan, C.J. and Schwitter, J.P. (1974) ‘The Culture Free Context
of Organization Structure, Sociology , 8: 59–80.Hiltrop, J.M. (1993) ‘Strategic Pressures Driving European HRM’, European Management
Journal , 11(4): 424–34.Hofstede, G. (1980) ‘Motivation, Leadership and Organization: Do American Theories Apply
Abroad?’, Organizational Dynamics, 9: 42–63.Hofstede, G. (1993) ‘Cultural Constraints in Management Theories’, Academy of Management
Executive , 7(1): 81–93.Hofstede, G. (1995) ‘Managerial Values: The Business of International Business is Culture’. In
Jackson, T. (ed.) Cross-cultural Management. London: Butterworth-Heinemann .Holmquist, F. and Ford, M. (1992) ‘Kenya: Slouching Toward Democracy’, Africa Today, 39(3):
97–111.Hunt, J.W. (1981) ‘Applying American Behavioural Science: Some Cross-cultural Problems’,
Organizational Dynamics, 10(1): 55–62.Hurley, A.E., Scandura, T.A., Schriesheim, C.A., Brannick, M.T., Seers, A., Vandenberg, R.J. and
Williams, L.J. (1997) ‘Exploratory and Con� rmatory Factor Analysis: Guidelines, Issues andAlternatives’, Journal of Organizational Behavior, 18: 667–83.
Jaeger, A.M. (1986) ‘Organization Development and National Culture: Where is the Fit?’Academy of Management Review, 11: 178–90.
Jaeger, A.M. (1990) ‘The Applicability of Western Management Techniques in DevelopingCountries: A Cultural Perspective‘. In Jaeger, A.M. and Kanungo, R.N. (eds) Management inDeveloping Countries, London: Routledge.
Jaeger, A.M. and Kanungo, R.N. (eds) (1990) Management in Developing Countries, London:Routledge.
Kamoche, K. (1992) ‘Human Resource Management: An Assessment of the Kenyan Case’,International Journal of Human Resource Management, 3(3): 497–521.
Kanungo, R.N. (1990) ‘Culture and Work Alienation: Western Models and Eastern Realities’.International Journal of Psychology, 25: 795–812.
Kanungo, R.N. and Mendonca, M. (eds) (1994) Work Motivation: Models for DevelopingCountries. New Delhi: Sage.
Kanungo, R. and Wright, R. (1983) ‘A Cross Cultural Comparative Study of Managerial JobAttitudes’, Journal of International Business Studies, Fall: 115–29.
Kelloway, E.K. (1995) ‘Structural Equation Modelling in Perspective’, Journal of Organizationa lBehavior, 16: 215–24.
Kenya Fact Book (1996) Nairobi: Government Printers.Kiggundu, M.N. (1989) Managing Organizations in Developing Countries: An Operational and
Strategic Approach. West Hartford, CT: Kumarian Press.Kluckhohn, F.R. and Strodtbeck, F.L. (1961) Variations in Value Orientations . New York: Harper
& Row.Lane, W.H. and DiStefano, J.J. (1992) International Management Behavior, Boston, MA: PWS-
Kent.Lane, W.H., DiStefano, J.J. and Maznevski, L.M. (1997) International Management Behaviour,
3rd edn. Oxford: Blackwell Business.Laurent, A. (1983) ‘The Cultural Diversity of Western Management Conceptions ’, International
Studies of Management and Organization, 8(1–2): 75–96.McGaughey, S.L. (1994) ‘Work Related Preferences of Undergraduates in Three Nations:
Implications for International Management and Research’, unpublished MBA thesis, MonashUniversity, Australia.
Nyambegera et al.: The impact of cultural value orientations 661

McGaughey, S.L., Iverson, R.D. and de Cieri, H. (1997) ‘A Multi-Method Analysis of Work-related Preferences in Three Nations: Implications for Inter-and Intra-national Human ResourceManagement’, International Journal of Human Resource Management, 8(1): 1–17.
Manso-Pinto, J.F., Gonzalez, J.S. and Gonzalez, A.E. (1993) ‘The Job Attribute Preferences ofChilean Managers’, International Journal of Management, 10(2): 277–9.
Maznevski, M.L. and DiStefano, J.J. (1995) ‘Measuring Culture in International Management: theCultural Perspectives Questionnaire ’, work-in-progress paper presented at the Academy ofInternational Business Annual Meeting.
Maznevski, M. L., Nason, S.W. and DiStefano, J.J. (1993) ‘Fourteen Faces of Culture: A NewMeasurement for Understanding Cultural Perspectives Questionnaire ’, work-in-progress paperpresented at the Academy of International Business Annual Meeting.
Maznevski, M.L., DiStefano, J.J. and Nason, S.W. (1994) ‘The Cultural Perspective Ques-tionnaire: Summary of Results using CPQ4’, unpublished working paper.
Mendonca, M. and Kanungo, N.K. (1990) ‘Performance Management in Developing Countries’.In Jaeger, A.M. and Kanungo, R.N. (eds) Management in Developing Countries, London:Routledge.
Negandhi, A.R. (1975) Organizational Theory in an Open System: A Study of TransferringAdvanced Management Practices to Developing Nations. New York: Dunellan.
Nunnally, J.C. (1967) Psychometric Theory. New York: McGraw-Hill.Onyemelukwe, C.C. (1973) Men and Management in Contemporary Africa. London:
Longman.Oppenheim, A.N. (1992) Questionnaire Design, Interviewing and Attitude Measurement. London:
Pinter.Pieper, R. (ed.) (1990) Human Resource Management: An International Comparison. Berlin: de
Gruyter.Robinson, R.V. (1983) ‘Greet Hofstede: Culture’s Consequences: International Differences in
Work-related Values’, Work and Occupations, 10: 110–15.Saunders, S.M. and Kanungo, N.R. (1995) New Approaches to Employee Management: Employee
Management in Developing Countries, Vol. 3. Greenwich, CT: JAI Press.Schmitt, N. (1994) ‘Method Bias: The Importance of Theory and Measurement’, Journal of
Organizational Behaviour, 15: 393–8.Schuler, R.M. and Jackson, S.E. (1987) ‘Linking Competition Strategy with HRM Practices’,
Academy of Management Executive, 1(3): 207–19.Schuler, R., Dowling, P. and de Cieri, H. (1993) ‘An Integrative Framework of Internationa l
Human Resource Management’, International Journal of Human Resource Management, 4(4):717–64.
Shenkar, O. (1985) ‘Organisational Co-ordination and Motivation according to Confucius and theHuman Relations School: A Comparison’, The Chinese Management Journal, 30: 564–76.
Sinha, D. and Tripathi, R.C. (1994) ‘Individualism in a Collectivist Culture: A case ofCoexistence of Opposites’. In Kim, U., Triandis, H.C. and Yoon, G. (eds), Individualism andCollectivism: Theoretical and Methodological Issues, Newbury Park, CA: Sage.
Smith, P.B. (1992) ‘Organisational Behaviour and National Cultures’, British Journal ofManagement, 3: 9–51.
Smith, P.B., Dugan, S. and Trompenaars, F. (1996) ‘National Culture and the Values ofOrganisational Employees: A Dimensional Analysis across 43 Nations’, Journal of Cross-cultural Psychology, 27(2): 231–64.
Sondergaard, M. (1994) ‘Research Note: Hofstede’s Consequences: A Study of Reviews,Citations and Replications ’, Organizational Studies, 15: 447–56.
Sparrow, P.R. and Budhwar, P. (1996) ‘Human Resource Management in India in the newEconomic Environment’. In Saxena, A. and Devedi, H. (eds) HRM in the new EconomicEnvironment, Jaipur: National Publishing House, pp. 28–73.
Sparrow, P.R. and Hiltrop, J.M. (1994) European Human Resource Management: A Text Book ofTheory and Practice. London: Prentice Hall.
Sparrow, P.R. and Wu, P. (1998) ‘How Much Do National Value Orientations Really Matter?Predicting HRM Preferences of Taiwanese Employees’, Employee Relations, 20(1): 26–56.
662 The International Journal of Human Resource Management

Sundaram, A.K. and Black, J.S. (1992) ‘The Environment and Internal Organisation ofMultinational Enterprises’, Academy of Management Review, 17: 267–99.
Tabachnik, B.G. and Fidell, L.S. (1983) Using Multivariate Statistics . New York: Harper andRow.
Teagarden, M., Butler, M.C. and Von Glinow, M. (1992) ‘Mexico’s Maquiladora Industry: WhereStrategic Human Resource Makes a Difference’, Organizational Dynamics. 20(3): 34–47.
Torrington, D. (1994) International Human Resource Management: Think Globally, Act Locally.London: Prentice Hall.
Trompenaars, F. (1993) Riding the Waves of Culture: Understanding Cultural Diversity inBusiness. London: Economist Books.
Weldon, E. and Jehn, K.C. (1993) ‘Work Goals and Work-Related Beliefs among Managers andProfessionals in the United States and the Peoples Republic of China’, Asia Paci� c Journal ofHuman Resource, 31(1): 57–70.
Yeung, A.K.O. and Wong, G.Y.Y. (1990) ‘A Comparative Analysis of the Practices andPerformance of Human Resource Management Systems in Japan and the PRC’, in Research inPersonnel and Human Resource Management, Suppl. 2, Greenwich, CT: JAI Press, pp. 147–70.
Nyambegera et al.: The impact of cultural value orientations 663