The Impact Of Classroom Observations And Collaborative ...
133
Wayne State University Wayne State University Dissertations 1-1-2016 e Impact Of Classroom Observations And Collaborative Feedback On Evaluation Of Teacher Performance, Based On e Danielson Framework For Teaching Christine L. Hofer Wayne State University, Follow this and additional works at: hp://digitalcommons.wayne.edu/oa_dissertations Part of the Educational Administration and Supervision Commons , Educational Assessment, Evaluation, and Research Commons , and the Education Policy Commons is Open Access Dissertation is brought to you for free and open access by DigitalCommons@WayneState. It has been accepted for inclusion in Wayne State University Dissertations by an authorized administrator of DigitalCommons@WayneState. Recommended Citation Hofer, Christine L., "e Impact Of Classroom Observations And Collaborative Feedback On Evaluation Of Teacher Performance, Based On e Danielson Framework For Teaching" (2016). Wayne State University Dissertations. 1640. hp://digitalcommons.wayne.edu/oa_dissertations/1640
Transcript of The Impact Of Classroom Observations And Collaborative ...

Wayne State University
Wayne State University Dissertations
1-1-2016
The Impact Of Classroom Observations AndCollaborative Feedback On Evaluation Of TeacherPerformance, Based On The Danielson FrameworkFor TeachingChristine L. HoferWayne State University,
Follow this and additional works at: http://digitalcommons.wayne.edu/oa_dissertations
Part of the Educational Administration and Supervision Commons, Educational Assessment,Evaluation, and Research Commons, and the Education Policy Commons
This Open Access Dissertation is brought to you for free and open access by DigitalCommons@WayneState. It has been accepted for inclusion inWayne State University Dissertations by an authorized administrator of DigitalCommons@WayneState.
Recommended CitationHofer, Christine L., "The Impact Of Classroom Observations And Collaborative Feedback On Evaluation Of Teacher Performance,Based On The Danielson Framework For Teaching" (2016). Wayne State University Dissertations. 1640.http://digitalcommons.wayne.edu/oa_dissertations/1640

THE IMPACT OF CLASSROOM OBSERVATIONS AND COLLABORATIVE FEEDBACK ON EVALUATION OF TEACHER PERFORMANCE, BASED ON
THE DANIELSON FRAMEWORK FOR TEACHING
by
CHRISTINE L. HOFER
DISSERTATION
Submitted to the Graduate School
of Wayne State University,
Detroit, Michigan
in partial fulfillment of the requirements
for the degree of
DOCTOR OF PHILOSOPHY
2016
MAJOR: EDUCATION
Approved By:
____________________________________ Advisor Date ____________________________________
____________________________________
____________________________________

©COPYRIGHTBY
CHRISTINEL.HOFER
2016
AllRightsReserved

ii
DEDICATION
Thisworkisdedicatedtomymother,PatriciaMargaretCherry.
Aneducatoratheart,sheinstilledinmeadrivetomakeapositivedifferenceinthe
world,andherexampleandinfluenceisever-present.
Sheaimedforperfection,settleduponexcellence.
PatriciaMargaretCherrytaughtmehowtolivelife,toachievedreams,andtolove
others.
Hers,alifetooshort,worthemulating.

iii
ACKNOWLEDGMENTS
Thanks and appreciation goes to my advisor, Dr. Thomas Edwards, who
preservedwithme over the years, and continuously supportedmy efforts. I am
thankful to themembersofmydissertationcommittee,Dr.S.AsliOzgun-Koca,Dr.
Jennifer Lewis and Dr. Kenneth R. Chelst, who challenged me and guided me
throughoutthisprocess,andwhohavegenerouslygiventheirtimeandexpertiseto
thisendeavor.
I amgrateful tomymany friendsandco-workerswhohaveofferedadvice,
wisdom, and support, especially in the bleakest times, and whose experiences
informedthiswork.ThestrengthIcontinuetogetfromthemkeepsmecentered.
My family members have been steadfast in their support throughout this
processandhavegivensomuchtohelpmebesuccessful,especiallymyfather,Walt
Cherry,andmyhusband,MichaelJ.Hofer.Myfatherismygreatestcheerleader,and
eagerly proofread each iteration of this work, correcting errors and offering
suggestions. MyhusbandoftenhasmorefaithinmethanIhaveinmyself,andhe
continuallypushesmetopursuemydreams. Eventhroughthedevastatinglossof
hisson,mystepson,MichaelR.Hofer, in2013,his love,attentivenessandbelief in
meneverwavered,andforthatIamforevergrateful.

iv
TABLEOFCONTENTS
Dedication ii
Acknowledgments iii
List of Tables vii
List of Figures viii
Chapter 1 Introduction 1
Statement of the Problem 2
Contribution of the Research 5
Chapter 2 Literature Review 8
Commonly Used Terms 8
Historical Roots of Teacher Evaluation 9
Today’s Landscape 13
Other Measures of Effective Teaching 15
Framework for Teaching (FFT) 18
Classroom Observations and Feedback 21
Conclusion to Literature Review 24
Chapter 3 Methodology 27

v
Setting 28
Administrator Training 31
Design – Research Question 1 34
Design – Research Question 2 35
Confidentiality 36
Validity 37
Conclusion to Methodology 39
Chapter 4 Research Findings 41
Quantitative Analysis 42
Surveys – Quantitative Data 56
Qualitative Analysis 65
Conclusion to Research Findings 69
Chapter 5 Summary, Discussion and Recommendations 71
Research Question 1 – Key Findings 74
Limitations to FFT 85
Research Question 2 – Key Findings 87
Summary of Findings 94

vi
Limitations to the Study 97
Recommendations for Future Studies 97
Recommendations at the District and State Levels 98
Conclusion 99
Appendix A: Framework for Teaching (FFT) Standards 102
Appendix B: Classroom Observation Form 104
Appendix C: Letter of Support 106
Appendix D: Coded Private Information Agreement 107
Appendix E: Teacher Survey 108
Appendix F: Administrative Survey 111
References 114
Abstract 121
Autobiographical Statement 123

vii
LIST OF TABLES
Table 1: Framework for Teaching (FFT) Domains and Components……………… 5
Table 2: Evaluation Ratings Year 1 – Year 4 ……………………………………… 42
Table 3: Demographic Information from Longitudinal Data……………………… 44
Table 4: Frequency of Years Evaluated…………………………………………… 46
Table 5: Evaluation Ratings Over Time…………………………………………… 47
Table 6: Crosstabulation of Rating and Experience……………………………….. 50
Table 7: Crosstabulation of Rating and Subject Taught…………………………… 51
Table 8: Crosstabulation of Rating and Core/Non-Core………………………. 52
Table 9: Crosstabulation of Rating and Grade Level……………………………… 53
Table 10: Crosstabulation of Rating and Elementary/Secondary……………….. 53
Table 11: Crosstabulation of Rating and Building………………………………….. 54
Table 12: Outlier Analysis – Summary of Cases……………………………………. 55
Table 13: Teacher Demographic Information from Survey………………………… 58
Table 14: Administrator Demographic Information from Survey………………….. 59
Table 15: Side-by-side Comparison of Teacher and Administrator Survey Results.. 61
Table 16: Mann Whitney U – Teacher and Administrator Survey Results …………. 64
Table 17: Statistically Significant Results of the Kruskall Wallis H Test………….. 64
Table 18: Summary of Comments from Teacher and Administrator Surveys………. 67
Table 19: Statistically Significant Associations between Teacher and Administrator Surveys…………………………………………………………………… 93

viii
LIST OF FIGURES
Figure 1: Evaluation Process with Framework for Teaching (FFT) Embedded …. 31
Figure 2: Teacher Experience Organized by Level from Year 4 of Longitudinal Study…………………………………………………………………….
43
Figure 3: Teacher Experience Organized by School from Year 4 of Longitudinal Study…………………………………………………………………….
43
Figure 4: Subject Taught Organized by Level from Year 4 of Longitudinal Study…………………………………………………………………….
45
Figure 5: Subject Taught Organized by School from Year 4 of Longitudinal Study…………………………………………………………………….
45
Figure 6: Friedman’s Two-way Analysis of Variance by Ranks……..…………… 47
Figure 7: Post Hoc Analysis - Pairwise Comparisons….…………………………. 48
Figure 8: Teacher Experience from Survey Data…………………………………. 57
Figure 9: Teacher Evaluation Ratings from Survey Data…………………………. 57
Figure 10: Administrator Experience from Survey Data…………………………… 58
Figure 11: Administrator Level from Survey Data…………………………………. 59
Figure 12: Teacher Response to “What is Necessary … to Advance to the Next Level?”…………………………………………….…………………….
66
Figure 13: Administrator Response to “What is Necessary … to Advance to the Next Level?”…………………………………………………………….
67

1
CHAPTER 1 INTRODUCTION
The political landscape has changed dramatically during the recent past,
particularly as it pertains to public education. Neighborhood schools, one of the
hallmarks of American public education, are not necessarily the norm today, as parents
choose between their local school, charter schools, private schools, cyber schools and
schools of choice. We have entered into an era of choice, competition, and accountability,
emulating the business model. The line between public education and business is no
longer clear, and laws are changing rapidly to obscure the line even further. The changes
with respect to public education impact all aspects of the system, including funding,
accountability, certification of teachers and administrators, student accountability, special
education, and teacher tenure and evaluation.
One significant development involves the method in which teachers are evaluated,
including the measures and tools that are used. Many states, including Michigan, now
require that teachers are observed multiple times a year by administrators, and also tie
student achievement data to teacher evaluations. Laws have changed to allow for the
relatively quick removal of teachers who are ineffective, or whose students do not show
adequate achievement. In Michigan, teacher evaluation has traditionally been an item
bargained by local unions and districts, but recent legislation has made this practice non-
negotiable (Legislative Council, 2011). There now exist stipulations in the law that
specify how teachers are evaluated, and require that teacher evaluations be used when
considering lay-offs, as opposed to the long-held practice of laying off by seniority. The
issues involving the implementation of high-stakes evaluation systems pose a number of

2
challenges. Even as districts throughout the state work feverishly to comply with recent
legislation, further legislation is being passed, signed into law and taking effect. There is
little direction given to districts, and no time to research or adequately plan for new
systems. Despite the “tremendous activity at the policy level, the reality is that most
states have barely begun to implement these new systems” (National Council on Teacher
Quality, 2015). Additionally, there has been very little research examining how these
policy changes are translating into actual practice and whether or not there has been any
impact on teacher effectiveness.
Statement of the Problem
It seems a simple notion – more effective teachers will produce higher achieving
students compared to their less effective counterparts. Few people will disagree with the
idea that teachers should be held accountable for the students’ learning. The crux of the
debate revolves around the process that is employed (the accountability tool and its
consequences) to determine effectiveness, and to what extent this impacts teacher
effectiveness and student achievement. The determination of effectiveness is not
straightforward, and the variables that impact student performance are plentiful and not
yet completely understood. The expertise and commitment of the evaluators, typically
administrators, will have a strong impact on evaluation results and must be considered.
Now that Michigan districts have a few years experience of implementing new evaluation
measures that require frequent classroom observations, to what extent are these changes
improving teaching?
Learning and teaching are complex behaviors that are influenced by a plethora of
variables. In order to determine the extent to which teacher effectiveness is impacted by

3
this new evaluation model, we must first define teacher effectiveness, and examine which
components of effective teaching impact student achievement. One such tool, Charlotte
Danielson’s Framework for Teaching (2007), was developed to help educators improve
their practice and identify effective teaching strategies. Danielson is a leading figure in
teacher evaluation methods, particularly in classroom that employ constructivist
instructional strategies, and many districts have adopted her framework for teaching as
part of their teacher evaluation systems. This framework has gained widespread use
throughout Michigan not only for its intended purposes, but also for evaluative and
improvement purposes. In fact, 61.4% of Michigan school districts currently use the
Framework for Teaching (hereafter FFT) in their evaluation process (Michigan
Department of Education, 2016).
During this era of change relating to the evaluation of educators, the FFT has
emerged as one of the leading evaluation tools used by administrators. The FFT has been
adopted in at least nine states as the official framework for teacher evaluation (Danielson
Group, 2013) and that number is growing. Charlotte Danielson, the author of the FFT,
acknowledges the enormous complexity of teaching and her framework attempts to create
“a definition of teaching that is simultaneously clear and succinct (it can be written on a
single page) and respectful of the intricacies of the work” (Danielson, 2007, p. v). Her
background with the Educational Testing Service (ETS) provided a foundation for
developing criteria for educators.
In 1987, the ETS developed a program detailing the essential skills for
Professional Assessments for Beginning Teachers, referred to as Praxis. The Praxis
Series is grounded in research on pedagogical content knowledge and the Interstate New

4
Teacher Assessment and Support Consortium (INTASC, 1992) standards. While Praxis I
and II pertains to pre-professionals, Praxis III identifies criteria relating to assessing
teaching skills and classroom performance. Danielson worked at the developmental
phase of the program and participated in fieldwork and pilot testing. While her work
with the ETS was geared toward licensing qualified educators, she soon began to see how
useful the criteria could be for all educators. Her vision was to create a framework that
detailed good teaching in order to provide teachers, novice and veteran, an opportunity to
have meaningful conversations surrounding sound instructional practices (Danielson,
2007).
Today, the FFT is intended for all teachers and support staff, including
counselors, schools nurses, social workers, library and media specialists and others. It
serves as a mechanism for professional growth and provides a common language for
conversations about teaching between educators. The process of reflecting on one’s
teaching using the FFT standards as a guide, collaborating with colleagues, and making
modifications based upon these conversations, “is critical to both enriching the
professional lives of educators and to ensuring that the components used in a given
setting actually do apply there” (Danielson, 1996, p. 5).
The FFT is designed to assess the complex art of teaching across all grade levels,
subject areas, and experience levels. The FFT identifies performance standards that are
accompanied by a set of rubrics. Each rubric has a four-level rating scale: unsatisfactory,
basic, proficient, and distinguished. The model is organized into four domains of
professional practice: planning and preparation, the classroom environment, instruction
and professional responsibilities. Each domain is further divided into 22 performance

5
components and 76 smaller elements. The domains and components are shown in Table 1
and the full framework is found in Appendix A. The comprehensive, generic framework
and its accompanying rubrics for each domain and component provide a common
language for practitioners.
Table 1 Framework for Teaching (FFT) Domains and Components Domain Components
1. Planning and Preparation 1a. Demonstrating Knowledge of Content and Pedagogy 1b. Demonstrating Knowledge of Students 1c. Setting Instructional Outcomes 1d. Demonstrating Knowledge of Resources 1e. Designing Coherent Instruction 1f. Designing Student Assessment
2. The Classroom Environment 2a. Creating an Environment of Respect and Rapport 2b. Establishing a Culture of Learning 2c. Managing Classroom Procedures 2d. Managing Student Behavior 2e. Organizing Physical Space
3. Instruction 3a. Communicating with Students 3b. Using Questioning and Discussion Techniques 3c. Engaging Students in Learning 3d. Using Assessment in Instruction 3e. Demonstrating Flexibility and Responsiveness
4. Professional Responsibilities 4a. Reflecting on Teaching 4b. Maintaining Accurate Records 4c. Communicating with Families 4d. Participating in a Professional Community 4e. Growing and Developing Professionally 4f. Showing Professionalism
Note: Adapted from the FFT (Danielson, 1996) Contribution of the Research
Nearly every state legislature is wrestling with the issue of teacher evaluation, and
many states have made significant changes recently to address the national movement to

6
redesign teacher evaluation systems. According to the Danielson Group (2013), the
“Framework for Teaching has become the most widely used definition of teaching in the
United States and has been adopted as the single model, or one of several approved
models, in over 20 states” (The Framework section, para. 2). Michigan has recognized
the FFT as one of several “approved” models for districts to use. Considering the
widespread use of the FFT for evaluative purposes, research is sparse and undeveloped,
thus warranting further investigation.
At its heart, the FFT focuses on improvement of instructional practices. This is
accomplished through meaningful conversations built upon a common language (rubric).
In other words, collaboration is a key component to improvement, and must be built into
the overall system. According to the Danielson Group website (2013), districts should
design a system that includes a “collaborative observation cycle” consisting of a pre-
observation conference, a classroom observation, shared written notes, written feedback
from teacher, evidence assigned to components in the FFT, assessment of performance
level, and a post-observation conference to reach consensus on the performance level,
strengths and areas for growth. Research conducted in Chicago by Sartain, Stoelinga and
Brown (2011) bears this out, recognizing that while the FFT “provides a tool for rating
teaching, the conferences were intended to be the lever for translating the ratings into
changes in instructional practice” (p. 21). The successful implementation of this type of
collaborative cycle is dependent upon trained administrators who are committed to the
process.
The national quest to reform the teacher evaluation system has gained momentum
and changes are happening quickly; however it is not clear whether or not the new

7
systems put into place will accurately measure teacher effectiveness. The FFT relies
heavily on collaboration and professional conversations between evaluators and teachers,
yet few districts have provided training or developed protocol to assist in these critical
conversations. Creating a system within the school to support collaborative
conversations is vital if the FFT is to be implemented with fidelity.
Bentley School District administrators have been using the FFT since the 2011-
2012 school year to evaluate teachers, and have included a collaborative component as
part of the system. Bentley administrators provide feedback to each teacher after an
observation, linking comments to specific FFT components. This study will focus on the
system that has been established in the Bentley School District, and the administrators’
role in the process to determine whether the use of the FFT embedded in the evaluation
process has produced instructional improvements over time. The researcher will then
examine whether or not some groups show greater growth than others. Secondly, this
study will investigate the types of interactions that occur surrounding teacher evaluations
and the impact this has, if any, on performance.
The main research questions raised are:
1.) Does teacher evaluation using the FFT embedded in the process produce
instructional improvement over time?
2.) What interactions around the FFT between evaluator and teacher contribute to
teacher performance?

8
CHAPTER2LITERATUREREVIEW
Commonly Used Terms
Effective teaching and effective teachers are terms that require defining, yet the
definitions are not simple, nor straightforward. Using student growth or achievement
data in determining teacher effectiveness is based on the fundamental belief that “good”
schools, teachers or principals, bring about student growth in excess of that found with
“bad” schools, teachers, or principals (Betebenner, 2009, p. 42). The Race to the Top
definition of an effective teacher is one whose “students achieve acceptable rates (e.g., at
least one grade level in an academic year) of student growth” (Goe & Holdheide, 2013, p.
12).
In contrast, the Measures of Effective Teaching (MET) Project (2013) defines
effective teaching as, “sensitivity to students’ academic and social needs, knowledge of
subject-matter content and pedagogy, and the ability to put that knowledge into practice,
all in the service of student success” (p. 3). Another document, the MET Project policy
brief (2013), recommends that multiple measures of effective teaching be used, including
classroom observations, student perception data, and student achievement data. There are
many similar definitions for effective teaching found in current literature, most of which
refer to using multiple measures for determining effectiveness in addition to student
growth/achievement data. Oddly, considering how prevalent is the practice of comparing
our educational system to those in other countries, there are few countries that “use
student achievement scores as the primary criterion for teacher evaluation” (Williams
& Engel, 2012, p. 54).

9
Insomecases,definitionsofeffectiveteachingincludestudentachievement
orgrowthdata,asindicatedinpreviousexamples.TheFFT,amodeldevelopedby
Charlotte Danielson, however, does not directly link these factors to teacher
effectiveness ratings, but instead measures effectiveness against standards of
practice. Thestandardsarecomprehensive,andspanover fourbroaddomainsof
professional practice: planning and preparation, the classroom environment,
instruction, and professional responsibilities. This coherent set of standards
embodies effective teaching (Danielson, 2007). The four domains, and the
components contained therein, define teacher practices that are considered
effective.Thissetofstandards,referredtoastheFFT,willbetheworkingdefinition
of“effective”forthisstudy,andtheyare“groundedintheconstructivistapproach”
(Danielson,2007,p.17).
HistoricalRootsofTeacherEvaluation
A review of the historical roots of teacher evaluation will show how such a drastic
change occurred over a relatively short period of time. In 1983, public dissatisfaction
with the public education system was growing, and when a federal commission published
A Nation at Risk (National Commission of Excellence in Education, 1983), the spotlight
was placed squarely on the flaws of our educational system (Fowler, 2009). In the years
that followed, many studies were conducted on various aspects of the educational system
in our country, including the evaluation system for teachers. Frequently touted
buzzwords included student achievement, standardized testing, choice, and
accountability. Questions revolved around how to best evaluate students, teachers and
schools. Policies were introduced and implemented that could be viewed as a “revolt

10
against the aging school organization inherited from the nineteenth and early twentieth
centuries and as a search for a new paradigm” (Fowler, p. 352). The implementation of
No Child Left Behind (NCLB) in 2002 put the issue of accountability into the forefront of
public opinion, and schools began to be rated based on student achievement in
mathematics and reading (No Child Left Behind (NCLB) Act, 2001). This act not only
brought the issue of student achievement based on standardized testing to the attention of
the public, but moved the discussion closer to connecting teacher effectiveness to this
data.
A great deal of controversy was created by NCLB, pitting lawmakers and
educators against each other. The goal of NCLB, that one hundred percent of students
will be proficient by the year 2014, is one that few educators believed as being realistic,
although in the light of public opinion and media coverage, it was not an easy task to
speak against NCLB. (Do you believe it is acceptable to leave some children behind?)
Since its implementation in 2001, the direction and focus of our educational system has
shifted in some significant ways. Schools, faced with the pressure of doing well on the
standardized test (which is now “high stakes”), felt pressure to expend effort and energy
into ensuring students performed well on these tests, as opposed to using instructional
practices and assessment techniques that are rooted in research-based, best practices.
Berliner (2009) criticizes NCLB because it rigidly prescribes what teachers do and
reduces autonomy of teachers. This in turn has a negative affect on the professionalism of
teaching. There are many other negative side effects of this accountability system, such
as “teaching to the test,” skewing the curriculum to match the predicted items on the test,
and teaching the lower-level thinking skills that standardized high-stakes tests assess.

11
Additionally, the legislation is discouraging to educational professionals, and certain
subject areas (those tested) are given priority over others (Cho & Eberhand, 2013).
After the implementation of NCLB, it became common practice to evaluate
schools based on student data. Discussion continued regarding reform measures for
teacher evaluation, however. The NCLB act requires teachers to be “highly qualified,”
which means that teachers have attended an approved teacher preparation program and
passed state tests in their subject area. Holley (2008) agrees that NCLB was correct in
deeming that teacher quality is an essential component of accountability, but states that
the law does not go far enough and “the policy should focus on ‘Highly Effective
Teachers,’ not ‘Highly Qualified Teachers’” (p. 63). He argues that the outcomes of
education, student achievement gains, are the most effective way to measure teacher
quality. The push to implement new methods of evaluating teachers using student
achievement data quickly gained momentum and support in the public arena.
The increased use of standardized testing resulted in a proliferation of data on
student achievement, and it became simple and common practice to compare and rank
schools based on the results. Teacher evaluations, on the other hand, continued as usual,
as outlined in the teacher contract. The union influence, particularly in Michigan, placed
limitations on the evaluator. It was not uncommon for a principal to visit classrooms once
per year, and sometimes even less frequently. The teacher often put on a “dog and pony
show” and then went back to business as usual. Evaluators visited classrooms, and wrote
evaluations about the lesson. Little useful feedback was given to teachers. The entire
evaluation process, from a teacher’s perspective, was passive. If the object of these
evaluations was improvement, it was not working. “It is scarcely surprising that teachers

12
don’t learn much as a consequence of the traditional supervision process; they aren’t
doing anything” (Danielson, 2007, p. 4). Attention to the evaluation process increased
when it became common that a school’s performance data and the quality of teachers, as
determined by teacher evaluation tools, did not align. The process of removing
ineffective teachers was rigorous, time-intensive, and expensive; therefore they were
rarely identified or removed.
Teacher evaluations continued to be almost exclusively positive, yet standardized
test scores told a different story. The Widget Effect (Weisberg, Sexton, Mulhorn, and
Keeling, 2009) studied teacher evaluation practices in four states and found that 94 –
98% of teachers receive positive ratings and less than one percent are rated as ineffective.
The Widget Effect exposed a broken evaluation system in terms of accountability and
connection to performance rewards, such as salary. The report essentially pointed out that
across the nation, teachers are nearly always rated as being satisfactory in their job
performance. This created a fresh wave of reform measures and legislation, much of
which has now been passed by state government and often revamps teacher evaluation
systems in significant ways. The New Teacher Project (2013) summarized flaws in a
traditional evaluation system that came to light in the Widget Effect (2009). They include
infrequent evaluations that are unfocused and based on superficial judgments, as opposed
to student achievement data, undifferentiated (pass/fail), unhelpful and inconsequential.
The Widget Effect concludes that excellence goes unrecognized, teachers are given
inadequate professional development, novices are not given the support they need and
poor performance goes unaddressed.

13
The more recent Race to the Top legislation from the Obama administration feeds
the country’s quest for better education and accountability measures (Civic Impulse,
2015). The policy changes in this legislation link student achievement data, as measured
by a high-stakes standardized test, to districts, schools and teachers. Many states have
adopted the Race to the Top Legislation because they will automatically get relief from
the sanctions resulting from non-compliance to the NCLB legislation (districts that do not
have one hundred percent of students in grades three through eight proficient in
mathematics and reading will be non-compliant, or “failing” schools). The Race to the
Top legislation entices states to link teacher evaluations, performance reviews and even
salary to the results of student achievement tests.
Previous attempts to reform the teacher evaluation process have not resulted in
their intended purpose of increasing accountability and/or improving teaching (Darling-
Hammond et al., 1983; Peterson, 1995; Weisberg et al., 2009). Today’s efforts differ
from previous attempts in that they are commonly tied to legislative initiatives. In
Michigan, the union’s decreasing influence creates an environment in which this type of
change is not only possible, but it is expected and written into law.
Today’s Landscape
In 2011, “the rating ‘ineffective’ was given to slightly less than 1% of teachers by
their local evaluation systems” (Kessler & Howe, 2012, p. 9), and the rest were
categorized as “effective.” The following year, after implementation of the new
evaluation mandates, there was much more delineation between “effective” and “highly
effective.” For many teachers this has been a paradigm shift, as they have been given the
highest marks possible on their evaluations for many years. To move to a new model of

14
evaluation that includes observations and feedback from administrators “can actually
seem patronizing and condescending; they are experienced professionals” (Danielson,
2007, p. 11).
There is no question that the teacher evaluation system, as traditionally outlined in
union contracts, was in need of fixing. However, we need to be cautious as we begin
down this path of developing new methods of teacher evaluations. Oddly enough, the
legislation was passed and policy was determined with very little input from educators.
Perhaps this is because there are those who believe that many of our teachers are the
problem and drastic changes are necessary in order to get rid of ineffective teachers. The
tide for reform is strong, and policy has been implemented and carried out so swiftly that
districts, administrators and teachers are reeling from the effects, and are struggling to
keep up with new requirements. All districts in Michigan are implementing new
evaluation measures, and the implementation timeline is such that there is not adequate
time to research and determine the best measures of teacher effectiveness. Districts across
the state are all going in different directions, and scrambling to conform to the new laws.
A primary concern is that policy is implemented and will impact teachers’ lives and
livelihood long before the research is complete and before appropriate tools have been
developed. It is this fact that makes the evaluation system high-stakes, whether it is
connected to student achievement and/or growth data or not.
In spite of the fact that educators have had little input in the formulation of these
changes, they have voiced their concern. A joint proposal from a number of education
associations across the state was published in response to the legislation that pertains to
performance evaluations of teachers (American Federation of Teachers, et al., 2013).

15
Their warning is clear: It is imperative that great care be taken when developing
evaluation measures that take into account multiple variables, many of which are outside
the control of teachers, administrators, and their school, that have heavy implications for
the livelihood of those being evaluated. In fact, there is some recent research regarding
using student achievement data to determine teacher effectiveness, while controlling for
these outside factors, but the area is so new that the current research is very contradictory.
Although the idea of addressing teacher effectiveness and holding professionals
responsible is a noble one, the process in which the evaluation tool is developed should
be thoughtful, research based, and broad.
Other Measures of Effective Teaching
Many factors, not only those that are based on student achievement, contribute to
effective teaching. They include instructional strategies, content level pedagogy,
experience, classroom and teacher observations, classroom practices and instructional
techniques, collaboration, discourse, and management and organizational skills; these can
be measured using careful classroom and teacher observations (Cobb, et al., 1999;
Danielson, 2007; Marshall, 2009; Marzano & Toth, 2013). These areas are supported by
research and best practices have been developed over many years, and therefore should
constitute part of a comprehensive teacher evaluation system.
Teaching is an art, and as such requires a number of variables to be considered
and working in harmony to be most effective. The National Council of Teachers of
Mathematics (2011) recognizes that the use of student test scores for teacher evaluation
purposes is too narrow in scope, and an evaluation of this sort will neglect to consider
some very important aspects of the teacher’s job. The NCTM’s position that “evidence of

16
student learning can and should be considered in the evaluation of teachers, it should be
only one factor among many” (NCTM, 2011, p. 42) is supported by current research and
studies in the field of mathematics education (Cobb, 1999; Hiebert & Grouws, 2007).
Likewise, students should be assessed using multiple measures and student
achievement and growth ought to be based on assessments and strategies that are
supported by research-based best practices. Darling-Hammond (2010) identifies several
key elements of effective assessment systems, including a rich and aligned curriculum,
and a well-rounded and robust system of student assessments that include evidence of
learning, such as performance assessments, constructed responses and formative
assessments. Many high-achieving nations use open-ended performance tasks to assess
the progress of their students.
It is clear to anyone who has stood in front of a class of students preparing to
embark upon the teaching of any subject, that there is much more involved in teaching
than simply knowing the content. Marzano & Waters (2009) describe pedagogical
knowledge as comprising three parts: instructional strategies, management techniques
and curriculum design. Not only does the effective teacher have a firm understanding of
the content she is teaching, but she will also understand how to break the concepts down
into understandable pieces so that children can begin to construct their own
understanding of mathematical concepts.
Marzano & Waters (2009) have identified instructional strategies that are directly
linked to student comprehension. The use of concept maps, homework, note-taking, and
cooperative learning are some of the strategies Marzano & Waters identify as having a
positive impact on student achievement that are also supported by research in

17
mathematics education (Cobb & Bowers, 1999; Hiebert & Grouws; 2007, Hill et al.,
2007). The role of discourse is equally important, and must be facilitated by an
experienced and knowledgeable teacher. Cunningham (2005) found this to be true as
well, and underscores the positive impact that student discussion and collaboration can
have on their learning. The components within the FFT link directly to these aspects of
instructional practice.
A comprehensive teacher evaluation will take into account both the actions of the
teacher during the class period, as well as his or her experience, professionalism,
planning and reflection (those actions that occur outside of the classroom). The design of
the teacher evaluation is vital, and reflective of the designers’ belief about good teaching.
If “good teaching is a professional skill developed over time with experience and through
relationships with other professionals, then teacher evaluation might serve more of a
signaling and formative mechanism” (Williams & Engel, 2012, p. 56). Including
elements of peer review and feedback shifts the focus to “improving practice” rather than
simply evaluating performance. In the long term, these formative elements are likely to
make the evaluation system more meaningful and will ultimately be of greater benefit to
more students. In Finland, evaluation is structured as a coaching model, and is a
formative process. Japan uses the practice of lesson study, which allows teachers to
observe and critique other teachers in a group setting (Williams & Engel, 2012).
Although the lesson study is not used for teacher evaluation in Japan, it is used for
instructional improvement. A similar formative assessment framework for teachers in
this country would be beneficial.

18
Framework for Teaching
The FFT is based on a constructivist view of student learning, in which learners
are viewed as active participants in their own learning (Murray, 2014). A constructivist
classroom is student-centered, and the teacher creates opportunities for learning to occur.
The main activity is usually centered on solving problems using inquiry-based methods.
Danielson (2007) states that the FFT is “grounded in the constructivist approach [and] it
assumes that the primary goal of education is for students to understand important
concepts and develop important cognitive skills” (p. 17). Formative in nature, the FFT is
based on this same constructivist theory and its purpose is to create a conversation among
educators that results in an improvement in instructional practice by engaging educators
in the experience.
The FFT has emerged as one of the leading models for teacher evaluation in this
new era of transparency and accountability. Many states have adopted the FFT as the
evaluation model, and others have named it as one that may be used to evaluate teachers.
Michigan falls into the latter category, and recommends the FFT as one of several that
may be used by districts in their evaluation efforts. While empirical evidence directly
relating to the effectiveness of the framework is scarce, some studies have begun to
emerge. Milanowski (2011) summarizes research pertaining to several different
implementations of the FFT and finds ratings to be reliable only in some cases based on
variations of implementation. He stresses, “The procedural variations among different
implementation of the Framework likely have a lot to do with differences in the reliability
or validity of ratings” (p. 5).

19
A large-scale study of teacher evaluation systems, the Measures of Effective
Teaching (MET) project (2013), was a beginning in conducting much needed research.
The purpose of the study, funded by the Bill and Melinda Gates Foundation, was to
determine how to identify and promote effective teaching. The MET project involved
3,000 teacher volunteers from six public school districts. The scope of the project was
broad, and included a focus on mathematics, language arts, standardized tests, student
performance, longevity of teachers, socio-economic factors of students, feedback
methods and evaluation tools. The FFT was one of several evaluation tools used by
districts involved in the MET Study.
Key findings from the three-year study were: (a) effective teaching can be
measured; (b) multiple measures, such as observations, student surveys and measures of
student achievement can be used to determine teacher effectiveness; and (c) adding a
second observer of a particular teacher increases reliability significantly more than
having the same observer score an additional lesson for that teacher (Cantrell & Kane,
2013).
Sartain et al. (2011) conducted a large-scale pilot program in the Chicago Public
Schools on teacher evaluation. The pilot’s focus was to improve instruction through the
use of the FFT. The three goals of the pilot program were: “to improve teaching and
learning in the school district; to develop a stronger professional learning climate among
teachers and principals; [and] to foster a constructive -rather than punitive – climate
around teacher evaluation” (Sartain et al., 2011, p. 5). This is one of the first studies that
provided research-based evidence that a new evaluation model could have a positive
impact on instructional practices. Overall, Sartain et al. (2011) concluded that:

20
The classroom observation ratings were valid measures of teaching practice; that is, students showed the greatest growth in test scores in classrooms where teachers received the highest ratings on the Danielson Framework, and students showed the least growth in test scores in classrooms where teachers received the lowest ratings. The classroom observation ratings were reliable measures of teaching practice; that is, principals and trained observers who watched the same lesson consistently gave the teacher the same ratings; however, 11 percent of principals consistently gave lower ratings than the observers and 17 percent of principals consistently gave higher ratings than the observers. Principals and teachers said that the conferences were more reflective and objective than in the past and were focused on instructional practice and improvement. However, many principals lack the instructional coaching skills required to have deep discussions about teaching practice. Over half of the principals were highly engaged in the new evaluation system. Principals who were not engaged in the new evaluation system tended to say that it was too labor intensive given the numerous district initiatives being simultaneously implemented in their schools. (Sartain et al., 2011, p. 2)
Schools in this study realized the shift toward evaluations that were more reflective and
formative in nature than traditional evaluations. “The study found that the new teacher
evaluation system had potential to impact school-wide change focused around teacher
professional development and student learning” (Murray, 2014, p. 44).
White, Cowhy, Stevens & Sporte (2012) found similar results in a study aimed at
learning about the implementation of the FFT in Illinois, and to understand how teachers
and administrators perceived the system. A number of challenges were encountered by
the five districts implementing the new system, including utilizing the evaluation process
to improve instruction, creating buy-in from participants, and reducing the time burden
on administrators.
Current research on the FFT is inconclusive as to whether or not the FFT, or any
teacher evaluation model, can accurately assess effective teaching. Policymakers and
educators alike must keep abreast of research pertaining to teacher evaluation as it
becomes available; “one emerging theme is very clear from the aforementioned policy

21
recommendations and research studies and that is the importance of feedback during the
observation process” (Murray, 2014, p. 50).
Classroom Observations and Feedback
One of the elements of Michigan’s revised evaluation law (Legislative Council,
2011) is that administrators will perform multiple, short observations. This is in contrast
to previous evaluations (most often negotiated by the union and administration) that not
only limited observations for evaluative reasons, but also required that teachers were
informed of when it would happen well in advance. This has spurred a flurry of activity,
research, and commentary about classroom observations. Frequent, unannounced
observations, according to Sartain et al., can provide or create motivation for
improvement among teachers (2011). Reeves (2010) found that the teacher influence is
the largest factor in student success, especially among lower achieving students.
Marshall (2009) also supports the use of frequent, focused classroom observations
that include immediate and specific feedback to teachers. Effective communication has a
positive impact on school climate and “effective principals recognize the unique styles
and needs of teachers and help them achieve their own performance goals” (p. 336). He
suggests multiple, informal mini-observations with one-on-one feedback conversations
(face to face). This method, he contends, will improve teaching in every classroom.
Although this is a paradigm shift for educators, many are open to the feedback and
appreciate the opportunity to reflect on and improve their practice. Marshall contends that
the administrator should have a particular area of focus, communicated to the teacher in
advance, such as “questioning strategies and techniques.”

22
After observing the teacher, the administrator should provide written, specific
feedback and recommendations for improvement to the teacher. Just as the teacher uses
formative assessment techniques to inform herself of her students’ progress, the
administrator can use observation data to gain insight as to the teachers’ strengths and
weaknesses and to inform future support and professional development plans. Goe &
Holdheide (2013) contend that “conversations should center on instructional strategies to
address learning needs,” and should be constructive rather than critical (p. 29).
Danielson (1996) concurs, noting that the process involved in the coaching
conversations “is critical to both enriching the professional lives of educators and to
ensuring that the components used in a given setting actually do apply there” (p. 5). The
FFT is designed to provide meaningful feedback on how teachers can improve their craft,
and reflection and self-assessment are critical components of the model (Danielson,
2011).
There are some cautions about using observations, however. Danielson (2007)
discusses the problem of administrator discrepancy and bias. Administrators must be
fully educated and trained not only in how to perform an effective classroom observation,
but to have a clear idea about each category in which the teacher will be evaluated.
According to Danielson (2007):
Bias occurs whenever there is variability in an observer’s application of the rubric based on a particular characteristic of the classroom (e.g., paint color), or of the individuals in the classroom. Biases can be unique to observers or can be shared across observers. Personal preferences are a shadowy mix of biases and prejudices. We usually exhibit personal preferences for familiar traits and behaviors. Personal preferences are often unique to an observer… We all have hidden biases and personal preferences that govern the way we respond to people, things, and events. Our biases and personal preferences, whether positive or negative, can impact the fairness and validity of … scoring when they are not a part of, or contradict, the instrument's scoring guidelines (p. 14).

23
The purpose of the training is not to eliminate bias or personal preference, which is
probably impossible, but simply to recognize it and minimize its effect. Many districts
are developing rubrics for administrators to use that are aimed at reducing bias and
variability among administrators. “Accuracy of observations requires rigorous training on
how to differentiate performance across all competencies within an observation
instrument” (MET Project, 2013, p. 6). Another practical concern that is raised by Goe &
Holdheide (2013) is how time intensive the process is, particularly if it includes
individual conversations with each teacher after an observation.
There are a number of qualities that effective teachers possess that are not
observable in the classroom, but are important enough to be included in an evaluation
model. These include items in the professional domain, such as experience, education,
organizational skills, planning, preparation, collaboration with colleagues and
professional development. Many opponents of public education, including the
Mackinaw Center in Michigan (Holley, 2008), dismiss this domain as unimportant. They
even point to some studies that seem to show that experience and education do not impact
student achievement. Many subsequent studies and reports, however, have largely
discredited those claims (Marshall, 2009; Marzano & Waters, 2013; Ravitch, 2010;
Reeves, 2010). Another important aspect, and largely underused, is teacher collaboration.
Collaboration has typically been ignored in the field of education in the U.S., and the
system is not built well to accommodate it. It will take a creative administrator to find
ways to allow teachers to collaborate effectively. As of yet, there is no “definitive link
between the quality of the feedback received during the observation process and changes
in teachers’ instructional practices” (Murray, p. 61).

24
The transition from the traditional “annual” model to a “frequent, unannounced”
observational model raises a number of questions, that time and research will be able to
address. One question is whether or not this model will result in better differentiation, or
give administrators a broader range, of teacher quality. Early studies are mixed.
Lipscomb, Chiang & Gill (2012) found the variation between satisfactory and
unsatisfactory teachers nearly unchanged during a pilot using the FFT. It is yet unclear as
to whether or not classroom observations will translate into improvement in instructional
practice, or which aspects garner greater results. Change is not inherent in the process of
classroom observations, rather it is impacted by multiple variables, such as trust,
willingness, consistency and mindset. However, it is likely that this new pressure will
impact the daily practices of teachers, and we will see curricular and instructional
improvements (Cho & Eberhard, 2013). Policymakers must weigh the costs and benefits
of their legislation, and create the opportunity to gather data and research. The changes
have been swift, and are costly. Districts and principals are investing valuable time and
money to develop, implement and document this new evaluation system for educators –
efforts that may prove futile if there is no improvement in teacher effectiveness and
student learning.
Conclusion to Literature Review
Change takes time. Significant systemic changes must occur in order for a new
evaluation model to be meaningful and useful. Administrators must not ignore the
importance of getting buy-in from teachers. Teachers are often quick to dismiss new
initiatives as “passing fads” which are soon replaced by yet another new idea. Current
evaluation systems have not changed teachers’ practice over time (Donaldson, 2012) and

25
many teachers remain disconnected from new evaluation systems, not believing there is a
link between classroom observations, professional conversations, and their performance.
Organizational culture must change in order for people’s behavior to change.
Professional growth and change can occur when teachers and administrators take
a collective responsibility for improving student learning (Marshall, 2013). Indeed, a
building administrator’s behavior plays a substantial role in the change that must occur
for improvement to take place. This is done by building a culture of trust, reflection and
collaboration, and by providing feedback to teachers to promote growth and development
of the staff (Darling-Hamond et al., 1983; Fullan, 1991; Ovando & Ramirez, 2007).
While teacher evaluations, in some form, have existed for decades, current
systems have a significant design difference. They are fulfilling dual purposes:
improvement and accountability (Danielson, 2010). States are moving away from a
seniority-based system for teacher retention and replacing it with a system that is based
on teacher performance as indicated by evaluations. Some believe that the evaluation
process is incapable of fulfilling both purposes. Popham (2013) stated that the “reason the
dual-mission teacher evaluation won’t work resides in human nature. Teachers want to
improve their skills ... but teachers also want to keep their jobs” (p. 21). Darling-
Hammond et al., (1983) support the notion that a new system can be successful if specific
guidelines are put into place, and all participants have a shared vision of the purpose and
process. Evaluations can be the catalyst that drives instructional improvements when
“teachers perceive that the evaluation procedure enables and motivates them to improve
their performance; and principals perceive that the procedure enables them to provide
instructional leadership” (Darling-Hammond et al., 1983, p. 320). Evaluations conducted

26
for the purpose of improvement are likely to thrive if the environment has supportive
leaders, and a mutual feedback system is established (Santiago & Benavides, 2009).
There is no doubt that teachers will now be evaluated using new evaluation
systems, whether research supports them or not. It is essential that high-quality research
be conducted to determine what measures of teacher effectiveness can and should be used
in teacher evaluations. Done correctly, this could be a time when we make some positive
and significant improvements to our field, and the results could have great results for
students and for our nation. However, done too quickly and without proper caution, input
and care, the results could produce dismal results and may ultimately have devastating
effects on our public education system. Already there has been a profound shift of time,
energy and money toward the development and implementation of a new evaluation
system, repositioning resources that were previously used elsewhere. This transfer of
resources, implemented hastily to conform to shifting legislative requirements, may bring
about unintended consequences to our entire educational system.
27
Chapter 3 Methodology
In 2011, the State of Michigan changed the law pertaining to the performance
evaluation system of educators (Legislative Council, 2011). The new law prohibits
teacher evaluation as a subject of bargaining, and requires that teachers are given one of
four designations: Ineffective, minimally effective, effective or highly effective.
Although the State of Michigan has not provided or mandated a single evaluation tool,
the majority of districts throughout the state are using Charlotte Danielson’s Framework
for Teaching (FFT).
Teaching is very complex work and, as such, it is important to develop a
comprehensive picture and a common language with which to talk about it. The FFT
serves this purpose, and is divided into four domains of teaching responsibility:
• Domain 1 – Planning and Preparation
• Domain 2 – Classroom Environment
• Domain 3 – Instruction
• Domain 4 – Professional Responsibilities
Domains 2 and 3, Classroom Environment and Instruction, describe those aspects of
teaching that are directly observable in the classroom. Domains 1 and 4, Planning and
Preparation and Professional Responsibilities, represent the behind-the-scenes work of
teaching that are essential to good teaching and have a significant impact on the learning
that happens in the classroom. While all four domains will be considered for final
evaluations, classroom observations focus primarily on domains 2 and 3.
The FFT uses a four-point scale. The ratings designated by State of Michigan are
in parenthesis next to the category they correspond with, as follows:

28
4: Distinguished (Highly effective)
3: Proficient (Effective)
2: Basic (Minimally effective)
1: Unsatisfactory (Ineffective)
In many districts, the evaluator, who observes teachers during classroom observations,
provides written feedback to the teacher, most often through e-mail. Ideally there is a
post-observation meeting that is face-to-face. Evaluators view the conversations and
feedback as “coaching” conversations, although to teachers these conversations lead to
high-stakes decisions and outcomes. A teacher’s job security is now based on their
evaluation, a drastic change from the seniority system that has been in place for so long.
Setting
This research uses a single case study, the Bentley School District (pseudonym),
to examine the implementation, impact and results the district has had using the FFT as
an evaluation device. The Bentley School District has developed an evaluation process
that uses the FFT in conjunction with frequent classroom observations and a feedback
cycle, and it has been in use since the 2011-2012 school year. The data collected from
multiple observations, conversations and evaluations, are used to evaluate teacher
effectiveness, using the structure described in the FFT. Teachers and administrators are
used as subjects. As individuals who have utilized the tool for a period of time, they have
a strong familiarity with and understanding of how the FFT works, which strengthened
the study.
Bentley School District consists of one high school, one middle school, and four
elementary schools, with 188 teachers and 10 administrators. This study uses evaluation

29
data from all teachers in the district in order to identify differences, if any, between
groups of teachers on various factors such as gender, experience, grade level and content
taught. The student population is 69% African American, 25% Caucasian, with 2%
Latino/Hispanic, and the remainder 4% divided among other racial and ethnic groups.
More than 50% of students qualify for federally funded breakfast and lunch.
Two specific areas of concern are addressed in this study. First, research was
conducted to determine whether Danielson’s FFT, embedded into the evaluation process,
can impact teacher performance by producing instructional improvement over time.
Many districts have revamped their entire evaluation system and are investing scarce
resources to train personnel and replace former evaluation models. The FFT demands a
continual investment of time by administrators, who have a multitude of additional
responsibilities. Most evaluation systems now include multiple observations by an
administrator or evaluator in order to comply with the law. In the Bentley School
District, such observations are formative in nature, involving teachers in the process
through feedback, reflection and discussion. Observational comments are linked to
components in the FFT. Feedback is an important element of any assessment process,
and therefore the second part of this study attempted to identify the specific interactions
between evaluators and teachers that contribute to teacher performance. The research
questions and sub-questions are:
1.) Does teacher evaluation using the FFT produce instructional improvement over time?
a. Does the change indicate that the teachers are getting better at their practice?
b. Does the FFT adequately inform educators about their practice, and if so how?
c. Do some groups of teachers, such as early elementary teachers or veteran

30
teachers, show greater growth than others?
d. Are there limitations to the tool, such as differences between the four levels of
effectiveness?
2.) What interactions around the FFT between evaluator and teacher contribute to teacher
performance?
a. What are some of the interactions around FFT that contribute to teacher
performance? Are some types of interactions more helpful than others?
b. Do teachers and administrators have a clear understanding of the FFT? Do they
find value in the FFT?
c. Do teacher and administrator groups have similar beliefs/views regarding the
evaluation process?
d. Do sub-groups of teachers have similar beliefs/views regarding the evaluation
process?
The evaluation process includes many components, including classroom
observations, feedback from observations during coaching conversations, and
professional development. Observations, feedback during conversations, and professional
development are all related to the FFT domains, components and elements. The FFT
provides a common language and a unified lens for the entire process. Figure 1 shows
the elements of the evaluation process and how the FFT is embedded into the system.

31
Figure 1: Evaluation Process with FFT embedded
Administrator Training
In the Bentley School District, all teachers and administrators participated in
twelve hours of training on the FFT beginning in the fall of 2011. Additionally, 7
administrators (64%) completed an extensive training program for evaluating teachers,
and are now certified evaluators using the FFT. The remaining 4 administrators have had
some, but not all, of the FFT training. In light of the complexity of teaching, it is often
difficult for multiple evaluators to reach consensus on a teacher’s performance. The
training program addressed this dilemma, by offering all evaluators in the district the
groundwork necessary to address the issue of inter-rater reliability, and ensure that the
expectations were similar throughout the district. The rigorous training and focus by the
district provided a solid foundation for this study.
Classroom and teacher observations using the FFT have been ongoing in the
Bentley School District since the 2011-2012 school year. Results and information

32
pertaining to the FFT standards (Appendix A) for each classroom observation have been
collected by administrators and a summary is recorded on a common feedback form
(Appendix B). Evaluators complete multiple classroom observations for each teacher,
using the FFT. Classroom observations are unannounced, and typically last between 16 -
20 minutes, according to the results of an administrator survey. Administrators strive to
give written feedback to teachers within 24 hours, and ideally a conversation about the
lesson and observation is held between the teacher and evaluator. This meeting is meant
to be formative and reflective in nature.
The participants included all 188 teachers in Bentley School District and the ten
evaluators. This number of teachers reflects the number of teachers, both full and part
time, employed by the Bentley School District in the fall of 2015. Previous years’
numbers fluctuate slightly due to retirements, leaves of absence, hiring and other staffing
needs. Evaluation scores from the 2011-2012 through 2014-2015 school years were used
for the longitudinal study. The level of experience of the teachers ranged from novice
(less than five years) to veteran (15 or more years). The researcher compiled the
following information for each case (teacher): grade level, subject area (if relevant), years
of teaching, gender, school, and overall evaluation rating for each of the past four years.
Preliminary procedures for the study included obtaining consent from the district
to use the data (Appendix C), developing an agreement between the district and
researcher that assures confidentiality (Appendix D), development of survey instruments,
and the creation of an information sheet to be distributed to those who took the survey.
This information sheet is included in the surveys for both teachers (Appendix E) and
administrators (Appendix F). The researcher developed the surveys and survey items

33
were based upon the research questions and sub-questions.
Data were collected for the past four school years. Teacher ratings and other
demographic information were de-identified and coded for use in the study by the human
resource department in the Bentley School District. This allowed the research to connect
different data points with the same teacher. The study was limited to the use of existing
and previously collected de-identified private information. This information was not
specifically collected for research purposes. The researcher has obtained exempt status
from the Wayne State University IRB. The study includes four school years, which are
defined as: Year 1 (2011-12), Year 2 (2012-13), Year 3 (2013-14), Year 4 (2014-15).
Prior to administering the surveys, the researcher met with each group of teachers
and administrators to explain the purpose of the survey, to invite them to participate by
completing the survey, and to answer questions. The survey was then distributed via
email and weekly reminders were sent to participants for a period of 5 weeks to the
teaching group and to the administrator group. These surveys were administered using
Qualtrics Survey software and questions were designed to elicit information pertaining to
the evaluation process, the use and practicality of the FFT for evaluative purposes, and its
perceived value and impact on instruction and student achievement. Most questions are
multiple choice, using a Likert scale for responses, and it also includes some open-ended
questions.
The interactions between evaluators and teachers surrounding the FFT were
examined to identify practices and conditions that improve teacher performance.
Examples of some typical interactions include written feedback, one-on-one
conversations, suggestions for teachers to follow up with, and promptness of feedback.

34
This second research question seeks to identify those practices and conditions conducive
to improvement, and inform some of the underlying questions. What are some of the
interactions around FFT that contribute to teacher performance? Are some types of
interactions more helpful than others? Do teachers and administrators have a clear
understanding of the FFT? Do they find value in the FFT? Do teacher and administrator
groups have similar beliefs/views regarding the evaluation process? Do sub-groups of
teachers have similar beliefs/views regarding the evaluation process?
Design – Research Question 1
Up to four years’ worth of longitudinal evaluation data and an effectiveness
rating, as determined by his or her administrator, were collected for each teacher. In
order to answer the first research question, “Does teacher evaluation using the FFT
produce instructional improvement over time?” the study examined the change in
effectiveness ratings over time using a one-way repeated-measures ANOVA test for all
cases in which four years’ worth of data was available. This informs the extent to which
the evaluation process, including the implementation of classroom observations and
feedback using the FFT as a model that is embedded into the evaluation process, results
in instructional improvement. The independent variable in this portion of the study is the
year of the evaluation and the dependent variable is the evaluation rating. The null
hypothesis is that there is no change in effectiveness ratings over time, and the alternative
hypothesis is that there is a change in teacher effectiveness over time.
H0 = no change in teacher effectiveness ratings
HA = teacher effectiveness ratings change over time

35
The demographic fields extracted from the evaluation data include grade level,
subject area (if applicable), years of teaching, gender, school, and overall evaluation
rating for each of the past four years. Data were analyzed using the Statistical Package for
the Social Sciences (SPSS). In addition to the one-way repeated-measures ANOVA
described above, Friedman’s two-way analysis of variance and pairwise comparisons
were examined to determine the extent to which the results were statistically significant.
Chi-squared independence tests were then performed to determine associations between
demographic fields and teachers’ ratings. These tests, each of which has its own null and
alternative hypothesis, help identify whether there exist differences between elementary
and secondary evaluations, schools, subject levels, or between novice and veteran
teachers. Finally, cell-by-cell comparisons of adjusted standardized residuals were
completed to determine specific information as it relates to the data.
In cases where there were outliers, the written evaluation summary was used to
add contextual evidence pertaining to the specific case in question. To accomplish this, a
textual analysis was performed once the researcher obtained the narrative contained in the
de-identified, end-of-the-year evaluation from the district’s human resource department.
The textual analysis searches for common phrases and descriptors that indicate best
practices. Once identified, the researcher examined consistencies among this sub-group
to articulate those actions that are more apt to result in improvement.
Design – Research Question 2
Through the use of surveys, the study examined the specific type of feedback and
its frequency, and other interactions and conditions that may contribute to teacher
improvement. Both groups, teachers and evaluators, were surveyed, using a different

36
form for each group, in order to inform the second research question, “What interactions
around the FFT between evaluator and teacher contribute to teacher performance?”
Many of the questions in the teacher survey are identical to those in the administrator
survey, allowing for comparison between the two groups. The surveys were used to gain
an understanding of the specific interactions that foster positive results in teacher
performance through both open-ended and closed-ended questions.
Surveys were administered to all teachers and administrators using Qualtrics
Survey program. Survey data were collected and summarized to provide a detailed
analysis about each individual’s experience with and perception of the FFT. Survey data
were analyzed using a cross-variable analysis to determine whether there are associations
between variables. Mann Whitney U tests were conducted to determine whether the data
show statistically significant differences between teachers and administrators. The non-
parametric Kruskal-Wallis H test was also run to examine differences among variables
(buildings, experience level, content taught, etc).
The qualitative elements of the study allowed the open-ended questions to be
explored in greater depth and detail than quantitative data from a survey could provide.
This provided the researcher with a better understanding how a teacher’s practice is
impacted by frequent, informal classroom observations and feedback using the FFT. This
data may also inform and enhance the understanding of the first research question. In
addition, recurring themes have been identified on the survey responses using a tracker
system to organize the results.
A logical analysis was used to organize responses from the open-ended questions
of both surveys and a matrix was developed to display results. Miles and Huberman’s

37
(1994) three-step process for logical analysis was followed. First, the responses were
reduced and categorized by theme, then the data was arranged to visually depict the
embedded data, and finally conclusions were drawn. The underlying questions answered
in the surveys, which are addressed in chapter 5, included: What are some of the
interactions around the FFT that contribute to teacher performance? Are some types of
interactions more helpful than others? Do teachers and administrators have a clear
understanding of, and do they find value in, the FFT? Do teacher and administrator
groups have similar beliefs/views regarding the evaluation process? Do sub-groups of
teachers have similar beliefs/views regarding the evaluation process?
Confidentiality
Participant confidentiality was maintained through a number of safeguards that
were put into place. The researcher used de-identified teacher data from Bentley School
District. This confidentiality extended to the administrators as well. No teacher or
administrator names were included on the data, and there are no means by which the
researcher can find which teacher the data belonged to. Participant information did not
include specific information that could potentially lead to identification, such as date of
birth, or employee identification number. Surveys were confidential, and participants
were assured of their privacy. The Qualtrics platform is designed to ensure anonymity,
and the researcher set up the survey with maximum confidentiality assurances. A coding
system was developed to describe the results, and only the researcher was aware of the
system.
Validity
Three data sources were used in an effort to construct validity through

38
triangulation. The data gathered regarding each teacher’s evaluation for the past four
years and other details pertaining to their job, such as longevity, is the first data point.
The Bentley School District has consistently used the same system for the duration of the
study, and both teachers and administrators received training. Training for administrators
has been ongoing since the implementation of the system, addressing FFT rubric details,
observation techniques, coaching conversations, issues pertaining to bias and inter-rater
reliability. In an effort to address the issue of evaluator bias and to increase inter-rater
reliability, all district evaluators were trained and most are certified in using the FFT to
evaluate teachers. Others have not yet completed the extensive training process.
According to Danielson (1996), this training and participating in ongoing meetings to
discuss the standards in the framework should occur. It is vital that evaluators watch
videos, or live lessons, rate independently and then discuss their observations and
conclusions. This practice will not only improve their skills, but will minimize the
discrepancy among evaluators. Surveys of teachers and evaluators provide two additional
data points.
Both surveys were designed to be tightly aligned to the research questions and
sub-questions. Questions were drafted, reviewed and revised with practitioners (teachers
and administrators) and committee members (Fowler, 2009). Questions were designed to
elicit information directly related to the research questions and sub-questions. In many
cases, questions were identical in both teacher and administrator surveys, allowing for
comparison and analysis between the two groups. The researcher created both surveys
with input from her committee. This panel of experts reviewed each question with the
researcher and changes were made to improve the question quality. For example, the

39
original phrase “written feedback” was changed to “qualitative feedback” since feedback
could be both written and oral. Also, some general questions were modified to be more
specific and some questions were reworded so as to have a few negative statements, such
as “The FFT process is insignificant to me as a professional” (Fowler, 2009).
One issue that may impact results is that teachers are slowly realizing the extent to
which the evaluation stakes have changed. Prior to the legislative changes in 2011,
teachers were evaluated as detailed in their bargaining agreement, and many protections
were included. Now teachers are beginning to understand the impact of the change and
see how evaluation results are used to inform lay-offs and termination. The union is no
longer able to bargain issues relating to evaluation.
In practice, this could have more of an impact on some teachers than others. For
example, evaluations have higher stakes for some because of the needs of the district
(such as having too many elementary teachers and needing to lay off in that area). It is
likely, for example, that elementary teachers would be laid off before secondary
mathematics and science teachers based on these needs. Layoffs are also based on the
teachers’ highly qualified (HQ) status. Here, it is likely that a veteran teacher with 20
year’s experience be laid off when a district is downsizing due to declining enrollment
(this is not uncommon). If this district had to reduce the size of their secondary science
teaching staff, for instance, and the 20-year veteran is rated lower than any other teacher
qualified to teach secondary science, they would be the one to get laid off, in spite of
their years of service.
Conclusion to Methodology
This chapter summarized the research methods that were used in a longitudinal

40
study of teacher evaluation scores in the Bentley School District over the course of four
years, 2011 – 2015, and examines how the FFT, embedded in the evaluation process,
produced instructional improvement over time and explores the interactions between the
teacher and evaluator. Teachers and administrators from six buildings (four elementary,
one middle school, and one high school) participated in the research. De-identified end-
of-the-year evaluation data was collected on each teacher, and research methods were
employed to identify statistically significant correlations, associations, and outliers.
Demographic information tied to each teacher was used to sub-divide data to examine
these relationships at a more granular level.
Surveys were administered to both teachers and evaluators, and questions were
designed to gain an understanding of teachers’ and administrators’ perceptions of the
FFT, the rubric, the observation process, and the evaluation process. This portion of the
study allowed the researcher to examine similarities and differences between the two
groups, and tests were performed to find areas that indicated statistical significance.
Textual analysis was performed on the open-ended portion of the survey, allowing
for a more elaborate description of teacher and administrator perceptions of the new
evaluation system. This analysis identified commonly cited outcomes, as well as unusual
and unique responses to the questions. The researcher worked back and forth between
the categories and the responses to verify that the classification system developed
accurately sorted the data (Patton, 1990). Three broad categories emerged during the
textual analysis on both teacher and administrator surveys that identified interactions that
support improvement: Coaching, communication and professional development. Results
of the research findings are provided in the following chapter.

41
CHAPTER 4 – RESEARCH FINDINGS
The Bentley School District has been utilizing the Danielson Framework for
Teaching (FFT) as its evaluation tool since the 2011-2012 school year. During this era of
continual change in teacher evaluation processes, districts often modify the system they
are using, or change parts of it from year to year. The consistency with which Bentley
School District has used the FFT provided longitudinal data that helped answer the
research questions. This study provides research to investigate whether the FFT,
embedded into the evaluation process, produced instructional improvement over time.
This was determined by measuring the extent of change (or lack thereof) in teachers’
ratings over time, and identifying the interactions between teachers and administrators
throughout the evaluation process that contribute to teacher performance. This chapter
explores the results of the longitudinal data analysis of teacher performance, chi-square
independence tests and will examine the results of both surveys, providing teacher and
administrator perception data as they relate to the use of the FFT as an evaluation tool.
Data collection for this study included quantitative data collected from several
sources: the longitudinal study of teacher evaluation ratings, chi-squared independence
tests performed on demographic variables and teacher evaluation ratings, and both
teacher and administrator surveys. Demographic variables, including years of
experience, school, and gender were compared with survey questions designed to
measure teacher and administrator perceptions. In addition, qualitative data from the
open-ended portion of the two surveys provided insight as to the participants’ experience
with and perception of the FFT.

42
Quantitative Analysis
Quantitative data were collected from three sources: Longitudinal data of teacher
evaluation ratings for 4 years, teacher surveys and administration surveys. The teacher
evaluation ratings were paired with details such as longevity, gender, building, grade
level, and subject taught. The longitudinal data that was collected included evaluation
ratings for each teacher during the school years ranging year 1 through year 4 of the
study. Tables 2 – 11 organize the data in multiple ways to examine relationships and
trends in demographic and evaluation information. Table 2 shows evaluation ratings
from Bentley School District for all four years of the study. It is noteworthy that the
district hired 18 new teachers during year three of the study, which is over 10% of the
teaching staff.
Table 2 Evaluation Ratings: Year 1 – Year 4
Table 3 organizes Bentley School District’s teachers into groups based on
longevity, the building they work in, and the content taught. This data is also displayed in
Figures 2 – 5. Demographic information from the longitudinal data collection
Rating 2012 2013 2014 2015
Highly Effective
8 (5%) 41 (23%) 30 (17%)* 43 (24%)
Effective 160 (94%) 126 (71%) 141 (81%) 127 (72%)
Minimally Effective
3 (2%) 8 (5%) 1 (<1%) 6 (3%)
Ineffective 0 2 (1%) 2 (1%) 0
* This drop may reflect the 18 newly hired teachers during this year (10%)
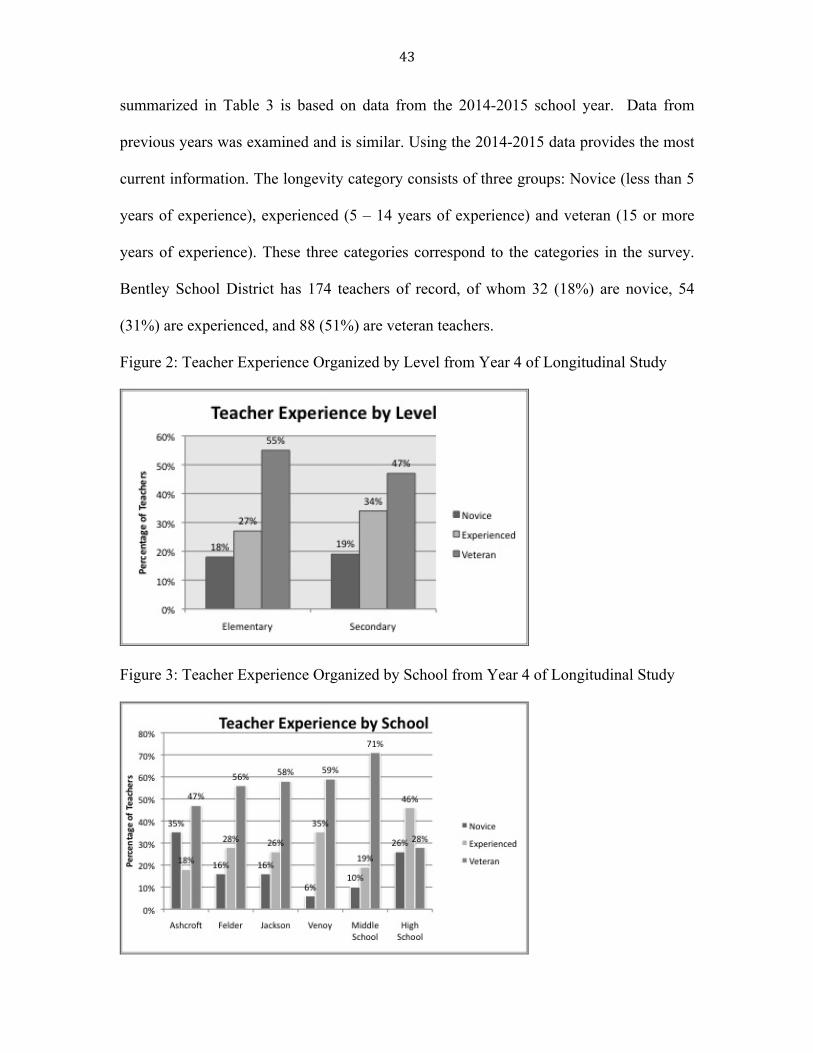
43
summarized in Table 3 is based on data from the 2014-2015 school year. Data from
previous years was examined and is similar. Using the 2014-2015 data provides the most
current information. The longevity category consists of three groups: Novice (less than 5
years of experience), experienced (5 – 14 years of experience) and veteran (15 or more
years of experience). These three categories correspond to the categories in the survey.
Bentley School District has 174 teachers of record, of whom 32 (18%) are novice, 54
(31%) are experienced, and 88 (51%) are veteran teachers.
Figure 2: Teacher Experience Organized by Level from Year 4 of Longitudinal Study
Figure 3: Teacher Experience Organized by School from Year 4 of Longitudinal Study

44
A distinction was made between teachers who teach core content (mathematics,
social studies, science or English), elective content (physical education, art, music, etc.)
and those who are non-classroom teachers. Non-classroom teachers include school
counselors, social workers, and special education teachers. Even though they are not
typical classroom teachers, they are generally still evaluated with the same tool as
classroom teachers. This data is reflected in Figures 4 and 5.
Table 3
Demographic Information from Longitudinal Data
Level of Instruction Building Longevity Content Ashcroft Novice 6 (35%)
Experienced 3 (18%) Veteran 8 (47%)
Core 12 (71%) Elective 2 (12%) Non-Classroom 3 (18%)
Felder Novice 4 (16%) Experienced 7 (28%) Veteran 14 (56%)
Core 19 (76%) Elective 3 (12%) Non-Classroom 3 (12%)
Jackson Novice 3 (16%) Experienced 5 (26%) Veteran 11 (58%)
Core 13 (68%) Elective 4 (21%) Non-Classroom 2 (11%)
Elementary
Venoy Novice 1 (6%) Experienced 6 (35%) Veteran 10 (59%)
Core 14 (82%) Elective 1 (6%) Non-Classroom 2 (12%)
Elementary (K – 5) Total: Novice 14 (18%) Experienced 21 (27%) Veteran 43 (55%)
Core 58 (74%) Elective 10 (13%) Non-Classroom 10 (13%)
Middle School Pearson Novice 4 (10%) Experienced 8 (19%) Veteran 30 (71%)
Core 28 (67%) Elective 7 (17%) Non-Classroom 7 (17%)
High School Thomason Novice 14 (26%) Experienced 25 (46%) Veteran 15 (28%)
Core 30 (56%) Elective 15 (28%) Non-Classroom 9 (17%)
Secondary (6-12) Total: Novice 18 (19%) Experienced 33 (34%) Veteran 45 (47%)
Core 58 (60%) Elective 22 (23%) Non-Classroom 16 (17%)
District Total: Novice 32 (18%) Experienced (31%) Veteran 88 (51%)
Core 116 (67%) Elective 32 (18%) Non-Classroom 26 (27%)

45
Figure 4: Subject Taught Organized by Level from Year 4 of Longitudinal Study
Figure 5: Subject Taught Organized by School from Year 4 of Longitudinal Study
A one-way repeated measures ANOVA test was conducted to examine the
longitudinal data to show the change that has occurred, if any, in teacher evaluation
ratings over time. Table 4 organizes the data by the number of years each teacher was
evaluated. While most teachers have data for all four years, some have less due to factors
such as retirement, leaves-of-absences, or being hired after 2012. Twenty-seven teachers
(13%) have been evaluated for only three of the four years, and 133 (63%) have been
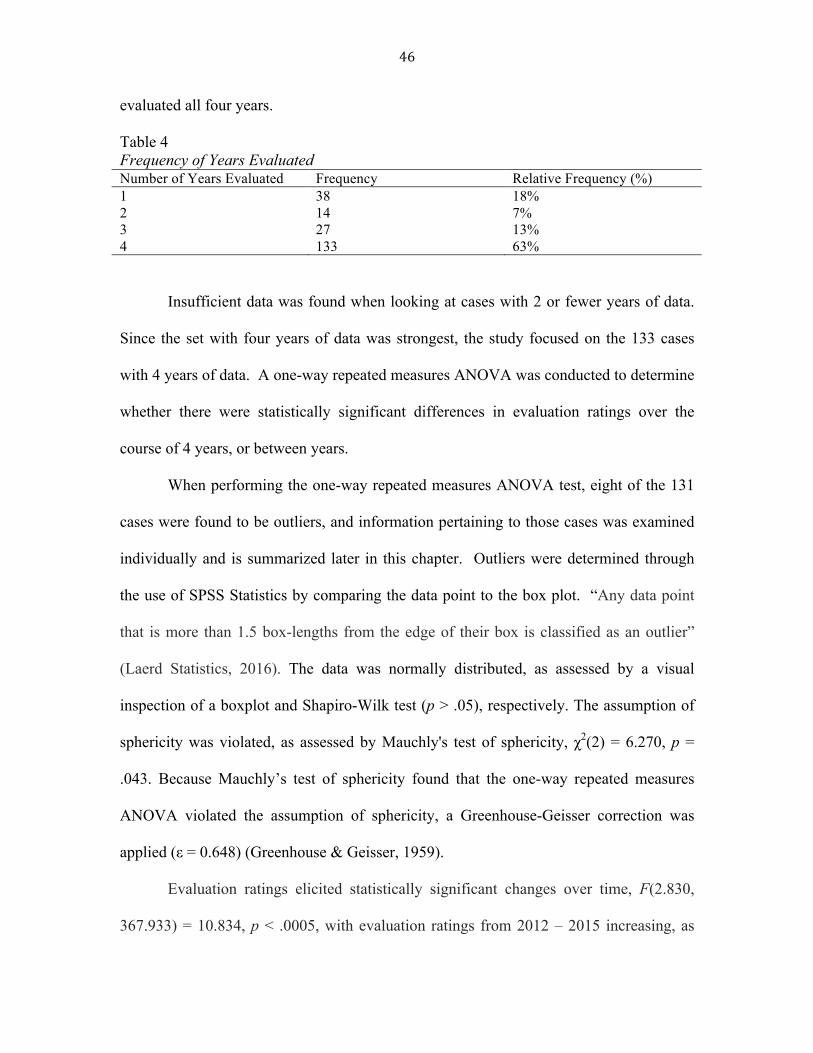
46
evaluated all four years.
Table 4 Frequency of Years Evaluated Number of Years Evaluated Frequency Relative Frequency (%) 1 38 18% 2 14 7% 3 27 13% 4 133 63%
Insufficient data was found when looking at cases with 2 or fewer years of data.
Since the set with four years of data was strongest, the study focused on the 133 cases
with 4 years of data. A one-way repeated measures ANOVA was conducted to determine
whether there were statistically significant differences in evaluation ratings over the
course of 4 years, or between years.
When performing the one-way repeated measures ANOVA test, eight of the 131
cases were found to be outliers, and information pertaining to those cases was examined
individually and is summarized later in this chapter. Outliers were determined through
the use of SPSS Statistics by comparing the data point to the box plot. “Any data point
that is more than 1.5 box-lengths from the edge of their box is classified as an outlier”
(Laerd Statistics, 2016). The data was normally distributed, as assessed by a visual
inspection of a boxplot and Shapiro-Wilk test (p > .05), respectively. The assumption of
sphericity was violated, as assessed by Mauchly's test of sphericity, χ2(2) = 6.270, p =
.043. Because Mauchly’s test of sphericity found that the one-way repeated measures
ANOVA violated the assumption of sphericity, a Greenhouse-Geisser correction was
applied (ε = 0.648) (Greenhouse & Geisser, 1959).
Evaluation ratings elicited statistically significant changes over time, F(2.830,
367.933) = 10.834, p < .0005, with evaluation ratings from 2012 – 2015 increasing, as

47
represented in Table 5.
Table 5 Evaluation Ratings Over Time Years Mean Difference
(M) Standard Error (SE) p-value (sig.)
2012 - 2015 .084 .036 .012
Friedman’s Two-Way Analysis of Variance (Figure 6) and Pairwise comparisons
(Figure 7) were performed (SPSS Statistics, 2012) with a Bonferroni correction for
multiple comparisons. The null and alternative hypothesis for this test were:
H0 = no change in teacher effectiveness ratings
HA = teacher effectiveness ratings change over time
Evaluation ratings exhibited statistically significant differences at the different
time points, X2(3) = 31.771, p < .0005. Post hoc analysis revealed statistically significant
differences in evaluation ratings between years 1 – 4 (M = .084, SE = .036, p = .012). For
the years 1 – 4, there was a statistically significant difference between means of
evaluation ratings and, therefore, we can reject the null hypothesis and accept the
alternative hypothesis that evaluation ratings change over time (Figure 6).
Figure 6: Friedman’s Two-Way Analysis of Variance by Ranks

48
Figure 7: Post Hoc Analysis - Pairwise Comparisons
Next, Chi-squared independence tests were performed to determine whether an
association existed between teacher evaluation ratings and longevity (veteran (15+ years),
experienced (5 – 14 years, and novice (0-4 years)). Chi-squared tests were also
performed on evaluation ratings versus subject taught (core, elective or non-classroom),
ratings versus core or non-core, and on ratings versus grade level (elementary (K – 5),
middle school (6 – 8) or high school (9 – 12) as well as elementary (K - 5) versus
secondary (6 - 12)). Finally, a Chi-Squared test was done comparing ratings and
building, to determine if there were statistically significant differences between them.

49
This data is displayed in Tables 6 – 11. Each of these chi-squared tests have a null and
alternative hypothesis that are related to the research questions and sub-questions. These
have been identified for each test.
Expected cell frequencies were greater than five in most cases and indicated in
each table. In every Chi-squared test the cell frequencies in the two rating categories
“ineffective” and “minimally effective” were lower than expected. Results were ignored
in those cells with less than the minimum expected frequencies of 5. In order to ensure
the expected percentage of cell frequencies were as high as possible during the Chi-
squared analyses, data from all four years was combined.
A Chi-squared test was performed to measure the association between evaluation
ratings and longevity. The null and alternative hypotheses are:
H0 = no change in teacher effectiveness ratings based on longevity
HA = teacher effectiveness ratings change based on longevity
There was a statistically significant association between evaluation ratings and longevity,
χ2(4) = 21.939, p < .0005. The association was small (Cohen, 1988), Cramer's V = .131.
Therefore, we can reject the null hypothesis and accept the alternative hypothesis that
there is an association between evaluation ratings and longevity. A cell-by-cell
comparison was done to determine the impact of the adjusted standardized residuals, and
to aid in understanding the nature of the evidence against the null hypothesis (Agresti,
2007, Kateri, 2014). The cell that is mostly responsible for the rejection of the null
hypothesis measures the association between experienced teachers who are rated
“minimally effective”. The adjusted standardized residual in this case is -2.7, so fewer
teachers than expected are observed in this category.

50
Table 6 Crosstabulation of Rating and Experience
The association between evaluation ratings and subject taught was examined with
two lenses. First, teachers were divided into three groups – those who taught core
content, those who taught elective classes and those who were not classroom teachers.
The core content category includes elementary classroom teachers and secondary
teachers of mathematics, English, science and social studies. The category “non-
classroom teachers” includes those teachers who are not in the classroom full time, such
as counselors and special education teachers. Then the data was resorted, combining
elective teachers with non-classroom teachers, leaving two categories – those who taught
core subjects and those who did not. The Chi-squared tests for these two groups are
summarized in Tables 7 and 8. The null and alternative hypotheses are:
H0 = no change in teacher effectiveness ratings based subject taught
HA = teacher effectiveness ratings change based on subject taught
There was a statistically significant association found between evaluation ratings
and the subject taught, χ2(6) = 14.311, p < .026. The association was small, Cramer's V =
.101. Therefore, we can reject the null hypothesis and accept the alternative hypothesis
that there is an association between evaluation ratings and the subject taught. The cell-
Experience Level Rating Veteran (15+) Experienced (5-14) Novice (1-4)
Highly Effective 54 (.9)
57 (-.3)
11 (-1)
Effective 198 (-.9)
247 (1.5)
55 (-1.0)
Minimally Effective 6 (-.6)
3 (-2.7)
9 (5.1)*
Ineffective 3 (1.4)
1 (-.9)
0 (-.7)
Note. Adjusted residuals appear in parenthesis below observed frequencies. * Adjusted residual not considered due to cell expected count < 5

51
by-cell comparison of the adjusted residuals found that frequency of non-classroom
teachers rated “effective” (adjusted residual = -2.0) was less than expected, the frequency
of non-classroom teachers rated “highly effective” (adjusted residual = 3.1) was more
than expected, and core teachers rated “highly effective” (adjusted residual = -2.4) is less
than expected. Therefore, the data show that teachers of core subjects are rated lower than
non-classroom teachers.
Table 7 Crosstabulation of Rating and Subject Taught
When the data was resorted based on whether or not the teacher taught a core subject, a
statistically significant association was found, χ2(3) = 9.065, p < .028. The association
was small, Cramer's V = .114. Based on this, we reject the null hypothesis and accept the
alternative hypothesis that there is an association between evaluation ratings and the
subject taught. A cell-by-cell analysis found the frequency of core teachers rated “highly
effective” was less than expected (adjusted residual = -2.4), while the frequency of non-
core teachers rated “highly effective” was more than expected (adjusted residual = 2.4).
This data also show that teachers of core subjects are rated lower than non-classroom
teachers. This data is summarized in Table 8.
Subject Taught Rating Core Elective Non-classroom Highly Effective 71
(-2.4) 21 (0)
30 (3.1)
Effective 380 (1.4)
96 (.2)
78 (-2.0)
Minimally Effective 15 (1.5)
3 (-1)
0 (-1.8)
Ineffective 4 (1.4)
0 (-.9)
0 (-.9)
Note. Adjusted residuals appear in parenthesis below observed frequencies.

52
Table 8 Crosstabulation of Rating and Core/Non-core
Next, a Chi-squared test was conducted on evaluation ratings and grade level
taught. The null and alternative hypotheses are:
H0 = no change in teacher effectiveness ratings based grade level taught
HA = teacher effectiveness ratings change based on grade level taught
This too was sorted two ways – first by elementary (K- 5), middle school (6- 8) and high
school (9 – 12) and then by elementary (K – 5) versus secondary (6 – 12). This double
sorting was done to first look at the data based on how the schools in the district are
organized, and then based on teachers’ certification levels. A statistically significant
association was found between teacher effectiveness ratings and the grade level taught
with χ2(6) = 20.621, p < .002. The association was small (Cohen, 1988), Cramer's V =
.122. We can reject the null hypothesis and accept the alternative hypothesis that there is
an association between evaluation ratings and the grade level taught (see Table 9).
Therefore, the data show that elementary teachers are rated higher than middle and high
school teachers.
Core / Non-core Rating Core Non-Core
Highly Effective 71 (-2.4)
51 (2.4)
Effective 380 (1.4)
174 (-1.4)
Minimally Effective 15 (1.5)
3 (-1.5)
Ineffective 4 (1.4)
0 (-1.4)
Note. Adjusted residuals appear in parenthesis below observed frequencies.

53
Table 9 Crosstabulation of Rating and Grade Level
When considering evaluation ratings versus elementary or secondary level
teachers (collapsing middle school and high school categories into one), a statistically
significant association was found, χ2(3) = 14.341, p < .002. The association was small,
Cramer's V = .143. Here too, we can reject the null hypothesis and accept the alternative
hypothesis that there is an association between evaluation ratings and the grade level
taught. The adjusted standardized residual within the crosstabulation show a higher than
expected frequency of “highly effective” teachers at the elementary level (adjusted
residual = 2.9) and lower than expected frequency of “highly effective” teachers at the
secondary level (adjusted residual = -2.9) (Table 10). This matches the data above and
indicates that elementary teachers are rated higher than secondary teachers.
Table 10 Crosstabulation of Rating and Elementary/Secondary
Grade Level Rating High School (9 – 12) Middle School (6 – 8) Elementary (K – 5) Highly Effective 34
(-.4) 20
(-2.8) 68
(2.9)
Effective 168 (1.1)
157 (2.0)
229 (-2.8)
Minimally Effective 3 (-1.2)
9 (2.3)*
6 (-.9)
Ineffective 0 (-1.3)
0 (-1.2)
4 (2.3)*
Note: Adjusted residuals appear in parenthesis below observed frequencies. * Adjusted residual not considered due to cell expected count < 5
Level Rating Elementary (K – 5) Secondary (6 - 12) Highly Effective 68
(2.9) 54 (-2.9)
Effective 229 (-2.8)
325 (2.8)
Minimally Effective 6 (-.9)
12 (.9)
Ineffective 4 (2.3)*
0 (-2.3)*
Note. Adjusted residuals appear in parenthesis below observed frequencies. * Adjusted residual not considered due to cell expected count < 5

54
Finally, a statistically significant association was found between teacher
effectiveness ratings and the building when conducting a Chi-squared test, χ2(15) =
61.833, p < .0005. The null and alternative hypotheses are:
H0 = no change in teacher effectiveness ratings based on building
HA = teacher effectiveness ratings change based on building
The association was small, Cramer's V = .172. We can reject the null hypothesis and
accept the alternative hypothesis that there is an association between evaluation ratings
and the building in which the teacher works. When conducting a cell-by-cell comparison
of adjusted standardized residuals, several cells were noted to have absolute values large
enough to provide evidence against the null hypothesis (Table 11). Specifically, two
schools were found to have fewer than the expected number of “effective” teachers
(adjusted residual =-3.6 and -4.2) while having more than the expected number of “highly
effective” teachers (adjusted residual = 3.9 and 5.2). Another school has more than the
expected number of “effective” teachers (adjusted residual = 2.3) and fewer than the
expected number of “highly effective” teachers (adjusted residual = -2.7). Therefore, the
data show that there are differences in evaluation ratings due to the building in which a
teacher works.
Table 11 Crosstabulation of Rating and Building
Building Rating Ashcroft Felder Jackson Venoy Pearson Thomason
Highly Effective 6 (-1.9)
10 (-2.2)
24 (3.9)
27 (5.2)
20 (-2.7)
34 (-.4)
Effective 56 (1.1)
87 (1.8)
44 (-3.6)
40 (-4.2)
157 (2.3)
168 (.7)
Minimally Effective 3 (1.1)
2 (-.4)
1 (-.6)
0 (-1.4)
7 (1.2)
5 (-.2)
Ineffective 1 (1.1)
2 (2.0)*
1 (1.0)
0 (-.7)
0 (-1.2)
0 (-1.3)
Note. Adjusted residuals appear in parenthesis below observed frequencies. * Adjusted residual not considered due to cell expected count < 5
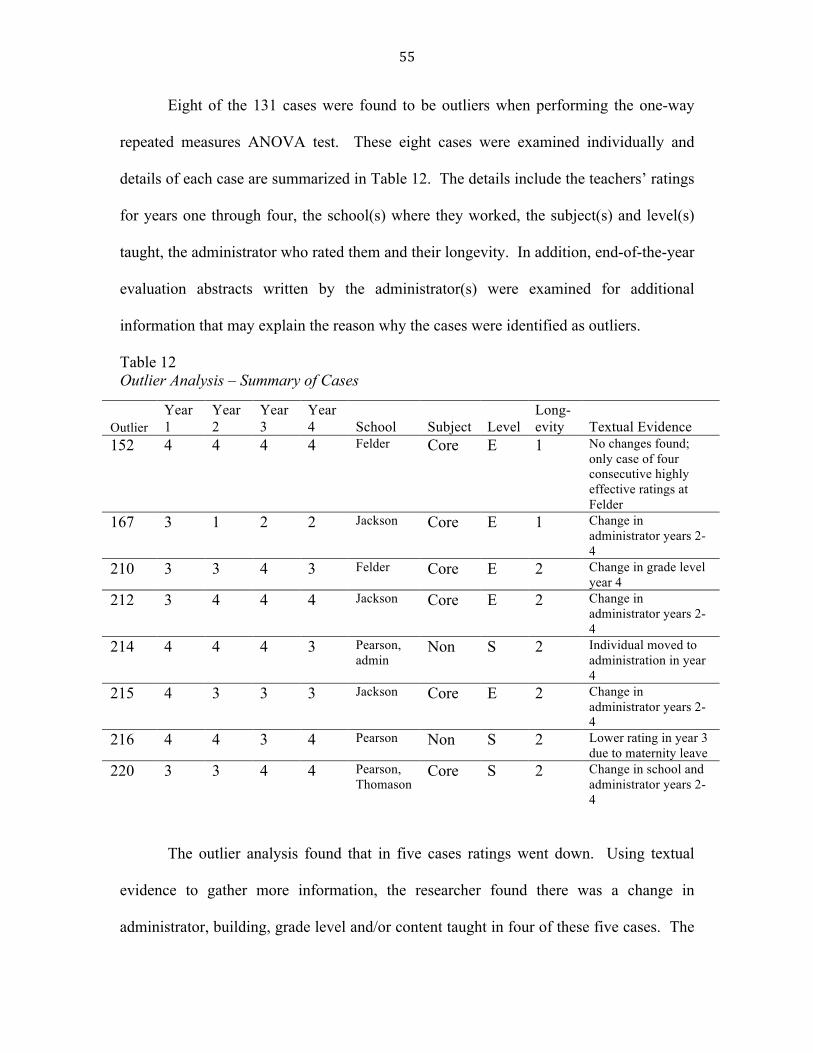
55
Eight of the 131 cases were found to be outliers when performing the one-way
repeated measures ANOVA test. These eight cases were examined individually and
details of each case are summarized in Table 12. The details include the teachers’ ratings
for years one through four, the school(s) where they worked, the subject(s) and level(s)
taught, the administrator who rated them and their longevity. In addition, end-of-the-year
evaluation abstracts written by the administrator(s) were examined for additional
information that may explain the reason why the cases were identified as outliers.
Table 12 Outlier Analysis – Summary of Cases
The outlier analysis found that in five cases ratings went down. Using textual
evidence to gather more information, the researcher found there was a change in
administrator, building, grade level and/or content taught in four of these five cases. The
Outlier Year 1
Year 2
Year 3
Year 4 School Subject Level
Long-evity Textual Evidence
152 4 4 4 4 Felder Core E 1 No changes found; only case of four consecutive highly effective ratings at Felder
167 3 1 2 2 Jackson Core E 1 Change in administrator years 2-4
210 3 3 4 3 Felder Core E 2 Change in grade level year 4
212 3 4 4 4 Jackson Core E 2 Change in administrator years 2-4
214 4 4 4 3 Pearson, admin
Non S 2 Individual moved to administration in year 4
215 4 3 3 3 Jackson Core E 2 Change in administrator years 2-4
216 4 4 3 4 Pearson Non S 2 Lower rating in year 3 due to maternity leave
220 3 3 4 4 Pearson, Thomason
Core S 2 Change in school and administrator years 2-4
56
fifth case was an atypical situation in which the teacher was on a maternity leave for part
of a year, and during that particular year received a lower rating than the other three
years. In one case, the teacher received a rating of highly effective for four consecutive
years, and this is the only instance of those ratings at the school. The other two cases
showed improvement over time.
Surveys – Quantitative Data
Quantitative data was also collected from the teacher and administrator surveys
that were administered. The teacher survey was sent via email to180 teachers in the
Bentley School District, and the administrator survey was sent via email to ten
administrators. Prior to the email, the researcher met with each group of teachers and all
the administrators to provide information about the study, its purpose, the intended use of
the survey data, and was available to answer questions. The survey was created on
Qualtrics and participants were sent an electronic link for access. The survey was open
for approximately six weeks, and four reminder emails were sent to encourage
participation. 104 of 174 teachers (59.8%) responded to the survey and 8 of 10
administrators (80%) responded.
The survey was designed to ask questions pertaining to different aspects of the
FFT instrument and the new teacher evaluation process. In addition to the demographic
questions, each survey was divided into three sections. The first section pertained to the
FFT rubrics, the second section explored the observation process and the third section
focused on the evaluation process. In addition, the questions were regrouped into three
general themes to allow further investigation: Value, impact on performance, and
process. Tables 13 and 14 summarize the demographic information from each survey,

57
and Figures 8-11 display the data visually.
Figure 8: Teacher Experience from Survey Data
Figure 9: Teacher Evaluation Rating from Survey Data

58
Table 13 Teacher Demographic Information from Survey
Figure 10: Administrator Experience from Survey Data
Category N Response Number and Percent Gender 100 Male
Female 22 (22%) 78 (78%)
Grade Level 104* Elementary Secondary
47 (45.2%) 62 (59.6%)**
Teaching Content (if secondary)
61 Core Elective Non-classroom
38 (62.3%) 14 (23.0%) 15 (24.6%)**
Years Teaching 101 Novice (0-4) Experienced (5-14) Veteran (15+)
9 (8.9%) 30 (29.7%) 62 61.4%)
Rating (2015) 97 Ineffective Minimally Effective Effective Highly Effective Not rated
0 6 (6%) 65 (67%) 23 (24%) 3 (3%)
Building 104 Ashcroft Felder Jackson Venoy Pearson Thomason
10 (10%) 14 (13%) 10 (10%) 13 (13%) 39 (38%) 23(22%)*
* The total number is less than the combined total of elementary and secondary teachers because some teachers work at both levels
**Total exceeds 100% because some teachers qualify for multiple categories

59
Figure 11: Administrator Level from Survey Data
Table 14 Administrator Demographic Information from Survey
Category N Response Number and Percent Gender 8 Male
Female 4 (50%) 4 (50%)
Level 8 Elementary Secondary
3 (38%) 5 (62%)
Experience 8 2 years 4 years 5+ years
1 (12%) 3 (38%) 4 (50%)
Table 15 lists the question, number of respondents (n), mean and standard
deviation for both the teacher and administrator surveys. A numbering convention is used
in data displays, allowing the reader to identify the survey, section and theme the
question comes from. The numbering convention is as follows:
T or A: Teacher or administrator survey
R, O, E: Identifies survey section (rubric, observation or evaluation)
1-10: Question number
V, I, P: Identifies question theme (value, impact or process)
Survey question TO3V identifies the third question in the observation section of the

60
teacher survey, and the theme of the question is value. Additionally, new identification
numbers were created for the twenty-one corresponding survey questions (those
questions that are on both the teacher and administrator surveys). These questions are
numbered with the section first, then the theme, and then the question number last (1-20).
The survey question identified as RP2, for example, indicates the second question
regarding the rubric that appears in both the teacher and administrator survey, with a
theme of process.
The mean responses on the teacher survey ranged from 2.6 on question TR7V
(The FFT process is insignificant to me as a professional) to 3.67 on questions TE4P and
TE5P (My evaluator(s) understand the FFT thoroughly and my evaluation was conducted
in a fair manner, respectively).
The administrative survey results have mean responses ranging from 1.38 on
question AR5V (The FFT process is insignificant to me as a professional) to 4.63 on
question AR1V (I clearly understand the purpose of using the FFT for evaluative
purposes).
Questions within value, the first theme, posit about the purpose and usefulness of
the evaluation instrument, perceptions, and practical use. The second theme, impact on
performance, gages whether or not teachers are motivated as a result of the process, and
whether this translates into an increase in student engagement, student achievement,
teacher reflection and/or a change in instructional practices. Process, the third theme,
includes questions that are designed to elicit information about the overall evaluation
process. Respondents are questioned about the consistency, accuracy and fairness with
the FFT. This includes perceptions of fidelity of implementation, communication

61
throughout the process, expectations, training and level of understanding.
Table 15 Side-by-side Comparison of Teacher and Administrator Survey Results
Joint ID
Question Question from teacher survey – no parenthesis (Administrator survey questions - if worded differently - parenthesis)
N t
(a)
Mean t
(a)
Standard deviation
t (a)
Survey item
t (a)
RV1 I clearly understand the purpose of using the FFT to evaluate my work. (I clearly understand the purpose of using the FFT for evaluative purposes.)
98 (8)
3.65 (4.63)
1.25 (.52)
TR1V (AR1V)
RP2 The rubrics in the FFT are easily understood. 98 (8)
3.45 (3.38)
1.16 (.92)
TR2P (AR2P)
RV3 The rubrics in the FFT are consistent with my beliefs about what constitutes effective teaching.
98 (8)
3.4 (4.25)
1.2 (.46)
TR3V (AR3V)
RI4 The FFT provides a common language for me to discuss teaching practices with colleagues. (The FFT provides a common language for me to discuss teaching practices with teachers.)
98 (8)
3.44 (4)
1.18 (.53)
TR4I (AR4I)
I know what I need to do in order to achieve the top level of performance on the FFT.
98 3.09 1.36
TR5P
I believe that it is possible for me to meet the top level of performance on the FFT.
98 2.83 1.49 TR6I
RV5 The FFT process is insignificant to me as a professional. 98 (8)
2.6 (1.38)
1.24 (.52)
TR7V (AR5V)
OV6 The observation process helps me to be reflective in my practice. (The observation process helps teachers to be reflective in their practice.)
98 (8)
3.35 (3.5)
1.24 (1.07)
TO1V (AO1V
)
OP7 The qualitative feedback I receive as part of the evaluation process is clearly connected to the FFT rubric. (I clearly relate my qualitative feedback to the FFT rubric.)
98 (8)
3.3 (3.88)
1.17 (.64)
TO2P (AO2P)
OV8 The qualitative feedback accurately describes my performance. (The qualitative feedback accurately describes teacher performance.)
98 (8)
3.06 (3.88)
1.17 (.35)
TO3V (AO3V
) OI9 The qualitative feedback helps me to improve my performance.
(The qualitative feedback provided helps teachers improve their performance.)
98 (8)
3.18 (3.5)
1.11 (.93)
TO4I (AO4I)
OI10 The observation is long enough in duration for my evaluator to get an accurate depiction of my performance. (The observation is long enough in duration for me to get an accurate depiction of my performance. )
98 (8)
2.78 (3.38)
1.32 (1.3)
TO5P (AO5P)
OV11 I regularly have written conversations with my evaluator(s) following an observation. (I regularly have written conversations with teachers following an observation.)
98 (8)
2.66 (2.88)
1.25 (1.55)
TO6V (A06V)

62
Table 15: Side-by-side Comparison of Teacher and Administrator Survey Results (con’t.)
A Mann-Whitney U test was run to determine if there were significant differences
in survey answers between teachers and administrators for the twenty-one corresponding
survey questions. The null hypothesis was that there was no association between the
Joint ID
Question Questions from teacher survey – no parenthesis (Administrator survey questions - if worded differently - parenthesis)
N t
(a)
Mean t
(a)
Standard deviation
t (a)
Survey item
t (a)
OV12 I regularly have oral conversations with my evaluator(s) following an observation. (I regularly have oral conversations with teachers following an observation.)
98 (8)
3 (3.38)
1.32 (1.41)
TO7V AO7V)
OI13 The discussions I have with my evaluator(s) help me to improve my performance. (The FFT process has encouraged me to discuss effective teaching practices with teachers.)
98 (8)
3.19 (4.13)
1.15 (.99)
TO8I (AO8I)
EP14 I know what is expected in order for me to do well using the current evaluation process. (It is possible for teachers to meet the top level of performance (distinguished).)
97 (8)
3.38 (4.13)
1.22 (.99)
TE1P (AE1P)
EP15 The evaluation process is implemented consistently throughout my school.
97 (8)
2.98 (3.88)
1.32 (.83)
TE2P (AE2P)
The processes and procedures used for my evaluation are fair. 97 3.12 1.18 TE3P EP16 My evaluator(s) understand the FFT thoroughly.
(I understand the FFT thoroughly) 97 (8)
3.67 (3)
1.20 (.76)
TE4P (AE3P)
My evaluation was conducted in a fair manner. 97 3.67 1.18 TE5P EP17 My evaluator(s) spends adequate time observing my instruction in
order to form a basis to assess my performance using the FFT. (I spend adequate time observing teachers in order to form a basis to assess their performance using the FFT.)
97 (8)
3.08 (3.63)
1.34 (.92)
TE6P (AE4P)
EI18 I have changed my instructional methods as a result of using the FFT as part of the evaluation process. (I have observed teachers changing instructional methods as a result of using the FFT as part of the evaluation process.)
97 (8)
3.32 (4.25)
1.2 (.71)
TE7I (AE5I)
The achievement of my students has improved as a result of using the FFT process.
97 2.86 1.1 TE8I
EI19 The engagement of my students has improved as a result of using the FFT process. (The engagement of students has improved as a result of using the FFT process.)
97 (8)
2.84 (3.25)
1.11 (.104)
TE9I (AE6I)
EV20 In general, the FFT process is valuable to me as a professional. (In general, the evaluation process is valuable to our district.)
97 (8)
2.87 (3.25)
1.19 (.89)
TE10V (AE8V)
The evaluation process could be improved. (8) (3.5) (1.31) (AE7P) EV21 My evaluation score accurately describes my performance.
(The evaluations I write accurately describe teacher performance.) 91 (8)
1.4 (1)
.49 (0)
TE11V (AE9V)
In cases where data is entered for both teachers and administrators, the teacher (t) data is on top and the administrator (a) data is on the bottom of the cell.

63
independent and dependent variables and the alternative hypothesis was that there is an
association between the independent and dependent variables. Independent variables
include the building, level, content, and experience and they are related to each survey
question (dependent variable). Distributions of the survey scores for teachers and
administrators were similar in all cases but one (OV11), as assessed by visual inspection.
In this one case, there was not a statistically significant difference in the survey scores for
teachers (mean rank = 52.7) and administrators (mean rank = 56.69), U = 358.5, z =-.366,
p = .715.
There was a statistically significant difference in the survey scores of teachers and
administrators for 7 of the 21 corresponding questions. Table 16 reports the results of the
Mann-Whitney U test for the seven questions showing statistically significantly different
results. The table includes the question, number of respondents (n), the mean rank, the
median (Mdn), the Mann-Whitney U score (U), the z-score (z) and the level of
significance (p). These seven questions are listed below and parenthesis indicate
differences between the teacher and administrator surveys:
• I clearly understand the purpose of using the FFT (to evaluate my work/for evaluative purposes).
• The FFT process is insignificant to me as a professional. • The qualitative feedback accurately describes (my/teacher) performance. • The FFT process has encouraged me to discuss effective teaching practices
with (my evaluators/teachers). • The evaluation process is implemented consistently throughout my school. • In general, the evaluation process is valuable (to me as a professional/to our
district) • (My evaluation score/the evaluations I write) accurately describe (my/teacher)
performance.
The nonparametric Kruskal-Wallis H test was used to determine if there are
statistically significant differences between independent variables (building, level,

64
content, and experience) for each question (dependent variables). First, the test was run
to calculate differences in the scores among the six buildings. Distributions of survey
scores were similar for all groups, as assessed by visual inspection of a boxplot. Median
survey scores were statistically significantly different between groups for 13 survey
questions. Results of these cases are listed in Table 17. For each of these cases, pairwise
comparisons were performed using Dunn's (1964) procedure with a Bonferroni correction
for multiple comparisons. Statistical significance was accepted at the p < .0083 level. The
results of each post hoc analysis revealing statistically significant differences in survey
scores between the buildings are also detailed in Table 17.
Table 16 Statistically Significant Results of the Mann-Whitney U Test
Question n Mdn (teachers)
Mdn (admins)
Mean rank (teachers)
Mean rank (admins) U z p
RV1 104 4 5 50.57 75.63 199 -2.382 .017 RV5 105 2 1 55.15 26.88 179 -2.601 .009 OV8 105 3 4 51.34 73.13 227 -2.028 .043 OI13 105 3 4 51.04 76.75 198 -2.396 .017 EP15 105 3 4 51.36 72.94 228.5 -1.98 .048 EV20 105 3 4 50.98 77.44 192.5 -2.436 .015 EV21 99 1 1 48.37 68.5 216 -2.267 .023 * indicated statistically significant results (p < .05) Table 17 Statistically Significant Results of the Kruskal-Wallis H Test Survey Item Kruskal-Wallis H Test
Statistically significant differences found between buildings:
TR1V χ2(5) = 15.726, p = .008 Venoy (Mdn = 2.0) and Felder (Mdn = 4.0) Venoy and Jackson (Mdn = 5.0) Venoy and Ashcroft (Mdn = 4.0)
TR2P χ2(5) = 22.539, p = .001 Jackson (Mdn = 4) and Venoy (Mdn = 2) Jackson and Pearson (Mdn = 3)
TR3V χ2(5) = 16.546, p = .005 Venoy (Mdn = 2.5) and Jackson (Mdn = 5) TR4I χ2(5) = 22.575, p = .001 Venoy (Mdn = 2) and Jackson (Mdn = 5)
Venoy and Ashcroft (Mdn = 4) TR7V χ2(5) = 21.888, p = .001 Jackson (Mdn = 1) and Venoy (Mdn = 3.5)
Jackson and Pearson (Mdn = 3) Jackson and Thomason (Mdn = 3)
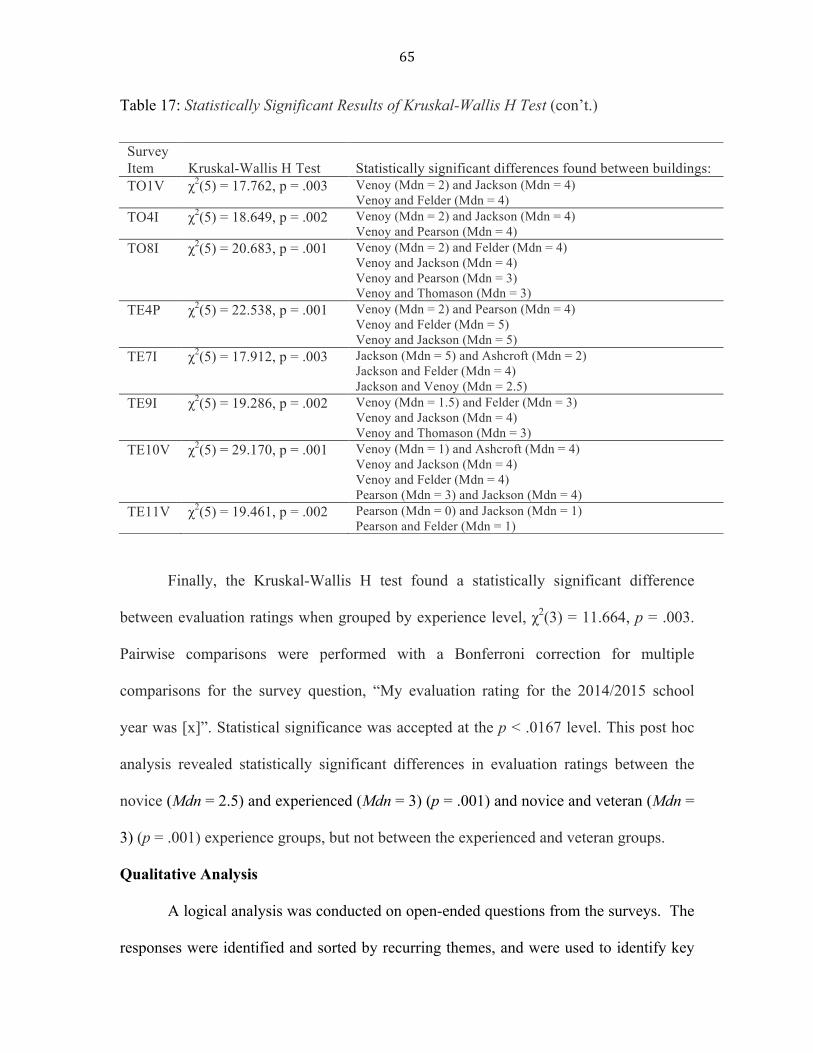
65
Table 17: Statistically Significant Results of Kruskal-Wallis H Test (con’t.)
Finally, the Kruskal-Wallis H test found a statistically significant difference
between evaluation ratings when grouped by experience level, χ2(3) = 11.664, p = .003.
Pairwise comparisons were performed with a Bonferroni correction for multiple
comparisons for the survey question, “My evaluation rating for the 2014/2015 school
year was [x]”. Statistical significance was accepted at the p < .0167 level. This post hoc
analysis revealed statistically significant differences in evaluation ratings between the
novice (Mdn = 2.5) and experienced (Mdn = 3) (p = .001) and novice and veteran (Mdn =
3) (p = .001) experience groups, but not between the experienced and veteran groups.
Qualitative Analysis
A logical analysis was conducted on open-ended questions from the surveys. The
responses were identified and sorted by recurring themes, and were used to identify key
Survey Item Kruskal-Wallis H Test Statistically significant differences found between buildings: TO1V χ2(5) = 17.762, p = .003 Venoy (Mdn = 2) and Jackson (Mdn = 4)
Venoy and Felder (Mdn = 4) TO4I χ2(5) = 18.649, p = .002 Venoy (Mdn = 2) and Jackson (Mdn = 4)
Venoy and Pearson (Mdn = 4) TO8I χ2(5) = 20.683, p = .001 Venoy (Mdn = 2) and Felder (Mdn = 4)
Venoy and Jackson (Mdn = 4) Venoy and Pearson (Mdn = 3) Venoy and Thomason (Mdn = 3)
TE4P χ2(5) = 22.538, p = .001 Venoy (Mdn = 2) and Pearson (Mdn = 4) Venoy and Felder (Mdn = 5) Venoy and Jackson (Mdn = 5)
TE7I χ2(5) = 17.912, p = .003 Jackson (Mdn = 5) and Ashcroft (Mdn = 2) Jackson and Felder (Mdn = 4) Jackson and Venoy (Mdn = 2.5)
TE9I χ2(5) = 19.286, p = .002 Venoy (Mdn = 1.5) and Felder (Mdn = 3) Venoy and Jackson (Mdn = 4) Venoy and Thomason (Mdn = 3)
TE10V χ2(5) = 29.170, p = .001 Venoy (Mdn = 1) and Ashcroft (Mdn = 4) Venoy and Jackson (Mdn = 4) Venoy and Felder (Mdn = 4) Pearson (Mdn = 3) and Jackson (Mdn = 4)
TE11V χ2(5) = 19.461, p = .002 Pearson (Mdn = 0) and Jackson (Mdn = 1) Pearson and Felder (Mdn = 1)

66
ideas, teacher/administrator interactions, misconceptions, positive and negative aspects of
the process and suggestions for improvement.
Three broad categories emerged during the textual analysis on the teacher survey,
two of which also appeared on the administrator survey, identifying interactions that
support improvement. Coaching and professional development are the categories that
represented answers by both teachers and administrators. The third category mentioned
by teachers was communication. In addition, 34 respondents (43%) indicated that they
were unclear or did not know what they needed to do in order to improve. This is
represented by the category “unsure” on the graph (Figure 11). In addition to the
categories coaching and professional development, reflection was also indicated as a
necessary attribute to advance to the next level on the FFT (Figure 12).
Figure 12: Teacher Responses – What is Necessary to Advance to the Next Level?

67
Figure 13: Administrator Responses – What is necessary to Advance to the Next Level?
Many teachers and administrators commented on positive and negative aspects of
the evaluation process, as well as made suggestions for improvement. Misconceptions
about the process were also observed. These responses are summarized and organized in
Table 18. Although the comments in table 18 are not a complete listing of comments
from the survey results, they are listed to offer a snapshot of the feedback given by both
teachers and administrators.
Table 18 Summary of Comments from Teacher and Administrator Surveys TeacherSurvey–CommentsOrganizedbyType(from79totalrespondents) PositiveAspects • The FFT rubrics can be a valuable evaluation and self-reflective tools, but only if and when
implemented appropriately • The administrator(s) are very fair in listening during the post-observation conversations • The FFT gives a good foundation to build from in the post-observation conversations • I like the FFT to use as a guide – it has helped me to me more mindful of asking deeper
questions and sharing learning targets with students • The FFT is helpful during the formative years of teaching

68
Table 18: Summary of Comments from Teacher and Administrator Surveys (con’t.)
Concerns • The FFT is too wordy and too difficult to understand
• The highly effective rating is far too ethereal with no clear path to achievement • Teaching is more than a stringent framework one should follow – it is a something that changes
with every child encountered and nothing can effectively measure that except the child it impacts
• The FFT can lead to teachers staying in a rut simply because what they are doing is good enough • The current process does not reward teachers to take calculated risks in their classroom for the
fear they would score lower then they have in the past. Suggestions • The evaluation should be set so that all to most teachers can get highly effective – as teachers,
that is our goal for students and it seems impossible to achieve with the FFT • We need to focus on collaboration, versus competition • The labels of highly effective, effective, minimally effective, and ineffective are unfair,
misleading and inadequate • More professional development needs to take place in understanding the rubric for instructional
use • Principals should focus more on teachers (who) are struggling
Misconceptions • It's only for teachers who live and breath (sic.) work
• The superintendent only allows certain numbers of teachers to be assigned the "highly effective" rating
• A formal "mission statement" in my classroom is necessary to become a highly effective teacher • Factors like teacher/student relationships are not considered • Administration gives most teachers an effective rating because they know it will cause the least
amount of conflict • There is (sic.) no criteria for "highly effective"
AdministratorSurvey–CommentsOrganizedbyType(from8totalrespondents) Positive Aspects • As a whole, the district has made notable strides towards improving classroom instruction
thanks to the quality coaching conversations that cultivate from the FFT • I have seen shifts in teacher practice; I believe this is not due to the FFT as much as it is to
ongoing professional development and modeled lessons Concerns • Number of evaluations - time in classrooms rather than number of times in classrooms (short
snip-its do not provide opportunities to see many of the true qualities of what is happening in a classroom (would longer evaluations less often with more cultural visits be more effective?)
• When the administrator is the one that is doing the coaching, true coaching does not occur, as the teacher views the coaching as an evaluative process rather than a helpful process
• There is a disconnect between the FFT and teachers - teachers are not familiar with it enough to utilize it in their practice or during reflection
Suggestions • Coaching teachers about what the framework looks and sounds like within their practice needs
development • Ongoing training in the evaluation process, including discussions on what each level of
effectiveness looks like

69
Conclusion to Research Findings
The aim of this study was to determine whether teacher evaluation using the FFT
produces instructional improvement over time, and to identify specific interactions
between teacher and evaluator that contribute to teacher performance. The longitudinal
study and survey data yielded key findings related to the research questions.
Key findings revealed from the longitudinal study include:
• Teacher evaluation ratings increased significantly during a novice teacher’s first
four years of teaching, whereas teacher evaluation ratings of experienced and
veteran teachers did not increase at a statistically significant level.
• Long term increases in ratings show a statistically significant association
indicating the importance of maintaining consistency over several years.
• Overall, fewer teachers than expected were rated minimally effective, calling into
question the differences in labeling conventions between the state and the FFT
and the depth of the categories in the FFT rubric.
• Some schools had evaluation ratings that were different than expected, indicating
the need for ongoing professional development, collaboration and training for
administrators.
• Elementary teachers are more likely to be rated highly effective than secondary
teachers.
• Teachers of elective classes and non-classroom teachers are more likely to be
rated highly effective than those who teach core content.
Key findings from the teacher and administrator surveys include:
• There are a number of discrepancies between administrator and teacher
70
perceptions indicated by the survey results.
• The majority of differences between teacher and administrator perceptions are
questions pertaining to the value of the process.
• One building shows significant differences in numerous areas.
• Both teachers and administrators identified coaching and professional
development as tools for improvement on the FFT.
• 43% of teacher survey responses revealed the teacher did not know how to
advance to the next level on the FFT.
• A number of teachers have misconceptions regarding the FFT, the evaluation
process, or both.
The teacher evaluation process used by Bentley School District consists of several
classroom observations and post-observation interactions between teacher and
administrator, with an emphasis on implementing effective teaching strategies as detailed
in the FFT. This evaluation process and the FFT rubric that is used by the district was
examined to assess its appropriateness in measuring and evaluating the complex
profession of teaching. The data analyses performed in this chapter are the basis for the
conclusions and recommendations that are presented in the following chapter.

71
CHAPTER 5: SUMMARY, DISCUSSION AND RECOMMENDATIONS
The evaluation of teachers is not new; in fact, administrators have always been
responsible for staff performance and evaluation. Most school districts had developed
evaluation models, often in collaboration with teachers and teachers’ unions, which were
specific and detailed. A recent wave of new legislation throughout the country, and
Michigan in particular, has forced districts to revamp their evaluation systems, in many
cases quite drastically. In an effort to comply with the Michigan law (Legislative
Council, 2011) and the aggressive timelines contained therein, district officials have
scrambled to find effective tools to serve the purpose of evaluating teachers.
A major catalyst for the change came about after The Widget Effect (Weisberg,
Sexton, Mulhorn, and Keeling, 2009) was published, when nearly exclusively positive
teacher evaluations were starkly juxtaposed with mediocre student standardized test
scores. The report pointed out the high percentage of teachers who were rated as being
satisfactory in their job performance (94-98%), and that less than 1% were rated
ineffective. In Michigan, this ultimately translated into the revision of school code
section 380.1249, prohibiting teacher evaluation as a subject of bargaining, and requiring
that districts use student growth and assessment data in conjunction with one of the
recommended performance evaluation systems, of which the FFT is one (Legislative
Council, 2011). The law further states that the performance evaluation tool include
frequent, short classroom observations with feedback provided to the teachers.
This study examined one of the most commonly used teacher evaluation tools,
Charlotte Danielson’s Framework for Teaching (FFT), to determine whether it produce
instructional improvement over time when embedded into the evaluation process. This

72
study also strives to identify those interactions between teachers and administrators that
contribute to improved teacher performance. The FFT was designed to assess all the
complexities inherent in the art of teaching, cutting across grade levels, subject areas and
experience levels. The FFT identifies key performance standards that are organized into
four domains of professional practice: planning and preparation, the classroom
environment, instruction and professional responsibilities (Danielson, 2007). Each
domain is further divided into performance components and elements. The FFT was not
developed to be the evaluation tool it is commonly used for today; rather, its intended
purpose is to help educators improve their practice and identify effective teaching
strategies, and its recommended process relies heavily upon collaboration and
professional conversations between evaluators and teachers.
The study found that a positive change in evaluation scores over time has
occurred, and the reasons for the change will be explored in this chapter. The research
questions and underlying questions are:
1.) Does teacher evaluation using the FFT produce instructional improvement
over time?
a. Does the change indicate that the teachers are getting better at their
practice?
b. Does the FFT adequately inform educators about their practice, and if so
how?
c. Do some groups of teachers, such as early elementary teachers or veteran
teachers, show greater growth than others?
d. Are there limitations to the tool, such as differences between the four

73
levels of effectiveness?
2.) What interactions around the FFT between evaluator and teacher contribute to
teacher performance?
a. What are some of the interactions around FFT that contribute to teacher
performance? Are some types of interactions more helpful than others?
b. Do teachers and administrators have a clear understanding of the FFT? Do
they find value in the FFT?
c. Do teacher and administrator groups have similar beliefs/views regarding
the evaluation process?
d. Do sub-groups of teachers have similar beliefs/views regarding the
evaluation process?
This research studied the FFT to determine whether the FFT produced
instructional improvement over time, and analyzed the interactions between
administrators and teachers that contribute to teacher performance. Bentley School
District was chosen as a case study for several reasons. First, the district used the FFT as
its evaluation tool with fidelity during the duration of the study: from 2011 – 2015. It is
rare to find a district in Michigan that has been using the same tool for such a long period
of time, given the continuous changes in the law. Secondly, all administrators and
teachers participated in 24 hours of professional development in the fall of 2011,
providing foundational knowledge to all stakeholders. Lastly, all district administrators
have had training as evaluators in the FFT, and most are certified evaluators for the FFT.
The first research question was studied by using a one-way repeated-measures
ANOVA test for all cases that included four years’ worth of data. Demographic variables

74
(longevity, school, grade level, subject) were then examined to determine if associations
exist and if so, the extent to which they were statistically significant. Survey data were
used to gain a better understanding of the beliefs and views of teachers and
administrators, and to add depth to the research questions being asked. A textual analysis
was performed in cases involving outliers.
Survey data were collected, summarized and analyzed to gain insight into both
teacher and administrator experiences with and perception of the FFT, using a cross-
variable analysis to determine what associations exist between variables. Mann Whitney
U tests were conducted to determine whether the data show statistically significant
differences between teachers and administrators, and the non-parametric Kruskal-Wallis
H test was run to examine differences among variables (buildings, experience level,
content taught, etc). Finally, qualitative elements of the study provided the researcher
with a better understanding of how a teacher’s practice is impacted by frequent, informal
classroom observations and feedback using the FFT.
This research identified some key findings pertaining to how well the FFT
produced instructional improvement over time, and identified specific interactions that
contribute to teacher performance. These are presented and discussed below.
Research Question #1 – Key Findings
Data from the longitudinal study and survey questions were used to examine the
first research question and its sub-questions. The question asked, “Does teacher
evaluation using the FFT produce instructional improvement over time?” Longitudinal
data show teacher evaluation ratings changed significantly over time and the mean rank
increased from 2.25 in year 1 to 2.65 in year 4. This answers the sub-question, “Does the

75
change indicate that the teachers are getting better at their practice” affirmatively. Year-
to-year associations were not always significant and the strongest association was
between years 1 and 4. This suggests that while the FFT does result in instructional
improvement over time, it can fluctuate from year to year, supporting the notion that the
consistency to which districts maintain an evaluation tool is important for long-term
improvement in teacher performance. The FFT is quite extensive, involving 4 domains,
22 components and 76 smaller elements, all described at four different performance
levels. It takes time for teachers and administrators to become familiar with the tool, and
to successfully implement sound instructional practices as suggested by the FFT.
Teacher responses to survey question EI18, “I have changed my instructional
methods as a result of using the FFT as part of the evaluation process” were positive,
with 53% of teachers responding “agree” or “strongly agree.” One teacher responded
that the FFT “helped me to be more mindful of asking deeper questions and sharing
learning targets with students.” In spite of a positive response on this question, however,
very few teacher comments supported or detailed the notion of improved instructional
strategies due to the evaluation process. In fact, comments indicated that some teachers
view the FFT not as a tool for personal improvement, but solely as an evaluation
instrument. Thirty-four teachers (43%) reported that they did not know what was
necessary to improve. One teacher explains, “I don’t think it has made a huge impact on
my practice. Teachers know what to do to improve.” Another teacher shared, “There are
too many things in the evaluation that are out of my control,” and another expressed that
improvement was impossible and “many teachers feel defeated by this rubric.”

76
Similar results were found by White, Cowhy, Stevens & Sporte (2012) in their
study aimed at understanding how teachers and administrators perceived the system. The
challenges they encountered included utilizing the evaluation process to improve
instruction, creating buy-in from participants, and reducing the time burden on
administrators. Time and consistency may improve teachers’ perceptions of the
evaluation system. It is important to remember that the cycle of observation, feedback,
discussion centered on instructional strategies, best-practices and coaching is
substantially different than what has been done in the past. However, as long as high-
stakes decisions involving layoffs and job security are connected to this process, the less
likely teachers will view it as anything other than an evaluation, let alone as a coaching
model.
On the other hand, every administrator, when asked if they have observed
teachers changing their instructional strategies, indicated a positive response. One
remarked, “The whole district has made notable strides towards improving classroom
instruction.” Another noted that they “have seen shifts in teacher practice,” although they
attribute the change not only to the use of the FFT, but to other elements, such as
professional development, as well.
Fewer teachers than expected were rated “minimally effective.” The same is
likely true for those rated “ineffective” but due to the low count in that category, the Chi-
square test did not meet the assumption of having a minimum expected frequency of five.
Most teachers receive one of the two ratings, “effective” or “highly effective.” Fifty-
percent (50%) of those rated “minimally effective” are novice teachers, and the other
50% make up the remaining two groups: experienced (16.7%) and veteran (33.3%). The

77
state’s labeling or verbiage of effectiveness levels does not match the FFT’s categories of
proficiency, and this may have an impact on how the various levels are interpreted by
teachers and administrators.
A considerable discrepancy between the FFT and the State of Michigan’s rating
system is the word choice, or verbiage, used for labeling the categories. Whereas the
State of Michigan uses the categories “ineffective, minimally effective, effective, and
highly effective,” the FFT uses “unsatisfactory, basic, proficient, and distinguished,”
respectively. Most notably, the FFT level of “basic” corresponds to the State of
Michigan’s level of “minimally effective”. When administrators rate teachers “basic”
according to the FFT, it is translated to “minimally effective” on their evaluation, often
causing teachers anxiety and mistrust in the evaluation tool. One teacher comments, “the
labels of highly effective, effective, minimally effective and ineffective are unfair,
misleading and inadequate.” If lawmakers changed the “minimally effective” label to
“basic” it would align better with the FFT and would help these teachers accept their
rating and strive for improvement. Even first year teachers are put off by the label,
“minimally effective,” because of the negative connotation associated with it.
Additionally, administrators are more apt to give teachers a “basic” score than
“minimally effective,” allowing them to utilize the FFT with greater fidelity.
Overall, fewer teachers than expected were rated minimally effective, calling into
question not only the differences in labeling conventions between the state and the FFT,
but also the depth of the categories in the FFT rubric. With so few teachers falling into
the “minimally effective” or “basic” level of the FFT, perhaps the categories ought to be
expanded, moving from 4 proficiency levels to five or six. As stated by one

78
administrator, “the ‘proficient’ level of the FFT encompasses a wide range of teacher
abilities. The difference between a ‘low proficient’ and a ‘high proficient’ is extreme.” A
revised rubric, with more proficiency levels, would allow for more accurate feedback and
more concise explanations. This would also help address teachers’ concerns that it is too
difficult to move to the next level of the FFT.
Research question 1b asks, “Does the FFT adequately inform educators about
their practice, and if so, how?” Seven survey questions directly inform this question, four
of which teachers responded positively to and three of which showed negative responses.
These questions and their percentage of positive responses were:
• OV6 The observation process helps me to be reflective in my practice (61%)
• OP7 The qualitative feedback I receive as part of the evaluation process is clear
(55%)
• EP14 I know what is expected in order for me to do well using the current
evaluation process (59%)
• EP15 The evaluation process is implemented consistently throughout my school
(41%)
• EI18 I have changed some of my instructional methods as a result of using the
FFT (53%)
• TE8I The achievement of my students has improved as a result of using the FFT
(29%)
• EI19 The engagement of my students has improved as a result of using the FFT
(28%)

79
While a number of teachers did not respond positively to OV6, OP7, EP14, and
EI18, more than half of the teachers did. This indicates that teachers find the observation
process and feedback from administrators helpful to them, and many claim to have
changed instructional practices as a result. Interestingly, 59% indicate that they know
what is expected in order for them to do well, which is in contrast to the number of
teachers who wrote in the comments that they were unclear of the expectations. This
draws attention to the fact that teachers are split when it comes to understanding the
expectations and process. A number of teachers identify lack of communication as the
reason for the ambiguity: “No feedback has ever been given to guide me,” “I’m not really
sure what my rating is based on,” “when I asked my administrator I was not given a
straight answer,” and “this wasn’t clarified.” It will be important, moving forward, that
the expectations and process is clarified and continually communicated to stakeholders.
The shift in the evaluation process is substantial, and impacts teaching at all levels. It is
vital that districts clearly communicate the rationale and the process, and revisit it often.
The importance of effective communication, particularly in areas involving high-
stakes decisions such as teacher evaluations, cannot be over-emphasized. District leaders
must clearly and continually articulate a clear rationale to teachers, using multiple modes
of communication. This study uncovered a discrepancy between administrators, who
perceive that the details have been communicated, and some (not all) teachers, who do
not have clarity regarding the process. Effective communication involves identifying the
purpose as well as the details, and revisiting it often. The communication divide may be
caused from an ambiguously defined purpose. Whereas administrators view one of the
main evaluation goals as improving and supporting classroom instruction, many teachers

80
tend to see it as a way to rank their ability against others’ ability. This communication,
ideally from an administrator who has built trust with his staff, is necessary if teacher
evaluation is to move from a process imposed upon the educational community to a
useful practice. Darling-Hammond contends that this process must move away from
being an obstacle or an impediment (2013). A clarification and ongoing statement of the
purpose, as it relates to students, will be important moving forward.
The next part of the study examined similarities and differences between teacher
groups, answering question 1c, “Do some groups of teachers show greater growth than
others?” Question 2d, “do sub-groups of teachers have similar beliefs/views regarding
the evaluation process” is answered in conjunction with 1c, as the sub-groups are the
same and both questions found statistically significant associations. Data for these
questions were compiled by looking for associations between teacher ratings and the
following demographic groups in both the longitudinal study and the survey data:
longevity, building, subject taught, and level (elementary vs. secondary).
As expected, there is a statistically significant association between longevity and
evaluation ratings. This association is true when comparing novice teachers to both
experienced and veteran teachers. There is not, however, a statistically significant
association between experienced and veteran teachers. This highlights the growth
inherent in the first four years of a teacher’s career. Administrators, mindful of this, will
expend resources and invest in the development of their novice teachers during this
critical time. Survey date show the same results.
A similar statistically significant association was found between teacher
evaluation ratings and the school in which the teacher taught. There were two schools

81
that had fewer than the expected amount of “effective” teachers, while having more than
the expected amount of “highly effective” teachers, and one school that had more than
the expected amount of “effective” teachers and less than the expected amount of “highly
effective” teachers. One of the schools with a higher than expected number of highly
effective teachers has a novice staff (less than five years’ experience) of 6%, possibly
contributing to these results. This does not hold true with the other schools in question,
however. These differences could also be influenced by the differences found in labeling
conventions for various levels of proficiency between the state and FFT, and how this in
interpreted by different administrators, as described above. In a similar study,
Milanowski (2011) found that procedural variations could impact the reliability of the
ratings, underscoring the importance of inter-rater reliability.
When the data were examined by building, there were statistically significant
differences on a number of questions on the teacher survey. Table 14 lists the questions
and indicates the question type and theme. A close analysis of the building findings show
that responses from one specific school are responsible for creating statistically
significant differences in 92% of the questions. The questions were sorted by type and
theme, and 46% of the questions fell into the “value” category. For that school, teachers
are more likely to:
• Misunderstand the FFT rubrics and the purpose of using the FFT.
• Find the FFT rubric to be inconsistent with what constitutes effective teaching.
• Find the FFT process to be insignificant to them as professionals.
• Perceive the process as inconsistent throughout the school.
And they are less likely to:

82
• Use the common language in the FFT to discuss teaching practices with
colleagues.
• Find the observation process helps them to be reflective.
• Find the FFT rubric easy to understand.
• Use feedback to improve their performance.
• Improve their performance based on discussions with their administrator.
• Believe their administrator understands the FFT.
• Change their instructional methods as a result of the process.
• See an improvement in student engagement based on using the FFT.
• Find the FFT process to be valuable.
The considerable difference found in this school as compared to other schools in
the district is concerning. In spite of administrative training and certification in the FFT
process, as well as ongoing communication and support at the district level, there exists
noteworthy variation in this one case. This finding emphasizes the importance of
consistency and fidelity of implementation at the district level to ensure inter-rater
reliability. The administrators must participate in ongoing training and professional
development that is done collaboratively to minimize differences between evaluators.
One of the administrators suggested that regular, collaborative discussions take place,
identifying characteristics for each proficiency level. This idea is supported by Danielson
(2007), who emphasizes that the purpose of ongoing training is not to eliminate bias or
personal preference, but to recognize it and minimize its effect. The MET project (2013)
had similar findings, stating, “the accuracy of observations requires rigorous training” (p.
6).

83
The study found an association that was statistically significant between teacher
evaluation ratings and the subject taught by teachers. The frequency of non-classroom
teachers (counselors, special education teachers, interventionists, and social workers)
rated “highly effective” was more than expected when comparing non-classroom teachers
with classroom teachers, and vice-versa. There was also a difference found between core
and non-core teachers. Those teachers who did not teach a core class, but instead teach
an elective, are more likely to be rated highly effective than teachers of mathematics,
English, social studies or science. This could be due to a number of reasons, including
the difference between traditional classroom settings versus the student-centered, group
settings that are more commonly found in elective courses.
The final statistically significant association identified in the one-way repeated
measures ANOVA was found when comparing teacher evaluation ratings and the level of
school the teacher was in – elementary or secondary. There was a higher than expected
frequency of “highly effective” teachers at the elementary level than at the secondary
level. As with the difference between the structure of elective and core classes, this, too,
could be a result of the difference in classroom structure, lessons and activities that are
inherent in an elementary setting as opposed to those at the secondary level. Both
elementary and elective classrooms tend to be more constructivist in nature than a typical
secondary classroom. Research has shown that constructivist instructional strategies
have a positive impact on student achievement in secondary mathematics classrooms and
in other classes of core subjects (Marzano and Waters, 2009, Cobb aned Bowers 1999,
Hiebert & Grouws, 2007, Hill et al. 2007). Even though it is less common to find these

84
strategies used in secondary classrooms, making a transition to include them is supported
by research.
The FFT is grounded in constructivism, stemming from the work of Dewey,
Piaget and Vygotsky, and is acknowledged as “providing the most powerful framework
for understanding how children (and adults) learn” (Danielson, 2013, p. 15). Inherent in
the proficient and distinguished levels of the FFT are constructivist attributes, including
active involvement by students, cognitive engagement in exploring and learning
concepts, and activities and discussions initiated and modified by students to enhance
their learning. In such classrooms, evidence of student voice and choice with groupings
that are flexible, fluid and intentional is apparent. This is in contrast to a more traditional
view of learning that is focused on knowledge and procedures. (Danielson, 2013). The
focus of teaching is no longer the delivery of a presentation (albeit sometimes this is
necessary) and assigning questions, rather it “focuses on designing activities and
assignments – many of them framed as problem solving – that engage students in
constructing important knowledge” (Danielson, 2013, p. 17). Teachers using a more
traditional approach will most often fall into the “basic” category using the FFT rubric.
The one-way repeated measures ANOVA test produced outliers in eight cases. These
cases were examined individually by analyzing demographic variables to determine
factors that contribute to unusual results. A copy of the teachers’ end-of-the-year written
abstract was examined in an effort to learn more about each of these cases. Of the eight
outliers, ratings went down in five instances, stayed the same (at the highest level) in one
instance and went up over time in two cases.
The outlier analysis found that in seven of the eight cases (87.5%) there was a

85
change in teachers’ building, administrator and/or grade level, and most often resulting in
a lower rating. This underscores the notion that teacher ratings increase when they have
consistency in their job and surroundings. This makes sense, as a change in building or
grade level results in a learning curve for teachers. Any teacher will agree that their
profession is a craft, carefully developed with instructional practices improving over
time.
Limitations to the FFT
Two limitations to the FFT tool emerged from the data and inform question 1d.
The first limitation is that the four categories do not provide enough variation to
adequately separate levels of proficiency. This is illustrated by the fact that 97% of
teachers fell within the “proficient” and “distinguished” categories in year 4 of the study
(year 1 was 98%, year 2 was 94% and year 3 was 98%) and less than 1% were rated
ineffective in all four years of the study. There is a broad range of ability demonstrated
by teachers within the “proficient” category, resulting in teachers with vast difference in
ability who are receiving the same rating. Teachers and administrators have identified
this as a limitation of the FFT, and it is the cause of frustration for a number of teachers.
It also contributes to the perception of teachers that the FFT is subjective, particularly in
the upper two levels of the rubric. In fact, the top level is viewed by many as
unattainable and unrealistic, as noted in the following comments from teachers: “A
highly effective classroom just has “magic,”” “It’s meant to be an ideal rather than a
goal,” “One only “visits” highly effective,” and “It seems impossible to attain, and
creates resentment because teachers are working very hard.”

86
Interestingly, under the revised evaluation system, the number of teachers falling
into the “satisfactory” category is essentially the same as was reported in The Widget
Effect, a study that served as a major catalyst for change in teacher evaluation systems.
The Widget Effect found 94% of teachers were rated in the top two categories of
effectiveness when districts used more than two rating categories (i.e. satisfactory and
unsatisfactory), and less than 1% were rated unsatisfactory (Weisberg, Sexton, Mulhorn,
and Keeling, 2009). Districts throughout Michigan show similar results, with 97.3% of
teachers rated “effective” or “highly effective” in the 2013-2014 school year and 97.1%
in 2012-2014 (Michigan Department of Education, 2016).
The second limitation pertains to the State of Michigan’s labeling convention as
compared to the proficiency levels of the FFT. As discussed above, the negative
connotations inherent in the state’s labels are concerning and likely have an influence on
how administrators throughout the state rate their “basic” teachers. To confound matters,
the authors of the FFT and the Michigan State legislators view the ratings themselves
differently. The FFT uses the labels ineffective, basic, proficient and distinguished,
drawing a line of acceptable and unacceptable between ineffective and basic. According
to the FFT, it is normal for novice teachers to fall into the “basic” category, whereas the
State of Michigan draws the line so that the third level, basic, falls into an “unacceptable”
category.
The State of Michigan lawmakers, using the rating labels of ineffective,
minimally effective, effective and highly effective, have placed consequences upon
teachers who receive a “minimally effective” or “ineffective” rating. Novice teachers
may not be issued their initial professional certificate (normally issued after five years of

87
classroom teaching) unless the individual was rated “effective or highly effective on his
or her three most recent evaluations. This puts the onus on administrators who must
decide if an honest evaluation is worth the loss of a potentially great teacher, who is
performing at the basic level (as they often are in their first years of teaching). Any
teacher who receives a rating of “ineffective” must improve their rating by the third year,
or the district must inform parents that their child will be taught by a teacher who was
rated “ineffective” during their third year (Legislative Council, 2011), assuming, of
course, that the district continues to employ the teacher.
Research Question #2 – Key Findings
The second research question, “What interactions around the FFT between
evaluator and teacher contribute to teacher performance?” is addressed through the data
found in the teacher and administrator surveys. The two surveys that were used in the
study collected information pertaining to the evaluation process, its implementation and
various elements contained therein, such as the specific type of feedback and other
interactions and conditions that may contribute to teacher improvement. The surveys
were analyzed both quantitatively and qualitatively to identify and understand the
specific interactions that foster positive results in teacher performance.
The survey was designed to elicit details about the types of interactions that
teachers and administrators participate in during the evaluation process that contribute to
teacher performance. Question 2a asks what those interactions are, and whether some
interactions are more helpful than others. This question was informed by survey
questions RI4, OV6, OP7, OV8, OI9, and OI13, and many teacher and administrator
comments addressed them as well. Additionally, questions OI10, OV11, and OV12 ask

88
about the post-observation conversations that take place, and all show negative results
from teachers. They are: I regularly have written conversations following an observation
(29%), I regularly have oral conversations following an observation (44%) and I find
these conversations to help me improve my performance (47%). Teachers positively
identified the following interactions as contributing to teacher performance: use of a
common language provided by the FFT (57%), the observation process (61%)
contributing to personal reflection, and feedback following an observation (50% rated
this positively, 24% were neutral, and 26% rated it negatively). Discussions with
administrators contributing to improved performance did not rate positively, however,
with only 47% of teachers giving it a high rating.
The observation process is an integral part of Bentley School District’s evaluation
process. Teachers are observed multiple times throughout the year, and observations are
unannounced and last between 16-20 minutes. Administrators give immediate written
feedback to teachers and ideally it is followed up with a discussion, either written or in
person. The survey results show that while 50% of teachers find this helpful, 55% find
the feedback clearly connected to the FFT. Only 43%, however, believe the feedback
accurately describes their performance and 47% find the discussion with their
administrator helpful.
Bentley School District administrators, like many administrators throughout the
state, have participated in many hours of professional development on working with
teachers to improve performance, participate in coaching conversations, use effective
feedback techniques and have difficult conversations. Most administrators view
themselves as instructional leaders and strive to support teachers in their development. A

89
conflict arises when an instructional coach is also responsible for evaluation, and this is
supported by the responses to the above survey questions as well as teachers’ responses
to the survey questions, such as: “I do not find the use of the coaching conversations
helpful,” “the observation is just a glimpse into what I do,” “coaching conversations are
very vague,” and “I would like to see better and more individualized feedback.”
Administrators concur with the shortcomings of the coaching model, stating, “coaching
teachers about what the FFT looks like and sounds like within their practice needs
development,” and “when the administrator is the one that is doing the coaching, true
coaching does not occur, as the teacher views the coaching as an evaluative process
rather than a helpful process.”
Coaching conversations between administrators and teachers is a paradigm shift
and it will take time for development. The purpose of coaching, according to Bentley
School District administrators, is to improve instructional strategies and help transform
classrooms into high level learning environments, as detailed in the FFT. Cheliotes &
Reilly (2010), define coaching as “a way of listening and speaking to colleagues that
assumes a belief that others are whole and capable. Others don’t need to be “fixed”” (p.
9). Although this concept is relatively new in the United States, Finland’s educational
structure includes a coaching model and Japan uses the idea of a lesson study, allowing
teachers to collaboratively plan and observe and critique each other (Williams and Engel,
2012). It is what happens after classroom observations, during reflective conversations,
which will result in an improvement in teaching practices.
The coaching conversations, coupled with the information gleaned from
observations, are also used to inform professional development as administrators’ gain

90
insight into teachers’ areas of need. This supports Goe and Holdheide’s contention that
post-observation meetings ought to focus on instructional strategies, addressing the needs
of the teacher (2013). Darling-Hammond (2013) reminds us that “evaluation alone will
not improve practice,” but we must “link both formal professional development and job-
embedded learning opportunities to the evaluation system” (p. 99). Skilled
administrators will use information gleaned from observations, coupled with details from
coaching conversations to plan and provide meaningful professional development to
teachers.
An additional criticism throughout the feedback on the survey pertains to the
time-intensive and seemingly unmanageable observation-feedback process. Ideally,
administrators meet with each teacher after a classroom observation for the coaching
conversation, but this does not always happen. A number of administrators attempt to
complete the feedback cycle via written communication, and even that presents a
challenge. On one hand the administrators are pressed for time, and on the other hand
teachers are asking for longer observations, as 16-20 minutes seems too short to
adequately assess their performance. Both teachers and administrators made suggestions
for improvement: “Would longer evaluations less often with more cultural visits be more
effective?” “Increase the time in each classroom, rather than the amount of times in each
classroom,” “more time in the classroom by the evaluator would be helpful (and at
different hours of the day),” “Once you are highly effective or effective, the number of
observations should be reduced,” “If we are to be evaluated as intended, then our
principals need more help. They cannot run the school, deal with discipline, observe
every teacher multiple times and follow up with individual meetings,” and “It is better

91
that administrators spend time with new and struggling teachers rather than seasoned
teachers.”
Teacher evaluation ratings may not have changed since the publication of The
Widget Effect (2009), but the time administrators spend on the evaluation process has
increased substantially. Bentley School District Administrators report spending 16-20
minutes on each observation, and they observe every teacher multiple times per year
(ranging from 2 – 6 per teacher per year, in most cases). In addition, they are tasked with
having coaching conversations following each observation, having pre-, post- and
sometimes mid-year meetings with teachers, and spending additional time organizing and
writing evaluations. The Widget Effect reports, “school administrators spend very little
time on what is a largely meaningless and inconsequential evaluation process. Most
teacher evaluations are based on two or fewer classroom observations totaling 76 minutes
or less” (p. 6). Sartain et al. (2011) found similar results in his study, with some
administrators claiming the new evaluation systems were too labor intensive. Some
districts have successfully “resolved the tension between the need for high-quality
evaluation and principal time [by] including assistant principals, department chairs, and
master or mentor teachers in the evaluation process” (Darling-Hammond, p. 134).
The next research question, 2b, investigates whether or not teachers and
administrators have a clear understanding of the FFT, and if they find value in it. The
survey questions designed to answer these questions received the highest ratings in the
teacher survey, save one. They are listed below:
• RV1 I clearly understand the purpose of using the FFT to evaluate my work
(69%)

92
• RP2 The rubrics in the FFT are easily understood (64%)
• RV3 The rubrics are consistent with my beliefs about what constitutes effective
teaching (59%)
• RV5 The FFT is insignificant to me as a professional (24%)
• TE3P The processes and procedures used for my evaluation are fair (44%)
• EP16 My evaluator(s) understands the FFT thoroughly (63%)
• TE5P My evaluation was conducted in a fair manner (61%)
These results indicate that many teachers do see value in the FFT and in the evaluation
process that is in place. Administrators also rate the questions pertaining to this question
high, and 100% indicate positive results on all related survey questions.
It is interesting to note that while 61% of teachers agree that their evaluation was
conducted in a fair manner, only 44% found the processes and procedures to be fair. The
teacher comments help us to understand this result more fully, as they indicate a belief in
the ability of their administrator to conduct the evaluation, but question the process and
procedures that are inherent in the structure.
Question 2c explores whether or not teacher and administrator groups have
similar beliefs/views regarding the evaluation process. Statistically significant
associations were found between the teacher and administrator surveys on seven
questions (Table 19), indicating significant differences in their beliefs/views. For cases
where the question varies between the two surveys, the second question, in parenthesis,
indicates the question on the administrator survey. When these questions were sorted by
type and theme, the following distributions are found:
• Sorted by type: Rubric (28%); Observation (28%); Evaluation (42%)

93
• Sorted by theme: Value (71%); Impact (14%); Process (14%)
Five of the seven questions fall in the theme of “value,” indicating a discrepancy
between how useful teachers and administrators perceive the FFT and evaluation process
to be. In all seven cases teachers rated the survey questions less favorably than
administrators. This suggests that teachers do not place as much value on the evaluation
instrument that is used, the observation process that is in place and the FFT’s practical
use, as do the administrators.
Table 19 Statistically Significant Associations between Teacher and Administrator Surveys
Question
Type: Rubric (R); Observation
(O); Evaluation
(E)
Theme: Value (V);
Impact (I);
Process (P)
Questions with statistically significant associations between teacher and administrator surveys: RVI: I clearly understand the purpose of using the FFT to evaluate my
work (I clearly understand the purpose of using the FFT for evaluative purposes)
R V
RV5: The FFT process is insignificant to me as a professional R V OV8: The qualitative feedback accurately describes my performance
(The qualitative feedback accurately describes teacher performance)
O V
OI13: The discussions I have with my evaluator(s) help me to improve my performance (The FFT process has encouraged me to discuss effective teaching practices with teachers)
O I
EP15: The evaluation process is implemented consistently throughout my school E P
EV20: In general, the FFT process is valuable to me as a professional (In general, the evaluation process is valuable to our district) E V
EV21: My evaluation score accurately describes my performance (The evaluations I write accurately describe teacher performance) E V

94
Summary of the findings
Teacher evaluation ratings improved over time, and especially over the course of
four years as opposed to year-to-year changes. This supports the notion that the
consistency to which districts maintain an evaluation tool is important for long-term
improvement in instruction and ultimately teacher performance. Both teachers and
administrators have seen shifts in classroom instructional practices since implementing
the evaluation cycle that includes classroom observations and coaching conversations that
are connected to the FFT. Continued time and consistency with the process may help to
improve teachers’ trust and perception of the evaluation system.
Higher ratings were found among teachers who were experienced or veteran
teachers, and the greatest growth was found in the group of teachers who are in their first
four years of teaching. Improvement in experienced and veteran teachers is not found to
the same extent. This emphasizes how important it is that districts spend time to develop
their novice teachers. Investment in new teachers is worthwhile and administrators will
typically witness a great deal of growth during this time.
This study found no difference in teacher evaluation ratings as compared to the
study done by Weisberg et al., that resulted in publication of The Widget Effect (2009).
The same is true when looking at statewide evaluation ratings since 2011. Fewer
teachers than expected are observed in the “minimally effective” category. FFT level of
“basic” is state of Michigan level of “minimally effective”. Lawmakers should change
the label to correspond with the FFT, as the negative connotation associated with their
current label impacts teachers’ perceptions and may influence the reliability of
administrators’ ratings, because they want to support their developing teachers. This

95
single change will not only strengthen the alignment with the FFT, but will help teachers
accept the process and strive for improvement. Administrators are more apt to give
teachers a basic score than minimally effective, thus helping maintain a higher level of
inter-rater reliability.
An additional recommended change pertaining to the rubric is to include an
additional proficiency level, as the current four levels do not provide enough variation.
This will allow for more accurate feedback and more concise explanations, especially in
the “proficient” category, which this study found to be too broad. The range of abilities
that fall within the “proficient” category is extensive. Two teachers, both with the rating
of “proficient,” could have markedly different abilities. This change would also help
address teachers concerns that movement from one level of the FFT to the next is
difficult.
Teachers were split when asked if the FFT adequately informs them of their
practice. The evaluation process, including classroom observations, and feedback or
coaching conversations, is valued more by administrators than teachers, although slightly
more than half of the teachers indicated they know and understand the expectations.
Expectations and processes need to be clearly communicated continuously to all
stakeholders. The shift in the evaluation process is substantial, and impacts teaching at
all levels. It is vital that districts clearly communicate the rationale and the process, and
revisit it regularly. The purpose of the evaluations, as it relates to students, needs to be
articulated often. Dialogue between administrators and teachers will help both groups
understand the common goal as it relates to student learning.

96
Teachers of core subjects and secondary-level teachers tend to score lower using
the FFT than other teachers. It is recommended that districts provide continuous
professional development and learning opportunities for those teachers regarding
constructivist, child-centered environments, implementing best practices. Current
research supports the inclusion of such strategies, and identifies them as having a positive
impact on student learning. Teachers of a more traditional “stand and deliver” method
will fall in the “basic” category of the FFT based on the rubric, translating to the
“minimally effective” label for the State of Michigan.
A discrepancy between buildings was found, indicating the need for continuous,
ongoing administrative training and professional development on the FFT and the
evaluation process. This is vital to ensure that differences between buildings are
minimized. If, in fact, the labeling convention described above does influence decisions,
it ought to be addressed by district leaders in order to establish consistency among raters.
Maintaining inter-rater reliability requires continual collaboration and ongoing training
for all administrators. Another recommendation is that two observers are used at the
elementary school. This could be accomplished by having district administrators observe
teachers in buildings other than their own.
Interactions surrounding the FFT that contribute to teacher performance include
using a common language connected to the FFT, maintaining clear and continuous
communication, performing classroom observations and informing professional
development. The first includes using a common language that is found in the FFT. This
will be strengthened as time goes on, by maintaining consistency with a single tool.
Teachers also report that the observational process allows them to personally reflect on

97
their practice, and they value the feedback following the observations. Ongoing
professional development, connected to the classroom observations and coaching
conversations, will strengthen teachers’ understanding of the FFT and their skillfulness in
their practice.
Limitations to the Study
The evaluation process in Michigan produced a paradigm shift in how educators,
both administrators and teachers, viewed and interacted with the new system. Such
profound changes take time to adjust to, and there is a natural learning curve that comes
with any new process. Future studies many help address some of the limitations listed
below:
• Year one of the study was the first year for teachers and administrators, all of
whom had little previous experience with the FFT.
• Differences in administrators’ ability and background knowledge with the FFT
could effect teachers’ attitudes and experiences with the process.
• Teachers may connect the FFT to the evaluation process, making it difficult to
determine if their disdain is toward the new evaluation process or the FFT itself.
Recommendations for Future Studies
Future studies can expand upon this study, and add to the school of knowledge
surrounding the teacher evaluation process. In addition to some of the limitations of the
current research listed above, other such studies include:
• A longitudinal study should be done on models other than the FFT that can be
compared with this study to help answer the question of whether or not it is

98
solely the tool (FFT) responsible for the statistically significant change, or if
other tools are equally sound.
• The study could be expanded to include multiple districts.
• The FFT was developed with a constructivist foundation (essentially measuring
the amount of “constructivism”), and this study shows teachers' ratings are higher
in elementary and elective classrooms. To what extent is this due to an increased
use of constructivist techniques and strategies in those classrooms?
Recommendations at the District and State Levels:
This study uncovered some critical aspects of the evaluation process that will help
to ensure that school districts create and implement teacher evaluation systems that are
fair and manageable. In doing so, a well-designed system will not only allow school
districts to meet the expectations of the law, but could ultimately have a positive impact
on student learning.
• It will be important, moving forward, that the expectations and process be
clarified and continually communicated to stakeholders.
• It is important to commit to the process for multiple years, understanding that the
greatest growth will be seen over time.
• Investment in new teachers is worthwhile and important, as the greatest growth
occurs during the first four years of teaching.
• Districts should provide professional development and learning opportunities for
teachers regarding constructivist, child-centered learning environments,
implementing best practices. This is a particular need of secondary and core
teachers

99
• Continuous, ongoing administrative training and professional development on the
FFT and the evaluation process are needed to ensure that rating differences
between buildings are minimized.
• Two observers should be used in the elementary school to help maintain inter-
rater reliability.
• Districts need to clearly communicate the rationale, expectations, process, and
purpose of the evaluations, as it relates to students, on an ongoing basis to
teachers.
• Gradations to the “proficient” category will allow for more variation, as this
study found the range of abilities that fall within this category to be extensive.
• Information should be developed that will help inform teachers of specific steps
that are needed to move from one category to the next.
Conclusion
This study took an in-depth look at the FFT model used by the Bentley School
District for use in evaluating teachers in compliance with the state requirements. Teacher
performance did improve with long-term use of the FFT, showing that sustained use of
the tool can result in instructional improvements. Greater growth, however, would likely
be seen if the evaluation process were decoupled from the FFT. The FFT provides clear
indicators of effectiveness in numerous areas, but many teachers view the process as
punitive and do not see it as useful to their practice and personal growth, minimizing the
impact the process could have on their teaching. The complexity of the FFT and the
evaluation process in general are cumbersome for administrators and place pressure on
teachers.

100
Evaluation systems are now being developed throughout the state that comply
with the law, and the findings herein reveal critical elements of the process that will help
unite teachers and administrators in the process, and increase teacher motivation and
participation. These elements include clearly articulated goals, ongoing and open
communication about the process, professional development, and coaching. If done well,
this can translate into improved teacher performance, and will ultimately increase student
learning.
State law in Michigan and throughout the country now requires district
administrators to perform multiple observations and evaluate teachers annually.
Initiatives that impact schools will have the greatest impact on education if they support
instructional practices that lead to student learning. The FFT can accomplish this, and the
Bentley School District places value in the opportunity to work with teachers to create
positive, student-centered classrooms in which students can thrive. This goal does not
yet translate to the teachers, however, and they tend to view the process as being much
less valuable and at times subjective. In spite of the differences in views held by these
two groups, teacher and administrator surveys both identified coaching, communication,
and professional development as valuable interactions that support improvement.
Long-term use of an evaluation tool is vital for districts to show substantial
results. Continuous communication between administrators and teachers helps teachers
to feel supported as opposed to scrutinized. Teacher professional development
surrounding practices and strategies contained in the FFT will align classrooms more
closely to a child-centered, constructivist model. Districts and administrators must
continually work to ensure they achieve inter-rater reliability through ongoing training

101
and professional development. Policy-makers need to allow time for districts, schools
and teachers to catch up to the requirements, and they, too, need to allow for long-term
use of evaluation tools before mandating further changes. Above all, we all must
remember that teaching is an art; a carefully developed and complex craft that is designed
to fit every type of student, each with his or her individual needs. A cursory glance can
never capture the totality of a teacher’s performance.

102
APPENDIX A

103
APPENDIX A (continued)

104
APPENDIX B

105
APPENDIX B (continued)

106
APPENDIX C
Letter of Support
Agreement between Investigator and District
The South Redford School District supports the study of Danielson’s Framework
for Teaching (hereafter FFT) conducted by Christine L. Hofer (investigator) for research
purposes. It is understood that the study involves the use of teacher evaluation data from
the school years 2011/2012 through 2014/2015. This data has been previously collected
and was not collected specifically for the currently proposed research. The project will
use this existing and coded private information and teachers and evaluators will be asked
take an online, anonymous survey using Qualtrics.
The purpose of the study is to determine the effectiveness of using the FFT by
evaluating the process established by the South Redford School District. This study is
being conducted at the South Redford School District and Wayne State University. Data
collected in the study will be used for research purposes. It is hereby agreed that the
South Redford School District supports this research and will provide the site and
location for the research to be conducted.
________________________________________ _______________ Christine L. Hofer, Investigator Date
________________________________________ _______________ Brian Galdes, Superintendent Date

107
APPENDIX D
Coded Private Information
Agreement between Investigator and District
The Bentley School District (pseudonym) will provide coded information to
Christine L. Hofer (investigator) for research purposes. The project is limited to the use
of existing and coded private information. It is understood that the private information
was not collected specifically for the currently proposed research. The investigator
cannot readily ascertain the identity of the individuals to whom the coded private
information pertains because this agreement prohibits the release of the key under any
circumstances, until the individuals are deceased.
It is hereby agreed that the code used to de-identify private information will not
be released to investigator Christine L. Hofer under any circumstances, until the
individuals are deceased. The code used will replace identifying information (such as
name or social security number) with a number, letter, symbol, or combination thereof. A
key will be created to decipher the code. The code cannot be derived from or related to
information about the individual.
________________________________________ _______________ Christine L. Hofer, Principal Investigator Date
________________________________________ _______________ Kim Meray, Secretary to HR Director Date

108
APPENDIX E SurveyQuestionsforTeachers
Pleasecompletethissurvey,whichwillhelpusbetterunderstandhowteachersareevaluatedusingDanielson’sFrameworkforTeaching(FFT).
Thissurveyisvoluntaryandallresponseswillbekeptconfidential.Surveyresponseswillbede-identifiedandwillnotbeconnectedtoindividuals.Theresearcher,ChristineL.Hofer,willusethedataderivedfromyourresponsesbutwillnotbeabletoconnectresponsestoindividuals.Completionofthesurveyposesnorisktoyou,andthereisnopenaltyfornon-participation.
TheSouthRedfordSchoolDistricthasusedCharlotteDanielson’sFrameworkforTeaching(FFT)aspartoftheirteacherevaluationprocessandthequestionshereinpertaintoyourexperiencewiththistool.
Usethefollowingdefinitionswhenconsideringthequestions:
Observation:Anevaluatorobservesaclassroomforaperiodoftimeandprovideswrittenfeedbacktoteachers.FeedbackregardingclassroomobservationsisbasedontheFrameworkforTeachingrubric.
Evaluation:Theratingreceivedattheendofaschoolyear(Highlyeffective,effective,minimallyeffective,ineffective).TheFFTconstitutesthemajorityofweightinthefinalevaluation.
Administrator:Theprincipalorassistantprincipalatabuilding.Administratorsareevaluators.
Evaluators:Thepersonwhoisperformingtheevaluation.Thispersonmanyormaynotbeanadministrator.CurrentlyinSouthRedfordallevaluatorsareadministrators.
SurveyQuestions:
NOTE:ThissurveywillbeconductedusingQualtrics,aweb-basedsurveytool.Eachquestionwillhavetheappropriateresponseattributedtoit,suchasatextbox,dropdownmenuornumericscale.
DemographicInformation:
1. Atwhatschooldoyouteach? 2. Whatgradeorsubjectdoyouteach?3. Howmanyyearshaveyoubeenteaching?4. Whatisyourgender?_________Male__________Female
FrameworkforTeachingRubrics

109
Pleaseselectthenumberthatbestreflectsyouragreementwitheachstatement:
1–StronglyDisagree2–Disagree3-NeitherAgreenorDisagree4–Agree5–StronglyAgree
2. IclearlyunderstandthepurposeofusingtheFrameworkforTeaching(hereafter“FFT”)toevaluatemywork.
3. TherubricsintheFFTareeasilyunderstood.4. TherubricsintheFFTareconsistentwithmybeliefsaboutwhatconstitutes
effectiveteaching.5. TheFFTprovidesacommonlanguageformetodiscussteachingpractices
withcolleagues.6. IknowwhatIneedtodoinordertoachievethetoplevelofperformance
(distinguished)ontheFFT.7. Ibelievethatitispossibleformetomeetthetoplevelofperformanceonthe
FFT.8. TheFFTprocessisinsignificanttomeasaprofessional.
ObservationProcessPleaseselectthenumberthatbestreflectsyouragreementwitheachstatement:
1–StronglyDisagree2–Disagree3-NeitherAgreenorDisagree4–Agree5–StronglyAgree
9. Theobservationprocesshelpsmetobereflectiveinmypractice.10. ThequalitativefeedbackIreceiveaspartoftheevaluationprocessis
clearlyrelatedtotheFFTrubric.11. Thequalitativefeedbackaccuratelydescribesmyperformance.12. Thequalitativefeedbackhelpsmetoimprovemyperformance.13. Theobservationislongenoughindurationformyevaluatortogetan
accuratedepictionofmyperformance.14. Iregularlyhavewrittenconversationswithmyevaluator(s)followingan
observation.15. Iregularlyhaveoralconversationswithmyevaluator(s)followingan
observation.16. ThediscussionsIhavewithmyevaluator(s)helpmetoimprovemy
performance.
EvaluationProcessPleaseselectthenumberthatbestreflectsyouragreementwitheachstatement:
1–StronglyDisagree2–Disagree3-NeitherAgreenorDisagree4–Agree5–StronglyAgree
17. Iknowwhatisexpectedinorderformetodowellusingthecurrentevaluationprocess.
18. Theevaluationprocessisimplementedconsistentlythroughoutmyschool.

110
19. Theprocessesandproceduresusedformyevaluationarefair.20. Myevaluationwasconductedinafairmanner.21. Myevaluator(s)understandtheFFTthoroughly.22. Myevaluator(s)spendsadequatetimeobservingmyinstructioninorder
toformabasistoassessmyperformanceusingtheFFT.23. IhavechangedmyinstructionalmethodsasaresultofusingtheFFTas
partoftheevaluationprocess.24. TheachievementofmystudentshasimprovedasaresultofusingtheFFT
process.25. TheengagementofmystudentshasimprovedasaresultofusingtheFFT
process.26. Ingeneral,theFFTprocessisvaluabletomeasaprofessional.
Summary
27. Myevaluationforthe2014/2015schoolyearwas:[ineffective,minimallyeffective,effective,highlyeffective]
28. Ifyoureceivedineffective,minimallyeffective,oreffectiveforthe2014/2015schoolyear,whatisnecessaryforyoutoadvancetothenextlevel?
29. Myevaluationscoreaccuratelydescribesmyperformance[true;false]30. Comments(optional):
Thankyouforcompletingthissurvey!

111
APPENDIX F
SurveyQuestionsforEvaluatorsPleasecompletethissurvey,whichwillhelpusbetterunderstandhowteachersareevaluatedusingDanielson’sFrameworkforTeaching(FFT).
Thissurveyisvoluntaryandallresponseswillbekeptconfidential.Surveyresponseswillbede-identifiedandwillnotbeconnectedtoindividuals.Theresearcher,ChristineL.Hofer,willusethedataderivedfromyourresponsesbutwillnotbeabletoconnectresponsestoindividuals.Completionofthesurveyposesnorisktoyou,andthereisnopenaltyfornon-participation.
TheSouthRedfordSchoolDistricthasusedCharlotteDanielson’sFrameworkforTeachingaspartoftheirteacherevaluationprocessandthequestionshereinpertaintoyourexperiencewiththistool.
Usethefollowingdefinitionswhenconsideringthequestions:
Observation:Anevaluatorobservesaclassroomforaperiodoftimeandprovideswrittenfeedbacktoteachers.FeedbackregardingclassroomobservationsisbasedontheFrameworkforTeachingrubric.
Evaluation:Theratingreceivedattheendofaschoolyear(Highlyeffective,effective,minimallyeffective,ineffective).TheFFTconstitutesthemajorityofweightinthefinalevaluation.
Administrator:Theprincipalorassistantprincipalatabuilding.Administratorsareevaluators.
Evaluators:Thepersonwhoisperformingtheevaluation.Thispersonmanyormaynotbeanadministrator.CurrentlyinSouthRedfordallevaluatorsareadministrators.
SurveyQuestions:
NOTE:ThissurveywillbeconductedusingQualtrics,aweb-basedsurveytool.Eachquestionwillhavetheappropriateresponseattributedtoit,suchasatextbox,dropdownmenuornumericscale.
DemographicInformation:1. Atwhatschooldoyouwork? 2. Howmanyyearshaveyoubeenanevaluatorusingthecurrentmodel?3. Whatisyourgender?_________Male__________Female
FrameworkforTeachingRubricsPleaseselectthenumberthatbestreflectsyouragreementwitheachstatement:

112
1–StronglyDisagree2–Disagree3-NeitherAgreenorDisagree4–Agree5–StronglyAgree
4. IclearlyunderstandthepurposeofusingtheFrameworkforTeaching(hereafter“FFT”)toevaluatemywork.
5. TherubricsintheFFTareeasilyunderstood.6. TherubricsintheFFTareconsistentwithmybeliefsaboutwhatconstitutes
effectiveteaching.7. TheFFTprovidesacommonlanguageformetodiscussteachingpractices
withteachers.8. TheFFTprocessisinsignificanttomeasaprofessional.
ObservationProcessPleaseselectthenumberthatbestreflectsyouragreementwitheachstatement:
1–StronglyDisagree2–Disagree3-NeitherAgreenorDisagree4–Agree5–StronglyAgree
9. Theobservationprocesshelpsteacherstobereflectiveintheirpractice.10. IclearlyrelatemyqualitativefeedbacktotheFFTrubric.11. Thequalitativefeedbackaccuratelydescribesteacherperformance.12. Thequalitativefeedbackhelpsteacherstoimprovetheirperformance.13. Theobservationislongenoughindurationformetogetanaccurate
depictionofmyperformance.14. Iregularlyhaveconversationswithteachersfollowinganobservation.15. TheFFTprocesshasencouragedmetodiscusseffectiveteachingpractices
withteachers.
EvaluationProcessPleaseselectthenumberthatbestreflectsyouragreementwitheachstatement:
1–StronglyDisagree2–Disagree3-NeitherAgreenorDisagree4–Agree5–StronglyAgree
16. Itispossibleforteacherstomeetthetoplevelofperformance(distinguished).
17. Theevaluationprocessisimplementedconsistentlythroughoutmyschool.18. Theevaluationprocessisimplementedconsistentlythroughoutthedistrict.19. IunderstandtheFFTthoroughly.20. Ispendadequatetimeobservingteachersinordertoformabasistoassess
theirperformanceusingtheFFT.21. Ihaveobservedteacherschanginginstructionalmethodsasaresultofusing
theFFTaspartoftheevaluationprocess.22. TheengagementofstudentshasimprovedasaresultofusingtheFFT
process.23. Theevaluationprocesscouldbeimproved.24. Ingeneral,theevaluationprocessisvaluabletoourdistrict.

113
Summary25. Ifateacherreceivesineffective,minimallyeffective,oreffectivefortheir
evaluation,whatistypicallynecessaryforthemtoadvancetothenextlevel?26. TheevaluationsIwriteaccuratelydescribeteacherperformance27. Comments(optional):
Thankyouforcompletingthissurvey!

114
REFERENCES
American Federation of Teachers, Michigan Education Association, Michigan
Association of Secondary Principals, & Michigan Elementary and Middle School
Principals Association (2013). A framework for Michigan educator evaluations.
(Joint Proposal). Lansing, MI: Michigan Education Association.
Agresti, A. (2007) Logistic Regression, in An Introduction to Categorical Data Analysis,
Second Edition, John Wiley & Sons, Inc., Hoboken, NJ, USA
Betebenner, D. W. (2009). Norm- and criterion-referenced student growth. Educational
Measurement: Issues and Practice, 28(4), 42-51.
Berliner, D.C. (2009). Poverty and potential: out-of-school factors and school success.
Boulder, CO and Tempe, AZ: Education and the Public Interest Center,
University of Colorado/Education Policy Research Unit, Arizona State
University. Retrieved from http://epicpolicy.org/publication/poverty-and-
potential.
Cantrell, S., & Kane, T. (2013). Ensuring fair and reliable measures of effective teaching:
Culminating findings from the MET project's three-year study. Retrieved from
http://www.metproject.org/downloads/MET_Ensuring_Fair_and_Reliable_Measu
res_Pra ctitioner_Brief.pdf
Cheliotes, L. & Reilly, M (2010). Coaching Conversations. Thousand Oaks, CA: Corwin.
Cho, J., & Eberhard, B. (2013). When Pandora's box is opened: A qualitative study of the
intended and unintended impacts of Wyoming's new standardized tests on local
educators' everyday practices. The Qualitative Report, 18(20), 1-22.

115
Civic Impulse. (2015). H.R. 1532 — 112th Congress: Race to the Top Act of 2011.
Retrieved March 29, 2015, from
https://www.govtrack.us/congress/bills/112/hr1532
Cobb, P. & Bowers, J. (1999). Cognitive and situated learning perspectives in theory and
practice. Educational Researcher, 29 (2), 4 – 15.
Cohen, J. (1988). Statistical power analysis for the behavioral sciences (2nd ed.).
Hillsdale, NJ: Lawrence Earlbaum Associates.
Cunningham, R. (2005). Algebra teachers’ utilization of problems requiring transfer
between algebraic, numeric, and graphic representations. School Science and
Mathematics. 105 (2), 73 – 81.
Danielson, C. (1996). Enhancing professional practice: A framework for teaching.
Alexandria, VA: Association for Supervision and Curriculum Development.
Danielson, C. (2007). Enhancing professional practice: A framework for teaching (2nd
ed.). Alexandria, VA: Association for Supervision and Curriculum Development.
Danielson, C. (2010). Evaluations that help teachers learn. Educational Leadership,
68(4), 35-39.
Danielson, C. (2011). The framework for teaching evaluation instrument. Retrieved from
www.teachscape.com
Danielson Group (2013). Framework for Teaching. Retrieved from
http://danielsongroup.org/charlotte-danielson/
Darling-Hammond, L. (2010). Performance counts: Assessment systems that support
high-quality learning. (White paper). Washington DC: Council of Chief State
School Officers (CCSSO).

116
Darling-Hammond, L., Wise, A., & Pease, S. (1983). Teacher evaluation in the
organizational context: A review of the literature. Review of Educational
Research, 53(3), 285-328.
Donaldson, M. (2012). Teachers' perspectives on evaluation reform. Retrieved from
http://www.americanprogress.org/issues/education/report/2012/12/13/47689/
teachersperspectives-on-evaluation-reform/
Dunn, O. J. (1964). Multiple comparisons using rank sums. Technometrics 6: 241–252.
Fowler, F. (2009). Policy Studies for educational leaders: An introduction. (3rd ed.).
Boston, MA: Allyn & Bacon.
Fullan, M. (1991). The new meaning of educational change (2nd ed.). New York, NY:
Teachers College Press.
Goe, L. & Holdheide, L. (2013). Measuring teachers’ contribution to student learning
growth for “the other 69%” [PowerPoint Slides]. Washington DC: National
Comprehensive Center for Teacher Quality. Retrieved from
http://www.tqsourc.org/publications.
Greenhouse, S. W., & Geisser, S. (1959). On the methods in the analysis of profile data.
Psychometrika, 24, 95-112.
Hiebert, J., & Grouws, D. A. (2007). The effects of classroom mathematics teaching on
students‘ learning. In F. K. Lester (Ed.), Second handbook of research on
mathematics teaching and learning (pp. 371-404). Charlotte, NC: Information Age
Publishers.

117
Hill, H. C., Sleep, L., Lewis, J. M., & Ball, D. L. (2007). Assessing teachers’
mathematical knowledge: What knowledge matters and what evidence counts.
Second handbook of research on mathematics teaching and learning, 1, 111-155.
Holley, M. (2008). A teacher quality primer for Michigan school officials, state
policymakers, media, and residents. Midland, MI: Mackinac Center for Public
Policy.
Intrastate New Teacher Assessment and Support Consortium (1992). Model standards for
beginning teacher licensing, assessment and development: A resource for state
dialogue. Retrieved from
http://thesciencenetwork.org/docs/BrainsRUs/Model%20Standards%20for%20Be
g%20Teaching_Paliokas.pdf
Kateri, M. (2014). Contingency table analysis. New York, NY: Springer.
Kessler, V. and Howe, C. (2012). Understanding Educator Evaluations in Michigan.
Michigan Department of Education. Retrieved from
https://www.michigan.gov/documents/mde/Educator_Effectiveness_Ratings_Poli
cy_Brief_403184_7.pdf
Laerd Statistics (2015). Statistical tutorials and software guides. Retrieved from
https://statistics.laerd.com/
Legislative Council, State of Michigan, 380.1249 (2011). The revised school code act
451 of 1976, 380.1249 (2013).
Lipscomb, S., Chiang, H., and Gill, B. (2012). Value-Added Estimates for Phase 1 of the
Pennsylvania Teacher and Principal Evaluation Pilot. Mathematica Policy
Research. April 5, 2012.

118
Marshall, K. (2009). Rethinking teacher supervision and evaluation: How to work smart,
build collaboration, and close the achievement gap. San Francisco, CA: Jossey-
Bass.
Marshall, K. (2013). Rethinking teacher supervision and evaluation: How to work smart,
build collaboration, and close the achievement gap (2nd ed.). San Francisco, CA:
Jossey-Bass.
Marzano, R., & Toth, M. (2013). Teacher evaluation that makes a difference. Alexandria,
VA: ASCD.
Marzano, R. and Waters, T. (2009). District leadership that works: Striking the right
balance. Bloomington, IN: Solution Tree Press.
Met Project Policy Brief (2013). Ensuring fair and reliable measures of effective
teaching: Culminating findings from the MET project's three-year study. (Policy
and Practice Brief). Seattle, WA: Bill and Melinda Gates Foundation.
Met Project (2013). Feedback for better teaching: Nine principles for using measures of
effective teaching. Seattle, WA: Bill and Melinda Gates Foundation.
Michigan Department of Education (2016). Educator Evaluations and Effectiveness in
Michigan. website (Michigan.gov/MDE/educatorservices/educatorevaluations).
Milanowski, A. (2011). Validity Research on Teacher Evaluation Systems Based on the
Framework for Teaching (Doctoral dissertation). Retrieved from ProQuest.
Miles, M.B, and Huberman, A.M. (1994). Qualitative Data Analysis, 2nd Ed., p. 10-12.
Newbury Park, CA: Sage.
Murray, P. (2014). An Investigation of Teacher and Administrator Perceptions of
Pennsylvania’s New Teacher Evaluation System, Based Upon the Danielson

119
Framework for Teaching, and its Impact of Teachers’ Instructional Strategies in
an Urban School District. (Doctoral dissertation). Retrieved from ProQuest.
National Commission of Excellence in Education (1983). A nation at risk: The
imperative for educational reform. Washington DC, U.S. Government Printing
Office.
National Council on Teacher Quality (2015). State-by-state evaluation timeline briefs.
Retrieved from
http://www.nctq.org/dmsStage/Evaluation_Timeline_Brief_Overview.
National Council of Teachers of Mathematics (2011). Principals and Standards for
School Mathematics. Reston, VA: National Council of Teachers of Mathematics.
The New Teacher Project (TNTP) (2013). Teacher evaluation 2.0. Retrieved August 22,
2013, from www.tntp.org/teacherevaluation20.
No Child Left Behind (NCLB) Act of 2001, 20 U.S.C.A. § 6301 et seq. (West 2003)
Ovando, M., & Ramirez, A. (2007). Principals' instructional leadership within a teacher
performance appraisal system: Enhancing students' academic success. Journal of
Personnel Evaluation in Education, 20(1-2), 85-110.
Patton, M.Q. (1990). Qualitative Evaluation and Research Methods, 2nd Ed. Newbury
Park: CA, Sage.
Peterson, K. (1995). Teacher evaluation: A comprehensive guide to new directions and
practices. Thousand Oaks, CA: Corwin Press.
Popham, W. (2013). On serving two masters. Principal Leadership, 13(7), 18-22.
Ravitch, D. (2010). The death and life of the great American school system: How testing
and choice are undermining education. New York, NY: Basic Books

120
Reeves, D. (2010). Transforming professional development into student results.
Alexandria, VA: ASCD.
Santiago, P., & Benavides, F. (2009). Teacher evaluation: A conceptual framework and
examples of country practices. Retrieved from
http://www.oecd.org/education/preschoolandschool/44568106.pdf
Sartain, L., Stoelinga, S., and Brown, E. (2011). Rethinking Teacher Evaluation in
Chicago: Lessons Learned from Classroom Observations, Principal-Teacher
Conferences, and District Implementation. Chicago, IL: UChicago Consortium
on Chicago School Research.
Weisberg, D., Sexton, S., Mulhorn, J., and Keeling, D. (2009). The widget effect: Our
national failure to acknowledge and act on differences in teacher effectiveness.
The New Teacher Project.
White, B., Cowhy, J., Stevens, W., & Sporte, S. (2012). Designing and implementing the
next generation of teacher evaluation systems: Lessons learned from case studies
in five Illinois districts. Retrieved from http://ccsr.uchicago.edu/sites/default/files/
publications/Teacher%20Evaluation%20Policy%20Brief1_0.pdf
Williams, J., & Engel, L. (2012). How do other countries evaluate teachers? Kappan
Magazine, 94(4), 53-57.

121
ABSTRACT
THE IMPACT OF CLASSROOM OBSERVATIONS AND COLLABORATIVE FEEDBACK ON EVALUATION OF TEACHER PERFORMANCE, BASED ON
THE DANIELSON FRAMEWORK FOR TEACHING
by
CHRISTINE L. HOFER
December 2016
Advisor: Dr. Thomas Edwards
Major: Education
Degree: Doctor of Philosophy
Teacher evaluation systems in Michigan are undergoing major reforms driven by
recent legislation at both the federal and state levels. Multiple teacher observations, as
well as student achievement data, are now required to be a major indicator of teacher
effectiveness for evaluative purposes. The reformed system is high-stakes, as
employment decisions such as layoffs and termination rest squarely on evaluation results.
Implementation has been fast, and school districts throughout the state are working to
understand the new requirements, and to implement them fairly and with fidelity. Many
districts are utilizing Charlotte Danielson’s Framework for Teaching (2007) as a rubric to
measure teacher quality against components of effective teaching. This study begins by
contrasting the ideals and beliefs behind the push for teacher accountability to the
viewpoints of educational leaders and current research on best practices in education.
Analysis of a school district that has implemented Danielson’s Framework for Teaching
for four years will be will be used to determine the impact it has had on teacher
performance. A vital component of the process involves feedback conversations. The

122
elements of collaboration that are linked to improvement in teacher performance are
examined, and some of the barriers to implementing a successful system are identified.
Keywords: evaluation, teacher, Michigan, union, reform, education, best practices,
effective teaching, coaching, classroom observations, Framework for Teaching

123
AUTOBIOGRAPHICAL STATEMENT
CHRISTINE L. HOFER
EDUCATION
2000 Bachelor of Science, University of Michigan, Dearborn, Michigan
2002 Master’s Degree in Instructional Technology, Wayne State University,
Detroit, Michigan
2009 Education Specialist Degree, Oakland University, Auburn Hills, Michigan
2016 Doctor of Philosophy, Wayne State University, Detroit, Michigan
PROFESSIONAL POSITIONS
2000 – 2011 Teacher of Mathematics, South Redford School District
2011 – 2012 Principal, Jane Addams Elementary School, South Redford School
District
2012 – PRESENT Principal, John D. Pierce Middle School, South Redford School
District
PROFESSIONAL ASSOCIATIONS
2000 National Council of Teachers in Mathematics (NCTM)
2009 Association of Supervision of Curriculum and Development (ASCD)
2011 Michigan Elementary and Middle School Principals Association
(MEMPSA)
2012 Michigan Association of Secondary School Principals (MASSP)