The Impact of Alternative Access Modes on Urban Public Transport
106
European Journal of Transport and Infrastructure Research Volume 1, no. 2 DUP Science / 2001
Transcript of The Impact of Alternative Access Modes on Urban Public Transport
European Journal ofTransport and Infrastructure Research
Volume 1, no. 2
DUP Science / 2001

Contents EJTIR, 1, no. 2 (2001)
Dominic Stead and Stephen Marshall 113The Relationships between Urban Form and Travel Patterns.An International Review and Evaluation
Hugo Priemus 143Mainports as Integrators of Passenger, Freight and Information Networks.From Transport Nodes to Business Generators; the Dutch Case
W. Martin De Jong 169The Impact of Institutional Structures on Transport Infrastructure Performance.A Cross-National Comparison on Various Indicators
Rob van Nes 197The Impact of Alternative Access Modes on Urban Public Transport Network Design
Hugo Priemus 211Book Review: D.G. Janelle & D.C. Hodge (eds.). Information, Place and Cyberspace.Issues in Accessibility.


The Relationships between Urban Form and TravelPatterns. An International Review and Evaluation
Dominic Stead and Stephen MarshallBartlett School of PlanningUniversity College LondonLondonUnited KingdomE-mail: [email protected]
EJTIR, 1, no. 2 (2001), pp. 113 - 141
Received: October 2000Accepted: February 2001
There is a growing body of research concerned with the relationship between urban formand travel patterns. Studies originate from a diversity of sources, and encompass a variety ofgeographic scales and locations. To add to this diversity, many different characteristics ofurban form to have been examined in these studies, and travel patterns have been measuredin a number of different ways. This paper brings together in a systematic way the results ofmany recent studies on urban form and travel patterns over the last 20 years. As well as thissystematic approach, other key aspects of this review paper include the identification ofwhere research has been concentrated (and where there are gaps in research), and in thecritique of the studies, which includes issues of data accuracy, reliability and quality, theapplicability of research methods and data interpretation. The critique focuses in somedetail on the interaction of socio-economic factors with urban form and travel patterns.
1. Introduction
The search for sustainable transport policies has witnessed increasing attention to patterns ofmobility, in the interests of reducing the adverse environmental impacts of increasing travel.In recent years there has been much interest in tackling travel growth by promoting forms ofsustainable urban development in which the design and layout of urban areas can assist inreducing travel (see for example Barton et al., 1995; Banister and Marshall, 2000; ECOTEC,1993). In particular, advocacy for various forms of neo-traditional urbanism, compact cities,urban villages and public transport oriented development all aim explicitly to use land usepolicy and urban design to assist in promoting more sustainable patterns of travel (see forexample Aldous, 1992; Calthorpe, 1993; Ryan and McNally, 1995; Urban Task Force,1999).

114 The Relationships between Urban Form and Travel Patterns
Accordingly, there is a growing body of research concerned with the relationship betweenurban form and travel patterns. Studies originate from a diversity of sources, and encompassa variety of geographic scales and locations. To add to this diversity, many differentcharacteristics of urban form to have been examined in these studies, and travel patterns havebeen measured in a number of different ways. This paper brings together the results of recentstudies on urban form and travel patterns over the last 20 years (from 1980 onwards).Research has examined the relationships between a number of urban form characteristics,ranging from regional to local in scale, and travel patterns. At the strategic level, urban formconcerns the location of new development in relation to existing towns, cities and otherinfrastructure, and the size and shape of new development and the type of land use (whetherfor example it is used for housing, commercial and industrial purposes or a mixture of thesepurposes). At the local level, urban form concerns the level and scale of land use mixing andthe extent to which development is clustered or concentrated into nodes (Figure 1).
STRATEGIC
LOCATION with respect to existingtowns, cities and infrastructure.
STRUCTURE of development - size andshape.
LAND USE TYPE and overall mix.
CLUSTERING/CONCENTRATION ofdevelopment.
LAND USE MIX - level and scale of mix.
DENSITY of development (populationand employment density).
LAYOUT of development (movementnetworks, neighbourhood type).
LOCAL
NEIGHBOURHOOD
Adapted from Owens, 1986
Figure 1. Land use characteristics that can affect travel patterns
Dominic Stead and Stephen Marshall 115
2. Approach
The paper focuses on nine aspects of urban form, ranging from regional strategic planninglevel (at the top of the list) down to specific local planning issues at the neighbourhood scale(at the bottom of the list)1:
i. distance of residence from the urban centreii. settlement sizeiii. mixing of land usesiv. provision of local facilitiesv. density of developmentvi. proximity to transport networksvii. availability of residential parkingviii. road network typeix. neighbourhood type
This paper reviews evidence for the influence of land use on travel patterns from empiricalstudies only2. In looking at travel patterns, the focus is individual travel as a whole, ratherthan individual modes (such as car or public transport) or certain types of journeys (such ascommuting). The review is international although most of the studies reported in this paperoriginate from either Western Europe or the United States.This review has necessitated a certain amount of compartmentalism into discrete categoriesof urban form and it is recognised that there is no definitive way of deciding the categories.Definitions may be overlapping or nested within each other. For example, the term‘concentration’ implies density but may also imply a nodal or ‘focal’ element which relatesto layout; the term ‘urban structure’ is often related to the layout of transportation networks(e.g. ‘grid structure’), of which street pattern may be regarded as a local subset. As shall beseen, neighbourhood type can be regarded as a composite measure which may incorporatenetwork type. Furthermore, the significance of each variable is likely to depend on context.For example, the significance a variable such as ‘distance to urban centre’ will varyaccording to how monocentric or dispersed a settlement is, both in terms of overall layoutand in terms of location of employment relative to residences.There are a number of reasons for the focus on empirical studies. First, empirical studies arefundamental and often provide data for use in the construction or testing of models. Second,empirical studies illustrate real examples and rely on fewer assumptions than modellingstudies. Third, they are often more understandable and transparent in approach thanmodelling studies and allow a wide variety of land use characteristics to be examined,whereas modelling studies are often seen as ‘black box’ exercises which lack transparencyabout the complexity, subjectivity and assumptions of the model. They rely on mathematicalformulations that are often incomprehensible to most people, including many land usepolicy-makers. It would be unfair however to point to the weaknesses of modelling studieswithout also recognising that there are weaknesses of empirical studies. Empirical studies do
1 It is recognised, however, that putting these nine elements in order of scale is difficult since some are relevant
to more than one scale. For example, road networks can be local or regional, density can apply at the city-scale or at the neighbourhood level.
2 For literature on land use and transport modelling studies and their application to land use planning, see forexample Webster et al (1988), Wegener (1994) or Wilson (1998).

116 The Relationships between Urban Form and Travel Patterns
not easily lend themselves to establishing the causality of relationships or conclusive results.The empirical investigation of relationships between selected land use characteristics andtravel patterns relies on examples of land use characteristics being found in the ‘field’. Thereare often confounding factors (such as socio-economic characteristics) which makecomparisons between different areas difficult in empirical studies. Certain land usecharacteristics are difficult to classify in the ‘real world’ since they often lie betweendifferent classification systems (centralised or dispersed employment, mixed or segregatedland uses for example). These issues are discussed in more detail later in the critique.
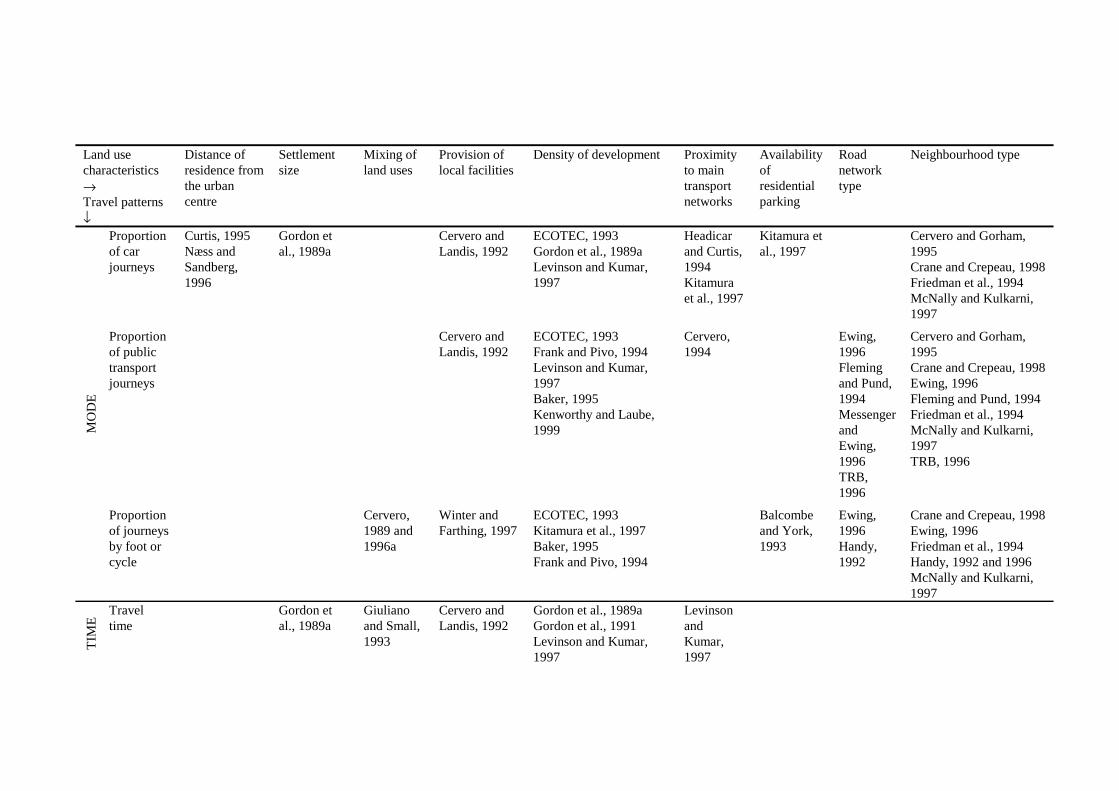
3. Review
There is a large amount of literature on the relationships between land use and travelcharacteristics. A summary of the review is presented in tabular form (Table 1) in which landuse characteristics form one axis and travel characteristics form the other axis. Differentstudies have examined different travel patterns and five measures of travel patterns aredistinguished in this review:
i. travel distanceii. journey frequencyiii. modal splitiv. travel timev. transport energy consumption
Using this tabular approach it is possible to identify where research has been concentratedand where there are gaps in the research. It is also possible to examine where findings aresimilar and where they differ.

Table 1. Studies Classified According to Land Use Characteristics and Travel Patterns
Land usecharacteristics→Travel patterns↓
Distance ofresidence fromthe urbancentre
Settlementsize
Mixing ofland uses
Provision oflocal facilities
Density of development Proximityto maintransportnetworks
Availabilityofresidentialparking
Roadnetworktype
Neighbourhood type
Averagejourneydistance
Gordon et al.,1989aJohnston-Anumonwo,1992Spence andFrost, 1995
Orfeuil andSalomon,1993
Cervero andLandis, 1992Hanson, 1982Winter andFarthing, 1997
ECOTEC, 1993
Averagejourneydistanceby car
Hillman andWhalley,1983
Cervero andLandis, 1992Farthing et al.,1997
ECOTEC, 1993Hillman and Whalley,1983Levinson and Kumar,1997
LevinsonandKumar,1997
MarshallandBanister,2000
Crane and Crepeau, 1998
DIS
TA
NC
E
Traveldistance(all modes)
Næss et al.,1995Curtis, 1995Stead, 1999
ECOTEC,1993Hillman andWhalley,1983Stead, 1999
Stead,1999
Stead, 1999 Dunphy and Fisher, 1996ECOTEC, 1993Hillman and Whalley,1983Kenworthy and Laube,1999Stead, 1999
Headicarand Curtis,1994Stead,1999
Stead, 1999 Crane and Crepeau, 1998Rutherford et al.,1996
FRE
QU
EN
CY
Journeyfrequency
Curtis, 1995 Ewing etal., 1996
Hanson, 1982;ECOTEC,1993
Dunphy and Fisher, 1996ECOTEC, 1993Ewing et al., 1996
Berman, 1996Cervero and Gorham,1995Crane and Crepeau, 1998Friedman et al., 1994McNally and Kulkarni,1997
Land usecharacteristics→Travel patterns↓
Distance ofresidence fromthe urbancentre
Settlementsize
Mixing ofland uses
Provision oflocal facilities
Density of development Proximityto maintransportnetworks
Availabilityofresidentialparking
Roadnetworktype
Neighbourhood type
Proportionof carjourneys
Curtis, 1995Næss andSandberg,1996
Gordon etal., 1989a
Cervero andLandis, 1992
ECOTEC, 1993Gordon et al., 1989aLevinson and Kumar,1997
Headicarand Curtis,1994Kitamuraet al., 1997
Kitamura etal., 1997
Cervero and Gorham,1995Crane and Crepeau, 1998Friedman et al., 1994McNally and Kulkarni,1997
Proportionof publictransportjourneys
Cervero andLandis, 1992
ECOTEC, 1993Frank and Pivo, 1994Levinson and Kumar,1997Baker, 1995Kenworthy and Laube,1999
Cervero,1994
Ewing,1996Flemingand Pund,1994MessengerandEwing,1996TRB,1996
Cervero and Gorham,1995Crane and Crepeau, 1998Ewing, 1996Fleming and Pund, 1994Friedman et al., 1994McNally and Kulkarni,1997TRB, 1996
MO
DE
Proportionof journeysby foot orcycle
Cervero,1989 and1996a
Winter andFarthing, 1997
ECOTEC, 1993Kitamura et al., 1997Baker, 1995Frank and Pivo, 1994
Balcombeand York,1993
Ewing,1996Handy,1992
Crane and Crepeau, 1998Ewing, 1996Friedman et al., 1994Handy, 1992 and 1996McNally and Kulkarni,1997
TIM
E
Traveltime
Gordon etal., 1989a
Giulianoand Small,1993
Cervero andLandis, 1992
Gordon et al., 1989aGordon et al., 1991Levinson and Kumar,1997
LevinsonandKumar,1997

Land usecharacteristics→Travel patterns↓
Distance ofresidence fromthe urbancentre
Settlementsize
Mixing ofland uses
Provision oflocal facilities
Density of development Proximityto maintransportnetworks
Availabilityofresidentialparking
Roadnetworktype
Neighbourhood type
EN
ER
GY
Transportenergycon-sumption
Næss et al.,1995Mogridge,1985Newman andKenworthy,1988
Banister etal., 1997
Næss, 1993Newman and Kenworthy,1989Kenworthy and Laube,1999

120 The Relationships between Urban Form and Travel Patterns
3.1 Distance of residence from the Urban Centre
Spence and Frost (1995) describe the changes in commuting distance between 1971 and1981 in the three largest cities in Great Britain, London, Manchester and Birmingham andshow how commuting distance changes with increasing distance between home and theurban centre. In London commuting distance increases almost linearly with distance betweenhome and urban centre. At a distance of 20 kilometres from the centre of London commutingdistance continues to increase with increasing distance from the centre of the city. InManchester and Birmingham however the relationship is different. Commuting distance inBirmingham first increases with increasing distance between home and the urban centre butat a distance of around 7 kilometres from the urban centre commuting distance reaches aplateau. At a distance of around 9 kilometres from the centre commuting distance begins todecrease as distance from the urban centre increases. Commuting distance in Manchesterfirst increases with increasing distance from the urban centre. At a distance of around 5kilometres from the centre commuting distance reaches a plateau and does not change withfurther increases from the city centre unlike the trend in commuting distance in Birminghamwhich begins to decrease at a distance of 9 kilometres from the city centre. The trends incommuting distance by distance from home to the urban centre in the three cities between1971 and 1981 are similar. Gordon et al. (1989a) describe the changes in average traveldistance in the United States between 1977 and 1983 of people residing inside and outsidecities. In various sizes of city journey distances for both work and non-work journeys in 1977and 1983 were almost always lower for residents inside cities than for residents outsidecities.Næss et al. (1995) identify a statistical relationship between the distance from the urbancentre and travel distance per person in Oslo in which total distance increases with increasesbetween home and the urban centre. It is claimed that the distance between home and theurban centre is an important determinant of travel distance in addition to factors such as carownership and the proximity to local facilities from the home. In a study of travel patterns invarious locations in and around Oxford, Curtis (1995) shows that average work journeydistance may be linked to the distance between home and urban centre. A link betweenaverage non-work journey distance and the distance from home to urban centre is much lessapparent. Average work journey distance is lowest in the two locations closest to the centreof Oxford (Botley and Kiddlington) and highest in the two locations furthest from the centreof Oxford (Bicester and Witney). As for non-work journeys, average travel distance ishighest in Witney, Bicester and Botley, the first two locations being most distant from thecity centre and the latter being closest to the centre of Oxford. The lowest average non-worktravel distance was recorded in Kiddlington, a location close to the centre of Oxford.According to the data collected by Curtis (1995) the frequency of work and non-workjourneys does not vary significantly according to the distance between home and the urbancentre. The proportion of journeys by car may be related to some extent to the distancebetween home and city centre. The proportion of car journeys is lowest in the two locationsclosest to the centre of Oxford and highest in the two locations furthest from the city centre.Stead (1999) examines the relationship between the proximity of homes to high street shopsas a proxy for the distance between home and the urban centre (recognising that this measuremay not accurately reflect the proximity to the nearest urban centre, since high street shops

Dominic Stead and Stephen Marshall 121
are not always found in central urban areas – they can also be found in out of town shoppingcentres and along the radial routes of larger cities for example) but finds no relationshipbetween the distance between home and high street shops.Næss et al. (1995) examine the effect of distance from the home to the urban centre ontransport energy consumption. Transport energy consumption increases as the distancebetween home and the urban centre increases. A causal model containing a variety of landuse and socio-economic variables is constructed. It is claimed car ownership has the greatestinfluence on transport energy consumption, followed by the distance between home and theurban centre, the proximity to local facilities from the home, income per capita and variousother socio-economic factors. Mogridge (1985) demonstrates a near linear relationshipbetween distance from home to the centre and transport energy consumption. Therelationship is shown to be very similar in both London and Paris. On average, residentsliving at a distance of 15 kilometres from the urban centre consume more than twice thetransport energy consumed by residents living 5 kilometres from the urban centre. Similarly,Newman and Kenworthy (1988) identify the relationship between transport energyconsumption and the distance from the central business district in Perth. Like Mogridge(1985), Newman and Kenworthy demonstrate a linear relationship although the latter is notas steep. It is reported that residents living at a distance of 15 kilometres from the centralbusiness district consume approximately 20 per cent more transport energy than residentsliving 5 kilometres from the central business district.In summary, in many studies, increasing distance from home to the urban centre is associatedwith increasing travel distance, an increasing proportion of car journeys and increasingtransport energy consumption. Trip frequency however does not vary significantly accordingto the distance between home and the urban centre. It is recognised here that urban areas arenot monocentric and there are often urban locations outside of the centre where majoremployment, services and facilities can also be found. Thus the distance between home andurban centre may only be a rough indicator of the remoteness of development.
3.2 Settlement Size
The size of settlements affects the range of local jobs and services that can be supported andinfluences the range of public transport services which can be provided. Thus smallsettlements that are unable to support a large range of services and facilities may force localresidents to travel longer distances in order to access the services and facilities that theyrequire. Very large, centralised settlements may on the other hand lead to longer traveldistances as the separation between homes and the urban centre becomes large. Largesettlements with a very large range of jobs and services may also attract people living longdistances away to travel to them. These factors may all influence travel patterns. Accordingto Owens (1986 p.29) and ECOTEC (1993 p.39) it is unlikely that there is a simplerelationship between settlement size and travel patterns. Banister (1996) argues that adiversity of services and facilities requires a population size of at least 10,000. Barton et al.(1995) share similar views on settlement size thresholds.Orfeuil and Salomon (1993) conclude from their study of French cities that the size of theurban area is associated with a U-shaped distribution of trip lengths. Long trip distances areobserved in rural areas and the largest conurbations, while short distances are observed inmedium-sized cities. In Great Britain, ECOTEC (1993) report that travel distance is highest

122 The Relationships between Urban Form and Travel Patterns
in the smallest category of settlements (containing fewer than 3,000 residents) and traveldistance is lowest in large metropolitan areas (excluding London), according to analysis ofnational travel data. Residents of London travel larger distances on average than the residentsof the six next largest metropolitan areas (West Midlands, Greater Manchester, WestYorkshire, Glasgow, Liverpool and Tyneside). Hillman and Whalley (1983) report similarfindings in their analysis of data from 1978/79 National Travel Survey of Great Britain. Theyalso report that the total distance travelled per person by car is lowest in conurbations(metropolitan areas) and highest in rural areas. The average journey distance by car is alsolowest in conurbations and highest in rural areas. Research by Stead (1999) suggests thattravel distance is often lower in large urban areas containing more than 250,000 residents,after socio-economic differences are taken into account.Figures from research by Gordon et al. (1989a) show no easily identifiable relationshipbetween urban population size and modal choice. In a study of commuting patterns in the tenlargest urbanised areas in the United States, the proportion of car journeys was found to beleast in New York (which has the largest population of the areas studied) and highest inDetroit (which has the sixth largest population of the areas studied).Breheny (1995) uses estimates of typical specific energy consumption by mode and datafrom the 1985/86 National Travel Survey of Great Britain to calculate transport energyconsumption by population size. He reports that transport energy consumption is lowest inmetropolitan areas (excluding London) and highest in the smallest category of settlements(containing fewer than 3,000 residents). Transport energy consumption is one third lowerthan average in the metropolitan areas (excluding London) and more than one third higherthan average in the smallest settlements. Breheny’s work shows that the trends in transportenergy consumption and travel distance trends by settlement size are very similar despitesignificant variations in modal split across different sizes of settlement. Although there aresignificant differences in energy consumption across different sizes of settlement, Brehenyestimates that counter-urbanisation trends between 1961 and 1991 have only beenresponsible for a small increase (approximately 2 per cent) in passenger transport energyconsumption.In summary, there has been a relatively large amount of research concerning the relationshipbetween settlement size and travel patterns. The relationship between settlement size andtravel patterns is unlikely to be simple due to the interplay of competing factors. Evidencefrom Great Britain shows that large metropolitan settlements are associated with low traveldistance and transport energy consumption. Evidence from the ten largest urban areas in theUnited States however shows no easily identifiable relationship between urban populationsize and modal choice.
3.3 The Mixing of Land Uses
The mixing of land uses affects the physical separation of activities and is therefore adeterminant of travel demand. Some evidence suggests that the mixing of land uses is not asimportant as density in influencing travel demand (Owens, 1986; ECOTEC, 1993).Nevertheless the level of mixed use may contribute to travel demand particularly through thedecentralisation of less specialised employment (ECOTEC, 1993). The mixing of land usesis commonly measured using job ratio, the ratio of jobs in the area to workers resident in thatarea.

Dominic Stead and Stephen Marshall 123
Ewing et al. (1996) have investigated the effect of the various land use mix characteristics ontrip generation including the balance of homes and jobs. They report that there is nostatistically significant relationship between the balance of homes and jobs and journeyfrequency. In a study of commuting patterns in San Francisco, Cervero (1989) reports anegative relationship between job ratio and the proportion of journeys undertaken by footand cycle: where there are many more jobs than houses the proportion of journeys by foot orcycle falls. Cervero concedes that the statistical relationship is not very strong but suggeststhat the encouragement of balancing houses and jobs may encourage walking and cycling.Giuliano and Small (1993) question the importance of job ratio on travel patterns and presentthe results of a commuting study in the Los Angeles region to show that job ratio has astatistically significant but relatively small influence on commuting time. They conclude thatattempts to alter the metropolitan structure of land use are likely to have small impacts oncommuting patterns even if jobs and housing became more balanced. Stead (1999) reportsthat higher job ratios are associated with lower travel distance but recognises that is notpossible to achieve high job ratios in all areas (since this would require a surplus of jobs or adeficit of employable residents). In a study of transport energy consumption in variouslocations in Great Britain, Banister et al. (1997) identify a relationship between job ratio andenergy use per trip in one of their case studies (Oxford). An aggregate measure of land usemix (termed ‘diversity’) is examined by Cervero and Kockelman (1997), who report a linkbetween land use mix and total non-work travel distance but no link between land use mixand total distance travelled.To summarise, there are relatively few studies concerning the effect of job ratio on travelpatterns. On first examination evidence from existing research may appear contradictory butthis is not necessarily the case. The three studies summarised above use different measures oftravel patterns in their analysis. Thus it is quite consistent that the relationship between jobratio and modal share (examined by Cervero, 1989) is not the same as the relationshipbetween job ratio and travel time (examined by Giuliano and Small, 1993), job ratio andtravel distance (Stead, 1999) or the relationship between job ratio and transport energy useper trip (examined by Banister et al., 1997).
3.4 The Provision of Local Facilities
The provision of local facilities and services may clearly reduce travel distance and increasethe proportion of short journeys capable of being travelled by non-motorised modes. Littleevidence has been collected on this subject however and some of the precise impacts of localfacilities and services on travel patterns are unknown.Winter and Farthing (1997) report that the provision of local facilities in new residentialdevelopments reduces average trip distances but does not significantly affect the proportionof journeys by foot. Evidence from the same study reported elsewhere indicates that theprovision of local facilities reduces the average journey distance by car (Farthing et al.,1997). ECOTEC (1993, p.47) report from neighbourhood case studies that a clearrelationship emerges between the distance from a local centre, the frequency of its use andaverage journey distance. Hanson (1982) and Stead (1999) report similar findings, showingthat the proximity to local facilities is positively associated with average distance after takinginto account the effects of various socio-economic differences of the areas studied. Hansonalso shows that the provision of local facilities is associated with increased journey
124 The Relationships between Urban Form and Travel Patterns
frequency although the effect of increasing journey frequency is not as strong as the effect ofreducing trip length.Thus, there is broad consensus from these studies about the effects of local facilities andservices on travel patterns. The provision of local facilities may overall contribute to lesstravel overall but might not contribute to any more travel by less energy intensive modes,namely walking and cycling.
3.5 The Density of Development
The density of development is commonly measured in terms of population density and to alesser extent employment density. Much of the research into land use and travel patterns hasfocused on the relationship between population density and travel patterns. ECOTEC (1993p.33) put forward four reasons why population density may be linked to travel patterns.Firstly, higher population densities widen the range of opportunities for the development oflocal personal contacts and activities that can be maintained without resort to motorisedtravel. Secondly, higher population densities widen the range of services that can besupported in the local area, reducing the need to travel long distances. Thirdly, higher densitypatterns of development tend to reduce average distances between homes, services,employment and other opportunities which reduces travel distance. Fourthly, high densitiesmay be more amenable to public transport operation and use and less amenable to carownership and use which have implications for modal choice.Figures derived from ECOTEC (1993, pp.33-34) indicate that average journey distance bycar, bus and rail decreases with increasing population density, whilst the average journeydistance by foot is more or less constant regardless of population density. Hillman andWhalley (1983) report similar findings from their analysis of data from the 1978/79 NationalTravel Survey of Great Britain. They show that the total distance by all modes decreases withincreasing population density and show that residents of very low-density areas (less than 5persons per hectare) travel by car more than twice the distance of residents of high-densityareas (more than 60 persons per hectare). Stead (1999) also reports that low populationdensities are often associated with high travel distances.According to ECOTEC (1993), total journey frequency does not show a clear gradation withpopulation density and there is little variation in trip frequency according to populationdensity. The average journey frequency is reported to be close to 14 journeys per person perweek. The highest trip frequency is 14.8 journeys per person per week in areas wherepopulation density is between 1 and 5 persons per hectare. The lowest trip frequency is 13.0journeys per person per week in areas where population density is more than 50 persons perhectare. Ewing et al. (1996) report that there is a weak significant statistical link between tripfrequency and population density.Figures from ECOTEC (1993) show how modal choice is associated with populationdensity. The proportion of trips by car decreases with increasing population density whilstthe proportion of trips by public transport and foot both increase. Car trips account for 71 percent of journeys in low-density areas (more than 50 persons per hectare) but only 51 per centof trips in high-density areas (less than 1 persons per hectare). There is a fourfold differencein public transport trips and almost a twofold difference in walk trips between very lowdensity areas and very high density areas. Frank and Pivo (1994) show how the proportion ofshopping trips by public transport and the proportion of commuting trips by foot are both
Dominic Stead and Stephen Marshall 125
positively linked with population density. Kitamura et al. (1997) show how populationdensity is linked to the proportion of public transport trips after accounting for socio-economic differences. Gordon et al. (1989a) however produce evidence which shows thatthere is no clear relationship between the proportion of car trips and population density.There are a number of reasons for the apparently contradictory findings of these studies.First, the definitions of density are different in the work of Gordon et al. than in most of theother studies. Second, Gordon et al. (1989a) only focus on journeys to work whereasECOTEC (1993) and Kitamura et al. (1997) examine all journey purposes.Newman and Kenworthy (1989) illustrate the correlation between urban population densityand transport energy consumption in a study of 32 cities from around the world. UsingSwedish data, Næss (1993) also identifies a link between population density and transportenergy consumption.There is much less evidence concerning the relationship between travel patterns andemployment density, a second measure of the intensity of land use and activities. It ispossible that similar relationships between population density and travel patterns existbetween employment density and travel patterns. Frank and Pivo (1994) for example showthat employment density, like population density, is connected to the proportion of publictransport trips for both shopping and work journeys after controlling for socio-economicvariations.In summary, there is a growing body of research that suggests a link between populationdensity and many measures of travel patterns. There is little evidence however of muchvariation in journey frequency by population density. In contrast to the amount of researchinto the relationship between population density and travel patterns, there has been littlerecent research concerning the relationships between employment density and travel patterns.
3.6 Proximity to Main Transport Networks
The proximity to transport networks also influences travel patterns and consequentlytransport energy consumption. Better access to major transport networks, particularly roadand rail networks, increases travel speeds and extends the distance which can be covered in afixed time. Major transport networks can be a powerful influence on the dispersal ofdevelopment – both residential and employment development. The proximity to majortransport networks may lead to travel patterns characterised by long travel distances and hightransport energy consumption.Headicar and Curtis (1994) report that the proximity to major transport networks has asubstantial effect on work travel distance. They conclude that the proximity to either amotorway or a main road is associated with longer travel distances and a higher proportion ofcar journeys. They also report that the proximity to a railway station is associated with longdistance commuting but fewer car journeys. Kitamura et al. (1997) report that the distancefrom home to the nearest bus stop and railway station affects the modal share. Theproportion of car journeys increases and the proportion of non-motorised journeys decreaseswith increasing distance from the nearest bus stop; the proportion of rail journeys increaseswith increasing distance from the nearest railway station. Cervero (1994) shows how theproportion of rail journeys decreases with increasing distance from the railway station.Residents living within 500 feet (approximately 150 metres) of a railway station in Californiatypically use rail for approximately 30 per cent of all journeys. The further the distance from
126 The Relationships between Urban Form and Travel Patterns
the railway station, the lower the proportion of rail journeys is made. Residents living at adistance of around 3,000 feet (approximately 900 metres) from the nearest railway station arelikely to make only about half the number of rail journeys than residents living within 500feet of a railway station. Cervero reports that this pattern of rail use is similar in Washington,Toronto, Edmonton and California. However, Stead (1999) finds little evidence in Britain ofa link between the proximity of homes to a railway station and travel distance.Thus, the proximity to transport networks influences travel patterns and consequentlytransport energy consumption. Better access to major transport networks, particularly roadand rail networks, increases travel speeds and extends the distance which can be covered in afixed time. Major transport networks can be a powerful influence on the dispersal ofdevelopment – both residential and employment development. The proximity to majortransport networks may lead to travel patterns characterised by long travel distances and hightransport energy consumption. The availability of residential car parking is linked to both tripfrequency and modal choice. As the availability of residential car parking increase, theproportion of car journeys increases.
3.7 The Availability of Residential Parking
Evidence from Kitamura et al. (1997) shows that the availability of residential car parking islinked to both trip frequency and modal choice. As the availability of residential car parkingincreases the average number of trips per person decreases: an observation that is perhapscounter-intuitive. Kitamura et al. suggest that residents with more parking spaces makefewer, longer journeys, whilst residents with fewer parking spaces make more journeys butthese tend to be short. It is also reported that as the availability of residential car parkingincreases the proportion of car journeys increases. This would imply that residents with moreparking spaces not only make fewer, longer journeys but also that these journeys are morecar-based. Conversely, the research implies that residents with fewer parking spaces makemore journeys but which are short and less car-based.Balcombe and York (1993) identify a correlation between the availability of residentialparking (expressed as the ratio of vehicles to spaces) and the proportion of car ownersmaking short journeys by foot (in order to retain their parking space). The research indicatesa greater tendency to walk in areas where residential parking is limited. Similarly, Valleley etal. (1997) suggest a relationship between the modal split of commuting and parkingprovision at work. Stead (1999) reports that limited residential parking is associated withlower travel distance and suggests that the limited availability of parking may lead to more‘rational’ car use as residents seek to reduce the number of journeys and hence the number oftimes they have to search for a parking space on their return home. Limited residentialparking may also indirectly contribute to less travel by suppressing car ownership which thestudy identifies as a strong determinant of travel distance. However, Balcombe and York(1993) report that difficulties in finding a parking space may not necessarily deter carownership or intentions to acquire additional vehicles even with increasing parkingproblems.
3.8 Road network type
The form or structure of an urban area may be characterised to some extent by the pattern ofits road network. Road networks may be described using qualitative labels for their overall
Dominic Stead and Stephen Marshall 127
pattern or by descriptions based on some component properties. Qualitative labels can give areasonable intuitive impression of network shape (e.g. grid, radial, and so on), whilecomponent properties are more easily quantified and hence used as the basis for systematiccomparison (e.g. the composition of the network in terms of route type or junction type—seeMarshall, 2001a).Maat (2000) reports the case of Houten, a Dutch town laid out with permeable pedestrian andcycle routes but with deliberately impermeable, circuitous routes for motor traffic. Here,peak period car trip generation was found to be 10 per cent less than the national average,despite car ownership being amongst the highest in the Netherlands. Use of the car forshopping trips was also found to be between 8 and 13 per cent less than in comparable urbanareas (with similar characteristics but different network structure). However, trip distancesfor those (shopping) trips that are made by car are longer than in the comparator cases(Marshall and Banister, 2000).Fleming and Pund (1994) report higher bus occupancy (implying a higher proportion of bususe) in networks which allow more direct access to public transport. However, Messengerand Ewing (1996) report that road network design had no apparent effect on bus use.Elsewhere, Ewing (1996) reports finding no relationship between transit use and streetnetwork design ‘after controlling for other variables such as urban density and servicefrequency’. Ewing also notes that grid-like patterns can be more transit friendly to the extentthat they may allow greater penetration of an area by transit services.Ewing’s study considered to what extent various urban features might be regarded as being‘essential’ or ‘highly desirable’ in terms of contributing to pedestrian and transit friendlydesign. Among the ‘essential’ characteristics were short to medium length blocks (relating tonetwork permeability) and continuous sidewalks (relating to the connectivity of thepedestrian network), while having a grid-like street network was considered highly desirable.Crane and Crepeau (1998) cast doubt on whether the grid pattern has any significant effecton car or pedestrian travel. Indeed, Crane (2000) points out that, to the extent that grids’greater connectivity offers shorter trips, trip frequency may be expected to increase - afinding echoing results of modelling work by McNally and Ryan (1993).The examples here suggest that the ability to single out the effects of road network type perse on travel behaviour may not be straightforward. However, underlying the many contingentfactors, there seems to be a basic inverse relationship between the attractiveness of a modeand the distance travelled by that mode. This means, for example, that a grid layout may beassociated with sustainable travel insofar as it promotes short and direct routes forpedestrians, including pedestrian access to public transport. But, by the same token, a gridmay promote ‘unsustainable’ travel insofar as it allows short, direct routes for car traffic.
3.9 Neighbourhood type
Neighbourhood type is effectively a composite variable that is used to characterise areas ofcities that are relatively homogeneous according to a range of attributes. These attributestypically include the age of development (such as pre-war or post-war), the style ofdevelopment (traditional, conventional or neo-traditional for example) and the street networktype (such as grid or loop and cul-de-sac), as illustrated in Table 2.
128 The Relationships between Urban Form and Travel Patterns
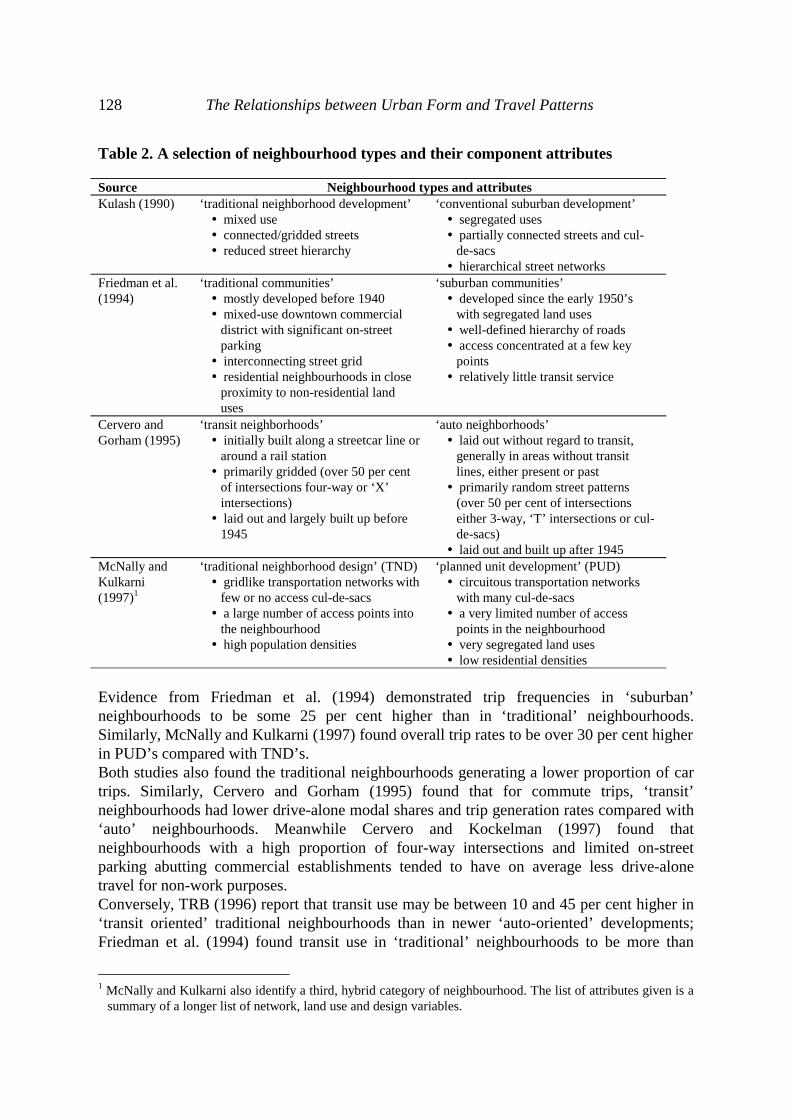
Table 2. A selection of neighbourhood types and their component attributes
Source Neighbourhood types and attributes‘traditional neighborhood development’ ‘conventional suburban development’Kulash (1990)
mixed use connected/gridded streets reduced street hierarchy
segregated uses partially connected streets and cul-de-sacs hierarchical street networks
‘traditional communities’ ‘suburban communities’Friedman et al.(1994) mostly developed before 1940
mixed-use downtown commercialdistrict with significant on-streetparking interconnecting street grid residential neighbourhoods in closeproximity to non-residential landuses
developed since the early 1950’swith segregated land uses well-defined hierarchy of roads access concentrated at a few keypoints relatively little transit service
‘transit neighborhoods’ ‘auto neighborhoods’Cervero andGorham (1995) initially built along a streetcar line or
around a rail station primarily gridded (over 50 per centof intersections four-way or ‘X’intersections) laid out and largely built up before1945
laid out without regard to transit,generally in areas without transitlines, either present or past primarily random street patterns(over 50 per cent of intersectionseither 3-way, ‘T’ intersections or cul-de-sacs) laid out and built up after 1945
‘traditional neighborhood design’ (TND) ‘planned unit development’ (PUD)McNally andKulkarni(1997)1
gridlike transportation networks withfew or no access cul-de-sacs a large number of access points intothe neighbourhood high population densities
circuitous transportation networkswith many cul-de-sacs a very limited number of accesspoints in the neighbourhood very segregated land uses low residential densities
Evidence from Friedman et al. (1994) demonstrated trip frequencies in ‘suburban’neighbourhoods to be some 25 per cent higher than in ‘traditional’ neighbourhoods.Similarly, McNally and Kulkarni (1997) found overall trip rates to be over 30 per cent higherin PUD’s compared with TND’s.Both studies also found the traditional neighbourhoods generating a lower proportion of cartrips. Similarly, Cervero and Gorham (1995) found that for commute trips, ‘transit’neighbourhoods had lower drive-alone modal shares and trip generation rates compared with‘auto’ neighbourhoods. Meanwhile Cervero and Kockelman (1997) found thatneighbourhoods with a high proportion of four-way intersections and limited on-streetparking abutting commercial establishments tended to have on average less drive-alonetravel for non-work purposes.Conversely, TRB (1996) report that transit use may be between 10 and 45 per cent higher in‘transit oriented’ traditional neighbourhoods than in newer ‘auto-oriented’ developments;Friedman et al. (1994) found transit use in ‘traditional’ neighbourhoods to be more than
1 McNally and Kulkarni also identify a third, hybrid category of neighbourhood. The list of attributes given is a
summary of a longer list of network, land use and design variables.
Dominic Stead and Stephen Marshall 129
double that in ‘suburban’ neighbourhoods. Meanwhile, Handy (1992), Friedman et al. (1994)and Cervero and Gorham (1995) all report higher proportions of journeys by foot intraditional or ‘transit’ neighbourhoods compared with suburban or ‘auto’ neighbourhoods.Although these findings may tend to support the commonly recognised association of‘traditional’ neighbourhoods with pedestrian and transit orientation, and ‘conventionalsuburban’ neighbourhoods with car orientation, this does not necessarily imply causalitybetween travel behaviour and either the land use or layout components of theneighbourhoods. This is not least due to the influence of socio-economic factors (a pointexpressly evaluated by McNally and Kulkarni, 1997).
4. Critique
The critique of the literature reviewed is divided into three main sections. The first sectionconcerns issues of data accuracy, reliability and quality. The applicability of various researchmethods is addressed in the second section and the third section concerns issues of datainterpretation.
4.1 Data accuracy, reliability and quality
The question of whether the data is accurate and reliable is fundamental to all research. Thispaper does not attempt to examine the accuracy and reliability of all the studies whose resultsare summarised above. Instead, a number of more general issues concerning data accuracy,reliability and quality, which have been directed to these type of empirical studies, aresummarised.In setting out his critique of two studies authored by Newman and Kenworthy (Newman etal., 1985; Newman and Kenworthy, 1989), Troy (1992) raises a number of issues that arealso applicable to many other studies of land use and travel patterns. The first issue concernsdata accuracy. A number of studies to have examined the effect of land use and travelpatterns have involved the calculation of travel distance from trip zone data. Troy (1992)questions the accuracy of travel distance calculations from trip zone data, where trip lengthsare calculated from average distances between zone centroids. Studies by Spence and Frost(1995) and Banister et al. (1997) also rely on trip zone data to calculate travel distance. Thedistance of each journey is calculated according to the distances between the origin anddestination zone centroids. Depending on the size of zones, the actual travel distance may besignificantly different to the figure calculated using average centroid distances. Thecalculations also do not account for the configuration of the transport network in order toestablish actual route distances, rather than straight-line distances between origin anddestination zones. Since most studies are comparative, however, precise distances are not asimportant as relative distances. Thus, precise calculations of travel are less important thancomparable travel distances that have a similar degree of accuracy for each area.Second, Troy (1992) questions the applicability of average fuel consumption figures tocalculate transport energy consumption, without accounting for factors that affect transportenergy consumption such driving conditions or the time of day. These sort of assumptionsare made in studies by Banister et al. (1997), Breheny (1995) and Næss et al. (1995). Theaverage energy consumption of vehicles is influenced by a number of vehicle, journey and

130 The Relationships between Urban Form and Travel Patterns
passenger characteristics, such as vehicle age, fuel type, engine size, engine temperature,vehicle speed and passenger loading (or occupancy). To account for each of these factors forevery journey would add much complexity to the calculation of energy consumption. Itwould be necessary to establish information about the vehicle age, fuel type, engine size,engine temperature, vehicle speed, and passenger occupancy for every journey. Evidencefrom the National Travel Survey data for Great Britain suggests that factors such as drivingspeed at different times of the day do not show large variations (see section 4.3). Althoughthe use of typical energy consumption values for each mode does not accurately account forthe variation in the vehicle, journey and passenger characteristics of each journey, it doesrepresent a reasonable estimate of transport energy consumption under typical conditions.Third, the issue of the reliability of data from self-completed questionnaires is questioned.Troy (1992 p49) states that there is evidence from several (unspecified) reports to suggestthat this kind of travel diary systematically overstates household travel and understates shorttrips. It is not clear how travel diaries tend to overstate household travel, but it is obvious tosee that short journeys may be under-recorded. Studies based on data from self-completedtravel diaries include Cervero (1994), Cervero and Landis (1992); Curtis (1995), Kitamura etal. (1997), Næss and Sandberg (1996), Næss et al. (1995), Prevedouros and Schofer (1991),Winter and Farthing (1997). Clearly, the issue of under-recorded short journeys is importantwhen considering travel patterns such as trip frequency or the modal share of non-motorisedjourneys, since short journeys may be a significant component. The under-recording of shortjourneys is perhaps of less importance when considering total travel distance or transportenergy consumption, since short trips do not often substantially contribute to these twomeasures of travel.The representativeness of travel data is related to the sample size, the type of journeysrecorded and the time period over which the data is collected. Troy (1992) expresses concernabout the representativeness of travel data collected over a short time, questioning whetherthe typical weekday travel data collected by Newman et al. (1985) provide sufficient travelinformation to calculate annual transport energy consumption. Similar concerns might beexpressed about a number of other studies summarised above. Concerns may also beexpressed about the extent to which studies of single journey purposes (work travel, forexample) can be used to represent all purposes of travel. Commuting in Great Britain, forexample, now accounts for fewer than a quarter of all trips and a similar proportion of totaltravel distance (Department of Environment, Transport and the Regions, 1999). The searchfor more sustainable land use patterns, which is the focus of many recent studies of land useand travel patterns, clearly depends on identifying areas which promote fewer journeys,shorter journeys and non-motorised journeys. These characteristics clearly do not just applyto one type of journey but all types. Thus, the extent to which studies of commuting or othersingle types of journey purpose can identify sustainable land use patterns is only partial.
4.2 Methods of analysis
There are limitations to all methods of analysis and the limitations of empirical studies ofland use and travel patterns have been outlined earlier in the paper. Two issues related to thelimitations of empirical studies are discussed in this section. The first issue concerns thedifficulty in establishing the causality of relationships. The second issue concerns socio-economic factors and the difficulty they pose in making comparisons between different areas.

Dominic Stead and Stephen Marshall 131
Cross-sectional analyses of land use and travel patterns, like the ones contained in the studiesreviewed above, do not easily lend themselves to establishing causal links. Several studiesdemonstrate strong correlations between various measures of land use characteristics andtravel patterns. Such analysis, however, cannot prove a causal relationship, even where highcorrelation is demonstrated. Correlation may identify a link between variables, but this linkmay or may not be direct. It could be that the link is in response to another variable. Even ifthe link is direct, it is not possible to establish the direction of causality. Therefore, a strongcorrelation between transport energy consumption and population density, for example, doesnot imply a direct link between the two variables. The two variables could be linked by oneor more intermediate variables, such as car ownership or income. Similarly, the results ofregression analyses may identify statistical dependence between variables but do not identifya physical relationship between variables. As with correlation analysis, regression analysismay identify a link between variables but this link may or may not be direct.In identifying a link between land use characteristics and travel patterns, it is necessary tohold all other variables constant. This is not easy in empirical research, since different landuse characteristics are often associated with different socio-economic factors, which alsohave an effect on travel patterns. The variation in socio-economic factors increases thedifficulty in establishing the effect of land use characteristics on travel patterns, and addscomplication to the comparison of travel patterns in different areas.A large number of socio-economic factors may influence travel patterns. There is asubstantial amount of literature on this subject. This paper does not present a comprehensivereview of the effects of all socio-economic factors on travel patterns. Instead, it identifies themain types of socio-economic factors and illustrates how each of these main types of factorsmay affect travel patterns. Eleven types of socio-economic factors are identified in this studyfrom the review of literature on travel patterns and socio-economic factors. These eleventypes comprise: income; car ownership and availability; possession of drivers’ licence;working status; employment type; gender; age; household size and composition; level ofeducation; attitudes; personality type. The effects of these factors on travel patterns aresummarised in Figure 2. For a more comprehensive review of the effect of socio-economicfactors on travel patterns, see Damm (1981) or Hanson (1982).These eleven types of socio-economic factors are interconnected, and it is often difficult toseparate the effect of one from another (i.e. they are often multicollinear). Householdincome, for example, is linked to employment type and working status (whether full-time orpart-time; how many members of the household are employed). This may influence carownership and use. Car ownership and use is also influenced by the possession of a driver’slicence, age and gender (Figure 3).Several studies summarised in this review do not explicitly recognise that different land usecharacteristics are associated with different socio-economic factors, which also have aneffect on travel patterns. Consequently, they do not attempt to differentiate between theeffects of land use characteristics and socio-economic factors. Other studies recognise theeffect that socio-economic factors may have on travel patterns but employ a research methodthat does not differentiate between the effects of land use characteristics and socio-economicfactors. ECOTEC (1993), for example, recognise the relationship between populationdensity, lifestyles, income and car ownership but do not attempt to identify the separateeffects of socio-economic factors and land use patterns. They report that:

132 The Relationships between Urban Form and Travel Patterns
Hanson (1982) reports that trip frequency is linked to household income: people in higher income households make more journeysthan in lower income households. Cervero (1996a) shows how commuting distance increases with increasing income. Næss andSandberg (1996) identify a positive link between household income and the total distance travelled per person. Transport energyconsumption is reported to increase as household income increases (Næss, 1993; Næss et al., 1995). Flannelly and McLeod (1989)show how income is linked to the choice of mode for commuting. Income is also linked to land use patterns, which may explainsome of the variation in travel patterns in different locations. Mogridge (1985), for example, shows how average incomes in Parisand London increase with increasing distance from the city centre, with the exception of residents in very central locations (withinapproximately 4 kilometres of the city centre). Kockelman (1997) also reports a positive correlation between travel distance andincome.
Hanson (1982) reports that trip frequency increases with car ownership, whereas Prevedouros and Schofer (1991) contend that caravailability does not explain the variation in trip frequency. Total travel distance is reported to increase with car ownership (Næssand Sandberg, 1996; Kockelman, 1997), as is transport energy consumption (op. cit.) and the proportion of car journeys (Næss,1993). Flannelly and McLeod (1989) show that the number of cars per household is linked to the choice of mode for commuting.Ewing (1995) reports that travel time increases as car ownership levels increase. Like income, car ownership is also linked to landuse patterns, and may explain some of the variation in travel patterns in different locations. Gordon et al. (1989a), Levinson andKumar (1997) and Næss et al. (1995) identify links between car ownership and population density. Higher density areas tend tohave lower levels of car ownership. According to evidence from the United States presented by Gordon et al. (1989a), carownership tends to be lower in larger cities. Other studies show that car ownership increases as the distance from the city centreincreases (Mogridge, 1985; Næss and Sandberg, 1996).
Flannelly and McLeod (1989) show how the possession of a driver’s licence is linked to the choice of mode for commuting. Peoplewho use the bus are likely to come from households where fewer members have a driver’s licence. Interestingly, it is reported thatpeople who share cars to work are likely to come from households with more drivers’ licences than average (op. cit.)
Prevedouros and Schofer (1991) report that work status does not explain the variation in trip frequency. Ewing et al. (1996) reportthat journey frequency increases as the number of workers per household increases. Ewing (1995) reports that average travel timeper person increases as the number of workers per household increases, reflecting the fact that where there is more than one workerin household, home location may not be near to the workplace of each worker
Hanson (1982) reports no difference in total trip frequency according to gender in Sweden. Gordon et al. (1989b) report that thefrequency of non-work trips is higher for women than men in the United States, and that women have shorter work trips than men,regardless of income, occupation, marital and family status.
Hanson (1982) reports no difference between trip frequency and age, whilst Prevedouros and Schofer (1991) report that ageexplains some of the variation in trip frequency. Evidence from Flannelly and McLeod (1989) suggests that age has no significanteffect on the choice of mode for commuting. Næss et al. (1995) report that transport energy consumption increases with increasingage. Banister et al. (1997) report a negative correlation between transport energy consumption and the proportion of childrenwithin each survey group.
According to Hanson (1982), journey frequency increases as household size increases. Evidence from Ewing et al. (1996), Dunphyand Fisher (1996) and Kockelman (1997) supports this finding. Ewing (1995) reports that travel time per person increases ashousehold size increases. Banister et al. (1997) report that household size is negatively correlated with transport energyconsumption.
Evidence from Flannelly and McLeod (1989) suggests that the level of education has no significant effect on the choice of modefor commuting.
Some significant differences in travel patterns are reported according to attitudes to various aspects of urban life (Kitamura et al.,1997). It is reported that higher than average trip frequency is associated not just with pro-car attitudes but also ratherinconsistently with attitudes which are either pro-environment or pro-public transport/ridesharing. Perhaps unsurprisingly, peoplewith pro-public transport attitudes make more journeys by public transport than other people. People with pro-car attitudes tend tomake fewest journeys by public transport and the most journeys by car. People with pro-environment and pro-public transportattitudes make the most non-motorised journeys, whereas people with pro-car attitudes make the fewest non-motorised journeys.Other attitudes to urban life (termed time pressure, urban villager, suburbanite and workaholic) were also investigated by Kitamuraet al. but there were few large differences in travel patterns according to these other attitudes. Flannelly and McLeod (1989)suggest that the choice of mode for commuting is affected by attitudes to travel, such as convenience, reliability, comfort, speed,pleasantness, safety and expense.
Prevedouros (1992) examines the differences in travel patterns according to personality types and reports that trip frequency andtotal distance travelled increases with increasing sociability. Different personality characteristics are associated with differenttypes of home location. The proportion of ‘sociable’ personalities was higher in urban areas and lower in suburban areas. Urbandwellers were therefore more likely to make more trips and travel further than suburban dwellers.
Figure 2. Examples of how socio-economic factors affect travel patterns
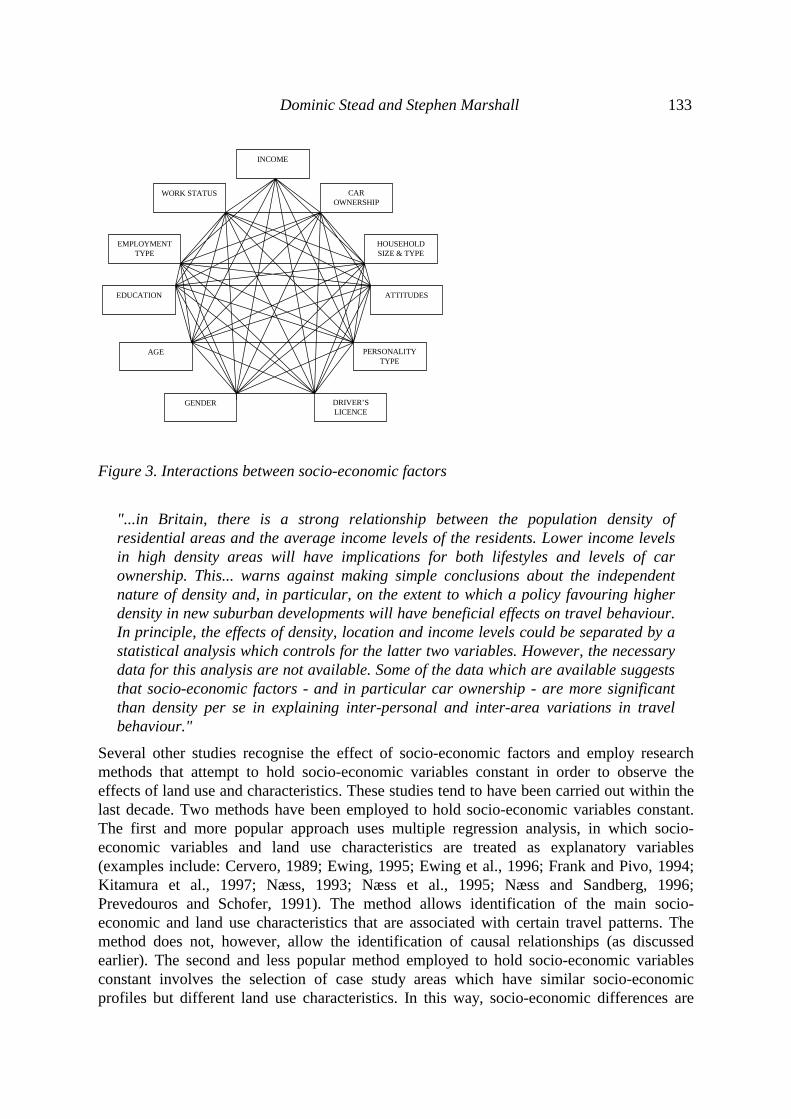
Dominic Stead and Stephen Marshall 133
EMPLOYMENTTYPE
EDUCATION
AGE
GENDER DRIVER’SLICENCE
PERSONALITYTYPE
ATTITUDES
HOUSEHOLDSIZE & TYPE
CAROWNERSHIP
WORK STATUS
INCOME
Figure 3. Interactions between socio-economic factors
"...in Britain, there is a strong relationship between the population density ofresidential areas and the average income levels of the residents. Lower income levelsin high density areas will have implications for both lifestyles and levels of carownership. This... warns against making simple conclusions about the independentnature of density and, in particular, on the extent to which a policy favouring higherdensity in new suburban developments will have beneficial effects on travel behaviour.In principle, the effects of density, location and income levels could be separated by astatistical analysis which controls for the latter two variables. However, the necessarydata for this analysis are not available. Some of the data which are available suggeststhat socio-economic factors - and in particular car ownership - are more significantthan density per se in explaining inter-personal and inter-area variations in travelbehaviour."
Several other studies recognise the effect of socio-economic factors and employ researchmethods that attempt to hold socio-economic variables constant in order to observe theeffects of land use and characteristics. These studies tend to have been carried out within thelast decade. Two methods have been employed to hold socio-economic variables constant.The first and more popular approach uses multiple regression analysis, in which socio-economic variables and land use characteristics are treated as explanatory variables(examples include: Cervero, 1989; Ewing, 1995; Ewing et al., 1996; Frank and Pivo, 1994;Kitamura et al., 1997; Næss, 1993; Næss et al., 1995; Næss and Sandberg, 1996;Prevedouros and Schofer, 1991). The method allows identification of the main socio-economic and land use characteristics that are associated with certain travel patterns. Themethod does not, however, allow the identification of causal relationships (as discussedearlier). The second and less popular method employed to hold socio-economic variablesconstant involves the selection of case study areas which have similar socio-economicprofiles but different land use characteristics. In this way, socio-economic differences are

134 The Relationships between Urban Form and Travel Patterns
minimised and the variation in travel patterns is assumed to be the result of land usecharacteristics (examples include Handy, 1992 and Curtis, 1995).Like the interconnection of socio-economic factors, it is also likely that a number of land usecharacteristics are also interrelated. Settlement size, for example, may be linked topopulation density (large cities are denser than small villages), the distance to the urbancentre or the availability of residential parking (Figure 4). Establishing the individual effectsof these characteristics is therefore difficult.
ROADNETWORK
PEDESTRIANNETWORK
P. T.ACCESSIBILITY
AVAILABILITYOF PARKING
DISTANCE TOURBAN CENTRE
JOBRATIO
EMPLOYMENTDENSITY
POPULATIONDENSITY
LOCALFACILITIES
NEIGHBOUR-HOOD TYPE
POPULATIONSIZE
Figure 4. Interactions between land use characteristics
The ability to relate travel behaviour with particular neighbourhood or network types isproblematic. For a start, the terminology used is not standard, leading to use of descriptionsof neighbourhoods or street patterns which may be ambiguous or otherwise not easilyinterpretable. Terms such as ‘clear’ or ‘coherent’ or ‘connected street networks’ are used tocharacterise street pattern, but their precise meaning is not always clear (Marshall, 1998).The Transport Research Board (TRB) Report on Transit and Urban Form notes that it is‘difficult to sort out the effects of land use mix and urban design because they are stronglycorrelated with density’, stating that density has the ‘dominant influence on transit use’(TRB, 1996). The TRB findings suggest that once density is taken into account, urban designmeasures generally do not add much explanatory power. This is attributed to the way inwhich density is characterised as a metric scale ranging over large values, and therefore has a‘natural predictive advantage’ over other variables of urban design which use a nominal scaleor ranking scale.Ewing (1996) sums up the problem: ‘Urban design characteristics may appear insignificantwhen tested individually, but quite significant when combined into an overall ‘pedestrian-friendliness’ measure. Conversely, urban design characteristics may appear significant whenthey are tested alone, but insignificant when tested in combination’. While network type maynot influence travel behaviour per se, network form can affect other factors such as coverage

Dominic Stead and Stephen Marshall 135
of transit routes (Ewing, 1996) or the directness of access paths to public transport routes andstops (Marshall, 2001b).With more analysis of disaggregated data it might be possible to isolate effects of networktype. Ewing (1996) notes the lack of previous multivariate studies which tested urban designvariables, and the absence of any testing road network variables per se. Neighbourhood typeis effectively an aggregate variable that incorporates network type and other urban formvariables. Network type, nested within the concept of neighbourhood type, is also to someextent a composite variable. Since there are no standard definitions of these it is difficult todraw generalised conclusions about their effects on travel behaviour.Results from Kitamura et al. (1994) suggest that a ‘place variable, which symbolises avariety of difficult-to-measure urban design attributes, is a significant source of explanatorypower for transit trip generation’ [emphasis added]. The TRB (1996) notes that ‘... thebundle of attributes that makes for a successful pedestrian and transit-friendly station area orneighborhood is difficult to break apart through statistical means...’ [emphasis added], andstates that ‘… the influence of neighborhood design is particularly problematic to evaluate’.This is illustrated by the observation that the neighbourhood characteristics of Americancities tend to equate with particular aggregated types. For example, compact neighbourhoods‘tend to have more varied land uses, average shorter block lengths, narrower streets, moregrid-like street patterns, continuous sidewalk networks, and so on’ (TRB, 1996). Ewing(1996) notes the degree of inter-relatedness of variables such as higher densities, finer landuse mixes and gridded streets. While this may allow reasonable deductions to be made abouttravel behaviour in existing neighbourhoods (dense traditional neighbourhoods beingequated with relatively high transit use, for example), this is not sufficient for predicting theeffects of new development forms which may only have some, or have differentcombinations of, these attributes. Accordingly, these findings would suggest that there is aneed to find a wider range of examples to study, which do not follow the ‘typical’characteristics like those noted above. By doing so it may be possible to obtain a moredetailed picture of the effects of different urban form variables on travel behaviour.
4.3 Interpretation of the results
There is considerable variation between individual definitions of neighbourhood types, andmuch scope for ambiguity and overlap between extremes of ‘suburban/auto’ and‘traditional/transit’ types. As well as the composite nature of ‘neighbourhood type’,definitions are not always used consistently, such that different names may be used todescribe the same feature, or the same names may be used to account for different embeddedvariables. In many cases the criteria used are subjective such that two different investigators,using the same criteria, could come up with different designations for a particular area. ‘Neotraditional’ may be taken to imply both ‘griddiness’ and density and mixed use. Secondly,griddiness or grain is not explicitly or uniquely defined. Density may be expressed in variousways but, at least, the particular way in any particular case is usually unambiguously defined.Therefore it is necessary to be cautious when interpreting results based on neighbourhoodtype. This is especially important where the neighbourhood type might include some othermajor indicator of urban form such as density, which may be used to characterise the area ofstudy. The studies reported on in Cervero (1996b) and Cervero and Gorham (1995) are rareexamples of unambiguous specification of both neighbourhood and network type. Ideally,

136 The Relationships between Urban Form and Travel Patterns
more detailed investigations into network type need to be undertaken in order to clarify itsrelationship with travel behaviour.It has been shown that there are links between socio-economic characteristics and travelpatterns, as well as between land use characteristics and travel patterns. It is clearly importantthat the effect of land use and socio-economic characteristics are differentiated in theinterpretation of results. Kitamura et al. (1997) conclude that attitudes may be more stronglyassociated with travel patterns than land use characteristics, and suggest that land usepolicies associated with more sustainable travel patterns may not significantly alter traveldemand unless attitudes are also changed.
5. Conclusions
The review has shown that there is a large amount of literature from around the world on therelationships between urban form and travel characteristics. Much of the evidence containedin the review originates in either Western Europe or the United States. Many of these studiesfind that urban form characteristics, ranging from regional to local in scale, have an influenceon travel patterns and consequently the environmental impacts of transport.This review has explicitly categorised the literature according to discrete aspects of urbanform and travel patterns (albeit at the risk of debate over the choice of categories), whichallows for clearer identification of the similarities and differences between studies. However,it is recognised that there is no definitive way of deciding the categories: definitions may beoverlapping or nested within each other and the significance of each variable is likely todepend on context.The critique of these studies has suggested that a number of issues must be taken intoaccount when drawing any conclusions for policy. These issues include the strength of theevidence, the transferability of findings (whether findings in one country apply to another forexample), the scale of analysis (regional, urban or neighbourhood and so on) and thecausality of relationships. The interactions between socio-economic factors, urban form andtravel patterns add further complication to the analysis of relationships between land use andtravel characteristics. This issue has not been well explored to date, although more studiesare now recognising interactions between socio-economic factors, urban form and travelpatterns in their design (see also Stead et al., 2000; Stead, 2001).So the extent to which urban form might influence travel patterns may be lower thanprevious studies have indicated (where they have not taken socio-economic characteristicsinto account). However, this does not mean that urban planning does not have an importantrole to play in helping to achieve more sustainable travel patterns. Planning policies caninfluence transport supply and parking as well as the distribution of land uses, and henceprovide a way of influencing travel demand and/or modal choice ‘at source’. Furthermore,combinations of several land use measures may have significant effects on travel by creatingsynergies between measures, and land use policies may be complemented by the effects ofother, non-land use measures (see Stead, 1999; Stead, 2000). In other words, urban planningis well placed to co-ordinate the variety of factors which individually and collectively areable to influence more sustainable travel patterns.

Dominic Stead and Stephen Marshall 137
Acknowledgments
The authors wish to thank the UK Engineering and Physical Sciences Research Council(EPSRC) who funded the studies that form the basis of this paper.
References
Aldous, T. (1992) Urban Villages. Urban Villages Group, London.
Baker, B. (1995) The role of neighbourhood land use design in influencing transportationactivity. Transportation Planning Systems,Vol. 3, No. 1, pp. 53-74.
Balcombe, R.J. and York, I.O. (1993) The Future of Residential Parking. Transport ResearchLaboratory Report, Crowthorne.
Banister, D. (1996) Energy, quality of life and the environment: the role of transport.Transport Reviews, Vol. 16, No. 1, pp. 23-35.
Banister, D. and Marshall, S. (2000) Encouraging Transport Alternatives: Good Practice inReducing Travel. The Stationery Office, London.
Banister, D.; Watson, S. and Wood C. (1997) Sustainable cities, transport, energy, and urbanform. Environment and Planning B: Planning and Design, Vol. 24, No. 1, pp. 125-143.
Barton, H.; Davies, G. and Guise, R, (1995) Sustainable Settlements – A Guide for Planners,Designers and Developers. Local Government Management Board, Luton.
Berman, M.A. (1996) The transportation effects of neo-traditional development. Journal ofPlanning Literature,Vol. 10, No. 4, pp. 347-363.
Breheny, M. (1995) Counterurbanisation and sustainable urban forms. In: Brotchie, J.; Batty,M.; Blakely, E.; Hall, P. and Newton, P. (eds.). Cities in Competition. Productive andsustainable cities for the 21st century. Longman Australia Pty Ltd., Melbourne. pp. 402-429.
Calthorpe, P. (1993). The Next American Metropolis: Ecology, Community and the AmericanDream. New York: Princeton Architectural Press.
Cervero, R. (1989) Jobs-housing balancing and regional mobility. Journal of the AmericanPlanning Association, Vol. 55, No. 2, pp. 136-150.
Cervero, R. (1994) Transit-based housing in California: evidence on ridership impacts.Transport Policy, Vol. 1, No. 3, pp. 174-183.
Cervero, R. (1996a) Jobs-housing balancing revisited. Journal of the American PlanningAssociation, Vol. 62, No. 4, pp.492-511.
Cervero, R. (1996b) Traditional neighborhoods and commuting in the San Francisco Bayarea. Transportation, Vol. 23, pp. 373-394.
Cervero, R. and Gorham, R (1995) Commuting in transit versus automobile neighborhoods.Journal of the American Planning Association, Vol. 61, No. 2.
Cervero, R. and Kockelman, K (1997) Travel demand and the 3Ds. Transportation ResearchPart D – Transport and Environment, Vol. 2, No. 3, pp. 199-219.
138 The Relationships between Urban Form and Travel Patterns
Cervero, R. and Landis, J. (1992) Suburbanisation of jobs and the journey to work: asubmarket analysis of commuting in the San Francisco Bay area. Journal of AdvancedTransportation, Vol. 26, No. 3, pp.275-297.
Crane, R. (2000) The Influence of Urban Form on Travel: An Interpretive Review. Journalof Planning Literature, Vol. 15, No. 1, pp. 3-23.
Crane, R. and Crepeau, R. (1998) Does neighborhood design influence travel? A behavioralanalysis of travel diary and GIS data. Transportation Research Part D – Transport andEnvironment, Vol. 3, No. 4, pp. 225-238.
Curtis, C. (1995) Reducing the need to travel: strategic housing location and travelbehaviour. In: Earp, J.H.; Headicar, P.; Banister, D. and Curtis, C. Reducing the need totravel: some thoughts on PPG13. Oxford Planning Monographs, Vol. 1, No. 2, pp. 29-47.
Damm, D. (1981) Theory and empirical results: a comparison of recent activity-basedresearch. In: Jones, P. and Carpenter, S. (eds.). Recent Advances in Travel Demand Analysis.Gower, Aldershot. pp. 3-33.
Department of Environment, Transport and the Regions (1999) National Travel Survey1996/98. The Stationery Office, London.
Dunphy, R.T. and Fisher, K. (1996) Transportation, congestion, and density: new insights.Transportation Research Record, Vol. 1552, pp. 89-96.
ECOTEC (1993) Reducing transport emissions through land use planning. HMSO, London.
Ewing, R. (1995) Beyond density, mode choice, and single trips. Transportation Quarterly,Vol. 49, No. 4, pp. 15-24.
Ewing, R. (1996) Pedestrian- and Transit-Friendly Design. Report prepared for the PublicTransit Office, Florida Department of Transportation.
Ewing, R.; DeAnna, M. and Li, S-C. (1996) Land use impacts on trip generation rates.Transportation Research Record, Vol. 1518, pp. 1-6.
Farthing, S.; Winter, J. and Coombes, T. (1997) Travel behaviour and local accessibility toservices and facilities. In: Jenks, M.; Burton, E. and Williams, K. (eds.). The compact city. Asustainable urban form? E. and F.N. Spon, London. pp. 181-189.
Flannelly, K.J. and McLeod, M.S. (1989) A multivariate analysis of socioeconomic andattitudinal factors predicting commuters’ mode of travel. Bulletin of the PsychonomicSociety, Vol. 27, No. 1, pp. 64-66.
Fleming, R. and Pund, G. (1994) The impact of the planning of urban areas on the use andattractiveness of local bus services. Proceedings 17th ARRB Conference, Part 7.
Frank, L. and Pivo, G. (1994) Impacts of mixed use and density on utilization of three modesof travel: single-occupant vehicle, transit, and walking. Transportation Research Record,Vol. 1466, pp. 44-52.
Friedman, B.; Gordon, S. and Peers, J. (1994) Effect of neotraditional neighborhood designon travel characteristics. Transportation Research Record, Vol. 1466, pp. 63-70.

Dominic Stead and Stephen Marshall 139
Giuliano, G. and Small, K. (1993) Is the journey to work explained by urban structure?Urban Studies, Vol. 30, No. 9, pp. 1485-1500.
Gordon, P.; Kumar, A. and Richardson, H.W. (1989a) Congestion, changing metropolitanstructure and city size in the United States. International Regional Science Review, Vol. 12,No. 1, pp. 45-56.
Gordon, P.; Kumar, A. and Richardson, H.W. (1989b) Gender differences in metropolitantravel behaviour. Regional Studies, Vol. 23, No. 6, pp. 499-510.
Gordon, P.; Richardson, H.W. and Jun, M-J. (1991) The commuting paradox: evidence fromthe top twenty. Journal of the American Planning Association, Vol. 57, No. 4, pp. 416-420.
Handy, S. (1992) Regional versus local accessibility. Neotraditional development and itsimplications for non-work travel. Built Environment, Vol. 18, No. 4, pp. 253-267.
Handy, S. (1996) Urban form and pedestrian choices: study of Austin neighborhoods.Transportation Research Record, Vol. 1552, pp. 135-144.
Hanson, S. (1982) The determinants of daily travel-activity patterns: relative location andsociodemographic factors. Urban Geography, Vol. 3, No. 3, pp. 179-202.
Headicar, P. and Curtis, C. (1994) Residential development and car-based travel: doeslocation make a difference? Proceedings of Seminar C – Environmental Issues, 22nd PTRCEuropean Transport Forum, Warwick, September. pp. 117-130.
Hillman M. and Whalley, A. (1983) Energy and personal travel: obstacles to conservation.Policy Studies Institute, London.
Johnston-Anumonwo, I. (1992) The influence of household type on gender differences inwork trip distance. Professional Geographer, Vol. 44, No. 2, pp. 161-169.
Kenworthy, J. and Laube, F. (1999) A global review of energy use in urban transportationsystems and its implications for urban transport and land use policy. TransportationQuarterly, Vol. 53, No. 4, pp. 23-48.
Kitamura, R.; Laidet, L.; Mokhtarian, P.; Buckinger, C. and Gianelli, F. (1994) Mobility andLivable Communities. State of California Air Resource Board.
Kitamura, R.; Mokhtarian, P. and Laidet, L. (1997) A micro-analysis of land use and travelin five neighbourhoods in the San Francisco Bay area. Transportation, Vol. 24, pp. 125-158.
Kockelman, K. (1997) Travel behavior as a function of accessibility, land use mixing, andland use balance – evidence from the San Francisco Bay area. Transportation ResearchRecord, Vol. 1607, pp. 116-125.
Kulash, W. M. (1990) Traditional neighbourhood development: Will traffic work? Paperpresented at the Eleventh International Pedestrian Conference, Bellevue, WA.
Levinson, D.M. and Kumar, A. (1997) Density and the journey to work. Growth andChange, Vol. 28, pp. 147-172.
Maat, C. (2000) Travel reduction ‘built in’: the role of land use planning. In: Banister, D. andMarshall, S., Encouraging Transport Alternatives: Good Practice in Reducing Travel. TheStationery Office, London, pp. 42-51.

140 The Relationships between Urban Form and Travel Patterns
Marshall, S. (1998) Towards the integration of urban transport networks and urban design,Paper presented at the 8th World Conference on Transport Research, Antwerp, Belgium, July1998.
Marshall, S. (2001a) Transport and the design of urban structure, Unpublished PhD Thesis.Bartlett School of Planning, University College London.
Marshall, S. (2001b) Public transport oriented urban design. In: Verhoef, E. and Feitelson, E.(eds.) Transport and Environment: Towards Sustainable Solutions. Edward Elgar,Cheltenham (forthcoming).
Marshall, S. and Banister, D. (2000) Travel reduction strategies: intentions and outcomes.Transportation Research Part A – Policy and Practice. Vol. 34, No. 3, pp. 321-338.
McNally, M. G. and Kulkarni, A. (1997) Assessment of influence of land use–transportationsystem on travel behavior. Transportation Research Record, Vol. 1607, pp. 105-115.
McNally, M. G. and Ryan, S. (1993) A comparative assessment of travel characteristics forneotraditional developments. Transportation Research Record, Vol. 1400, pp. 67-77.
Messenger, T. and Ewing, R. (1996) Transit-oriented development in the sun belt.Transportation Research Record, Vol. 1552, pp. 145-153.
Mogridge, M.J.H. (1985) Transport, land use and energy interaction. Urban Studies, Vol. 22,No. 6, pp. 481-492.
Næss, P. (1993) Transportation energy in Swedish towns and regions. Scandinavian Housingand Planning Research, Vol. 10, No. 4, pp. 187-206.
Næss, P. and Sandberg, S.L. (1996) Workplace location, modal split and energy use forcommuting trips. Urban Studies, Vol. 33, No. 3, pp. 557-580.
Næss, P.; Røe, P.G. and Larsen, S. (1995) Travelling distances, modal split andtransportation energy in thirty residential areas in Oslo. Journal of Environmental Planningand Management, Vol. 38, No. 3, pp. 349-370.
Newman P.W.G. and Kenworthy, J.R. (1989) Cities and automobile dependence. Aninternational sourcebook. Gower Technical, Aldershot.
Newman, P.W.G. and Kenworthy, J.R. (1988) The transport energy trade-off: fuel efficienttraffic versus fuel-efficient cities. Transportation Research, Vol. 22A, No. 3, pp. 163-174.
Newman, P.W.G.; Kenworthy, J.R. and Lyons, T.J. (1985) Transport energy use in the Perthmetropolitan region: some urban policy implications. Urban Policy and Research, Vol. 3,No. 2, pp. 4-15.
Orfeuil, J. and Salomon, I. (1993) Travel patterns of Europeans in everyday life. In:Salomon, I., Bovy, P. and Orfeuil, J. (eds.) A Billion Trips per Day – Tradition andTransition in European Travel Patterns. Kluwer Academic Press, Dordrecht.
Owens, S. (1986) Energy Planning and Urban Form. Pion, London.
Prevedouros, P.D. (1992) Associations of personality characteristics with transport behaviorand residence location decisions. Transportation Research Part A – Policy and Practice,Vol. 26, No. 5, pp. 381-391.

Dominic Stead and Stephen Marshall 141
Prevedouros, P.D. and Schofer, J. (1991) Trip characteristics and travel patterns of suburbanresidents. Transportation Research Record, Vol. 1328, pp. 49-57.
Rutherford, G. S.; McCormack, E. and Wilkinson, M. (1996) Travel Impacts of Urban Form:Implications from an Analysis of Two Seattle Area Travel Diaries. Paper presented at theTravel Improvement Program Conference on Urban Design, Telecommuting and TravelBehavior, Williamsburg VA.
Ryan, S. and McNally, M. G. (1995) Accessibility of neotraditional neighborhoods: a reviewof design concepts, policies, and recent literature. Transportation Research Part A – Policyand Practice, Vol. 29, No. 2, pp. 87-105.
Spence, N. and Frost, M. (1995) Work travel responses to changing workplaces andchanging residences. In: Brotchie, J.; Batty, M.; Blakely, E.; Hall, P. and Newton, P. (eds.)Cities in Competition. Productive and sustainable cities for the 21st century. LongmanAustralia Pty Ltd., Melbourne. pp. 359-381.
Stead, D. (1999) Planning for less travel – identifying land use characteristics associatedwith more sustainable travel patterns. Unpublished PhD Thesis, Bartlett School of Planning,University College London, London.
Stead, D. (2000) Unsustainable Settlements. In: Barton, H. (ed.). Sustainable Communities.The Potential for Eco-Neighbourhoods. Earthscan, London, pp.29-45.
Stead, D. (2001) Relationships between land use, socio-economic factors and travel patternsin Britain. Environment and Planning B, Vol. 28, No 4, pp. 499-528.
Stead, D.; Titheridge, H. and Williams, J. (2000) Land use, transport and people –identifying the connections. In: Jenks, M.; Burton, E. and Williams, K. (eds.). AchievingSustainable Urban Form. E. and F.N. Spon, London, pp.174-186.
Transportation Research Board (1996) TCRP Report 16: Transit and Urban Form. NationalAcademy Press, Washington DC.
Troy, P.N. (1992) Let’s look at that again. Urban Policy and Research, Vol. 10, No. 1, pp.41-49.
Valleley, M.; Jones, P.; Wofinden, D. and Flack, S. (1997) The role of parking standards insustainable development. Proceedings of Seminar C – Policy, Planning and Sustainability,25th PTRC European Transport Forum, Uxbridge, September. pp. 393-411.
Webster, F.V.; Bly, P.H. and Paulley, N.J. (1988) Urban Land-Use and TransportInteraction: Policies and Models. Gower, Aldershot.
Wegener, M. (1994) Operational urban models: state of the art. Journal of the AmericanPlanning Association, Vol. 60, No. 1, pp. 17-29.
Wilson, A.G. (1998) Land-use/transport interaction models: past and future. Journal ofTransport Economics and Policy, Vol. 32, No. 1, pp. 3-27.
Winter, J. and Farthing, S. (1997) Coordinating facility provision and new housingdevelopment: impacts on car and local facility use. In: Farthing, S.M. (ed.) Evaluating LocalEnvironmental Policy. Avebury, Aldershot, pp. 159-179.


Mainports as Integrators of Passenger, Freight andInformation Networks. From Transport Nodes toBusiness Generators; the Dutch Case
Hugo Priemus1
OTB Research Institute for Housing, Urban and Mobility StudiesDelft University of TechnologyDelftThe NetherlandsE-mail: [email protected]
EJTIR, 1, no. 2 (2001), pp. 143 - 167
Received: February 2001Accepted: July 2001
In the process of increasing globalization, mainports play an important role. A number ofgateways have emerged as transport nodes in the networks of air and sea routes which criss-cross the globe. Here, millions of travellers are transferred and millions of tonnes of freightare transhipped. Both Japan and the Netherlands play an important part in these ‘hub andspoke’ networks.In this contribution we will deal with the dynamics of mainports in general, and morespecifically with the mainports of the Netherlands. Our argument is that their function goesfar beyond that of infrastructure, transport and logistics. Although they started out astransport nodes, the mainports in the Netherlands are now evolving into fully fledgedbusiness generators. The economic function of mainports will be strengthened by integratingmainport and brainport functions. It will be further reinforced by seizing the opportunity tocombine the traditional mainport functions. This will involve connecting airlines with roadand rail transport networks, connecting ocean shipping with inland shipping, cargo trains,trucks and pipelines and connecting transport nodes with an infrastructural node of ICT(information and communications technology) networks. For the Randstad Holland (theNetherlands’ economic heartland in the west), we conclude that a stronger integration ofgateway Rotterdam and mainport Amsterdam Schiphol could be considered. This could beachieved not only by strengthening their transport infrastructure, but first and foremost byplanning, developing and integrating the ICT mainport functions.
1 Paper presented at the 8th ITPS Symposium of the Institute for Transport Policy Studies, in collaboration with
TRAIL Research School, Tokyo, 10 October 2000, in commemoration of 400 years economic relationsbetween Japan and The Netherlands
144 Mainports as Integrators of Passenger, Freight and Information Networks
1. Introduction
In the process of increasing globalization, mainports play an important role both forpassengers and freight. In the networks of air and sea routes which criss-cross the globe, anumber of gateways have emerged as transport nodes where millions of travellers aretransferred and millions of tonnes of freight is transhipped.In this contribution we will deal with the dynamics of mainports in general, and morespecifically with the mainports of the Netherlands. Our argument is that their function goesfar beyond that of infrastructure, transport and logistics. Initially serving as transport nodes,the mainports in the Netherlands are evolving into fully fledged business generators. Theeconomic function of mainports will be strengthened by integrating mainport and brainportfunctions. It will be further reinforced by seizing the opportunity to combine the traditionalmainport functions. This will involve connecting airlines with road and rail transportnetworks, connecting ocean shipping with inland shipping, cargo trains, trucks and pipelinesand connecting transport nodes with an infrastructure node of ICT networks. As regards theRandstad Holland (the Netherlands’ economic heartland in the west), we can furtherconclude that a stronger integration between gateway Rotterdam and mainport AmsterdamSchiphol could be considered. This could be achieved not only by strengthening theirtransport infrastructure, but first by planning, developing and integrating the ICT mainportfunctions.Intercontinental transport chains connect mainports like Tokyo and Rotterdam (Section 2) bysea, land and air. In Section 3 we give a brief quantitative overview of the performance ofAmsterdam Airport Schiphol and mainport Rotterdam. Section 4 characterizes mainports aslinks between regional economic clusters and international networks. In Section 5 weintroduce five functions of mainports in general. Section 6 deals with the infrastructure ofnetworks and nodes in the new economy. We give an inventory of the development of ICTinfrastructures in the Netherlands.Finally, we present some conclusions and recommendations in Section 7.
2. Intercontinental transport chains
Mainports are connected by world-wide intercontinental networks. This can be illustrated bythe container routes between Southeast Asia, Europe and America. Figure 1 depicts the maincontainer routes between Tokyo and Rotterdam (Dutch Ministry of Housing, SpatialPlanning and the Environment, 1997: 9-10).Maritime transport between European ports and overseas destinations totals about 1.5 billiontonnes per year. Sooner or later the vast majority of unloaded goods will either be placed onanother ship or carried from the ports to their hinterland by truck, rail, barge or pipeline.Continental shipments total about 9 billion tonnes per annum, more than 50% of which islocal transport. This implies that maritime flows between ports and their hinterlandsrepresent around 30% of the interregional (non-local) transport volume in Europe. Thisconsiderable share is reflected in the enormous organizational and physical efforts requiredto facilitate such flows of freight through transport chains.

Hugo Priemus 145
The number of possible routes along which the flows can travel is unexpectedly high. Thechoice between alternative transport chains is always governed by cost, time and quality.Consider the example of a container shipped from Tokyo to Rotterdam (Figure1). In Japan, the container will go by lorry or rail from its original location to one of the mainharbours. If the plant is not located on Honshu, but on one of the smaller islands, anadditional short-sea trip may prove necessary. For centuries, a subsequent long open oceanvoyage was unavoidable: the Pacific Ocean, the Indian Ocean, around the Cape of GoodHope and then north towards Europe. The situation first improved in 1869 with the opening(or rather reopening since Roman times) of the Suez Canal and in 1914, almost half a centurylater, with the opening of the Panama Canal. These two major shortcuts meant that the longersouthbound routes were only used for triangular journeys.
Source: Ministry of Housing, Spatial Planning and the Environment, 1997: 9.
Figure 1. Example of container routes between Tokyo and Rotterdam
The next important technical improvement in the area of transhipment has come about in thelast three decades: the containerization of load units. The relative cost of transhipment andinland transport (double-stack container trains in the US) has decreased considerablycompared to the cost of long sea journeys. This new cost relationship has brought about amajor geographic reorientation of transport flows.The most famous case is the North American land bridge, across Canada and the USA. ThePanama Canal can not accommodate ships carrying more than 4,000 boxes (the so-called“Panamax” size), and smaller ships are restricted to daylight sailings. It is therefore cheaper,and sometimes faster, to unload a container from Japan on the US West Coast, betweenVancouver and Long Beach (Los Angeles), place it on the double-stack container train to theEast Coast, and then reload it onto another ship bound for Rotterdam.Last, but not necessarily least, there is the Transiberian route. Here, the maritime leg is rathershort, and the land leg or legs quite long. From Japan to Rotterdam the sea distance is around21,500 kilometres taking 35 days. Using a rail connection via Russia shortens the distance to14,000 kilometres and the time to 24 days. Its development as a viable alternative has been

146 Mainports as Integrators of Passenger, Freight and Information Networks
held up by various difficulties. If conditions improve, however, this route could develop stillfurther. This would have major repercussions for European ports.As a result of the competition between chains, port competition has also increased – to thebenefit of shippers and shipping lines. The situation has become rather volatile, smallchanges in supply or demand may lead to relatively large shifts of traffic from one port orroute to another.
3. Performances of Amsterdam Airport Schiphol and MainportRotterdam
The growth of Amsterdam Airport Schiphol since 1980 and especially since 1990 has beenspectacular: the number of passengers increased 5.6% on average in the 1980s, and 9.7% inthe period from 1990 to 1998. Even more spectacular was the increase in the number oftransfer passengers, with an annual growth of 15.9% in the period from 1990 to 1998. Onaverage, air cargo increased by 6.6% from 1980 to 1990 and by 8.6% from 1990 to 1998.The growth in aircraft movements also accelerated in the 1990s. From 1980 to 1990 thisfigure was 3.4%. This increased to an average of 8.1% in the period from 1990 to 1998.
Table 1 Development of traffic and transport at Amsterdam Airport Schiphol in theperiod 1990-1998
1990 1995 1998 Annual growth in %1990-1998
Total passenger (mln) 16.2 24.9 34.0 9.7Transfer passengers (mln) 4.4 9.6 14.3 15.9Cargo (ton) 604,000 978,000 1,171,000 8.6Aircraft movements 202,000 291,000 377,000 8.1
Source: Amsterdam Airport Schiphol; Ministry of Transport, Public Works and Water Management, 2000:11.
The accessibility of Amsterdam Airport Schiphol improved considerably in the period from1990 to 1998. The number of destinations increased by 4.3% annually. The weekly frequencyfor each destination increased by 8.6% annually in the same period. These figures are morefavourable than those for most other West European mainports (Table 2).
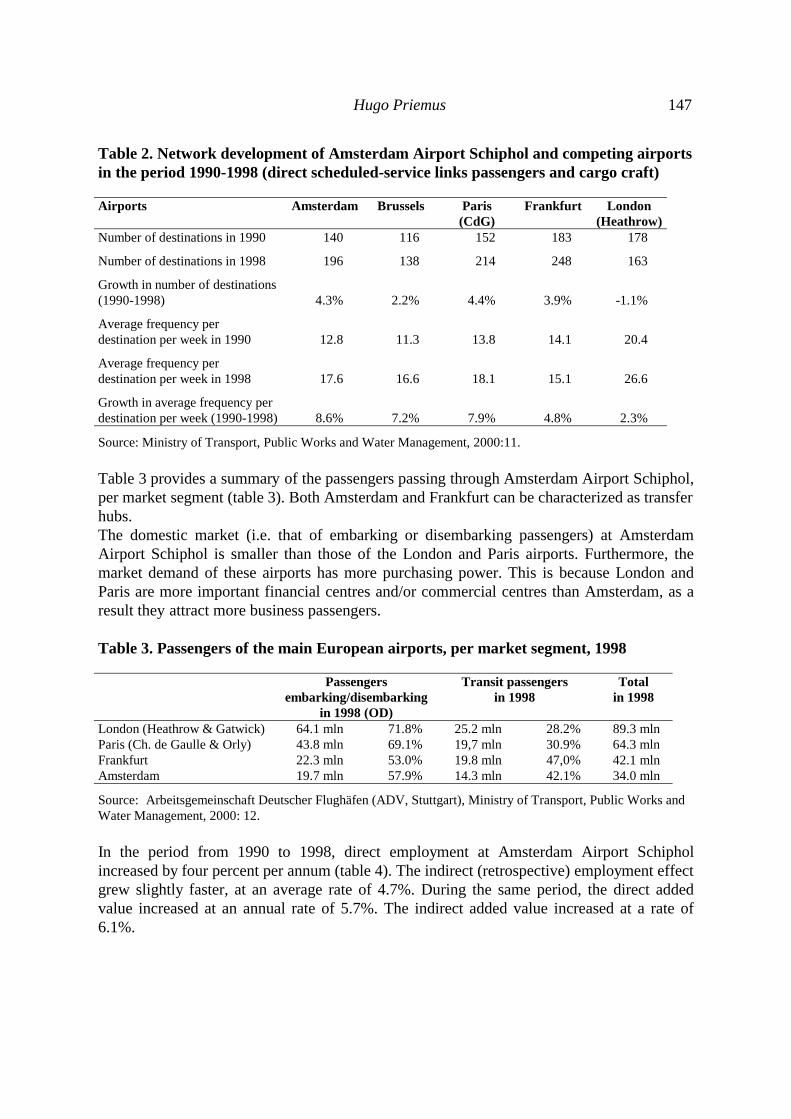
Hugo Priemus 147
Table 2. Network development of Amsterdam Airport Schiphol and competing airportsin the period 1990-1998 (direct scheduled-service links passengers and cargo craft)
Airports Amsterdam Brussels Paris(CdG)
Frankfurt London(Heathrow)
Number of destinations in 1990 140 116 152 183 178
Number of destinations in 1998 196 138 214 248 163
Growth in number of destinations(1990-1998) 4.3% 2.2% 4.4% 3.9% -1.1%
Average frequency perdestination per week in 1990 12.8 11.3 13.8 14.1 20.4
Average frequency perdestination per week in 1998 17.6 16.6 18.1 15.1 26.6
Growth in average frequency perdestination per week (1990-1998) 8.6% 7.2% 7.9% 4.8% 2.3%
Source: Ministry of Transport, Public Works and Water Management, 2000:11.
Table 3 provides a summary of the passengers passing through Amsterdam Airport Schiphol,per market segment (table 3). Both Amsterdam and Frankfurt can be characterized as transferhubs.The domestic market (i.e. that of embarking or disembarking passengers) at AmsterdamAirport Schiphol is smaller than those of the London and Paris airports. Furthermore, themarket demand of these airports has more purchasing power. This is because London andParis are more important financial centres and/or commercial centres than Amsterdam, as aresult they attract more business passengers.
Table 3. Passengers of the main European airports, per market segment, 1998
Passengersembarking/disembarking
in 1998 (OD)
Transit passengersin 1998
Totalin 1998
London (Heathrow & Gatwick) 64.1 mln 71.8% 25.2 mln 28.2% 89.3 mlnParis (Ch. de Gaulle & Orly) 43.8 mln 69.1% 19,7 mln 30.9% 64.3 mlnFrankfurt 22.3 mln 53.0% 19.8 mln 47,0% 42.1 mlnAmsterdam 19.7 mln 57.9% 14.3 mln 42.1% 34.0 mln
Source: Arbeitsgemeinschaft Deutscher Flughäfen (ADV, Stuttgart), Ministry of Transport, Public Works andWater Management, 2000: 12.
In the period from 1990 to 1998, direct employment at Amsterdam Airport Schipholincreased by four percent per annum (table 4). The indirect (retrospective) employment effectgrew slightly faster, at an average rate of 4.7%. During the same period, the direct addedvalue increased at an annual rate of 5.7%. The indirect added value increased at a rate of6.1%.

148 Mainports as Integrators of Passenger, Freight and Information Networks
Table 4. Employment and added value at the mainport Amsterdam Schiphol, 1990-1998
1990 1995 1998 Average annual growth(%) 1990-1998
Direct employment(individuals employed) 38 000 43 000 52 000 4.0
Indirect 'retrospective' employment(individuals employed) 18 000 21 000 26 000 4.7Direct added value(NLG billion) 3.8 5.3 5.9 5.7
Indirect 'retrospective' added value(NLG billion) 1.5 1.9 2.4 6.1
Source: Netherlands Institute of Economics (NEI): Tussenbalans Economische Effecten Schiphol (Mid-termreview of the economic effects of Schiphol).Ministry of Economic Affairs: Nota Ruimtelijk Economisch Beleid (Regional and Economic Policy Document)June 1999c, The Hague (Ministerie van EZ).
The rapid growth of Amsterdam Airport Schiphol imposed ever greater environmentalproblems on its immediate surroundings. Although the number of dwellings experiencingnoise nuisance decreased by an average of 3.8% per annum between 1990 and 1998 (table 5),the number of complaints regarding noise nuisance increased markedly (17.4% per annum),partly as a result of the increase in night flights (1.5% per annum).The numbers of takeoffs and landings by noisy aircraft declined rapidly, at an average rate of25.9% per annum. The net effect of increased growth has been to greatly intensify the debateconcerning the environmental effects of Amsterdam Airport Schiphol. The central issue ishow long can the airport continue to grow at its present site. One alternative option is thecreation of an airport island in the North Sea, linked to the mainland by rapid transitcapsules.The environmental aspects of mainports development are crucial but fall outside the scope ofthis contribution.
Table 5. Development of noise indicators at Amsterdam Airport Schiphol, 1990-1998
1990 1995 1998 Average annualgrowth (%)1990-1998
Dwellings experiencing noisenuisance within the 35Ke contour 13,900 17,000 10,200 -3.8
Takeoffs and landings by H2 aircraft 55,000 33,000 5,000 -25.9
Night flights between 23.00 and06.00 12,248 12,171 13,813 1.5
Number of complaints about noisenuisance 55,000 113,000 198,000 17.4
Source: Amsterdam Airport Schiphol; Ministry of Transport, Public Works and Water Management, 2000:16.

Hugo Priemus 149
The seaport of Rotterdam has not grown as rapidly as Amsterdam Airport Schiphol.Furthermore, it has grown much less rapidly than the major seaports of Southeast Asia andvarious competing seaports in Europe.Table 6 provides an overview of the largest European container ports in 1975, 1985, 1996and 1997 in terms of container transfer, measured in TEU (Notteboom & Winkelmans, 1998:382).
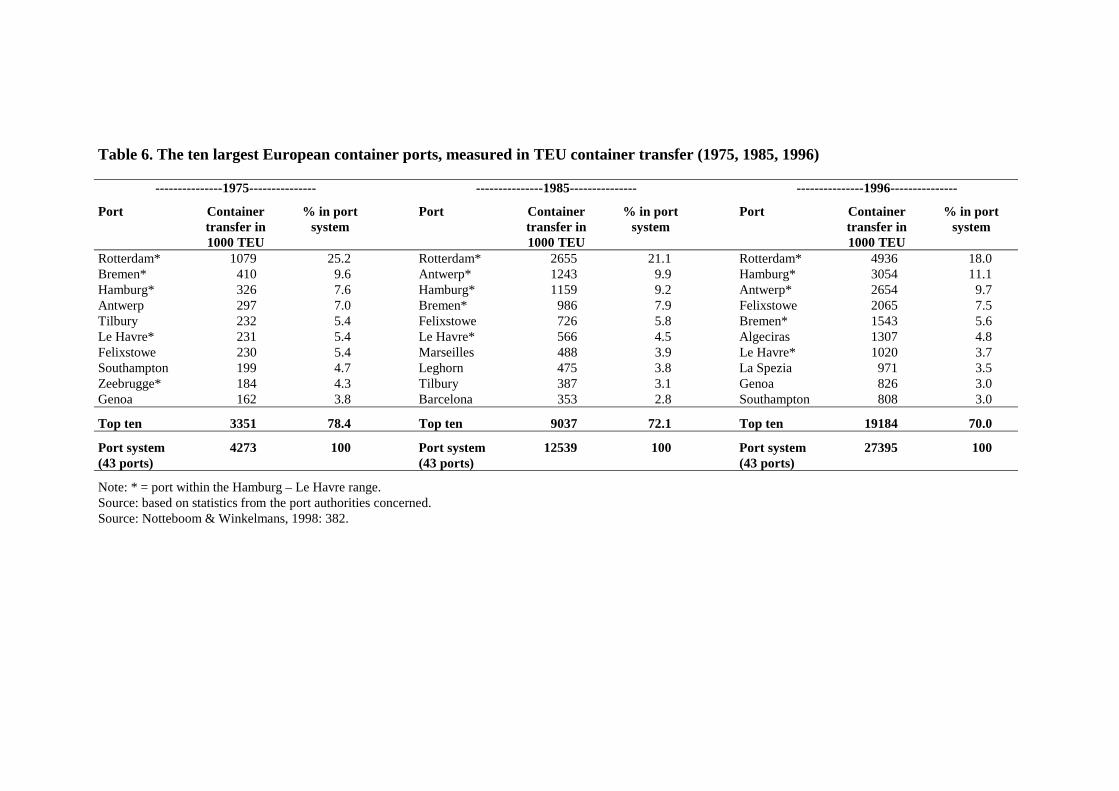
Table 6. The ten largest European container ports, measured in TEU container transfer (1975, 1985, 1996)
---------------1975--------------- ---------------1985--------------- ---------------1996---------------
Port Containertransfer in1000 TEU
% in portsystem
Port Containertransfer in1000 TEU
% in portsystem
Port Containertransfer in1000 TEU
% in portsystem
Rotterdam* 1079 25.2 Rotterdam* 2655 21.1 Rotterdam* 4936 18.0Bremen* 410 9.6 Antwerp* 1243 9.9 Hamburg* 3054 11.1Hamburg* 326 7.6 Hamburg* 1159 9.2 Antwerp* 2654 9.7Antwerp 297 7.0 Bremen* 986 7.9 Felixstowe 2065 7.5Tilbury 232 5.4 Felixstowe 726 5.8 Bremen* 1543 5.6Le Havre* 231 5.4 Le Havre* 566 4.5 Algeciras 1307 4.8Felixstowe 230 5.4 Marseilles 488 3.9 Le Havre* 1020 3.7Southampton 199 4.7 Leghorn 475 3.8 La Spezia 971 3.5Zeebrugge* 184 4.3 Tilbury 387 3.1 Genoa 826 3.0Genoa 162 3.8 Barcelona 353 2.8 Southampton 808 3.0
Top ten 3351 78.4 Top ten 9037 72.1 Top ten 19184 70.0
Port system(43 ports)
4273 100 Port system(43 ports)
12539 100 Port system(43 ports)
27395 100
Note: * = port within the Hamburg – Le Havre range.Source: based on statistics from the port authorities concerned.Source: Notteboom & Winkelmans, 1998: 382.
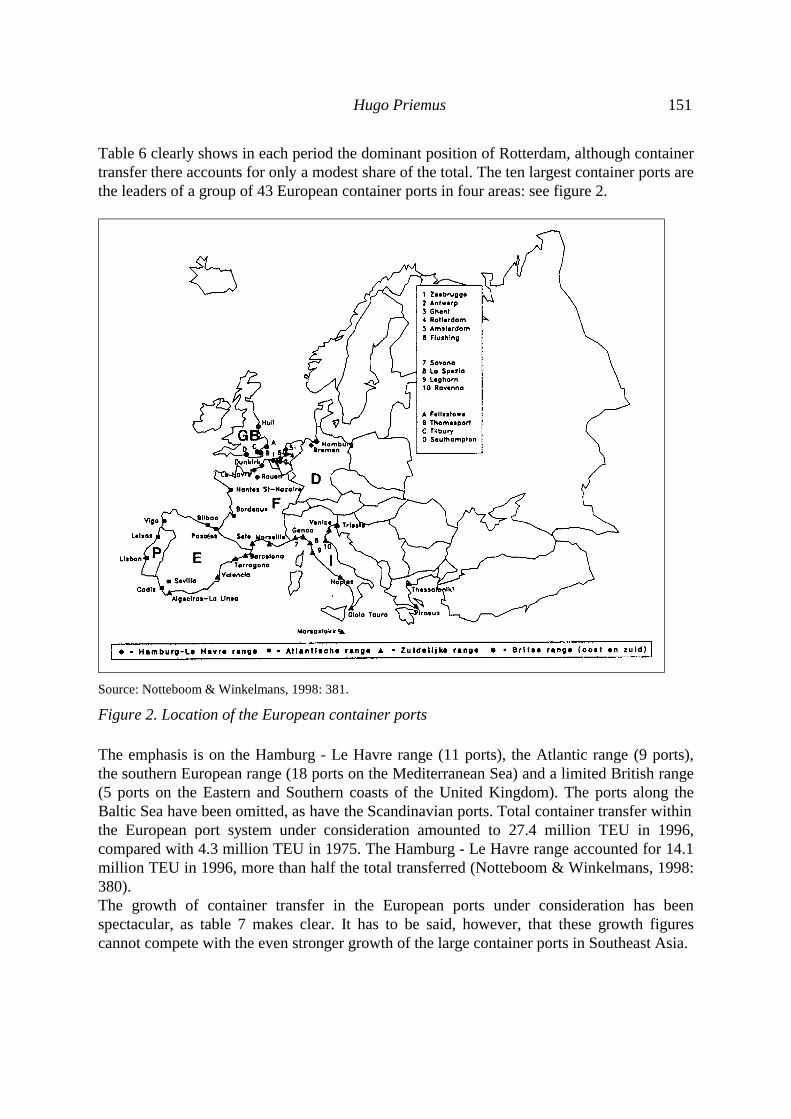
Hugo Priemus 151
Table 6 clearly shows in each period the dominant position of Rotterdam, although containertransfer there accounts for only a modest share of the total. The ten largest container ports arethe leaders of a group of 43 European container ports in four areas: see figure 2.
Source: Notteboom & Winkelmans, 1998: 381.
Figure 2. Location of the European container ports
The emphasis is on the Hamburg - Le Havre range (11 ports), the Atlantic range (9 ports),the southern European range (18 ports on the Mediterranean Sea) and a limited British range(5 ports on the Eastern and Southern coasts of the United Kingdom). The ports along theBaltic Sea have been omitted, as have the Scandinavian ports. Total container transfer withinthe European port system under consideration amounted to 27.4 million TEU in 1996,compared with 4.3 million TEU in 1975. The Hamburg - Le Havre range accounted for 14.1million TEU in 1996, more than half the total transferred (Notteboom & Winkelmans, 1998:380).The growth of container transfer in the European ports under consideration has beenspectacular, as table 7 makes clear. It has to be said, however, that these growth figurescannot compete with the even stronger growth of the large container ports in Southeast Asia.

152 Mainports as Integrators of Passenger, Freight and Information Networks
Table 7. Average annual growth of container transfer in 43 European container portsthroughout five separate periods between 1975 and 1996
Period Annual growth of container transferin 1000 TEU As a percentage
1975-1982 834 13.101982-1987 770 6.661987-1991 1121 7.211991-1994 1509 7.591994-1996 2212 9.21
Source: Notteboom & Winkelmans, 1998: 384.
Within the European system of container ports, Rotterdam’s market share decreased from25.2% in 1975 to 18.0% in 1996.Table 8 illustrates that the transhipment of containers at Rotterdam (45.7 million tons in1993) has a dominant share of the mixed cargo sector (63.9 million tons in 1993). It alsoshows that container transhipment still only accounted for a modest share of the totaltranshipment of 282.2 million tons in 1993. Traditionally, wet and dry bulk commodities hada large market share at Rotterdam. This all serves to give Mainport Rotterdam its rathertraditional image. In financial terms, the added value associated with the transport andtranshipment of bulk goods is somewhat limited, there has only been modest growth in thesetypes of freight and the environmental effects associate with the transport of bulk goods arerelatively detrimental.
Table 8. Transhipment by type of goods in the port of Rotterdam, from 1990 to 1993 (inmillion tons gross weight)
1990 1991 1992 1993*
Agribulk 20.3 17.9 16.8 17.3Ores and scrap 41.8 42.7 40.8 38.1Coal 21.4 23.7 23.0 19.5Other bulk goods, dry 11.5 7.9 7.1 8.3Total bulk goods, dry 95.0 92.2 87.7 83.2
Crude oil 88.5 96.6 102.3 97.2Petroleum products andpetcokes
29.3 25.2 20.4 20.2
Other bulk goods, wet 16.7 18.1 19.3 17.6Total bulk goods, wet 134.5 139.9 142.0 135.0Total bulk goods 229.5 232.2 229.7 218.3
Roll-on-Roll-off 7.3 7.1 7.2 7.2Containers, flats 39.3 40.3 44.3 45.7Other mixed cargo 11.7 12.5 12.2 11.0Total mixed cargo 58.3 59.9 63.7 63.9
Total 287.8 292.0 293.4 282.2* Provisional figures.Source: Rotterdam Port Authority, 1994, in: Priemus, Konings & Kreutzberger, 1995: 127.

Hugo Priemus 153
Figure 3 is a summary of industrial sites in and around the mainport of Rotterdam. Rijnmondhas the greatest concentration of industrial sites in the Netherlands. A strip ofland to the south of the Nieuwe Waterweg (New Waterway) is almost entirely used forindustrial sites. There is generally no room for new initiatives in this area. It is therefore notsurprising that industrial sites are springing up all along the Nieuwe Waterweg (both in theimmediate vicinity and further away), all of which derive from the mainport role ofRotterdam Rijnmond.
Wet, sea port area
Wet, situated along inland waterways, without quay
Wet, situated along inland waterways, with quay
Dry
Business areas Opportunities for loading and unloading
Source: OTB calculations of IBIS, in: Priemus, Konings & Kreutzberger, 1995: 128.
Figure 3. Companies in and around mainport Rotterdam
With the future in mind, the flow of containers would seem to be of special significance.This is, after all, the most rapidly growing form. Table 6 shows that Rotterdam is by far thelargest container port in Europe (albeit with rather modest growth figures). World-wide, onlyfour other ports are larger than Rotterdam. These are Hong Kong, Singapore, Kaoshiung(Taiwan) and Pusan (South Korea), and all have higher growth figures than Rotterdam.The prognoses presented in August 1990, which were based on Goods Flow Model 6 (GFM6), show that over the next 20 years annual transhipment in the port of Rotterdam willincrease by approximately. 100 million tons to reach almost 400 million tons in 2010

154 Mainports as Integrators of Passenger, Freight and Information Networks
(according to the most optimistic variant). The Rotterdam Port Authority (RPA) wants toanticipate this developments and presents a vision of how the further development ofmainport Rotterdam can be stimulated in cooperation with industry, local governments andother involved parties. This involves the enhancement of industry and commerce on onehand and appropriate compliance with environmental policy by all involved on the other.Some key figures are shown in Table 9.The principal variant, which is based on GFM 6, assumes a rate of economic growthequivalent to the upper estimate of the Central Planning Office, which is slightly less thanthe European Community estimate. By way of comparison, a reference variant has beencalculated, based on the (adverse) assumption that the requisite port sites will not beavailable.
Table 9. Key figures of the 2010 Port Plan of Rotterdam
1990 2010Total transhipment (mln tons) 288 400
Employment in transhipment, storage anddistribution activities (jobs) 12.800 17.800
Direct added value (NLG bln) 10 14
Area required (in hectares) 5.250 6.700
Source: Rotterdam Port Authority, 1991, in: Priemus, Konings & Kreutzberger, 1995: 129.
Since 1990, the actual growth figures for the port of Rotterdam have fallen well short of theprognoses published in 1991.Priority is given now more and more on increasing the added value and the transformation ofthe mainport into a brainport. A brainport is a mainport in which knowledge-intensity hasincreased, as a result of which the added value of transport and logistics has increasedconsiderably.
4. Mainports serving as links between regional economic clusters andinternational networks
The mainports of Rotterdam and Amsterdam Schiphol have an international transportfunction, both for passengers and freight. Whereas Rotterdam is primarily concerned withfreight transport, Amsterdam Airport Schiphol transports both goods and passengers. Bothare vital to the functioning of the Dutch economic clusters. A study carried out by BuckConsultants in 1997, in collaboration with NEI, supported the view that the mainports havean important part to play in the Dutch economy. The study’s authors concluded: ‘Adequatefrequency and quality of transport links with other countries and continents are essentialpreconditions for a very internationally oriented economy. This particularly applies to thedevelopment of international business services, as well as trade and distribution facilities.’

Hugo Priemus 155
4.1 European Distribution Centres
The Netherlands likes to refer to itself as ‘the Gateway to Europe’, a direct reference to thecountry’s logistical and distribution facilities. The Netherlands’ position as market leader inthe field of European Distribution Centres (EDCs), is largely due to the strong positions ofAmsterdam Airport Schiphol and Rotterdam. A study commissioned by the HollandInternational Distribution Council has shown that 57% of the 611 American EDCs are basedin the Netherlands, as are 56% of the 344 Asian EDCs. This market share has grown rapidlyduring the 1990s, from just 40% in 1990 to 55% in 1997 (for American and Japanese EDCs).American EDC companies represent a wide variety of sectors: computers, medicalequipment, office equipment, machinery, the chemical, fashion and textile industries,cosmetics and household items. Japanese EDCs primarily distribute office equipment,chemical products, machinery (heavy equipment), automotive items, consumer electronicsand instruments. Two thirds of the Taiwanese EDCs are active in the computer andelectronics cluster (Ministerie van Economische Zaken, 1999b).Most of the EDCs (53%) are located in the Randstad Holland. Of these, 28% are in theregion of Rotterdam while 26% are situated in and around Amsterdam. The majority ofAmerican companies are based around Amsterdam Airport Schiphol, but most Japanesecompanies have a preference for Rotterdam. This concentration in the west is the result of adevelopment that started in the latter half of the 1980s. This was an increase in the share ofmetropolitan business sites for EDCs due to the popularity of Amsterdam Airport Schiphol.This share has declined in the 1990s as American and Japanese companies have increasinglyopted for sites throughout the connecting corridors in the hinterlands of the Rotterdam andAmsterdam Schiphol mainports. The position of Rotterdam has been most affected by thisdevelopment (Buck Consultants, 1998).
4.2 Economic clusters
A country may contain several economic clusters, each consisting of numerous companiesand industrial sectors forming a critical mass of networks (production, market or expertise).From within the Dutch clusters, the constituent sectors maintain their links with internationalnetworks.In his book, ‘Competitive Advantage of Nations’ (1990) Michael Porter emphasizes theinterweaving of several sectors, companies and centres of expertise to create added value.Porter (1990) argues: ‘A nation’s successful industries are usually linked through verticalrelationships (buyer/supplier) or horizontal relationships’ (common customers, technologychannels, etc). This interweaving occurs through personal contacts, goods flows, informationand individuals with particular expertise. The Dutch mainports are typical links, placeswhere various flows merge. Both the Port of Rotterdam and Amsterdam Airport Schipholserve as links, connecting Dutch clusters to international networks (Technopolis & Dialogic,2000: 12).Figure 4 shows clusters in which the Dutch economy enjoys a pre-eminent position.

156 Mainports as Integrators of Passenger, Freight and Information Networks
Commercialservices
Agriculture/food
Health
Chemistry Industrymaking things
Buildingindustry
Energy
PersonalMulti-media
Ports/transport
Source: Ministerie van Economische Zaken, 1999b.
Figure 4. Dutch economic clusters
In the Netherlands, as elsewhere, clusters have become the object of policy. The Dutchgovernment defines clusters as networks and chains of suppliers, customers and/orindividuals with particular expertise, focusing on the innovative creation of added value.A study commissioned by the Ministry of Economic Affairs (Ministerie van EconomischeZaken, 1999b: 20) emphasized the strategic importance of the mainports for Dutch clusterswithin international networks. Rather than being restricted to a single area or country, entirevalue chains for most products and services are increasingly likely to be spread across allparts of the global economy. The mainports are essential links in these international networksand are critical to the controlling function of the Dutch clusters.
4.3 ICT mainport
The concept of a ‘gateway’ is not restricted to the dimension of transport alone. Increasingly,people refer to the knowledge-intensive brainport. The Gigaport project cited therequirements imposed on an ICT mainport, as part of the mainport of Greater Amsterdam(Ministerie van Economische Zaken, 1999b: 19). The Gigaport project (set up by theMinistry of Economic Affairs, the Ministry of Education, Culture and Science and theMinistry of Transport, Public Works and Water Management), which includes a number ofcompanies and Amsterdam Airport Schiphol, concerns the development of the world’s mostadvanced communications networks.
5. Mainports: five functions
Five distinct functions of mainports can be identified: freight transport node, passengertransport node, cluster magnet, business generator and signboard. Each of these functions is

Hugo Priemus 157
further elaborated in the brief descriptions given below (Ministerie van Economische Zaken,1999b: 23-25).
5.1 The Mainport as ‘Goods node’
This is the classical function of the mainports, the physical transport of goods. Bothmainports play an important part in the transport of goods and can also enhance this withValue Added Logistics services.This function can be subdivided into the following three aspects:
import node for raw materials, materials, components and semi-finished products forDutch production clusters;
goods transit node, with the facility for simple processing within the Netherlands(assembly, packaging, bundling);
export node for semi-finished products and finished products manufactured in theNetherlands.
Factors such as accessibility, connections to the hinterland, intermodality and networkdevelopment, all help to determine the competitive position of the mainports as goods node.
5.2 The Mainport as a ‘Passenger node’
For all clusters the main node for business air traffic is Amsterdam Airport Schiphol, eventhough its importance for some sectors is waning. In this context, the mainport fulfils aprimarily logistic role in giving travellers access to a large number of (mainly foreign)destinations. This involves the transport of:
staff of Dutch companies who are involved in overseas projects, who conductinternational acquisitions, meet with members of the company’s branches abroad, attendinternational conferences, trade fairs or other informative occasions;
staff of foreign companies who have been seconded to the Netherlands, who conductacquisitions in the Netherlands and hand out work assignments, inspect work in progress,visit a subsidiary/parent company and attend trade fairs and conferences that take place inthe Netherlands;
people participating in international meetings and conferences that take place in thevicinity of the mainport.
Amsterdam Airport Schiphol is to be linked to the European high-speed train network, whichfurther enhances its function as a passenger node.
5.3 The Mainport as a ‘Cluster magnet’
The geographical surroundings of the mainports act as a magnet for industries. In somecases, the companies involved tend to display a degree of clustering. This is wherecompanies from the same sector or value chain establish themselves in close proximity toone another in order to gain a competitive advantage. This advantage derives either fromsuch mutual proximity or from the specific advantages offered by the site itself.This initially involves several companies establishing a physical presence in the vicinity ofthe mainport. In addition to activities that are directly associated with the airport (logistics

158 Mainports as Integrators of Passenger, Freight and Information Networks
and distribution), these include companies that are located in the value chains of the variousclusters.The synergism generated by the cluster is further enhanced by the concentration of expertisein the vicinity of the mainports, primarily embodied in the individuals employed in thecluster. Clustering promotes the development of a specialized labour market. Accordingly,for the information technology (IT) cluster, one of the most attractive features of Amsterdam(and other areas of the Randstad Holland) is the presence of a relatively large labour marketfor IT specialists. Process technicians are easier to find in Rotterdam than in other parts ofthe country. Know-how can be exchanged via informal networks, the labour market, links totraining institutes, mutual collaboration and specialized service providers.Two examples of this are the financial cluster that has developed in the southern and south-eastern districts of Amsterdam (‘Zuid’ and ‘Zuidoost’) and the chemical industry cluster thathas established itself in the port of Rotterdam. Expertise is also concentrated in the logisticalknow-how that is associated with the physical flows of goods. This can generate additionalservices such as the tele-auctioning of flowers that have not yet been transported. Thislogistical know-how is partly stored in IT systems. This transforms the mainport into anexpertise node, in the broadest sense of the term. During discussions of such issues, themainport is often referred to as a brainport.Another step in the formation of clusters occurs when specialized resources are shared. Someexamples would be shared services such as Safety, Health and Welfare services, safetyfacilities, distribution channels, pipelines etc.This bundling of activities can also result in the creation of relationships between differentclusters. A large number of (European) head offices are located around the AmsterdamSchiphol mainport. The presence of such large potential customers tends to attract othercompanies, primarily from the service sector. One of the clearest examples of this is theinterweaving of the IT cluster with the head offices of other clusters that have beenestablished in the area.
5.4 The mainport as a ‘Business Generator’
The mainports do much more than simply provide services to industry. Their roles as aninfrastructure company and as a transport and distribution cluster make them importantpotential customers for local clusters. In this context, both mainports are large-scale users ofcomputer systems and software needed to manage logistical flows. The large sums investedin physical infrastructure generate work for construction companies and for engineeringfirms involved in the construction projects. These relationships serve to enhance the strategicimportance of the mainports.
5.5 The mainport as a ‘Signboard’
One of the ‘softest’ factors making up the strategic importance of the mainports is the imageof Amsterdam Airport Schiphol and, more especially, that of the city of Amsterdam, togetherwith Rotterdam’s reputation as a world port. In the case of Amsterdam, the city’s reputationfor culture and tourism makes it easier for Dutch companies to persuade foreign customersand business partners to come to the Netherlands to discuss an acquisition, or to attend tradefairs or conferences. It can even influence decisions on whether to set up overseas offices inthe city. This favourable image can also serve as a business image. Companies that have

Hugo Priemus 159
carried out work for one of the mainports (Amsterdam Airport Schiphol or Rotterdam PortAuthority) can gain benefits overseas from the prestige associated with these infrastructuralprojects. Amsterdam Airport Schiphol itself has profited from this by being selected formajor projects, for example, the construction and management of terminals at JFK Airport(AAS, 1998) and the development of the Airport City formula.When dealing with the ‘softer’ mainport functions, it is better to use the term ‘mainportSchiphol/Amsterdam’ rather than to limit the concept to the airport itself. The same is true ofRotterdam, since the area of the mainport extends well beyond the harbours themselves. Themainport and the city centre are deeply interwoven, forming an integral unit.Policy documents relating to the Rotterdam mainport tend to focus on:
the creation of a second Maas Area to avoid a situation in which logistics and industrywill run out of space;
tying the logistic flows of the port itself into other transport modalities such as road,inland waterways and rail, especially the links to the Ruhr and to the Antwerp port area;
enhancing local know-how and the mainport’s level of computerization by boostingactivities associated with added value.
In terms of passenger numbers, Amsterdam Airport Schiphol ranks fourth in Europe behindLondon, Paris and Frankfurt. In terms of air cargo it ranks third, ahead of Paris. Nearly halfof those using scheduled services are transit passengers. A major issue for the future iswhether Amsterdam Airport Schiphol will be able to continue to develop within theenvironmental limits that have been imposed. The clustering of companies aroundAmsterdam Airport Schiphol as well as in Hoofddorp and Amsterdam Zuid (EDCs, Dutchhead offices, European head offices and the associated service industries) has a certaingeographic element. For many companies, the key factor for success is the proximity of theairport. The central thrust of policy for Amsterdam Airport Schiphol is meeting theenvironmental preconditions and the option of an airport on an island in the North Sea.
5.6 Conclusions
Mainports are much more than transport and logistics nodes. Mainports should not bedefined merely in physical terms since they have already become major centres of expertiseand information. The ability to direct flows of goods and passengers is critical to the futuredevelopments of both mainports.The mainport Rotterdam is, nevertheless, primarily concerned with freight transport. Thisvirtually eclipses the region’s relatively minor role as a passenger transport node (RotterdamAirport, Rotterdam Central station and the high-speed railway, motorway connecting pointand node). While mainport Amsterdam Schiphol is primarily a mainport for passengertransport, freight transport is also important both at Amsterdam Airport Schiphol and in theport of Amsterdam. The relationship between the port of Rotterdam and Rotterdam Airportis extremely weak. The same is true of the relationship between Amsterdam Airport Schipholand the port of Amsterdam.The essential difference between Amsterdam and Rotterdam at this stage centres on the ITnode function. While Amsterdam is rapidly progressing towards an IT mainport status,Rotterdam is lagging behind. It might be worthwhile to develop a cohesive, urban, RandstadHolland network. This could encompass cities such as Amsterdam, Rotterdam, The Hague

160 Mainports as Integrators of Passenger, Freight and Information Networks
and Utrecht, as well as medium-sized towns such as Almere, Haarlem, Leiden, Delft,Zoetermeer and Dordrecht. The mainport function of Rotterdam and Amsterdam would thenneed to develop into a mainport function for Randstad Holland (see figure 5).Such a step would require significant improvement of public transport at the level ofRandstad Holland, recently by central government renamed as Deltametropolis. In addition,the accelerated informatization and computerization of this Deltametropolis is of strategicimportance. The ongoing ICT revolution is transforming the economy such that serviceindustries would become dominant and greatly increasing the concentration of expertise.
mainport Schiphol
mainportRotterdam
The Hague
Amsterdam
Rotterdam
Utrecht
IT mainportAmsterdam
high speed train to Brussels and Paris
Figure 5. Mainport functions of Randstad Deltametropolis
The Netherlands mainports are links where flows of freight, passengers and informationcome together. The harbour of Rotterdam and airport of Amsterdam Schiphol connect theDutch clusters with international networks.Figure 4 indicates which mega clusters put the Netherlands economy in a strong position.These mega clusters can be further subdivided into several meso clusters, such as the dairyindustry in the agricultural-food cluster and truck construction in the port transport cluster.
Hugo Priemus 161
The clusters shown in figure 4 are formed by industrial firms in the Netherlands: they havedeveloped a critical mass of their production, market, and information networks, so that fromhere they can maintain their connections with international networks.Porter (1990) stresses the importance of thinking in clusters, which emphasize theimportance of the intertwining of sectors, firms and knowledge institutes in the creation ofadded value: ‘A nation’s successful industries are usually linked through vertical(buyer/supplier) or horizontal (common customers, technology channels, etc.) relationships.’
6. ICT networks and nodes of the new economy
Mainport policies are still disproportionately focused on seaports and airports, and onconnecting intercontinental ocean networks and airlines with regional, national andinternational multimodal networks of roads, rails, inland waterways and pipelines.This is all related to physical transport. However, electronic highways are developing muchmore rapidly. Electronic mainports are gaining ground, increasingly eclipsing traditionalinfrastructural functions. Many policymakers find it difficult to grasp the development ofvirtual mobility and the concept of the new economy. They do not understand issues such asthe location and the significance of IT networks.

162 Mainports as Integrators of Passenger, Freight and Information Networks
##
# #
#
#
#
#
#
##
#
#
#
#
#
#
#
#
Breda
Venlo
Zwolle
Arnhem
Alkmaar
Haarlem
Heerlen
Deventer
Nijmegen
Den Haag
Groningen
Amsterdam
Rotterdam
Eindhoven
Leeuwarden
Amersfoort
's-Hertogenbosch
Enschede
Utrecht
Source: Ministerie van Economische Zaken, 1999a: 30.
Figure 6. Footprint across the Netherlands
DDV (1999: 27-34) has mapped out the current telecommunications infrastructure of theNetherlands. The primary infrastructure of most operators (the ‘backbones’ or transport nets)all have more or less the same footprint across the Netherlands (figure 7).Following a phased development starting in Randstad Holland, the mobile nets have alsoacquired a common characteristic, namely national coverage. They differ only in terms of thenumbers of transmitter masts.This section contains an overview of the location of telecommunications infrastructure in theNetherlands and a summary of the most important players responsible for developing thisnew infrastructure (DDV, 1999: 27-34).
Hugo Priemus 163
6.1 International access networks
KPN. KPN is energetically working on its future and KPN/Qwest is making rapidprogress in constructing the so-called Eurorings, which link the Netherlands to most otherwestern European states. The aim of this project is to establish a private infrastructurecapable of handling large volumes of cross-border traffic for international customers. TheEurorings are linked to KPN/Qwest’s own transcontinental infrastructure and to those ofother providers.
Global Crossing. The Global Crossing company builds fixed infrastructures throughoutthe world. It is presently working on a new transatlantic connection (Atlantic Crossing 1)with branches to European capitals. This connection will roughly double currenttransatlantic capacity.
Viatel. This new player is also constructing a European infrastructure, thereby opening upthe Dutch market.
Worldcom/MCI. Within a short space of time, Worldcom has grown (partly by means of aseries of take-overs) to become one of the most important telecommunications operatorsin the world. Worldcom has traditionally focused on high volumes and on data traffic.However, the company cannot afford to ignore the rapid development of the mobilemarket and will have to reorient its focus in this regard. Worldcom’s Network OperationsCentre for the European market is located in Amsterdam.
6.2 Places where undersea cables come ashore
Undersea cables fulfil a major role in world-wide telecommunications networks. They linkup countries and continents.Some enterprises are truly global in scope. One example is Fiber Link Around The Globe(FLAG). This is made up of a large number of participants, such as Atlantic Crossing andPacific Crossing. The transatlantic routes usually enter Europe via Britain (Lands End) andFrance (Brittany). The cable routes pass through Britain to reach the Netherlands, Germanyand Belgium.In addition to the transatlantic cables, there are also undersea cables linking the Netherlandsand Britain, such as the Rembrandt 1 and Rembrandt 2 cables.As has already been pointed out, the Netherlands has a part to play in the connectionsbetween the United States and Europe since various undersea cables come ashore in thiscountry. There are six sites at which undersea cables come ashore, these are located inAlkmaar, Beverwijk, IJmuiden, Zandvoort, Katwijk and Domburg.From these sites, the connections link up with the main routes to European cities. Theyconnect the Dutch networks to international gateways. The fact that such networks comeashore in the Netherlands has a certain economic significance. The construction of suchnetworks requires involves enormous sums of money, in the region of several hundredmillion Dutch guilders. Furthermore, the fact that these cables come ashore in theNetherlands regularly leads to the creation of Network Operations Centres (NOCs), eachproviding from several dozen to a couple of hundred high-quality jobs. Operators such asWorldCom/MCI, Global Crossing and Versatel have either already set up NOCs in theNetherlands or are in the process of doing so.
164 Mainports as Integrators of Passenger, Freight and Information Networks
6.3 Main international routes
Laying undersea cables up onto the shore is usually part of the construction of maininternational routes, and these almost always follow the same fixed pattern. The routes runfrom the coast to Amsterdam where they are connected up to various optical fibre rings. Anycompanies wishing to be connected up to these main routes should establish a physicalpresence as close as possible to a network node, for example a KPN interconnection point.This confers considerable advantages, both in terms of cost and time.From the point at which they link into the Amsterdam infrastructure, the main routes followthree paths.
To the south, past Amsterdam Airport Schiphol to Rotterdam where they connect up withthe pipeline complex to Antwerp
To the south-east, towards the Ruhr, either via Zevenaar or via Venlo.
Bottlenecks are always developing, due to underestimates of the numbers of new usersentering the market for the first time and requiring space for cable routes. One example is thepipeline complex between Rotterdam and Antwerp. This had to be expanded in a hurry,adding several dozen extra ducts in order to meet the requirements of telecommunicationsproviders.
6.4 Main infrastructure, transport nets
Figure 7 displays the routing used by KPN and the new users of main infrastructure in theNetherlands. The map image derived from this is reasonably clear. There is a clear linkbetween the presence of telecommunications links and centres of economic activity andpopulation centres.In the figure, the infrastructures of alternative providers is depicted as well. This stock-takingexercise reveals that some cities have several providers.

Hugo Priemus 165
#
#
##
#
#
#
#
#
##
#
#
#
#
#
#
#
#
#
$T
$T
$T
$T
$T
$T
#$T Landing point sea cable
Interconnection point KPNBackbone
Source: Ministerie van Economische Zaken, 1999a: 30.
Figure 7. Main ICT-infrastructure in the Netherlands
A larger role of the ICT infrastructure in the mainports and urban networks may alsointroduce some problems: the higher energy demand (often underrated), the increasingvulnerability for system breakdowns and the growing dependency on foreign companieswhich control the ICT-networks.When economic policy strives to transform the mainports into brainports, a synergy isneeded between the ICT-mainport and mainports like Rotterdam and Amsterdam-Schiphol.Although the mobility of persons and the mobility of freight are largely separate domains, it
166 Mainports as Integrators of Passenger, Freight and Information Networks
is worthwhile to promote the synergy between the Rotterdam harbour, Amsterdam-Schiphol,and the urban networks in the Randstad, for instance by improving the accessibility of urbannodes and mainports by car and high speed public transport (Deltanet).It is important for policy makers to be aware of the development and significance of the newICT infrastructures. Only then will they be able to evolve strategic plans for the backboneand to coordinate the development of these networks’ strategic nodes with that of thetraditional sea mainport and air gateways. Randstad Holland should get the message andendeavour to integrate ICT-mainport with mainport Rotterdam and mainport AmsterdamSchiphol.
7. Conclusions
Mainports are much more than mere transport nodes that serve to connect transport networksby sea, land and air. We have identified the following five mainport functions:
freight transport node; passenger transport node; magnet for economic clusters; business generator; signboard.
The economic function of mainports can be enhanced by linking regional economic clustersand international networks. The development of infrastructural networks for ICT is ofstrategic importance when coupled to the economic restructuring involved in switching fromindustrial activities to knowledge-intensive business services. Mainports can be transformedinto brainports by improving connections between the nodes for freight transport (likeRotterdam) and passenger transport (Amsterdam), and by integrating these with themainports’ ICT function (Gigaport). Randstad Holland is a polycentric urban configurationwith a variety of city centres. It could be developed into a coherent urban network, wherelocal governments cooperate to improve accessibility and interconnections. This wouldcreate an integrated mainport Randstad Holland, which would be capable of handlingpassengers, freight and information in a competitive and sustainable way.
References
AAS (1998) Jaarverslag 1997 Amsterdam Airport Schiphol. Schiphol: Amsterdam AirportSchiphol.
Buck Consultants and NEI (1997) Ruimtelijk-economische verkenning van de ToekomstigeNederlandse Luchtvaart Infrastructuur, [Spatial Economic Survey of the future DutchAirport Infrastructure], Nijmegen/Rotterdam: Buck Consultants Inter-national/NederlandsEconomisch Instituut.
Buck Consultants (1998) Ontwikkeling vestigingspatronen Amerikaanse en Japansebedrijven in Europa, [Development settlement patterns American and Japanese firms inEurope], The Hague: Ministerie van Economische Zaken.
Hugo Priemus 167
DDV Telecommunications and Media Consultants (1999) Ruimtelijke verschillen in detelecommunicatie-infrastructuur, [Spatial differences in telematics infrastructure], TheHague: Ministerie van Economische Zaken.
Ministerie van Economische Zaken (1999a) Ruimtelijke verschillen in de telecommunicatie-infrastructuur, [Spatial differences in telematics infrastructure], The Hague: Ministerie vanEconomische Zaken.
Ministerie van Economische Zaken (1999b) Mainports: Schakels tussen Nederlandseclusters en internationale netwerken, [Mainports: Links between Dutch clusters andinternational networks], The Hague: Ministerie van Economische Zaken.
Ministerie van Economische Zaken (1999c) Nota Ruimtelijk-Economisch Beleid, [SpatialEconomic Policy Memorandum], The Hague: Ministerie van Economische Zaken.
Ministerie van Verkeer en Waterstaat (2000) Mainportnotitie Schiphol. Een notitie over hetbelang van de mainport Schiphol voor Nederland, [Note on the importance of mainportSchiphol for the Netherlands], Tweede Kamer 1999-2000, 26.959 nr. 6, The Hague, 30 mei.
Ministerie van Volkshuisvesting, Ruimtelijke Ordening en Milieubeheer (1989) Vierde NotaRuimtelijke Ordening, [Fourth Spatial Planning Memorandum], The Hague: Ministerie vanVROM.
Ministerie van Volkshuisvesting, Ruimtelijke Ordening en Milieubeheer (1997) SpatialPatterns of Transportation, The Hague: Ministerie van VROM.
Notteboom, T. and W. Winkelmans (1998) Bundeling van containerstromen in het Europesehavensysteem en netwerkontwikkeling in het achterland, [Bundling of container flows in theEuropean port system and development of networks in the hinterland], Tijdschriftvervoerwetenschap, no. 4, pp. 379-398.
Porter, M. (1990) The Competitive Advantage of Nations. New York: The Free Press.
Priemus, H., J.W. Konings and E. Kreutzenberger (1995) Goederentrans-portknooppuntenen modaliteit: een inventarisatie, [Freight transport nodes and modality: an inventory],Delft: Delft University Press.
Technopolis and Dialogic (2000) Mainports: Schakels tussen Nederlandse clusters eninternationale netwerken, [Mainports: links between Dutch clusters and internationalnetworks], The Hague: Ministerie van Economische Zaken.


The Impact of Institutional Structures on TransportInfrastructure Performance. A Cross-NationalComparison on Various Indicators
W. Martin De JongFaculty of Technology, Policy and ManagementDelft University of TechnologyDelftThe NetherlandsE-mail: [email protected]
EJTIR, 1, no. 2 (2001), pp. 169 - 196
Received: January 2001Accepted: July 2001
It is generally acknowledged that structures and styles of decision-making have an importantimpact on what transport networks under these regimes look like. However, this has not beena regular line of research up to now. This paper investigates this by distinguishing four typesof institutional structures that reflect various politico-administrative systems and styles inWestern Europe. It seeks to construe an argument on how these types of institutionalstructures have divergent impacts on 1) decision-making speed on infrastructure projects, 2)satisfaction of actors in the decision making process, 3) Benefit-Cost ratios for projects, 4)modal split, 5) size of transport networks, 6) congestion in the networks and 7) investmentlevels. It seeks to explain why every specific type of institutional structure has a specificpredicted impact on the form, type and performance of the transport networks and also takesinto account that institutional structure is not the only factor with an impact on finalphysical outcomes. The article gives a well-substantiated argument on the supposedconnection and provides some empirical evidence, but does not claim statistical significance.It sets a first step toward a new line of research and suggests this may prove fruitful as acontribution to policy making.
1. Introduction
It is generally acknowledged that structures and styles of decision making have an importantimpact on what transport networks under these regimes look like. Some seminalpublications, such as those by Salomon, Bovy & Orfeuil (1993), Banister (1994), Gerondeau(1997), Cervero (1998) and Bertolini & Spit (1998) put transport networks explicitly in the

170 The Impact of Institutional Structures on Transport Infrastructure Performance
context of their wider spatial and governmental, organisational and bureaucraticenvironments. In Cervero’s Transit metropolis, for instance, the evolution of towns and citiesfriendly to public transport networks in the various nations is clearly dependent onunderlying administrative processes and various settlement patterns which at their turn alsohinge on spatial regulatory regimes. Additionally, the possibility to limit and hamper car usein certain areas and under certain conditions and the willingness of people to accept living inrelatively dense areas clearly has some cultural overtones. Denizens of Singapore andStockholm are more respectful of their government’s rule than are inhabitants of MexicoCity and Toronto and therefore create different opportunities for regulatory measures.Gerondeau shows how difficult it is to harmonise road safety policies across Europe, becauseof different values attached to safety, different ways in which inspection by governmentalagencies is organised and different education systems existing in the various countries. Onceagain, the administrative dimension turns out to be a crucial factor for the how and why ofthe development of transport policies as well as their eventual performance.Despite this wealth of empirical evidence systematic surveys of the influence of institutionalstructures on transport infrastructure development and performance has not been done. Initself, this is less surprising than it seems, for infrastructure performance is dependent on awhole range of factors of which decision-making structures is just one of the options andclearly not the simplest one. Divergent geographical patterns, levels of welfare, varyingconsumer preferences or still other factors have attracted more attention for the explanationof national differences. Furthermore, the trouble is that all these factors are so muchentangled that for most of the above mentioned authors solid individual case studies were amore achievable or desirable aim than methodologically tricky cross-national comparisons.And they clearly led to deepened insights.Comparisons between the various institutional structures and their effects are also verypromising, however. It is a novel research area that might offer a number of opportunities forimproving the decision-making context for the development of public transport. It is basedon knowledge how various types of institutional structures lead policy actors to set differentpriorities and lead to varying levels of investment and accommodation of transport demand.Obviously, any evaluation that is made of a country, more in particular the performance of itsinfrastructure, will depend heavily on the enshrined norms - which are themselves subject towide-ranging prioritisation. Quality is far from being an unambiguous term (Beckford 1998).Thus, whereas technicians are generally inclined to base evaluations on traffic standards,economists look first at cost-benefit ratios or expenditure levels and public officials focusmore on acceptance of embraced policies by their constituencies or at the speed with whichpolicies are implemented. As a consequence, these analysts may have preferences fordifferent institutional structures.In this article, a first attempt is made to see how four types of institutional structuresdistinguished by the author impact on infrastructure performance. To do justice to varioustypes of analysts and their disciplinary preferences, section 4 highlights three criteria forprocess quality in decision-making on infrastructures, namely speed, satisfaction of involvedactors and use of cost-benefit ratios. Section 5 deals with four criteria for product quality(functioning of the infrastructure network itself, being the modal split, the size of thenetwork, network congestion and expenditure levels). With regard to the latter criterion,more infrastructure and increased expenditure are not necessarily more desirable than lessinfrastructure and lower spending. The relationship between process and product is often
W. Martin De Jong 171
very subtle. The former European Centre of Infrastructural Studies (ECIS) made a wisestatement when it remarked that:
Much of Europe’s infrastructure, in practice, is driven by the inertia of ministerial andlocal budgets, with variations caused by budget considerations (and electoral cycles)rather than by a careful assessment of needs. General under investment may pose a lessserious problem than misallocation. Indeed, overcapacity may co-exist with seriousbottlenecks (ECIS 1996: 27).
In the long run it is the relationship between process and product and between the diverseindicators that provides us with a reliable and realistic picture including both spatial,economic, transport and political arguments. Simplifying complex material would merelyhave an adverse effect here.If we relate these outcomes to the countries’ institutional positions, we will gain a deeperunderstanding of the relationship between decision-making structures and how certainstructural and persistent traffic problems may be caused. To get there, first in section 2 atypology of institutional structures will be developed, after which section 3 gives somepredictions on how the four respective types are expected to affect the process scores insection 4 and product scores in section 5. Section 6 presents some concluding remarks.
2. Four types of institutional structures
In the political-administrative process of policy-making, analytical information, data andarguments are used by policy-actors in a political way. As a result, the way in which thisinformation is reworked, transformed and implemented into physical products such astransport networks depends heavily on how the administrative rules of the game lead actorsto employ this information to their own benefit. For example, when one party is able,through its strong position, to monopolise most of the investment funds and is in the positionto set the agenda for the debate, the variety of information used to come to political problemsolving will be much more restricted than when several actors need each other and startsetting up co-operative structures to both generate and share information. Also, when due toa lack of co-operative incentives, information and results gleaned from evaluation models arenot shared, collaboration between parties is drastically complicated and (semi-)public goodsas comprehensive, vast and vulnerable as public transport may suffer.In previous work (De Jong 1999), four dimensions relevant for infrastructure planning havebeen distinguished, being federalism, democracy, integralism and corporatism. They wereapplied to six Western countries (Switzerland, Germany, the Netherlands, England, theUnited States and France) and their scores on each of the dimensions were established on thebasis of field research.

172 The Impact of Institutional Structures on Transport Infrastructure Performance
The dimensions were defined as outlined below:
1. Federalism - unitarism, expressed in terms of the federalism index (FED). A country isconsidered more federal when the institutional structure gives more support to theorganisation of veto powers for lower government tiers against proposals emanating fromthe state, and to more frequent taking of initiative at lower levels (intergovernmental vetopowers).
2. Democracy - technocracy, expressed in terms of the democracy index (DEM). A countryis considered to be more democratic when the institutional structure gives more supportto the organisation of veto powers for social groups (pressure groups and individualcitizens) against proposals emanating from government or scientific experts (societalveto powers).
High scores on these two dimensions reflect high levels of checks and balances in theinstitutional structure and therefore a much more even distribution of power among actors.
1. Integralism - reductionism, expressed in terms of the integralism index (INT). A countryis considered to be more integralist when the institutional structure gives more support toconsideration of all possible aspects and implications of infrastructure investments duringthe appraisal process (conceptual co-operation).
2. Corporatism - pluralism, expressed in terms of the corporatism index (COR). A country isconsidered to be more corporatist when the institutional structure gives more support tothe development of feelings of loyalty between actors after the achievement of agreementbetween them, thus reducing the tendency to the taking of opportunistic stances (politicalco-operation).
High scores on both of these latter two dimensions reflect stronger incentives for co-operation thereby increasing levels of information exchange and the realisation of co-productions with various parties contributing to projects. In the previously mentioned study,a variety of data on a set of variables was collected for the countries mentioned in table 1.The final country scores on each of these four aspects, based on an extensive analysis ofthese data, are presented in table 1.
Table 1. Country scores in the four institutional dimensions
Dimension
Country
Federalism(checks and
balances)
Democracy(checks and
balances)
Integralism(incentives forcollaboration)
Corporatism(incentives forcollaboration)
Switzerland MID HIGH HIGH HIGHGermany MID MID HIGH HIGHNetherlands LOW MID MID MIDEngland LOW LOW LOW LOWUnited States HIGH HIGH LOW LOWFrance MID LOW MID MID
For more details, backgrounds and extensive comments, see De Jong (1999).
When taking the levels of (1) checks and balances reflected in the first two dimensions and(2) incentives for collaboration as the key aspects to determine how institutional structuresguide the use of information, the following table of institutional structures can be presented:
W. Martin De Jong 173
Table 2. Four types of institutional structures
Key aspects as to the use of information Many checks and balances Monopoloid power structureIncentives for co-operation Type 1.
Co-operative interactorsType 2.Benevolent dictators
Incentives or competition Type 3.Individualist competitors
Type 4.Hierarchical determinators
Type 1. Co-operative interactorsThe institutional system has a wide range of interdependent actors, who also maintaindurable relationships. It demands a combination of varied creation of information andextensive sharing of it. Both checks and balances and co-operative structures have beenrealised, leading to a high degree of conceptual harmonisation over time between actors. Thislimits the extent to which actors ´blind one another with science´ during the evaluationprocess, since they can acquire clear insight in each other's calculation methods. Thestandardisation, acceptance and wide applicability of the models allows them to be usedrepeatedly without the need for continual redesign or modification to deal with new cases.
Type 2. Benevolent dictatorsThe institutional system comprises relatively few actors monopolising most the resources,who do maintain lasting relationships among themselves. As a market form, this structureresembles an oligopoly with strong cartel formation. Information comes from only a smallnumber of sources, but it is widely shared. Actors have co-operative inclinations, but poweris not really evenly spread among them.
Type 3. Individualist competitorsThe institutional system comprises a very wide range of actors, who maintain only volatilerelations between themselves. As a market form this structure resembles a market with arelatively large number of players on the supply and demand sides, who do not succeed inreaching collusion or agreement because these are mainly focused on direct individual utility.There is a lot of individual innovation, but this innovation is only standardised after the eventor not at all. There are a great many checks and balances, but co-operative structures amongthe actors are missing.
Type 4. Hierarchical determinatorsThe institutional system has a relatively small number of different actors of which one or twodominate the debate. Moreover, these actors maintain few relationships. A dominant marketleader sets the agenda and tries to impose it on the other actors without need or willingnessto listen to any of them. He/she is focused on direct utility and speed of decision making.
Comparing tables 1 and 2 lead us to conclude that Switzerland and Germany come closest toapproaching institutional structure type 1, the United States to type 3 and England to type 4.The positions of France and the Netherlands are slightly more complicated because theycross each other when it comes to federalism and democracy. French citizens and pressuregroups are relatively less powerful, but lower tiers of government can bar central governmentdecisions better through a system of osmosis and double functions. The Netherlands has

174 The Impact of Institutional Structures on Transport Infrastructure Performance
more provisions for citizens to speak out their opinions, but provinces and municipalitieshardly have any funds when it comes to transport investments. France and the Netherlands,each other’s mirror images, are improbable candidates for a type 1 or type 3 position, butboth could swing to be types 2 or 4, depending on the circumstances. We will come to thatlater.
3. Predictions for infrastructure performance
Institutional structures influence the way in which financial priorities are set. These effects ofthis prioritisation can be subsequently recognised in the way the transport network has beenconstructed and how it functions. One way of providing the dimensions in the institutionalapproach developed in this report with explanatory or predictive power is by relating theinstitutional structure and aspects of infrastructure in various countries. In other words, howare infrastructures influenced by institutional structures? While making this connection someimportant nuances will have to be kept in mind:
1. Although we assume a connection between institutional structure and characteristics ofthe infrastructure network, this is not a direct causal relationship. The spatial structure ofcountries or regions may represent an especially disturbing variable. Large, sparselypopulated areas suffer less from congestion than small, densely populated areas, but needmore money to ‘cover’ the territory. Furthermore, geological circumstances differ, so thatin some places construction is substantially more expensive. This is, for instance, the casein mountainous Switzerland. The TNO-INRO studies (1995, 1996) comparing theRandstad, the Ruhr Area and the Flemish city triangle reveal that many differences inquality and capacity of infrastructure networks are explained by spatial characteristics.Geographical settlement patterns make a particular network structure more obvious thananother. Also, a connection exists between the spatial concentration/fragmentation and theadministrative concentration/fragmentation, as indicated by the NEI (1991).
2. The materialisation of decision-making in physical works takes time. This means that thecharacteristics of the infrastructure network may date from institutional structures of sometime ago. In order to demonstrate the effect of institutions on physical production, weought to compare the institutional structure of decades ago with the current infrastructure.Such research is not feasible for practical and methodical reasons.
However, institutions often share a highly sustainable character. Although elements maychange over time, the main structure is often the same since it is the manifestation of secular,deeply rooted thought and action patterns. Dobbin (1994) has studied institutional structuresas they existed when railroads came into being in the 19th century. He concludes thatremarkable continuity exists in the way countries tackle policy problems. Much of what wascommon in the 19th century is still relevant. In this light we then should regard his followingremark:
During the nineteenth century nation-states developed institutions for organizingeconomic life that paralleled those they used for organizing political life. (...) Whennations face new policy dilemmas they design new institutions around the principles ofexisting institutions. (...) I will argue that policy approaches are reproduced because

W. Martin De Jong 175
state institutions provide principles of causality that policy-makers apply to newproblems, and not simply because institutions give policy-makers the organizationalresources that repeat history (Dobbin, 1994: 2-3).
His message, translated to institutional structures for prioritising infrastructure, is thatadministrators and designers of structures automatically adopt a familiar line of thought, thatthey apply time and again to other issues. This study focuses on uncovering the underlyingdesign logic of each country as much as possible. This enhances our understanding of howcountries operate when developing institutional structures, with the intention of displayingstrong and weak sides. In his comparative analysis of institutional structures for planning ofrailroad projects in 19th century England, America and France, Dobbin arrives at someconclusions that are remarkably close to those in this study. The following quotes areremarkable in showing how railway investment policies in three different countries show ahigh degree of continuity over the centuries:
Why do nations pursue such different industrial policy strategies today? The UnitedStates enforces market competition and eschews state leadership in virtually every stateindustry. Meanwhile, French state technocrats orchestrate sectoral growth from above,and Britain bolsters firms against interference from both markets and state officials.(…) Americans aimed to create a private system of railroads using public inducements.The French aimed to create a public system of railroads with the help of private capital.Britain's early financial policies were genuinely laissez faire: the state did nothing topromote or regulate private finance (1994: 1, 58).
England was characterised by a practice in which enterprises and subnational governmentswere governed from a distance by central government, without London making real contactor interfering in their processes. The individual enterprise had to be protected againstgovernment intervention, as well as against the whims of the market. America was moreinclined toward public-private partnerships in which all contributed some and no one wasfully in control. They were aimed at inter-organisational networks in which ‘community self-rule’ and the voice of citizens and representative local governments were given importantroles. Technical expertise of individuals was not trusted. The political idea of powerdistribution in the American Constitution was maintained and considered relevant to theeconomic reality of railroad construction. The French considered harmonisation andstandardisation of railroads the most important goal and this could only be left to technocratsfrom central government (Corps des Ponts et Chaussées). Private capital could only be usedfor execution matters1.
1 Dunlavy (1992), after studying railway policy in 19th century America and Prussia, nuances the statement that
assessment practices can be directly deduced from institutional structures. Based on current practice, onewould expect in 19th century Germany that public bodies and public enterprises also financed and organisedinvestments in infrastructure. That, however, is not true. Up to the middle of the 19th century, German statesleft railroad infrastructure largely to the private sector. Normally, the state would have initiated it and while itdid have that ambition, Prussia was still a monarchy where the king decided about the construction ofrailroads. Waterways and roads were ‘done’ by the state, so that there was little money left for railroads. Hadthere been enough money, as in Belgium, railroads would have been constructed by the state. For lack ofresources it was left to private investors who did not accept state intervention. In that time, higher taxes wereonly conceivable as a consequence of political liberalisation. It was not until the 1840s - after much publicpressure - that state loans were agreed to finance railroads and the existing private railroad companies were
176 The Impact of Institutional Structures on Transport Infrastructure Performance
3.1 Types of institutional structures and performance
The hypothesis that various types of institutional structures will result in various types ofinfrastructure networks requires a properly substantiated argument:
Type 1: Co-operative interactorsIn these structures, substantial alterations of central proposals can be suggested given thelarge number of administrative and societal veto powers. The variation in ideas is increased.For the parties involved in the assessment process, there are strong incentives to co-operate.So the variation of information is largely adopted.Due to the extensive number of checks and balances between actors, speed is predicted to below; time to reach agreement and acceptance is taken into consideration from the verybeginning. Due to actors’ co-operative inclinations the duration is relatively predictable. Apositive side effect is high level of satisfaction among participating actors however. When itcomes to the question which aspects are seen as important in appraisal frameworks, all actorswill have had some influence and various criteria, aspects or arguments have beenincorporated.Type 1 structures leave room for all transport modes and integrate them well both internallyand externally; co-production between modes frequently occurs. Given the large number ofveto powers, experts’ projects and programmes are processed quickly and without too manychanges. As a consequence, the constructed infrastructure meets societal demand. The largeamount of expenditure is not spent on a large numbers of projects but on adequateincorporation in the physical environment.
Type 2: Benevolent dictatorsIn these structures proposals by the centre can hardly be changed given the limited number ofadministrative and societal veto powers. The creation of variation of ideas is thereforelimited. For the parties involved in the assessment process, strong stimuli exist to co-operateso that this limited variation is adopted by all.Due to the limited number of checks and balances between actors, speed is predicted to behigh; not much time is needed to reach agreement, because resistance can be expected to beweak. This has its repercussions on actor satisfaction however; it is predicted to be low.When it comes to the question which aspects are seen as important in appraisal frameworks,it is the dominant (national) actor that has by far the most impact; national economic growthand financial viability will probably prevail over other aspects.Type 2 structures provide room for all transport modes and integrate them well internally,but not intermodally with other modes and are otherwise not very innovative either. Giventhe limited number of veto powers, experts’ projects and programmes can be executedrelatively quickly and intact. As a result, the amount of constructed infrastructure is morethan adequate, but it is used inefficiently. The large amount of expenditure is not spent onenvironmental aspects, but rather on a large number of projects.
nationalised. The enlargement of the power of the Länder vis-a-vis the national government was establishedunder the influence of the allied forces after the Second World War. Contrary to England, America andFrance, Germany has experienced major changes in its state and administrative system since the last century.This limits the possibilities for recognising continuity in the past 150 years.

W. Martin De Jong 177
Type 3: Individualist competitorsSerious alterations in central proposals can be made in these structures given the largenumber of administrative and societal veto powers. This enhances the variation of ideas.Parties involved in the assessment process have no incentives or minimal incentives to co-operate, As a result, the great amount of variation is only partially adopted by some actors.Harmonisation of evaluation models is uncommon.Due to the extensive number of checks and balances between actors and their competitiveinclinations, speed is predicted to be low, and rather unpredictable; (semi-) public goods areonly realised if all required actors see the project as relevant to their interests. A positive sideeffect is a high level of satisfaction among participating actors, however. When it comes tothe question which aspects are seen as important in appraisal frameworks, all contributingactors will have had some influence and various criteria, aspects or arguments have beenincorporated. Nevertheless, these are dealt with in a rather ad hoc and unsystematic manner.Type 3 structures leave little room for transport modes that cannot maintain themselves in acompetitive environment, but when they can, they are both efficient and innovative. Linksare created only if they serve the players’ direct interests. Given the large number of vetopowers, experts’ projects and programmes are rarely processed quickly or left intact. As aconsequence, the infrastructure constructed meets societal demand. The small amount offinancial means is spent on a large number of small projects, which have somethingattractive in it for all actors.
Type 4: Hierarchical determinatorsIn these structures changes in central proposals can only be proposed to a limited degreegiven the limited number of administrative and societal veto powers. The variation of ideasis therefore limited. There are minimal incentives for the parties involved to co-operate sothe limited variation is adopted to a small degree and only because the weaker parties cannotwithdraw from the monopolist´s financial power.Due to the limited number of checks and balances between actors, speed is predicted to behigh; not much time is needed to reach agreement, because resistance can be expected to beweak. This has its repercussions on actor satisfaction however; it is predicted to be low.When it comes to the question which aspects are seen as important in appraisal frameworks,it is the dominant (national) actor that has by far the most impact; national economic growthand financial viability will probably prevail over other aspects.Type 4 structures leave little room for transport modes that cannot compete and stimulateefficiency. These structures do not encourage innovation in these modes. Given the limitednumber of veto powers, the lack of a central will for investment is not compensated by thestrength of other actors. As a consequence insufficient infrastructure is constructed, andsocietal demand is not accommodated. The small amount of financial resources is used for asmall number of centrally selected large projects.The tables 3a and 3b summarise the characterisations of the various structures:
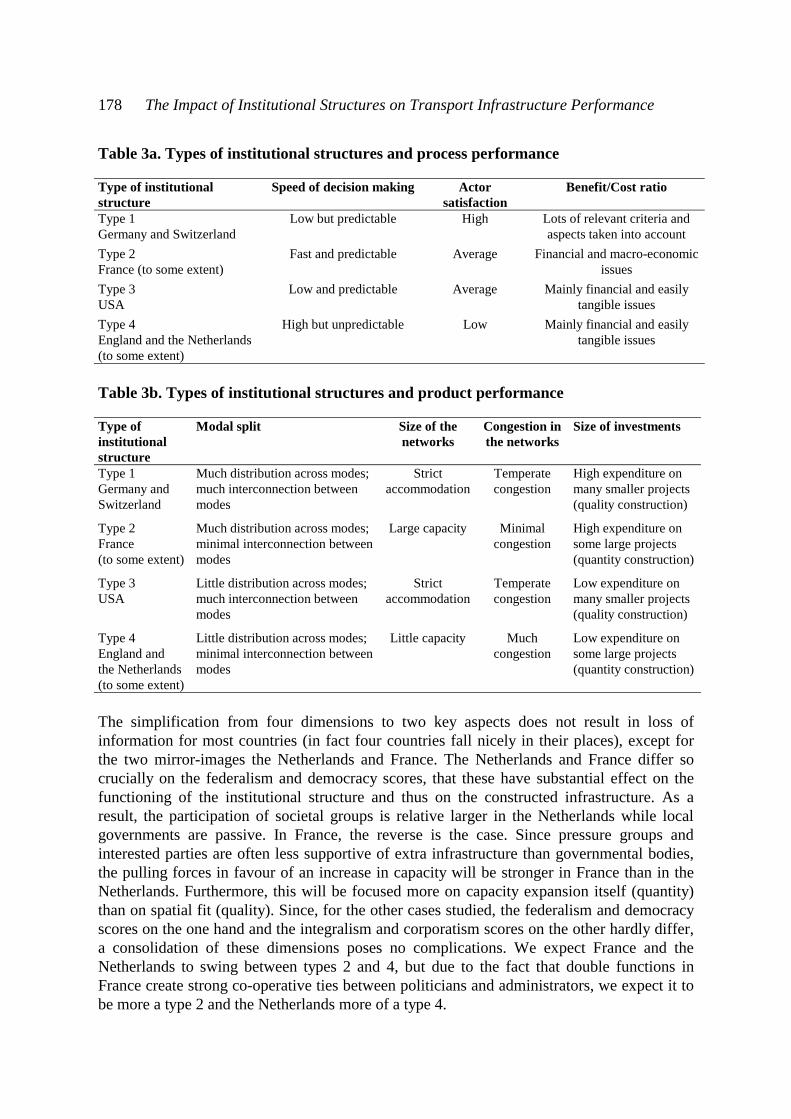
178 The Impact of Institutional Structures on Transport Infrastructure Performance
Table 3a. Types of institutional structures and process performance
Type of institutionalstructure
Speed of decision making Actorsatisfaction
Benefit/Cost ratio
Type 1Germany and Switzerland
Low but predictable High Lots of relevant criteria andaspects taken into account
Type 2France (to some extent)
Fast and predictable Average Financial and macro-economicissues
Type 3USA
Low and predictable Average Mainly financial and easilytangible issues
Type 4England and the Netherlands(to some extent)
High but unpredictable Low Mainly financial and easilytangible issues
Table 3b. Types of institutional structures and product performance
Type ofinstitutionalstructure
Modal split Size of thenetworks
Congestion inthe networks
Size of investments
Type 1Germany andSwitzerland
Much distribution across modes;much interconnection betweenmodes
Strictaccommodation
Temperatecongestion
High expenditure onmany smaller projects(quality construction)
Type 2France(to some extent)
Much distribution across modes;minimal interconnection betweenmodes
Large capacity Minimalcongestion
High expenditure onsome large projects(quantity construction)
Type 3USA
Little distribution across modes;much interconnection betweenmodes
Strictaccommodation
Temperatecongestion
Low expenditure onmany smaller projects(quality construction)
Type 4England andthe Netherlands(to some extent)
Little distribution across modes;minimal interconnection betweenmodes
Little capacity Muchcongestion
Low expenditure onsome large projects(quantity construction)
The simplification from four dimensions to two key aspects does not result in loss ofinformation for most countries (in fact four countries fall nicely in their places), except forthe two mirror-images the Netherlands and France. The Netherlands and France differ socrucially on the federalism and democracy scores, that these have substantial effect on thefunctioning of the institutional structure and thus on the constructed infrastructure. As aresult, the participation of societal groups is relative larger in the Netherlands while localgovernments are passive. In France, the reverse is the case. Since pressure groups andinterested parties are often less supportive of extra infrastructure than governmental bodies,the pulling forces in favour of an increase in capacity will be stronger in France than in theNetherlands. Furthermore, this will be focused more on capacity expansion itself (quantity)than on spatial fit (quality). Since, for the other cases studied, the federalism and democracyscores on the one hand and the integralism and corporatism scores on the other hardly differ,a consolidation of these dimensions poses no complications. We expect France and theNetherlands to swing between types 2 and 4, but due to the fact that double functions inFrance create strong co-operative ties between politicians and administrators, we expect it tobe more a type 2 and the Netherlands more of a type 4.
W. Martin De Jong 179
For the transport science indicators presented below, we used tables from transport studies ofvarious national ministries, Kolpron, CBI, ECIS, TNO-INRO, the UN and from previouswork done by this author (de Jong 1999). The hypotheses specified in this section will betested using real-world observations in sections 4 and 5.Predictions made in this section andreality will be matched in sections 4 and 5.
4. Scores for process quality
In this section, the three performance criteria for process quality are briefly described afterwhich some statistics are presented to see if they fit the expectations. The three processcriteria are speed, satisfaction of involved actors and the relevant aspects used in cost-benefitanalyses.
4.1 Speed of decision-making
In practice, the ‘process time’ is often an implicit criterion for assessing decision-making oninfrastructure projects. When the speed of decision-making is the criterion, the will to actbecomes the most important aspect. This means that ideas should not be changed too oftensince this would slow down the decision-making process. The line of reasoning here is thatthe benefits of infrastructure will occur more quickly and the costs will generally be lowerwhen planning and construction proceed according to the plan. Also, a large number ofpractical, administrative problems are decreased such as low expenditure in some years andbudget deficits in other years.Quick decision-making may have a number of important disadvantages. Because of theemphasis on pushing certain decisions through, it is possible that the contractor has little orno consideration for arguments and contributions of opponents. These opponents could,under different conditions, well be potential participants who would enrich the final decision.While the costs will be higher, hopefully the long-term benefits will be greater, thus it mightbe wise to reconsider before one acts. Today’s benefits may well be tomorrow’s costs. TheFrench planning specialist Merlin wrote about this:
Lengthy and costly projects yield infrastructures with a life span of decades,generations or centuries It is understandable that decision-makers cannot afford tomake mistakes in such circumstances; after all, their decisions are doubly important,because of the costs involved and because of the long-term consequences. (Merlin,1994: 6, original in French, translation by the author).
Seen in this light efficient, but hasty decision-making (efficiency in a narrow sense) isunwise and substantial variation of ideas and a thorough selection from that variation isnecessary. Efficiency in the broader sense means keeping an eye on the long term and beingopen to quality improvement. This requires attention for coincidence, treading unknownpaths and thorough reflection on decisions before actions are taken. Such activities are neverefficient in a narrow sense.Decision-making speed is not easy to measure. The beginning and the end of a project areusually difficult to determine precisely, and decision-making speed may differ from the one

180 The Impact of Institutional Structures on Transport Infrastructure Performance
project or mode to the other. Decision-making speed, in reality, is often an impressioninstead of a precise measure.Solid empirical research on the length of decision-making procedures is scarce. UsingKolpron's data (1994), we have made the following table of only European countries. Weshould realise that it concerns estimates made by national civil servants.
Table 4. Duration of the decision-making process in years (measured until 1990)
Transport mode Switzerland Germany Netherlands England FranceRoads 16 16 24 20 6Railroads 12 15 9 5 7
Source: Kolpron 1994.
From these data we derive that the length of the decision-making process in type 1 structures(Germany and Switzerland) is long but predictable, and short in type 2 structures (France).Both outcomes are in accordance with the predictions in paragraph 3. No data are availableon the USA. The duration of decision-making processes regarding roads in the Netherlandsand England (type 4 countries) is substantially different from the expectations. These scoresmay be explained from the fact that in both countries, the Ministry of Transport is thedominant actor and while it can limit the constructive veto powers of other parties, it cannoteliminate their blocking power. Other actors besides the one who initiates a projectapparently do not have the power to submit policy proposals and get them accepted, but theycan prevent quick implementation and construction. That this undesirable effect occurs morewith roads than with railroads can probably be explained by the fact that railroad owners areoften the sole initiator, while for roads authority is more dispersed. Low federalism anddemocracy in combination with low integralism and corporatism do not lead simply to quickdecision-making: it is likely that low federalism and democracy scores with an average orhigh integralism and corporatism scores are even better. In this case, weak parties are metwith a willing attitude and receive some influence, which in turn prevents them from usingall influence they have against the realisation of infrastructure projects.In a recent publication, The Confederation of British Industry (CBI 1995) also attempted topresent a careful indication of the process time in four countries (England, France, Germanyand the Netherlands). According to CBI, the construction of infrastructure (in general) in theNetherlands takes 12 years from the moment that any certainty exists about the availability ofnational funds. For Germany, numbers of 9 years for railroad projects and 10 for federalhighways are mentioned, but the politico-administrative discussion must be added to this.There are no periods indicated for France but it is assumed to be rather speedy. Englandtakes as much as 13.5 years, basically for lack of a consensual attitude and financialresources. No matter how much these estimates differ from those offered by Kolpron, theydo indicate that limited veto power and offensive, competitive relations certainly do noguarantee quick decision-making. Not even when the procedures appear to suggest so.A third more detailed study deals with the developments and changes in the national railroadplans in Switzerland and the Netherlands in the 1988-1996 period under the influence oftheir respective institutional structures (De Jong, Stevens and Veeneman 1996). It appearsthat in 8 years time, the Swiss plans have gone through major changes under the influence ofseveral veto powers (referendum, lump-sum financing, strong influence of cantons), while

W. Martin De Jong 181
Dutch Rail project realisation may have fallen behind schedule, it is still relatively fast andunchanged. After 8 years, only a third of the Dutch intentions has been realised and themoney for the whole programme has been depleted, while in Switzerland the maximumamount available resulted in enormous cutbacks: the existing rail system can handle capacitywith better and larger transport material. The Dutch are quicker and more technocratic thanthe Swiss. Because of a continuing budget for Dutch plans, national government and DutchRail have more room to grant detailed municipal wishes. In Switzerland, on the other hand,regional wishes have been anticipated from the start, but since they appear to take asecondary position as a result of cutback measures, a stalemate developed. According to thisdetailed study, a strong unitary and relatively technocratic country can operate far morequickly than a federal and democratic country. According to Moser (1993), the Swiss policy-makers have to deal with a great number of veto powers within a rather rigidly applied legalframework. Furthermore, money, which appeared to be excellent oil for massaging andquickening processes, was lacking for rail projects in Switzerland.And finally, in its research of decision-making on large infrastructure projects in a number ofareas in North Western Europe, the NEI (1991) presented several conclusions in tables(number and size of projects, solidity and time span). Up to a point, these are related to theinstitutional structures in a country. It is interesting to compare the outcomes of the NEIresearch with the outcomes we may expect in this investigation (see table 5):
The number and size of projects are related to the ambition levels of actors. Oversupplyoften thrives in combination with low veto power (low federalism and low democracy)combined with strong tendencies to co-operate (high integralism and corporatism). Lowfederalism and democracy scores combined with low integralism and corporatism scoreswould result in a smaller number of projects (under-supply). Other combinations will notbe so distinct since opposition or veto will mitigate high or low ambitions. Number andsize of projects ought to be large in France and the Netherlands, not all too marked inGermany and low in England.
The solidity of a project is supposed to score high in environments lacking opportunismand with many shared preferences. This requires high integralism and corporatism and isunrelated with federalism and democracy. Solidity of projects should be high in Germany,average in France and the Netherlands and low in England.
The time span of projects is usually shortened by low federalism and democracy (‘will toact’) and low integralism and corporatism (‘winning’ instead of vetoing). The time spanshould be shortest in England, relatively short in France, longer in the Netherlands andlongest in Germany.
Outcomes are not only influenced by institutional structures, but also by welfare, spatialstructures, preferences of the population, the condition of the infrastructure, regionaldifferences within countries and specific events. Therefore, interpretation of data such asthese should always be done with great care.
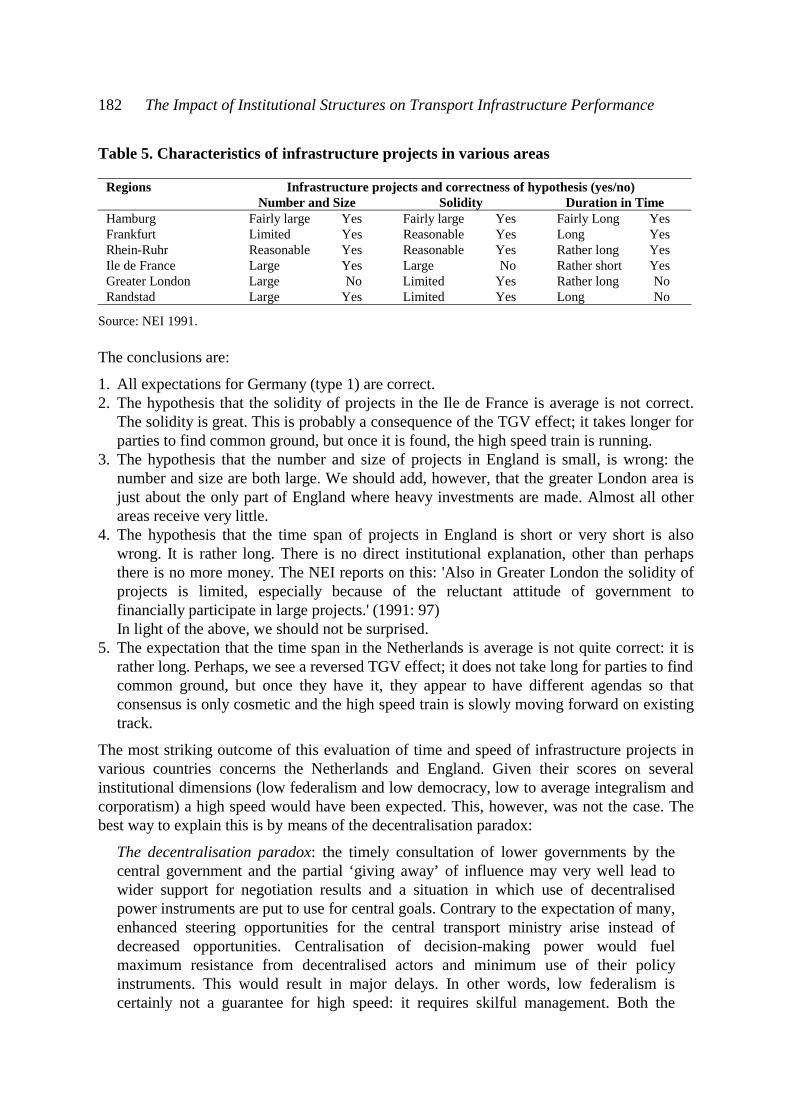
182 The Impact of Institutional Structures on Transport Infrastructure Performance
Table 5. Characteristics of infrastructure projects in various areas
Regions Infrastructure projects and correctness of hypothesis (yes/no)Number and Size Solidity Duration in Time
Hamburg Fairly large Yes Fairly large Yes Fairly Long YesFrankfurt Limited Yes Reasonable Yes Long YesRhein-Ruhr Reasonable Yes Reasonable Yes Rather long YesIle de France Large Yes Large No Rather short YesGreater London Large No Limited Yes Rather long NoRandstad Large Yes Limited Yes Long No
Source: NEI 1991.
The conclusions are:
1. All expectations for Germany (type 1) are correct.2. The hypothesis that the solidity of projects in the Ile de France is average is not correct.
The solidity is great. This is probably a consequence of the TGV effect; it takes longer forparties to find common ground, but once it is found, the high speed train is running.
3. The hypothesis that the number and size of projects in England is small, is wrong: thenumber and size are both large. We should add, however, that the greater London area isjust about the only part of England where heavy investments are made. Almost all otherareas receive very little.
4. The hypothesis that the time span of projects in England is short or very short is alsowrong. It is rather long. There is no direct institutional explanation, other than perhapsthere is no more money. The NEI reports on this: 'Also in Greater London the solidity ofprojects is limited, especially because of the reluctant attitude of government tofinancially participate in large projects.' (1991: 97)In light of the above, we should not be surprised.
5. The expectation that the time span in the Netherlands is average is not quite correct: it israther long. Perhaps, we see a reversed TGV effect; it does not take long for parties to findcommon ground, but once they have it, they appear to have different agendas so thatconsensus is only cosmetic and the high speed train is slowly moving forward on existingtrack.
The most striking outcome of this evaluation of time and speed of infrastructure projects invarious countries concerns the Netherlands and England. Given their scores on severalinstitutional dimensions (low federalism and low democracy, low to average integralism andcorporatism) a high speed would have been expected. This, however, was not the case. Thebest way to explain this is by means of the decentralisation paradox:
The decentralisation paradox: the timely consultation of lower governments by thecentral government and the partial ‘giving away’ of influence may very well lead towider support for negotiation results and a situation in which use of decentralisedpower instruments are put to use for central goals. Contrary to the expectation of many,enhanced steering opportunities for the central transport ministry arise instead ofdecreased opportunities. Centralisation of decision-making power would fuelmaximum resistance from decentralised actors and minimum use of their policyinstruments. This would result in major delays. In other words, low federalism iscertainly not a guarantee for high speed: it requires skilful management. Both the
W. Martin De Jong 183
Netherlands and England can be characterised as countries where financial means areconcentrated at the national level. As the capital assumes that he who pays alsodecides, the blocking power of spatial-juridical competences and organisation power ofpersonnel tends to be systematically underestimated (De Bruijn, Ten Heuvelhof and DeJong 1994: 48).
4.2 Satisfaction of involved actors (satisfaction norm)
A norm that may result in diametrically opposed outcomes to the speed norm is the norm thatall involved actors must be content at the end of the decision-making process - both with theway the process developed as well as with the outcomes (Teisman 1995). In material terms,this means that after consultation and negotiation, all interested parties who had something tooffer in the decision-making process have reached agreement. In this case, one can assumethey have ‘learned’. The amount of time from beginning to end is only of secondaryimportance. Strict procedures often lead to forced or sub-optimal outcomes in which partiesmay have something to offer each other but are unable to do so given rigid procedures. Inthis context, the laissez-faire approach of decision-making provides sometimes interesting,surprising and promising outcomes.No systematic survey research has been done on the satisfaction of actors regardinginfrastructure projects, let alone international comparative research. But from case descriptionsof the institutional structures and decision making in De Jong (1999) we can derive thefollowing observations:
1. Germany and Switzerland (type 1), where both public bodies and societal groups arecaptured in the decision-making process, have a reasonable amount of satisfaction. This isnot so much because they always get their way, but more because they have the feelingthat all individuals have a legitimate place in the process. Involved actors are content.Non-involved actors are usually discontent, but there are not too many of those. Manychecks and balances assure many involved actors, while high co-operation assures thatthey all are accommodated within reason.
2. France (type 2), where public bodies are especially contained, experiences little discontentwithin public channels. However, the discontent about process and outcome amongpressure groups and citizens is much higher. Every new proposal to enhance participationbounces against a wall of distrust. The involved actors are content and powerful, the non-involved are not, but powerless.
3. In the United States (type 3), where the number of policy relevant actors is largest, there isno fundamental distinction between public and private actors. This is a consequence ofthe fact that actors are involved in some decisions and not in others. Sometimes they arecapable of creating a coalition of parties with comparable interests, and these winsometimes and lose sometimes. The combination of strong checks and balances andfragmentation of assessment process does not lead to the kind of containment you wouldfind in Germany or Switzerland. On the contrary, pragmatism and self-interest results in apractice of ad hoc associations between actors in which everybody will win sometime,without being able to predict exactly when. The course and outcome of decision-makingis something like throwing dice. Few are thus always discontent because no actorsconsistently lose.
184 The Impact of Institutional Structures on Transport Infrastructure Performance
4. The Netherlands and England (type 4) share the philosophy that public bodies and societalgroups deserve a place in the decision-making process, but they will have to fight for it.Furthermore, every type of co-operation is created ad hoc and is certainly not long term.No actor is really assured of his place. The number of actors that can really make adifference during the process is small. The national transport ministry is the major funder,and only the largest municipalities have good contacts with the capital and the seat ofgovernment; the representatives of the various transport modes are organised in tightmonopolistic clubs, despite a privatisation philosophy. Smaller municipalities adopt apassive attitude and environmental lobbies are usually aggressive. Every now and thenthey win a battle, but co-deciding on the main course of a policy is outside their reach.This is not surprising for England, but it is for the Netherlands which has extensiveparticipation procedures and open planning processes. The fundamental choices withrespect to main ports and the major infrastructure are, however, made in a much smallercircle (Huigen, Frissen and Tops, 1993; Siddiqui 1996). Societal groups can do little morethan stepping out of the discussion, declare their opposition, buy land and start judicialprocedures. How open are the planning processes, really, when participation is seldomequal to decision? Some non-involved but interested actors are consistently dissatisfied.
4.3 Relevant aspects used in cost-benefit analyses
In essence, the substantive motive to develop infrastructures is almost always related toexpected societal benefits divided by the costs to be incurred. As a corollary, institutionalstructures that result in infrastructure projects or traffic systems with a high B/C ratio arepreferred above others. This is one of the few policy analytical norms posed and is, in thatsense, more valuable than the others which are all process norms.Unfortunately, in terms of outcome, this norm is also the least operative: benefits and costsof produced infrastructure systems are spread out over long periods of time. They are rarely -if ever - predictable and they are difficult to define. They are particularly difficult to definesince some cultures value certain societal benefits more than others. Also, the importanceattached to various items under both costs as well as benefits may differ from country tocountry. Furthermore, benefits can be positive as well as negative and some can be expressedin monetary terms while others cannot; thus the B/C ratio can never be captured in one singlenumber. Last, but certainly not least, it is not easy to ascribe the benefits derived from trafficsystems solely to the institutional structure that developed them. Other factors may be just asimportant.It is possible to outline in general terms how costs and benefits are distributed per country.Thus, someone who focuses on the costs of infrastructure and who does not believe in abroader spectrum of externalities, will have a preference for results that are expressedprimarily in monetary terms. Those with a focus on the supply vision upon infrastructure andan orientation on benefits, will prefer countries with substantial and nuanced multi-criteriamatrices.When applying this criterion, the best that can be achieved is an indication of how and wherecosts and benefits are distributed and which issues are considered costs and which areconsidered benefits. In the end, such an assessment is dominantly a matter of ideology. Thus, afocus on the costs of infrastructure will lead to little belief in the broader spectrum ofexternalities and will favour the Anglo-Saxon countries which do not include the less
W. Martin De Jong 185
measurable effects of infrastructure: only that which is directly visible is taken into account. Afocus on the planning of traffic networks and a supply view on transport will result in theinclusion of all possible relevant aspects in their considerations. When we distinguish betweenproduction costs, transactions costs and benefits, we develop an insight in the stronger andweaker points of various countries:
Type 1: Germany and SwitzerlandAdvocates of a supply view on infrastructure and an orientation on benefits will prefercountries with high co-operation scores. Integralism promotes attention not only forbusiness-economic but also macro-economic and various spatial and ecological interestswhen looking at traffic issues. Corporatism results in estimates of positive and negativeexternalities, as they are experienced by various parties. The line of reasoning is that sincethese effects in the production process are translated by actors to third parties, they ought tobe internalised via collective action. While all of these inefficient effects in a narrow senseprobably occur, but are difficult to assess, arbitrary choices are made with respect to theirrelative weight in the larger societal cost-benefit balance. Since a broad concept of benefitswill raise the B/C ratio, the construction of infrastructure on policy analysis grounds is to beexpected.The broadest concept of societal benefits exists in Germany, where almost all business-economic, macro-economic, ecological, urbanistic and politically opportune effects havetheir place in the decision-making framework. The Standardisierte Bewertung is aninstitutionalised example of this. It is remarkable that the application is, time and again, veryprecise and that representatives of relevant organisations in the project team are involved inapplying the method (TNO-INRO 1991, KUB & TNO-INRO 1997). The production andtransaction costs are high, as are the benefits, especially in the spatial and ecological sphere.Switzerland also uses a very broad concept of infrastructure benefits, but the belief inintegral policy analysis is traditionally smaller. The approach there is one of planning of thetransport network by government and transport companies and a democratic test by thepopulation who are expected to independently weigh their interests.Therefore, the predictions fit the German case very well and the Swiss case to some extent.In Switzerland, there is no comprehensive framework for appraisal, but in all of the decisionmaking process, transport investment projects are seen from various angles by various actors.
Type 2: FranceFrance, on the other hand, focuses strongly on and values highly traffic and macro-economicbenefits of infrastructure and less on spatial and ecological issues. This is especially visiblein railroads that emphasise societal profits for investments, contrary to the partial multi-criteria approach in Germany. In France, most projects also have to meet some form of CostBenefit analysis, but their contents are financial and macro-economic in nature and its usetakes place in much more politicised environment. Criteria or wishes from pressure groups,lower tiers of government and citizens have very limited or no representation in thesesophisticated models. The French case fits the predictions.
186 The Impact of Institutional Structures on Transport Infrastructure Performance
Type 3: United StatesBy coupling public and private forces, the situation in the US is less homogeneous andprobably more favourable. Several governments encourage each other to develop creativefinancial constructions, so that the effects of lower expenditure on economic benefits aremitigated. The way non-economic benefits of infrastructure are taken into account varies alot per state. Some states and Metropolitan Planning Organizations (for instance inCalifornia) have set up interactive processes inviting several participants to air their view andsuggest criteria that were all incorporated in a general framework, others focus just on costs,financial viability and profitability.
Type 4: England and the NetherlandsUsually, economic criteria and relatively slender analyses of societal costs and benefits aresufficient for an assessment in England. This almost automatically means that the totalbenefits are low, costs are comparatively high and a high B/C ratio can hardly be established.In the end this results in lower costs (expenditure) on infrastructure, while the directeconomic profit is satisfied. The lowering in England is mainly accredited to a lowering ofproduction costs by simply decreasing production. England uses a set evaluation method(COBA), that translates all aspects in economic terms and does not consider user benefits. Inthat, the zero-alternative (doing nothing) is also taken into account, clearly a cost-reducingfactor. The application of the method is evaluated by the national government without theinvolvement of sub-national actors, this also reduces transaction costs. Whether this decreasein transaction costs actually happens is less evident, given the length of decision-making andthe difficulty in establishing agreement on research data and decisions.Like other European countries, policy makers in the Netherlands believe in more than onlyfinancial criteria. The environment and the concentration of urban areas also requireattention. Assessment methods exist, but their use is hardly systematic: they are only usedwhen parties feel the need to do so2. As a result, the dissemination of the type of benefitsdepends on the type of project. The largest projects around main ports and distantconnections are highly motivated by macro-economic arguments, while many investments inpublic transport are argued in terms of spatial and environmental benefits. Thus, constructedroads are justified for considerations of network completion. An absence of standardisedassessment also results in production costs, transaction costs and benefits which are highlyad hoc by nature. In general, both types of costs are relatively low, but rising. Economicbenefits appear reasonable, although traffic statistics do confirm the image of a country verysensitive to congestion. Much attention is given to planning issues, although these are not assystematically researched as the ‘societal benefits’, but more as instruments for political gain.Quite recently, a new evaluation procedure (OEEI) has been introduced in the Netherlands,which is actively supported by the current Minister of Transport and which is used toevaluate many recent projects. It was devised by mostly economic consultants and peopleworking for the Ministry and lower tiers of government have mostly stayed outside this
2 TNO-INRO (1991) concluded about the Dutch public transport situation that a rather large number of
individual studies are conducted in order to get insight in aspects such as comfort, changes in the amount ofpassenger kilometres, travel time, travel time evaluation, costs of tickets, investment costs, exploitation costs,noise, use of space, environmental aspects, and safety. Since then an integral policy evaluation for collectivetransport has developed, but this has never been generally accepted or applied.

W. Martin De Jong 187
process. Only the future can tell whether this procedure will eventually institutionalise havereal political impact. If it does, a decisive step in the English direction has been taken.Predictions fit the English case extremely well, whereas the Dutch case remains elusive.In sum, the three alternative approaches to process quality give diverging results. Speedpoints to France as the winner, while all others are rather slow. But an institutional designerwishing to take transplants from France has to remind himself that the accompanying lossesin terms of democracy lead to a very high citizen dissatisfaction. Contentment among playersis high in Germany and Switzerland. It is lower in the USA and the Netherlands and lowestin England. The expectations as such were almost all confirmed.
5. Scores for product quality
In this section, the three performance criteria for product quality are described shortly afterwhich some statistics are presented to see if they fit the prediction. The three product criteriafor transport infrastructure are modal split, size of the networks, congestion in the networksand size of the investments.
5.1 Modal split
The prediction with respect to the modal split is that in the United States (type 3) roaddominates and intermodality is successful, that England and the Netherlands (type 4)concentrate their transport streams on roads while being not so good at intermodality, thatFrance (type 2) leaves more space for other transport modes, but that intermodality has hardtimes there and that Germany and Switzerland (type 1) have a strong spread over variousmodes and are also good at intermodality.The statistics in the table below confirm most of the expectations:
Table 6. Modal split passenger transport (in %, excluding biking and walking)
Country Car ----------Public transport----------Total Rail Other
Switzerland 1989 80.8 19.2 13.6 5.6Germany 1991 84.0 16.0 6.6 9.4Netherlands 1991 83.4 16.6 8.4 8.2England 1991 87.8 12.2 5.7 6.5USA 1992 97.8 2.2 1.3 0.9France 1991 86.5 13.5 7.8 5.7
Sources: Dutch Ministry of Transport 1996, US Department of Transportation 1996.
The hypotheses turn out correct except for the modal split in the Netherlands, which is lesscar-dominated than expected. The fact that co-operation is not as low as in England can inpart account for this. Other, mainly spatial reasons, will probably provide the other part.For a comprehensive test of the predictions, a presentation of the modal split of the transportof goods would be required. Figures about these, however, are extremely complicated togenerate, not suitable or simply not available (cf. Tavasszy 1996) for a number of reasons:
188 The Impact of Institutional Structures on Transport Infrastructure Performance
1. The transportation distance of cargo highly influences the modal split. The countriesinvestigated vary in size, and this results in distortion of figures. Also, national transport,international transport and transit are often difficult to separate.
2. Neither the weight transported (tons) nor the weight transported multiplied by the numberof kilometres (ton-kilometres) are adequate indicators for the importance of freight.Furthermore, the difference in outcome on both units is enormous. Switzerland, forinstance, scores 10% for rail in tonnage and 41.8% in ton-kilometres. In other countriesthese figures are more comparable.
3. The presence of waterways is a disturbing variable for making expected connections sinceit requires minimal financial resources for construction and maintenance. A substantialpart of freight in the Netherlands is by inland waterways. It is unclear to what mode thistransport would be allocated in the absence of waterways. The number of waterways inSwitzerland is negligible.
4. The measurement of modal split data is complicated. Many data are not registered or areonly registered per individual transport company. National aggregate data are incompleteand inconsistent.
Nevertheless, on the basis of secondary sources, we can make the following remarks:
1. In all countries, road dominates in the modal split.2. The share of inland waterways is very small in Switzerland. In terms of tonnage, rail is
limited, but in terms of ton-kilometres it is about half.3. In Germany, inland waterways and rail, in particular, are important, even though roads
occupy the largest share. In the specific case of North-Rhine Westphalia, inlandwaterways are more important than rail.
4. The share of inland waterways is large in the Netherlands even though road transportremains largest in terms of tonnage. The share of rail in the modal split is less than in anyother country.
5. In England, road dominates even more than in other countries and the share of inlandwaterways is negligible. Rail is used more frequently than in the Netherlands and less thanin other countries.
6. The road is less dominant in the USA than in other countries. The use of inlandwaterways is limited but not negligible. Transport of goods by rail is important - greaterthan 40% in terms of ton-kilometres. The large distances in the USA, combined withliberalisation, have resulted in profitable railroad enterprises.
7. Inland waterways are not well developed in France, relatively unimportant and, in fact,declining in importance as well. The share of rail is smaller than in the Low and Germaniccountries and larger than in England.
In light of the unequal availability of inland waterways, the freight transport statistics areabout what we expected. The only striking conclusion is success of railroads in the USA.This may be explained from the fact that geographical circumstances and the integration ofseveral modes into one integrated, intermodal transport enterprise resulted in a situationwhere freight by rail was profitable.Intermodality can hardly be expressed in data; numbers of terminals are not very meaningful.Effects can be found more easily in how the transport modes interact. Thus, we can see thatin Germany and Switzerland public transport companies increasingly use each others’ rail
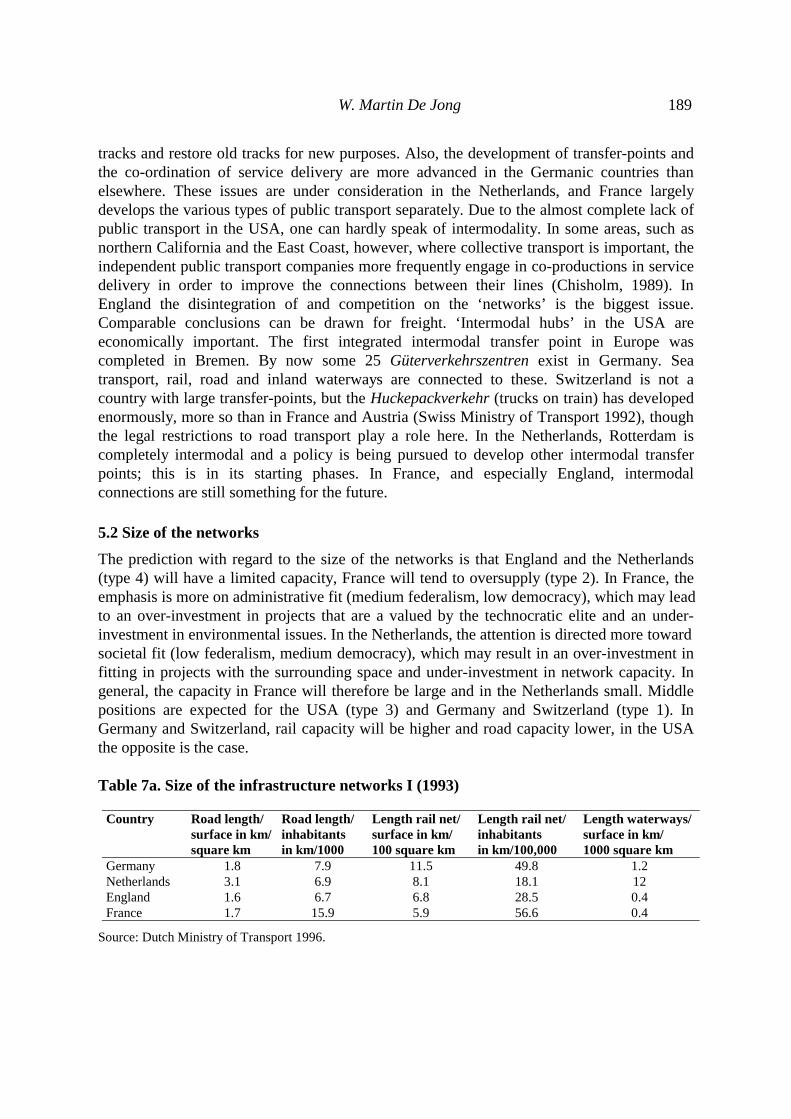
W. Martin De Jong 189
tracks and restore old tracks for new purposes. Also, the development of transfer-points andthe co-ordination of service delivery are more advanced in the Germanic countries thanelsewhere. These issues are under consideration in the Netherlands, and France largelydevelops the various types of public transport separately. Due to the almost complete lack ofpublic transport in the USA, one can hardly speak of intermodality. In some areas, such asnorthern California and the East Coast, however, where collective transport is important, theindependent public transport companies more frequently engage in co-productions in servicedelivery in order to improve the connections between their lines (Chisholm, 1989). InEngland the disintegration of and competition on the ‘networks’ is the biggest issue.Comparable conclusions can be drawn for freight. ‘Intermodal hubs’ in the USA areeconomically important. The first integrated intermodal transfer point in Europe wascompleted in Bremen. By now some 25 Güterverkehrszentren exist in Germany. Seatransport, rail, road and inland waterways are connected to these. Switzerland is not acountry with large transfer-points, but the Huckepackverkehr (trucks on train) has developedenormously, more so than in France and Austria (Swiss Ministry of Transport 1992), thoughthe legal restrictions to road transport play a role here. In the Netherlands, Rotterdam iscompletely intermodal and a policy is being pursued to develop other intermodal transferpoints; this is in its starting phases. In France, and especially England, intermodalconnections are still something for the future.
5.2 Size of the networks
The prediction with regard to the size of the networks is that England and the Netherlands(type 4) will have a limited capacity, France will tend to oversupply (type 2). In France, theemphasis is more on administrative fit (medium federalism, low democracy), which may leadto an over-investment in projects that are a valued by the technocratic elite and an under-investment in environmental issues. In the Netherlands, the attention is directed more towardsocietal fit (low federalism, medium democracy), which may result in an over-investment infitting in projects with the surrounding space and under-investment in network capacity. Ingeneral, the capacity in France will therefore be large and in the Netherlands small. Middlepositions are expected for the USA (type 3) and Germany and Switzerland (type 1). InGermany and Switzerland, rail capacity will be higher and road capacity lower, in the USAthe opposite is the case.
Table 7a. Size of the infrastructure networks I (1993)
Country Road length/surface in km/square km
Road length/inhabitantsin km/1000
Length rail net/surface in km/100 square km
Length rail net/inhabitantsin km/100,000
Length waterways/surface in km/1000 square km
Germany 1.8 7.9 11.5 49.8 1.2Netherlands 3.1 6.9 8.1 18.1 12England 1.6 6.7 6.8 28.5 0.4France 1.7 15.9 5.9 56.6 0.4
Source: Dutch Ministry of Transport 1996.

190 The Impact of Institutional Structures on Transport Infrastructure Performance
Table 7b. Size of the infrastructure networks II (1988)
Country Length rail net in km/square km % multiple tracks Length road net in km/square kmSwitzerland 125 32 1734Germany 122 42 1995Netherlands 22 77 776England 69 70 1549United States 22 -- 665France 63 45 1471
Source Swiss Ministry of Transport (1992), based on UN data.
Tables 7a and 7b provide the answers. In the first table data on the USA and Switzerland aremissing, while in the second table data on the number of kilometres per citizens are lacking.Even more striking is the difference in outcomes for the Netherlands: the statistics in thesecond table give it a road and rail network that is smaller by a factor 4. When asked, theresponsible sources were unable to clarify or explain the gap in the respective outcomes.Switzerland, on the other hand, is given a very huge rail network, while the SBB wrote that ithad the most limited budget in relation to the number of passengers after the Netherlands(SBB 1989). Since then, not many extra kilometres have been constructed. Yet, on the basisof this, some conclusions can be made:
1. The networks in England and the USA are limited, as expected.2. The German and French networks are extensive, especially rail. The Swiss networks
appear quite sizeable here, but it is possible that extra cantonal data have been added.3. The exact size of the Dutch network is unclear. It is true, though, that the infrastructure
networks in the Randstad are less extensive than in the Ruhr Area. Intensive servicedelivery through efficient use of (limited) infrastructure is a common practice in theNetherlands - this makes the current network sensitive to growth of traffic. TheNetherlands is a typical type 4 here after all.
TNO-INRO write about the road networks in the Ruhr Area, Randstad and the Flemish citytriangle:
The highway network in the Randstad is substantially more pressured than in the RuhrArea and the Antwerp-Brussels-Ghent region. The day-intensity per lane is on average20% higher. In all three regions, the most pressured connections are found around andbetween the large cities. (...) In addition, the supply of other through-going roads is farbehind the supply in the Ruhr Area and around Antwerp-Brussels-Ghent. In theRandstad there is no cohesive road network contrary to the other two regions. As aconsequence there are more and shorter replacements via the highways (TNO-INRO1996: i-ii).
In addition, TNO-INRO supply the data presented in table 8:
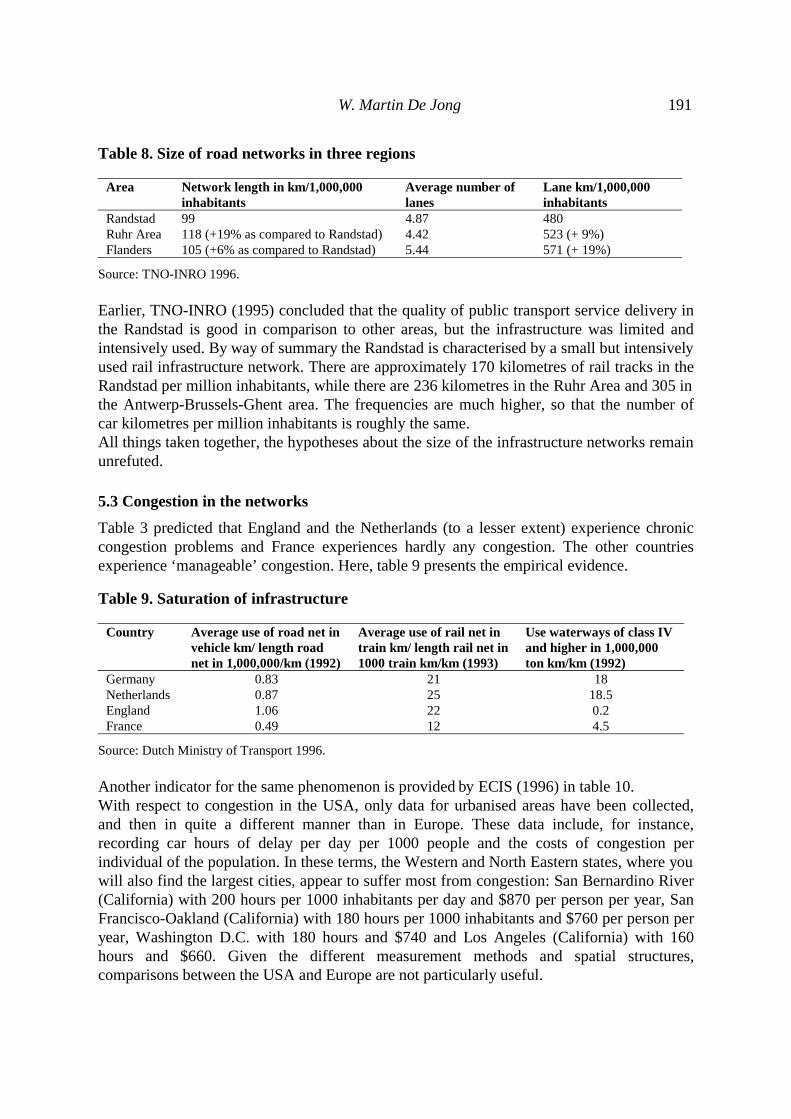
W. Martin De Jong 191
Table 8. Size of road networks in three regions
Area Network length in km/1,000,000inhabitants
Average number oflanes
Lane km/1,000,000inhabitants
Randstad 99 4.87 480Ruhr Area 118 (+19% as compared to Randstad) 4.42 523 (+ 9%)Flanders 105 (+6% as compared to Randstad) 5.44 571 (+ 19%)
Source: TNO-INRO 1996.
Earlier, TNO-INRO (1995) concluded that the quality of public transport service delivery inthe Randstad is good in comparison to other areas, but the infrastructure was limited andintensively used. By way of summary the Randstad is characterised by a small but intensivelyused rail infrastructure network. There are approximately 170 kilometres of rail tracks in theRandstad per million inhabitants, while there are 236 kilometres in the Ruhr Area and 305 inthe Antwerp-Brussels-Ghent area. The frequencies are much higher, so that the number ofcar kilometres per million inhabitants is roughly the same.All things taken together, the hypotheses about the size of the infrastructure networks remainunrefuted.
5.3 Congestion in the networks
Table 3 predicted that England and the Netherlands (to a lesser extent) experience chroniccongestion problems and France experiences hardly any congestion. The other countriesexperience ‘manageable’ congestion. Here, table 9 presents the empirical evidence.
Table 9. Saturation of infrastructure
Country Average use of road net invehicle km/ length roadnet in 1,000,000/km (1992)
Average use of rail net intrain km/ length rail net in1000 train km/km (1993)
Use waterways of class IVand higher in 1,000,000ton km/km (1992)
Germany 0.83 21 18Netherlands 0.87 25 18.5England 1.06 22 0.2France 0.49 12 4.5
Source: Dutch Ministry of Transport 1996.
Another indicator for the same phenomenon is provided by ECIS (1996) in table 10.With respect to congestion in the USA, only data for urbanised areas have been collected,and then in quite a different manner than in Europe. These data include, for instance,recording car hours of delay per day per 1000 people and the costs of congestion perindividual of the population. In these terms, the Western and North Eastern states, where youwill also find the largest cities, appear to suffer most from congestion: San Bernardino River(California) with 200 hours per 1000 inhabitants per day and $870 per person per year, SanFrancisco-Oakland (California) with 180 hours per 1000 inhabitants and $760 per person peryear, Washington D.C. with 180 hours and $740 and Los Angeles (California) with 160hours and $660. Given the different measurement methods and spatial structures,comparisons between the USA and Europe are not particularly useful.
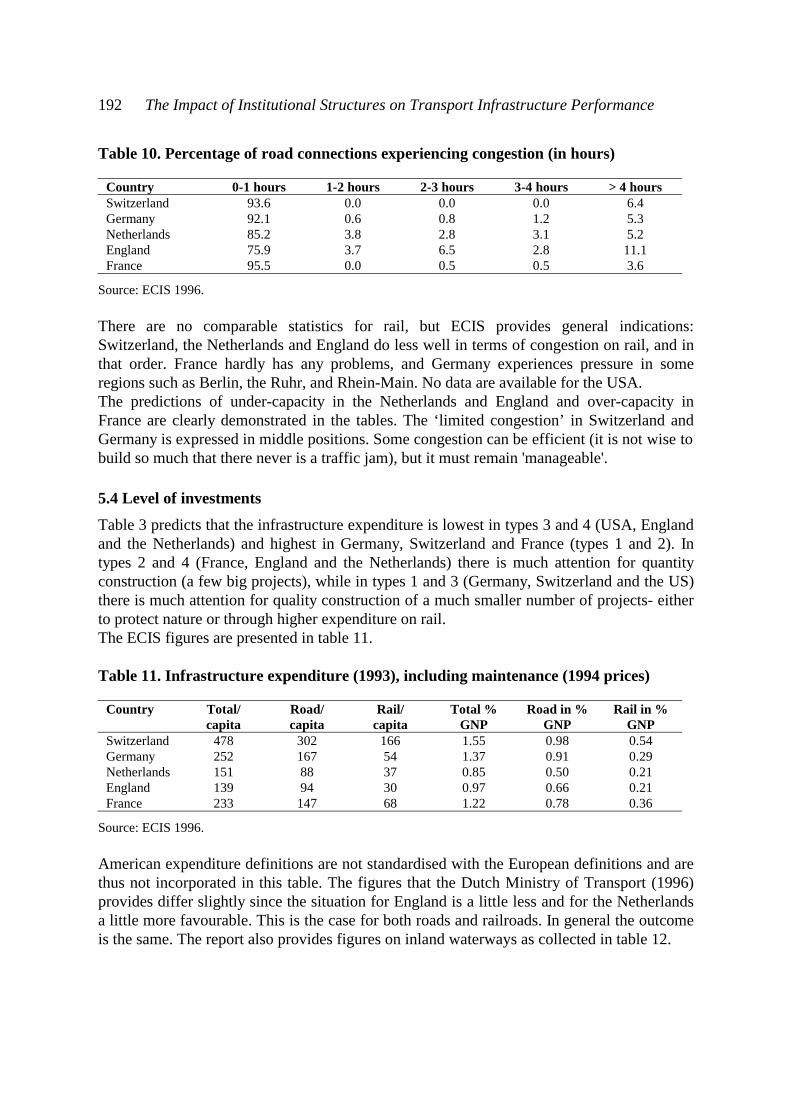
192 The Impact of Institutional Structures on Transport Infrastructure Performance
Table 10. Percentage of road connections experiencing congestion (in hours)
Country 0-1 hours 1-2 hours 2-3 hours 3-4 hours > 4 hoursSwitzerland 93.6 0.0 0.0 0.0 6.4Germany 92.1 0.6 0.8 1.2 5.3Netherlands 85.2 3.8 2.8 3.1 5.2England 75.9 3.7 6.5 2.8 11.1France 95.5 0.0 0.5 0.5 3.6
Source: ECIS 1996.
There are no comparable statistics for rail, but ECIS provides general indications:Switzerland, the Netherlands and England do less well in terms of congestion on rail, and inthat order. France hardly has any problems, and Germany experiences pressure in someregions such as Berlin, the Ruhr, and Rhein-Main. No data are available for the USA.The predictions of under-capacity in the Netherlands and England and over-capacity inFrance are clearly demonstrated in the tables. The ‘limited congestion’ in Switzerland andGermany is expressed in middle positions. Some congestion can be efficient (it is not wise tobuild so much that there never is a traffic jam), but it must remain 'manageable'.
5.4 Level of investments
Table 3 predicts that the infrastructure expenditure is lowest in types 3 and 4 (USA, Englandand the Netherlands) and highest in Germany, Switzerland and France (types 1 and 2). Intypes 2 and 4 (France, England and the Netherlands) there is much attention for quantityconstruction (a few big projects), while in types 1 and 3 (Germany, Switzerland and the US)there is much attention for quality construction of a much smaller number of projects- eitherto protect nature or through higher expenditure on rail.The ECIS figures are presented in table 11.
Table 11. Infrastructure expenditure (1993), including maintenance (1994 prices)
Country Total/capita
Road/capita
Rail/capita
Total %GNP
Road in %GNP
Rail in %GNP
Switzerland 478 302 166 1.55 0.98 0.54Germany 252 167 54 1.37 0.91 0.29Netherlands 151 88 37 0.85 0.50 0.21England 139 94 30 0.97 0.66 0.21France 233 147 68 1.22 0.78 0.36
Source: ECIS 1996.
American expenditure definitions are not standardised with the European definitions and arethus not incorporated in this table. The figures that the Dutch Ministry of Transport (1996)provides differ slightly since the situation for England is a little less and for the Netherlandsa little more favourable. This is the case for both roads and railroads. In general the outcomeis the same. The report also provides figures on inland waterways as collected in table 12.

W. Martin De Jong 193
Table 12. Expenditure for waterways (1995)
Country Investments per capita(in fl 1.00/inhabitant)
Investments in waterways/length ofwaterway network (in fl. 1000/km)
Germany 37 290Netherlands 44 140England 0 0France 6 50
Source: Dutch Ministry of Transport 1996.
The low figures for England and France are not really surprising: their inland waterwaynetwork is very small and they choose to keep it that way. The proportions of Germany andthe Netherlands are remarkable: the Netherlands is the waterway champion, but appears topay relatively less attention to the network than Germany.All in all, the tables confirm the prediction about Switzerland, Germany and France as stronginvestors. In the Netherlands and England, the costs for resolving congestion points areapparently deemed too high.Infrastructure construction is less easy to express in figures with regard to quality.Qualitative indications can be provided. Spatial fit in Germany and Switzerland and theNetherlands (which otherwise goes along with type 4 in that it focuses mainly on bigprojects) is often established through high investments in public transport systems, highexpenditures on tunnels that preserve nature areas or track adaptations to preserve inhabitedareas and nature areas. Both in the Netherlands and the USA, the principle of compensationis relevant, where the demolition of nature is supposed to be compensated through thecreation of new nature areas. In America, nature protection is also pursued via non-attainment areas; these are areas where construction is totally prohibited (De Jong 1999). InFrance, it was predicted that infrastructure capacity is considered more important than theenvironment in light of the relationship between infrastructure capacity and congestion withregard to investments. Also, the maintenance of infrastructure is considered of lesserimportance (Fourniau 1995, Dutch Ministry of Transport 1996). The same is the case inEngland, which can be derived from the fact that increased pressure of environmentalinterest groups is not answered by better spatial fit, but by withdrawing all projectsconsidered problematic (De Jong 1999). A study by Hendriks (1996) showed how ring roadswere constructed deep into the city of Birmingham with unpleasant consequences for theliving environment, while Munich made substantial investments in systems of local andregional public transport.All in all, as seen in the previous paragraphs, reality is quite nuanced and dependent onseveral factors, but the expectations expressed in table 3 are generally confirmed by theevidence.
6. Concluding remarks
In the preceding paragraphs, an attempt has been made to demonstrate a structuralrelationship between types of institutional structures on the one hand and processes andproducts of decision making on transport infrastructures on the other. This can be understood
194 The Impact of Institutional Structures on Transport Infrastructure Performance
by viewing how relationships of power and collaboration between actors influence thecreation and sharing of relevant information. This differentiated use of information amongthe different institutional structures, at its turn, determines what type of infrastructurenetworks grow. For instance, type 1 structures with high levels of checks and balances andstrong incentives to collaborate force actors to construct networks together, because they feelthey depend on each other and the regulations punish them in one sense or another foropportunistic behaviour. This makes intermodal and public transport easier to realise, butthose networks also take more time to develop and are probably relatively costly. The mutualchecks that actors exert on each other mitigate the whimsical desires of each of them, leadingto average network size and congestion levels (under supply or oversupply are effectivelyprevented). Actors involved in the decision making turn out to be generally happy about bothquality of process and quality of product. Similar lines of argument have been developed forthe other three institutional types leading to other process and product outcomes due to theirdifferent institutional characteristics. Though any relevant statistical exercise was precludedbecause of the limited set of countries, clear indications have been given that there is indeeda connection between institutional structure and infrastructure performance.To further substantiate the theory and the line of argument and to make them statisticallysignificant further exploration is required.This paper just intended to be a first step in the direction of a greater understanding of theinstitutional foundations of transport and infrastructure networks. Other fields such as trafficsafety could also benefit from such international institutional comparisons. It promises to bea productive line of thought, because it opens up a deeper insight into the politico-administrative context in which policy measures are taken. Countries learning from eachother’s experiences can be a rich source of policy learning. This is becoming only morerelevant in the context of wider EU transport planning where data and knowledge is going tobe shared and certain policies of harmonisation will have to be implemented. Increasedknowledge of each other’s systems will be put their own systems in comparative perspectiveand help policy-makers to fine tune them as well as serve as basic building blocks to havethese systems grow more similar in the years to come.
References
Banister, David (1994) Transport Planning in the UK, USA and Europe, E&FN Spon,London.
Beckford, John (1998) Quality. A Critical Introduction, Routledge, London/New York.
Bertolini, Luca & Tejo Spit (1998) Cities on Rails. The Development of Railway Stationsand Their Surroundings, E&FN Spon, London.
Cervero, Robert (1998) The Transit Metropolis. A Global Inquiry, Island Press, New York.
Chisholm, Donald (1989) Co-ordination without Hierarchy. Informal Structures in Multi-organizational Systems, University of California Press, Berkeley/Los Angeles.
Confederation of British Industry (1995) Missing Links. Settling National TransportPriorities, a CBI discussion document, London.

W. Martin De Jong 195
De Bruijn, Hans, Ernst Ten Heuvelhof and Martin de Jong (1994) Het infrastructuurfondstussen inhoudelijke norm en politieke afweging, Ministerie van Verkeer en Waterstaat, DenHaag.
De Jong, Martin (1999) Institutional transplantation; how to adopt good transportinfrastructure ideas from other countries?, Eburon publishers, Delft.
De Jong, Martin, Henrik Stevens and Wijnand Veeneman (1996) Evolving TransportConcepts. Railway Development Schemes in Switzerland and The Netherlands, in: TRAILConference Proceedings, May 1996, Rotterdam.
Dobbin, Frank (1994) Forging Industrial Policy. The United States, Britain and France inthe Railway Age, Cambridge University Press, New York.
Dunlavy, Colleen A. (1992) Railway Policies in 19th Century Prussia, in: Steinmo, Sven,Kathleen Thelen and Frank Longstretch (eds), Historical Institutionalism in ComparativeAnalysis, Cambridge University Press, Cambridge.
Dutch Ministry of Transport (1996) Internationale vergelijking infrastructuur. Nederland,Duitsland, Verenigd Koninkrijk, Belgie, Frankrijk, SDU Uitgevers, Den Haag.
European Consortium for Infrastructural Studies (1996) The State of EuropeanInfrastructure, Rotterdam.
Fourniau, Jean-Michel (1995) Evaluation et conduite des grands projets d’infrastructure detransport. Des expériences de renouvellement encore hésitantes, paper presented at theinternational colloquium Grandes infrastructures de transport et territoires, June 1995.
Gerondeau, Christian (1997) Transport in Europe, Artech House, Boston/London.
Hendriks, Frank (1996) Beleid, cultuur en instituties. Het verhaal van twee steden, DSWOPress, Leiden.
Huigen, Jos, Paul Frissen and Pieter Tops (1993) Het project Betuwelijn. Spoorlijn ofbestuurlijke co-produktie, Katholieke Universiteit Brabant, Tilburg.
Katholieke Universiteit Brabant & TNO-INRO (1997) Infrastructureel investeringsbeleid invergelijkend perspectief, Tilburg/Delft.
Kolpron Consultants BV (1994) Besluitvorming over grote infrastructuurprojecten in eenaantal Europese landen, Ministerie van Verkeer en Waterstaat, den Haag.
Merlin, Pierre (1994) Les transports en France, La documentation française, Paris.
Moser, Peter (1993) Why is the political system of Switzerland so stable?, Discussion paperno. 72, University of Skt Gallen, Skt Gallen.
Nederlands Economisch Instituut (1991) Majeure ruimtelijke en infrastructurele operaties ingrootstedelijke agglomeraties in Noord-West Europa, Rotterdam.
Salomon, Ilan, Piet Bovy & Jean-Pierre Orfeuil (eds) (1993) A billion trips a day; traditionand transition in European travel patterns, Kluwer Academic Publishers,Dordrecht/Boston/London.

196 The Impact of Institutional Structures on Transport Infrastructure Performance
Schweizerische Bundesbahnen (1989) Bahn und Bus 2000. Von Konzept zur Planung,Sonderdrück Schweizer Eisenbahnrevue, Bern.
Siddiqui, Frank (1996) Een duistere club. De lobby achter de Betuwelijn, in: Intermediair, 20December 1996: 6-15.
Swiss Ministry of Transport (1992) Mobilität in der Schweiz. Bericht zu Handen derKommission für Verkehr und Fernmeldewesen des Ständerates, Bern/Zurich 1992.
Tavasszy, Lorant A., Modelling European Freight Transport Flows, The NetherlandsResearch School for Transport, Infrastructure and Logistics, Delft.
Teisman, Geert H. (1995) Complexe besluitvorming. Een pluricentrisch perspectief opbesluitvorming over ruimtelijke investeringen, VUGA, Den Haag.
TNO-INRO (1991) De evaluatie van openbaar vervoerinvesteringen, TNO Beleidsstudies,Delft.
TNO-INRO (1995) De kwaliteit van de infrastructuur binnen metropolitane gebieden inNoordwest Europa, Delft.
TNO-INRO (1996) Vergelijking aanbod en gebruik hoofdwegennet in enkele Europesemetropolen, Delft.
US Department of Transportation & Bureau of Transportation Statistics (1996)Transportation Statistics in Brief, Washington.
The Impact of Alternative Access Modes on Urban PublicTransport Network Design
Rob van NesFaculty of Civil Engineering and GeosciencesDelft University of TechnologyDelftThe NetherlandsE-mail: [email protected]
EJTIR, 1, no. 2 (2001), pp. 197 - 210
Received: April 2001Accepted: July 2001
Public transport network design determines the quality for travellers as well as operationalcosts. Network design is therefore crucial for the cost effectiveness of urban publictransport. In urban public transport network design it is commonly assumed that alltravellers walk to the stops. This might be true for short access distances, but if stop and linespacing increase other modes such as bicycles might become interesting as an alternativeaccess mode. An analytical model is presented that determines optimal networkcharacteristics, i.e. stop spacing, line spacing, and frequency, and that explicitly accountsfor alternative access modes. The objective used is maximising social welfare. Results showthat, if cycling is considered as an alternative access mode, all three network characteristicsmentioned above should be increased, offering benefits for the traveller, the operator as wellas the society. However, if there is a large sub-population of travellers who are not able touse the alternative mode, or if there are barriers for using an alternative mode to access theurban public transport system, it is better to assume that walking is the only access modeavailable. In the case of cycling as an access mode there are possibilities for positivebenefits, at least in countries such as Denmark or the Netherlands. It is expected that forother access modes, such as peoplemovers and demand responsive public transport systems,the barriers are too high to have an impact on urban public transport network design.
1. Introduction
It is well known that the costs of urban public transport systems are a point of concern. Thecosts of providing public transport services should be balanced by the benefits for thetravellers and the city. Since public transport network design determines the quality for thetraveller as well as the operational costs, it is crucial for the cost effectiveness of public

198 The Impact of Alternative Access Modes on Urban Public Transport Network Design
transport. Typical network design variables are stop spacing, line spacing and frequency.Stop and line spacing determine access time, stop spacing influences average vehicle speed,while frequency determines waiting time. The average vehicle speed, line spacing andfrequency determine operational costs. In order to improve the cost effectiveness of publictransport networks, it is thus essential to know what the main relationships for these designvariables are.There is a considerable amount of studies on the basic relationships for urban publictransport network design (see e.g. Van Nes (2000) for an overview). A general assumption inthese studies is that travellers walk to the stops. This is certainly realistic in the case thataccess distances are limited to say 400 metres but if access distances increase thisassumption might be questionable. Other modes such as cycling might then become arealistic possibility.Several of these studies explicitly state that current values for stop and line spacing should beincreased, independent whether they deal with the United States (e.g. Black (1978), Furth &Rahbee (2000)) or the Netherlands (e.g. Egeter (1995), Van Nes & Bovy (2000)). Van Nes &Bovy (2000), for instance, found that the stop spacing should doubled for both bus and tramnetworks and that in the case of bus networks line spacing should be doubled too. As a resultthe average access distance would become about 400 metres and the maximum accessdistance 800 metres, that is in the case of homogeneous distribution of the demand andaccess routes parallel and perpendicular to the lines. Such a maximum access distance isclearly large enough to start considering the possibilities of alternative access modes such asbicycles, peoplemovers, or perhaps even demand responsive transport systems.If it is assumed, for instance, that all travellers use a bicycle to access urban public transportthe access speed will be four times as high compared to the case of walking only. Usingsquare root relationships for stop and line spacing (see Van Nes & Bovy (2000)) this leads todoubling the stop and line spacing once again, resulting in a maximum access distance of1,600 metres. Operational costs might then be reduced to 50%. Of course, this approach isfar from realistic, but it shows the impact of the assumption of the access mode on thenetwork performance characteristics of urban public transport networks.This paper presents an approach that explicitly considers the choice of the access mode in theassessment of the optimal stop and line spacing. The analysis is based on an analytical modelusing the building blocks described by Van Nes & Bovy (2000). However, instead of usingthe advised objective of minimising total costs, the more detailed objective of maximisingsocial welfare is used (Section 2). The model is described briefly in Section 3. Section 4focuses on the results of the model and implications for urban public transport networkdesign. Section 5 summarises the conclusions and presents recommendations for furtherresearch.
2. Maximising social welfare
There are many objectives that might be used in urban public transport network design. It hasbeen shown that the choice of the objective strongly influences the optimal network and theperformance characteristics of urban public transport systems (Van Nes & Bovy (2000)). Itwas concluded from this analysis that the objective of minimising total costs, that is, travellercosts plus operational costs, is most suitable for urban public transport network design. It
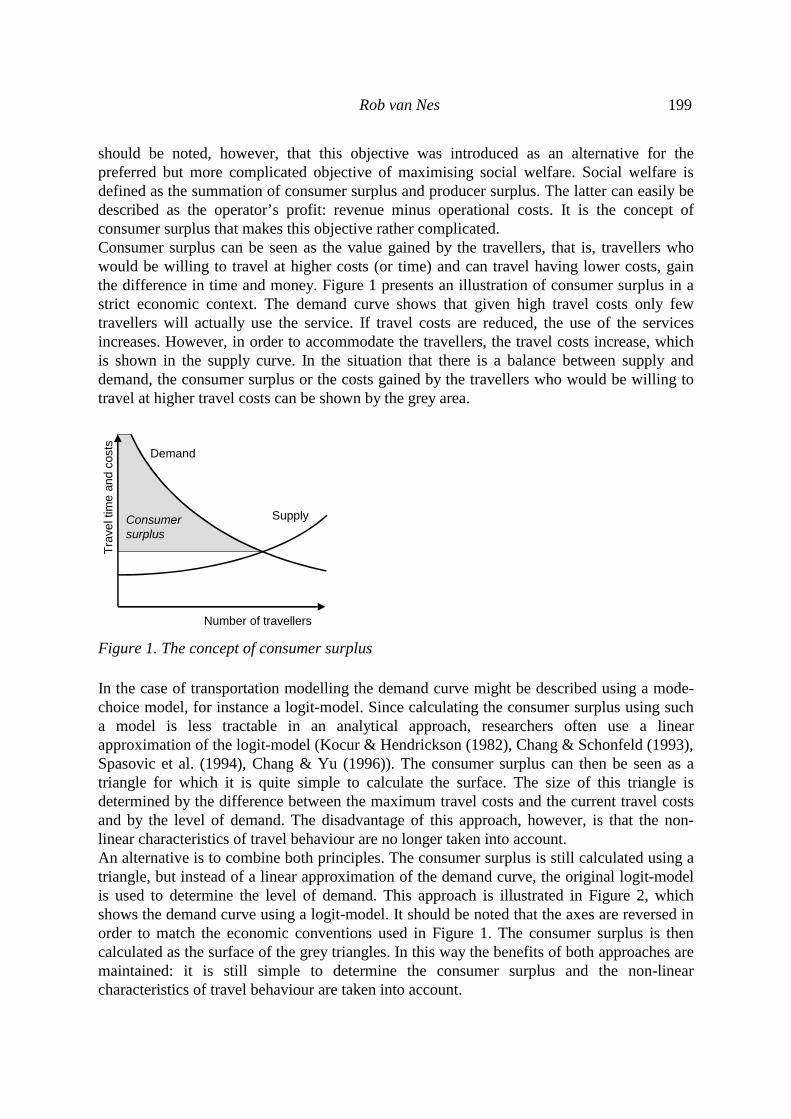
Rob van Nes 199
should be noted, however, that this objective was introduced as an alternative for thepreferred but more complicated objective of maximising social welfare. Social welfare isdefined as the summation of consumer surplus and producer surplus. The latter can easily bedescribed as the operator’s profit: revenue minus operational costs. It is the concept ofconsumer surplus that makes this objective rather complicated.Consumer surplus can be seen as the value gained by the travellers, that is, travellers whowould be willing to travel at higher costs (or time) and can travel having lower costs, gainthe difference in time and money. Figure 1 presents an illustration of consumer surplus in astrict economic context. The demand curve shows that given high travel costs only fewtravellers will actually use the service. If travel costs are reduced, the use of the servicesincreases. However, in order to accommodate the travellers, the travel costs increase, whichis shown in the supply curve. In the situation that there is a balance between supply anddemand, the consumer surplus or the costs gained by the travellers who would be willing totravel at higher travel costs can be shown by the grey area.
Number of travellers
Tra
vel t
ime
and
cost
s
Supply
Demand
Consumersurplus
Figure 1. The concept of consumer surplus
In the case of transportation modelling the demand curve might be described using a mode-choice model, for instance a logit-model. Since calculating the consumer surplus using sucha model is less tractable in an analytical approach, researchers often use a linearapproximation of the logit-model (Kocur & Hendrickson (1982), Chang & Schonfeld (1993),Spasovic et al. (1994), Chang & Yu (1996)). The consumer surplus can then be seen as atriangle for which it is quite simple to calculate the surface. The size of this triangle isdetermined by the difference between the maximum travel costs and the current travel costsand by the level of demand. The disadvantage of this approach, however, is that the non-linear characteristics of travel behaviour are no longer taken into account.An alternative is to combine both principles. The consumer surplus is still calculated using atriangle, but instead of a linear approximation of the demand curve, the original logit-modelis used to determine the level of demand. This approach is illustrated in Figure 2, whichshows the demand curve using a logit-model. It should be noted that the axes are reversed inorder to match the economic conventions used in Figure 1. The consumer surplus is thencalculated as the surface of the grey triangles. In this way the benefits of both approaches aremaintained: it is still simple to determine the consumer surplus and the non-linearcharacteristics of travel behaviour are taken into account.

200 The Impact of Alternative Access Modes on Urban Public Transport Network DesignW
eig
hte
d t
rave
l tim
e b
y p
ub
lic t
ran
spo
rt (
min
)
Share of public transport
0% 10% 20% 30% 40% 50% 60% 70% 80% 90% 100%0
20
40
60
80
100
120
140
160
Figure 2. Two examples of the simplified representation of consumer surplus using a logit-model
It has been found that for urban public transport network design this approach formaximising social welfare leads to similar results as the objective of minimising total costs(Van Nes (2000)). Furthermore it was found that this approach is more robust with respect tothe way the demand is modelled. It depends on the sensitivity of the demand for the qualityof the transport services offered, whether minimising total costs leads to an optimum, whichis in fact a local optimum, or to the trivial solution of offering no transport services at all.Offering no transport services, however, is no optimum for the objective of maximisingsocial welfare.
3. Model description
The analytical model is based on the case of a unit area, for instance a square kilometre, in anurban corridor in which a set of parallel lines offer transport services to the city centre(Figure 3). This might seem a rather typical situation for a public transport network, but ananalysis of the impact of including other trip types (return trips and transversal trips, with andwithout transfer in the city centre) on the optimal network characteristics shows that theresults of this specific case are representative for an urban network (Van Nes (2000)).Similar results were found for a radial city too.The design variables are stop spacing (Ss), line spacing (Sl), and frequency (F). The objectiveis, of course, to maximise social welfare.

Rob van Nes 201
Stop spacing Ss
Line spacing SlCity centre Access route
1,000 metres
1,00
0 m
etre
s
Figure 3. Study area and lay out of the public transport lines
Furthermore, the model is based on the following assumptions:
Travel demand is homogeneously distributed; Fares are fixed; Access routes are parallel and perpendicular to the lines; All lines offer direct access to the city centre, no transfers are needed; Stops in the city centre are located at the main points of interests. Egress times in the city
centre are therefore fixed.
The objective of social welfare consists of consumer surplus, determined by the door-to-doortravel time and the corresponding level of demand, and the producer surplus, determined bythe level of demand and the operational costs. The door-to-door travel time is thus a keyvariable, which consists of different time elements: access time, waiting time, in-vehicletime, and egress time. Weights are used to account for the fact that travellers have differentvaluations for the different parts of the trip.
eeiwwaac TwTTwTwT ⋅++⋅+⋅= (1)
where:
xw
T
T
T
T
T
x
e
i
w
a
c
element time for weight
time egress
time vehicle-in
time waiting
time access
time travel weightedtotal
======
3.1 One access mode
The access time depends on the stop and line spacing (Ss and Sl), and on the access speed Va.Waiting time is determined by the frequency F, and the in-vehicle time depends on theaverage travel distance to the city centre Lc, the stop spacing Ss, and the time lost at stops dueto braking, boarding and alighting, and accelerating (Ts). The weighted travel time can thenbe written as:
( )ees
s
s
cww
a
lsaac TwT
VS
SL
Ff
wV
SSfwT ⋅+
+⋅+⋅++⋅⋅= (2)
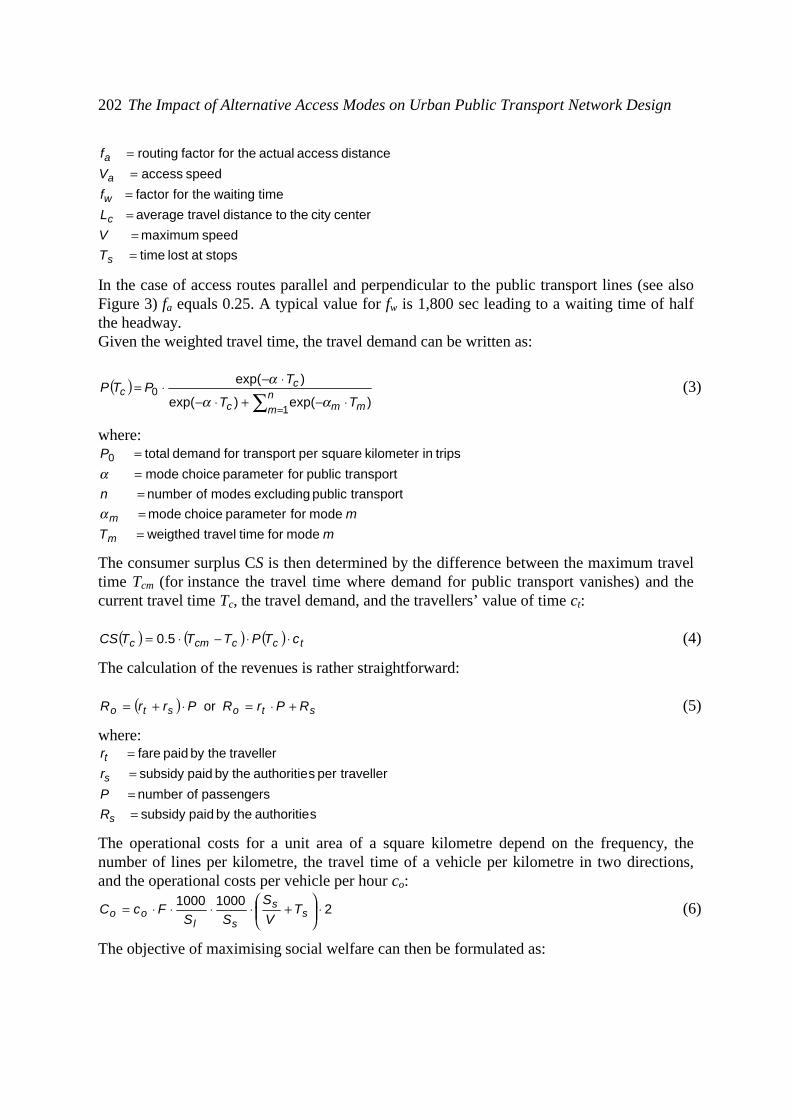
202 The Impact of Alternative Access Modes on Urban Public Transport Network Design
stops at lost time
speed maximum
centercity the to distance travel average
time waitingthe for factor
speed access
distance access actual the for factor routing
==
===
=
s
c
w
a
a
T
V
L
f
V
f
In the case of access routes parallel and perpendicular to the public transport lines (see alsoFigure 3) fa equals 0.25. A typical value for fw is 1,800 sec leading to a waiting time of halfthe headway.Given the weighted travel time, the travel demand can be written as:
( )∑ = ⋅−+⋅−
⋅−⋅=nm mmc
cc
TT
TPTP
1
0)exp()exp(
)exp(
αα
α (3)
where:
mT
m
n
P
m
m
mode for time travel weigthed
mode for parameter choice mode
transportpublic excluding modes of number
transportpublic for parameter choice mode
trips in kilometer square per transport for demand total 0
=====
α
α
The consumer surplus CS is then determined by the difference between the maximum traveltime Tcm (for instance the travel time where demand for public transport vanishes) and thecurrent travel time Tc, the travel demand, and the travellers’ value of time ct:
( ) ( ) ( ) tcccmc cTPTTTCS ⋅⋅−⋅= 5.0 (4)
The calculation of the revenues is rather straightforward:
( ) stosto RPrRPrrR +⋅=⋅+= or (5)
where:
sauthoritie theby paidsubsidy
passengers of number
traveller per sauthoritie theby paidsubsidy
traveller theby paid fare
====
s
s
t
R
P
r
r
The operational costs for a unit area of a square kilometre depend on the frequency, thenumber of lines per kilometre, the travel time of a vehicle per kilometre in two directions,and the operational costs per vehicle per hour co:
210001000 ⋅
+⋅⋅⋅⋅= s
s
sloo T
V
S
SSFcC (6)
The objective of maximising social welfare can then be formulated as:

Rob van Nes 203
( )
( )
⋅
+⋅⋅⋅⋅
−⋅−+⋅−
⋅−⋅⋅+
+⋅⋅−+⋅−
⋅−⋅⋅−⋅
∑
∑
=
=
210001000
)exp()exp(
)exp(
)exp()exp(
)exp(5.0
1
0
1
0
ss
slo
nm mmc
cst
tnm mmc
cccm
TVS
SSFc
TT
TPrr
cTT
TPTT
MAXαα
α
αα
α
(7)
The optimal values for stop spacing Ss, line spacing Sl, and frequency F can be determinedusing enumeration techniques or numerical methods.
3.2 Two access modes
In the case of two access modes, for instance walking and cycling, a distinction must bemade between the populations using each mode, that is P1 and P2. Each of the populationshas its own access time determined by the access distance La and the access speed Vaj. It ispossible that there are more differences between these populations, for instance, with respectto the weight for access time, or the routing factor. Pedestrians for example might have moredirect access routes. In this case, however, it is assumed that the access speed is the onlydifference. The average weighted travel time can then be written as:
eess
s
cww
a
aa
a
aac TwT
V
S
S
LTw
P
P
V
Lw
P
P
V
LwT ⋅+
+⋅+⋅+⋅⋅+⋅⋅= 2
2
1
1(8)
where:( )
21
population for speed access
PPP
jV
SSfL
aj
lsaa
+=
=+⋅=
Please note that it is assumed that the alternative mode is only used to access the publictransport system for a trip to the city centre. In this approach walking is still the only egressmode in the city centre.The size of the sub-populations will depend on the access time per mode, which can bedescribed using the logit-model, just as in Equation 3:
P
V
L
V
L
V
L
P
a
a
a
a
a
a
⋅
−⋅−+
⋅−
⋅−
=ϕαα
α
22
11
11
1
expexp
exp
(9)
The coefficient ϕ appears as a mode-specific constant for cycling.Comparison of both equations for the weighted travel time, that is Equations 2 and 8, showsthat the access speed Va in Equation 2 should be replaced by the average access speed forboth populations:

204 The Impact of Alternative Access Modes on Urban Public Transport Network Design
2
2
1
1
aa
a
V
P
V
PP
V+
= (10)
Given values for the stop and line spacing, Equation 9 can be used to determine which shareof the total population walks to the stop and which share uses a bicycle. Given these sharesEquation 10 is used to determine the average access speed, which is then used in theoptimisation of Equation 7.
4. Application of the model
The models presented in the previous section are applied to a situation that is comparablewith tram network in the southern part of The Hague in the Netherlands. The current valuesfor stop and line spacing are 400 metres and 1,000 metres respectively. The average linelength is circa 7.5 kilometres. If it is assumed that the main function of the tramlines is tooffer transport between the outer areas of the city and the city centre, the average trip lengthis 5 kilometres. The weights used for the different time elements were determined forespecially such trip types in urban areas in the Netherlands (Van der Waard (1988a)). Thereis, however, no knowledge of the traveller’s attitude to using bicycles as an access mode inurban public transport systems. Therefore, different penalties are used in the analysis. Thesepenalties are added to the access time by bicycle.The coefficients of the access mode-choice model of Equation 9 are determined in such away that the resulting shares of walking per travel distance matches those found in the DutchNational Travel Survey (Table 1). It is expected that the maximum access distance rangesbetween 700 (current value) and 1,700 metres (in the case of cycling only).
Table 1. Walking as percentage of all trips for different travel distances (NationalTravel Survey)
Travel distance Share of walking (%)0 – 500 metres 76500 – 1,000 metres 471,000 – 2,500 metres 232,500 – 3,750 metres 8
The following scenarios are analysed:
Access mode walking only; Access mode cycling only; Two access modes: walking and cycling with no penalty; Two access modes: walking and cycling with a penalty for getting and parking the bicycle
(2 min.); Two access modes: walking and cycling with a transfer penalty (5.7 min., that is the
transfer penalty for public transport trips excluding walking and waiting time).
For each scenario the optimal values for the stop spacing, line spacing and frequency aredetermined. The values for the frequencies are limited to the values 4, 6, 8, 10, and 12

Rob van Nes 205
vehicles per hour. The level of demand that is assumed is representative for an average peakhour. The values of the parameters used can be found in the Appendix.Figure 4 shows the shape of the objective function in the case of two access modes and apenalty of 2 minutes as a function of the design variables stop spacing and line spacing. Itclearly shows that there is a large range of values of the design variables where the value ofthe objective function is more or less equal: a common phenomenon for this type of analysis(Van Nes (2000)).
100
400
700
1.00
0
1.30
0
1.60
0
1.90
0
2.20
0
2.50
0
2.80
0
100
800
1.500
2.200
2.900
-3.000
-2.500
-2.000
-1.500
-1.000
-500
0
500
1.000
So
cial
wel
fare
per
sq
uar
e ki
lom
etre
Line spacing
Stop spacing
Figure 4. Objective function social welfare for the case of two access modes and a penalty of2 min.
Given the optimal network characteristics for each scenario all kinds of performancecharacteristics are calculated, such as, travel time (with and without weights), travel demand,operational costs, total costs and social welfare. The results are presented in Table 2 andsummarised in Figure 5.

206 The Impact of Alternative Access Modes on Urban Public Transport Network Design
Table 2. Optimal network parameters and performance characteristics for differentaccess modes for an average peak hour
Scenario Reference Walking Cycling Walking and cyclingTransfer penalty 0 min 2 min 5.7 minStop spacing (m) 400 800 1,500 1,100 1,000 900Line spacing (m) 1,000 900 2,100 1,500 1,300 1,000Frequency (veh/h) 6 6 10 8 8 6Walking as access mode (%) 100 100 0 51 57 68Access speed (km/h) 4 4 16 6.4 5.1 3.9Travel time (min) 26.3 23.9 17.3 21.5 22.3 24.4Access time (min) 5.3 6.4 3.4 6.1 6.8 7.3Waiting time (min) 5.0 5.0 3.0 3.8 3.8 5.0In-vehicle time (min) 13.1 9.5 7.9 8.6 8.8 9.1Weighted travel time (min) 35.4 34.4 23.1 31.0 32.5 35.9Travel demand (pas/km2/h) 125 126 137 130 128 125Operational costs (€/km2/h) 86 69 41 50 59 60Producer surplus (€/km2/h) -15 2 36 24 13 11Consumer surplus (€/km2/h) 494 503 605 533 520 490Social welfare (€/km2/h) 479 505 641 557 533 501
In the case of walking only the stop spacing is twice as large. Compared to the referencesituation the travel time is nearly 10 % lower. Operational costs are 19 % lower, while socialwelfare is 5 % higher. If all travellers would use a bicycle, stop spacing is four times as large.In this case the optimal values for line spacing and frequency are higher too. Travel time is34% lower, while operational costs are more than 50 % lower. Social welfare is 34 % higher.These impacts on the optimal network parameters and performance characteristics arestrongly reduced if walking and cycling are considered as two alternative modes, from whichthe traveller may choose. The larger the penalty, the smaller the impact.If the case of a penalty of 2 minutes is compared to that the optimum for walking only, thestop spacing of 1,0000 metres is 25 % higher. Line spacing is nearly 45 % higher up to 1,300metres, enabling a frequency of 8 vehicles per hour. Nearly 60 % of the travellers walk to thestops, leading to an average access speed of 5.1 km/h. Travel times are 5 % lower, while theoperational costs are more than 10 % lower. The resulting level of social welfare is anadditional 6 % higher leading to a total improvement of 11 % compared to the referencesituation.In all cases, stop spacing and social welfare are higher while travel time and operational costsare lower. All scenarios lead thus to better network structures than the reference situation:less stops but higher quality at lower costs. If cycling is considered as access mode, linespacing and frequency are higher too, except for the case of a high penalty for bicycle usage.In the cases of no penalty or a small penalty for bicycle usage, the combination of walkingand cycling as access modes leads to coarser and more attractive network structures for allpossible points of view: traveller, operator, and society. If the penalty for using bicycles as anaccess mode is high, however, the network optimised for walking only is better with respectto travel time, total costs and social welfare. Since there is a small population opting forusing a bicycle where walking would be faster, the average access speed drops slightly to 3.9km/h. Contrary to the expectations, the resulting stop and line spacing are higher, which isthe result of the non-linear characteristics of the access time.
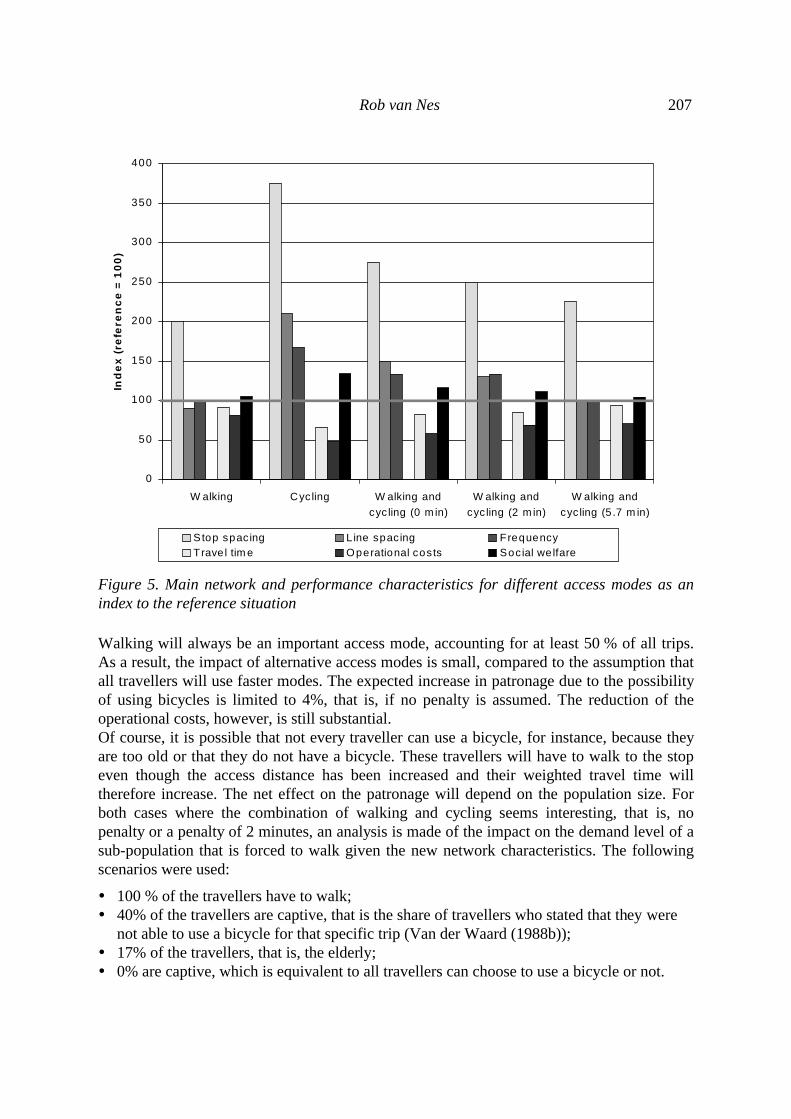
Rob van Nes 207
0
50
100
150
200
250
300
350
400
W alking Cycling W alking and
cyc ling (0 m in)
W alking and
cyc ling (2 m in)
W alking and
cyc ling (5 .7 m in)
Ind
ex
(re
fere
nc
e =
10
0)
Stop spac ing L ine spac ing FrequencyTrave l tim e Operational costs Social we lfare
Figure 5. Main network and performance characteristics for different access modes as anindex to the reference situation
Walking will always be an important access mode, accounting for at least 50 % of all trips.As a result, the impact of alternative access modes is small, compared to the assumption thatall travellers will use faster modes. The expected increase in patronage due to the possibilityof using bicycles is limited to 4%, that is, if no penalty is assumed. The reduction of theoperational costs, however, is still substantial.Of course, it is possible that not every traveller can use a bicycle, for instance, because theyare too old or that they do not have a bicycle. These travellers will have to walk to the stopeven though the access distance has been increased and their weighted travel time willtherefore increase. The net effect on the patronage will depend on the population size. Forboth cases where the combination of walking and cycling seems interesting, that is, nopenalty or a penalty of 2 minutes, an analysis is made of the impact on the demand level of asub-population that is forced to walk given the new network characteristics. The followingscenarios were used:
100 % of the travellers have to walk; 40% of the travellers are captive, that is the share of travellers who stated that they were
not able to use a bicycle for that specific trip (Van der Waard (1988b)); 17% of the travellers, that is, the elderly; 0% are captive, which is equivalent to all travellers can choose to use a bicycle or not.
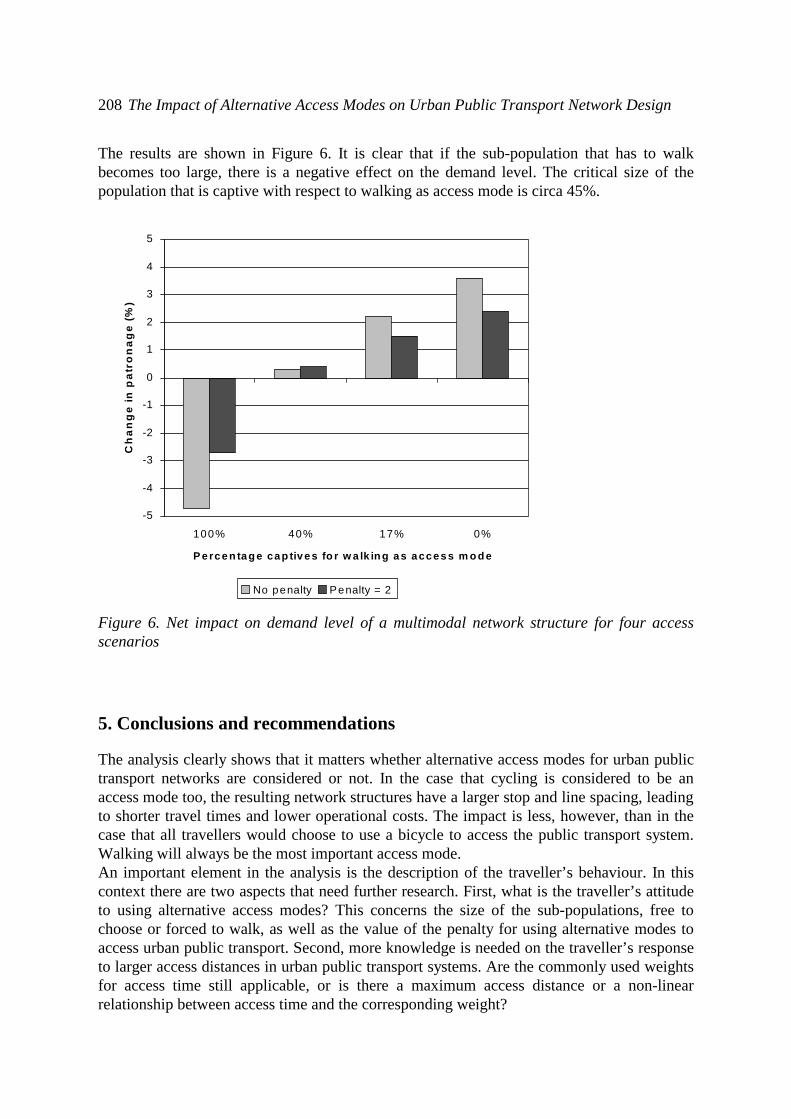
208 The Impact of Alternative Access Modes on Urban Public Transport Network Design
The results are shown in Figure 6. It is clear that if the sub-population that has to walkbecomes too large, there is a negative effect on the demand level. The critical size of thepopulation that is captive with respect to walking as access mode is circa 45%.
-5
-4
-3
-2
-1
0
1
2
3
4
5
100% 40% 17% 0%
P e rc e n ta g e ca p tiv e s fo r w a lk in g a s a cc e s s m o d e
Ch
an
ge
in
pa
tro
na
ge
(%
)
No penalty Penalty = 2
Figure 6. Net impact on demand level of a multimodal network structure for four accessscenarios
5. Conclusions and recommendations
The analysis clearly shows that it matters whether alternative access modes for urban publictransport networks are considered or not. In the case that cycling is considered to be anaccess mode too, the resulting network structures have a larger stop and line spacing, leadingto shorter travel times and lower operational costs. The impact is less, however, than in thecase that all travellers would choose to use a bicycle to access the public transport system.Walking will always be the most important access mode.An important element in the analysis is the description of the traveller’s behaviour. In thiscontext there are two aspects that need further research. First, what is the traveller’s attitudeto using alternative access modes? This concerns the size of the sub-populations, free tochoose or forced to walk, as well as the value of the penalty for using alternative modes toaccess urban public transport. Second, more knowledge is needed on the traveller’s responseto larger access distances in urban public transport systems. Are the commonly used weightsfor access time still applicable, or is there a maximum access distance or a non-linearrelationship between access time and the corresponding weight?

Rob van Nes 209
The traveller’s attitude to using alternative modes determines the implications for planingpractice. If there are enough travellers having a positive attitude to using, for instance, abicycle to access the urban public transport system, an urban public transport network shouldhave larger stop and line spacing and a higher frequency. The net impact on the demandmight be small, but travel times and especially operational costs will be reduced. However, ifthere is only a small population willing to use a bicycle, or if the penalty for using a bicycleis high, then it is better to assume that walking is the only access mode. Of course, it mightbe interesting in this case to provide parking facilities for bicycles at a subset of stops, forinstance, every second stop at the outskirts if the city, to make urban public transport moreattractive.Finally, the discussion presented in this paper focuses on the impact of cycling as anadditional access mode to urban public transport systems. The conclusions with respect tothe impact on public transport network structures, however, are certainly representative forother access modes too, for instance, peoplemovers or demand responsive transport systems.It might even be expected that for such modes a higher penalty must be used than for cycling.The use of bicycles is widely spread, at least in countries such as Denmark or theNetherlands, and what is more important, the traveller can take care of his own access trip.The use of peoplemovers and demand responsive transport systems introduces a dependencyon the quality of these transport systems, for instance, the frequency and the punctuality. Thisimplies that these transport systems should be used as access modes for higher level publictransport networks only.
Acknowledgements
This publication is a product of the research program Seamless Multimodal Mobility, carriedout within the Netherlands TRAIL Research School for Transport, Infrastructure andLogistics, and financed by the Delft University of Technology. The author would like tothank the reviewers for their comments.
References
Black A. (1978) Optimizing Urban Mass Transit Systems. A General Model, TransportationResearch Record 677, pp. 41-47
Chang S.K. and P.M. Schonfeld (1993) Welfare Maximization with Financial Constraints forBus Transit Systems, Transportation Research Record 1395, pp. 48-57
Chang S.K. and W.J. Yu (1996) Comparison of Subsidized Fixed- and Flexible-Route BusSystems, Transportation Research Record 1557, pp. 15-20
Egeter, B. (1995) Optimizing Public Transport Structure in Urban Areas, Proceedings ofTransportation Congress, Volume 2, San Diego
Furth, P.G. and A.B. Rahbee (2000) Optimal Bus Stop Spacing Using DynamicProgramming and Geographic Modeling, Transportation Research Record 1731, pp. 15-22
Kocur, G. and C. Hendrickson (1982) Design of Local Bus Service with DemandEquilibration, Transportation Science, Vol. 16, No. 2, pp. 149-170

210 The Impact of Alternative Access Modes on Urban Public Transport Network Design
Spasovic, L.N., M.P. Boile and A.K. Bladikas (1994) Bus Transit Service Coverage forMaximum Profit and Social Welfare, Transportation Research Record 1451, pp. 12-22
Van der Waard, J. (1988a) The Relative Importance of Public Transport Trip-time Attributesin Route Choice, PTRC Summer Annual Meeting, Bath
Van der Waard, J. (1988b) Onderzoek weging tijdelementen, Deelrapport 3: Analyseroutekeuzegedrag van openbaar vervoerreizigers, Report VK 5302.303, TU Delft, Delft
Van Nes, R. (2000) Optimal Stop and Line Spacing for Urban Public Transport Networks.Analysis of Objectives and Implications for Planning Practice, TRAIL Studies inTransportation Science S2000/01, TRAIL, Delft
Van Nes, R. and P.H.L. Bovy (2000) The Importance of Objectives in Urban PublicTransport Network Design, Transportation Research Record 1735, pp. 41-47
Appendix: Values of the parameters used
Parameter Symbol Value UnitsTravel distance Lc 5,000 mAccess speed walking Va1 1.1 m/sAccess speed cycling Va2 4.4 m/sFactor access distance fa 0.25Factor waiting time fw 1,800 sMaximum speed public transport V 13.9 m/sTime lost at stops Ts 34 sEgress time Te 180 sWeight access time wa 2.2Weight waiting time ww 1.5Weight egress time we 1.1Travel demand per square kilometre P0 175 /km2
Value of time for travellers ct 4.55 €/hOperating costs per vehicle co 164 €/hFare rf 0.55 €Subsidy rs 0 €Parameter mode choice model public transport α 0.03 min-1
Parameter mode choice model private car αm 0.08 min-1
Average speed private car 4.2 m/sParking penalty private car 300 sParameter access mode choice walking α1 0.12 min-1
Parameter access mode choice cycling α2 0.08 min-1
Mode specific constant cycling φ 1.0
Book Review:
D.G. Janelle & D.C. Hodge (eds.)Information, Place and Cyberspace. Issues in Accessibility1
Hugo PriemusOTB Research Institute for Housing, Urban and Mobility StudiesDelft University of TechnologyDelftThe NetherlandsE-mail: [email protected]
EJTIR, 1, no. 2 (2001), pp. 211 - 214
Received: February 2001Accepted: May 2001
Since 1995, Springer Verlag has published the series ‘Advances in Spatial Science’, in whichstudies have appeared about ‘Sustainable Cities and Energy Policies’ (R. Capello, P.Nijkamp & G. Pepping), Geographical Information and Planning (J. Stillwell, S. Geertman &S. Openshaw, eds.) and ‘Spatial Dynamics of European Integration’ (H.M. Fischer & P.Nijkamp, eds.) and so forth. In 2000, the book ‘Information, Place and Cyberspace. Issues inAccessibility’ appeared, published by Don Janelle and David Hodge. The book was aconsequence of a workshop in the context of the Varenius project and funded by the NationalScience Foundation, held in November 1998 in Pacific Grove (California). The theme of theconference was ‘Measuring and Representing Accessibility in the Information Age’. It wassponsored by the National Center for Geographic Information and Analysis (NCGIA).The objectives of the book are to broaden understanding of conceptual and analyticalapproaches to accessibility research appropriate to the information age, and to demonstratepossible contributions for geographic information science in representing the geographies ofthe information society. In seeking to meet these objectives, the editors and authors highlightsignificant linkages among information resources, traditional places, and cyberspace, andfocus on expanding models of space (and time) that encompass both the physical and virtualworlds. 1 Janelle, D.G. and D.C. Hodge (eds.)
Information, Place and Cyberspace. Issues in AccessibilitySpringer Verlag (Berlin, Heidelberg, New York etc.)2000ISBN 3-540-67492-6376 p.
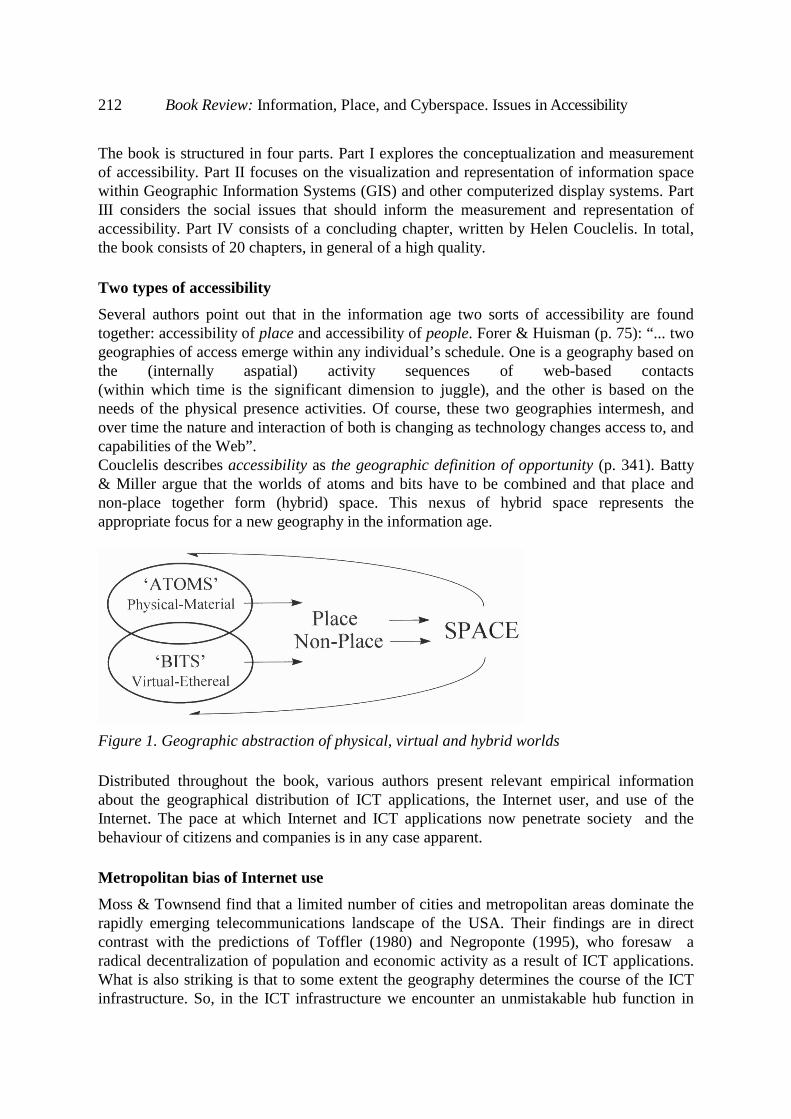
212 Book Review: Information, Place, and Cyberspace. Issues in Accessibility
The book is structured in four parts. Part I explores the conceptualization and measurementof accessibility. Part II focuses on the visualization and representation of information spacewithin Geographic Information Systems (GIS) and other computerized display systems. PartIII considers the social issues that should inform the measurement and representation ofaccessibility. Part IV consists of a concluding chapter, written by Helen Couclelis. In total,the book consists of 20 chapters, in general of a high quality.
Two types of accessibility
Several authors point out that in the information age two sorts of accessibility are foundtogether: accessibility of place and accessibility of people. Forer & Huisman (p. 75): “... twogeographies of access emerge within any individual’s schedule. One is a geography based onthe (internally aspatial) activity sequences of web-based contacts(within which time is the significant dimension to juggle), and the other is based on theneeds of the physical presence activities. Of course, these two geographies intermesh, andover time the nature and interaction of both is changing as technology changes access to, andcapabilities of the Web”.Couclelis describes accessibility as the geographic definition of opportunity (p. 341). Batty& Miller argue that the worlds of atoms and bits have to be combined and that place andnon-place together form (hybrid) space. This nexus of hybrid space represents theappropriate focus for a new geography in the information age.
Figure 1. Geographic abstraction of physical, virtual and hybrid worlds
Distributed throughout the book, various authors present relevant empirical informationabout the geographical distribution of ICT applications, the Internet user, and use of theInternet. The pace at which Internet and ICT applications now penetrate society and thebehaviour of citizens and companies is in any case apparent.
Metropolitan bias of Internet use
Moss & Townsend find that a limited number of cities and metropolitan areas dominate therapidly emerging telecommunications landscape of the USA. Their findings are in directcontrast with the predictions of Toffler (1980) and Negroponte (1995), who foresaw aradical decentralization of population and economic activity as a result of ICT applications.What is also striking is that to some extent the geography determines the course of the ICTinfrastructure. So, in the ICT infrastructure we encounter an unmistakable hub function in
Hugo Priemus 213
Atlanta, Chicago and Dallas. Moss & Townsend conclude: “Just as the Interstate HighwaySystem transformed urban development in 20th century America, the Internet will help shapeurban activity patterns in the 21st century”.
Internet and the home
The impression given is that in the information age the function of the home will changemarkedly. None of the authors takes up the issue explicitly. Sui (p. 116) does however reportthat several national surveys have confirmed that for the first time there are more people (36million) accessing the Net from home than from work (26 million). These data are inaccordance with the data on Canada presented by Harvey and Macnab.
Internet user and Internet use
The Internet user profile shifted in the USA between 1994 and 1997 towards older agecategories, towards women, towards households with a somewhat lower income, andtowards the less highly educated. Nevertheless, Internet use is still a selective activity whereyoung, rich, well educated men dominate the scene.
Fragmentation of activities
The theme of the book is fairly obvious and we may expect more publications, dealing withthe changing meaning of space as a result of the large-scale access to new information andcommunication technologies. Certainly, a strategic research and policy issue is at stake here.Janelle & Hodge announce (p. 9): “A hybrid blend of physical and virtual space may nowconstitute the new geography of the information age”. The editors and authors are searchingfor a new meaning for space and access through which a new paradigm for spatial sciencescould be created.Couclelis states that a profound reorganization of activity patterns is taking place on all scalelevels, so that the net number of interactions that involve physical movement rather thanelectronic contact appears to be increasing rather than decreasing. She explains a large partof this phenomenon, arguing that a fragmentation of activity is taking place, by describinghow activities that used to be associated with a single location (the workplace, for example),are now increasingly scattered among geographically distant locations (the office, home,associate’s home, hotel room, car, train, or plane). The contact set of individuals, the numberof places with which they interact, explodes per activity from one location to a potentiallyindefinite number of locations.
Adaptability instead of accessibility
The authors are certainly not all looking in the same direction. Sui provides a waywardcontribution in which he advocates that adaptability, not accessibility should be chosen asthe central theme for research in the geography of the information society.Sui (p. 108): “It would be disastrous if we continued to let accessibility dictate our researchand policy agenda in the information age. Many studies have indicated that having access tounlimited amounts of information is not necessarily beneficial to an individual or anorganization. In fact, information overload (having access to too much information) may beequally or more harmful than having too little information.”
214 Book Review: Information, Place, and Cyberspace. Issues in Accessibility
Societal issues
Part III deals with Societal Issues; this part is certainly not the strongest of the book. Onsrudpresents a contribution on the ‘Legal Access to Geographic Information: Measuring Lossesor Developing Responses?’ He argues that the foundations of citizens’ legal rights to accessinformation are being undermined as we move into networked digital data environments. Asa result, widespread loss of access information and works of knowledge in US society isoccurring. This is something to be elaborated further; indeed, it is important to find responsesbefore it is too late.Hanson and Occelli each provide a new conceptualization of accessibility, without reallytouching on the societal issues. And Mugerauer, presenting an interesting contribution onqualitative GIS, does not really deal with societal issues either. Perhaps it is too early to takesocietal issues fully on board.
Power of the book
The power of the book certainly does not lie in the specification and explanation of theimpact of ICTs on human behaviour, global economies, the home, the workplace, theneighbourhood, the city or the whole society. There is a clear focus on the impact of ICTs oncities, but in this respect too. the new questions are more important than the final answers.The book succeeds in persuading the reader that spatial developments and spatial planningwill really change as a result of the adoption of ICTs. There will be changes in spatialsciences in general and geography in particular, as Graham & Marvin (1996) have arguedearlier. The book provides the data, the questions, and the inspiration for a new researchagenda for spatial sciences. There are very many books with less to offer!
References
Graham, S. and S. Marvin (1996) Telecommunications and the City. Electronic Spaces,Urban Places, London, Routledge.
Negroponte, N. (1995) Being Digital, New York, A.A. Knopf.
Toffler, A. (1980) The Third Wave, New York, William Morrow & Co.