The Impact of Adjuvant Chemotherapy on Survival for ...
51
University of Kentucky University of Kentucky UKnowledge UKnowledge Theses and Dissertations--Public Health (M.P.H. & Dr.P.H.) College of Public Health 2018 The Impact of Adjuvant Chemotherapy on Survival for Patients The Impact of Adjuvant Chemotherapy on Survival for Patients with Stage II Colon Cancer Portfolio with Stage II Colon Cancer Portfolio Li Ding University of Kentucky, [email protected] Follow this and additional works at: https://uknowledge.uky.edu/cph_etds Part of the Public Health Commons Right click to open a feedback form in a new tab to let us know how this document benefits you. Right click to open a feedback form in a new tab to let us know how this document benefits you. Recommended Citation Recommended Citation Ding, Li, "The Impact of Adjuvant Chemotherapy on Survival for Patients with Stage II Colon Cancer Portfolio" (2018). Theses and Dissertations--Public Health (M.P.H. & Dr.P.H.). 218. https://uknowledge.uky.edu/cph_etds/218 This Graduate Capstone Project is brought to you for free and open access by the College of Public Health at UKnowledge. It has been accepted for inclusion in Theses and Dissertations--Public Health (M.P.H. & Dr.P.H.) by an authorized administrator of UKnowledge. For more information, please contact [email protected].
Transcript of The Impact of Adjuvant Chemotherapy on Survival for ...

University of Kentucky University of Kentucky
UKnowledge UKnowledge
Theses and Dissertations--Public Health (M.P.H. & Dr.P.H.) College of Public Health
2018
The Impact of Adjuvant Chemotherapy on Survival for Patients The Impact of Adjuvant Chemotherapy on Survival for Patients
with Stage II Colon Cancer Portfolio with Stage II Colon Cancer Portfolio
Li Ding University of Kentucky, [email protected]
Follow this and additional works at: https://uknowledge.uky.edu/cph_etds
Part of the Public Health Commons
Right click to open a feedback form in a new tab to let us know how this document benefits you. Right click to open a feedback form in a new tab to let us know how this document benefits you.
Recommended Citation Recommended Citation Ding, Li, "The Impact of Adjuvant Chemotherapy on Survival for Patients with Stage II Colon Cancer Portfolio" (2018). Theses and Dissertations--Public Health (M.P.H. & Dr.P.H.). 218. https://uknowledge.uky.edu/cph_etds/218
This Graduate Capstone Project is brought to you for free and open access by the College of Public Health at UKnowledge. It has been accepted for inclusion in Theses and Dissertations--Public Health (M.P.H. & Dr.P.H.) by an authorized administrator of UKnowledge. For more information, please contact [email protected].

STUDENT AGREEMENT: STUDENT AGREEMENT:
I represent that my capstone and abstract are my original work. Proper attribution has been
given to all outside sources. I understand that I am solely responsible for obtaining any needed
copyright permissions. I have obtained needed written permission statement(s) from the
owner(s) of each third-party copyrighted matter to be included in my work, allowing electronic
distribution (if such use is not permitted by the fair use doctrine) which will be submitted to
UKnowledge as Additional File.
I hereby grant to The University of Kentucky and its agents the irrevocable, non-exclusive, and
royalty-free license to archive and make accessible my work in whole or in part in all forms of
media, now or hereafter known. I agree that the document mentioned above may be made
available immediately for worldwide access unless an embargo applies.
I retain all other ownership rights to the copyright of my work. I also retain the right to use in
future works (such as articles or books) all or part of my work. I understand that I am free to
register the copyright to my work.
REVIEW, APPROVAL AND ACCEPTANCE REVIEW, APPROVAL AND ACCEPTANCE
The document mentioned above has been reviewed and accepted by the student’s advisor, on
behalf of the advisory committee, and by the Director of Graduate Studies (DGS), on behalf of
the program; we verify that this is the final, approved version of the student’s capstone including
all changes required by the advisory committee. The undersigned agree to abide by the
statements above.
Li Ding, Student
Dr. Bin Huang, Committee Chair
Dr. Sarah Wackerbarth, Director of Graduate Studies

i
The Impact of Adjuvant Chemotherapy on
Survival for Patients with Stage II Colon
Cancer Portfolio
Li Ding
MPH
Biostatistics

ii
Contents 1. PROJECT DESCRIPTION ......................................................................................................................... 1
2. NOTES ................................................................................................................................................... 2
2.1 Patient selection algorithm in SEER dataset ............................................................................... 2
2.2 High-risk features of recurrence in SEER dataset ........................................................................ 2
2.3 Risk group definition .................................................................................................................... 3
2.4 Subgroups of high-risk group ....................................................................................................... 3
2.5 Characteristics of patients ........................................................................................................... 4
2.6 Chemotherapy Records ................................................................................................................ 4
3. SAS CODE .............................................................................................................................................. 5
3.1 Data Input and Format ................................................................................................................. 5
3.2 Describe the Characteristics of Patients ...................................................................................... 7
3.3 Survival Analysis ........................................................................................................................... 8
4. OUTPUTS ............................................................................................................................................. 13
4.1 Frequency Table Outputs ........................................................................................................... 13
4.2 Survival analysis Outputs ........................................................................................................... 18
5. RESULTS ANALYSIS ............................................................................................................................. 27
5.1 Frequency Table Results ............................................................................................................. 27
5.2 Survival Analysis Results ............................................................................................................ 27
6. REPORTS (Analysis outcomes summary) ........................................................................................... 28
7. LESSONS .............................................................................................................................................. 28
8. PAPER DRAFT ...................................................................................................................................... 29
ABSTRACT ............................................................................................................................................... 29
Purpose ............................................................................................................................................... 29
Patients and Methods ........................................................................................................................ 29
Results ................................................................................................................................................. 29
Conclusion ........................................................................................................................................... 29
INTRODCTION ......................................................................................................................................... 29
PATIENTS AND METHODS ...................................................................................................................... 30
Data source ......................................................................................................................................... 30
Study Population ................................................................................................................................ 30

iii
Variables ............................................................................................................................................. 31
Statistical Analysis .............................................................................................................................. 31
RESULTS .................................................................................................................................................. 32
Characteristics of Patients ................................................................................................................. 32
Survival Benefit of Chemotherapy ..................................................................................................... 32
DISCUSSION ............................................................................................................................................ 33
CONCLUSIONS ......................................................................................................................................... 33
REFERENCES ............................................................................................................................................ 39
9. Defense Presentation ......................................................................................................................... 40

1
1. PROJECT DESCRIPTION
It is controversial for patients with stage II colon cancer to use adjuvant chemotherapy after
surgery. Although in theory, adjuvant chemotherapy can reduce the risk of cancer recurrence after
surgery, many studies indicated that the improvement of adjuvant chemotherapy on survival is minimal
for patients with stage II colon cancer. Adjuvant chemotherapy are not recommended to routine use in
patients with stage II colon cancer; However, if patients present any high risk feature of recurrence,
including T4 tumor, poorly/differentiated histology, lymphovascular invasion, perineural invasion, less
than 12 lymph nodes were removed or could be assessed, positive margin, obstruction, or perforation,
adjuvant chemotherapy can be considered to use, but it does not mean that adjuvant chemotherapy
should be used for all stage II patients who present high-risk features. Patients with these features still
need to talk with their doctors to decide if they can use chemotherapy or not. Until now, there are not
uniform standards about which part of patients with stage II colon cancer should receive adjuvant
chemotherapy. The purpose of this study was to explore if adjuvant chemotherapy can really improve
the survival of patients with stage II colon cancer, especially for patients who presented any high-risk
feature of recurrence.
A total of 23,354 patients with stage II colon cancer and received colon cancer primary site
surgery were selected from SEER dataset based on patient selection algorithm (Note 1). Considering that
some patients had bad health condition and died before they could receive adjuvant chemotherapy, we
excluded patients who survived at less than 6 months after diagnosis. We found the information of five
high-risk features in SEER dataset, including T4 tumor, poorly/differentiated histology, perineural
invasion, less than 12 lymph nodes were removed or could be assessed, and positive margin
involvement (Note 2). Patients were divided into low-risk group and high-risk group according to if they
presented any high-risk feature (Note 3). High-risk group patients were further divided into five
subgroups (Note 4). We used 𝑥2 test to describe the characteristics of patients in low and high risk
groups. These characteristics included five sociodemographic variables (age, gender, race, year of
diagnosis, and urban/rural status) and five cancer-related variables (T stage, nodes examined, histology
grades, margin involvement, and perineural invasion) (Note 5). Then, we used survival analysis (Kaplan-
Meier test and Cox regression analysis) to compare the survival difference by chemotherapy record (Yes
vs. No/Unknown) in each risk group. For survival analysis, the primary explanatory variable was
chemotherapy. The primary outcome variable was overall survival. The primary statistical tool is SAS 9.0.
The univariate survival analysis reflected that no matter patients presented any high-risk feature
or not, the survival rate of patients who received chemotherapy was obviously better than those who
did not or unknown. This difference disappeared after multivariate survival analysis (patients’
sociodemographic characteristics were controlled). The possible reason was that younger patients were
more likely to receive chemotherapy and younger patients had better survival than older patients.
Chemotherapy did not really improve patients’ survival. We guessed that maybe for some special high-
risk features, chemotherapy could improve patients’ survival, but for some other features,
chemotherapy could not improve patients’ survival. After analysis, we found when patients presented
T4 tumor feature, no matter they presented any other high-risk features or not, chemotherapy could
improve their survival. For other four high-risk features, we could not decide if chemotherapy really
improved patients’ survival.

2
2. NOTES
2.1 Patient selection algorithm in SEER dataset
2.2 High-risk features of recurrence in SEER dataset
High risk feature Seer code field Seer code Other definition
Higher T stage (T4 versus T3)
Derived AJCC T, 6th ed (2004+)
T3 and T4
Less than 12 lymph nodes were removed or could be assessed.
Regional nodes examined (1988+)
00-99, Records the total number of regional lymph nodes that were removed and examined by the pathologist.
Poorly differentiated histology
Grade Well differentiated; Grade I Moderately differentiated; Grade II Poorly differentiated; Grade III Undifferentiated; anaplastic; Grade IV
Presence of lymphovascular invasion
Lymph-vascular Invasion (2004+ varying by schema)
Blank(s)
bowel obstruction or bowel perforation
No Obstruction: Medicare, ICD-9-CM Diagnosis
Variables Definition
Colon cancer Primary Site
Site recode ICD-O-3/WHO 2008= Colon excluding Rectum; Primary Site= C18.0-18.9 Histology = 8140-8147,8210-8211,8220-8221,8260-8263,8480-8481,8490 First malignant primary indicator=Yes
Colon cancer stage AJCC.Derived AJCC Stage Group, 7th ed (2010+)= 'II','IINOS','IIA','IIB','IIC','IIEA','IIEB','IIE','IISA','IISB','IIS','IIESA','IIESB','IIES'
Colon cancer primary surgery
Surg Prim Site (1998+)=30-80
Age >=20
Diagnosis year 2010-2015
Race All race
gender Male and Female
Survival Month Complete data are available and there are more than 0 days of survival Survival Month >=6

3
560.89, 560.90 Perforation: Medicare, ICD-9-CM Diagnosis 569.83
Indeterminate or positive margins
CS site specific factor 6 Circumferential Resection Margin (CRM)
Positive 0-10 Negative 11-996 (except 988) Unknown 998,999
Presence of perineural invasion
CS Site-Specific Factor 8 Perineural Invasion
No Presence: 0 Presence:10 Unknown: 988, 998, 999
2.3 Risk group definition
Low-risk group High-risk group
Patients presented features: “T3 stage” AND “>=12 lymph nodes were removed or could be assessed” AND “Well or Moderately differentiated” AND “Negative margins” AND “No presence of perineural invasion”
Patients present features: “T4 stage” OR “<12 lymph nodes were removed or could be assessed” OR “Poorly or Undifferentiated differentiated” OR “Positive margins” OR “Presence of perineural invasion”
2.4 Subgroups of high-risk group
Subgroup Definition
Subgroup 1 Patients presented high-risk feature: T4 tumor feature
Subgroup 2 Patients presented high-risk feature: <12 lymph nodes were removed or could be assessed
Subgroup 3 Patients presented high-risk feature: Poorly or undifferentiated histology
Subgroup 4 Patients presented high-risk feature: Positive Margin
Subgroup 5 Patients presented high-risk feature: Presence of perineural invasion

4
2.5 Characteristics of patients
Sociodemographic characteristics (Control variables)
Age, Gender, Race, Year of Diagnosis, and Urban/Rural Status
Cancer-related characteristics (Stratification variables)
T stage, nodes examined, histology grades, margin involvement, and perineural invasion
2.6 Chemotherapy Records Because SEER dataset did not record the time of chemotherapy, we could not distinguish
adjuvant and non-adjuvant of chemotherapy. However, considering that for stage II colon cancer,
there were few patients received chemotherapy before surgery. We can consider all chemotherapy
record in SEER dataset as adjuvant chemotherapy. We will use KCR data to check the percentage of
adjuvant chemotherapy among all chemotherapy records.

5
3. SAS CODE 3.1 Data Input and Format
filename in1 'D:\Chemotherapy for stage II colon cancer\exportnew.txt';
ods rtf file='D:\Chemotherapy for stage II colon cancer\export.rtf';
*Input data;
data casedat;
infile in1 LRECL = 32000 delimiter = '09'X TERMSTR = CRLF;
length Patient_ID $19
Site_recode_ICD_O_3_WHO_2008 $53
RX_Summ_SurgPrimSite1998 $20
Age_recode_with_1_year_olds $11
Race_recode_White_Black_Other $59
Sex $15
Year_of_Diagnosis $9
RuralUrban_Continuum_Code_2013 $60
DerivedAJCC_T_7thed2010 $9
Regional_nodes_examined1998 $9
Grade $9
CRM6 $60
Perineural_Invasion8 $9
Survival_months $11
Vitalstatusrecodestudycutoffus $5
Chemotherapy_Recode $5
;
/*NOTE: skipping over field names*/
if _N_ = 1 then input;
input Patient_ID $
Site_recode_ICD_O_3_WHO_2008 $
RX_Summ_SurgPrimSite1998 $
Age_recode_with_1_year_olds $
Race_recode_White_Black_Other $
Sex $
Year_of_Diagnosis $
RuralUrban_Continuum_Code_2013 $
DerivedAJCC_T_7thed2010 $
Regional_nodes_examined1998 $
Grade $
CRM6 $
Perineural_Invasion8 $
Survival_months $
Vitalstatusrecodestudycutoffus $
Chemotherapy_Recode $
;
* Label data variables;
label Patient_ID = "Patient ID"
Site_recode_ICD_O_3_WHO_2008 = "Site recode ICD-O-3/WHO 2008"
RX_Summ_SurgPrimSite1998 = "Surgery Record"
Age_recode_with_1_year_olds = "Age recode with <1 year olds"
Race_recode_White_Black_Other = "Race recode (White, Black, Other)"
Sex = "Sex"
Year_of_Diagnosis = "Year of Diagnosis"
RuralUrban_Continuum_Code_2013 = "Rural-Urban Continuum Code 2013"
DerivedAJCC_T_7thed2010 = "T stage"
Regional_nodes_examined1998 = "Lymph nodes examined"

6
Grade=" Histology grade"
CRM6="Tumor Margin Involvement"
Perineural_Invasion8="Perineural Invasion"
Survival_months = "Survival months"
Vitalstatusrecodestudycutoffus = "Vital status recode (study cutoff
used)"
Chemotherapy_Recode="Chemotherapy Record"
;
run;
*Foramt data value;
proc format ;
value agegf 1='20-49' 2='50-64' 3='65-74' 4='75+';
value racef 1='White' 2='Black' 3='Other' 9='unknown';
value sexf 1="Male" 2="Female";
value yearf 1="2010-2011" 2="2012-2013" 3="2014-2015" ;
value metrof 1="Metro" 2="Rural" 3="Unknown";
value Tstagef 1='T3 ' 2='T4' 3='Unknown';
value Nodesf 1='<12' 2='>=12' 3='Unknown';
value gradef 1="Well or Moderately differentiated" 2="Poorly or
Undifferentiated differentiated" 3="Unknown";
value marginf 1="Positive resection margin" 2="Negative resection margin"
3="unknown";
value invasionf 1= "No perineural invasion present" 2="Perineural invasion
present" 3="unknown";
value vitalf 0='Dead' 1='Alive';
value chemof 0='No/Unknown' 1='Yes';
value riskgroupf 1='low-risk' 2='high-risk' 3='unknown';
*Check the orignal dataset;
Title Orignal dataset;
proc print data=casedat (obS=10) label;
run;
*Define new variables;
data test;
set casedat;
format ageg agegf. race racef. gender sexf. year_group yearf. metro metrof.
T_stage Tstagef. Lymph_Nodes Nodesf. Histology_Grade gradef.
Margin_involvement marginf. Perineural_Invasion invasionf. vitalstatus
vitalf. Chemotherapy chemof. Risk_group riskgroupf. ;
if 5<=Age_recode_with_1_year_olds <=10 then ageg=1;
else if 11<=Age_recode_with_1_year_olds <=13 then ageg=2;
else if 14<=Age_recode_with_1_year_olds <=15 then ageg=3;
else if Age_recode_with_1_year_olds >=16 then ageg=4;
race=Race_recode_White_Black_Other*1;
gender=sex*1;
if Year_of_Diagnosis in (210,211) then year_group=1;
else if Year_of_Diagnosis in (212,213) then year_group=2;
else if Year_of_Diagnosis in (214,215) then year_group=3;
if RuralUrban_Continuum_Code_2013 in (1,2,3) then metro=1;
else if RuralUrban_Continuum_Code_2013 in (4,5,6,7,8,9) then metro=2;
else if metro=3;
if DerivedAJCC_T_7thed2010=300 then T_stage=1;
else if DerivedAJCC_T_7thed2010 in (410, 420) then T_stage=2;

7
else if T_stage=3;
if 0<=Regional_nodes_examined1998<=11 then Lymph_Nodes =1;
else if 12<=Regional_nodes_examined1998<=90 then Lymph_Nodes =2;
else if Regional_nodes_examined1998>90 then Lymph_Nodes =3;
if Grade in (1,2) then Histology_Grade=1;
else if Grade in (3,4) then Histology_Grade=2;
else if Grade =9 then Histology_Grade=3;
if 0<=CRM6<=10 then Margin_involvement=1;
else if 10<CRM6<=996 then Margin_involvement=2;
else Margin_involvement=3;
if Perineural_Invasion8="0" then Perineural_Invasion=1;
else if Perineural_Invasion8="10" then Perineural_Invasion=2;
else Perineural_Invasion=3;
if T_stage=1 and Lymph_Nodes =2 and Histology_Grade=1 and
Margin_involvement=2 and Perineural_Invasion=1 then Risk_group=1;
Else if T_stage=2 or Lymph_Nodes =1 or Histology_Grade=2 or
Margin_involvement=1 or Perineural_Invasion=2 then Risk_group=2;
Else Risk_group=3;
month_survival=Survival_months*1;
if Vitalstatusrecodestudycutoffus='4' then vitalstatus=0;
else if Vitalstatusrecodestudycutoffus='1' then vitalstatus=1;
Chemotherapy=Chemotherapy_Recode*1;
run;
*Check the new dataset with new variables;
Title Dataset with new defined variables;
proc print data=test (obS=10) label;
var Patient_ID ageg race gender year_group metro T_stage Lymph_Nodes
Histology_Grade Margin_involvement Perineural_Invasion vitalstatus
month_survival Chemotherapy Risk_group ;
run;
3.2 Describe the Characteristics of Patients
*Descriptive Statistics;
Title1 Characteristics of patients undergoing surgery for stage II colon
cancer;
Title2 Patients in each risk feature group;
proc freq data=test;table Risk_group * Chemotherapy / chisq; run;
Title2 Age distirbution in low-risk features group;
proc freq data=test;where Risk_Group=1; table ageg * Chemotherapy / chisq;
run;
Title2 Age distirbution in high-risk features group;
proc freq data=test;where Risk_Group=2; table ageg * Chemotherapy / chisq;
run;
Title2 Gender distirbution in low-risk features group;
proc freq data=test;where Risk_Group=1; table gender * Chemotherapy / chisq;
run;

8
Title2 Gender distirbution in high-risk features group;
proc freq data=test;where Risk_Group=2; table gender * Chemotherapy / chisq;
run;
Title2 Race distirbution in low-risk features group;
proc freq data=test;where Risk_Group=1; table race * Chemotherapy / chisq;
run;
Title2 Race distirbution in high-risk features group;
proc freq data=test;where Risk_Group=2; table race * Chemotherapy / chisq;
run;
Title2 Diagnosis year distirbution in low-risk features group;
proc freq data=test;where Risk_Group=1; table year_group * Chemotherapy /
chisq; run;
Title2 Diagnosis year distirbution in high-risk features group;
proc freq data=test;where Risk_Group=2; table year_group * Chemotherapy /
chisq; run;
Title2 Metro/rural status distirbution in low-risk features group;
proc freq data=test;where Risk_Group=1; table metro * Chemotherapy / chisq;
run;
Title2 Metro/rural status distirbution in high-risk features group;
proc freq data=test;where Risk_Group=2; table metro * Chemotherapy / chisq;
run;
Title2 T stage distirbution in low-risk features group;
proc freq data=test;where Risk_Group=1;table T_stage * Chemotherapy / chisq;
run;
Title2 T stage distirbution in high-risk features group;
proc freq data=test;where Risk_Group=2;table T_stage * Chemotherapy / chisq;
run;
Title2 Lymph_Nodes distirbution in low-risk features group;
proc freq data=test;where Risk_Group=1;table Lymph_Nodes * Chemotherapy /
chisq; run;
Title2 Lymph_Nodes distirbution in high-risk features group;
proc freq data=test;where Risk_Group=2;table Lymph_Nodes * Chemotherapy /
chisq; run;
Title2 Histology_Grade distirbution in low-risk features group;
proc freq data=test;where Risk_Group=1;table Histology_Grade * Chemotherapy /
chisq; run;
Title2 Histology_Grade distirbution in high-risk features group;
proc freq data=test;where Risk_Group=2;table Histology_Grade * Chemotherapy /
chisq; run;
Title2 Margin_involvement distirbution in low-risk features group;
proc freq data=test;where Risk_Group=1;table Margin_involvement *
Chemotherapy / chisq; run;
Title2 Margin_involvement distirbution in high-risk features group;
proc freq data=test;where Risk_Group=2;table Margin_involvement *
Chemotherapy / chisq; run;
Title2 Perineural_Invasion distirbution in low-risk features group;
proc freq data=test;where Risk_Group=1;table Perineural_Invasion *
Chemotherapy / chisq; run;
Title2 Perineural_Invasion distirbution in high-risk features group;
proc freq data=test;where Risk_Group=2;table Perineural_Invasion *
Chemotherapy / chisq; run;
3.3 Survival Analysis
*Surival Analysis
9
*For patients in low-risk feature group, testing if chemo will influece their
surivial;
*Kaplan-Meier test;
Title Patients without any high-risk of recurrence feature;
proc lifetest data=test notable method=km ;
time month_survival*Vitalstatus(1);
Where Risk_group=1;
strata Chemotherapy;
run;
*Kaplan-Meier test;
PROC PHREG DATA=test;
class Chemotherapy (PARAM=REF REF='No/Unknown');
Where Risk_group=1;
MODEL month_survival*Vitalstatus(1)= Chemotherapy /rl;
RUN;
*adjusted hazed ratio;
PROC PHREG DATA=test;
CLASS ageg (PARAM=REF REF='20-49') race(PARAM=REF REF='White')
gender(PARAM=REF REF='Female') year_group(PARAM=REF REF='2010-2011')
metro(PARAM=REF REF='Rural') Chemotherapy (PARAM=REF REF='No/Unknown');
Where Risk_group=1;
MODEL month_survival*Vitalstatus(1)= ageg race gender year_group metro
Chemotherapy /rl;
RUN;
*For patients with any high risk factor,testing if chemo will influece
surivial;
*Kaplan-Meier test;
Title Patients with any high-risk of recurrence feature;
proc lifetest data=test notable method=km ;
time month_survival*Vitalstatus(1);
Where Risk_group=2;
strata Chemotherapy;
run;
*unadjusted hazed ratio;
PROC PHREG DATA=test;
CLASS Chemotherapy (PARAM=REF REF='No/Unknown');
Where Risk_group=2;
MODEL month_survival*Vitalstatus(1)= Chemotherapy /rl;
RUN;
*adjusted hazed ratio;
PROC PHREG DATA=test;
CLASS ageg (PARAM=REF REF='20-49') race(PARAM=REF REF='White')
gender(PARAM=REF REF='Female') year_group(PARAM=REF REF='2010-2011')
metro(PARAM=REF REF='Rural') Chemotherapy (PARAM=REF REF='No/Unknown');
Where Risk_group=2;
MODEL month_survival*Vitalstatus(1)= ageg race gender year_group metro
Chemotherapy /rl;
RUN;
*For patients at least with high-risk feature T4 tumor,testing if chemo will
influece surivial;
*Kaplan-Meier test;
Title Patients at least with high-risk feature T4 tumor;
proc lifetest data=test notable method=km ;
time month_survival*Vitalstatus(1);

10
Where T_stage=2 ;
strata Chemotherapy;
run;
*unadjusted hazed ratio;
PROC PHREG DATA=test;
class Chemotherapy (PARAM=REF REF='No/Unknown');
Where T_stage=2;
MODEL month_survival*Vitalstatus(1)= Chemotherapy /rl;
RUN;
*adjusted hazed ratio;
PROC PHREG DATA=test;
class ageg (PARAM=REF REF='20-49') race(PARAM=REF REF='White')
gender(PARAM=REF REF='Female') year_group(PARAM=REF REF='2010-2011')
metro(PARAM=REF REF='Rural') Chemotherapy (PARAM=REF REF='No/Unknown');
Where T_stage=2;
MODEL month_survival*Vitalstatus(1)= ageg race gender year_group metro
Chemotherapy /rl;
RUN;
*For patients at least with high-risk feature < 12 lymph nodes removed or
assessed,testing if chemo will influece surivial;
*Kaplan-Meier test;
Title Patients at least with high-risk feature < 12 lymph nodes removed or
assessed;
proc lifetest data=test notable method=km ;
time month_survival*Vitalstatus(1);
Where Lymph_Nodes =1 ;
strata Chemotherapy;
run;
*unadjusted hazed ratio;
PROC PHREG DATA=test;
class Chemotherapy (PARAM=REF REF='No/Unknown');
Where Lymph_Nodes =1 ;
MODEL month_survival*Vitalstatus(1)= Chemotherapy /rl;
RUN;
*adjusted hazed ratio;
PROC PHREG DATA=test;
class ageg (PARAM=REF REF='20-49') race(PARAM=REF REF='White')
gender(PARAM=REF REF='Female') year_group(PARAM=REF REF='2010-2011')
metro(PARAM=REF REF='Rural') Chemotherapy (PARAM=REF REF='No/Unknown');
Where Lymph_Nodes =1 ;
MODEL month_survival*Vitalstatus(1)= ageg race gender year_group metro
Chemotherapy /rl;
RUN;
*For patients at least with high-risk feature poorly/differentiated
histology, testing if chemo will influece surivial;
*Kaplan-Meier test;
Title Patients at least with high-risk feature poorly/differentiated
histology;
proc lifetest data=test notable method=km ;
time month_survival*Vitalstatus(1);
Where Histology_Grade=2 ;
strata Chemotherapy;
run;
*unadjusted hazed ratio;
PROC PHREG DATA=test;

11
class Chemotherapy (PARAM=REF REF='No/Unknown');
Where Histology_Grade=2 ;
MODEL month_survival*Vitalstatus(1)= Chemotherapy /rl;
RUN;
*adjusted hazed ratio;
PROC PHREG DATA=test;
class ageg (PARAM=REF REF='20-49') race(PARAM=REF REF='White')
gender(PARAM=REF REF='Female') year_group(PARAM=REF REF='2010-2011')
metro(PARAM=REF REF='Rural') Chemotherapy (PARAM=REF REF='No/Unknown');
Where Histology_Grade=2 ;
MODEL month_survival*Vitalstatus(1)= ageg race gender year_group metro
Chemotherapy /rl;
RUN;
*For patients at least with high-risk feature positive margin, testing if
chemo will influece surivial;
*Kaplan-Meier test;
Title Patients at least with high-risk feature positive margin;
proc lifetest data=test notable method=km ;
time month_survival*Vitalstatus(1);
Where Margin_involvement=1 ;
strata Chemotherapy;
run;
*unadjusted hazed ratio;
PROC PHREG DATA=test;
class Chemotherapy (PARAM=REF REF='No/Unknown');
Where Margin_involvement=1 ;
MODEL month_survival*Vitalstatus(1)= Chemotherapy /rl;
RUN;
*adjusted hazed ratio;
PROC PHREG DATA=test;
class ageg (PARAM=REF REF='20-49') race(PARAM=REF REF='White')
gender(PARAM=REF REF='Female') year_group(PARAM=REF REF='2010-2011')
metro(PARAM=REF REF='Rural') Chemotherapy (PARAM=REF REF='No/Unknown');
Where Margin_involvement=1 ;
MODEL month_survival*Vitalstatus(1)= ageg race gender year_group metro
Chemotherapy /rl;
RUN;
*For patients at least with high-risk feature perineural invasion, testing if
chemo will influece surivial;
*Kaplan-Meier test;
Title Patients at least with high-risk feature perineural invasion ;
proc lifetest data=test notable method=km ;
time month_survival*Vitalstatus(1);
Where Perineural_Invasion=2;
strata Chemotherapy;
run;
*unadjusted hazed ratio;
PROC PHREG DATA=test;
class Chemotherapy (PARAM=REF REF='No/Unknown');
Where Perineural_Invasion=2;
MODEL month_survival*Vitalstatus(1)= Chemotherapy /rl;
RUN;
*adjusted hazed ratio;
PROC PHREG DATA=test;

12
class ageg (PARAM=REF REF='20-49') race(PARAM=REF REF='White')
gender(PARAM=REF REF='Female') year_group(PARAM=REF REF='2010-2011')
metro(PARAM=REF REF='Rural') Chemotherapy (PARAM=REF REF='No/Unknown');
Where Perineural_Invasion=2;
MODEL month_survival*Vitalstatus(1)= ageg race gender year_group metro
Chemotherapy /rl;
RUN;
ods rtf close;

13
4. OUTPUTS
4.1 Frequency Table Outputs
Patients in each risk group
Age Distribution
No chemo or Unknown Chemo Total
Group
Low-risk group 8509 1008 9517
High-risk group 7668 2692 10360
Unknown 3058 419 3477
Total 19235 4119 23354
0
1000
2000
3000
4000
5000
6000
7000
8000
9000
Low-risk group High-risk group Unknown
Patients
No chemo or Unknown Chemo
Stage II without any high risk factor (n=9517) Stage II with at least one high risk factor (n=10360)
Characreristic No Chemo or Unkonw (n=8509) Chemo (n=1008) P No Chemo or Unkonw (n=7668) Chemo (n=2692) P
Age, years, % <0.0001 <0.0001
20-49 7.05 26.79 6.17 19.17
50-64 27.01 44.25 22.4 43.31
65-74 27.12 20.14 25.12 26.3
75+ 38.82 8.83 46.31 11.22

14
Gender Distribution
Race distribution
0
5
10
15
20
25
30
35
40
45
50
20-49 50-64 65-74 75+
Low risk group: Age
No Chemo or Unkonw (n=8509) Chemo (n=1008)
0
5
10
15
20
25
30
35
40
45
50
20-49 50-64 65-74 75+
High risk group: Age
No Chemo or Unkonw (n=7668) Chemo (n=2692)
Stage II without any high risk factor (n=9517) Stage II with at least one high risk factor (n=10360)
Characreristic No Chemo or Unkonw (n=8509) Chemo (n=1008) P No Chemo or Unkonw (n=7668) Chemo (n=2692) P
Gender, % 0.9785 <0.0001
Male 49.75 49.7 46.35 51.23
Female 50.25 50.3 53.65 48.77
0
10
20
30
40
50
60
Male Female
Low risk group: Gender
No Chemo or Unkonw (n=8509) Chemo (n=1008)
0
10
20
30
40
50
60
Male Female
High risk group: Gender
No Chemo or Unkonw (n=7668)
Chemo (n=2692)
Stage II without any high risk factor (n=9517) Stage II with at least one high risk factor (n=10360)
Characreristic No Chemo or Unkonw (n=8509) Chemo (n=1008) P No Chemo or Unkonw (n=7668) Chemo (n=2692) P
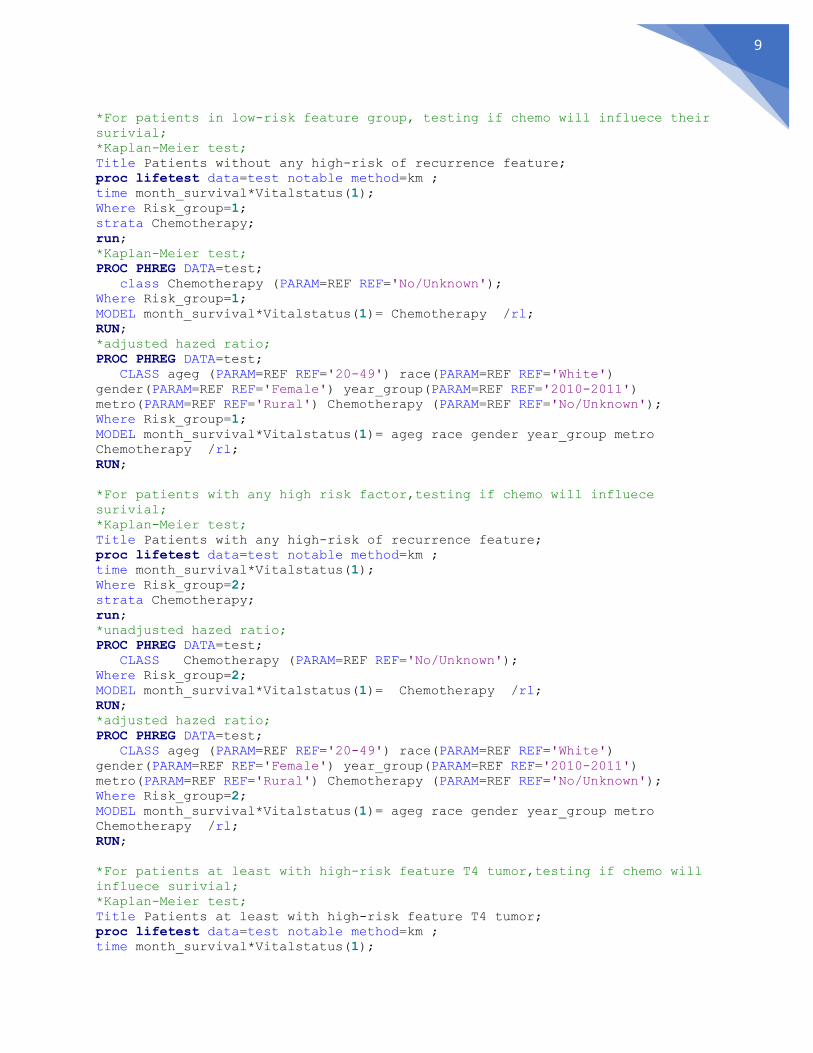
Race, % <0.0001 0.0044
White 79.84 73.81 81.7 79.72
Black 11.04 15.77 10.54 13
other 8.56 10.12 7.46 7.1
Unknown 0.56 0.3 0.3 0.19
15
Diagnosis year distribution
Metra/rural status distribution
0
10
20
30
40
50
60
70
80
90
White Black other Unknown
Low risk group: Race
No Chemo or Unkonw (n=8509) Chemo (n=1008)
0
10
20
30
40
50
60
70
80
90
White Black other Unknown
High risk group: Race
No Chemo or Unkonw (n=7668) Chemo (n=2692)
Stage II without any high risk factor (n=9517) Stage II with at least one high risk factor (n=10360)
Characreristic No Chemo or Unkonw (n=8509) Chemo (n=1008) P No Chemo or Unkonw (n=7668) Chemo (n=2692) P
Year of Diagnosis, % 0.503 0.0102
2010-2011 33.66 35.42 38.81 37.3
2012-2013 36.57 35.12 36.54 35.1
2014-2015 29.77 29.46 24.65 27.6
0
5
10
15
20
25
30
35
40
2010-2011 2012-2013 2014-2015
Low risk group: Diagnosis Year
No Chemo or Unkonw (n=8509) Chemo (n=1008)
0
10
20
30
40
50
2010-2011 2012-2013 2014-2015
High risk group: Diagnosis Year
No Chemo or Unkonw (n=7668) Chemo (n=2692)
Stage II without any high risk factor (n=9517) Stage II with at least one high risk factor (n=10360)
Characreristic No Chemo or Unkonw (n=8509) Chemo (n=1008) P No Chemo or Unkonw (n=7668) Chemo (n=2692) P
Metro/Rural, % 0.4698 0.5606
Metro 87.3 88.1 86.92 86.48
Rural 12.7 11.9 13.08 13.52

16
T stage distribution
Nodes examined distribution
0
20
40
60
80
100
Metro Rural
Low risk group: Metra/Rural status
No Chemo or Unkonw (n=8509) Chemo (n=1008)
0
20
40
60
80
100
Metro Rural
High risk group: Metra/Rural status
No Chemo or Unkonw (n=7668) Chemo (n=2692)
Stage II without any high risk factor (n=9517) Stage II with at least one high risk factor (n=10360)
Characreristic No Chemo or Unkonw (n=8509) Chemo (n=1008) P No Chemo or Unkonw (n=7668) Chemo (n=2692) P
T Stage, % <0.0001
T3 100 100 72.08 41.05
T4 0 0 27.92 58.95
0
20
40
60
80
100
120
T3 T4
Low risk group: T stage
No Chemo or Unkonw (n=8509) Chemo (n=1008)
0
10
20
30
40
50
60
70
80
T3 T4
High risk group: T stage
No Chemo or Unkonw (n=7668) Chemo (n=2692)
Stage II without any high risk factor (n=9517) Stage II with at least one high risk factor (n=10360)
Characreristic No Chemo or Unkonw (n=8509) Chemo (n=1008) P No Chemo or Unkonw (n=7668) Chemo (n=2692) P
Nodes Examined,% <0.0001
Nodes examined <12 0 0 27.03 21.51
Nodes examined>=12 100 100 72.85 78.27
Unknown 0 0 0.12 0.22

17
Histology grades distribution
Margin involvement distribution
0
20
40
60
80
100
120
Nodes examined<12
Nodesexamined>=12
Unknown
Low risk group: Nodes examined
No Chemo or Unkonw (n=8509) Chemo (n=1008)
0
20
40
60
80
100
Nodes examined<12
Nodesexamined>=12
Unknown
High risk group: Nodes examined
No Chemo or Unkonw (n=7668) Chemo (n=2692)
Stage II without any high risk factor (n=9517) Stage II with at least one high risk factor (n=10360)
Characreristic No Chemo or Unkonw (n=8509) Chemo (n=1008) P No Chemo or Unkonw (n=7668) Chemo (n=2692) P
Histology Grade, % <0.0001
Well or Moderately differentiated 100 100 60.42 65.9
Poorly or Undifferentiated differentiated 0 0 38.12 31.5
unknown 0 0 1.46 2.6
0
20
40
60
80
100
120
Well orModerately
differentiated
Poorly orUndifferentiated
differentiated
unknown
Low risk group: Histology Grade
No Chemo or Unkonw (n=8509) Chemo (n=1008)
010203040506070
Well orModerately
differentiated
Poorly orUndifferentiated
differentiated
unknown
High risk group: Histology Grade
No Chemo or Unkonw (n=7668) Chemo (n=2692)
Stage II without any high risk factor (n=9517) Stage II with at least one high risk factor (n=10360)
Characreristic No Chemo or Unkonw (n=8509) Chemo (n=1008) P No Chemo or Unkonw (n=7668) Chemo (n=2692) P
Margin involvement, % <.0001
Positve margin 0 0 20.51 21.36
Negative margin 100 100 58.06 53.16
Unknown 0 0 21.43 25.48

18
Perineural Invasion distribution
4.2 Survival analysis Outputs
Patients without any high-risk factor:
(a) KM plot (Log-Rank, P<0.0001)
0
20
40
60
80
100
120
Positve margin Negativemargin
Unknown
Low risk group: Margin involvement
No Chemo or Unkonw (n=8509) Chemo (n=1008)
0
10
20
30
40
50
60
70
Positve margin Negative margin Unknown
High risk group: Margin involvement
No Chemo or Unkonw (n=7668) Chemo (n=2692)
Stage II without any high risk factor (n=9517) Stage II with at least one high risk factor (n=10360)
Characreristic No Chemo or Unkonw (n=8509) Chemo (n=1008) P No Chemo or Unkonw (n=7668) Chemo (n=2692) P
Perineural Invasion, % 0.0092
No invasion present 100 100 76.02 73.22
Invasion present 0 0 13.02 13.97
Unknown 0 0 10.97 12.82
0
20
40
60
80
100
120
No invasionpresent
Invasion present Unknown
Low risk group: Perineural Invasion
No Chemo or Unkonw (n=8509) Chemo (n=1008)
0
20
40
60
80
No invasionpresent
Invasion present Unknown
High risk group: Perineural Invasion
No Chemo or Unkonw (n=7668)
Chemo (n=2692)

19
(b) Cox regression
Unadjusted HR (Chemo Yes VS Chemo No or Unknown): 0.534, 95% CI (0.422, 0.676), P<0.0001
Adjusted HR (Chemo Yes VS Chemo No or Unknown): 0.926, 95% CI (0.726, 1.180), P=0.5323 (adjusting
age ,race, gender, year, metro/rural status)
Analysis of Maximum Likelihood Estimates
Parameter DF
Parameter
Estimate
Standard
Error Chi-Square Pr > ChiSq
Hazard
Ratio
95% Hazard
Ratio
Confidence
Limits Label
Chemotherapy Yes 1 -0.62682 0.12010 27.2393 <.0001 0.534 0.422 0.676 Chemotherapy Yes

20
Patients with at least one high risk factor:
(a) KM plot (Log-Rank, P<0.0001)
(b) Cox regression
Unadjusted HR (Chemo Yes VS Chemo No or Unknown): 0.645, 95% CI (0.576, 0.721), P<0.0001
Analysis of Maximum Likelihood Estimates
Parameter DF
Parameter
Estimate
Standard
Error Chi-Square Pr > ChiSq
Hazard
Ratio
95% Hazard
Ratio
Confidence
Limits Label
ageg 50-64 1 0.85320 0.22255 14.6981 0.0001 2.347 1.517 3.631 ageg 50-64
ageg 65-74 1 1.39953 0.21899 40.8436 <.0001 4.053 2.639 6.226 ageg 65-74
ageg 75+ 1 2.13366 0.21486 98.6138 <.0001 8.446 5.543 12.868 ageg 75+
race Black 1 0.16515 0.09468 3.0428 0.0811 1.180 0.980 1.420 race Black
race Other 1 -0.31539 0.12856 6.0183 0.0142 0.730 0.567 0.939 race Other
race unknown 1 -11.88006 157.35897 0.0057 0.9398 0.000 0.000 6.09E128 race unknown
gender Male 1 0.21147 0.05886 12.9100 0.0003 1.235 1.101 1.387 gender Male
year_group 2012-2013 1 0.11492 0.06760 2.8902 0.0891 1.122 0.983 1.281 year_group
2012-2013
year_group 2014-2015 1 -0.08520 0.13028 0.4277 0.5131 0.918 0.711 1.185 year_group
2014-2015
metro Metro 1 -0.06396 0.08705 0.5398 0.4625 0.938 0.791 1.113 metro Metro
Chemotherapy Yes 1 -0.07722 0.12364 0.3900 0.5323 0.926 0.726 1.180 Chemotherapy
Yes
Analysis of Maximum Likelihood Estimates
Parameter DF
Parameter
Estimate
Standard
Error Chi-Square Pr > ChiSq
Hazard
Ratio
95% Hazard
Ratio
Confidence
Limits Label
Chemotherapy Yes 1 -0.43915 0.05708 59.1992 <.0001 0.645 0.576 0.721 Chemotherapy Yes

21
Adjusted HR (Chemo Yes VS Chemo No or Unknown): 0.965, 95% CI (0.856, 1.088), P=0.5592
Patients at least with high risk factor T4 stage
(a) KM plot (Log-Rank, P<0.0001)
(b) Cox regression
Unadjusted HR (Chemo Yes VS Chemo No or Unknown): 0.553, 95% CI (0.478, 0.640), P<0.0001
Analysis of Maximum Likelihood Estimates
Parameter DF
Parameter
Estimate
Standard
Error Chi-Square Pr > ChiSq
Hazard
Ratio
95% Hazard
Ratio
Confidence
Limits Label
ageg 50-64 1 0.24395 0.11947 4.1691 0.0412 1.276 1.010 1.613 ageg 50-64
ageg 65-74 1 0.55168 0.11821 21.7794 <.0001 1.736 1.377 2.189 ageg 65-74
ageg 75+ 1 1.30949 0.11378 132.4493 <.0001 3.704 2.964 4.630 ageg 75+
race Black 1 0.22407 0.07057 10.0818 0.0015 1.251 1.090 1.437 race Black
race Other 1 -0.19608 0.09595 4.1762 0.0410 0.822 0.681 0.992 race Other
race unknown 1 -0.48799 0.70784 0.4753 0.4906 0.614 0.153 2.458 race unknown
gender Male 1 0.09963 0.04531 4.8344 0.0279 1.105 1.011 1.207 gender Male
year_group 2012-2013 1 0.00855 0.05168 0.0274 0.8685 1.009 0.911 1.116 year_group 2012-
2013
year_group 2014-2015 1 -0.02895 0.09494 0.0930 0.7604 0.971 0.807 1.170 year_group 2014-
2015
metro Metro 1 0.04006 0.06611 0.3673 0.5445 1.041 0.914 1.185 metro Metro
Chemotherapy Yes 1 -0.03569 0.06112 0.3411 0.5592 0.965 0.856 1.088 Chemotherapy
Yes
Analysis of Maximum Likelihood Estimates
Parameter DF
Parameter
Estimate
Standard
Error Chi-Square Pr > ChiSq
Hazard
Ratio
95% Hazard
Ratio
Confidence
Limits Label
Chemotherapy Yes 1 -0.59177 0.07449 63.1158 <.0001 0.553 0.478 0.640 Chemotherapy Yes

22
Adjusted HR (Chemo Yes VS Chemo No or Unknown): 0.770, 95% CI (0.656, 0.904), P=0.0014
Patients at least with high risk factor <12 nodes examined:
(a) KM plot (Log-Rank, P=0.0001)
(b) Cox regression
Unadjusted HR (Chemo Yes VS Chemo No or Unknown): 0.667, 95% CI (0.540, 0.823), P=0.0002
Analysis of Maximum Likelihood Estimates
Parameter DF
Parameter
Estimate
Standard
Error Chi-Square Pr > ChiSq
Hazard
Ratio
95% Hazard
Ratio
Confidence
Limits Label
ageg 50-64 1 0.31288 0.15789 3.9271 0.0475 1.367 1.003 1.863 ageg 50-64
ageg 65-74 1 0.53623 0.15975 11.2673 0.0008 1.710 1.250 2.338 ageg 65-74
ageg 75+ 1 1.08962 0.15519 49.2972 <.0001 2.973 2.193 4.030 ageg 75+
race Black 1 0.27642 0.10396 7.0698 0.0078 1.318 1.075 1.616 race Black
race Other 1 -0.18587 0.14301 1.6891 0.1937 0.830 0.627 1.099 race Other
race unknown 1 -9.69975 126.02911 0.0059 0.9387 0.000 0.000 1.16E103 race unknown
gender Male 1 -0.05273 0.06998 0.5679 0.4511 0.949 0.827 1.088 gender Male
year_group 2012-2013 1 0.09046 0.07793 1.3475 0.2457 1.095 0.940 1.275 year_group
2012-2013
year_group 2014-2015 1 -0.05363 0.13928 0.1483 0.7002 0.948 0.721 1.245 year_group
2014-2015
metro Metro 1 0.01719 0.10096 0.0290 0.8648 1.017 0.835 1.240 metro Metro
Chemotherapy Yes 1 -0.26121 0.08197 10.1540 0.0014 0.770 0.656 0.904 Chemotherapy
Yes
Analysis of Maximum Likelihood Estimates
Parameter DF
Parameter
Estimate
Standard
Error Chi-Square Pr > ChiSq
Hazard
Ratio
95% Hazard
Ratio
Confidence
Limits Label
Chemotherapy Yes 1 -0.40547 0.10778 14.1533 0.0002 0.667 0.540 0.823 Chemotherapy Yes

23
Adjusted HR (Chemo Yes VS Chemo No or Unknown): 0.965, 95% CI (0.772, 1.207), P=0.7543
Patients at least with high risk factor poorly or undifferentiated grade:
(a) KM plot (Log-Rank, P=0.0001)
(b) Cox regression
Unadjusted HR (Chemo Yes VS Chemo No or Unknown): 0.619, 95% CI (0.505, 0.758), P<0.0001
Analysis of Maximum Likelihood Estimates
Parameter DF
Parameter
Estimate
Standard
Error Chi-Square Pr > ChiSq
Hazard
Ratio
95% Hazard
Ratio
Confidence
Limits Label
ageg 50-64 1 0.04251 0.23252 0.0334 0.8549 1.043 0.662 1.646 ageg 50-64
ageg 65-74 1 0.41898 0.22739 3.3951 0.0654 1.520 0.974 2.374 ageg 65-74
ageg 75+ 1 1.13423 0.21946 26.7113 <.0001 3.109 2.022 4.780 ageg 75+
race Black 1 0.22012 0.11868 3.4399 0.0636 1.246 0.988 1.573 race Black
race Other 1 -0.07697 0.15238 0.2551 0.6135 0.926 0.687 1.248 race Other
race unknown 1 0.74560 0.71236 1.0955 0.2953 2.108 0.522 8.515 race unknown
gender Male 1 -0.02145 0.08062 0.0708 0.7902 0.979 0.836 1.146 gender Male
year_group 2012-2013 1 -0.04996 0.09290 0.2892 0.5907 0.951 0.793 1.141 year_group 2012-
2013
year_group 2014-2015 1 -0.16393 0.20193 0.6590 0.4169 0.849 0.571 1.261 year_group 2014-
2015
metro Metro 1 0.00852 0.10936 0.0061 0.9379 1.009 0.814 1.250 metro Metro
Chemotherapy Yes 1 -0.03568 0.11399 0.0980 0.7543 0.965 0.772 1.207 Chemotherapy
Yes

24
Adjusted HR (Chemo Yes VS Chemo No or Unknown): 0.960, 95% CI (0.773, 1.192), P=0.7127
Patients at least with high risk factor positive margin:
(a) KM plot (Log-Rank, P=0.1501)
(b) Cox regression
Unadjusted HR (Chemo Yes VS Chemo No or Unknown): 0.852, 95% CI (0.684, 1.061), P=0.1520
Analysis of Maximum Likelihood Estimates
Parameter DF
Parameter
Estimate
Standard
Error Chi-Square Pr > ChiSq
Hazard
Ratio
95% Hazard
Ratio
Confidence
Limits Label
Chemotherapy Yes 1 -0.48004 0.10346 21.5284 <.0001 0.619 0.505 0.758 Chemotherapy Yes
Analysis of Maximum Likelihood Estimates
Parameter DF
Parameter
Estimate
Standard
Error Chi-Square Pr > ChiSq
Hazard
Ratio
95% Hazard
Ratio
Confidence
Limits Label
ageg 50-64 1 0.46560 0.22888 4.1381 0.0419 1.593 1.017 2.495 ageg 50-64
ageg 65-74 1 0.81715 0.22399 13.3090 0.0003 2.264 1.460 3.512 ageg 65-74
ageg 75+ 1 1.54271 0.21703 50.5263 <.0001 4.677 3.057 7.157 ageg 75+
race Black 1 0.24352 0.13776 3.1246 0.0771 1.276 0.974 1.671 race Black
race Other 1 -0.26838 0.18495 2.1056 0.1468 0.765 0.532 1.099 race Other
race unknown 1 -10.75114 179.42852 0.0036 0.9522 0.000 0.000 1.15E148 race unknown
gender Male 1 0.13046 0.07837 2.7710 0.0960 1.139 0.977 1.329 gender Male
year_group 2012-2013 1 -0.13460 0.08929 2.2727 0.1317 0.874 0.734 1.041 year_group
2012-2013
year_group 2014-2015 1 0.06194 0.14606 0.1798 0.6715 1.064 0.799 1.417 year_group
2014-2015
metro Metro 1 0.12760 0.11400 1.2529 0.2630 1.136 0.909 1.421 metro Metro
Chemotherapy Yes 1 -0.04063 0.11033 0.1356 0.7127 0.960 0.773 1.192 Chemotherapy
Yes

25
Adjusted HR (Chemo Yes VS Chemo No or Unknown): 1.196, 95% CI (0.948, 1.509), P=0.1319
Patients at least with high risk factor perineural invasion present:
(a) KM plot (Log-Rank, P=0.0101)
(b) Cox regression
Unadjusted HR (Chemo Yes VS Chemo No or Unknown): 0.0109, 95% CI (0.501, 0.914), P=0.1520
Analysis of Maximum Likelihood Estimates
Parameter DF
Parameter
Estimate
Standard
Error Chi-Square Pr > ChiSq
Hazard
Ratio
95% Hazard
Ratio
Confidence
Limits Label
Chemotherapy Yes 1 -0.16026 0.11186 2.0525 0.1520 0.852 0.684 1.061 Chemotherapy Yes
Analysis of Maximum Likelihood Estimates
Parameter DF
Parameter
Estimate
Standard
Error Chi-Square Pr > ChiSq
Hazard
Ratio
95% Hazard
Ratio
Confidence
Limits Label
ageg 50-64 1 0.06117 0.23454 0.0680 0.7942 1.063 0.671 1.683 ageg 50-64
ageg 65-74 1 0.48188 0.23173 4.3244 0.0376 1.619 1.028 2.550 ageg 65-74
ageg 75+ 1 1.21246 0.22222 29.7700 <.0001 3.362 2.175 5.197 ageg 75+
race Black 1 0.12782 0.15775 0.6566 0.4178 1.136 0.834 1.548 race Black
race Other 1 -0.36529 0.22023 2.7511 0.0972 0.694 0.451 1.069 race Other
race unknown 1 -9.75165 181.59003 0.0029 0.9572 0.000 0.000 2.16E150 race unknown
gender Male 1 0.17380 0.09633 3.2553 0.0712 1.190 0.985 1.437 gender Male
year_group 2012-2013 1 0.04423 0.11158 0.1571 0.6918 1.045 0.840 1.301 year_group
2012-2013
year_group 2014-2015 1 -0.15410 0.20025 0.5922 0.4416 0.857 0.579 1.269 year_group
2014-2015
metro Metro 1 0.10139 0.15354 0.4361 0.5090 1.107 0.819 1.495 metro Metro
Chemotherapy Yes 1 0.17884 0.11870 2.2699 0.1319 1.196 0.948 1.509 Chemotherapy
Yes
26
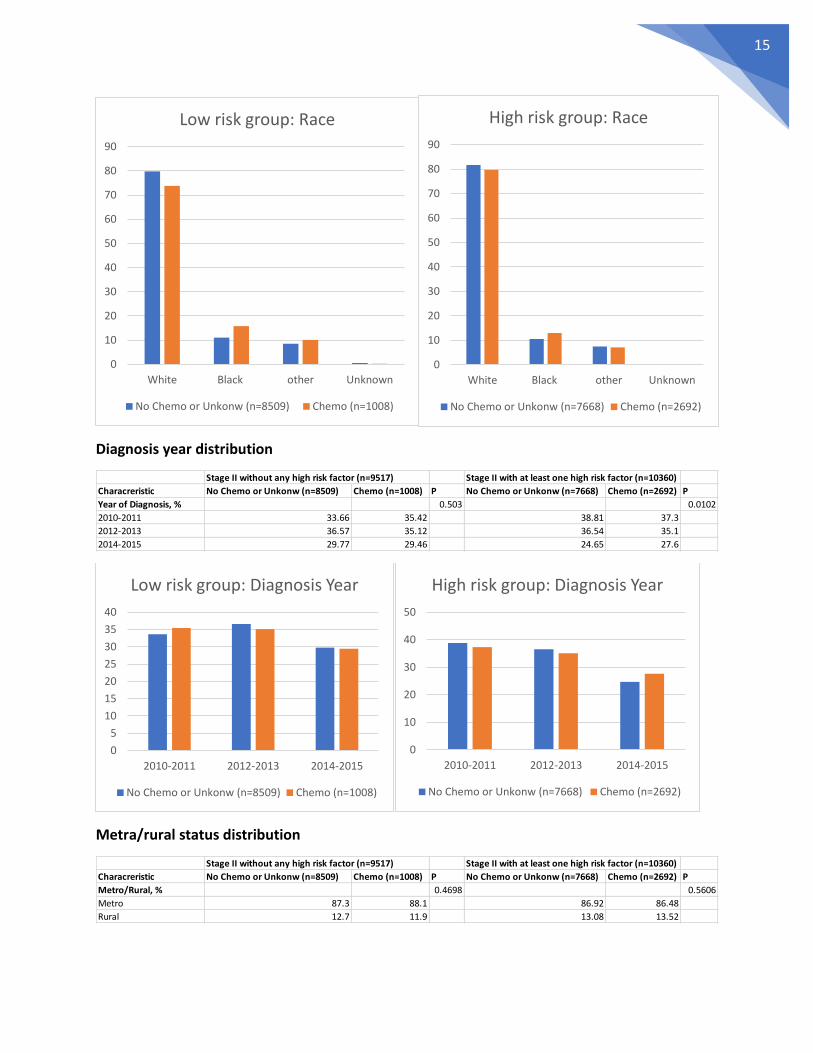
Adjusted HR (Chemo Yes VS Chemo No or Unknown): 0.927, 95% CI (0.672, 1.280), P=0.6473
Analysis of Maximum Likelihood Estimates
Parameter DF
Parameter
Estimate
Standard
Error Chi-Square Pr > ChiSq
Hazard
Ratio
95% Hazard
Ratio
Confidence
Limits Label
Chemotherapy Yes 1 -0.39056 0.15342 6.4804 0.0109 0.677 0.501 0.914 Chemotherapy Yes
Analysis of Maximum Likelihood Estimates
Parameter DF
Parameter
Estimate
Standard
Error Chi-Square Pr > ChiSq
Hazard
Ratio
95% Hazard
Ratio
Confidence
Limits Label
ageg 50-64 1 0.27596 0.30227 0.8335 0.3613 1.318 0.729 2.383 ageg 50-64
ageg 65-74 1 0.41672 0.30692 1.8436 0.1745 1.517 0.831 2.768 ageg 65-74
ageg 75+ 1 1.06357 0.29077 13.3790 0.0003 2.897 1.638 5.122 ageg 75+
race Black 1 0.10925 0.17877 0.3734 0.5411 1.115 0.786 1.584 race Black
race Other 1 -0.12820 0.25350 0.2557 0.6131 0.880 0.535 1.446 race Other
race unknown 1 -10.02699 258.67270 0.0015 0.9691 0.000 0.000 6.73E215 race unknown
gender Male 1 0.07629 0.12708 0.3604 0.5483 1.079 0.841 1.385 gender Male
year_group 2012-2013 1 0.19132 0.14238 1.8056 0.1790 1.211 0.916 1.601 year_group
2012-2013
year_group 2014-2015 1 -0.47937 0.29005 2.7314 0.0984 0.619 0.351 1.093 year_group
2014-2015
metro Metro 1 0.24582 0.21192 1.3455 0.2461 1.279 0.844 1.937 metro Metro
Chemotherapy Yes 1 -0.07528 0.16454 0.2094 0.6473 0.927 0.672 1.280 Chemotherapy
Yes

27
5. RESULTS ANALYSIS 5.1 Frequency Table Results
23,354 patients were included in this study based on the patient selection algorithm. These
patients were divided into low-risk feature group (n=9,517) and high-risk feature group (n=10,360).
Additionally, 3,477 patients could not be decided into any group because of the missing values for some
cancer-related variables. In this study, we were only interested in patients in low-risk feature group and
high-risk feature group.
The above bar chats compare the sociodemographic and cancer-related characteristics of
patients by chemotherapy records within each risk group. Compared to low-risk group, the percentage
of patients who received chemotherapy in high-risk group was obviously higher. No matter in low-risk
feature group or high-risk feature group, compared to those who did not received chemotherapy or
unknown, patients who received chemotherapy tended to be younger. There was not obvious
chemotherapy record difference for different gender, race, year of diagnosis, or rural/urban status. For
patients in high-risk group, compared to those who did not receive chemotherapy or unknown, patients
who received chemotherapy were more likely to have T4 tumor. There was not obvious chemotherapy
record difference for other four cancer-related characteristics.
5.2 Survival Analysis Results
For patients in low-risk group, Kaplan-Meier Curve (Log-Rank, P<0.0001) and unadjusted Hazard
Ratio [0.534, 95% CI (0.422, 0.676), P<0.0001] showed that the OS of patients who received
chemotherapy was significantly higher than those who did not or unknown. However, when controlling
for age of diagnosis, gender, race, year of diagnosis, and rural/urban status, the adjusted HR [0.926, 95%
CI (0.726, 1.180), P=0.5323] is not significant, indicating that there was not significant survival difference
for patients who received chemotherapy and those who did not or unknow.
Likewise, for patients in high risk group, patients who received chemotherapy had better
survival than those not or unknown as the Kaplan-Meier Curve (Log-Rank, P<0.0001) and unadjusted HR
[0.645, 95% CI (0.576, 0.721), P<0.0001] showed, but the adjusted HR [0.965, 95% CI (0.856, 1.088),
P=0.5592] showed that this survival difference was insignificant.
Further, for each subgroup of high-risk feature group, we found that when patients at least
presented T4 tumor, Kaplan-Meier test (Log-Rank, P<0.0001), unadjusted HR [0.553, 95% CI (0.478,
0.640), P<0.0001] and adjusted HR [0.770, 95% CI (0.656, 0.904), P=0.0014] consistently reflected that
patients could benefit from Chemotherapy. Differently, for patients with positive margin, Kaplan-Meier
test (Log-Rank, P=0.1501), unadjusted HR [0.852, 95% CI (0.684, 1.061), P=0.1520] and adjusted HR
[1.196, 95% CI (0.948, 1.509), P=0.1319] consistently reflected that there was not significant OS
difference for patients who received chemotherapy and those who did not or unknow. The analysis for
other 3 high-risk features were similar: Although Kaplan-Meier test and unadjusted HR indicated that
chemotherapy could improve OS, adjusted HR indicated this improvement was insignificant.

28
6. REPORTS (Analysis outcomes summary)
After analysis, the following items were concluded.
1. Younger patients were more likely to receive adjuvant chemotherapy.
2. Patients with any high-risk features of recurrence were more likely to receive adjuvant
chemotherapy than those without any high-risk features.
3. When patients did not present any high-risk features of recurrence, adjuvant chemotherapy did
not substantially improve patients’ survival.
4. When patients presented any high-risk features of recurrence, adjuvant chemotherapy did not
substantially improve patients’ survival.
5. When patients presented T4 tumor, adjuvant chemotherapy substantially improved patients’
survival.
6. When patients presented less than 12 lymph nodes examined, adjuvant chemotherapy did not
substantially improve patients’ survival.
7. When patients presented poorly/differentiated histology, adjuvant chemotherapy did not
substantially improve patients’ survival.
8. When patients presented less than positive margin, adjuvant chemotherapy did not
substantially improve patients’ survival.
9. When patients presented less than perineural invasion, adjuvant chemotherapy did not
substantially improve patients’ survival.
10. It is inappropriate to recommend adjuvant chemotherapy for patients with any high-risk
features of recurrence.
11. The presence of T4 tumor could be one indicator of using adjuvant chemotherapy.
7. LESSONS
This capstone project was a wonderful research experience for me. By reviewing the literatures,
I learned the standard treatment of colon cancer and the high-risk features of recurrence for colon
cancer. By using SEER dataset, I learned the ICD code of colon cancer site. By conducting data analysis, I
reviewed the knowledge on SAS programming and survival analysis. Because of this project, I develop
great interest in data analysis in cancer epidemiology.
In this research experience, I realized the importance of literature review. I defined many
variables in this project. The rationality of these new defined variables was based on other published
literatures. In addition, I also realized that the result of data analysis is not unchanged. Even though for
same research question, different statistical methods can lead different results. Thinking reasonable
explanation for these different results is the key point.
From this project, I felt that I need to learn more knowledge about biostatistics, especially some
different statistical methods. In this research, I met the trouble of missing values. There were 3477
patients who could not be divided into any risk group because of the missing values of some cancer
related variables. I could not handle these patients but just simply ignored them. I desired to learn more
statistical methods about how to handle some missing values. I also felt that I need to lean more SAS
advanced programming knowledge, such as Macro programming.

29
8. PAPER DRAFT
Adjuvant Chemotherapy for Patients with Stage II Colon Cancer
ABSTRACT
Purpose
It is controversial for patients with stage II colon cancer to use adjuvant chemotherapy after
surgery. Although in theory, adjuvant chemotherapy can reduce the risk of cancer recurrence after
surgery, some studies showed that adjuvant chemotherapy had limited influence on patients’ survival
improvement. The purpose of this study is to explore if adjuvant chemotherapy can improve patients’
survival, especially for patients who presented any high-risk feature of recurrence.
Patients and Methods
A total of 23,354 patients with stage II colon cancer from SEER dataset were included in this
study. Patients were divided into low-risk feature group and high-risk feature group. High-risk group
patients were further divided into five subgroups according to the presence of different high-risk
feature. We used 𝑥2 tests to describe the characteristics of patients. Then we used survival analysis
(Kaplan-Meier test and Cox regression analysis) to compare the survival difference by chemotherapy
record (Yes vs. No/Unknown) in each risk group.
Results
No matter in low-risk or high-risk feature group, there was not enough evidence to prove that
chemotherapy could improve patients’ survival. However, when patients presented T4 tumor, the
Kaplan-Meier test (Log-Rank, P<0.0001), unadjusted HR [0.553, 95% CI (0.478, 0.640), P<0.0001] and
adjusted HR [0.770, 95% CI (0.656, 0.904), P=0.0014] consistently reflected that chemotherapy
improved patients’ survival. For other four high-risk features, we could not prove that chemotherapy
really improved patients’ survival.
Conclusion
The presence of T4 tumor is an important indicator of adjuvant chemotherapy for stage II colon
cancer.
INTRODCTION
Colorectal cancer is the third most common cancer in the United States and it is also the third
leading cause of cancer-related deaths in the US. Colorectal cancer includes colon cancer and rectal
cancer. Compared to rectal cancer, colon cancer is more common. It is estimated that there are 97,220
new cases of colon cancer in the US for 2018 (American Cancer Society, 2018a).
Treatment of colon cancer is largely based on its stage. Colon cancer includes five stages: Stage
0 is the earliest stage, and then range from Stage I to Stage IV. The treatments for stage 0 - III are
relatively clear (stage IV means cancer has spread to distant sites, so the treatment is complex). For

30
patients in stage 0 or stage I. Surgery only is the standard treatment. For patients in stage III, Surgery
with adjuvant chemotherapy (AC) is the standard treatment. For patients in stage II, there is no doubt
that surgery is necessary, but the using of AC is controversial (American Cancer Society, 2018b;
American Society of Clinical Oncology, 2004, 2017; Varghese, 2015).
In practice, the 5-year overall survival (OS) rate for stage II patients who received surgery can
research 80%. The main cause of cancer recurrence is that some patients may have micrometastatic
diseases at the time of surgery, but surgery cannot recognize these diseases. In theory, AC can eradicate
this micrometastatic disease, prevent cancer recurrence, and then improve survival, but at the same
time, AC brings potentially serious side effects, such as tiredness, nausea, vomiting, nerve damage, and
so on (American Society of Clinical Oncology, 2004; Varghese, 2015). Compared to its serious side
effects, the improvement of AC on survival is very small for patients with stage II colon cancer. Some
studies even indicated that there is not significant survival difference between stage II patients who
received AC and those who did not (American Society of Clinical Oncology, 2004; Böckelman,
Engelmann, Kaprio, Hansen, & Glimelius, 2015; Fang, Efron, Berho, & Wexner, 2014; O'Connor et al.,
2011; Varghese, 2015).
Based on national and international guidelines, AC are not recommended to routine use in
patients with stage II colon cancer, however, if patients present high risk features of recurrence,
including T4 tumor, poorly/differentiated histology, lymphovascular invasion, perineural invasion, less
than 12 lymph nodes were removed or could be assessed, obstruction, or perforation, AC can be
considered, but it does not mean that AC should be used for all stage II patients who present any high-
risk features. Patients need to talk with their doctors (American Cancer Society, 2018b; American Society
of Clinical Oncology, 2004; Varghese, 2015). Two studies indicated that even for patients with high-risk
features, AC did not contribute to higher survival (Kucukzeybek et al., 2015; O'Connor et al., 2011). Two
studies showed that only for patients with T4 tumor, the AC was associated with higher survival, but for
patients with other high-risk features, there was no significant association between AC and survival
(Kumar et al., 2014; Verhoeff, van Erning, Lemmens, de Wilt, & Pruijt, 2016). Until now, there are not
uniform standards about which part of patients with stage II colon cancer should be given AC. More
statistical data are needed to evaluate the benefit of AC for patients with stage II colon cancer,
especially for those presenting high-risk features.
In this study, the association between AC and survival are further explored among patients who
are diagnosed as stage II colon cancer, especially for those presenting any high-risk feature.
PATIENTS AND METHODS
Data source
The data came from the Surveillance, Epidemiology, and End Results (SEER) cancer database
“Incidence -SEER 18 Regs Custom Data (with additional treatment fields), No2017 Sub (1973-215
varying) Linked to County Attributes - Total U.S., 1969-2016 Counties, National Cancer Institute, DCCPS,
Surveillance Research Program, released April 2018, based on the November 2017 submission.”
Study Population

31
All patients aged 20 years and older as well as diagnosed with primary American Joint
Committee on Cancer (AJCC) stage II colon adenocarcinoma in a SEER area from 2010 to 2015 were
eligible for this study. Colon Cancer were identified by site and histology codes (Primary Site=C18.0-18.9;
Histology=8140-8147,8210-8211,8220-8221,8260-8263,8480-8481,8490) (O'Connor et al., 2011; Weiss
et al., 2014). Further, Patients who received surgical resection of primary colon cancer were selected.
Moreover, considering that some patients had bad health condition and died before they could receive
AC, we excluded patients who survived at less than 6 months after diagnosis. Eventually, a total of
23,354 patients were included in this study.
Variables
Outcome variable: The primary outcome variable is overall survival rate (OS), which is the
percentage of patients who are alive for a period of time after their diagnosis. SEER Database recorded
patients’ survival months and death/alive status.
Explanatory variable: The primary explanatory variable is AC. AC is chemotherapy offered after
primary site surgery with an intent of reducing the risk of cancer recurrence (American Society of Clinical
Oncology, 2004; Kopetz, Freitas, Calabrich, & Hoff, 2008). SEER database had chemotherapy records but
did not indicate this chemotherapy was AC or not. We used Kentucky Cancer Registry (KCR) database to
check the percentage of patients who received chemotherapy before primary surgery and found this
percentage is minimal. Considering the similarity of KCR data and SEER data, we believed that most
chemotherapy records in SEER data could be regarded as AC records.
Stratification variables: The primary stratification variables were high risk features of recurrence.
SEER database included the information of five high risk features (T4 tumor, poorly/differentiated
histology, less than 12 lymph nodes removed or assessed, positive margin, perineural invasion,). The
information of other three high risk features (lymphovascular invasion, obstruction, or perforation) was
not recorded in SEER database.
Control variables: The primary control variables included age of diagnosis (>=20 years old),
gender (male and female), race (white, black, other or unknown), year of diagnosis (2010-2015), and
urban/rural status.
Statistical Analysis
Patients were divided into two risk-feature groups. If patients presented any one of the five
SEER-listed high-risk features of recurrence, they were in the high-risk features group. If they did not
present any of the five SEER-listed high-risk features, they were in the low-risk features group.
Then we used 𝑥2 tests to compare the frequency of patients’ sociodemographic and cancer-
related variables by chemotherapy records (Yes vs. No/Unknown) within each risk group. The
sociodemographic variables were five control variables: age, gender, race, year of diagnosis, and
urban/rural status. The cancer-related variables included T stage, nodes examined, histology grades,
margin involvement, and perineural invasion.
Kaplan-Meier test were used to compare the OS difference by chemotherapy records (Yes vs.
No/Unknown) within each risk-feature group. Then Cox regression analysis was used to compare the
hazard ratio (HR) for different chemotherapy records (Yes vs. No/Unknown) within each risk-feature

32
group. Compared to patients in low-risk group, we were more interested in the effect of chemotherapy
on patients in high-risk group because patients in high-risk group were more likely to be recommended
to receive chemotherapy. Based on the presence of different high-risk features, the high-risk group
patients were further divided into five subgroups: patients at least with T4 tumor, patients at least with
poorly/differentiated histology, patients at least with less than 12 lymph nodes removed or assessed,
patients at least with positive margin, and patients at least with perineural invasion. For each of these
five subgroups, we repeated to conduct Kaplan-Meier test and Cox regression analysis.
RESULTS
Characteristics of Patients
As described in the patients and methods section, 23,354 patients were included in this study
based on the patient selection algorithm. These patients were divided into low-risk feature group
(n=9,517) and high-risk feature group (n=10,360). Additionally, 3,477 patients could not be decided into
any group because of the missing values for some cancer-related variables. In this study, we were only
interested in patients in low-risk feature group and high-risk feature group.
Table 1 compare the sociodemographic and cancer-related characteristics of patients by
chemotherapy records within each risk group. Compared to low-risk group, the percentage of patients
who received chemotherapy in high-risk group was obviously higher. No matter in low-risk feature
group or high-risk feature group, compared to those who did not received chemotherapy or unknown,
patients who received chemotherapy tended to be younger. There was not obvious chemotherapy
record difference for different gender, race, year of diagnosis, or rural/urban status. For patients in high-
risk group, compared to those who did not receive chemotherapy or unknown, patients who received
chemotherapy were more likely to have T4 tumor. There was not obvious chemotherapy record
difference for other four cancer-related characteristics.
Survival Benefit of Chemotherapy
For patients in low-risk group (Figure 1), Kaplan-Meier Curve (Log-Rank, P<0.0001) and
unadjusted Hazard Ratio [0.534, 95% CI (0.422, 0.676), P<0.0001] showed that the OS of patients who
received chemotherapy was significantly higher than those who did not or unknown. However, when
controlling for age of diagnosis, gender, race, year of diagnosis, and rural/urban status, the adjusted HR
[0.926, 95% CI (0.726, 1.180), P=0.5323] is not significant, indicating that there was not significant
survival difference for patients who received chemotherapy and those who did not or unknow.
Likewise, for patients in high risk group (Figure 2), patients who received chemotherapy had
better survival than those not or unknown as the Kaplan-Meier Curve (Log-Rank, P<0.0001) and
unadjusted HR [0.645, 95% CI (0.576, 0.721), P<0.0001] showed, but the adjusted HR [0.965, 95% CI
(0.856, 1.088), P=0.5592] showed that this survival difference was insignificant.
Further, for each subgroup of high-risk feature group, we found that when patients at least
presented T4 tumor, Kaplan-Meier test (Log-Rank, P<0.0001), unadjusted HR [0.553, 95% CI (0.478,
0.640), P<0.0001] and adjusted HR [0.770, 95% CI (0.656, 0.904), P=0.0014] consistently reflected that
patients could benefit from Chemotherapy (Figure 3). Differently, for patients with positive margin,
Kaplan-Meier test (Log-Rank, P=0.1501), unadjusted HR [0.852, 95% CI (0.684, 1.061), P=0.1520] and

33
adjusted HR [1.196, 95% CI (0.948, 1.509), P=0.1319] consistently reflected that there was not significant
OS difference for patients who received chemotherapy and those who did not or unknow (Figure 6). The
analysis for other 3 high-risk features were similar (Figure 4, Figure 5, Figure 7): Although Kaplan-Meier
test and unadjusted HR indicated that chemotherapy could improve OS, adjusted HR indicated this
improvement was insignificant.
DISCUSSION
The univariate analysis reflected that no matter patients presented any high-risk feature or not,
the survival rate for patients who received chemotherapy was obviously better than those who did not
or unknown. This difference disappeared after patients’ sociodemographic characteristics were
controlled. The possible reason was that younger patients were more likely to receive chemotherapy
and younger patients had better survival than older patients. Chemotherapy did not really improve
patients’ survival.
Patients who presented any high-risk features of recurrence were more likely to be
recommended to receive chemotherapy. However, in this study, even when patients presented any
high-risk features, chemotherapy did not really improve patients’ survival. We guessed that maybe for
some special high-risk features, chemotherapy could improve patients’ survival, but for some other
features, chemotherapy could not improve patients’ survival. After analysis, we found when patients
presented T4 tumor feature, no matter they presented any other high-risk features or not,
chemotherapy could improve their survival. For other four high-risk features, we could not decide if
chemotherapy really improved patients’ survival.
In this analysis, the data was the information of patients diagnosed as colon adenocarcinoma
from 2010 to 2015. This data is the newest data for colon cancer in SEER database. From 2010, the
information of margin involvement and perineural invasion became available. Few previous studies
involved these two factors. The other advantage of this study was that the age range. Some previous
studies only involved patients aged 65 or older, but this study included younger patients (O'Connor et
al., 2011; Weiss et al., 2014).
Because SEER data did not include the information of perineural invasion, obstruction, and
perforation. The definition of risk group was not precise, and we could not test the effects of these three
features. SEER data recorded chemotherapy as “Yes” and “No/Unknow”, which also influenced the
accuracy of analysis. In addition, SEER data did not record the time of chemotherapy, thus we could not
precisely distinguish the adjuvant chemotherapy and non-adjuvant chemotherapy. Two solutions for
these limitations were to use SEER-Medicare data or KCR data. However, SEER-Medicare data lacked the
information of patients aged <65. KCR data for stage II colon cancer was too small to impactable. Further
analysis needs more advanced database.
CONCLUSIONS
For patients with stage II colon cancer, chemotherapy improved the overall survival for those presented
T4 tumor feature, no matter they presented any other high-risk features or not. The presence of T4
tumor was an important indicator of chemotherapy for stage II colon cancer.

34
Table 1. Characteristics of Patients Undergoing Surgery for Stage II Colon Cancer Stage II without any high-risk features
(n=9,517)
Stage II with any high-risk feature (n=10,360)
Characteristics No Chemo or Unknow (n=8,509)
Chemo (n=1,008)
P No Chemo or Unknow (n=7,668)
Chemo (n=2,692)
P
Age, years, %
<0.0001
<0.0001
20-49 7.05 26.79
6.17 19.17
50-64 27.01 44.25
22.4 43.31
65-74 27.12 20.14
25.12 26.3
75+ 38.82 8.83
46.31 11.22
Gender, %
0.9785
<0.0001
Male 49.75 49.7
46.35 51.23
Female 50.25 50.3
53.65 48.77
Race, %
<0.0001
0.0044
White 79.84 73.81
81.7 79.72
Black 11.04 15.77
10.54 13
other 8.56 10.12
7.46 7.1
Unknown 0.56 0.3
0.3 0.19
Year of Diagnosis, %
0.503
0.0102
2010-2011 33.66 35.42
38.81 37.3
2012-2013 36.57 35.12
36.54 35.1
2014-2015 29.77 29.46
24.65 27.6
Metro/Rural, %
0.4698
0.5606
Metro 87.3 88.1
86.92 86.48
Rural 12.7 11.9
13.08 13.52
T Stage, %
<0.0001
T3 100 100
72.08 41.05
T4 0 0
27.92 58.95
Nodes Examined, %
<0.0001
<12 0 0
27.03 21.51
>=12 100 100
72.85 78.27
Unknown 0 0
0.12 0.22
Histology Grade, %
<0.0001
Well or Moderately differentiated
100 100
60.42 65.9
Poorly or Undifferentiated differentiated
0 0
38.12 31.5
unknown 0 0
1.46 2.6
Margin involvement, %
<.0001
Positive 0 0
20.51 21.36
Negative 100 100
58.06 53.16
Unknown 0 0
21.43 25.48
Perineural Invasion, %
0.0092
No invasion present 100 100
76.02 73.22
Invasion present 0 0
13.02 13.97
Unknown 0 0 10.97 12.82

35
Figure 1. The effects of adjuvant chemotherapy on overall survival for patients without any high-risk feature
Figure 2. The effects of adjuvant chemotherapy on overall survival for patients with any high-risk feature

36
Figure 3. The effects of adjuvant chemotherapy on overall survival for patients at least with T4 tumor
Figure 4. The effects of adjuvant chemotherapy on overall survival for patients at least with < 12 lymph nodes removed or
assessed

37
Figure 5. The effects of adjuvant chemotherapy on overall survival for patients at least with poorly/differentiated histology
Figure 6. The effects of adjuvant chemotherapy on overall survival for patients at least with positive margin
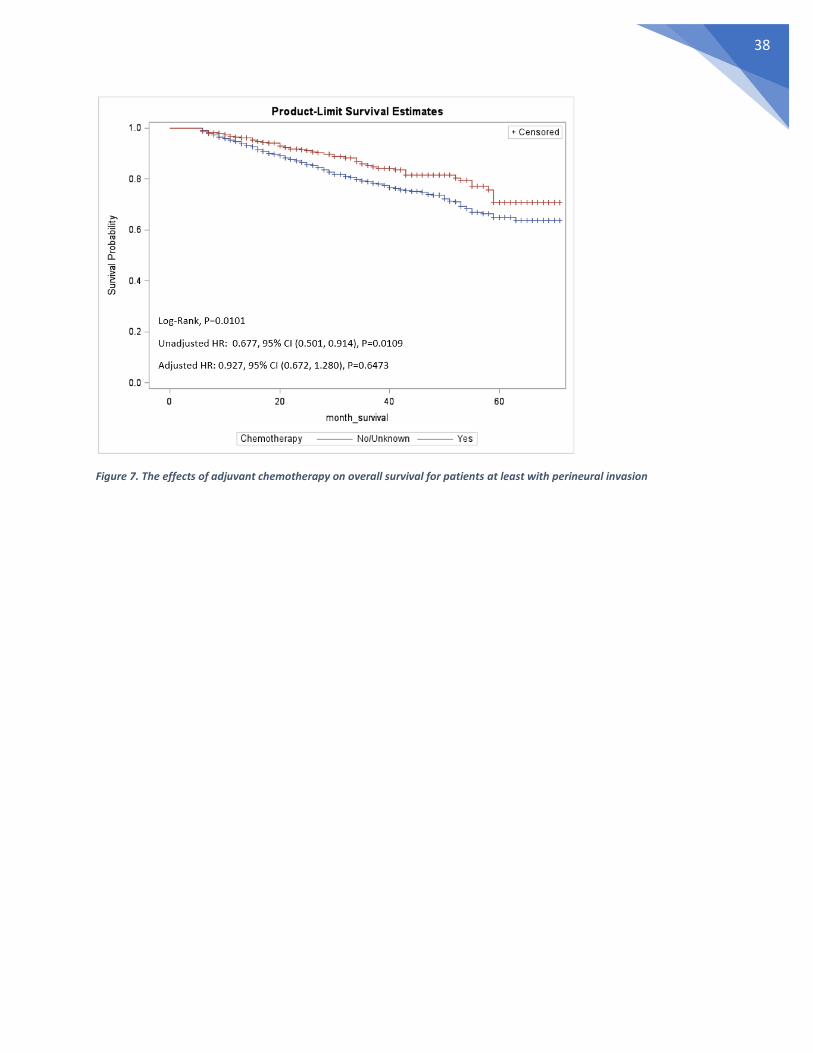
38
Figure 7. The effects of adjuvant chemotherapy on overall survival for patients at least with perineural invasion

39
REFERENCES
American Cancer Society. (2018a). Key Statistics for Colorectal Cancer. Retrieved from https://www.cancer.org/cancer/colon-rectal-cancer/about/key-statistics.html
American Cancer Society. (2018b). Treatment of Colon Cancer, by Stage. Retrieved from https://www.cancer.org/cancer/colon-rectal-cancer/treating/by-stage-colon.html
American Society of Clinical Oncology. (2004). Adjuvant Chemotherapy for Stage II Colon Cancer. Retrieved from https://www.cancer.net/research-and-advocacy/asco-care-and-treatment-recommendations-patients/adjuvant-chemotherapy-stage-ii-colon-cancer
American Society of Clinical Oncology. (2017). Colorectal Cancer: Treatment Options. Retrieved from https://www.cancer.net/cancer-types/colorectal-cancer/treatment-options
Böckelman, C., Engelmann, B. E., Kaprio, T., Hansen, T. F., & Glimelius, B. (2015). Risk of recurrence in patients with colon cancer stage II and III: A systematic review and meta-analysis of recent literature. Acta Oncologica, 54(1), 5-16. doi:10.3109/0284186X.2014.975839
Fang, S. H., Efron, J. E., Berho, M. E., & Wexner, S. D. (2014). Dilemma of Stage II Colon Cancer and Decision Making for Adjuvant Chemotherapy. Journal of the American College of Surgeons, 219(5), 1056-1069. doi:https://doi.org/10.1016/j.jamcollsurg.2014.09.010
Kopetz, S., Freitas, D., Calabrich, A. F. C., & Hoff, P. M. (2008). Adjuvant chemotherapy for stage II colon cancer. Cancer Network - Home of the Journal Oncology, 22(3).
Kucukzeybek, Y., Dirican, A., Demir, L., Yildirim, S., Akyol, M., Yildiz, Y., . . . Tarhan, M. O. (2015). Adjuvant chemotherapy and prognostic factors in stage II colon cancer--Izmir Oncology Group Study. Asian Pacific Organization fot Cancer Prevention, 16(6), 2413-2418.
Kumar, A., Kennecke, H. F., Renouf, D. J., Lim, H. J., Gill, S., Woods, R., . . . Cheung, W. Y. (2014). Adjuvant chemotherapy use and outcomes of patients with high-risk versus low-risk stage II colon cancer. Cancer, 121(4), 527-534. doi:10.1002/cncr.29072
O'Connor, E. S., Greenblatt, D. Y., LoConte, N. K., Gangnon, R. E., Liou, J.-I., Heise, C. P., & Smith, M. A. (2011). Adjuvant Chemotherapy for Stage II Colon Cancer With Poor Prognostic Features. Journal of Clinical Oncology, 29(25), 3381-3388. doi:10.1200/JCO.2010.34.3426
Varghese, A. (2015). Chemotherapy for Stage II Colon Cancer. Clinics in Colon and Rectal Surgery, 28(4), 256-261. doi:10.1055/s-0035-1564430
Verhoeff, S. R., van Erning, F. N., Lemmens, V. E. P. P., de Wilt, J. H. W., & Pruijt, J. F. M. (2016). Adjuvant chemotherapy is not associated with improved survival for all high-risk factors in stage II colon cancer. International Journal of Cancer, 139(1), 187-193. doi:10.1002/ijc.30053
Weiss, J. M., Schumacher, J., Allen, G. O., Neuman, H., Lange, E. O. C., Loconte, N. K., . . . Smith, M. A. (2014). Adjuvant chemotherapy for stage II right-sided and left-sided colon cancer: analysis of SEER-medicare data. Annals of surgical oncology, 21(6), 1781-1791. doi:10.1245/s10434-014-3631-8

40
9. Defense Presentation

41

42

43

44

45

46


![[C8] Optimal duration of adjuvant chemotherapy for ...](https://static.fdocuments.net/doc/165x107/62143c1523188548457883bd/c8-optimal-duration-of-adjuvant-chemotherapy-for-.jpg)