The impact of a prescription review and prescriber ...
13
RESEARCH ARTICLE Open Access The impact of a prescription review and prescriber feedback system on prescribing practices in primary care clinics: a cluster randomised trial Wei Yin Lim 1* , Amar Singh HSS 1,2 , Li Meng Ng 3 , Selva Rani John Jasudass 4 , Sondi Sararaks 5 , Paranthaman Vengadasalam 6 , Lina Hashim 1 and Ranjit Kaur Praim Singh 7 Abstract Background: To evaluate the effectiveness of a structured prescription review and prescriber feedback program in reducing prescribing errors in government primary care clinics within an administrative region in Malaysia. Methods: This was a three group, pragmatic, cluster randomised trial. In phase 1, we randomised 51 clinics to a full intervention group (prescription review and league tables plus authorised feedback letter), a partial intervention group (prescription review and league tables), and a control group (prescription review only). Prescribers in these clinics were the target of our intervention. Prescription reviews were performed by pharmacists; 20 handwritten prescriptions per prescriber were consecutively screened on a random day each month, and errors identified were recorded in a standardised data collection form. Prescribing performance feedback was conducted at the completion of each prescription review cycle. League tables benchmark prescribing errors across clinics and individual prescribers, while the authorised feedback letter detailed prescribing performance based on a rating scale. In phase 2, all clinics received the full intervention. Pharmacists were trained on data collection, and all data were audited by researchers as an implementation fidelity strategy. The primary outcome, percentage of prescriptions with at least one error, was displayed in p-charts to enable group comparison. Results: A total of 32,200 prescriptions were reviewed. In the full intervention group, error reduction occurred gradually and was sustained throughout the 8-month study period. The process mean error rate of 40.7% (95% CI 27.4, 29.5%) in phase 1 reduced to 28.4% (95% CI 27.4, 29.5%) in phase 2. In the partial intervention group, error reduction was not well sustained and showed a seasonal pattern with larger process variability. The phase 1 error rate averaging 57.9% (95% CI 56.5, 59.3%) reduced to 44.8% (95% CI 43.3, 46.4%) in phase 2. There was no evidence of improvement in the control group, with phase 1 and phase 2 error rates averaging 41.1% (95% CI 39.6, 42.6%) and 39.3% (95% CI 37.8, 40.9%) respectively. Conclusions: The rate of prescribing errors in primary care settings is high, and routine prescriber feedback comprising league tables and a feedback letter can effectively reduce prescribing errors. Trial registration: National Medical Research Register: NMRR-12-108-11,289 (5th March 2012). Keywords: Prescribing errors, P-chart, Statistical process control chart, League tables, Feedback, Prescription review, Primary care, Prescribers * Correspondence: [email protected] 1 Clinical Research Centre Perak, Ministry of Health Malaysia, Level 4, Ambulatory Care Centre, Raja Permaisuri Bainun Hospital, Jalan Raja Ashman Shah, 30450 Ipoh, Perak, Malaysia Full list of author information is available at the end of the article © The Author(s). 2018 Open Access This article is distributed under the terms of the Creative Commons Attribution 4.0 International License (http://creativecommons.org/licenses/by/4.0/), which permits unrestricted use, distribution, and reproduction in any medium, provided you give appropriate credit to the original author(s) and the source, provide a link to the Creative Commons license, and indicate if changes were made. The Creative Commons Public Domain Dedication waiver (http://creativecommons.org/publicdomain/zero/1.0/) applies to the data made available in this article, unless otherwise stated. Lim et al. BMC Family Practice (2018) 19:120 https://doi.org/10.1186/s12875-018-0808-4
Transcript of The impact of a prescription review and prescriber ...

RESEARCH ARTICLE Open Access
The impact of a prescription review andprescriber feedback system on prescribingpractices in primary care clinics: a clusterrandomised trialWei Yin Lim1* , Amar Singh HSS1,2, Li Meng Ng3, Selva Rani John Jasudass4, Sondi Sararaks5,Paranthaman Vengadasalam6, Lina Hashim1 and Ranjit Kaur Praim Singh7
Abstract
Background: To evaluate the effectiveness of a structured prescription review and prescriber feedback program inreducing prescribing errors in government primary care clinics within an administrative region in Malaysia.
Methods: This was a three group, pragmatic, cluster randomised trial. In phase 1, we randomised 51 clinics to a fullintervention group (prescription review and league tables plus authorised feedback letter), a partial interventiongroup (prescription review and league tables), and a control group (prescription review only). Prescribers in theseclinics were the target of our intervention. Prescription reviews were performed by pharmacists; 20 handwrittenprescriptions per prescriber were consecutively screened on a random day each month, and errors identified wererecorded in a standardised data collection form. Prescribing performance feedback was conducted at thecompletion of each prescription review cycle. League tables benchmark prescribing errors across clinics andindividual prescribers, while the authorised feedback letter detailed prescribing performance based on a ratingscale. In phase 2, all clinics received the full intervention. Pharmacists were trained on data collection, and all datawere audited by researchers as an implementation fidelity strategy. The primary outcome, percentage ofprescriptions with at least one error, was displayed in p-charts to enable group comparison.
Results: A total of 32,200 prescriptions were reviewed. In the full intervention group, error reduction occurredgradually and was sustained throughout the 8-month study period. The process mean error rate of 40.7% (95% CI27.4, 29.5%) in phase 1 reduced to 28.4% (95% CI 27.4, 29.5%) in phase 2. In the partial intervention group, errorreduction was not well sustained and showed a seasonal pattern with larger process variability. The phase 1 errorrate averaging 57.9% (95% CI 56.5, 59.3%) reduced to 44.8% (95% CI 43.3, 46.4%) in phase 2. There was no evidenceof improvement in the control group, with phase 1 and phase 2 error rates averaging 41.1% (95% CI 39.6, 42.6%)and 39.3% (95% CI 37.8, 40.9%) respectively.
Conclusions: The rate of prescribing errors in primary care settings is high, and routine prescriber feedbackcomprising league tables and a feedback letter can effectively reduce prescribing errors.
Trial registration: National Medical Research Register: NMRR-12-108-11,289 (5th March 2012).
Keywords: Prescribing errors, P-chart, Statistical process control chart, League tables, Feedback, Prescription review,Primary care, Prescribers
* Correspondence: [email protected] Research Centre Perak, Ministry of Health Malaysia, Level 4,Ambulatory Care Centre, Raja Permaisuri Bainun Hospital, Jalan Raja AshmanShah, 30450 Ipoh, Perak, MalaysiaFull list of author information is available at the end of the article
© The Author(s). 2018 Open Access This article is distributed under the terms of the Creative Commons Attribution 4.0International License (http://creativecommons.org/licenses/by/4.0/), which permits unrestricted use, distribution, andreproduction in any medium, provided you give appropriate credit to the original author(s) and the source, provide a link tothe Creative Commons license, and indicate if changes were made. The Creative Commons Public Domain Dedication waiver(http://creativecommons.org/publicdomain/zero/1.0/) applies to the data made available in this article, unless otherwise stated.
Lim et al. BMC Family Practice (2018) 19:120 https://doi.org/10.1186/s12875-018-0808-4

BackgroundAdverse drug events (ADEs) are one of the importantcauses of morbidity and mortality in primary care [1–3].Such adverse events are frequently associated with medi-cation errors [4–6], which can occur during any step ofthe medication use process–prescribing, transcribing, dis-pensing, administration, and monitoring [7]. Prescribing,the first stage in the medication use pathway, is most oftenthe source of a series of drug-related problems in thehealthcare system. A systematic review in 2007 reportedthat the largest proportion of errors in ambulatory careoriginated in the prescribing stage, accounting for 64.7%of all preventable ADEs, and 56.0% of preventable ADEsresulting in hospital admission [8].Medication safety in primary care is considerably
important, as primary care clinics are increasingly respon-sible for complex medication regimens, and a large por-tion of medical encounters are with government primarycare practices [9]. However, despite primary care servicesplaying an integral part of the healthcare delivery, qualityimprovement programs are less widespread in ambulatorysettings compared to inpatient settings. Given that pre-scribing errors are theoretically preventable, interventionsshould target errors in prescribing [8].Several published articles have described programs
designed to improve physician prescribing behaviour.Recent reviews suggest that, in order to change prescrib-ing behaviour, an active intervention is required [10–14].Implementation research has also revealed the ineffect-iveness of passive strategies such as printed educationmaterials on actual prescribing behaviour, whilerelatively more active strategies such as audit withon-going feedback have shown greater promise incertain types of prescribing practices [11, 15]. However,the positive impact of audit with feedback was inconclu-sive [16, 17]. A Cochrane systematic review in 2006 [18]and the updated review in 2012 [19] concluded that theimpact of audit and feedback on professional practice issmall but potentially important, and is affected by thefeedback delivery mechanism.There is relatively little research about improving pre-
scribing practice in primary care. As providing feedbackis proven useful for changing behaviour, we aimed todesign a prescription review and prescriber feedbackprogram and to evaluate its effectiveness on improvingprescribing practices in government primary care clinics.We designed the study to minimally change dailypractices as the ultimate aim was to improve prescribingquality in the primary care system nationwide.
MethodsStudy design and participantsWe conducted a three-group pragmatic cluster rando-mised controlled trial among government primary care
clinics with pharmacists in Perak, Malaysia. We chose acluster design because the intervention was applied atthe health clinic level. Of a total 79 government healthclinics in Perak providing primary care services, 55clinics with pharmacists were identified for the study, asthe intervention involved prescription review by phar-macists. Excluded were health clinics with electronicprescribing systems, as the quality of computerised pre-scribing differed from that of manual prescribing [20].Primary care prescribers of the remaining 51 healthclinics were the target of this pragmatic intervention.We included prescribers of different expertise levels:family medicine specialists, medical officers, and medicalassistants, all who routinely prescribe medications topatients in the primary care setting. Handwritten pre-scriptions of these prescribers were prospectivelyreviewed by pharmacists to screen for prescribing errors.This pragmatic trial was conducted over eight months
in two phases (May to December 2012). In phase 1 (Mayto August 2012), health clinics were randomised intoone of three groups to receive either a) full feedbackintervention [structured prescription review andprescribing performance feedback (league tables andauthorised feedback letter)], b) partial feedback interven-tion [structured prescription review and prescribingperformance feedback (league tables only)], or c) usualcare as control (structured prescription review only).Prescription data collected in May 2012 represented thebaseline data for the study. Interventions based on groupallocation were implemented after the collection of base-line data. At the end of this phase, the prescribingperformance of these three groups were compared todetermine the intervention’s effect on error rates. Inphase 2 (September to December 2012), all study groupsreceived full feedback intervention, and prescribingperformance was monitored until the end of the phase.In December 2012, the last batch of prescribingperformance feedback was sent to prescribers and thetrial ended. See Fig. 1 for the trial methodology flowchart of the trial.
Allocation and blindingIn Perak, the 51 eligible health clinics come under theadministration purview of ten health districts, eachheaded by a district health officer. Therefore, for thepurpose of implementing the intervention program, westratified the ten health districts by size (large: ≥6 healthclinics, small: < 6 health clinics) and randomly allocatedthem in a 1:1:1 ratio to three parallel groups: full inter-vention group (full feedback intervention), partial inter-vention group (partial feedback intervention), andcontrol group (usual care) by simple randomisation.Stratification by district size was to obtain an even distri-bution of large and small districts in each study group.
Lim et al. BMC Family Practice (2018) 19:120 Page 2 of 13

Due to the nature of the community interventions, itwas not possible to blind neither the pharmacists northe prescribers. The prescribers in the full and partialintervention groups were aware of the interventionswhen the first batch of prescribing performance feed-back was mailed to them after the collection of baselinedata. It was also not possible to blind the data analystbecause the intervention program was implementedcontinuously and monthly feedback was provided toprescribers. However, the intervention assignments wereconcealed to the pharmacists and prescribers prior torandomisation.
Prescription review and prescriber feedback programAs a pragmatic trial, state managers and clinicians wereengaged throughout the study design, especially withdesigning the intervention program and its implementa-tion work flow. The intervention program consists oftwo core components: a) structured prescription review
and b) prescribing performance feedback containing twoitems: i) league tables and ii) authorised feedback letter.The structured prescription review component is builtupon the basic duty of pharmacists—review prescrip-tions presented to them and intervene when necessaryto ensure that prescriptions are therapeutically appropri-ate for patients. As this component closely resemblesthe pharmacist’s daily professional practice, it is there-fore considered as ‘usual care’, albeit more structuredand standardised (see Structured prescription review bypharmacists and Training of pharmacists).
Structured prescription review by pharmacistsStructured prescription review was conducted monthlyby pharmacists in the health clinics. This process wasconducted in accordance with a structured protocolprepared by the researchers; pharmacists were speciallytrained to conduct comprehensive prescription reviews(see Training of pharmacists), and researchers regularly
Fig. 1 Summary of trial methodology flow chart
Lim et al. BMC Family Practice (2018) 19:120 Page 3 of 13

audited this process to ensure its quality throughout thestudy. Handwritten prescriptions of prescribers ineligible clinics were consecutively collected by pharma-cists and screened for errors. Pharmacists were requiredto collect 20 prescriptions per prescriber for up to fiveworking days, starting from a randomly selected date ineach month. To ensure that all prescription reviews wereconsistently conducted across health clinics, weconstructed a standardised form for data collection.Errors identified in the prescriptions were recorded inthe Prescribing Error Record Form (see Additional file 1).The definition of a prescribing error was adapted fromthat of Dean et al. [21]. The prescriptions were checkedfor: incomplete patient and prescriber information,incomplete dosing regimen (duration/quantity, dose,frequency, dosage form, strength), illegibility, use ofnon-standard abbreviations, inappropriate/incorrectdosing regimen (dose, frequency, duration, dosage form),polypharmacy, medication duplicity, and contraindica-tions. These errors were subcategorised into drug errors,information errors, and administrative errors (Table 1).Prescribing errors that do not fall into any of the prede-fined subcategories were categorised as other errors. ThePrescribing Error Record Form, along with photocopiedprescriptions, were delivered to the researchers for dataentry, analysis, and generation of prescribing perform-ance feedback for prescribers. As an implementationfidelity strategy, each prescription was re-evaluated forerrors by the researchers [22]. Errors missed or wronglyidentified during this process were promptly correctedby the researchers, and communicated to the pharma-cists via email. This strategy was conducted to improvesubsequent data collection by pharmacists.
Prescribing performance feedback to prescribersAt the completion of each prescription review cycle, dataon prescribing errors recorded in the Prescribing ErrorRecord Form were analysed to generate personalisedperformance feedback reports for prescribers. The firstbatch of prescribing performance feedback was mailedto prescribers using the baseline data in May 2012. The
prescribing performance feedback reports included twoitems. The first item was a graphical presentation ofprescribing performance data—league tables (bar charts)displaying the percentage of prescribing errors at thehealth district, health clinic levels, as well as of individ-ual prescribers (see Additional file 2). The specific typesof prescribing error were also displayed in this item. Thesecond item was an authorised feedback letter detailingindividual prescribing error rate and prescribingperformance based on a performance rating scale (seeAdditional File 3) [23]. This scale consisted of five levelsof performance: excellent (top 10% of scale), good (top11–30% of scale), average (middle 40% of scale), belowaverage (bottom 11–30% of scale), and poor (bottom10% of scale). Trends in prescribing errors were alsoshown in this item. Prescribing performance feedbackreports were mailed to individual prescribers within twoweeks of completion of each prescription review cycle.There were two exceptions—prescribing performancefeedback reports for September and November weredelivered to prescribers together with the reports forOctober and December, respectively (e.g. prescribingperformance feedback reports in October contains datafor September and October). The delay in the delivery ofprescribing performance feedback reports was becausethe computer-generated dates for prescription review ofthe consecutive months were in close proximity; thusthere was insufficient time to generate and mail reportsto prescribers before the next structured prescriptionreview cycle. To ensure that appropriate actions weretaken to improve prescribing practice, a summaryprescribing performance feedback report was also mailedto the district health officer of each health district, whois responsible for the administrative overview of thehealth district.
Training of pharmacistsWe provided training to pharmacists on prescriptionreview, data collection, and document delivery. Thetraining was done over three sittings, with differentpharmacists according to health districts as per group
Table 1 Subclassification of prescribing errors
Drug Error Information Error Administrative Error
Inappropriate dose Duration/quantity not specified No prescriber name/stamp
Inappropriate frequency Dose not specified No prescriber signature
Inappropriate duration Frequency not specified No date
Inappropriate dosage form Dosage form not specified No patient name
Polypharmacy Strength not specified No patient age
Medication duplication Illegible No patient ID
Contraindication Abbreviation No diagnosis
Incorrect patient name
Lim et al. BMC Family Practice (2018) 19:120 Page 4 of 13
allocation, to avoid treatment contamination betweenstudy groups. Pharmacists were trained on standardoperating procedures, the types of prescribing errors,and the data collection process. Each pharmacistreceived a folder containing essential documents for thestudy, which included a) instructions and a flow charton data collection and document delivery, b) operationaldefinitions and examples of the specific types ofprescribing error, c) prescriber code list containingunique identification codes for each prescriber, d) copiesof the Prescribing Error Record Form, and e)researchers’ contact details. A test was administered afterthe training to determine the competency of pharmacistsin identifying and recording prescribing errors. A set offour prescriptions with and without errors was given toeach pharmacist, and each were asked to identify andrecord errors into the Prescribing Error Record Form.All pharmacists were required to achieve the passingmark of 85%, and those who failed received re-traininguntil they passed the test.
Sampling method and sample sizeUsing multi-stage sampling, we sampled prescriptionsfor review. First, we randomly selected a date in eachmonth from a list of random numbers generated usingEpiCalc 2000 [24]. This randomly selected day is the firstof the five prescription collection days. Following this,we consecutively sampled prescriptions from all eligibleprescribers for review.We estimated that a minimum of 20 prescriptions per
prescriber was sufficient to determine the percentage ofprescribing errors each month, based on the number ofprescriptions to be collected for each prescriber, thesampling unit. Assuming the percentage of errors in theaverage prescriber was 45% [25], the minimum errors tobe detected was 15% (null hypothesis), a significancelevel of 5% and a power of 90%, the required sample was19. No drop out was expected as all handwritten pre-scriptions were consecutively collected by pharmacists.Therefore, the number of prescriptions per prescriber tobe collected was 20.
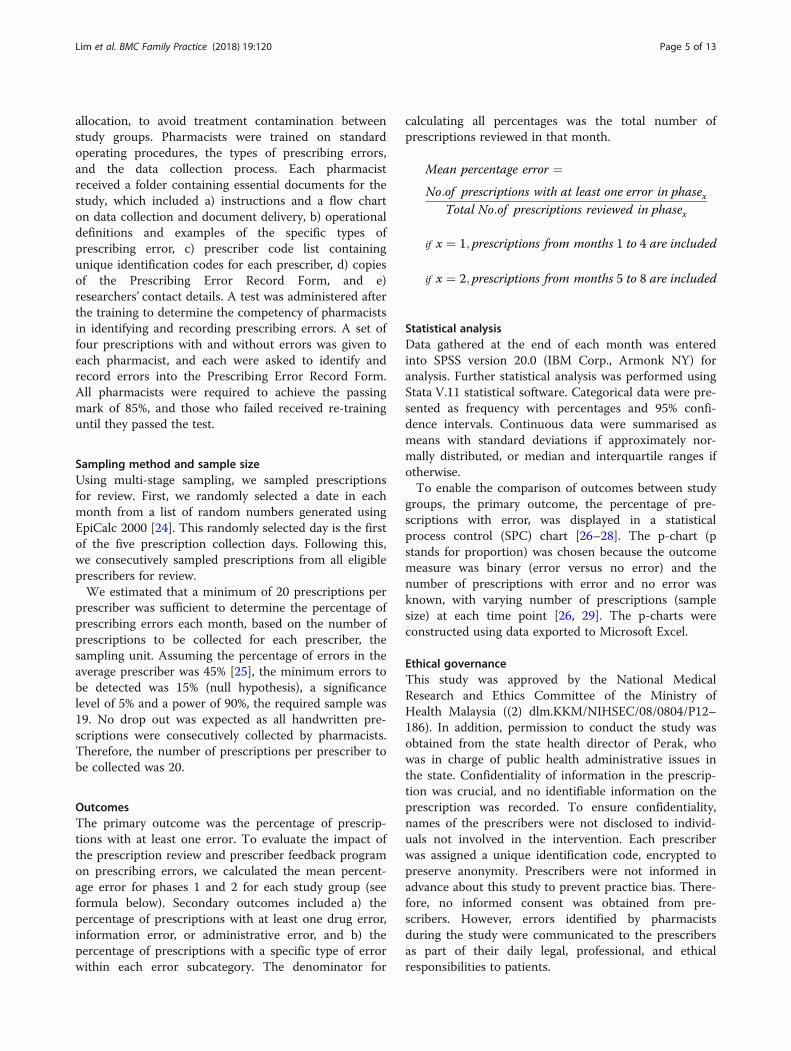
OutcomesThe primary outcome was the percentage of prescrip-tions with at least one error. To evaluate the impact ofthe prescription review and prescriber feedback programon prescribing errors, we calculated the mean percent-age error for phases 1 and 2 for each study group (seeformula below). Secondary outcomes included a) thepercentage of prescriptions with at least one drug error,information error, or administrative error, and b) thepercentage of prescriptions with a specific type of errorwithin each error subcategory. The denominator for
calculating all percentages was the total number ofprescriptions reviewed in that month.
Mean percentage error ¼No:of prescriptions with at least one error in phasex
Total No:of prescriptions reviewed in phasex
if x ¼ 1; prescriptions from months 1 to 4 are included
if x ¼ 2; prescriptions from months 5 to 8 are included
Statistical analysisData gathered at the end of each month was enteredinto SPSS version 20.0 (IBM Corp., Armonk NY) foranalysis. Further statistical analysis was performed usingStata V.11 statistical software. Categorical data were pre-sented as frequency with percentages and 95% confi-dence intervals. Continuous data were summarised asmeans with standard deviations if approximately nor-mally distributed, or median and interquartile ranges ifotherwise.To enable the comparison of outcomes between study
groups, the primary outcome, the percentage of pre-scriptions with error, was displayed in a statisticalprocess control (SPC) chart [26–28]. The p-chart (pstands for proportion) was chosen because the outcomemeasure was binary (error versus no error) and thenumber of prescriptions with error and no error wasknown, with varying number of prescriptions (samplesize) at each time point [26, 29]. The p-charts wereconstructed using data exported to Microsoft Excel.
Ethical governanceThis study was approved by the National MedicalResearch and Ethics Committee of the Ministry ofHealth Malaysia ((2) dlm.KKM/NIHSEC/08/0804/P12–186). In addition, permission to conduct the study wasobtained from the state health director of Perak, whowas in charge of public health administrative issues inthe state. Confidentiality of information in the prescrip-tion was crucial, and no identifiable information on theprescription was recorded. To ensure confidentiality,names of the prescribers were not disclosed to individ-uals not involved in the intervention. Each prescriberwas assigned a unique identification code, encrypted topreserve anonymity. Prescribers were not informed inadvance about this study to prevent practice bias. There-fore, no informed consent was obtained from pre-scribers. However, errors identified by pharmacistsduring the study were communicated to the prescribersas part of their daily legal, professional, and ethicalresponsibilities to patients.
Lim et al. BMC Family Practice (2018) 19:120 Page 5 of 13
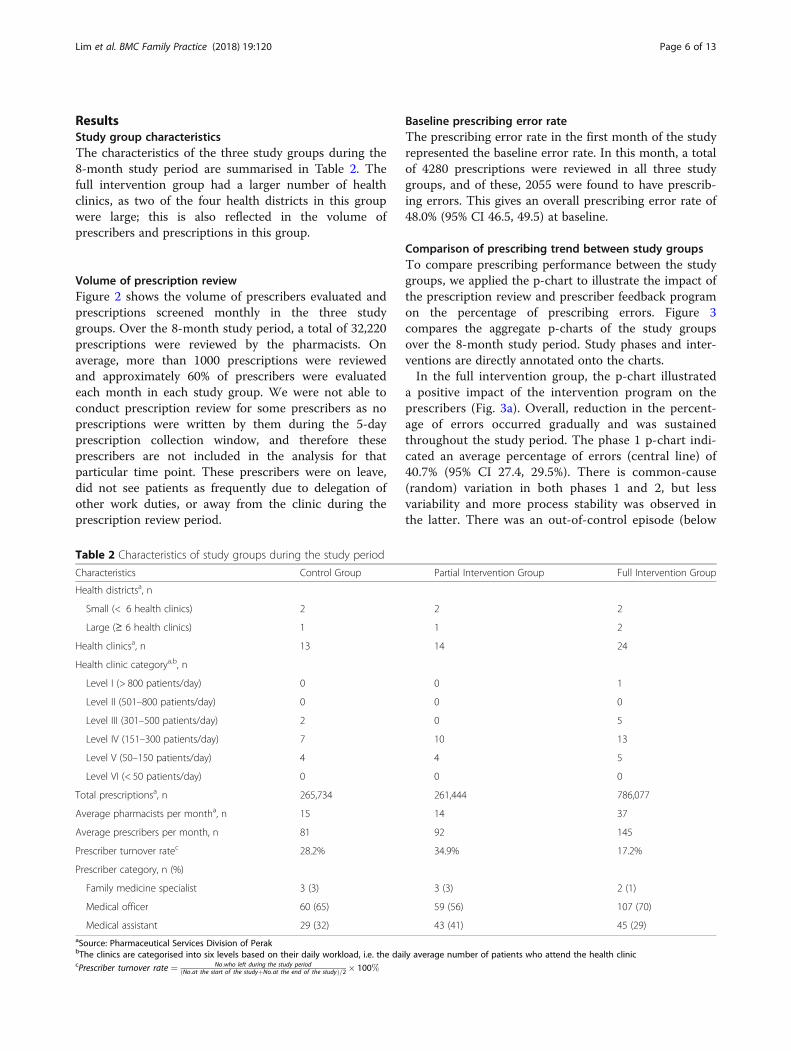
ResultsStudy group characteristicsThe characteristics of the three study groups during the8-month study period are summarised in Table 2. Thefull intervention group had a larger number of healthclinics, as two of the four health districts in this groupwere large; this is also reflected in the volume ofprescribers and prescriptions in this group.
Volume of prescription reviewFigure 2 shows the volume of prescribers evaluated andprescriptions screened monthly in the three studygroups. Over the 8-month study period, a total of 32,220prescriptions were reviewed by the pharmacists. Onaverage, more than 1000 prescriptions were reviewedand approximately 60% of prescribers were evaluatedeach month in each study group. We were not able toconduct prescription review for some prescribers as noprescriptions were written by them during the 5-dayprescription collection window, and therefore theseprescribers are not included in the analysis for thatparticular time point. These prescribers were on leave,did not see patients as frequently due to delegation ofother work duties, or away from the clinic during theprescription review period.
Baseline prescribing error rateThe prescribing error rate in the first month of the studyrepresented the baseline error rate. In this month, a totalof 4280 prescriptions were reviewed in all three studygroups, and of these, 2055 were found to have prescrib-ing errors. This gives an overall prescribing error rate of48.0% (95% CI 46.5, 49.5) at baseline.
Comparison of prescribing trend between study groupsTo compare prescribing performance between the studygroups, we applied the p-chart to illustrate the impact ofthe prescription review and prescriber feedback programon the percentage of prescribing errors. Figure 3compares the aggregate p-charts of the study groupsover the 8-month study period. Study phases and inter-ventions are directly annotated onto the charts.In the full intervention group, the p-chart illustrated
a positive impact of the intervention program on theprescribers (Fig. 3a). Overall, reduction in the percent-age of errors occurred gradually and was sustainedthroughout the study period. The phase 1 p-chart indi-cated an average percentage of errors (central line) of40.7% (95% CI 27.4, 29.5%). There is common-cause(random) variation in both phases 1 and 2, but lessvariability and more process stability was observed inthe latter. There was an out-of-control episode (below
Table 2 Characteristics of study groups during the study period
Characteristics Control Group Partial Intervention Group Full Intervention Group
Health districtsa, n
Small (< 6 health clinics) 2 2 2
Large (≥ 6 health clinics) 1 1 2
Health clinicsa, n 13 14 24
Health clinic categorya,b, n
Level I (> 800 patients/day) 0 0 1
Level II (501–800 patients/day) 0 0 0
Level III (301–500 patients/day) 2 0 5
Level IV (151–300 patients/day) 7 10 13
Level V (50–150 patients/day) 4 4 5
Level VI (< 50 patients/day) 0 0 0
Total prescriptionsa, n 265,734 261,444 786,077
Average pharmacists per montha, n 15 14 37
Average prescribers per month, n 81 92 145
Prescriber turnover ratec 28.2% 34.9% 17.2%
Prescriber category, n (%)
Family medicine specialist 3 (3) 3 (3) 2 (1)
Medical officer 60 (65) 59 (56) 107 (70)
Medical assistant 29 (32) 43 (41) 45 (29)aSource: Pharmaceutical Services Division of PerakbThe clinics are categorised into six levels based on their daily workload, i.e. the daily average number of patients who attend the health cliniccPrescriber turnover rate ¼ No:who left during the study period
ðNo:at the start of the studyþNo:at the end of the studyÞ=2 � 100%
Lim et al. BMC Family Practice (2018) 19:120 Page 6 of 13

0%
10%
20%
30%
40%
50%
60%
70%
80%
90%
100%
0
500
1000
1500
2000
2500
May-12 Jun-12 Jul-12 Aug-12 Sep-12 Oct-12 Nov-12 Dec-12
Pre
scrib
ers
eval
uate
d
Num
ber
of p
resc
riptio
ns s
cree
ned
Control Group prescriptions Partial Intervention Group prescriptions
Full Intervention Group prescriptions Control Group prescribers
Partial Intervention Group prescribers Full Intervention Group prescribers
Fig. 2 Prescriptions screened and prescribers evaluated in each study group
Data point attributable to common-cause variationData point attributable to special-cause variation
(B) Baseline data+ Structured prescription review# Prescribing performance feedback item 1: League tables¥ Prescribing performance feedback item 2: Authorised feedback letter
20%
25%
30%
35%
40%
45%
50%
55%
60%
65%
May
-12
Jun-
12
Jul-1
2
Aug
-12
Sep
-12
Oct
-12
Nov
-12
Dec
-12
Pre
scrip
tions
with
err
or
Month
Phase 2Phase 1
(A) Full Intervention Group
(B)
+ + ++
+ + ++# # # #
## ##¥¥ ¥¥
20%
25%
30%
35%
40%
45%
50%
55%
60%
65%
May
-12
Jun-
12
Jul-1
2
Aug
-12
Sep
-12
Oct
-12
Nov
-12
Dec
-12
Pre
scrip
tions
with
err
or
Month
Phase 1 Phase 2
(C) Control Group
(B)
+ + +++ + ++## ##¥¥ ¥¥
20%
25%
30%
35%
40%
45%
50%
55%
60%
65%
May
-12
Jun-
12
Jul-1
2
Aug
-12
Sep
-12
Oct
-12
Nov
-12
Dec
-12
Pre
scrip
tions
with
err
or
Month
Phase 1 Phase 2
(B) Partial Intervention Group
(B)
+ + ++
+ + ++# # # #
## ##¥¥ ¥¥
Fig. 3 p-charts illustrating the percentage of prescriptions with error over the 8-month study period. The line with data markers represents thepercentage of prescriptions with error at each time point. The central line corresponds to the process mean (average percentage of prescriptionswith errors). The control limits (dotted lines) were calculated based on a normal approximation of the binomial distribution, and positioned at adistance of three standard deviations (SD) around the central line. The upper control limit was calculated by adding three times the SD to theprocess mean. The lower control limit was calculated by subtracting three times the SD from the process mean. The control limits for each timepoint was calculated based on its specific sample size (number of prescriptions), and drawn in stair-steps to reflect the changes in sample sizeover time. Data points within the control limits suggest common-cause variation, and data points outside the control limits suggest special-causevariation. There was a delay in the delivery of prescribing performance feedback in September and November 2012. Prescribing performancefeedback reports for September 2012 and November 2012 were delivered together with the reports for October 2012 and December2012, respectively
Lim et al. BMC Family Practice (2018) 19:120 Page 7 of 13

the lower control limit) at the end of phase 1, suggest-ing an adaptation of the intervention program in theprescribing system. The phase 2 p-chart indicated animproved process with percentage of errors averaging28.4% (95% CI 27.4, 29.5%). The full intervention pro-gram consisting of structured prescription review and acombination of league tables and authorised feedbackletters likely encouraged more complete compliance,less variability, and sustained improvement in prescrib-ing performance.Improvement in the prescribing performance of the
partial intervention group was not well sustained, andshowed a seasonal pattern in the later part of thep-chart (Fig. 3b). The phase 1 p-chart indicatesclearly that a less stable and inferior prescribingprocess was operating for the first four months of thestudy, with an average performance of 57.9% (95% CI56.5, 59.3%). Similar to the full intervention group, anout-of-control episode was observed at the end of phase1. In phase 2, the p-chart reveals a stable process with nospecial-cause variation, and an improved performancewith percentage of errors averaging 44.8% (95% CI 43.3,46.4%). However, the process variability in this phase islarger than that of the full intervention group, possiblydue to the introduction of authorised feedback letters andthe higher prescriber turnover in this group, causingchanges in the prescribing system.
The prescribing performance of the control group ap-peared to be different from the other two study groups(Fig. 3c). As illustrated in the p-chart, although processesin both phases 1 and 2 are stable, there was no improve-ment in phase 2 when prescribing performance feedbackwas introduced into the system. The phase 1 p-chartindicated an average percentage of errors of 41.1% (95%CI 39.6, 42.6%). The single out-of-control episode in thisphase could be attributed to chance (random orcommon-cause variation), since no prescribing perform-ance feedback was introduced during this period (thecontrol group received usual care in phase 1). Noimprovement in the process was observed in phase 2 withpercentage of errors averaging 39.3% (95% CI 37.8, 40.9%).
Subcategory of prescribing errorsPrescribing errors identified during the structured pre-scription review process were subclassified into drug,information, and administrative errors. The percentageof prescriptions with these errors in each study groupare illustrated in line graphs with 95% confidence inter-vals (see Fig. 4). Overall, there was a trend toward areduction of all error subcategories. The reduction ap-peared to be more consistent in the full interventiongroup, regardless of error subcategory. The most fre-quent error subcategory committed by all study groupswas information error, which consisted of incomplete
0%
5%
10%
15%
20%
25%
30%
May
-12
Jun-
12
Jul-1
2
Aug
-12
Sep
-12
Oct
-12
Nov
-12
Dec
-12
Pre
scrip
tions
with
err
or
Month
0%
10%
20%
30%
40%
50%
May
-12
Jun-
12
Jul-1
2
Aug
-12
Sep
-12
Oct
-12
Nov
-12
Dec
-12
Pre
scrip
tions
with
err
or
Month
(C) Administrative Error(B) Information Error
Control Group Partial Intervention Group Full Intervention Group
0%
2%
4%
6%
8%
10%
May
-12
Jun-
12
Jul-1
2
Aug
-12
Sep
-12
Oct
-12
Nov
-12
Dec
-12
Pre
scrip
tions
with
err
or
Month
(A) Drug Error
Mean % Error (95% CI)
rorrEevitartsinimdA)C(rorrEnoitamrofnI)B(rorrEgurD)A(
Phase 1 Phase 2 Phase 1 Phase 2 Phase 1 Phase 2
Control 4.8 (4.2, 5.5) 3.8 (3.2, 4.4) 27.3 (25.9, 28.6) 38.0 (36.6, 39.3) 13.0 (11.9, 14.0) 10.6 (9.6, 11.6)
Partial 8.0 (7.2, 8.7) 5.4 (4.7, 6.2) 31.4 (30.4, 32.4) 28.5 (27.1, 29.9) 23.0 (21.8, 24.1) 11.7 (10.7, 12.7)
Full 4.7 (4.3, 5.2) 2.5 (2.2, 2.9) 32.4 (31.0, 33.9) 22.7 (21.7, 23.7) 7.3 (6.7, 7.9) 3.7 (3.2, 4.1)
Phase 1 Phase 2 Phase 1 Phase 2 Phase 1 Phase 2
Fig. 4 Line graphs comparing the percentage of prescriptions with error between study groups. The lines with data markers represent thepercentage of prescriptions with drug error (a), information error (b), and administrative error (c) at each time point. Error bars indicate 95%confidence intervals
Lim et al. BMC Family Practice (2018) 19:120 Page 8 of 13

prescribing information or unclear instructions on theprescription. Although there was a reduction in thepercentage of prescriptions with information errors, thiserror subcategory appeared to be less impacted by theintervention program compared to drug and administra-tive errors. The mean percentage errors of each errorsubcategory are presented in Table 3.
Types of prescribing errorThe specific types of prescribing error within each errorsubcategory are summarised in Table 3. Prescribingerrors that do not fall into any of the predefined errorsubcategories were classified as other error. Across thethree study groups, the most common drug errors wereinappropriate drug dose, inappropriate drug frequency,and polypharmacy. Most types of drug error appear tohave decreased, but the percentage of prescriptions with
contraindications have at least doubled. We hypothe-sised that pharmacists’ vigilance during the structuredprescription review process could have led to the identi-fication of prescriptions with antihistamines for childrenunder 2 years old. Drug frequency not specified is themost frequent information error in prescriptions, andalso the most common type of error in this study.Although overall legibility and other types of informa-tion error improved throughout the study period, in-creasing number of prescriptions were found with drugdose not specified. The majority of administrative errorsarose from prescriptions without diagnosis, followed byprescriptions without patient age. After the initiation ofthe feedback interventions, violation of legal or proced-ural requirements of prescription writing, such asabsence of prescriber’s name and signature, werereduced, although this reduction was not observed
Table 3 Types of prescribing error
Control Group Partial Intervention Group Full Intervention Group
Phase 1Mean % Error
Phase 2Mean % Error
Phase 1Mean % Error
Phase 2Mean % Error
Phase 1Mean % Error
Phase 2Mean % Error
(n = 4200) (n = 3920) (n = 5020) (n = 3920) (n = 7880) (n = 7280)
Types of drug error, n (%)
Inappropriate dose 84 (2.0) 59 (1.5) 230 (4.6) 107 (2.7) 198 (2.5) 76 (1.0)
Inappropriate frequency 59 (1.4) 51 (1.3) 72 (1.4) 37 (0.9) 48 (0.6) 35 (0.5)
Inappropriate duration 10 (0.2) 5 (0.1) 20 (0.4) 6 (0.2) 17 (0.2) 6 (0.1)
Inappropriate dosage form 8 (0.2) 2 (0.1) 13 (0.3) 12 (0.3) 49 (0.6) 6 (0.1)
Polypharmacy 36 (0.9) 18 (0.5) 75 (1.5) 26 (0.7) 64 (0.8) 31 (0.4)
Medication duplication 4 (0.1) 3 (0.1) 5 (0.1) 2 (0.1) 8 (0.1) 9 (0.1)
Contraindication 14 (0.3) 23 (0.6) 22 (0.4) 33 (0.8) 8 (0.1) 27 (0.4)
Types of information error, n (%)
Duration/quantity not specified 241 (5.7) 178 (4.5) 444 (8.8) 250 (6.4) 507 (6.4) 339 (4.7)
Dose not specified 141 (3.4) 289 (7.4) 221 (4.4) 248 (6.3) 385 (4.9) 387 (5.3)
Frequency not specified 599 (14.3) 612 (15.6) 760 (15.1) 646 (16.5) 1319 (16.7) 872 (12.0)
Dosage form not specified 22 (0.5) 6 (0.2) 60 (1.2) 20 (0.5) 66 (0.8) 35 (0.5)
Strength not specified 41 (1.0) 45 (1.2) 168 (3.4) 32 (0.8) 107 (1.4) 68 (0.9)
Illegible 189 (4.5) 97 (2.5) 565 (11.3) 224 (5.7) 325 (4.1) 124 (1.7)
Abbreviation 201 (4.8) 221 (5.6) 468 (9.3) 288 (7.4) 510 (6.5) 246 (3.4)
Types of administrative error, n (%)
No prescriber name/stamp 47 (1.1) 45 (1.2) 148 (3.0) 185 (4.7) 67 (0.9) 17 (0.2)
No prescriber signature 4 (0.1) 1 (0.0) 19 (0.4) 6 (0.2) 15 (0.2) 10 (0.1)
No date 8 (0.2) 17 (0.4) 14 (0.3) 8 (0.2) 19 (0.2) 8 (0.1)
No patient name 0 (0.0) 2 (0.1) 1 (0.0) 0 (0.0) 2 (0.0) 0 (0.0)
No patient age 136 (3.2) 73 (1.9) 249 (5.0) 76 (1.9) 109 (1.4) 42 (0.6)
No patient ID 8 (0.2) 11 (0.3) 11 (0.2) 4 (0.1) 14 (0.2) 6 (0.1)
No diagnosis 372 (8.9) 296 (7.6) 751 (15.0) 193 (4.9) 363 (4.6) 185 (2.5)
Wrong patient name 7 (0.2) 3 (0.1) 20 (0.4) 8 (0.2) 10 (0.1) 0 (0.0)
Other error, n (%) 76 (1.8) 45 (1.2) 240 (4.8) 90 (2.3) 162 (2.1) 112 (1.5)
Lim et al. BMC Family Practice (2018) 19:120 Page 9 of 13

across all study groups. Prescriptions with wrong patientname, though accounting for a small proportion of thetotal prescriptions reviewed, are serious errors as theymay cause patient harm. The numbers of such errorsreduced in all groups.
DiscussionPrincipal findingsOur study explored whether monthly personalised feed-back of prescribing performance to primary careprescribers using league tables and authorised feedbackletters would result in reduction in prescribing errorrates. Comparison between study groups, illustrated bythe p-chart, demonstrated a gradual and sustained re-duction in the percentage of prescribing errors in the fullintervention group. Compared to the other two studygroups, the process in the full intervention group wasstable with less random variation. In the partial interven-tion group, there was also a reduction in the percentageof errors, but owing to a larger process variability, theprescribing performance was inferior to that of the fullintervention group. There was no evidence of error re-duction in the control group although the process wasrelatively stable. Overall, there is a trend toward a reduc-tion of all error subcategories, but information errorsappeared to be less impacted by the intervention pro-gram, compared to drug and administrative errors.
Comparison with other studiesIn this study, we demonstrated that mailed personalisedfeedback could lead to meaningful changes in prescrib-ing behaviour of primary care prescribers. A review in2012 reported that mailed interventions are wellreceived by prescribers, and are able to evoke significantchanges in prescribing patterns [30]. This finding isencouraging and illustrates the potential in using feed-back to drive prescribing performances in primary carethrough benchmarking among prescribers. In addition,the feedback in our study was non-punitive and con-ducted in a confidential manner, an approach reportedto be effective in detecting and addressing problems inseveral clinical settings [31]. The league tables enabledthe prescribers to compare their performance with thatof their peers, and likely offered them motivation toimprove. The effect of authorised feedback letters actingas “report cards” appeared to strongly stimulate qualityimprovement [32, 33]. Furthermore, we provided feed-back to individual prescribers and district health officers,which appeared to have a larger impact than feedbackprovided to district health officers alone [34]. Our studyfindings echoed previous studies that showed that auditand feedback can provide a framework for a proactivesafety culture [35, 36], and direct constructive feedbackto prescribers can effectively reduce errors [34, 37, 38].
We chose to compare prescribing error rates betweenstudy groups using SPC charts, as control charts wouldprovide an intuitive technique from assessing to moni-toring and improving quality of healthcare performance[39, 40]. We did not use mixed effect models to analysethe data as we recognise that only a small proportion ofthe variance will be explained by the explanatoryvariables in the model, as most of the variability in ahealth system cannot be measured in practice [41]. Inany health system, common-cause variation is inherent,and so it becomes important to recognise special-causevariation and intervene as necessary [41]. Recentpublished studies have utilised the SPC chart to improveprescribing performance in an effort to reduce errors[37, 38, 42]. Other studies have used the SPC chart as afeedback tool to reduce infection rates [43], improveadherence to prescribing guidelines [44], and improvereporting of medical errors [45]. These studies haveshown that the SPC chart is an effective way to commu-nicate mistakes, continuously monitor impact of inter-ventions, and drive sustainable improvement in patientcare. Control charts have also been demonstrated as ap-propriate tools to aid health service decision making forhealth authorities and managers [46]. The advantage ofSPC charts over classical statistical tests is that SPCmethods integrate statistical significance tests withtemporal trend of summary data, and acknowledge thatunexplained variance is a reflection of random variationin a health system that is under control [41].Our study reported an overall prescribing error rate of
48.0% at baseline, similar to the results of a study donelocally in 12 conveniently selected primary care clinics[25]. In a subsequent study to reduce errors [47], theauthors implemented an intervention package mainlycomprising educational training, which resulted in anabsolute reduction of 18.0% in the intervention group,and only 2.3% in the control group. Other studies thatemployed similar definitions of error as used in ourstudy reported lower error rates. In the UK, communitypharmacists reported that less than 1% of prescriptionshad a prescribing error [48], and outpatient pharmacistsin Norway detected errors in 2.6% of the prescriptionsdispensed [49]. However, these two studies did notconduct a formal audit of prescriptions but relied on thereporting of prescribing errors by pharmacists. In bothstudies, the majority of prescriptions had incomplete orillegible drug information, followed by prescriptions withincomplete administrative endorsement, and a smallproportion with incorrect drug information [48, 49].
Strengths and limitationsThis is the first national study to evaluate the effective-ness of providing prescribing performance feedback toprimary care prescribers, with the aim of reducing
Lim et al. BMC Family Practice (2018) 19:120 Page 10 of 13
prescribing errors in the primary care setting. The prag-matic design of this study, the delivery of interventionsin ‘real world’ settings by staff with typical experience,and active stakeholder involvement provide the effective-ness of the interventions in everyday practice to answerquestions of decision makers. Preliminary findings ofthis study were presented to managers in the Ministry ofHealth Malaysia, and plans to revise the intervention forfeasible implementation is under way. We utilised a lon-gitudinal randomised controlled study design, with re-peated and regular prescription review and prescriberfeedback, a methodological design strongly recommendedby systematic reviews for this purpose. In addition, weincorporated implementation fidelity practices in thestudy design to ensure consistent intervention implemen-tation, thus strengthening the validity of the study.Several methodological challenges were identified in
our study. The large volume of data collected eachmonth for the generation of prescribing performancefeedback reports, limited the ability of the researchers toprovide timely feedback to prescribers (there was a timelag of one month between structured prescription reviewand the delivery of feedback in September andNovember). This might have interrupted the criticalprocesses in our feedback system, thus impairing the im-pact of the intervention towards prescribers. We usedp-charts to compare prescribing performance betweenstudy groups, as this method allows the differentiationbetween common-cause and special-cause variation in asystem environment. However, to adequately assesschanges and trends in prescribing performance on acontrol chart, it would be ideal to have more time pointsfor this study (i.e. an extension of the data collectionperiod), as it is common in practice, to evaluateprescriptions written by every prescriber over a conveni-ent time period. In our study, baseline data from a singletime point may not be adequate to monitor changes andthe impact of the intervention program on the healthsystem. However, we were unable to extend the periodfor collection of baseline data as there were urgentrequests from managers to rectify prescribing errors inprimary care. We initially planned a third phase of thestudy to assess the feasibility of the interventionprogram, and to specifically determine whether theintervention program can be implemented independ-ently by pharmacists in the primary care clinics.Unfortunately, this phase of the study could not beconducted due to insufficient support from the pharma-cists, as there was a general impression that they couldnot cope with the volume of work that the interventionprogram would entail. Extending the data collectionperiod would require substantial resources, of whichcould not be supported by public sector funding.Additionally, although managers were pleased with the
improvements in prescribing performance, they were inagreement that the intervention program was toolabour- and resource-intensive for long-term implemen-tation. Therefore, the data collection period for the studywas limited to eight months, and the impact of theintervention program on prescribing performance wasevaluated within this time period.
Implications for clinicians and policymakersThis study shows that a high rate of prescribing errorsoccur routinely in primary care settings. Important mea-sures should be taken to reduce these errors in an effortto improve and maintain prescribing safety. Routineprescriber feedback comprising league tables and a feed-back letter acting as “report cards” by “warning” poorlyperforming prescribers and praising well-performing orcompliant prescribers is effective in reducing prescribingerrors. Ongoing monitoring of prescribing errors usingSPC charts allows easier recognition of special-causevariation in a health system process to be targeted forimprovement. Managers in primary care could adopt thisintervention program along with temporal monitoring ofprescribing performance as a quality improvement tool.
Unanswered questions and future researchFuture research on prescriber feedback should examinethe impact of the intervention over a longer period oftime to determine sustainability. Classifying prescribingerrors according to clinical severity (e.g. fatal,life-threatening, serious, significant) and their potentialharm to the patient should be considered for futurework. The impact of an electronic prescribing system indetecting prescribing errors and allowing for correctionsand computer-generated feedback, especially for admin-istrative and information errors, should be evaluated.
ConclusionsThis study shows that the rate of prescribing errors inprimary care is high, and routine feedback comprisingleague tables and a feedback letter could effectively re-duce prescribing errors. The challenge now is to developa feedback intervention program that is feasible and sus-tainable for long-term implementation.
Additional files
Additional file 1 Prescribing Error Record Form (a standardised datacollection form to record prescribing errors identified during thestructured prescription review process) (DOCX 20 kb).
Additional file 2 League tables (bar charts displaying the percentage ofprescribing errors for the health districts, health clinics, and of individualprescribers) (DOCX 226 kb).
Additional file 3 Authorised feedback letter (a letter signed by the statehealth director showing individual prescribing error rate and prescribingperformance based on a performance rating scale) (DOCX 15 kb).
Lim et al. BMC Family Practice (2018) 19:120 Page 11 of 13

AbbreviationsADE: Adverse drug event; CI: Confidence interval; SD: Standard deviation;SPC: Statistical process control
AcknowledgementsWe thank the Director General of Health, Malaysia for permission to publishthis paper. We also thank the Perak State Health Department, especiallyAsmah Zainal Abidin, and the Pharmaceutical Services Division of Perak forproviding the logistic support for this study. We are grateful to Siti Nur UmiAminah Zainal Bahri and Afida Nor Abu Hussain for their assistance with thetraining of clinic pharmacists and the audit of collected prescriptions anddata. We greatly appreciate the support of clinic pharmacists in Perakinvolved in structured prescription review and data collection. We thankpharmacists Doris George Visuvasam and Abdul Haniff Mohamad Yahaya fortheir assistance in the development of the data collection form. We alsoacknowledge Sivanesan Seevagan for his assistance with data entry.
FundingThis research was partly funded by the National Institutes of Health, Ministryof Health Malaysia, under the 10th Malaysia Plan Research Priority AreaHealth Policy and Systems.
Availability of data and materialsAll data generated or analysed during the current study are available fromthe corresponding author on reasonable request.
Authors’ contributionsWYL, ASHSS, LMN, SRJJ, SS, PV, and RKPS contributed substantially to theconcept and design of the study. WYL and SS performed statistical analysisfor the study. WYL, ASHSS, LMN, SRJJ, SS, PV, LH, and RKPS were involvedwith the acquisition, analysis, or interpretation of data. WYL led the draftingof the manuscript, and WYL, ASHSS, LMN, SRJJ, SS, PV, LH, and RKPS criticallyrevised the manuscript for important intellectual content, and gave finalapproval of the version to be published. WYL and LH secured funding forthe study, and RKPS provided administrative, technical, and material supportfor the study. WYL, ASHSS, LMN, SRJJ, SS, PV, LH, and RKPS agree to beaccountable for all aspects of the work in ensuring that questions related tothe accuracy or integrity of any part of the work are appropriate investigatedand resolved. All authors read and approved the final manuscript.
Ethics approval and consent to participateThe study had waiver of informed consent from the Medical Research &Ethics Committee (MREC), Ministry of Health Malaysia ((2) dlm.KKM/NIHSEC/08/0804/P12–186) as data in the study were routinely collected prescriptiondata and identifying information was not disclosed. This cluster randomisedtrial was not registered with the International Clinical Trials Registry as thepurpose of this trial was to examine the effect of the intervention only onthe prescribers (healthcare providers) and not patients, in compliance withthe International Committee of Medical Journal Editors (ICMJE) guidelines onclinical trial registration. The trial is registered with the National MedicalResearch Registry (NMRR-12-108-11,289), Ministry of Health Malaysia as perguidelines of the MREC.
Consent for publicationNot applicable.
Competing interestsThe authors declare that they have no competing interests.
Publisher’s NoteSpringer Nature remains neutral with regard to jurisdictional claims inpublished maps and institutional affiliations.
Author details1Clinical Research Centre Perak, Ministry of Health Malaysia, Level 4,Ambulatory Care Centre, Raja Permaisuri Bainun Hospital, Jalan Raja AshmanShah, 30450 Ipoh, Perak, Malaysia. 2Department of Paediatrics, Raja PermaisuriBainun Hospital, Ministry of Health Malaysia, Jalan Raja Ashman Shah, 30450Ipoh, Perak, Malaysia. 3Manjung Health District Office, Ministry of HealthMalaysia, Jalan Dato’ Ahmad Yunus, 32000 Sitiawan, Perak, Malaysia. 4SgChua Health Clinic, Ministry of Health Malaysia, Kaw Perindustrian Sg Chua,
Sg Ramal Luar, 43000 Kajang, Selangor, Malaysia. 5Institute for Health SystemsResearch, Ministry of Health Malaysia, No. 2 Jalan Setia Prima S U13/S,Seksyen U13 Setia Alam, ,40170 Shah Alam, Selangor, Malaysia. 6JelapangHealth Clinic, Ministry of Health Malaysia, 30020 Ipoh, Perak, Malaysia. 7PerakState Health Department, Ministry of Health Malaysia, Jalan Panglima BukitGantang Wahab, 30590 Ipoh, Perak, Malaysia.
Received: 25 October 2016 Accepted: 26 June 2018
References1. Avery AJ, Rodgers S, Cantrill JA, Armstrong S, Cresswell K, Eden M, et al. A
pharmacist-led information technology intervention for medication errors(PINCER): a multicentre, cluster randomised, controlled trial and cost-effectiveness analysis. Lancet. 2012;379(9823):1310–9.
2. Bourgeois FT, Shannon MW, Valim C, Mandl KD. Adverse drug events in theoutpatient setting: an 11-year national analysis. Pharmacoepidemiol DrugSaf. 2010;19(9):901–10.
3. Gandhi TK, Weingart SN, Borus J, Seger AC, Peterson J, Burdick E, et al. Adversedrug events in ambulatory care. N Engl J Med. 2003;348(16):1556–64.
4. Hughes RG, Blegen MA. Medication administration safety. In: Hughes RG,editor. Patient safety and quality: an evidence-based handbook for nurses.Rockville (MD): Agency for Healthcare Research and Quality (US); 2008.Chapter 37. http://www.ncbi.nlm.nih.gov/books/NBK2656/
5. Morimoto T, Gandhi T, Seger A, Hsieh T, Bates D. Adverse drug events andmedication errors: detection and classification methods. Qual Saf HealthCare. 2004;13(4):306–14.
6. Runciman WB, Roughead EE, Semple SJ, Adams RJ. Adverse drug events andmedication errors in Australia. Int J Qual Health Care. 2003;15(Suppl 1):i49–59.
7. Institute of Medicine, Committee on quality of health Care in America. Toerr is human: building a safer health system. Washington, DC: The NationalAcademies Press; 2000. http://www.nap.edu/catalog/9728.html
8. Thomsen LA, Winterstein AG, Sondergaard B, Haugbolle LS, Melander A.Systematic review of the incidence and characteristics of preventableadverse drug events in ambulatory care. Ann Pharmacother. 2007;41(9):1411–26.
9. Sivasampu S, Lim Y, Norazida AR, Hwong WY, Goh PP, Hisham AN. NationalClinical Research Centre. National Medical Care Statistics (NMCS) 2012. KualaLumpur; 2014.
10. Lu CY, Ross-Degnan D, Soumerai SB, Pearson SA. Interventions designed toimprove the quality and efficiency of medication use in managed care: acritical review of the literature - 2001-2007. BMC Health Serv Res. 2008;8:75.
11. Soumerai SB, McLaughlin TJ, Avorn J. Improving drug prescribing in primarycare: a critical analysis of the experimental literature. Milbank Q. 2005;83(4):10.
12. Roque F, Herdeiro MT, Soares S, Teixeira Rodrigues A, Breitenfeld L, FigueirasA. Educational interventions to improve prescription and dispensing ofantibiotics: a systematic review. BMC Public Health. 2014;14:1276.
13. Kamarudin G, Penm J, Chaar B, Moles R. Educational interventions to improveprescribing competency: a systematic review. BMJ Open. 2013;3(8):e003291.
14. Ioannidis JP, Lau J. Evidence on interventions to reduce medical errors: anoverview and recommendations for future research. J Gen Intern Med.2001;16(5):325–34.
15. Freemantle N, Harvey EL, Wolf F, Grimshaw JM, Grilli R, Bero LA. Printededucational materials: effects on professional practice and health careoutcomes. Cochrane Database Syst Rev. 2000;(2):CD000172.
16. Sondergaard J, Andersen M, Vach K, Kragstrup J, Maclure M, Gram LF.Detailed postal feedback about prescribing to asthma patients combinedwith a guideline statement showed no impact: a randomised controlledtrial. Eur J Clin Pharmacol. 2002;58(2):127–32.
17. Grimshaw JM, Shirran L, Thomas R, Mowatt G, Fraser C, Bero L, et al.Changing provider behavior: an overview of systematic reviews ofinterventions. Med Care. 2001;39(8 Suppl 2):II2–45.
18. Jamtvedt G, Young JM, Kristoffersen DT, O’Brien MA, Oxman AD. Audit andfeedback: effects on professional practice and health care outcomes.Cochrane Database Syst Rev. 2006;(2):CD000259.
19. Ivers N, Jamtvedt G, Flottorp S, Young JM, Odgaard-Jensen J, French SD, etal. Audit and feedback: effects on professional practice and healthcareoutcomes. Cochrane Database Syst Rev. 2012;(6):CD000259.
20. The Health Foundation. Evidence Scan: Reducing prescribing errors.London: April 2012. http://www.health.org.uk/sites/health/files/ReducingPrescribingErrors.pdf. Accessed 10 May 2016.
Lim et al. BMC Family Practice (2018) 19:120 Page 12 of 13

21. Dean B, Barber N, Schachter M. What is a prescribing error? Qual HealthCare. 2000;9(4):232–7.
22. Dusenbury L, Brannigan R, Falco M, Hansen WB. A review of research onfidelity of implementation: implications for drug abuse prevention in schoolsettings. Health Educ Res. 2003;18(2):237–56.
23. Linn BS, Arostegui M, Zeppa R. Performance rating scale for peer and selfassessment. Br J Med Educ. 1975;9(2):98–101.
24. Gilman J, Myatt MA. EpiCalc 2000 v1.02 - A statistical calculator forepidemiologists. Llanidloes, UK: Brixton Health; 1998.
25. Khoo EM, Lee WK, Sararaks S, Abdul Samad A, Liew SM, Cheong AT, et al.Medical errors in primary care clinics–a cross sectional study. BMC FamPract. 2012;13:127.
26. Carey RG, Lloyd RC. Measuring quality improvement in healthcare: a guideto statistical process control applications. New York: Quality Resources; 2001.
27. Cheung YY, Jung B, Sohn JH, Ogrinc G. Quality initiatives: statistical controlcharts: simplifying the analysis of data for quality improvement.Radiographics. 2012;32(7):2113–26.
28. Amin SG. Control charts 101: a guide to health care applications. QualManag Health Care. 2001;9(3):1–27.
29. Mohammed MA, Worthington P, Woodall WH. Plotting basic controlcharts: tutorial notes for healthcare practitioners. Qual Saf Health Care.2008;17(2):137–45.
30. Ho MJ, Venci J. Improving the success of mailed letter interventionprograms to influence prescribing behaviors: a review. J Manag Care Pharm.2012;18(8):627–49.
31. American College of Physicians–American Society of Internal Medicine.Assessing Individual Physician Performance By Managed Care Organizations.Philadelphia: American College of Physicians–American Society of InternalMedicine; 2001. White Paper. (Available from American College ofPhysicians–American Society of Internal Medicine, 190 N. IndependenceMall West, Philadelphia, PA 19106.)
32. Goldfield N, Gnani S, Majeed A. Primary care in the United States: profilingperformance in primary care in the United States. BMJ. 2003;326(7392):744–7.
33. Smith PC, Mossialos E, Papanicolas I. Performance measurement for healthsystem improvement: experiences, challenges and prospects, vol. 2008.Tallinn: World Health Organization 2008 and World Health Organization, onbehalf of the European Observatory on Health Systems and Policies; 2008.http://www.who.int/management/district/performance/PerformanceMeasurementHealthSystemImprovement2.pdf. Accessed 10May 2016
34. Franklin BD, O’Grady K, Paschalides C, Utley M, Gallivan S, Jacklin A, et al.Providing feedback to hospital doctors about prescribing errors; a pilotstudy. Pharm World Sci. 2007;29(3):213–20.
35. Herbert CP, Wright JM, Maclure M, Wakefield J, Dormuth C, Brett-MacLean P,et al. Better prescribing project: a randomized controlled trial of the impactof case-based educational modules and personal prescribing feedback onprescribing for hypertension in primary care. Fam Pract. 2004;21(5):575–81.
36. Fowler S, Webber A, Cooper BS, Phimister A, Price K, Carter Y, et al.Successful use of feedback to improve antibiotic prescribing and reduceClostridium difficile infection: a controlled interrupted time series. JAntimicrob Chemother. 2007;59(5):990–5.
37. Sullivan KM, Suh S, Monk H, Chuo J. Personalised performance feedbackreduces narcotic prescription errors in a NICU. BMJ Qual Saf. 2013;22(3):256–62.
38. Tiah L, Lee WY, Tiruchittampalam M. The use of individual performancemetrics to reduce prescription errors in the emergency department.Proceedings of Singapore Healthcare. 2011;20(3):174–80.
39. Thor J, Lundberg J, Ask J, Olsson J, Carli C, Harenstam KP, et al. Applicationof statistical process control in healthcare improvement: systematic review.Qual Saf Health Care. 2007;16(5):387–99.
40. Benneyan JC, Lloyd RC, Plsek PE. Statistical process control as a tool forresearch and healthcare improvement. Qual Saf Health Care. 2003;12(6):458–64.
41. Neuhauser D, Provost L, Bergman B. The meaning of variation to healthcaremanagers, clinical and health-services researchers, and individual patients.BMJ Qual Saf. 2011;20(Suppl_1):i36–40.
42. Furuya H, Morimoto T, Ogawa Y. Relationship between the use of anelectronic commercial prescribing system and medical and medicationerrors in a teaching hospital. Tokai J Exp Clin Med. 2013;38(1):33–6.
43. Curran E, Harper P, Loveday H, Gilmour H, Jones S, Benneyan J, et al. Resultsof a multicentre randomised controlled trial of statistical process controlcharts and structured diagnostic tools to reduce ward-acquired meticillin-
resistant Staphylococcus aureus: the CHART project. J Hosp Infect. 2008;70(2):127–35.
44. Mertens WC, Higby DJ, Brown D, Parisi R, Fitzgerald J, Benjamin EM, et al.Improving the care of patients with regard to chemotherapy-inducednausea and emesis: the effect of feedback to clinicians on adherence toantiemetic prescribing guidelines. J Clin Oncol. 2003;21(7):1373–8.
45. Marshall T, Mohammed MA, Rouse A. A randomized controlled trial ofleague tables and control charts as aids to health service decision-making.Int J Qual Health Care. 2004;16(4):309–15.
46. Neuspiel DR, Stubbs EH, Liggin L. Improving reporting of outpatientpediatric medical errors. Pediatrics. 2011;128(6):e1608–13.
47. Khoo EM, Sararaks S, Lee WK, Liew SM, Cheong AT, Abdul Samad A, et al.Reducing medical errors in primary care using a pragmatic complexintervention. Asia Pac J Public Health. 2015;27(6):670–7.
48. Chen YF, Neil KE, Avery AJ, Dewey ME, Johnson C. Prescribing errors andother problems reported by community pharmacists. Ther Clin Risk Manag.2005;1(4):333–42.
49. Haavik S, Soeviknes S, Erdal H, Kjonniksen I, Guttormsen AB, Granas AG.Prescriptions from general practitioners and in hospital physicians requiringpharmacists’ interventions. Pharmacoepidemiol Drug Saf. 2011;20(1):50–6.
Lim et al. BMC Family Practice (2018) 19:120 Page 13 of 13


![Biochemic prescriber[1]](https://static.fdocuments.net/doc/165x107/579079a51a28ab6874c836ca/biochemic-prescriber1.jpg)